
Study on the Compressive Strength and Reaction Mechanism of Alkali-Activated Geopolymer Materials Using Coal Gangue and Ground Granulated Blast Furnace Slag
 , and
, and
Abstract
:1. Introduction
2. Materials and Methods
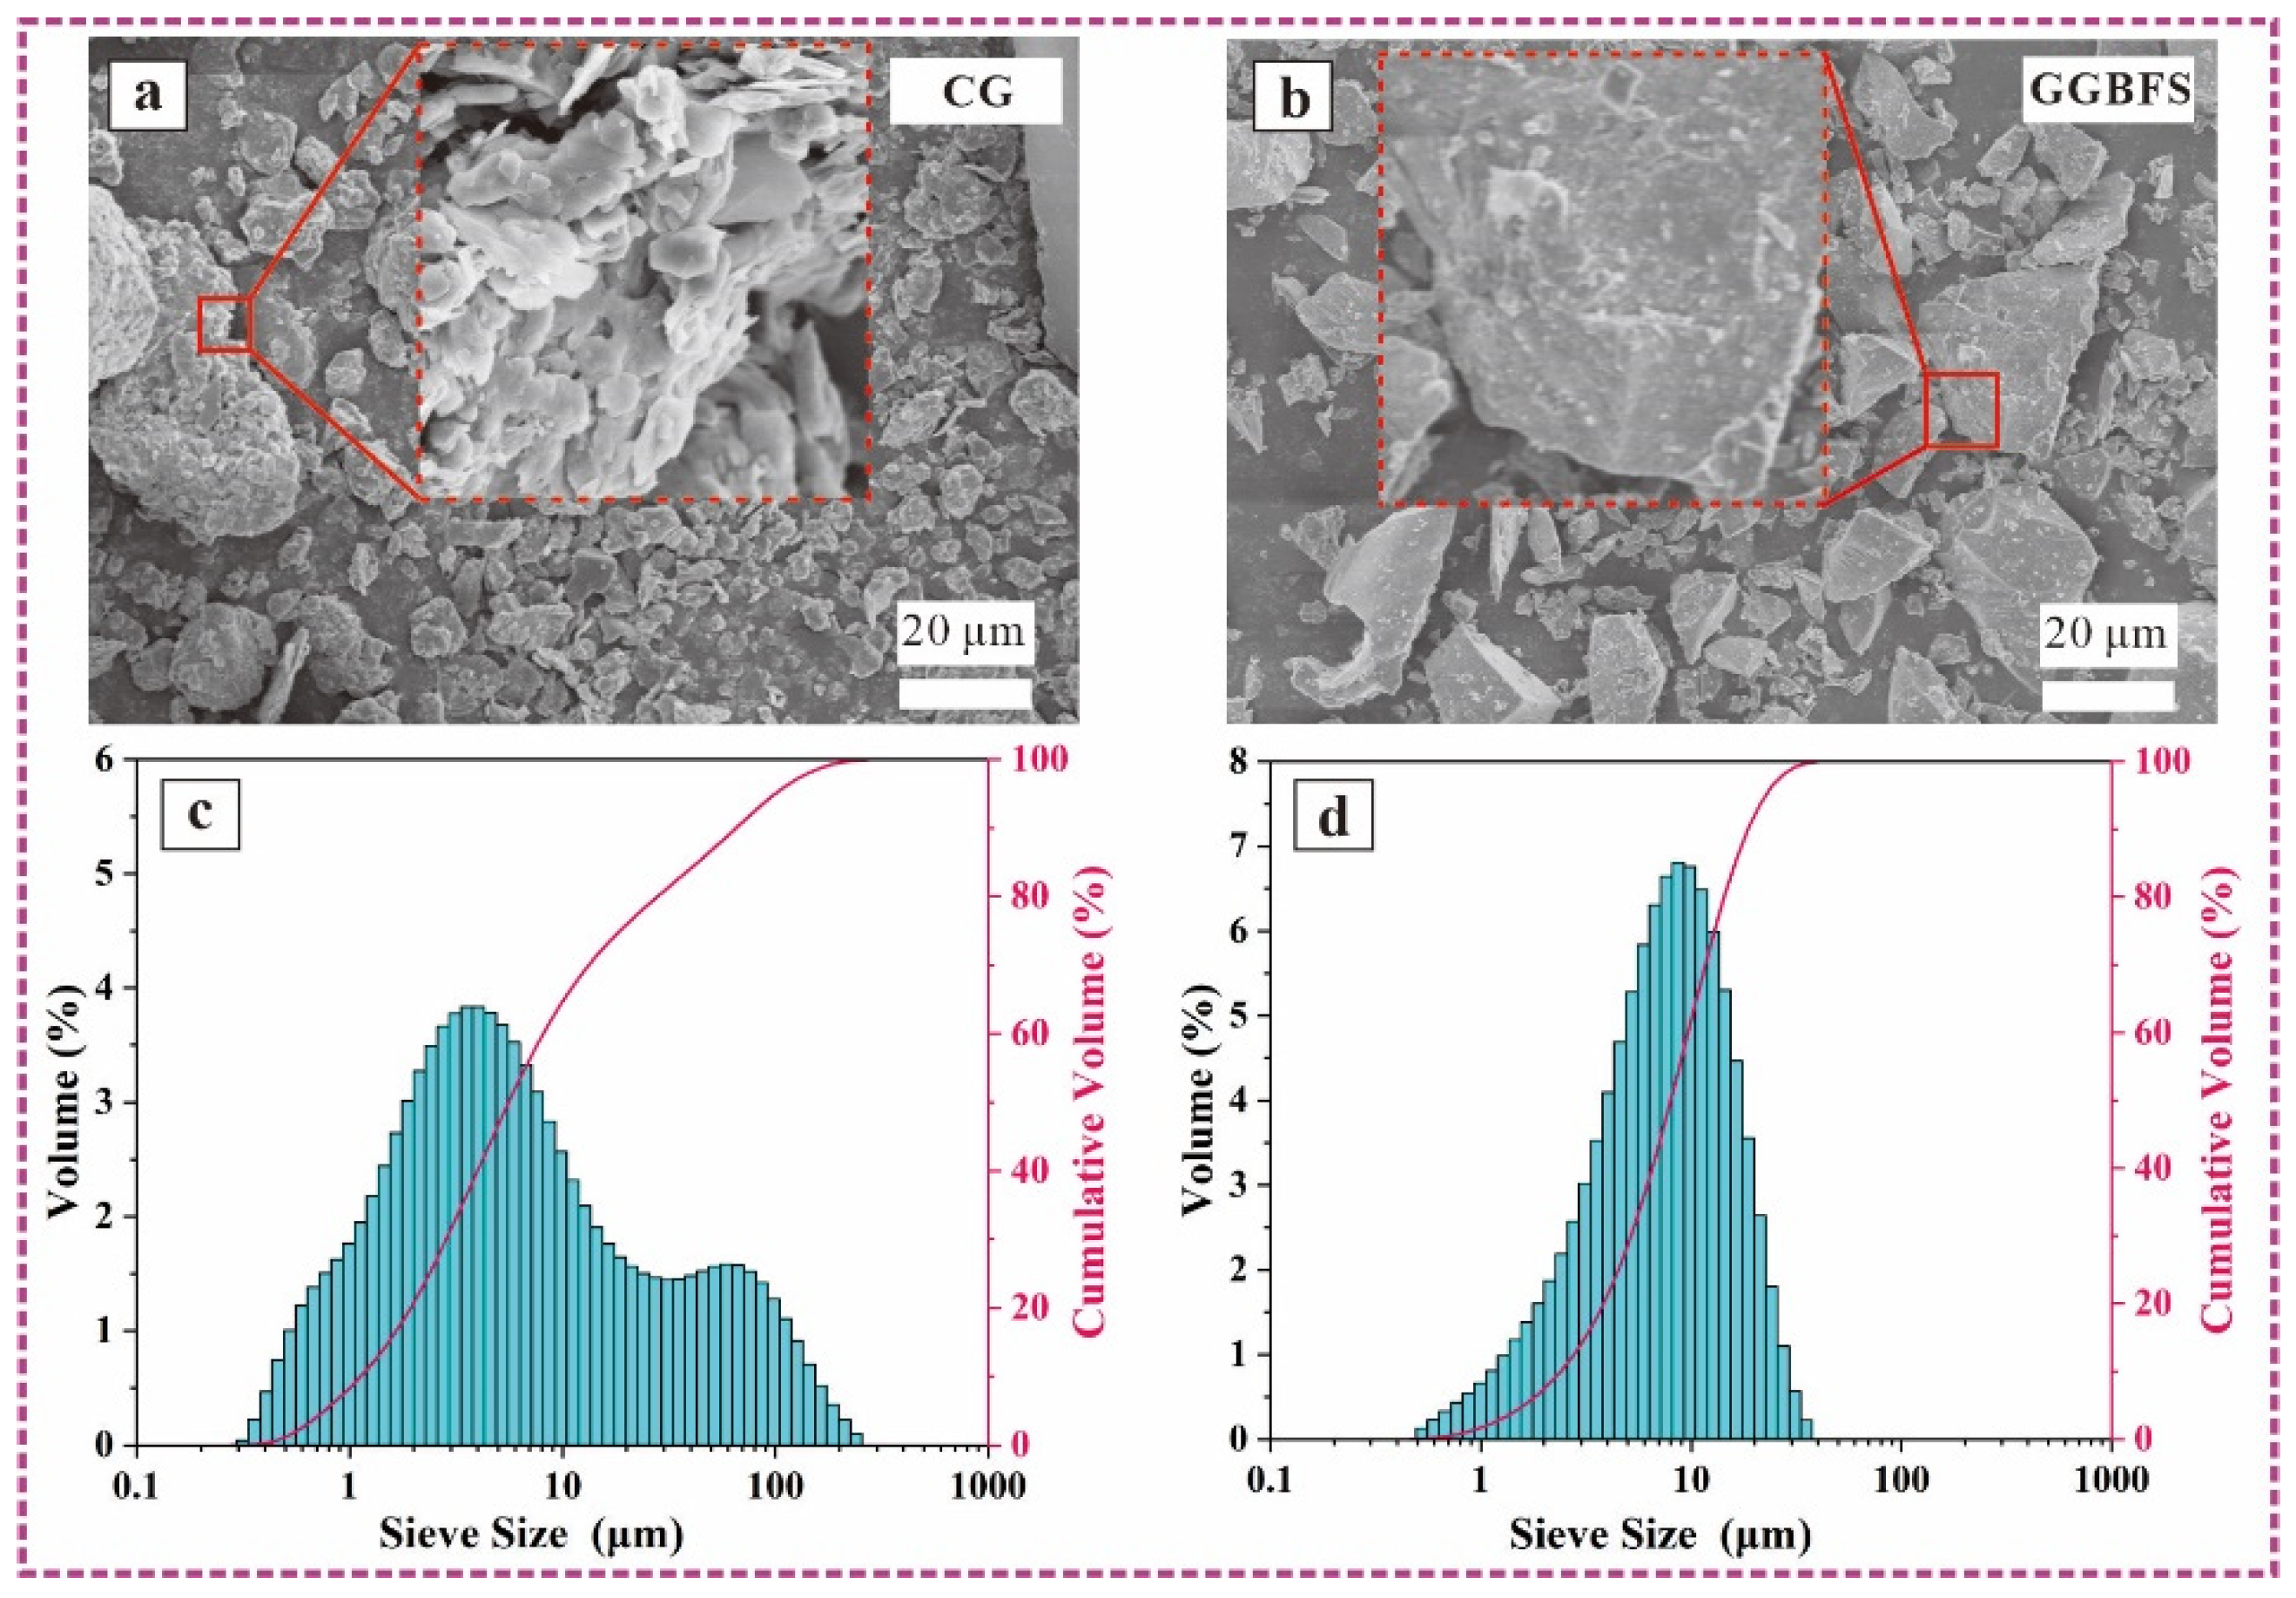
2.1. Materials
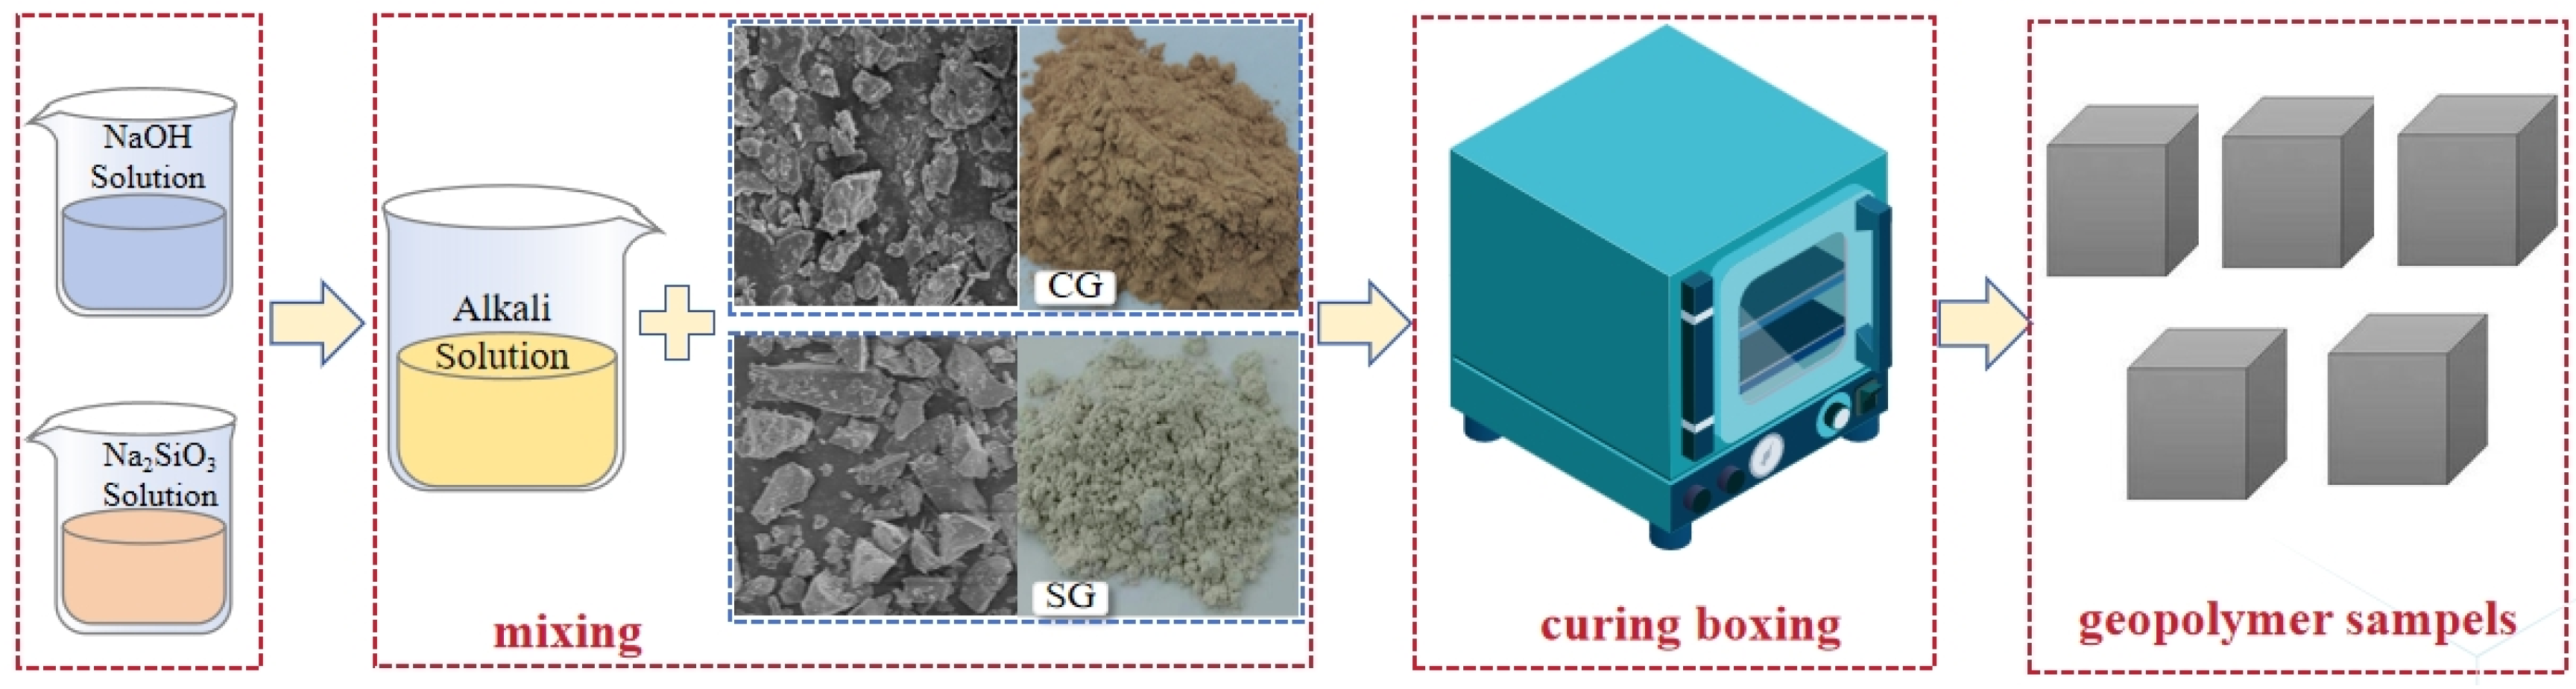
2.2. AAMs Preparation
2.3. Methods
2.3.1. Physical Properties Tests
2.3.2. Microscopic Properties Tests
3. Results
3.1. Setting Time and Compressive Strength
3.1.1. Fluidity
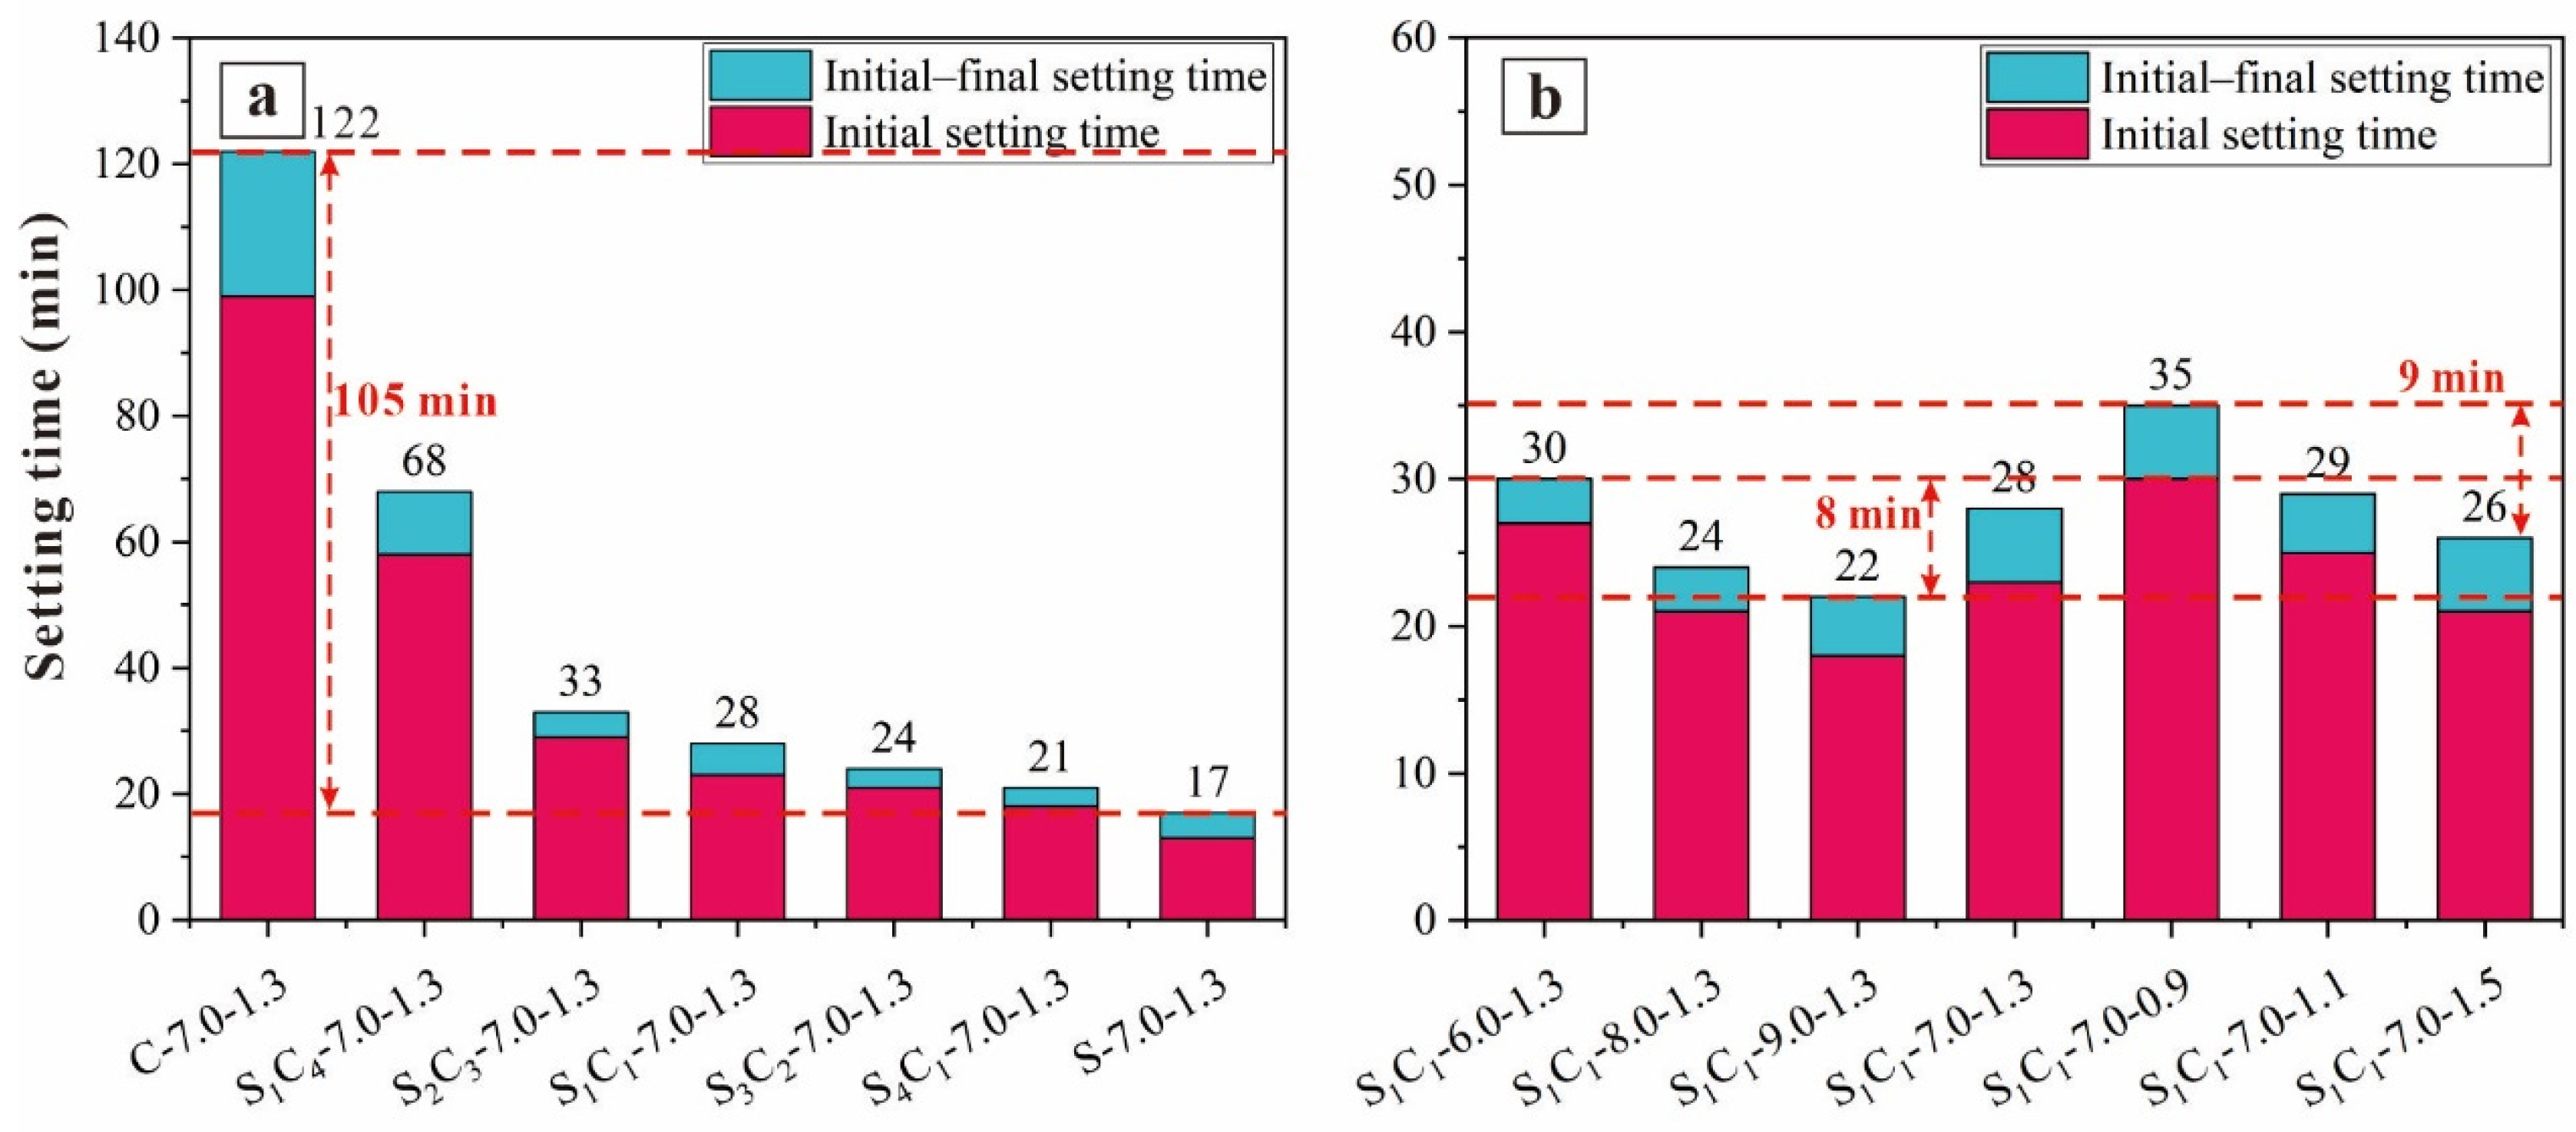
3.1.2. Setting Time
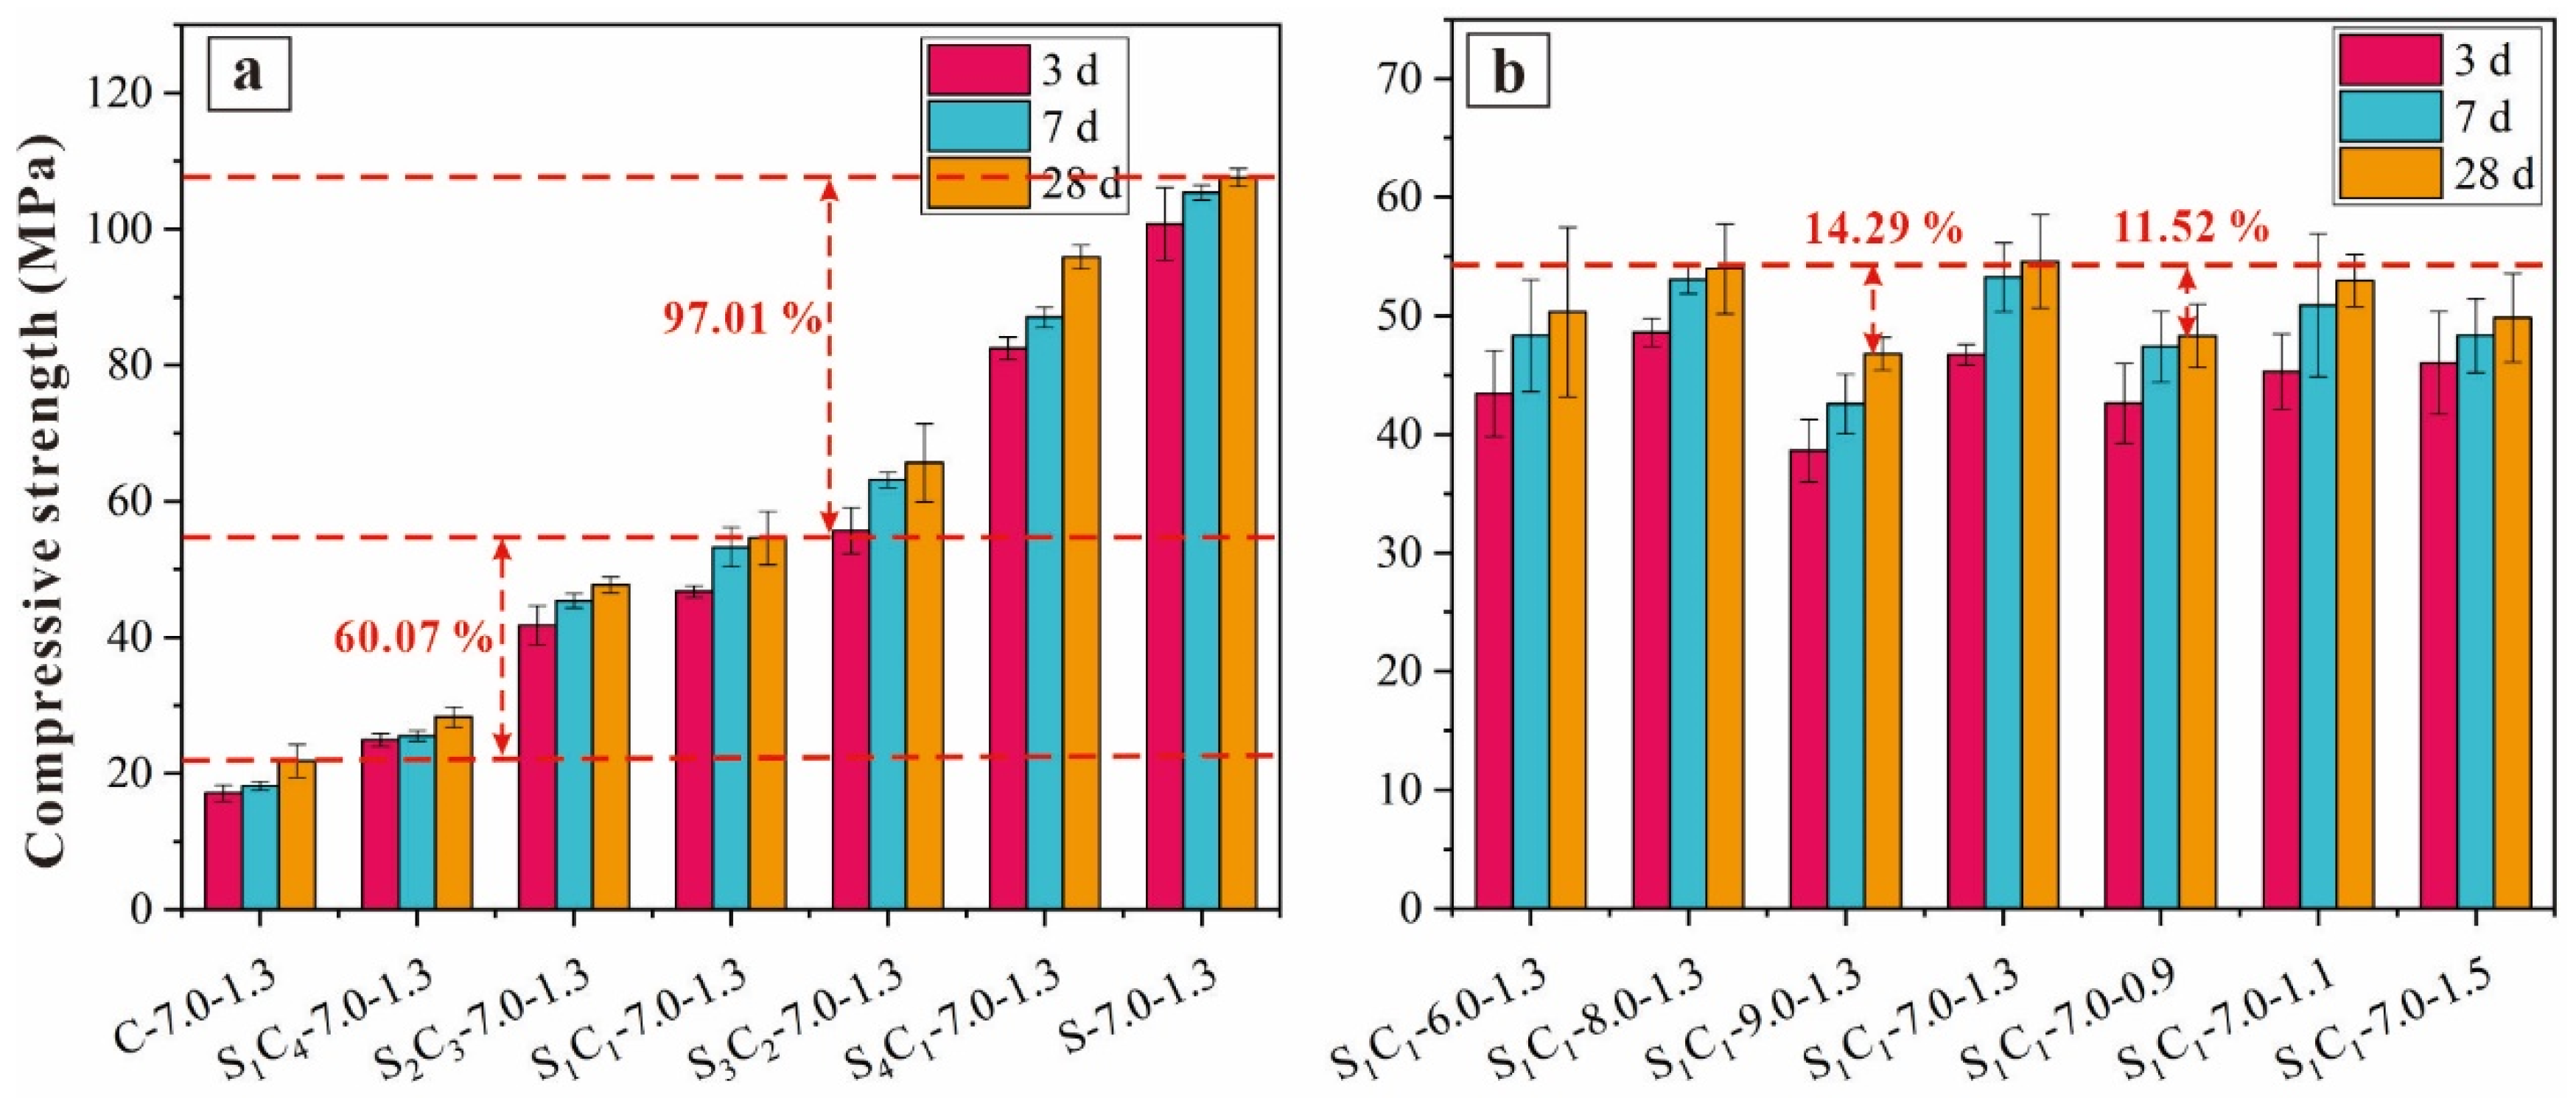
3.1.3. Compressive Strength
3.2. Geopolymer Structure
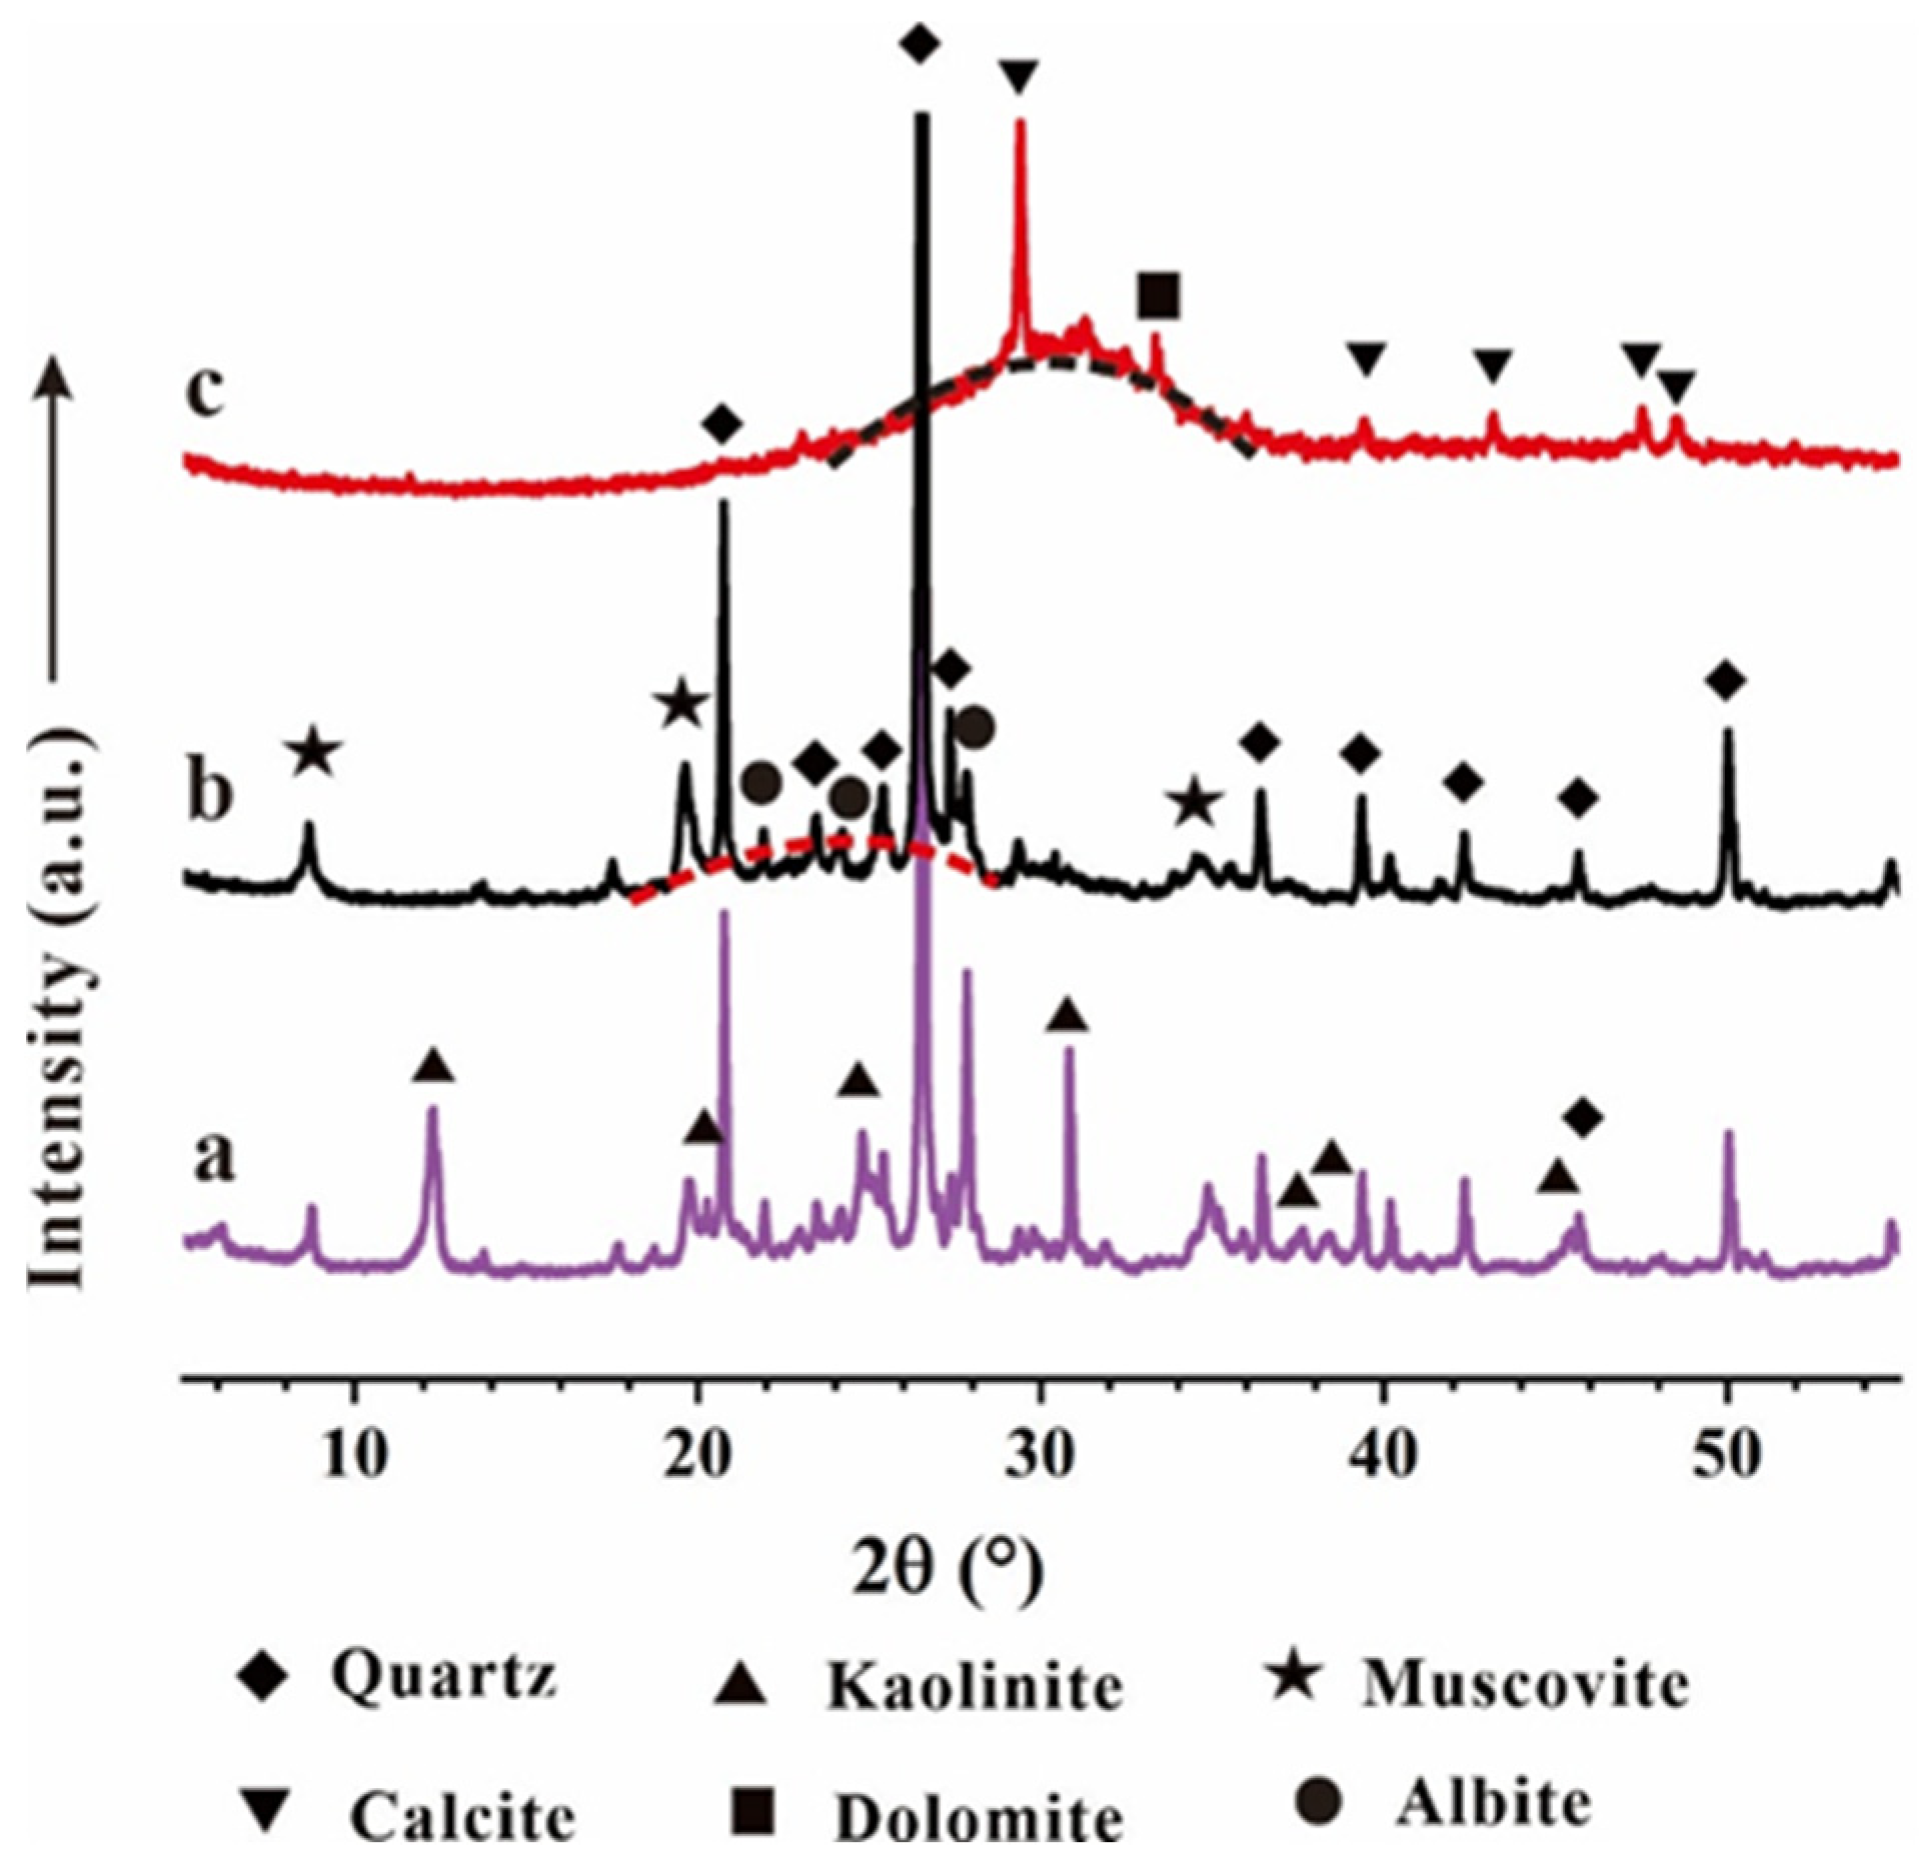
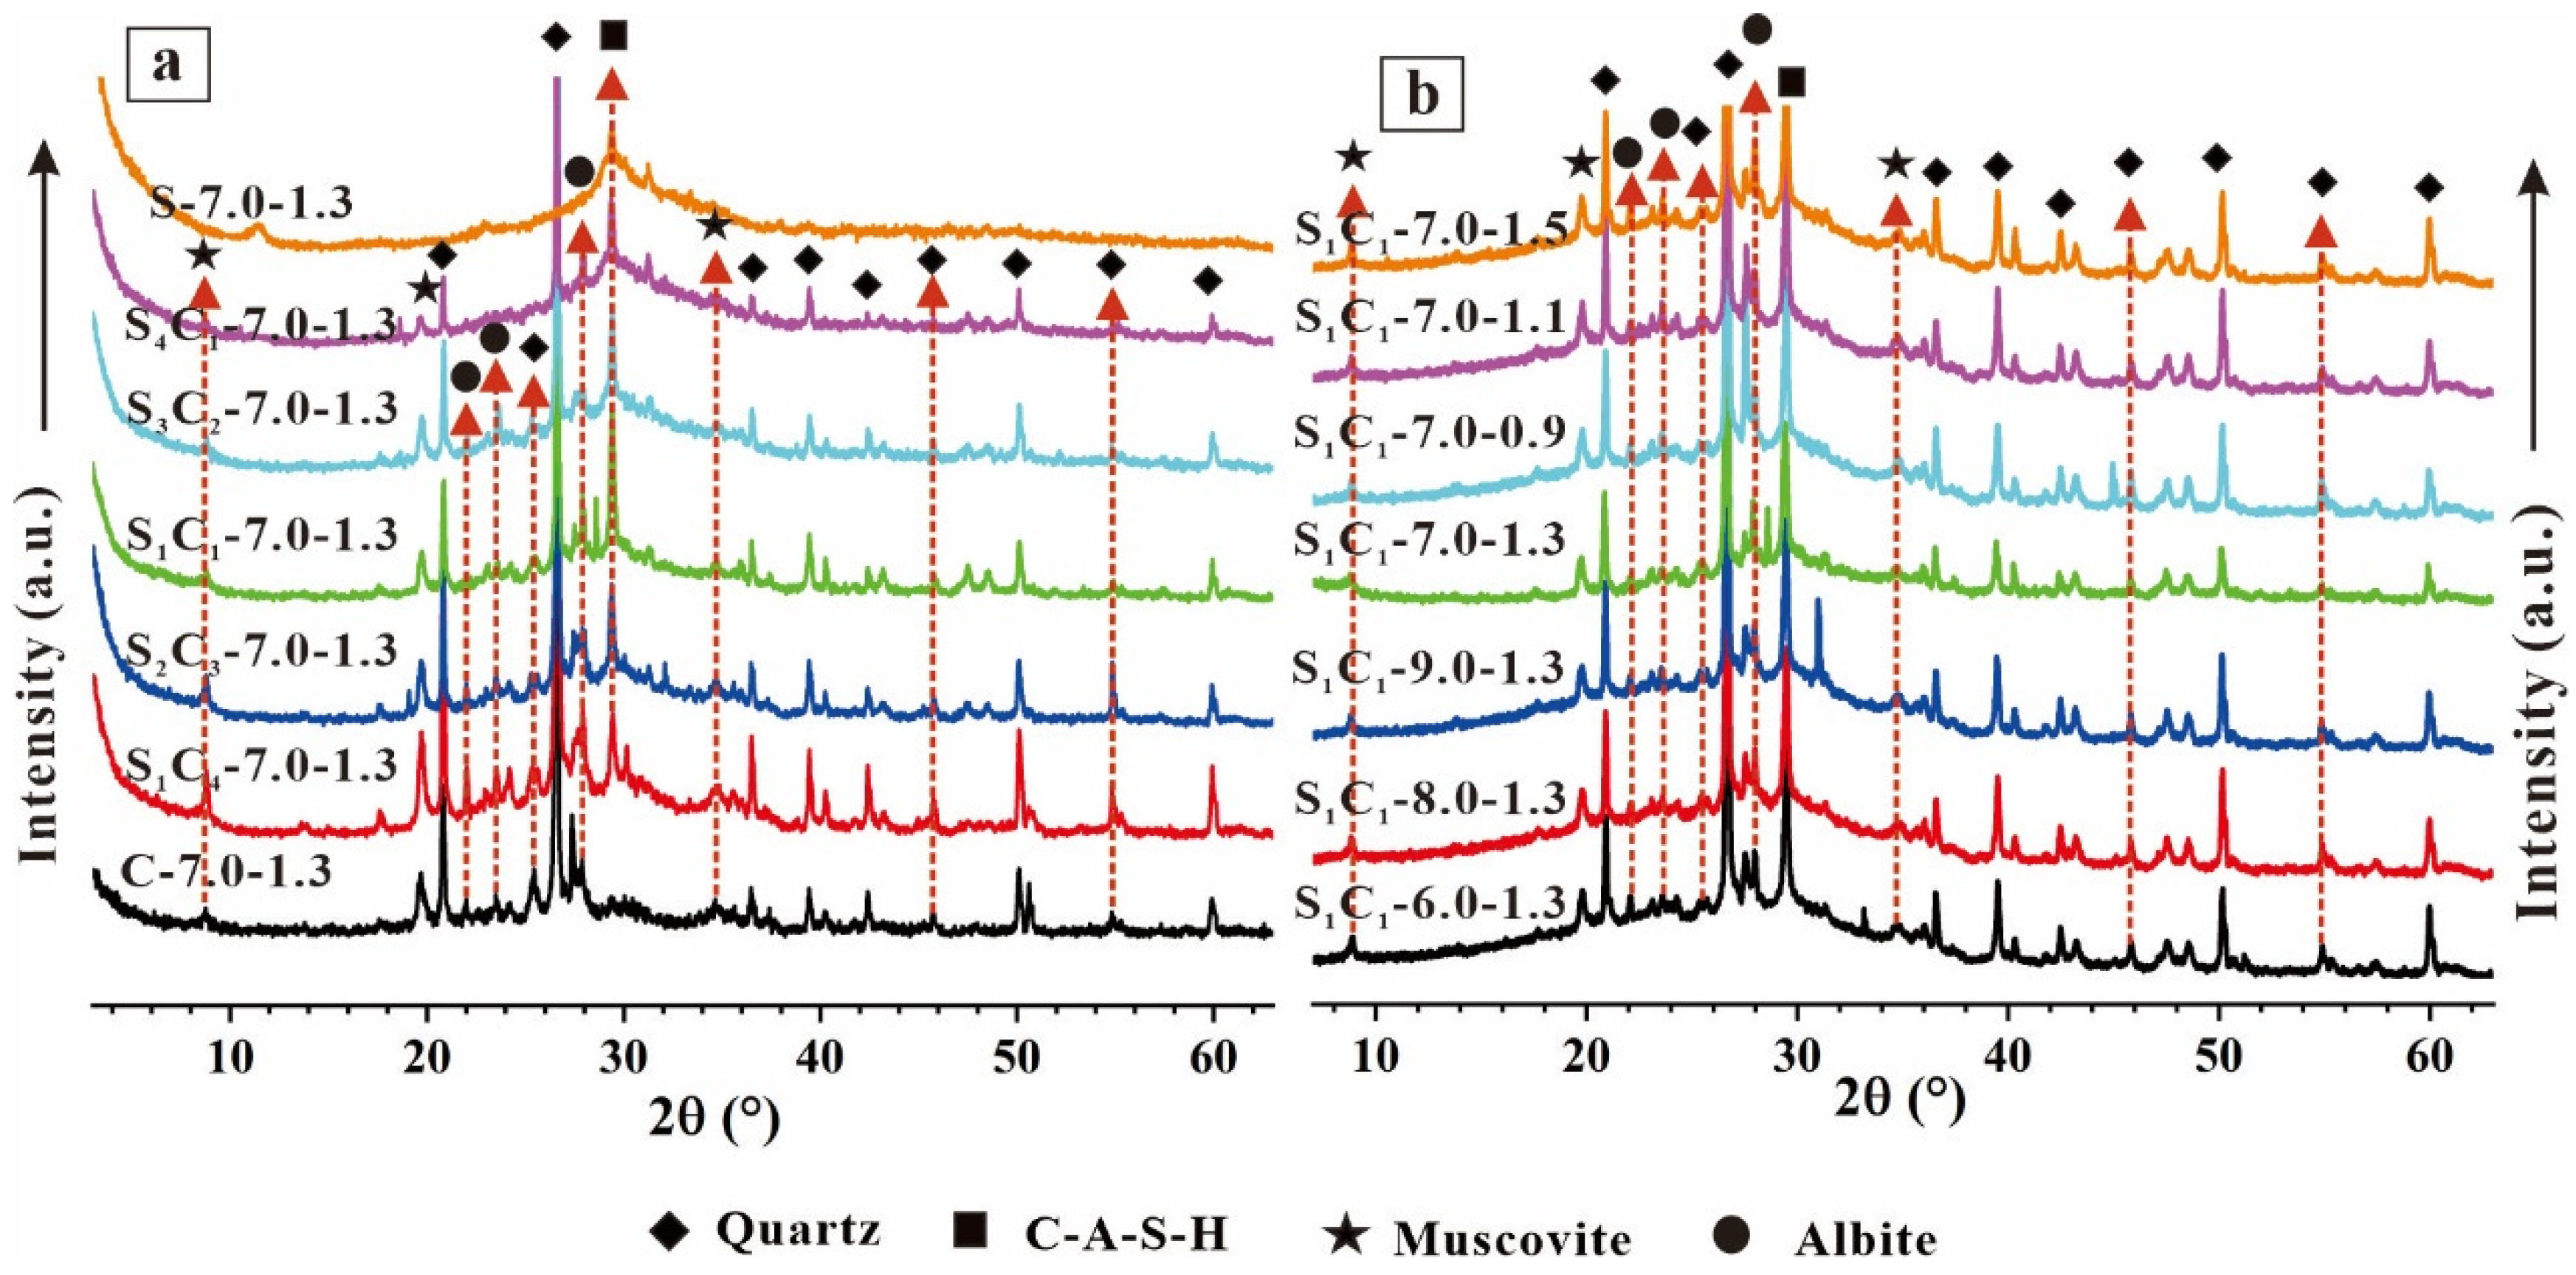
3.2.1. XRD Analysis
3.2.2. FTIR Spectroscopy
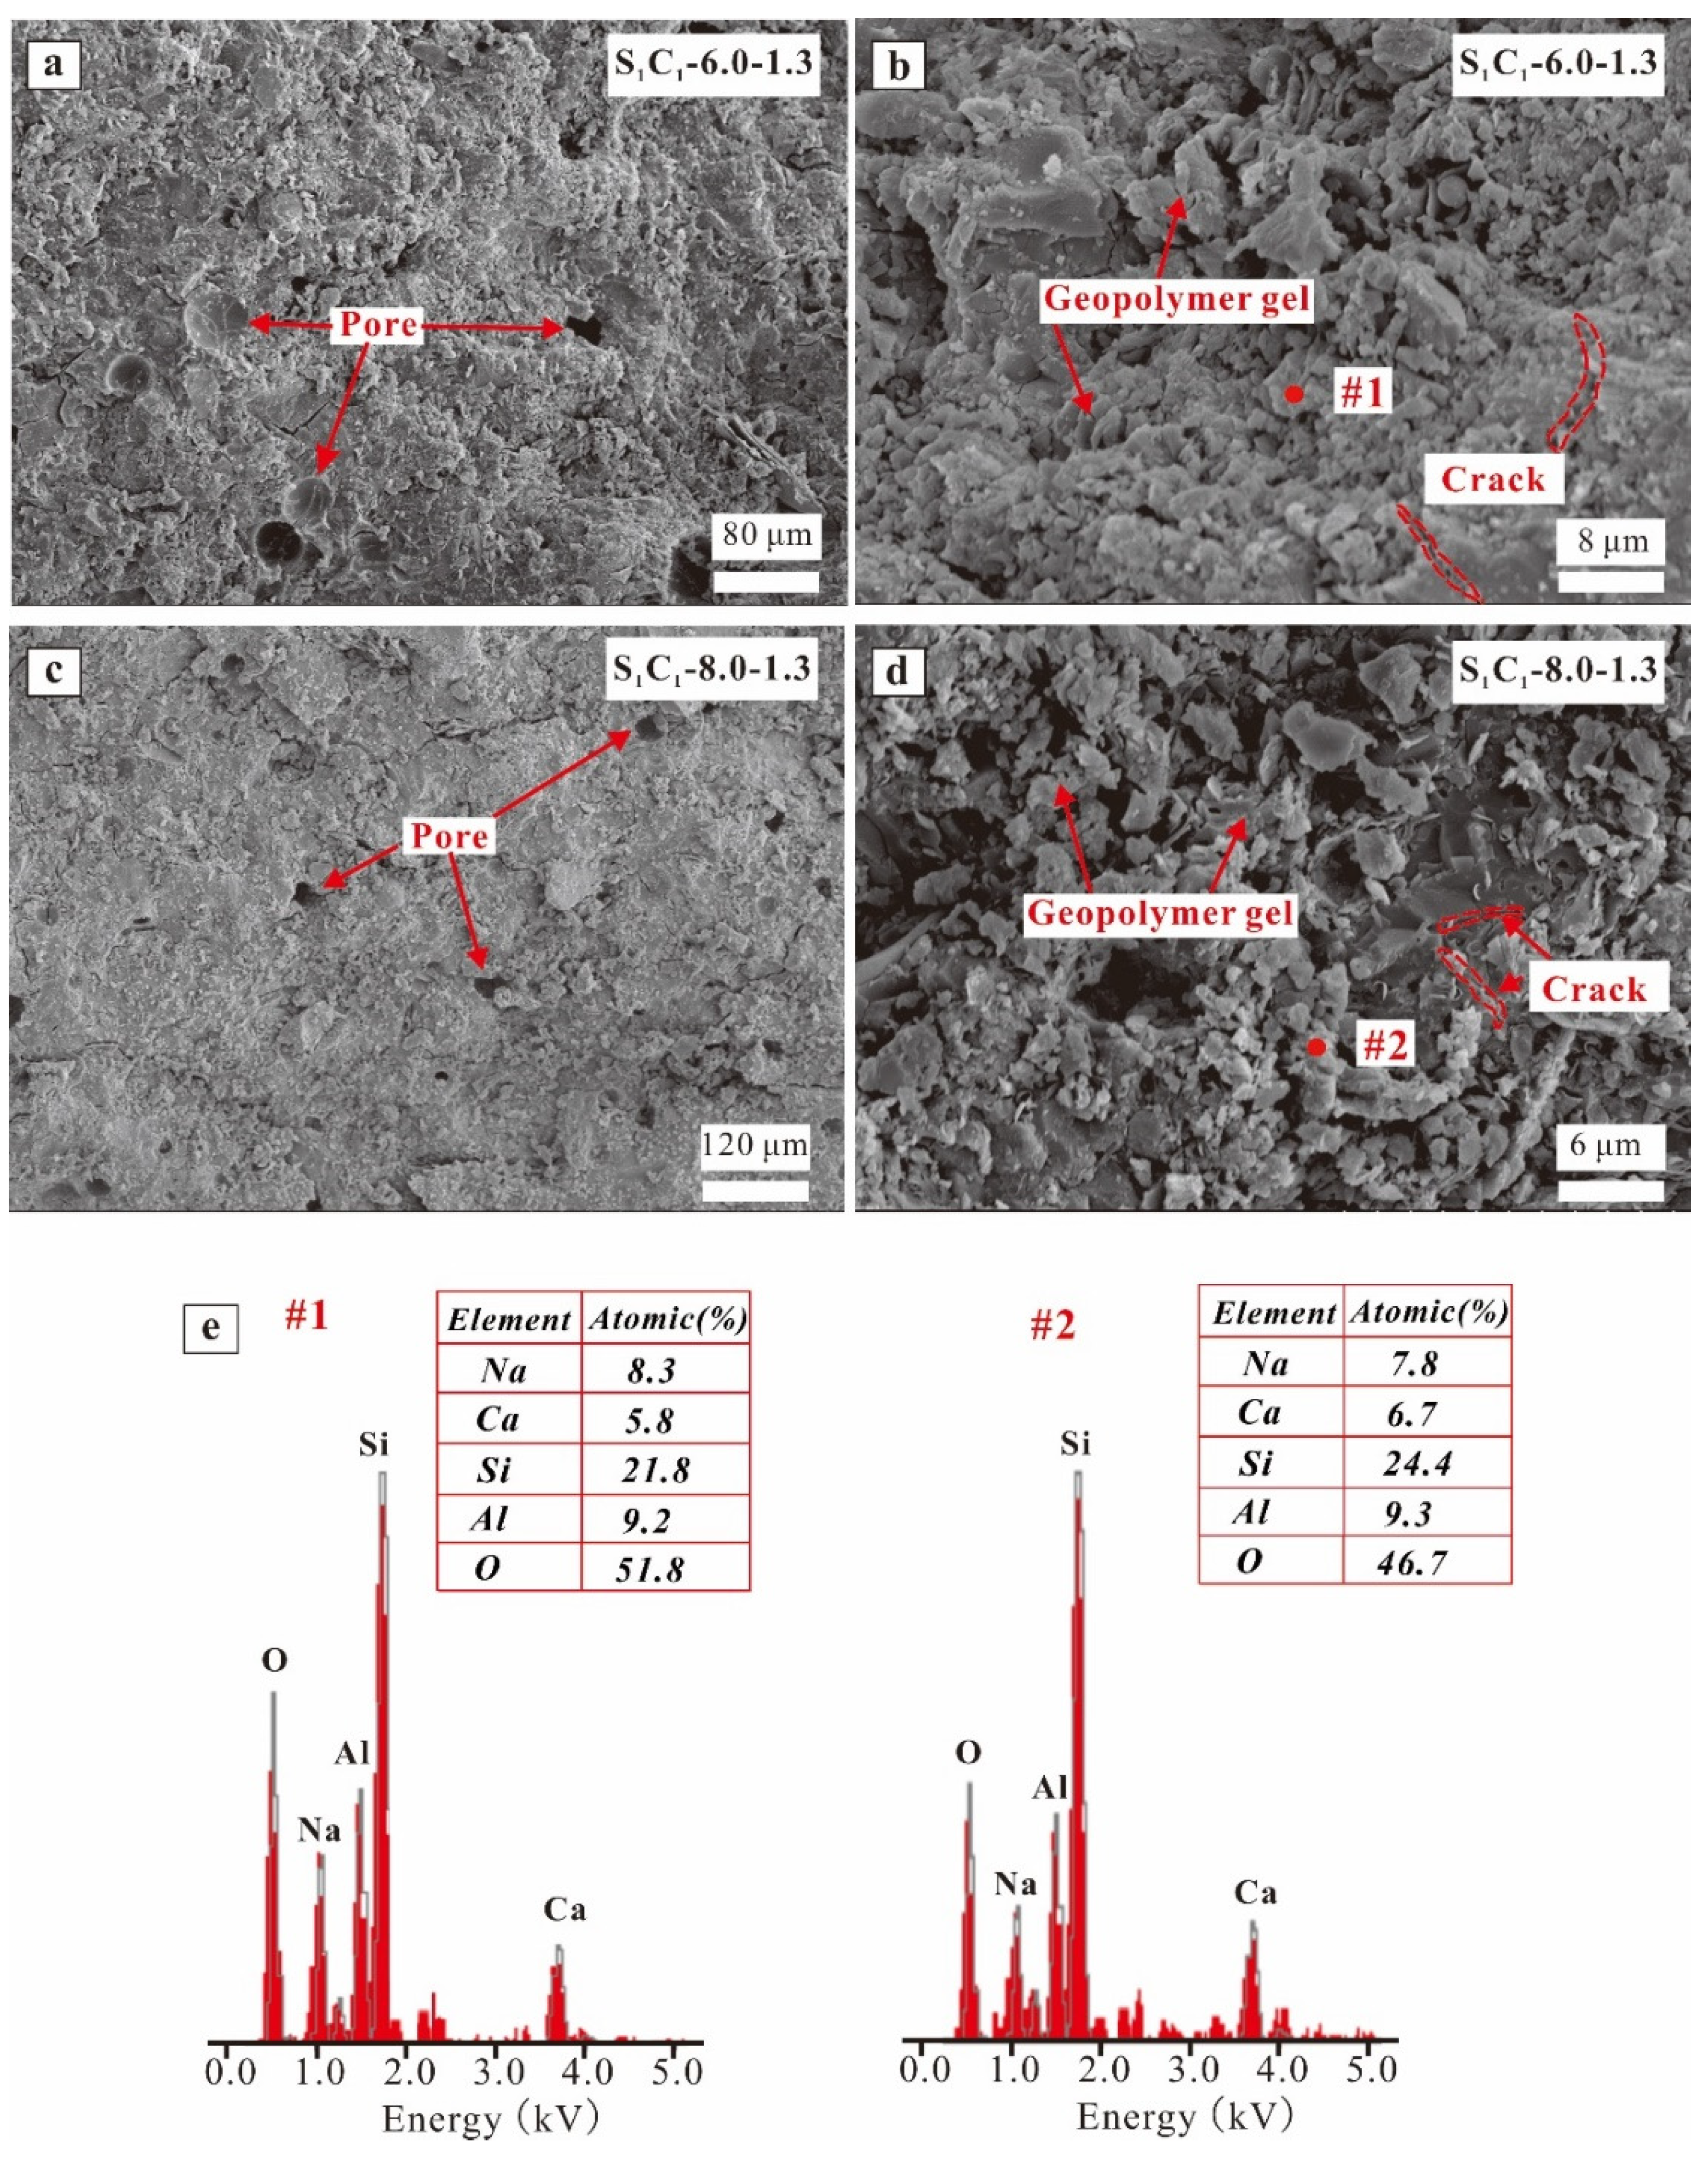
3.2.3. SEM/EDX Results
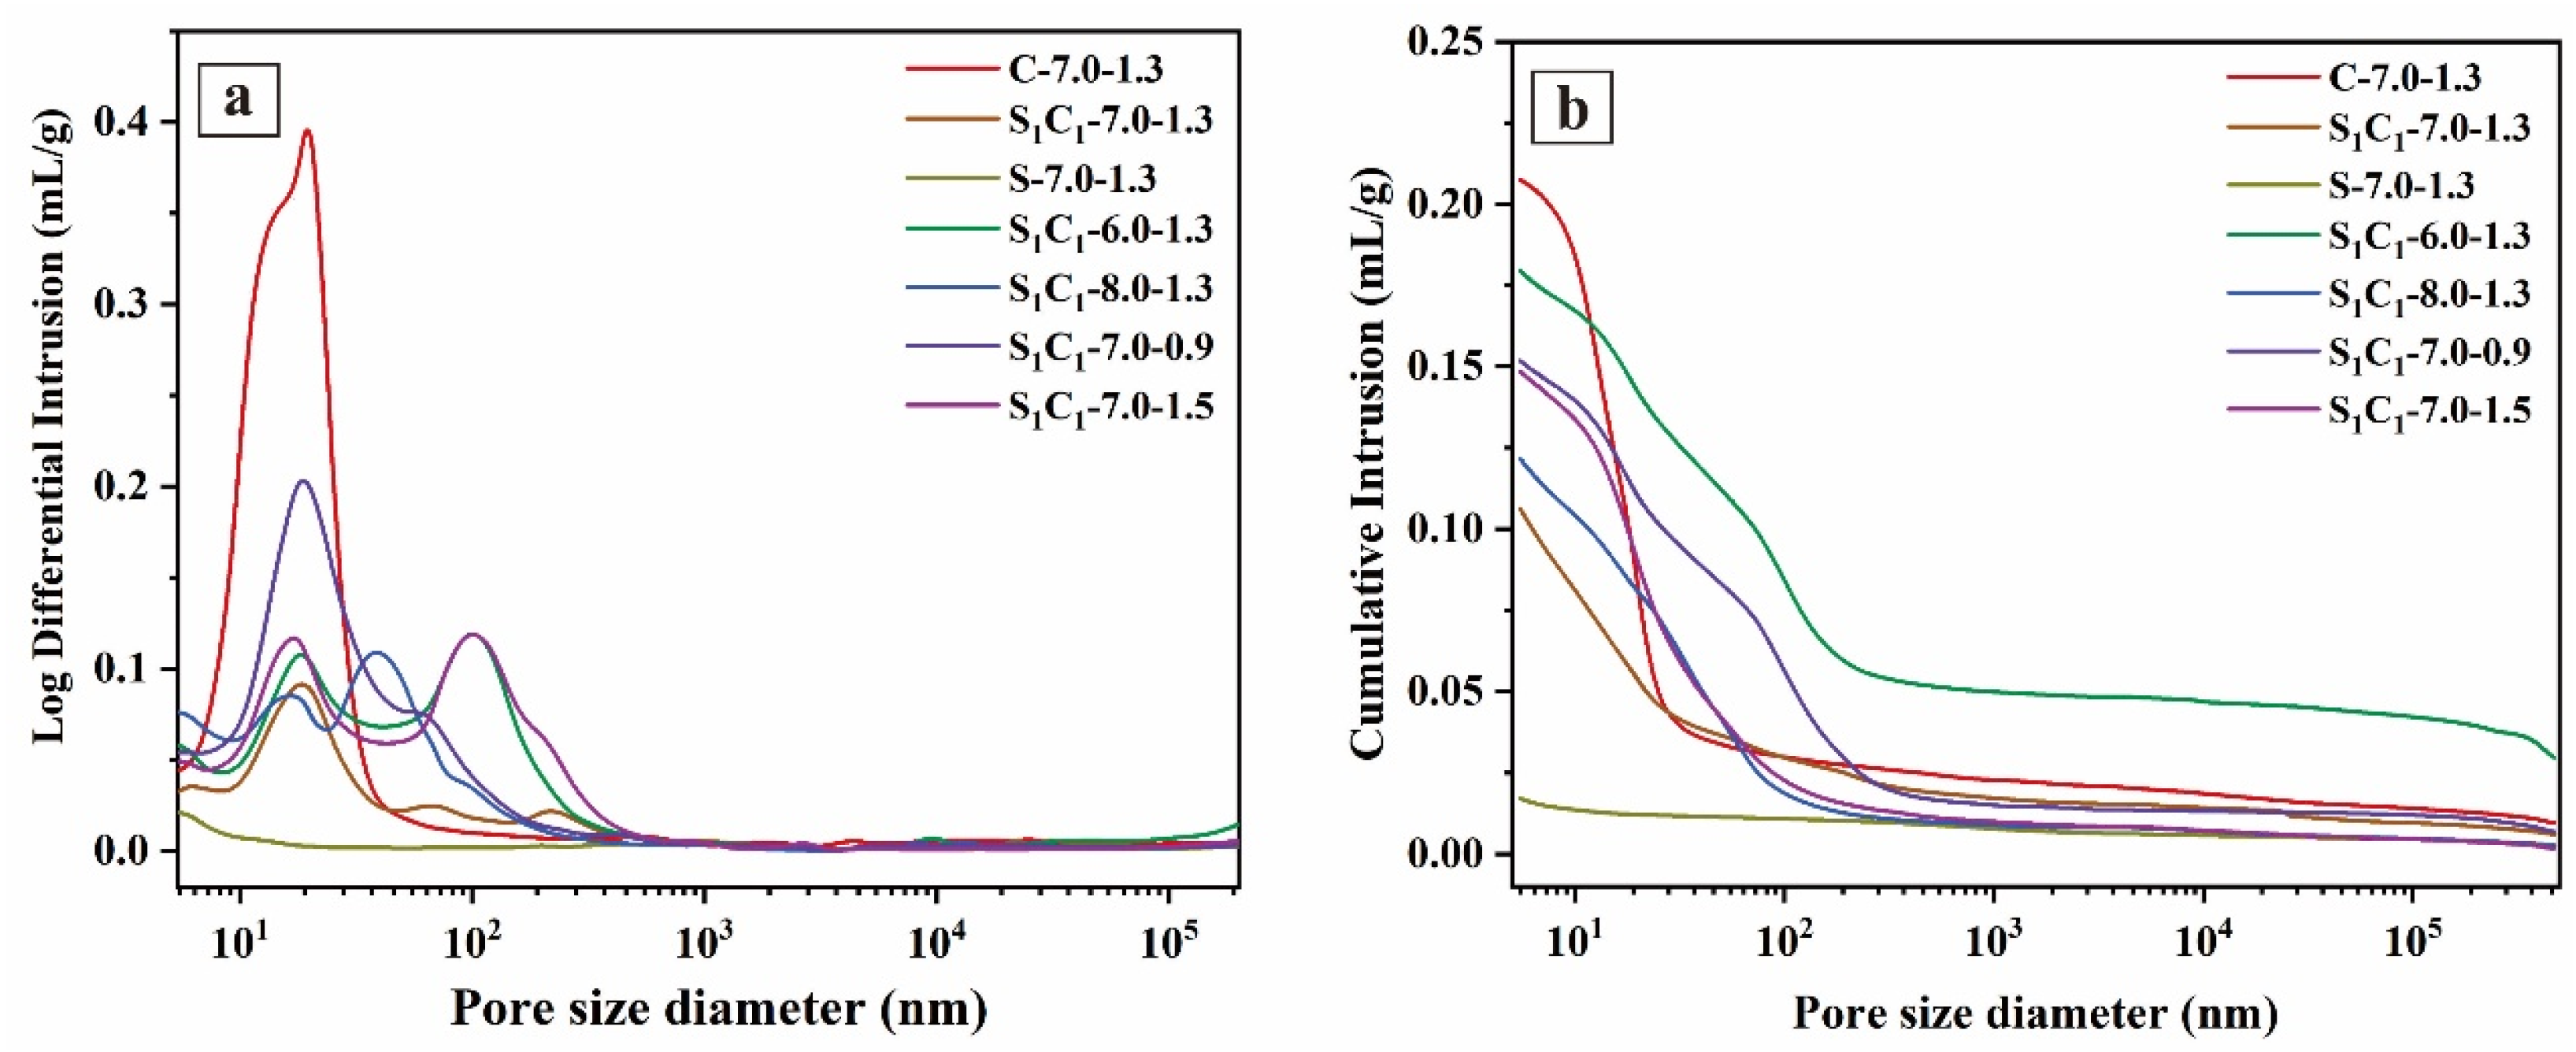
3.2.4. MIP Results
4. Discussion
5. Conclusions
Author Contributions
Funding
Institutional Review Board Statement
Informed Consent Statement
Data Availability Statement
Acknowledgments
Conflicts of Interest
References
- Okoye, F.N.; Durgaprasad, J.; Singh, N.B. Mechanical Properties of Alkali Activated Fly ash/Kaolin Based Geopolymer Concrete. Constr. Build. Mater. 2015, 98, 685–691. [Google Scholar] [CrossRef]
- Liu, Q.; Hu, Z.; Wang, X.; Zhao, H.; Qian, K.; Li, L.; Meng, Z. Numerical study on cracking and its effect on chloride transport in concrete subjected to external load. Constr. Build. Mater. 2022, 325, 126797. [Google Scholar] [CrossRef]
- Tan, Y.; He, Y.; Cui, X.; Liu, L. Design and performance optimization of alkali-activated waste coal bottom ash/slag porous concrete. Constr. Build. Mater. 2022, 359, 129413. [Google Scholar] [CrossRef]
- Dong, K.; Jiang, H.; Sun, R.; Dong, X. Driving Forces and Mitigation Potential of Global CO2 Emissions from 1980 through 2030: Evidence from Countries with Different Income Levels. Sci. Total Environ. 2019, 649, 335–343. [Google Scholar] [CrossRef] [PubMed]
- Xi, F.; Davis, S.J.; Ciais, P.; Crawford-Brown, D.; Guan, D.; Pade, C.; Shi, T.; Syddall, M.; Lv, J.; Ji, L.; et al. Substantial global carbon uptake by cement carbonation. Nat. Geosci. 2016, 9, 880. [Google Scholar] [CrossRef]
- Tran, T.; Kim, Y.; Kang, G.; Dinh, B.; Do, T. Feasibility of reusing marine dredged clay stabilized by a combination of by-products in coastal road construction. Transp. Res. Record. 2019, 2673, 519–528. [Google Scholar] [CrossRef]
- Pobłocki, K.; Pawlak, M.; Drzeżdżon, J.; Gawdzik, B.; Jacewicz, D. Clean production of geopolymers as an opportunity for sustainable development of the construction industry. Sci. Total Environ. 2024, 928, 172579. [Google Scholar] [CrossRef] [PubMed]
- Longhi, M.A.; Zhang, Z.; Rodriguez, E.D.; Kirchheim, A.P.; Wang, H. Efflorescence of alkali-activated cements (geopolymers) and the impacts on material structures: A critical analysis. Front. Mater. 2019, 6, 89. [Google Scholar] [CrossRef]
- Lee, N.K.; Lee, H.K. Setting and mechanical properties of alkali-activated fly ash/slag concrete manufactured at room temperature. Constr. Build. Mater. 2013, 47, 1201–1209. [Google Scholar] [CrossRef]
- Abdollahnejad, Z.; Luukkonen, T.; Mastali, M.; Giosue, C.; Favoni, O.; Ruello, M.L.; Kinnunen, P.; Illikainen, M. Microstructural analysis and strength development of one-part alkali-activated slag/ceramic binders under different curing regimes. Waste Biomass Valorization 2020, 11, 3081–3096. [Google Scholar] [CrossRef]
- Zurinskas, D.; Vaiciukyniene, D.; Stelmokaitis, G.; Dorosevas, V. Clayey soil strength improvement by using alkali activated slag reinforcing. Minerals 2020, 10, 1076. [Google Scholar] [CrossRef]
- Zhang, H.; Kodur, V.; Qi, S.; Cao, L.; Wu, B. Development of metakaolin–fly ash based geopolymers for fire resistance applications. Constr. Build. Mater. 2014, 55, 38–45. [Google Scholar] [CrossRef]
- Kong, L.; Zhao, W.; Xuan, D.; Wang, X.; Liu, Y. Application potential of alkali-activated concrete for antimicrobial induced corrosion: A review. Constr. Build. Mater. 2022, 317, 126169. [Google Scholar] [CrossRef]
- Aiken, T.A.; Gu, L.; Kwasny, J.; Huseien, G.F.; McPolin, D.; Sha, W. Acid resistance of alkali-activated binders: A review of performance, mechanisms of deterioration and testing procedures. Constr. Build. Mater. 2022, 342, 128057. [Google Scholar] [CrossRef]
- Puertas, F.; Fernández-Jiménez, A. Mineralogical and microstructural characterisation of alkali-activated fly ash/slag pastes. Cem. Concr. Compos. 2003, 25, 287–292. [Google Scholar] [CrossRef]
- Luukkonen, T.; Abdollahnejad, Z.; Yliniemi, J.; Kinnunen, P.; Illikainen, M. One-part alkali-activated materials: A review. Cem. Concr. Res. 2018, 103, 21–34. [Google Scholar] [CrossRef]
- Cloete, S.; Giuffrida, A.; Romano, M.C.; Zaabout, A. The swing adsorption reactor cluster for post-combustion CO2 capture from cement plants. J. Clean. Prod. 2019, 223, 692–703. [Google Scholar] [CrossRef]
- Chen, L.; Wang, Z.; Wang, Y.; Feng, J. Preparation and properties of alkali activated metakaolin-based geopolymer. Materials 2016, 9, 767. [Google Scholar] [CrossRef] [PubMed]
- Li, X.; Zhao, Y.; Hu, Y.; Wang, G.; Xia, M.; Luo, B.; Luo, Z. Influence of multiple factors on the workability and early strength development of alkali-activated fly ash and slag-based geopolymer-stabilized soil. Materials 2022, 15, 2682. [Google Scholar] [CrossRef] [PubMed]
- Zhang, Q.; Ji, T.; Yang, Z.; Wang, C.; Wu, H. Influence of different activators on microstructure and strength of alkali-activated nickel slag cementitious materials. Constr. Build. Mater. 2020, 235, 117449. [Google Scholar] [CrossRef]
- Li, Z.; Gao, Y.; Zhang, J.; Zhang, C.; Chen, J.; Liu, C. Effect of particle size and thermal activation on the coal gangue based geopolymer. Mater. Chem. Phys. 2021, 267, 124657. [Google Scholar] [CrossRef]
- Jablonska, B.; Kityk, A.V.; Busch, M.; Huber, P. The structural and surface properties of natural and modified coal gangue. J. Environ. Manag. 2017, 190, 80–90. [Google Scholar] [CrossRef] [PubMed]
- Yang, L.; Song, J.; Bai, X.; Song, B.; Wang, R.; Zhou, T.; Jia, J.; Pu, H. Leaching behavior and potential environmental effects of trace elements in coal gangue of an open-cast coal mine area, inner mongolia, China. Minerals 2016, 6, 50. [Google Scholar] [CrossRef]
- Zhang, W.; Dong, C.; Huang, P.; Sun, Q.; Li, M.; Chai, J. Experimental study on the characteristics of activated coal gangue and coal gangue-based geopolymer. Energies 2020, 13, 2504. [Google Scholar] [CrossRef]
- Wang, X.; Liu, F.; Pan, Z.; Chen, W.; Muhammad, F.; Zhang, B.; Li, L. Geopolymerization of coal gangue via alkali-activation: Dependence of mechanical properties on alkali activators. Buildings 2024, 14, 787. [Google Scholar] [CrossRef]
- Yi, C.; Ma, H.; Chen, H.; Wang, J.; Jing, S.; Li, Z.; Yu, M. Preparation and characterization of coal gangue geopolymers. Constr. Build. Mater. 2018, 187, 318–326. [Google Scholar] [CrossRef]
- Kizilkanat, A.B. Experimental evaluation of mechanical properties and fracture behavior of carbon fiber reinforced high strength concrete. period. Polytech. Civil Eng. 2016, 60, 289–296. [Google Scholar] [CrossRef]
- Deb, P.S.; Nath, P.; Sarker, P.K. The effects of ground granulated blast-furnace slag blending with fly ash and activator content on the workability and strength properties of geopolymer concrete cured at ambient temperature. Mater. Des. 2014, 62, 32–39. [Google Scholar] [CrossRef]
- Buchwald, A.; Tatarin, R.; Stephan, D. Reaction progress of alkaline-activated metakaolin-ground granulated blast furnace slag blends. J. Mater. Sci. 2009, 44, 5609–5617. [Google Scholar] [CrossRef]
- Venkatesan, R.P.; Pazhani, K.C. Strength and durability properties of geopolymer concrete made with Ground Granulated Blast Furnace Slag and Black Rice Husk Ash. KSCE J. Civ. Eng. 2016, 20, 2384–2391. [Google Scholar] [CrossRef]
- Temuujin, J.; van Riessen, A. Effect of fly ash preliminary calcination on the properties of geopolymer. J. Hazard. Mater. 2009, 164, 634–639. [Google Scholar] [CrossRef] [PubMed]
- Khalifa, A.Z.; Cizer, Ö.; Pontikes, Y.; Heath, A.; Patureau, P.; Bernal, S.A.; Marsh, A.T.M. Advances in alkali-activation of clay minerals. Cem. Concr. Res. 2020, 132, 106050. [Google Scholar] [CrossRef]
- Song, M.; Qian, J.; Zhong, L.J.; Liang, S. From a View of Alkali Solution: Alkali Concentration to Determine Hydration Process of Alkali Activating Metakaolin; Springer: Dordrecht, The Netherlands, 2015; Volume 10, pp. 305–313. [Google Scholar] [CrossRef]
- Pelisser, F.; Guerrino, E.L.; Menger, M.; Michel, M.D.; Labrincha, J.A. Micromechanical characterization of metakaolin-based geopolymers. Constr. Build. Mater. 2013, 49, 547–553. [Google Scholar] [CrossRef]
- Thaarrini, J.; Venkatasubramani, R. Feasibility Studies on Compressive Strength of Ground Coal Ash Geopolymer Mortar (Retracted Paper). Period. Polytech. Civ. Eng. 2015, 59, 373–379. [Google Scholar] [CrossRef]
- Guo, X.; Shi, H.; Dick, W.A. Compressive strength and microstructural characteristics of class C fly ash geopolymer. Cem. Concr. Compos. 2010, 32, 142–147. [Google Scholar] [CrossRef]
- Wang, H.; Li, H.; Yan, F. Synthesis and mechanical properties of metakaolinite-based geopolymer. Colloids Surf. A Physicochem. Eng. Asp. 2005, 268, 1–6. [Google Scholar] [CrossRef]
- Zhang, Z.; Huo, Z.; Yang, Z.; Wang, X.; Xia, J. Curing condition and NaOH concentration on the mechanical properties of fly ash based geopolymer mmortars. Int. J. Sustain. Constr. Eng Technol. 2023, 14, 279–286. [Google Scholar] [CrossRef]
- Kramar, S.; Šajna, A.; Ducman, V. Assessment of alkali activated mortars based on different precursors with regard to their suitability for concrete repair. Constr. Build. Mater. 2016, 124, 937–944. [Google Scholar] [CrossRef]
- Gebregziabiher, B.S.; Thomas, R.; Peethamparan, S. Very early-age reaction kinetics and microstructural development in alkali-activated slag. Cem. Concr. Compos. 2015, 55, 91–102. [Google Scholar] [CrossRef]
- Longhi, M.A.; Walkley, B.; Rodríguez, E.D.; Kirchheim, A.P.; Zhang, Z.; Wang, H. New selective dissolution process to quantify reaction extent and product stability in metakaolin-based geopolymers. Compos. Part B Eng. 2019, 176, 107172. [Google Scholar] [CrossRef]
- Chen, Z.; Li, J.-S.; Zhan, B.-J.; Sharma, U.; Poon, C.S. Compressive strength and microstructural properties of dry-mixed geopolymer pastes synthesized from GGBS and sewage sludge ash. Constr. Build. Mater. 2018, 182, 597–607. [Google Scholar] [CrossRef]
- Zhang, B.; Guo, H.; Yuan, P.; Li, Y.; Wang, Q.; Deng, L.; Liu, D. Geopolymerization of halloysite via alkali-activation: Dependence of microstructures on precalcination. Appl. Clay Sci. 2020, 185, 105375. [Google Scholar] [CrossRef]
- He, J.; Jie, Y.; Zhang, J.; Yu, Y.; Zhang, G. Synthesis and characterization of red mud and rice husk ash-based geopolymer composites. Cem. Concr. Compos. 2013, 37, 108–118. [Google Scholar] [CrossRef]
- van Jaarsveld, J.G.S.; van Deventer, J.S.J. Effect of the alkali metal activator on the properties of fly ash-based geopolymers. Ind. Eng. Chem. Res. 1999, 38, 3932–3941. [Google Scholar] [CrossRef]
- Liew, Y.M.; Kamarudin, H.; Al Bakri, A.M.M.; Bnhussain, M.; Luqman, M.; Nizar, I.K.; Ruzaidi, C.M.; Heah, C.Y. Optimization of solids-to-liquid and alkali activator ratios of calcined kaolin geopolymeric powder. Constr. Build. Mater. 2012, 37, 440–451. [Google Scholar] [CrossRef]
- Zuhua, Z.; Xiao, Y.; Huajun, Z.; Yue, C. Role of water in the synthesis of calcined kaolin-based geopolymer. Appl. Clay Sci. 2009, 43, 218–223. [Google Scholar] [CrossRef]
- Aiken, T.A.; Kwasny, J.; Sha, W.; Soutsos, M.N. Effect of slag content and activator dosage on the resistance of fly ash geopolymer binders to sulfuric acid attack. Cem. Concr. Res. 2018, 111, 23–40. [Google Scholar] [CrossRef]
- Yaseri, S.; Masoomi Verki, V.; Mahdikhani, M. Utilization of high volume cement kiln dust and rice husk ash in the production of sustainable geopolymer. J. Clean. Prod. 2019, 230, 592–602. [Google Scholar] [CrossRef]
- Zhang, M.; Zhao, M.; Zhang, G.; El-Korchi, T.; Tao, M. A multiscale investigation of reaction kinetics, phase formation, and mechanical properties of metakaolin geopolymers. Cem. Concr. Compos. 2017, 78, 21–32. [Google Scholar] [CrossRef]
- Fernández-Jiménez, A.; Palomo, A. Mid-infrared spectroscopic studies of alkali-activated fly ash structure. Micropor. Mesopor. Mat. 2005, 86, 207–214. [Google Scholar] [CrossRef]
- Li, N.; Farzadnia, N.; Shi, C. Microstructural changes in alkali-activated slag mortars induced by accelerated carbonation. Cem. Concr. Res. 2017, 100, 214–226. [Google Scholar] [CrossRef]
- El Alouani, M.; Alehyen, S.; El Achouri, M.; Taibi, M. Preparation, Characterization, and Application of Metakaolin-Based Geopolymer for Removal of Methylene Blue from Aqueous Solution. J. Chem. 2019, 2019, 4212901. [Google Scholar] [CrossRef]
- Dehghani, A.; Aslani, F.; Ghaebi Panah, N. Effects of initial SiO2/Al2O3 molar ratio and slag on fly ash-based ambient cured geopolymer properties. Constr. Build. Mater. 2021, 293, 123527. [Google Scholar] [CrossRef]
- Wu, C. Comparative assessment of the interface between poly(3-hydroxybutyrate-Co-3-hydroxyvalerate) and Fish Scales in composites: Preparation, characterization, and applications. Mater. Sci. Eng. C Mater. Biol. Appl. 2019, 104, 109878. [Google Scholar] [CrossRef] [PubMed]
- Yu, Q.; Li, S.; Li, H.; Chai, X.; Bi, X.; Liu, J.; Ohnuki, T. Synthesis and characterization of Mn-slag based geopolymer for immobilization of Co. J. Clean. Prod. 2019, 234, 97–104. [Google Scholar] [CrossRef]
- Yuan, P.; Tan, D.; Annabi-Bergaya, F.; Yan, W.; Fan, M.; Liu, D.; He, H. Changes in structure, morphology, porosity, and surface activity of mesoporous halloysite nanotubes under heating. Clay Clay Min. 2012, 60, 561–573. [Google Scholar] [CrossRef]
- Ryu, G.S.; Lee, Y.B.; Koh, K.T.; Chung, Y.S. The mechanical properties of fly ash-based geopolymer concrete with alkaline activators. Constr. Build. Mater. 2013, 47, 409–418. [Google Scholar] [CrossRef]
- Sun, Z.; Vollpracht, A. One year geopolymerisation of sodium silicate activated fly ash and metakaolin geopolymers. Cem. Concr. Compos. 2019, 95, 98–110. [Google Scholar] [CrossRef]
- Koshy, N.; Dondrob, K.; Hu, L.; Wen, Q.; Meegoda, J.N. Synthesis and characterization of geopolymers derived from coal gangue, fly ash and red mud. Constr. Build. Mater. 2019, 206, 287–296. [Google Scholar] [CrossRef]
- Li, Z.; Lu, T.; Liang, X.; Dong, H.; Ye, G. Mechanisms of autogenous shrinkage of alkali-activated slag and fly ash pastes. Cem. Concr. Res. 2020, 135, 106107. [Google Scholar] [CrossRef]
- Mastali, M.; Kinnunen, P.; Dalvand, A.; Mohammadi Firouz, R.; Illikainen, M. Drying shrinkage in alkali-activated binders—A critical review. Constr. Build. Mater. 2018, 190, 533–550. [Google Scholar] [CrossRef]
- Melo Neto, A.A.; Cincotto, M.A.; Repette, W. Drying and autogenous shrinkage of pastes and mortars with activated slag cement. Cem. Concr. Res. 2008, 38, 565–574. [Google Scholar] [CrossRef]
- Wang, Y.-S.; Alrefaei, Y.; Dai, J.-G. Silico-aluminophosphate and alkali-aluminosilicate geopolymers: A comparative review. Front. Mater. 2019, 6, 106. [Google Scholar] [CrossRef]
- Fan, Y.; Luan, H. Pore structure in concrete exposed to acid deposit. Constr. Build. Mater. 2013, 49, 407–416. [Google Scholar] [CrossRef]
- Rashad, A.M. Alkali-activated metakaolin: A short guide for civil Engineer—An overview. Constr. Build. Mater. 2013, 41, 751–765. [Google Scholar] [CrossRef]
- Wang, J.; Han, L.; Liu, Z.; Wang, D. Setting controlling of lithium slag-based geopolymer by activator and sodium tetraborate as a retarder and its effects on mortar properties. Cem. Concr. Compos. 2020, 110, 103598. [Google Scholar] [CrossRef]
- Cong, X.; Zhou, W.; Geng, X.; Elchalakani, M. Low field NMR relaxation as a probe to study the effect of activators and retarders on the alkali-activated GGBFS setting process. Cem. Concr. Compos. 2019, 104, 103399. [Google Scholar] [CrossRef]
- Kalina, L.; Bilek, V.; Novotny, R.; Moncekova, M.; Masilko, J.; Koplik, J. Effect of Na3PO4 on the hydration process of alkali-activated blast furnace slag. Materials 2016, 9, 395. [Google Scholar] [CrossRef]
- Gong, C.M.; Yang, N.R. Effect of phosphate on the hydration of alkali-activated red mud-slag cementitious material. Cem. Concr. Res. 2000, 30, 1013–1016. [Google Scholar] [CrossRef]
- Brough, A.R.; Holloway, M.; Sykes, J.; Atkinson, A. Sodium silicate-based alkali-activated slag mortars Part II. The retarding effect of additions of sodium chloride or malic acid. Cem. Concr. Res. 2000, 30, 1375–1379. [Google Scholar] [CrossRef]


| Chemical Composition | SiO2 | Al2O3 | Fe2O3 | CaO | Na2O | MgO | K2O | TiO2 | Others |
|---|---|---|---|---|---|---|---|---|---|
| CG | 62.84 | 23.28 | 4.44 | 1.73 | 1.04 | 1.99 | 3.22 | 0.98 | 0.48 |
| GGBFS | 28.03 | 14.65 | 0.44 | 43.43 | 0.51 | 8.57 | 0.44 | 0.99 | 2.94 |
| Specimens | CG (wt%) | GGBFS (wt%) | Na2O (%) | Ms = (SiO2/Na2O) | Liquid/Solid | Fluidity (mm) |
|---|---|---|---|---|---|---|
| C-7.0-1.3 | 0 | 100 | 7.0 | 1.3 | 0.55 | 107.6 |
| S1C4-7.0-1.3 | 20 | 80 | 118.1 | |||
| S2C3-7.0-1.3 | 40 | 60 | 129.3 | |||
| S1C1-7.0-1.3 | 50 | 50 | 135.3 | |||
| S3C2-7.0-1.3 | 60 | 40 | 142.8 | |||
| S4C1-7.0-1.3 | 80 | 20 | 154.4 | |||
| S-7.0-1.3 | 100 | 0 | 167.7 | |||
| S1C1-6.0-1.3 | 50 | 50 | 6.0 | 1.3 | 133.2 | |
| S1C1-8.0-1.3 | 8.0 | 137.1 | ||||
| S1C1-9.0-1.3 | 9.0 | 138.2 | ||||
| S1C1-7.0-0.9 | 7.0 | 0.9 | 127.3 | |||
| S1C1-7.0-1.1 | 1.1 | 131.9 | ||||
| S1C1-7.0-1.5 | 1.3 | 139.5 |
| Wavenumber (cm−1) | Assignment | References |
|---|---|---|
| 1650 | Stretching vibration of O–H bonds | [51] |
| 1445 | Asymmetric stretching vibration of C–O bonds | [52] |
| 1081-1010 | In-plane stretching vibrations of Si–O bonds | [53,54] |
| 875 | Out-of-plane bending vibrations of C–O bonds | [55] |
| 801 | Symmetric stretching vibrations of Si–O bonds | [56] |
| 780 | Stretching vibration of Al–O bonds | [57] |
| 697 | Internal extension of the Si–O bond | [58] |
| 480 | Stretching vibration of Si–O–T bands | [59,60] |
| Samples | Total Pore Area (m2/g) | Average Pore Diameter (nm) | Porosity (%) |
|---|---|---|---|
| C-7.0-1.3 | 36.58 | 35.70 | 31.74 |
| S1C1-7.0-1.3 | 24.89 | 22.84 | 18.38 |
| S-7.0-1.3 | 7.64 | 17.06 | 3.36 |
| S1C1-6.0-1.3 | 20.11 | 25.93 | 27.19 |
| S1C1-8.0-1.3 | 22.84 | 21.29 | 20.58 |
| S1C1-7.0-0.9 | 27.91 | 29.07 | 24.58 |
| S1C1-7.0-1.5 | 20.88 | 21.28 | 24.42 |
Disclaimer/Publisher’s Note: The statements, opinions and data contained in all publications are solely those of the individual author(s) and contributor(s) and not of MDPI and/or the editor(s). MDPI and/or the editor(s) disclaim responsibility for any injury to people or property resulting from any ideas, methods, instructions or products referred to in the content. |
© 2024 by the authors. Licensee MDPI, Basel, Switzerland. This article is an open access article distributed under the terms and conditions of the Creative Commons Attribution (CC BY) license (https://creativecommons.org/licenses/by/4.0/).
Share and Cite
Wang, X.; Liu, F.; Li, L.; Chen, W.; Cong, X.; Yu, T.; Zhang, B. Study on the Compressive Strength and Reaction Mechanism of Alkali-Activated Geopolymer Materials Using Coal Gangue and Ground Granulated Blast Furnace Slag. Materials 2024, 17, 3659. https://doi.org/10.3390/ma17153659
Wang X, Liu F, Li L, Chen W, Cong X, Yu T, Zhang B. Study on the Compressive Strength and Reaction Mechanism of Alkali-Activated Geopolymer Materials Using Coal Gangue and Ground Granulated Blast Furnace Slag. Materials. 2024; 17(15):3659. https://doi.org/10.3390/ma17153659
Chicago/Turabian StyleWang, Xiaoping, Feng Liu, Lijuan Li, Weizhi Chen, Xinhe Cong, Ting Yu, and Baifa Zhang. 2024. "Study on the Compressive Strength and Reaction Mechanism of Alkali-Activated Geopolymer Materials Using Coal Gangue and Ground Granulated Blast Furnace Slag" Materials 17, no. 15: 3659. https://doi.org/10.3390/ma17153659