
Evaluation of the Effect of Mineral Oil Exposure on Changes in the Structure and Mechanical Properties of Polymer Parts Produced by Additive Manufacturing Techniques

 , , , and
Abstract
:1. Introduction
2. Materials and Methods
2.1. Materials and Printing Procedures
2.2. Description of the Experiment Conducted
2.3. Static Tensile Test
2.4. Morphological Analysis
2.5. Evaluation of Thermal Stability of Prints
2.6. Fourier Transform Infrared Spectroscopy (FTIR)
2.7. Statistics
3. Results
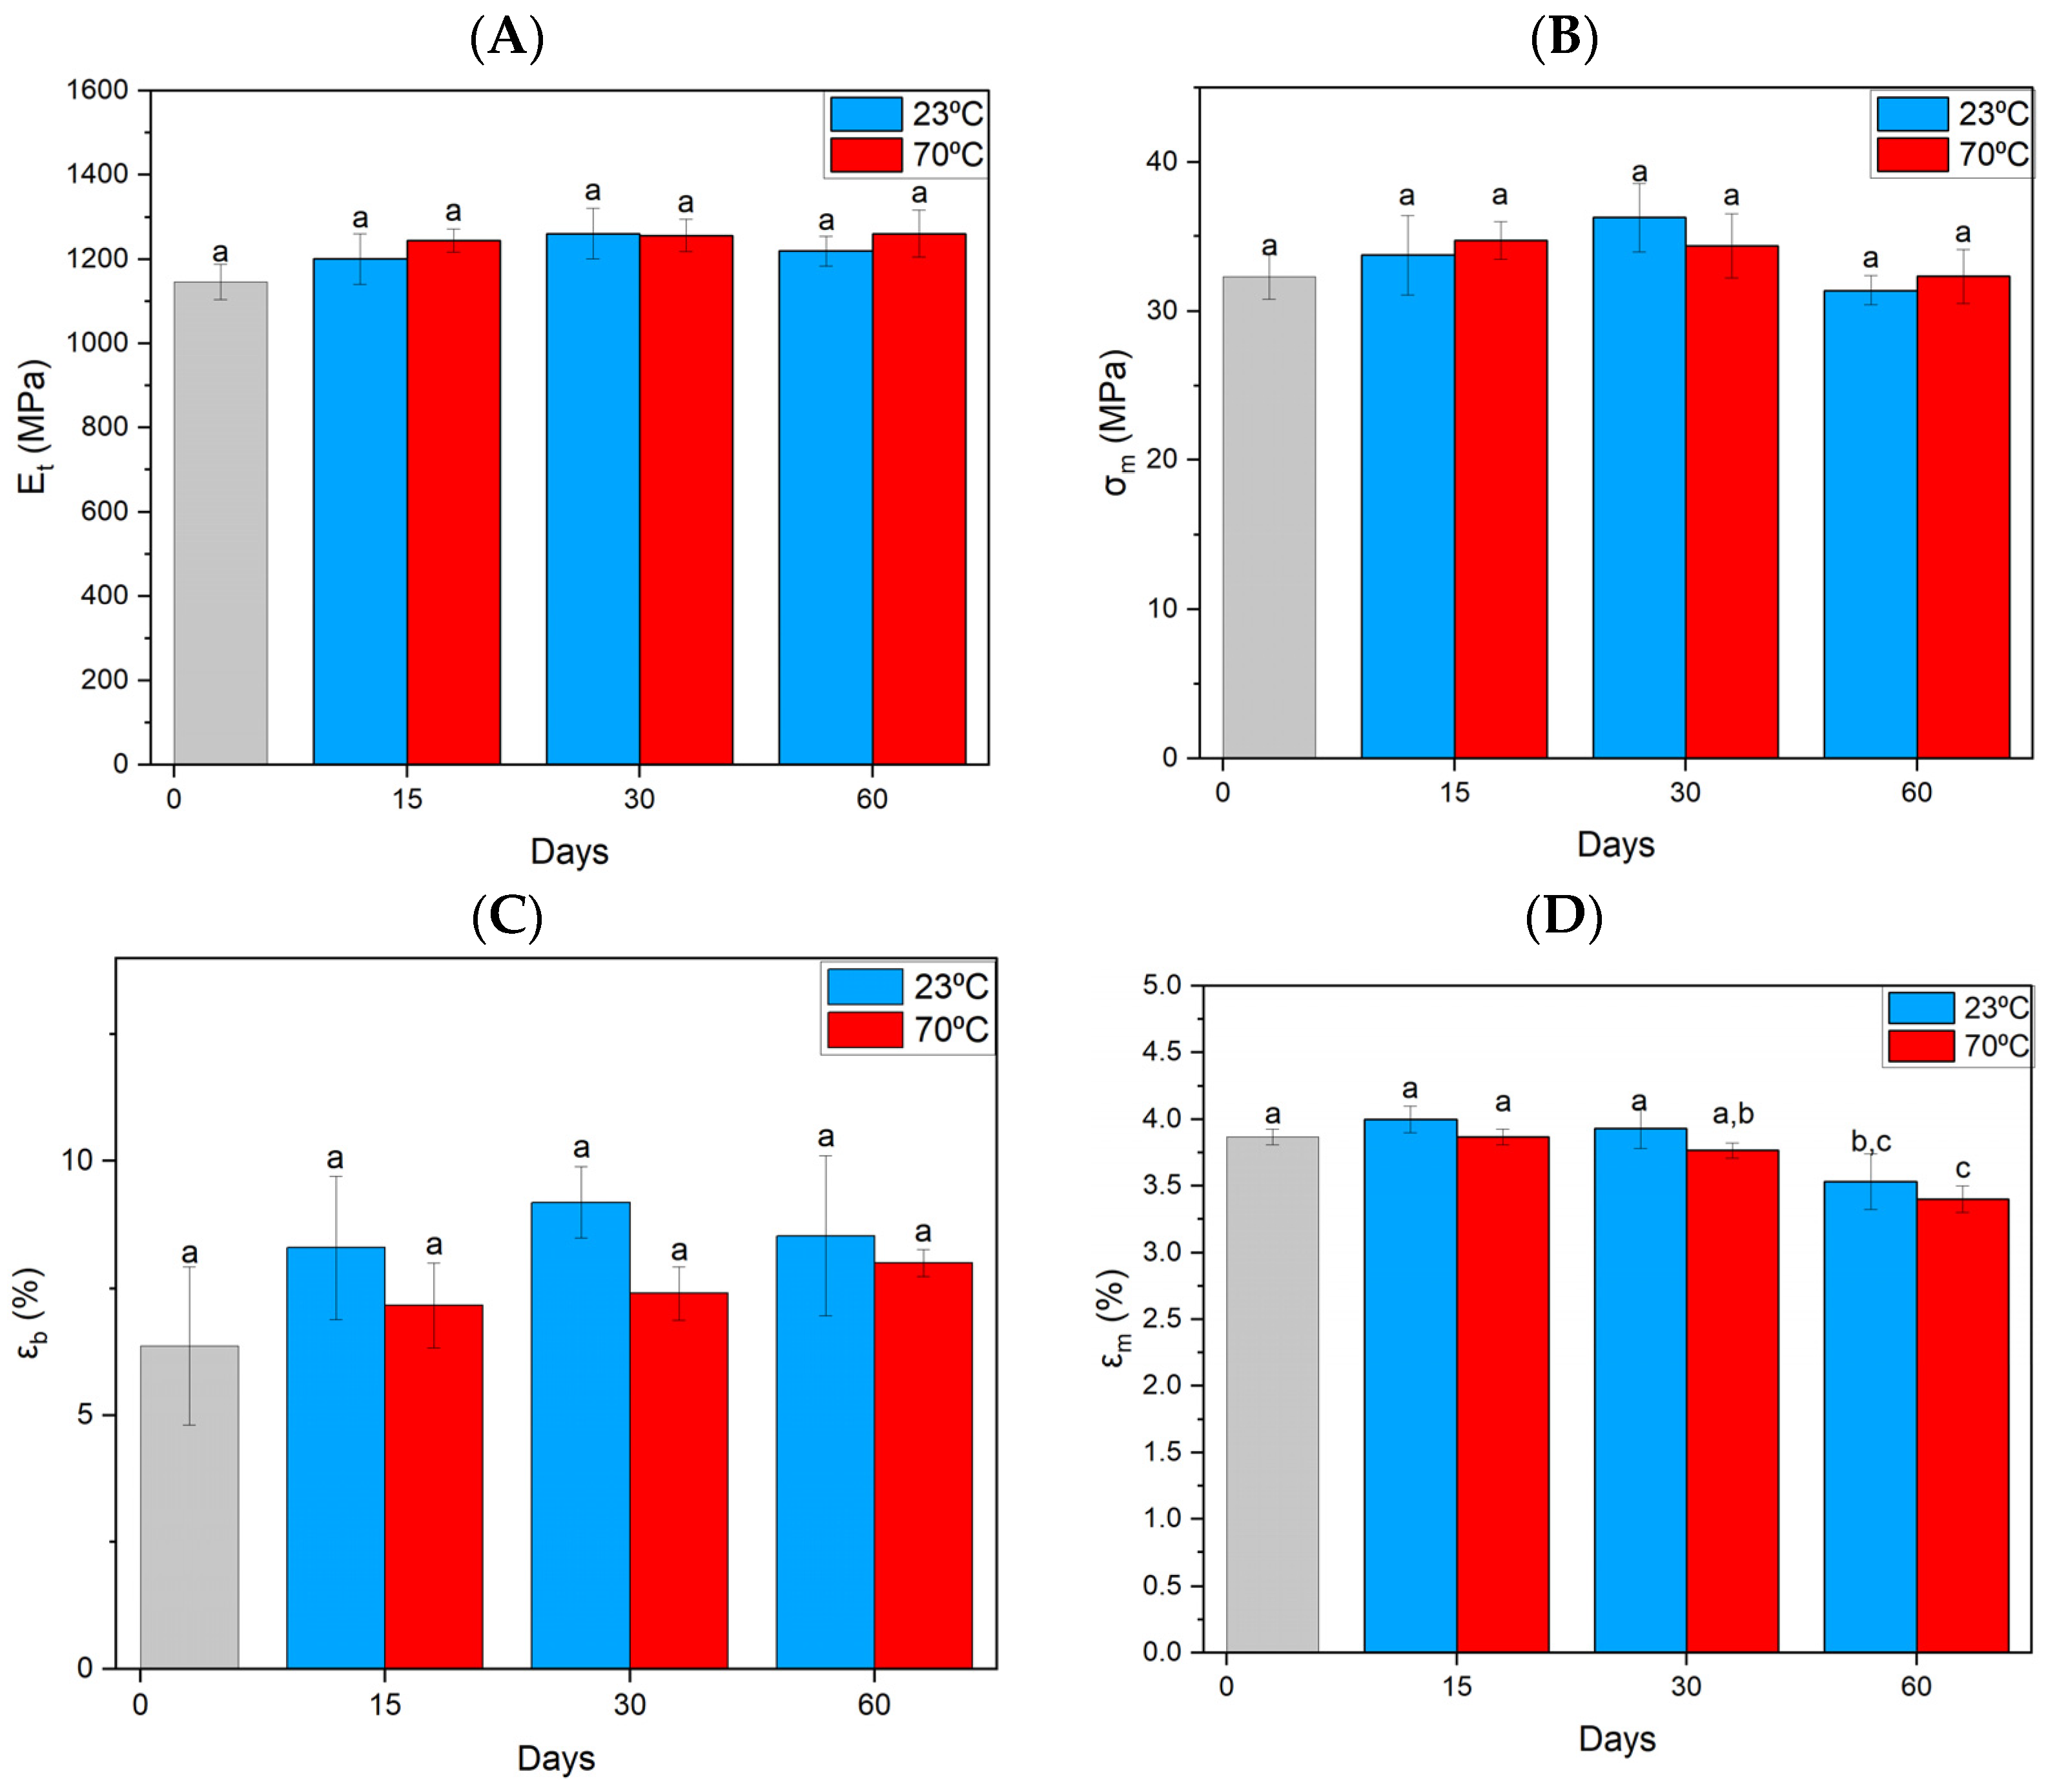
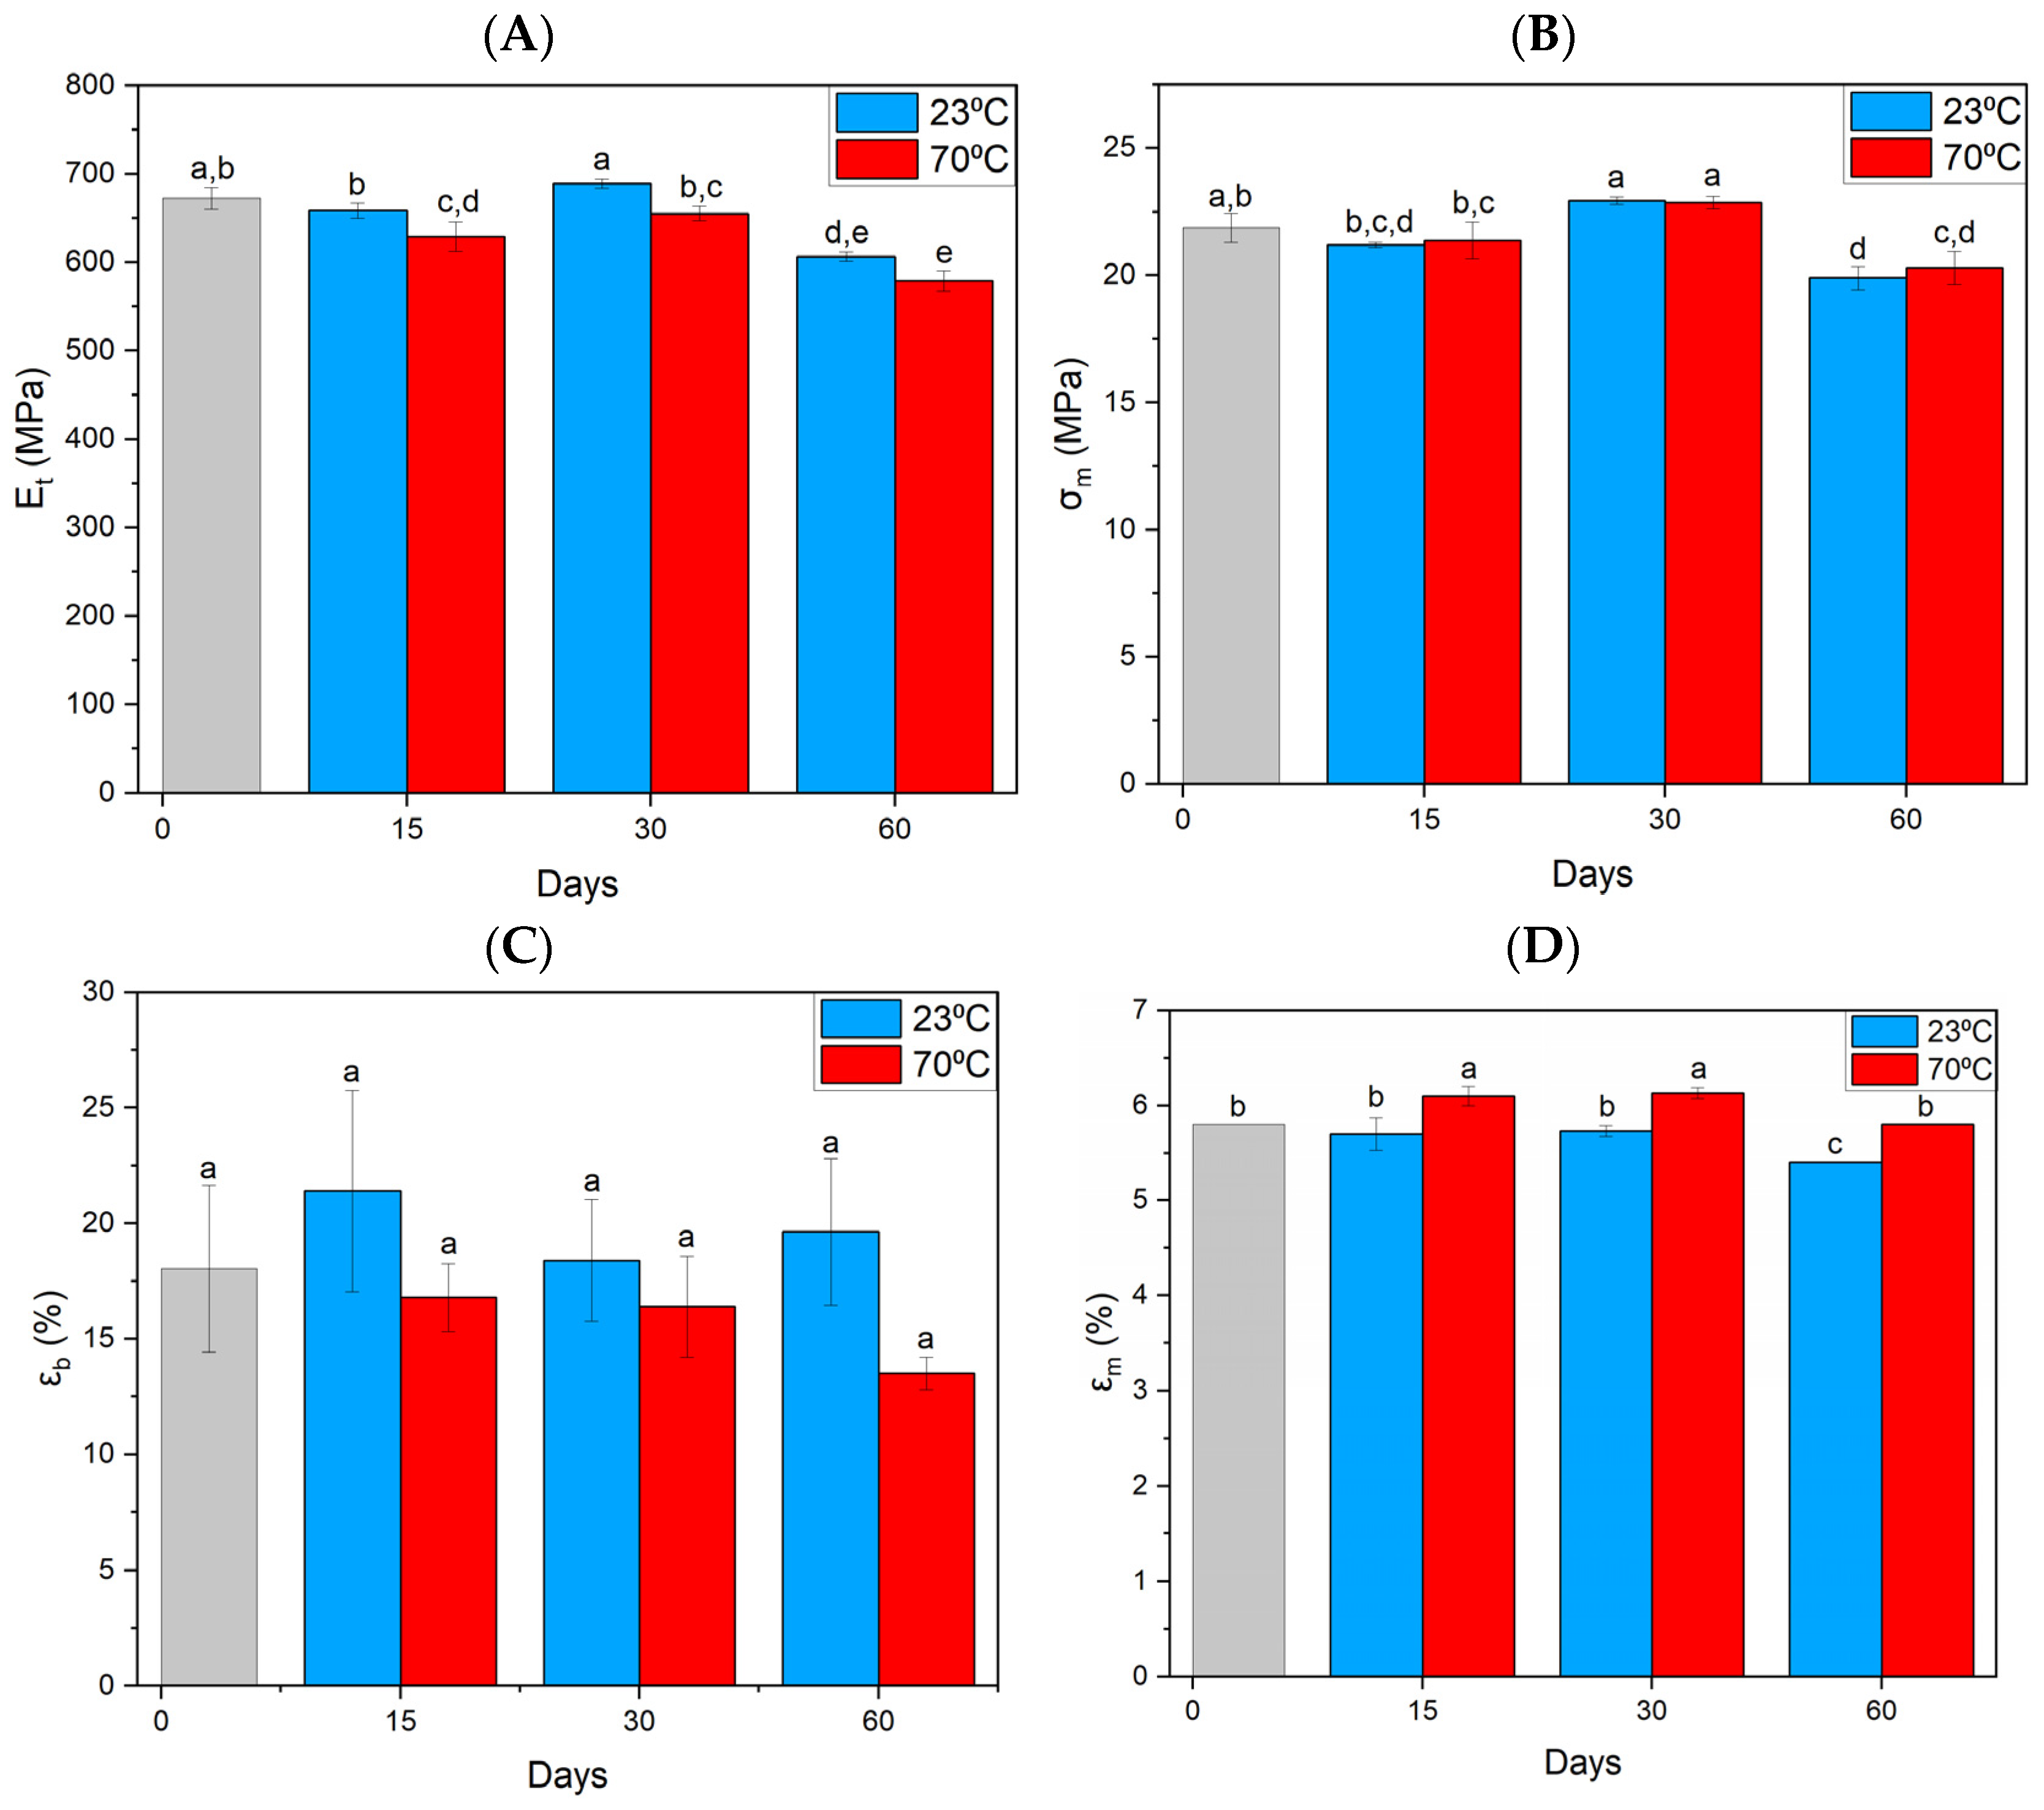
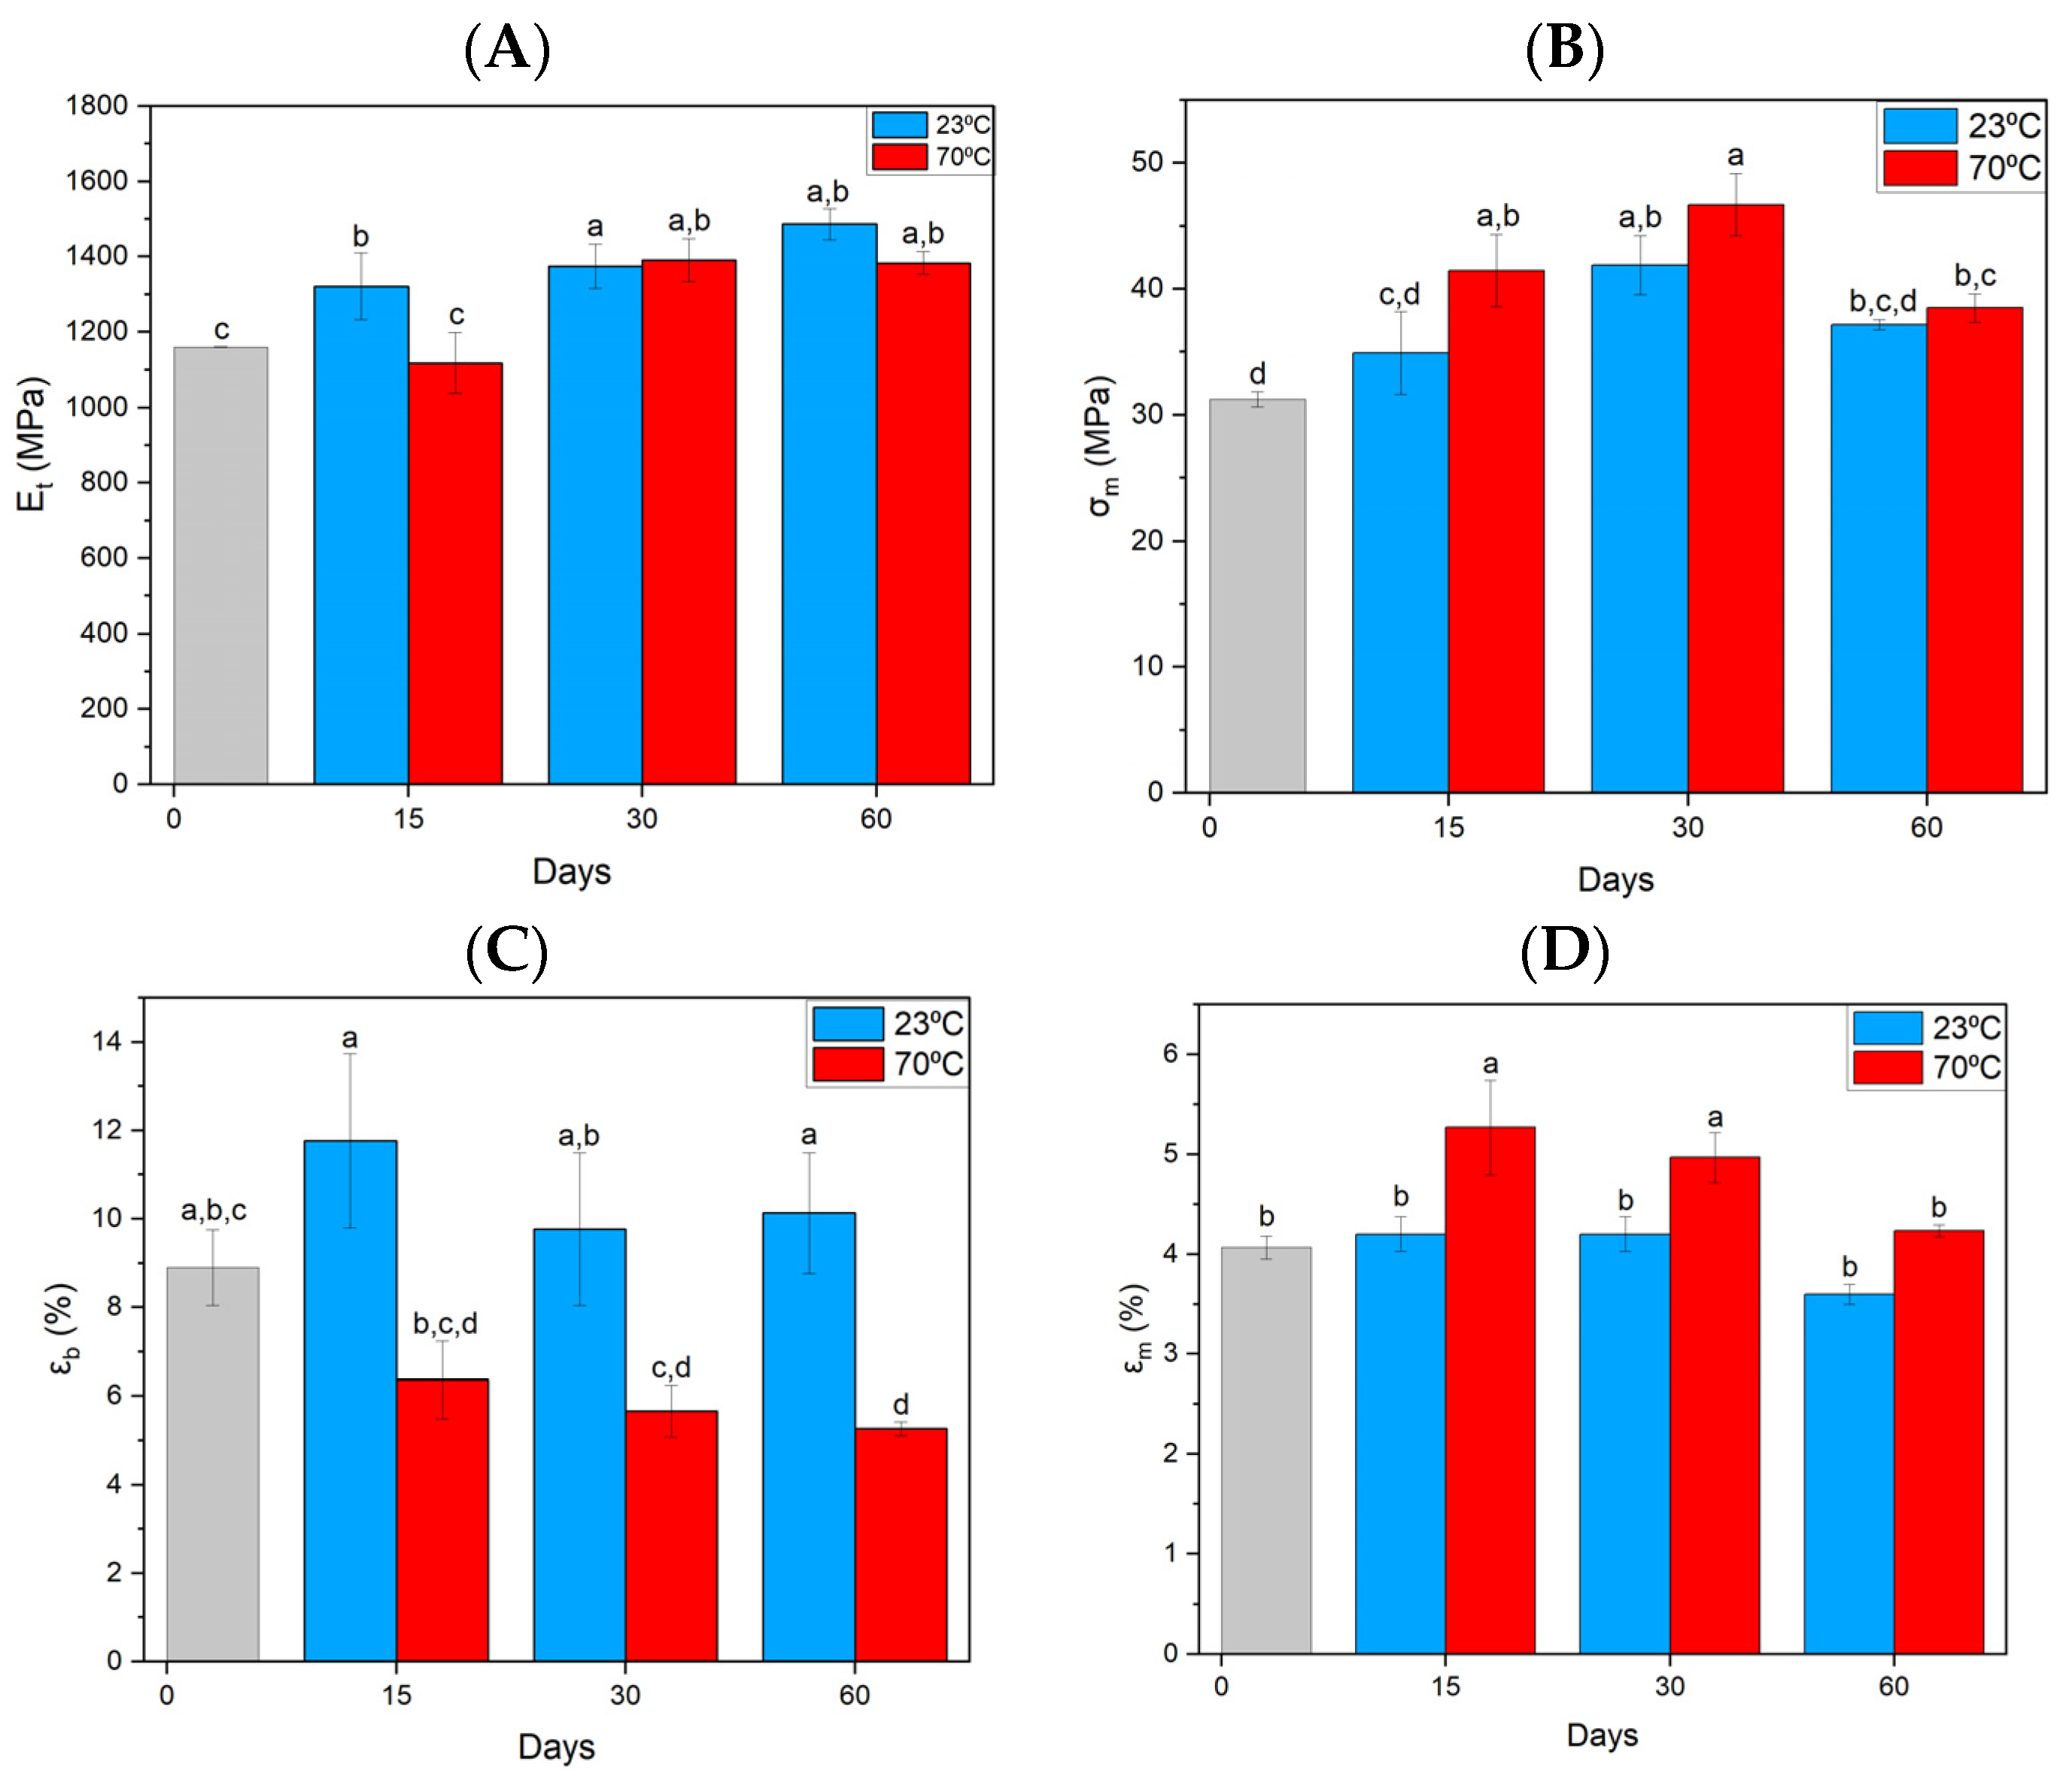
3.1. Tensile Test
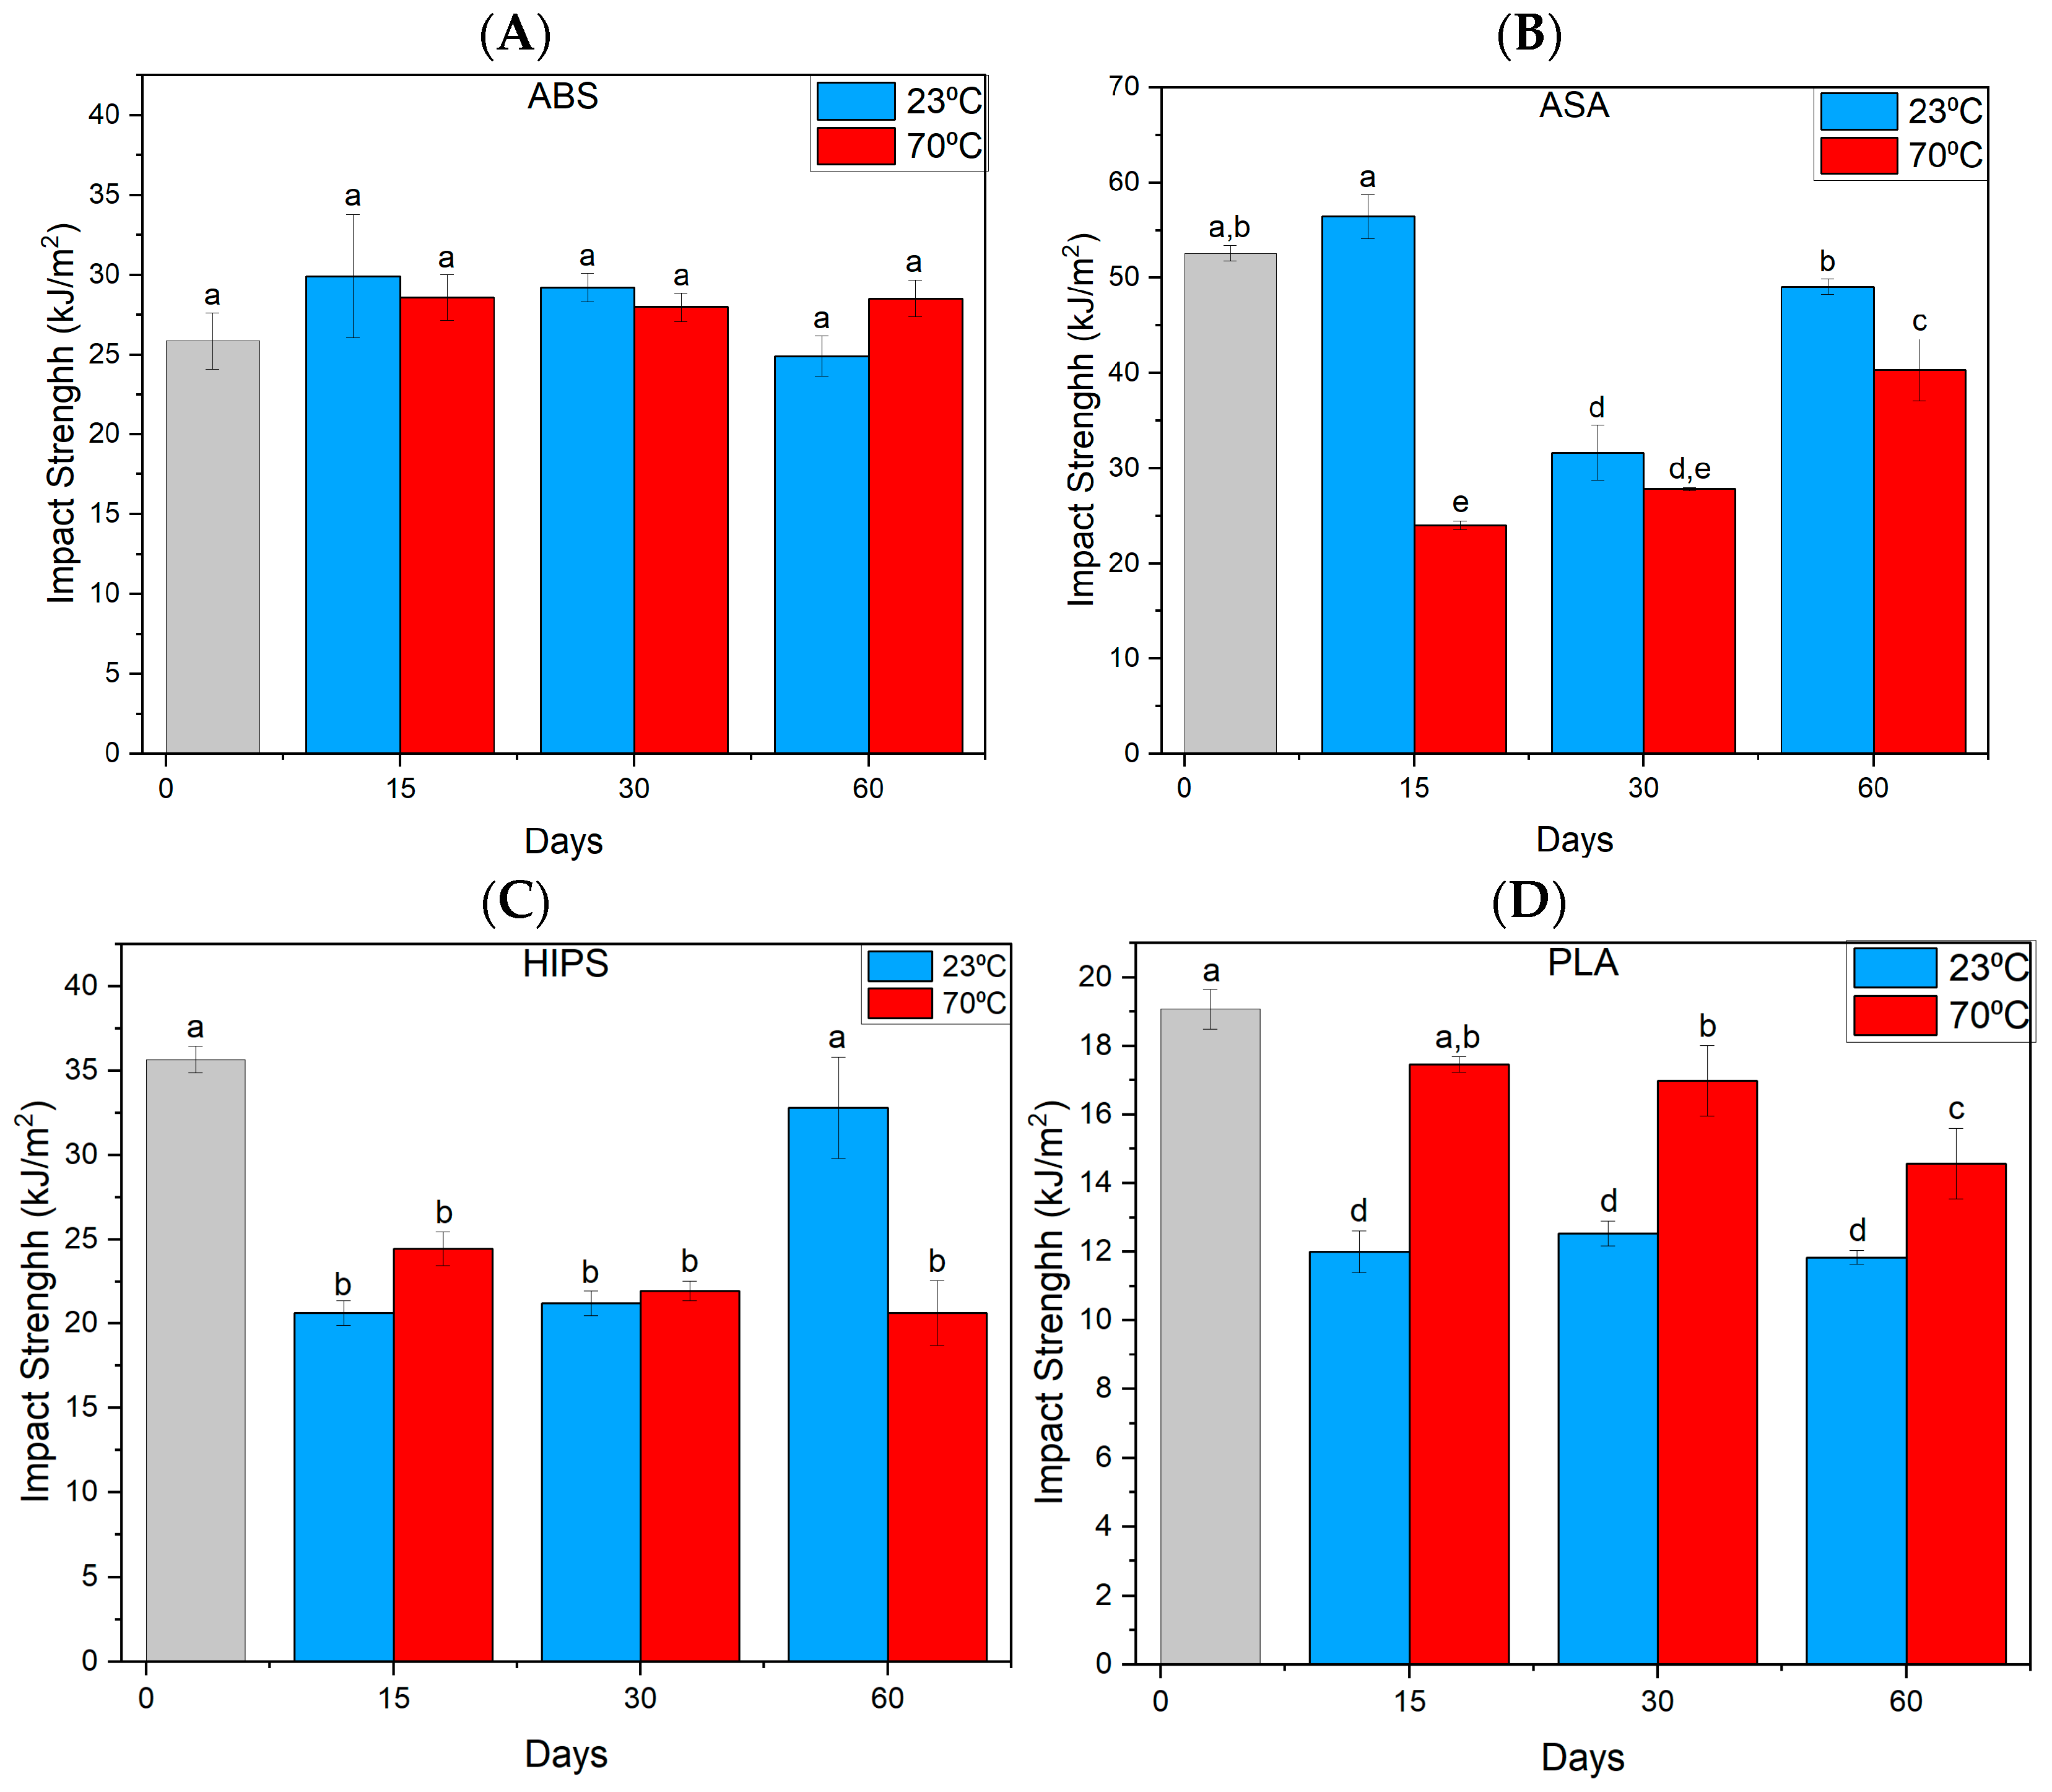
3.2. Charpy Impact Test
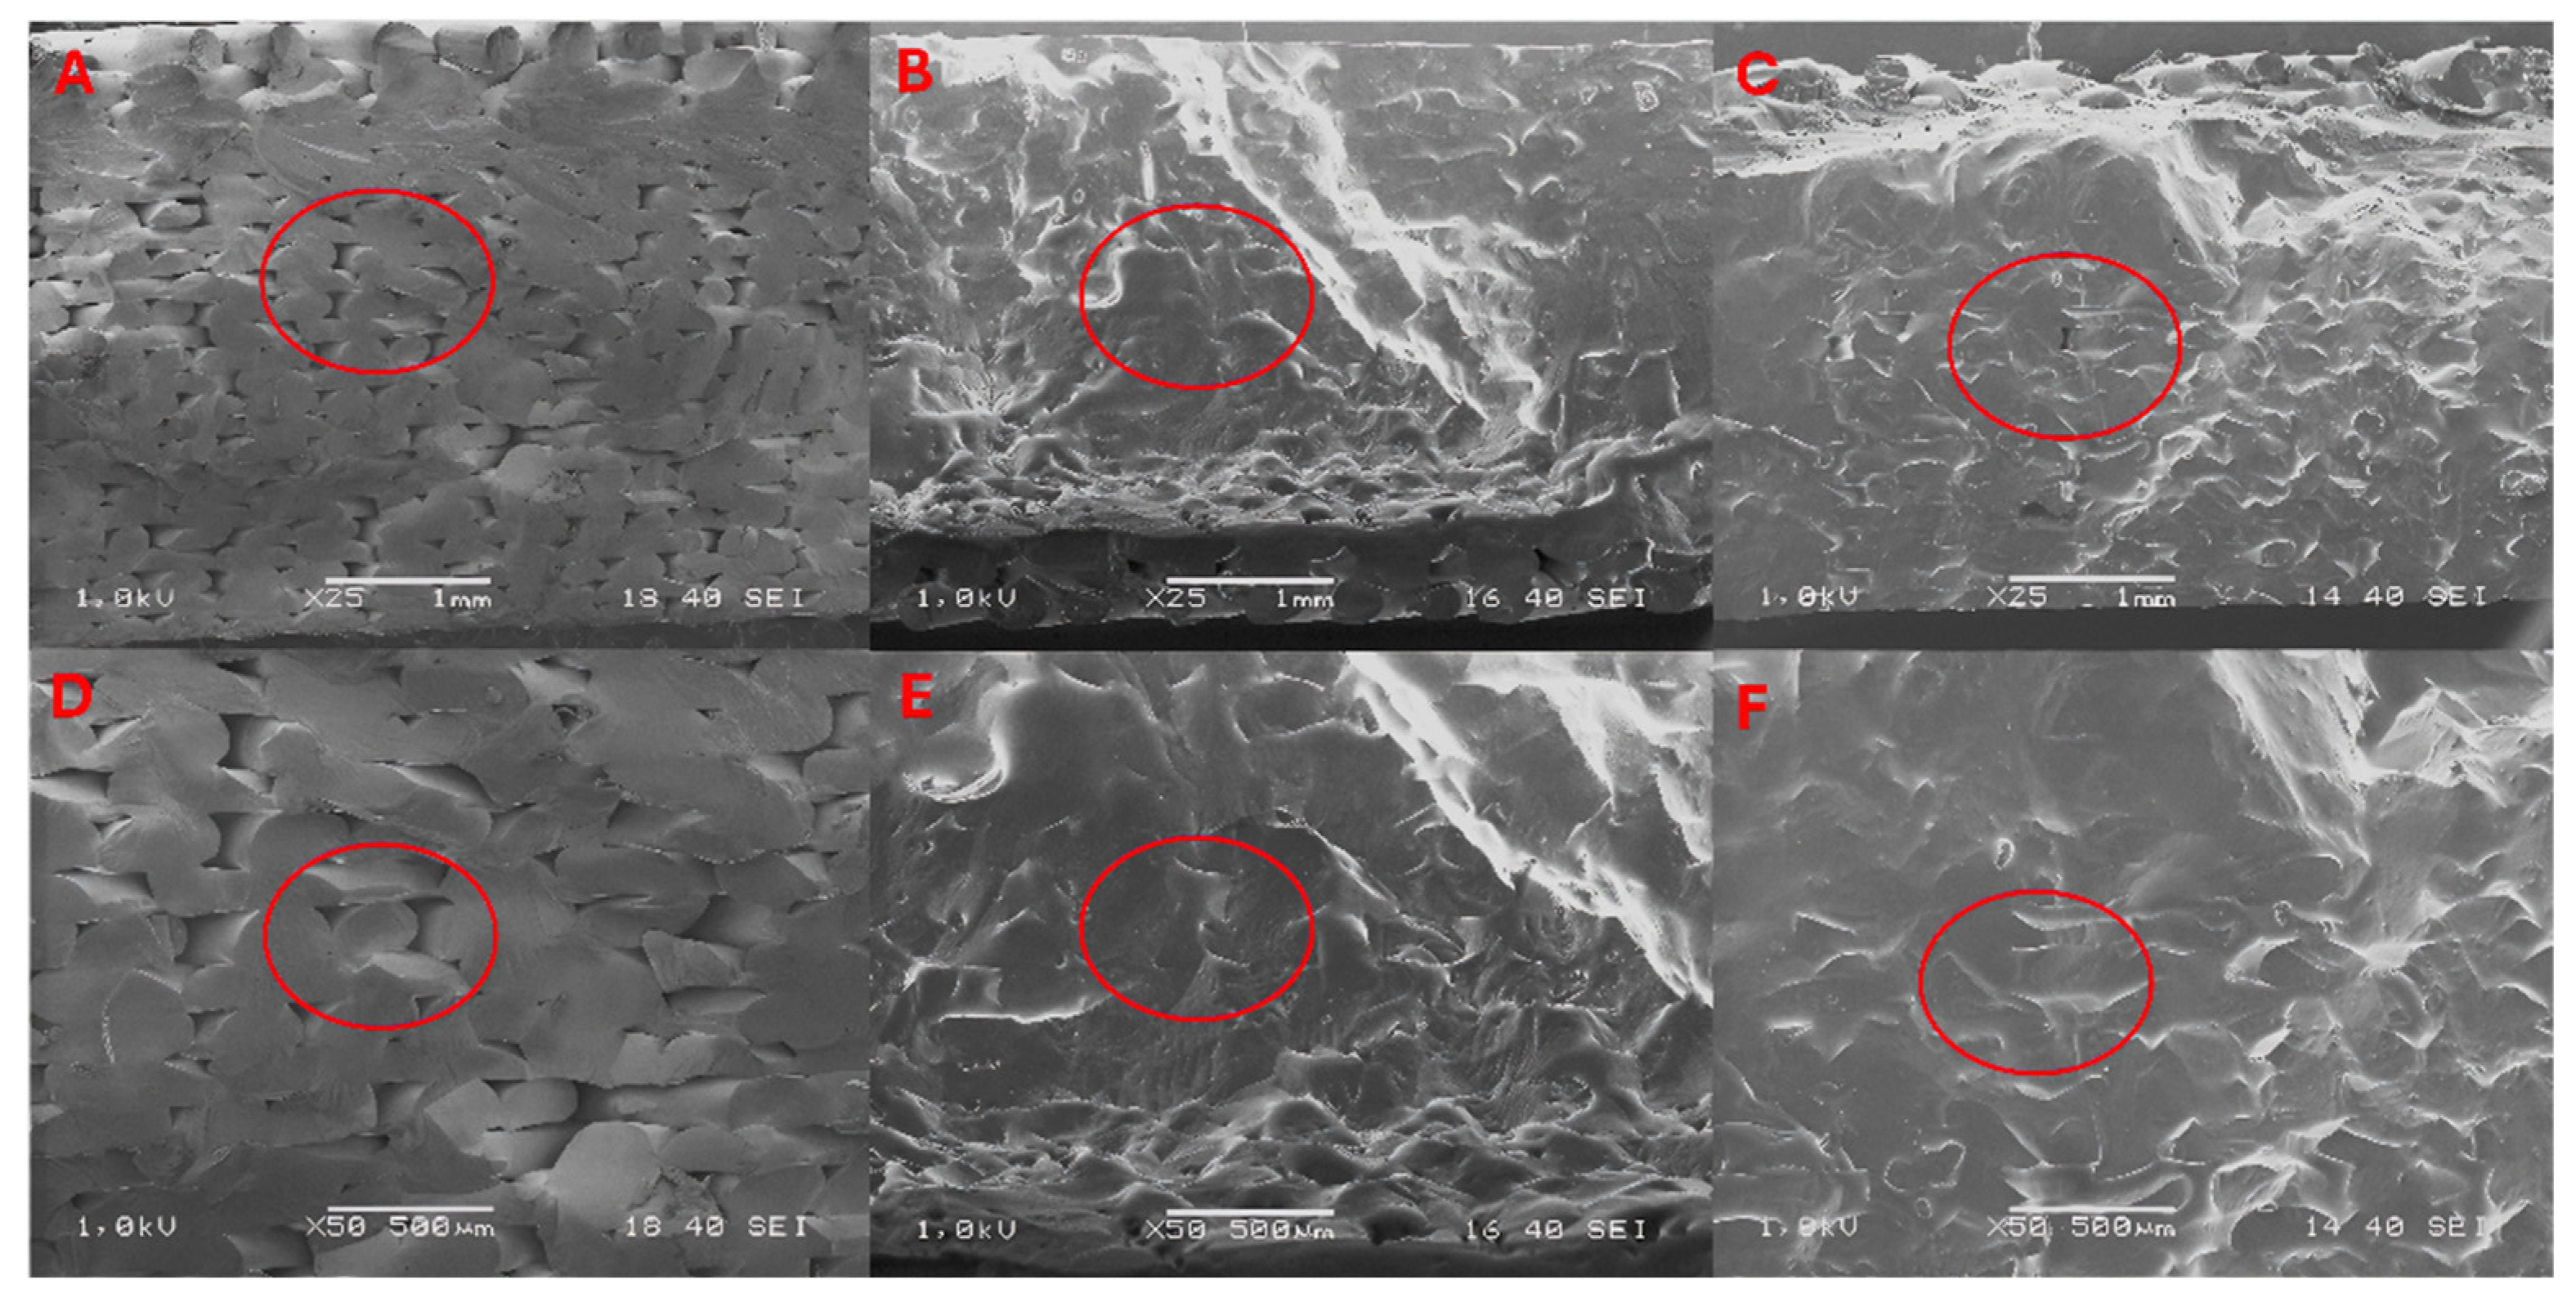
3.3. Scanning Electron Microscope
3.4. Analysis of TGA Results
3.4.1. Mineral Oil
3.4.2. PLA
3.4.3. HIPS
3.4.4. ASA
3.4.5. ABS
3.4.6. PLA
3.4.7. HIPS
3.4.8. ASA
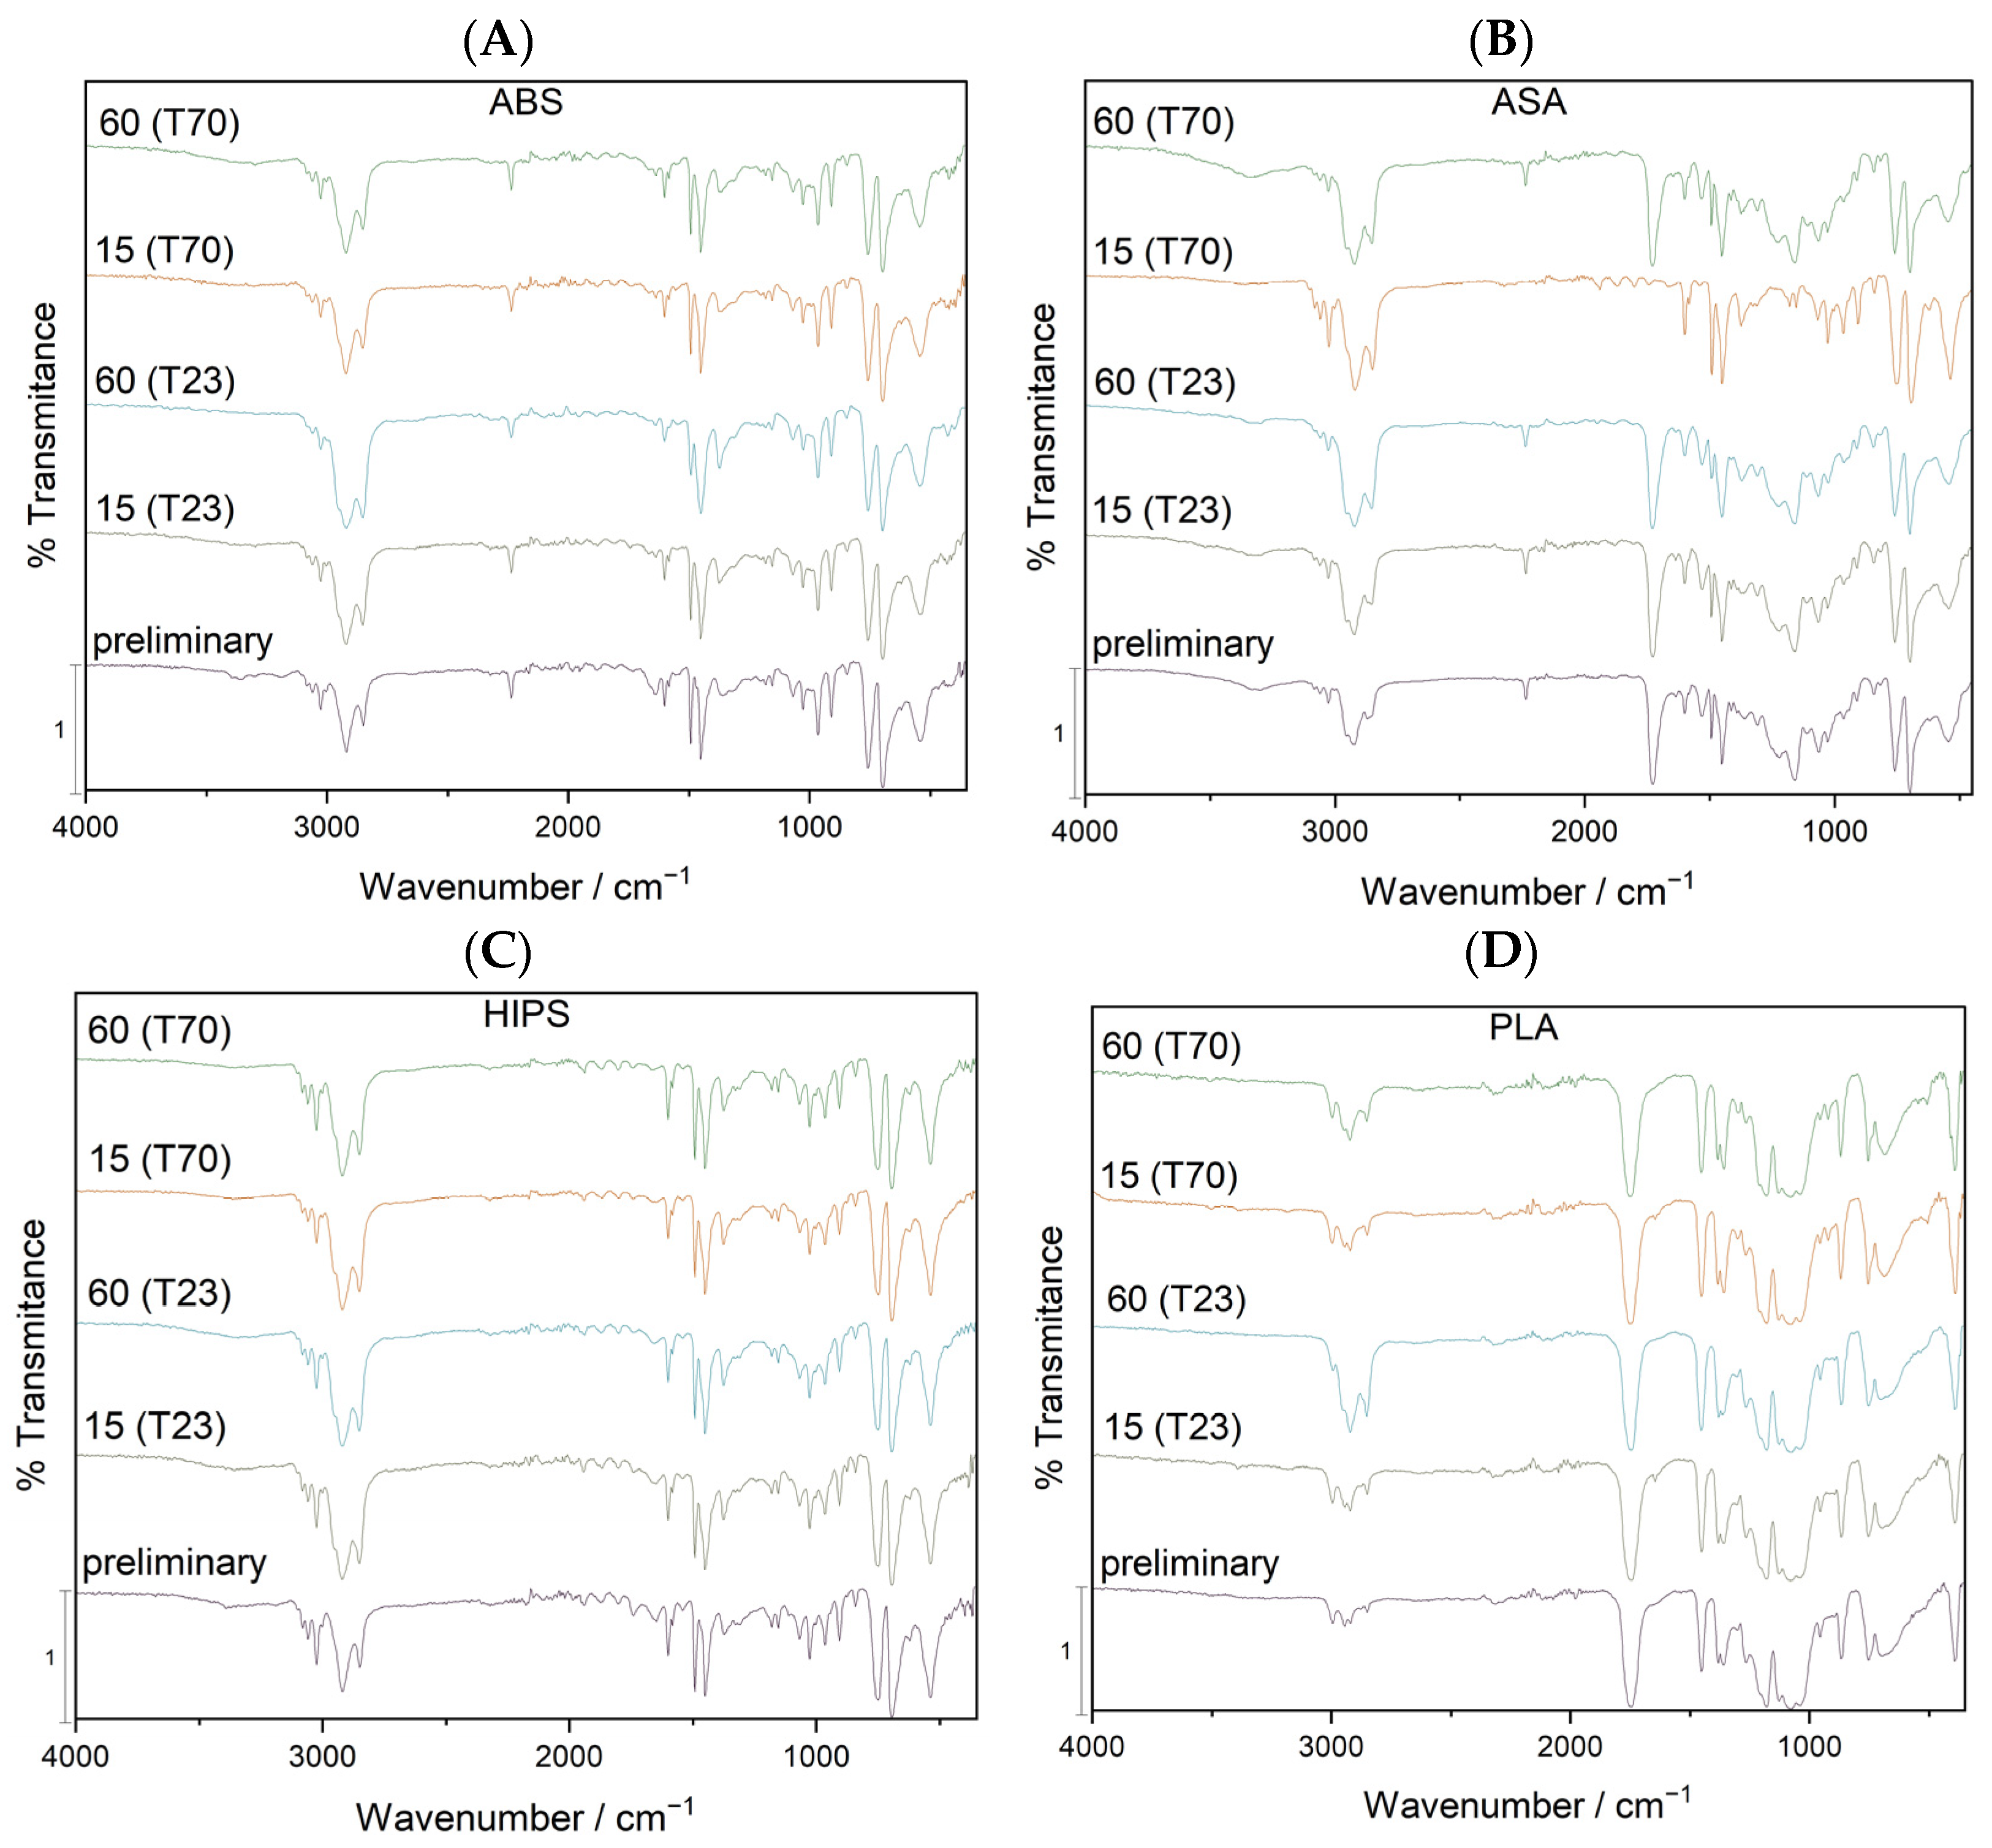
3.5. Analysis of FTIR Results
3.5.1. Mineral Oil
3.5.2. HIPS
3.5.3. ASA
3.5.4. ABS
4. Conclusions
Supplementary Materials
Author Contributions
Funding
Institutional Review Board Statement
Informed Consent Statement
Data Availability Statement
Conflicts of Interest
References
- Kumar Panda, S.; Charan Rath, K.; Mishra, S.; Khang, A. Revolutionizing Product Development: The Growing Importance of 3D Printing Technology. Mater. Today Proc. 2023. [Google Scholar] [CrossRef]
- Shahrubudin, N.; Lee, T.C.; Ramlan, R. An Overview on 3D Printing Technology: Technological, Materials, and Applications. Procedia Manuf. 2019, 35, 1286–1296. [Google Scholar] [CrossRef]
- Lu, B.; Li, D.; Tian, X. Development Trends in Additive Manufacturing and 3D Printing. Engineering 2015, 1, 085–089. [Google Scholar] [CrossRef]
- Aimar, A.; Palermo, A.; Innocenti, B. The Role of 3D Printing in Medical Applications: A State of the Art. J. Healthc. Eng. 2019, 2019, 5340616. [Google Scholar] [CrossRef] [PubMed]
- Ali, S.; Nouzil, I.; Mehra, V.; Deiab, I.; Pervaiz, S. Integrated optimization scheme for 3D printing of PLA-APHA biodegradable blends. Prog. Addit. Manuf. 2024, 1–12. [Google Scholar] [CrossRef]
- Hozdić, E.; Hozdić, E. Comparative Analysis of the Influence of Mineral Engine Oil on the Mechanical Parameters of FDM 3D-Printed PLA, PLA+CF, PETG, and PETG+CF Materials. Materials 2023, 16, 6342. [Google Scholar] [CrossRef] [PubMed]
- Quanjin, M.; Rejab, M.R.M.; Idris, M.S.; Kumar, N.M.; Abdullah, M.H.; Reddy, G.R. Recent 3D and 4D Intelligent Printing Technologies: A Comparative Review and Future Perspective. Procedia Comput. Sci. 2020, 167, 1210–1219. [Google Scholar] [CrossRef]
- Tofail, S.A.M.; Koumoulos, E.P.; Bandyopadhyay, A.; Bose, S.; O’Donoghue, L.; Charitidis, C. Additive Manufacturing: Scientific and Technological Challenges, Market Uptake and Opportunities. Mater. Today 2018, 21, 22–37. [Google Scholar] [CrossRef]
- Moreno Nieto, D.; Alonso-García, M.; Pardo-Vicente, M.-A.; Rodríguez-Parada, L. Product Design by Additive Manufacturing for Water Environments: Study of Degradation and Absorption Behavior of PLA and PETG. Polymers 2021, 13, 1036. [Google Scholar] [CrossRef]
- Afshar, A.; Wood, R. Development of Weather-Resistant 3D Printed Structures by Multi-Material Additive Manufacturing. J. Compos. Sci. 2020, 4, 94. [Google Scholar] [CrossRef]
- Upadhyay, R.K.; Mishra, A.K.; Kumar, A. Mechanical Degradation of 3D Printed PLA in Simulated Marine Environment. Surf. Interfaces 2020, 21, 100778. [Google Scholar] [CrossRef]
- Fotopoulou, K.; Karapanagioti, H. Degradation of Various Plastics in the Environment. In Handbook of Environmental Chemistry; Springer: Berlin/Heidelberg, Germany, 2017; ISBN 978-3-319-95566-7. [Google Scholar]
- Pinho, A.C.; Piedade, A.P. Sandwich Multi-Material 3D-Printed Polymers: Influence of Aging on the Impact and Flexure Resistances. Polymers 2021, 13, 4030. [Google Scholar] [CrossRef] [PubMed]
- Yildirim, F.; Hiçyılmaz, A.; Yildirim, K. The Effects of the Weathering Methods on the Properties of the ABS, ASA and PMMA Polymers. Polym. Test 2022, 107, 107484. [Google Scholar] [CrossRef]
- Paz, E.; Calzado, M.; Romero, L.; Espinosa, M.M.; Domínguez, M. Characterization of the Resistance to Abrasive Chemical Agents of Test Specimens of Thermoplastic Elastomeric Polyurethane Composite Materials Produced by Additive Manufacturing. J. Appl. Polym. Sci. 2021, 138, 50791. [Google Scholar] [CrossRef]
- Boubakri, A.; Haddar, N.; Elleuch, K.; Bienvenu, Y. Impact of Aging Conditions on Mechanical Properties of Thermoplastic Polyurethane. Mater. Des. 2010, 31, 4194–4201. [Google Scholar] [CrossRef]
- Boubakri, A.; Elleuch, K.; Guermazi, N.; Ayedi, H.F. Investigations on Hygrothermal Aging of Thermoplastic Polyurethane Material. Mater. Des. 2009, 30, 3958–3965. [Google Scholar] [CrossRef]
- Pretsch, T.; Jakob, I.; Müller, W. Hydrolytic Degradation and Functional Stability of a Segmented Shape Memory Poly(Ester Urethane). Polym. Degrad. Stab. 2009, 94, 61–73. [Google Scholar] [CrossRef]
- Šafka, J.; Ackermann, M.; Martis, D. Chemical Resistance of Materials Used in Additive Manufacturing. MM Sci. J. 2016, 2016, 1573–1578. [Google Scholar] [CrossRef]
- Aydemir, C.; Yenidoğan, S.; Karademir, A.; Kandirmaz, E.A. The Examination of Vegetable- and Mineral Oil-Based Inks’ Effects on Print Quality: Green Printing Effects with Different Oils. J. Appl. Biomater. Funct. Mater. 2018, 16, 137–143. [Google Scholar] [CrossRef]
- Spectrumfilaments. Manufacturer of 3D Printing Filament; Spectrumfilaments: Pecice Male, Poland, 2024. [Google Scholar]
- Available online: https://Www.Orlenoil.Pl/Oodownload/1116.Pdf (accessed on 25 June 2024).
- PN-EN ISO 527:1998; Plastics—Determination of Mechanical Properties in Static Tension—General Principles. Polish Stand-ArdsInstitution: Warszawa, Poland, 1998.
- PN-EN ISO 179-1; Plastics—Determination of Charpy Impact Strength—Part 1: Non-Instrumental Impact Test. Polish Stand-ArdsInstitution: Warszawa, Poland, 2010.
- ROSTEK Ewa and BABIAK, M. Thermogravimetric Analysis in the Synthetic Engine Oil 5W-30. Combust. Engines 2017, 170, 188–192. [Google Scholar] [CrossRef]
- Robiah Yunus, H.S.R.N.W.M.Z. Wear and Friction Behavior of Semi-Synthetic Engine Oil Blended with Palm Oil/TMP Ester and Nano Glass Powder Additive. Tribologi 2020, 26, 16–36. [Google Scholar]
- Lehrle, R.S.; Duncan, R.; Liu, Y.; Parsons, I.W.; Rollinson, M.; Lamb, G.; Barr, D. Mass Spectrometric Methods for Assessing the Thermal Stability of Liquid Polymers and Oils: Study of Some Liquid Polyisobutylenes Used in the Production of Crankcase Oil Additives. J. Anal. Appl. Pyrolysis 2002, 64, 207–227. [Google Scholar] [CrossRef]
- Mohan Rao, U.; Fofana, I.; Kartheek, R.; Yapi, K.M.L.; Jaya, T. Mineral Oil and Ester Based Oil/Paper Insulation Decaying Assessment by FTIR Measurements. In Proceedings of the 21st International Symposium on High Voltage Engineering, Budapest, Hungary, 26–30 August 2020; Németh, B., Ed.; Springer: Cham, Switzerland, 2020; pp. 615–624. [Google Scholar]
- Sikora, G.; Miszczak, A. The Influence of Oil Ageing on the Change of Viscosity and Lubricity of Engine Oil. In Proceedings of the Mechatronic Systems and Materials V; Trans Tech Publications Ltd.: Zurich, Switzerland, 2013; Volume 199, pp. 182–187. [Google Scholar]
- Giełdowska, M.; Puchalski, M.; Sztajnowski, S.; Krucińska, I. Evolution of the Molecular and Supramolecular Structures of PLA during the Thermally Supported Hydrolytic Degradation of Wet Spinning Fibers. Macromolecules 2022, 55, 10100–10112. [Google Scholar] [CrossRef]
- Barczewski, M.; Hejna, A.; Aniśko, J.; Andrzejewski, J.; Piasecki, A.; Mysiukiewicz, O.; Bąk, M.; Gapiński, B.; Ortega, Z. Rotational Molding of Polylactide (PLA) Composites Filled with Copper Slag as a Waste Filler from Metallurgical Industry. Polym. Test 2022, 106, 107449. [Google Scholar] [CrossRef]
- Meaurio, E.; López-Rodríguez, N.; Sarasua, J.R. Infrared Spectrum of Poly(l-Lactide): Application to Crystallinity Studies. Macromolecules 2006, 39, 9291–9301. [Google Scholar] [CrossRef]
- Rasselet, D.; Ruellan, A.; Guinault, A.; Miquelard-Garnier, G.; Sollogoub, C.; Fayolle, B. Oxidative Degradation of Polylactide (PLA) and Its Effects on Physical and Mechanical Properties. Eur. Polym. J. 2014, 50, 109–116. [Google Scholar] [CrossRef]
- Arráez, F.J.; Arnal, M.L.; Müller, A.J. Thermal Degradation of High-Impact Polystyrene with pro-Oxidant Additives. Polym. Bull. 2019, 76, 1489–1515. [Google Scholar] [CrossRef]
- Signoret, C.; Edo, M.; Caro-Bretelle, A.S.; Lopez-Cuesta, J.M.; Ienny, P.; Perrin, D. MIR Spectral Characterization of Plastic to Enable Discrimination in an Industrial Recycling Context: III. Anticipating Impacts of Ageing on Identification. Waste Manag. 2020, 109, 51–64. [Google Scholar] [CrossRef]


| Parameter Name | Smart ABS | HIPS-X | ASA 275 | PLA Premium |
|---|---|---|---|---|
| Product Symbol | 5903175658173 | 5903175658012 | 5903175653086 | 5903175657114 |
| Extrusion Temperature | 275 °C | 250 °C | 240 °C | 210 °C |
| Platform Temperature | 80 °C | 80 °C | 60 °C | 30 °C |
| Density | 1.05 g/cm3 | 1.05 g/cm3 | 1.08 g/cm3 | 1.24 g/cm3 |
| Infill pattern | Rectilinear | |||
| Fill angle | 45° | |||
| Infill density | 100% | |||
| Fill density at the bottom | 100% | |||
| Fill density on the wall | 100% | |||
| Layer height | 0.3 mm | |||
| Solid layers | Top 7, Bottom 4 | |||
| Print speed | 30 mm/s | |||
| Nozzle diameter | 0.4 mm | |||
| Diameter tolerance | ±0.03 | |||
| Layer height | 0.19 mm | |||
| Filling density | 100% | |||
| Material | T1 | T5 | T50 | Tonset | TDTG | ||
|---|---|---|---|---|---|---|---|
| Temperature (°C) | Time (days) | (°C) | (°C) | (°C) | (°C) | (°C) | |
| Mineral oil | - | - | 141.6 (0.1) | 241.5 (0.1) | 323.6 (0.3) | 275.0 (0.2) | 331.0 (0.1) |
| PLA | - | 0 | 306.2 (0.3) | 329.8 (0.5) | 356.2 (0.1) | 341.3 (0.3) | 360.2 (0.5) |
| 23 | 15 | 214.3 (0.5) | 319.2 (0.2) | 355.0 (0.2) | 338.3 (0.1) | 360.4 (0.2) | |
| 30 | 212.7 (0.1) | 315.0 (0.6) | 354.0 (0.3) | 338.7 (0.2) | 358.8 (0.1) | ||
| 60 | 211.2 (0.4) | 310.8 (0.1) | 353.0 (0.3) | 339.1 (0.1) | 357.3 (0.4) | ||
| 70 | 15 | 214.5 (0.2) | 313.8 (0.1) | 355.4 (0.3) | 338.5 (0.1) | 359.5 (0.2) | |
| 30 | 207.4 (0.4) | 301.5 (0.2) | 354.2 (0.1) | 344.1 (0.2) | 357.4 (0.3) | ||
| 60 | 200.3 (0.3) | 289.3 (0.1) | 353.0 (0.5) | 349.8 (0.3) | 355.4 (0.4) | ||
| HIPS | - | 0 | 288.9 (0.1) | 380.4 (0.2) | 422.9 (0.1) | 408.6 (0.3) | 425.7 (0.1) |
| 23 | 15 | 244.1 (0.3) | 349.4 (0.1) | 422.3 (0.2) | 401.8 (0.3) | 424.7 (0.1) | |
| 30 | 239.8 (0.4) | 349.4 (0.5) | 422.1 (0.6) | 402.4 (0.2) | 425.3 (0.4) | ||
| 60 | 235.5 (0.2) | 349.4 (0.1) | 421.9 (0.3) | 403.0 (0.4) | 426.0 (0.2) | ||
| 70 | 15 | 241.5 (0.2) | 333.3 (0.1) | 421.8 (0.5) | 400.0 (0.3) | 425.2 (0.2) | |
| 30 | 224.5 (0.1) | 313.5 (0.3) | 421.8 (0.2) | 403.2 (0.4) | 425.4 (0.2) | ||
| 60 | 207.5 (0.4) | 293.8 (0.2) | 421.9 (0.4) | 406.5 (0.3) | 425.6 (0.1) | ||
| ASA | - | 0 | 270.6 (0.2) | 322.5 (0.3) | 407.1 (0.1) | 391.2 (0.4) | 406.6 (0.1) |
| 23 | 15 | 221.6 (0.1) | 296.9 (0.5) | 406.9 (0.2) | 382.4 (0.4) | 405.0 (0) | |
| 30 | 221.6 (0.3) | 291.9 (0.3) | 405.9 (0.2) | 386.2 (0.1) | 405.0 (0) | ||
| 60 | 221.6 (0.4) | 287.0 (0.4) | 405.0 (0.2) | 390.1 (0.3) | 405.0 (0) | ||
| 70 | 15 | 204.7 (0.2) | 277.7 (0.3) | 403.3 (0.1) | 380.2 (0.5) | 404.8 (0.2) | |
| 30 | 213.1 (0.1) | 282.3 (0.6) | 404.1 (0.2) | 385.1 (0.3) | 404.9 (0.1) | ||
| 60 | 221.6 (0.4) | 287.0 (0.4) | 405.0 (0.1) | 390.1 (0.1) | 405.0 (0) | ||
| ABS | - | 0 | 219.8 (0.1) | 344.6 (0.1) | 415.2 (0.3) | 387.0 (0) | 412.3 (0.1) |
| 23 | 15 | 187.0 (0.3) | 267.9 (0.1) | 414.7 (0.2) | 391.1 (0.2) | 411.4 (0.1) | |
| 30 | 196.1 (0.2) | 282.9 (0.3) | 415.2 (0.1) | 390.8 (0.1) | 412.8 (0.2) | ||
| 60 | 205.3 (0.4) | 298.0 (0.4) | 415.8 (0.1) | 390.6 (0.2) | 414.3 (0) | ||
| 70 | 15 | 212.9 (0.1) | 328.4 (0.5) | 416.3 (0.1) | 390.0 (0.1) | 414.8 (0.1) | |
| 30 | 211.0 (0.4) | 328.7 (0.3) | 415.0 (0.6) | 390.1 (0.2) | 412.2 (0.3) | ||
| 60 | 209.1 (0.3) | 329.0 (0.2) | 413.8 (0.4) | 390.3 (0.1) | 409.7 (0.1) | ||
Disclaimer/Publisher’s Note: The statements, opinions and data contained in all publications are solely those of the individual author(s) and contributor(s) and not of MDPI and/or the editor(s). MDPI and/or the editor(s) disclaim responsibility for any injury to people or property resulting from any ideas, methods, instructions or products referred to in the content. |
© 2024 by the authors. Licensee MDPI, Basel, Switzerland. This article is an open access article distributed under the terms and conditions of the Creative Commons Attribution (CC BY) license (https://creativecommons.org/licenses/by/4.0/).
Share and Cite
Głowacki, M.; Skórczewska, K.; Lewandowski, K.; Mazurkiewicz, A.; Szewczykowski, P. Evaluation of the Effect of Mineral Oil Exposure on Changes in the Structure and Mechanical Properties of Polymer Parts Produced by Additive Manufacturing Techniques. Materials 2024, 17, 3680. https://doi.org/10.3390/ma17153680
Głowacki M, Skórczewska K, Lewandowski K, Mazurkiewicz A, Szewczykowski P. Evaluation of the Effect of Mineral Oil Exposure on Changes in the Structure and Mechanical Properties of Polymer Parts Produced by Additive Manufacturing Techniques. Materials. 2024; 17(15):3680. https://doi.org/10.3390/ma17153680
Chicago/Turabian StyleGłowacki, Marcin, Katarzyna Skórczewska, Krzysztof Lewandowski, Adam Mazurkiewicz, and Piotr Szewczykowski. 2024. "Evaluation of the Effect of Mineral Oil Exposure on Changes in the Structure and Mechanical Properties of Polymer Parts Produced by Additive Manufacturing Techniques" Materials 17, no. 15: 3680. https://doi.org/10.3390/ma17153680