Abstract
The construction industry’s high energy consumption and carbon emissions negatively impact the ecological environment; large-scale construction projects consume much energy and emit a significant amount of CO2 into the atmosphere. Statistics show that 30% of energy loss and 40% of solid waste in the construction industry are generated during construction. Therefore, reducing emissions during construction has significant research potential and value. Many scholars have recently studied eco-friendly building materials to facilitate the use of high-carbon emission materials like cement. Adding fibers to composite materials has become a research hotspot among these studies. Although adding fibers to composite materials has many advantages, it mainly reduces the compressive strength of the composite material. This research used the response surface methodology (RSM) to optimize the raw material ratios and thus improve the performance of plant fiber composite materials. Single-factor experiments were conducted to analyze the effects of grass size, grass content, and quicklime content on the composite materials’ compressive strength, flexural strength, and water absorption. The influencing factors and levels for the response surface experiment were determined based on the results of the single-factor analysis. Using the response surface methodology (RSM), a second-order polynomial regression model was established to analyze the interaction effects of the three factors on the composite materials’ compressive strength, flexural strength, and water absorption rate. The optimal ratio was determined: the optimized options for grass size, grass content, and quicklime content are 2.0 mm, 8.2 g, and 38 g, respectively. The actual values of compressive strength, flexural strength, and water absorption rate of the composite materials made according to the predicted ratio are 11.425 MPa, 2.145 MPa, and 21.89%, respectively, with a relative error of 8% between the actual and predicted values. X-ray diffraction and scanning electron microscopy were also used to reveal the factors contributing to the relatively high strength of the optimized samples.
1. Introduction
The emission of greenhouse gases is one of the most severe environmental problems globally, as it is the primary cause of global warming. Carbon dioxide accounts for 82% of total greenhouse gas emissions [1], with the cement industry producing 7% of the world’s anthropogenic carbon dioxide despite emitting almost no other greenhouse gases [2]. The production of Portland cement significantly contributes to global warming. Consequently, finding alternatives to cement has become a significant concern in the construction industry. Since the 1960s, extensive research has focused on developing cement-free slag or geopolymer-based alkali-activated composites. These studies have examined these materials’ mechanical and chemical properties to enhance performance and reduce cement use in the construction industry [3,4,5,6,7,8].
Alkali-activated slag can be better applied to building materials. Alkali-activated slag materials exhibit mechanical properties similar to cement-based materials [3,5]. The primary advantage of alkali-activated slag is its environmental friendliness, as alkali-activated slag composites produce less carbon dioxide compared to cement-based composites. Additionally, recent studies have reported that alkali-activated slag-based cementless fiber-reinforced composites can achieve high tensile strain capacity and tensile strength [9,10,11], laying the foundation for replacing cement-based composites with slag-based composites. However, alkali-activated composites exhibit brittleness and are prone to cracking [12,13]. Nonetheless, incorporating appropriate fibers can improve the flexibility of alkali-activated cementless composites.
Previous studies have added synthetic fibers such as tire shreds, PVA fibers, basalt fibers, glass fibers, and polypropylene fibers to composites. Extensive research has been conducted on tire shred-reinforced composites [14,15]. Tyre shred-reinforced composites have been proven to improve the matrix material’s flexibility, toughness, thermal conductivity, and acoustic properties, but their compressive and flexural strengths are compromised [16]. Lee et al. explored the feasibility of developing strain-hardening fiber-reinforced cementless composites using mortar based on alkali-activated ground granulated blast furnace slag (GGBS) and PVA fibers [10]. The results showed a tensile strain-hardening behavior, and up to 4.5% flexibility could be achieved [12]. Similar results were obtained in studies using basalt fibers, where fiber-reinforced composites exhibited better fracture performance than conventional Portland cement, and the addition of fibers also reduced the presence of cracks. Incorporating these synthetic fibers into composites can improve their mechanical, physical, and processing properties. However, traditional synthetic fibers have poor biodegradability and cause severe environmental pollution, leading to widespread interest in research on new composite reinforcements based on biodegradable resources [17]. In addition to being lightweight, cost-effective, abundant, and biodegradable, natural plant fibers possess high specific strength and modulus, making their composites a research focus for scholars in recent years [18].
In existing studies, researchers have used many materials such as wood [19,20], sisal [21,22,23,24], hemp [25,26], coconut [22,27,28,29], bamboo [30], wheat straw [31], and rice straw [32] in composites. Zhao et al. [19] studied rubberwood particle-reinforced composites. They found that adding rubberwood particles improved the composites’ flexural toughness and impact resistance, reduced weight, and enhanced thermal insulation and energy savings. Silva et al. [24] studied the physical and mechanical properties of durable sisal fibers added to composites through direct tensile and bending tests to determine their mechanical properties under static loads. They assessed the physical properties of the composites through drying shrinkage rate, capillary water absorption, and water tightness. The studies showed that sisal composites performed better in tension and had twice the toughness of ordinary composites; physical performance tests showed that sisal composites had reasonable drying shrinkage rates and water tightness. Hemp fibers have excellent mechanical properties, and their composites possess good mechanical performance on a green and environmentally friendly basis, with some properties almost comparable to those of synthetic fiber composites [17]. Millogo et al. [33] studied the addition of hemp fibers to composites. They found that adding 0.2–0.6 wt.% of 30 mm fibers could reduce the pore size in PAB (Pressed Adobe Blocks) and improve its mechanical properties. However, adding 0.8 wt.% of 60 mm fibers negatively impacted compressive strength.
Sedan et al. [26] found that hemp fiber-reinforced composites significantly improved flexural strength in their mechanical properties. Lee et al. [34] studied the compressive and flexural properties of hemp fiber-reinforced composites and found that the flexural toughness of hemp fiber-reinforced composites increased by 144%. Coconut fibers showed better flexural strength than synthetic fibers [35]. Wang et al. [29] reported that the flexural toughness of coconut shell fiber composites increased more than tenfold. In another study, Chin et al. [36] found that bamboo fibers have a negative effect on compressive strength and split tensile strength, but the negative effect of bamboo fibers decreases with the increasing age of concrete. Petrell et al. [31] investigated the production of sustainable cement mortars from wheat straw fibers and found that the mechanical properties decreased dramatically with increasing straw content compared to standard mortars by more than 30–40% of the corresponding values. Although these samples showed a significant decrease in the overall mechanical resistance, no actual collapse of the samples was observed after the plastic behavior described above, which was mainly found at higher straw contents. Pachla et al. [32] studied the sustainable application of rice straw in porous composites. They found that adding rice straw to porous composites reduced compressive strength by 15% while increasing three-point bending strength. Feng et al. [37] studied the effect of alkali-activated rice straw on composites. They found that alkali-activated straw fibers had a more significant impact on the composites than untreated rice straw. The amount of rice straw fiber added also had specific requirements, and an appropriate amount of straw fiber admixture could significantly improve the performance of modified cement samples. Still, excessive straw fibers would have adverse effects. Bentchikou et al. [38] studied the effect of recycled cellulose fibers on the performance of composite matrices and found that as fiber content increased, compressive strength decreased. This reduction was primarily due to the increase in voids caused by higher fiber content, which reduced the material’s weight and weakened it. However, the flexural strength did not exhibit a monotonic behavior with fiber content; it increased between 0% and 4% fiber content, possibly due to the bridging effect of the fibers within the matrix, but then gradually decreased. This latter behavior could be attributed to the combination of two potential phenomena: the effect of fibers on the uneven dispersion within the matrix and the weakening response due to the reduced volume proportion of the cement matrix. Soroushian et al. [39] reported that increasing the content of softwood fibers from 5% to 15% (fiber/cement matrix weight ratio) improved the system’s toughness. However, the flexural strength showed a slight increase (an average of 5%) when the fiber content increased from 5% to 10% and then decreased (an average reduction of 15%) as the fiber content increased to 15%. Sliva et al. [24] in their study on the performance of sisal fiber-cement composites found that when the length of sisal fibers increased from 10 mm to 40 mm, the strain failure rate decreased from approximately 5.2% to 2.6%. Simultaneously, the Weibull modulus decreased from 4.6 mm to 3.0 as the gauge length increased from 10 mm to 40 mm. Among the well-studied materials such as wood, sisal, hemp, coconut, bamboo, rice, and wheat straws, their common feature is their high cellulose fiber content. Cellulose fibers play an essential role in the performance of plant fiber-reinforced composites, offering excellent strength and durability. Additionally, cellulose fibers can increase the thermal insulation properties of composites, reducing heat conduction and improving insulation. They also have good moisture absorption and sound insulation properties.
This study found that alfalfa, one type of grass, also has a high cellulose fiber content. Grass is also an essential sustainable renewable biomass resource. China’s natural grassland area is nearly 6 billion m2, accounting for 41.7% of the country’s land area. Inner Mongolia’s grassland is the largest and most diverse ecological functional area in northern China, with an area of 88.44 million hectares, accounting for 22% of the national grassland area. Inner Mongolia’s planting area of silage corn, alfalfa, forage oats, and sheep grass is nearly 1.2 million hectares, yielding over 20 million tons. The natural grassland forage yield exceeds 30 million tons. However, most grass withers and degrades naturally on the grassland, with only a small amount used as animal feed. Therefore, accelerating the comprehensive utilization of grass resources in China has become an urgent task for Chinese researchers [40]. Grass grows year-round, but grass straw is rarely used as a building material. Applying grass to building materials will provide new avenues and directions for developing grass resources.
This study aims to determine the feasibility of using grass fibers to reinforce cementless slag-based composites through experiments. It also analyzes the effects of grass fibers and quicklime on the properties of the composites. It optimizes the mixture proportions to enhance the mechanical properties of alkali-activated slag-based composites.
2. Experiments and Methods
2.1. Materials and Sample Preparation
2.1.1. Materials
The slag-based grass fiber blocks comprise grass straw (alfalfa straw), alkali-activated granulated blast furnace slag powder, quicklime, fine aggregates, water, and additives.
- Grass
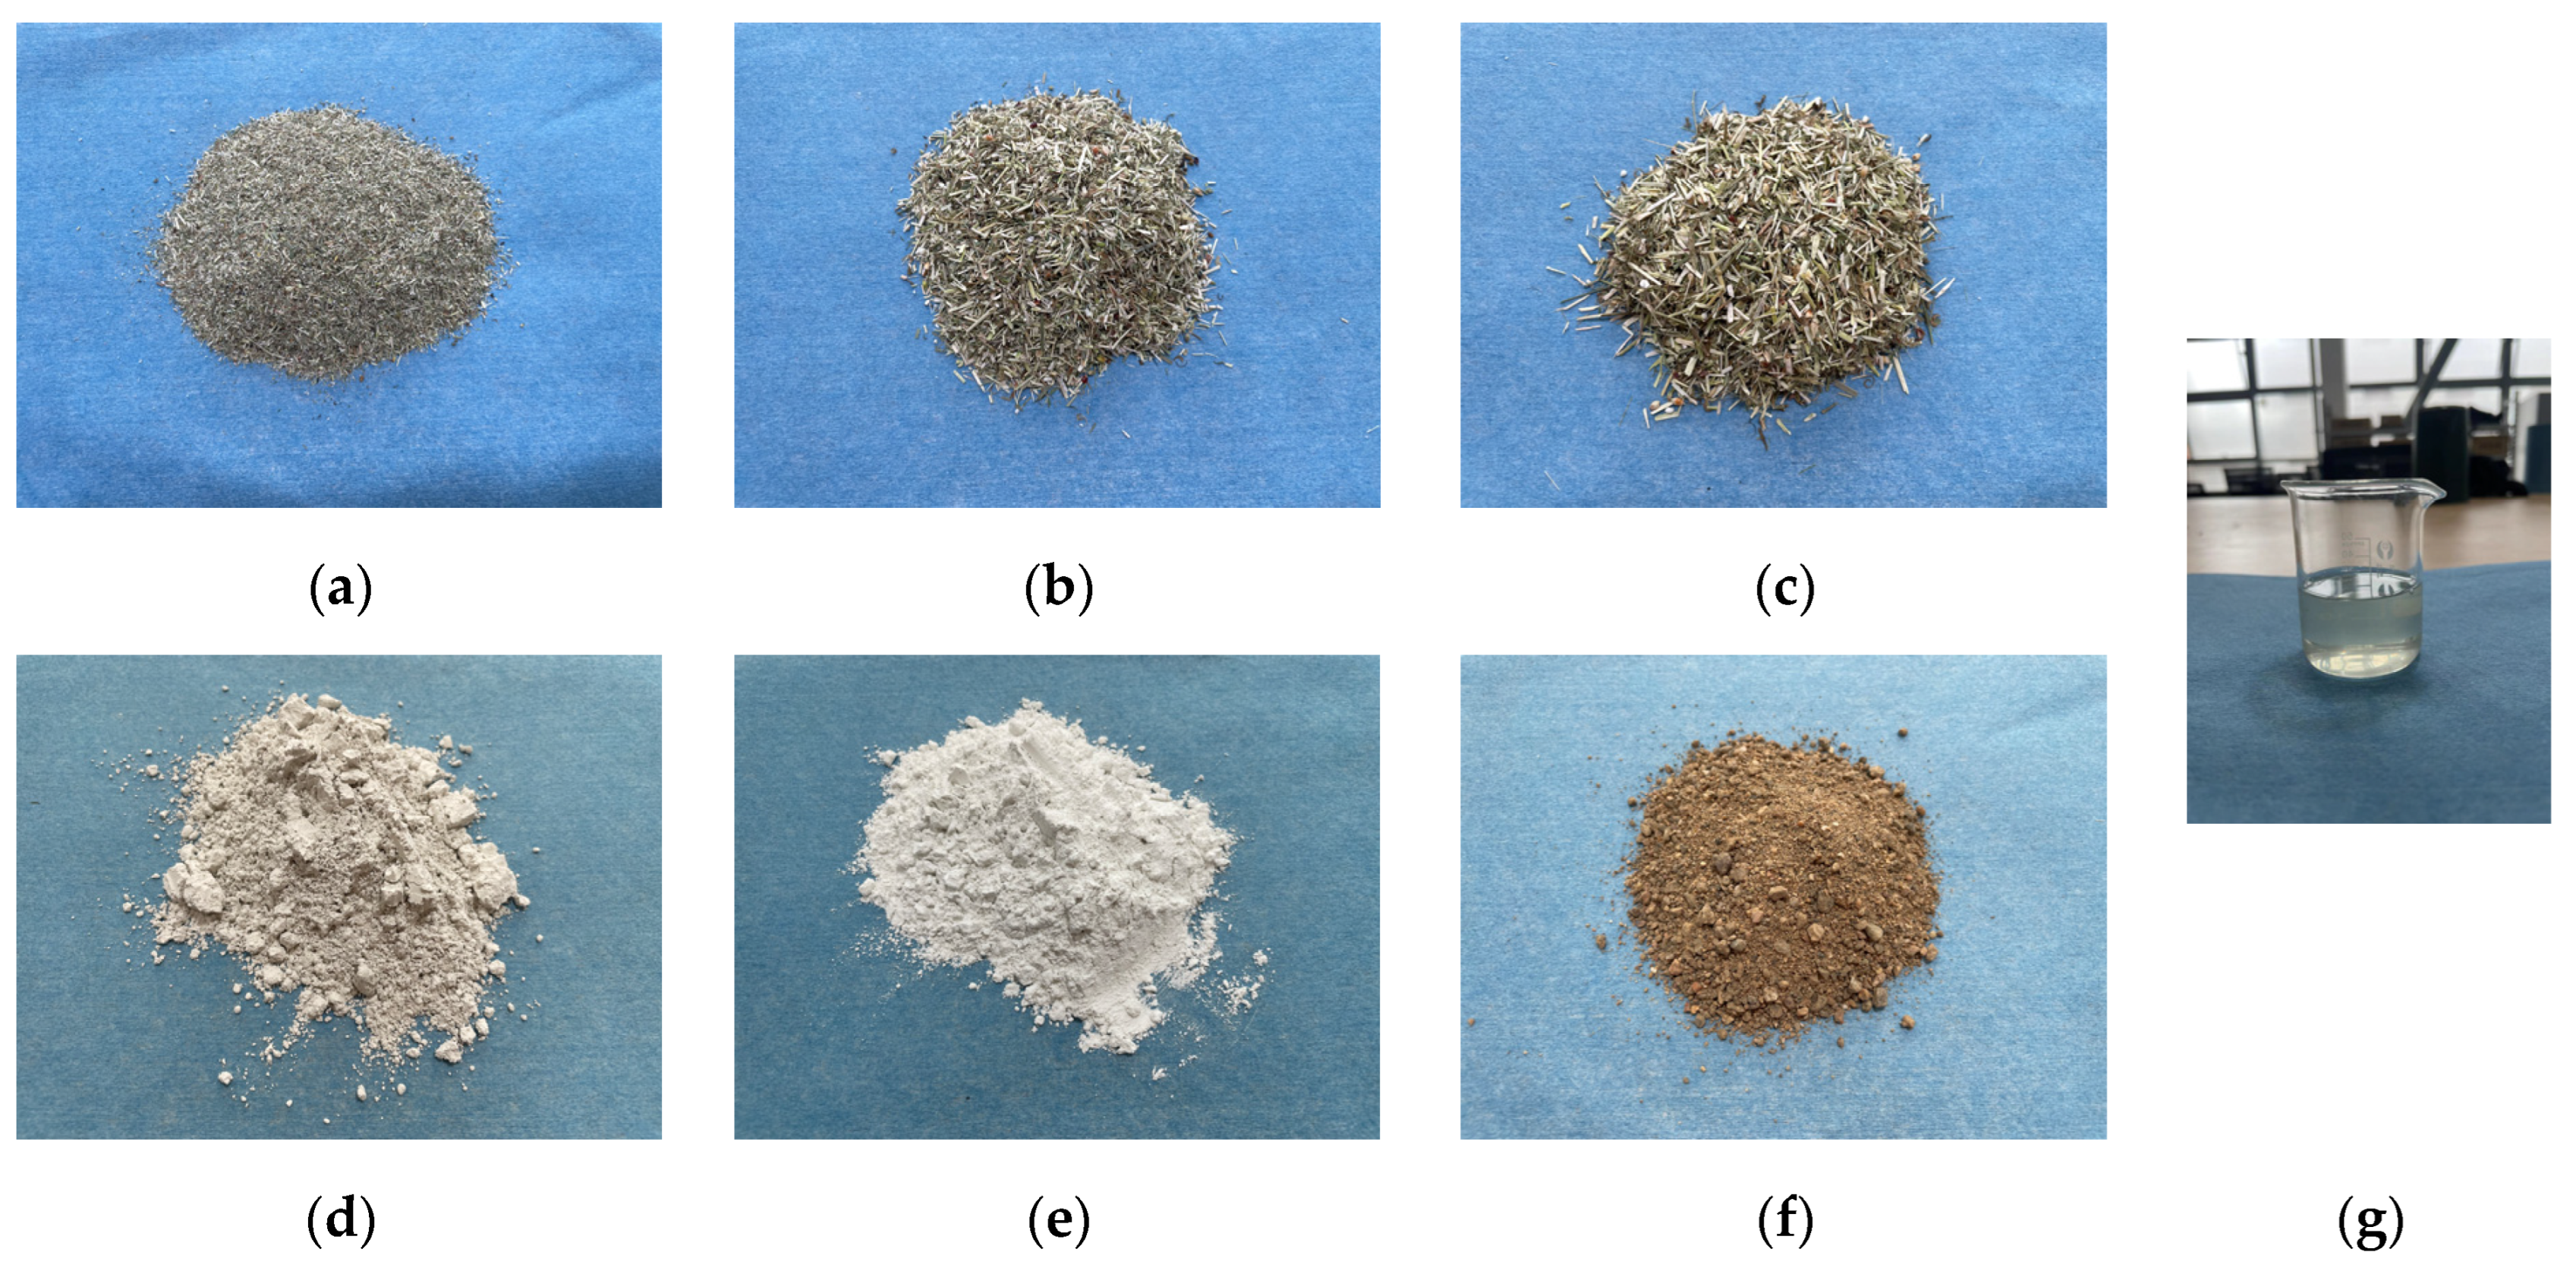
The grass selected is alfalfa, as shown in Figure 1, and it was collected from a pasture in Inner Mongolia. The grass is typically harvested when it is lush but not overly mature. The harvested grass is spread out and dried to dehydrate, requiring 3 days of sun drying. The grass must be turned regularly to ensure even drying and prevent mold. The dried grass is then crushed using a grinder into particles with lengths of 1–3 mm and classified using a standard sieve. As shown in Figure 1a–c In this experiment, the content and size of grass were two of the main factors studied; where the content of grass was taken as values of 5 g, 10 g, and 15 g; and the size of grass was taken as values of 1 mm, 2 mm and 3 mm.
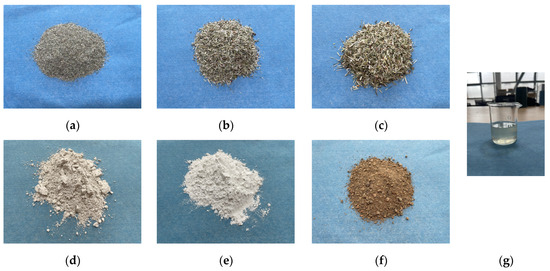
Figure 1.
(a) 1 mm grass (b) 2 mm grass (c) 3 mm grass (d) Slag (e) Quicklime (f) Sand (g) Additives.
- Slag
Granulated blast furnace slag powder made by Gongyi Longze Water Purification Materials Co., Ltd., Gongyi, China, is the slag that is utilized. It is rated S105 for strength. As shown in Figure 1d. Table 1 and Table 2 show the chemical composition and pertinent characteristics that meet the testing standards as specified in the Chinese national standard for ground granulated blast furnace slag used for cement and concrete (GB/T 18046-2017) [41]. In this test, the amount of slag was fixed at 300 g.

Table 1.
Chemical composition of S105 slag.
Table 2.
Properties of S105 slag.
- Quicklime
The quicklime used in this experiment meets the requirements as specified in the Chinese national standard JCT 621-1996 [42] for lime used in silicate building products. The quicklime appearance is shown in Figure 1e. In this experiment, the amount of quicklime was also one of the variables studied, the amount of quicklime used was 27.5 g, 37.5 g, and 47.5 g.
- Fine aggregate
The fine aggregate used in the experiment is natural river sand, as shown in Figure 1f. with a bulk density typically at 1.48 × 10³ kg/m3 and a fineness modulus generally ranging between 2.5 and 3.5. The diameter of the fine sand particles ranged from 0.075 mm to 0.425 mm. It complies as defined by the Chinese national standard for construction sand (GB/T 14684-2011) [43] and according to the ASTM standard specification for concrete aggregates (ASTM C33/C33M-18) [44]. In the experiment, the amount of fine aggregate-fine river sand was 100 g.
- Additives
The additive used in this experiment is a concrete early strength agent. As shown in Figure 1g. Its main components include silicate, gypsum, and calcium oxide. These components can enhance the reactivity of the composite material and promote the hydration reaction. In the experiment, the amount of modified material additive was 18 g.
- Water
The water used in the experiment is regular tap water from the teaching building, with a pH of 6.5. In the experiment, the amount of water used was 225 g.
2.1.2. Sample Preparation
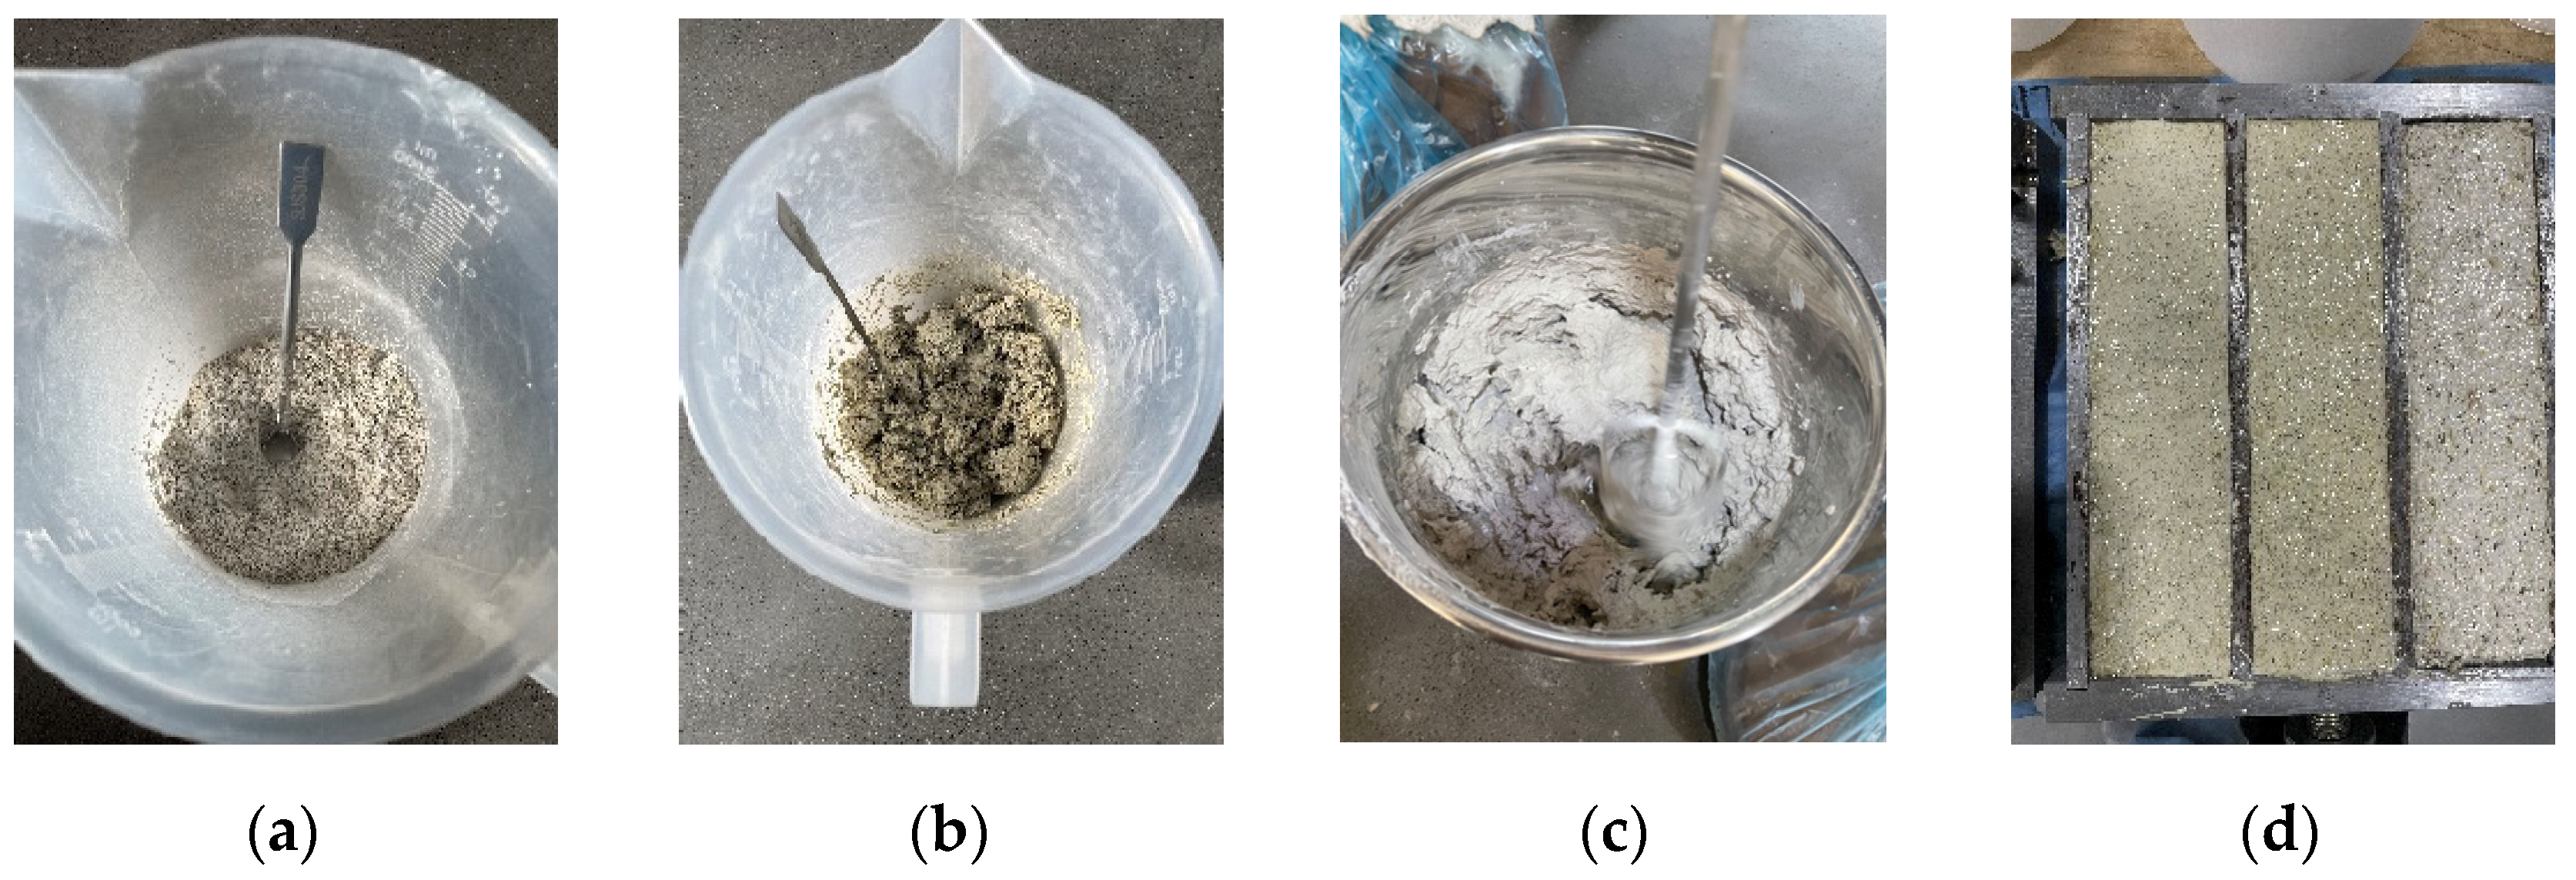
The preparation process for the grass fiber slag-based composite material is as follows: weigh the required amounts of alfalfa straw, slag, quicklime, sand, additive, and water for the specimen. (1) Weigh the grass fibers, slag, quicklime, and sand, and mix them evenly as shown in Figure 2a. (2) Add water in two stages: First, pour water into the mixture and continuously stir manually until all materials are thoroughly wetted, as shown in Figure 2b. Then, add the remaining water and start mixing with a mixer, as shown in Figure 2c, with a mixing time of 3 min. (3) After the mixture is uniform, add the additives and mix with the mixer for an additional minute. (4) Clean the sample molds. After cleaning and drying, apply a thin layer of mineral oil to the inner walls of the molds. Pour the mixture into the molds, which have dimensions of 40 × 40 × 160 mm. Level and compact the mixture with vibration as shown in Figure 2d. Prepare three samples for each group of tests. To prevent moisture evaporation, cover the samples with plastic film. (5) Allow the samples to set in the molds for two days. Then, de-mold the samples and place them in foam boxes in the laboratory for curing (at 20 °C ± 2 °C, 50% ± 5% RH) for 56 days. During the curing process, spray the blocks with water using a spray bottle every two days.
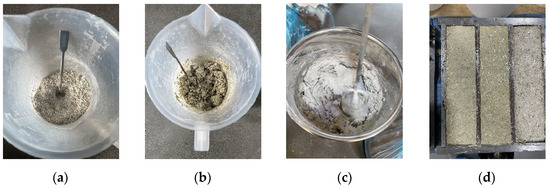
Figure 2.
The process of making grass bricks. (a) Mix grass, slag, quicklime and sand dry ingredients well; (b) First time you add water; (c) Second addition of water; (d) Pour the mixture into the molds, level and compact it.
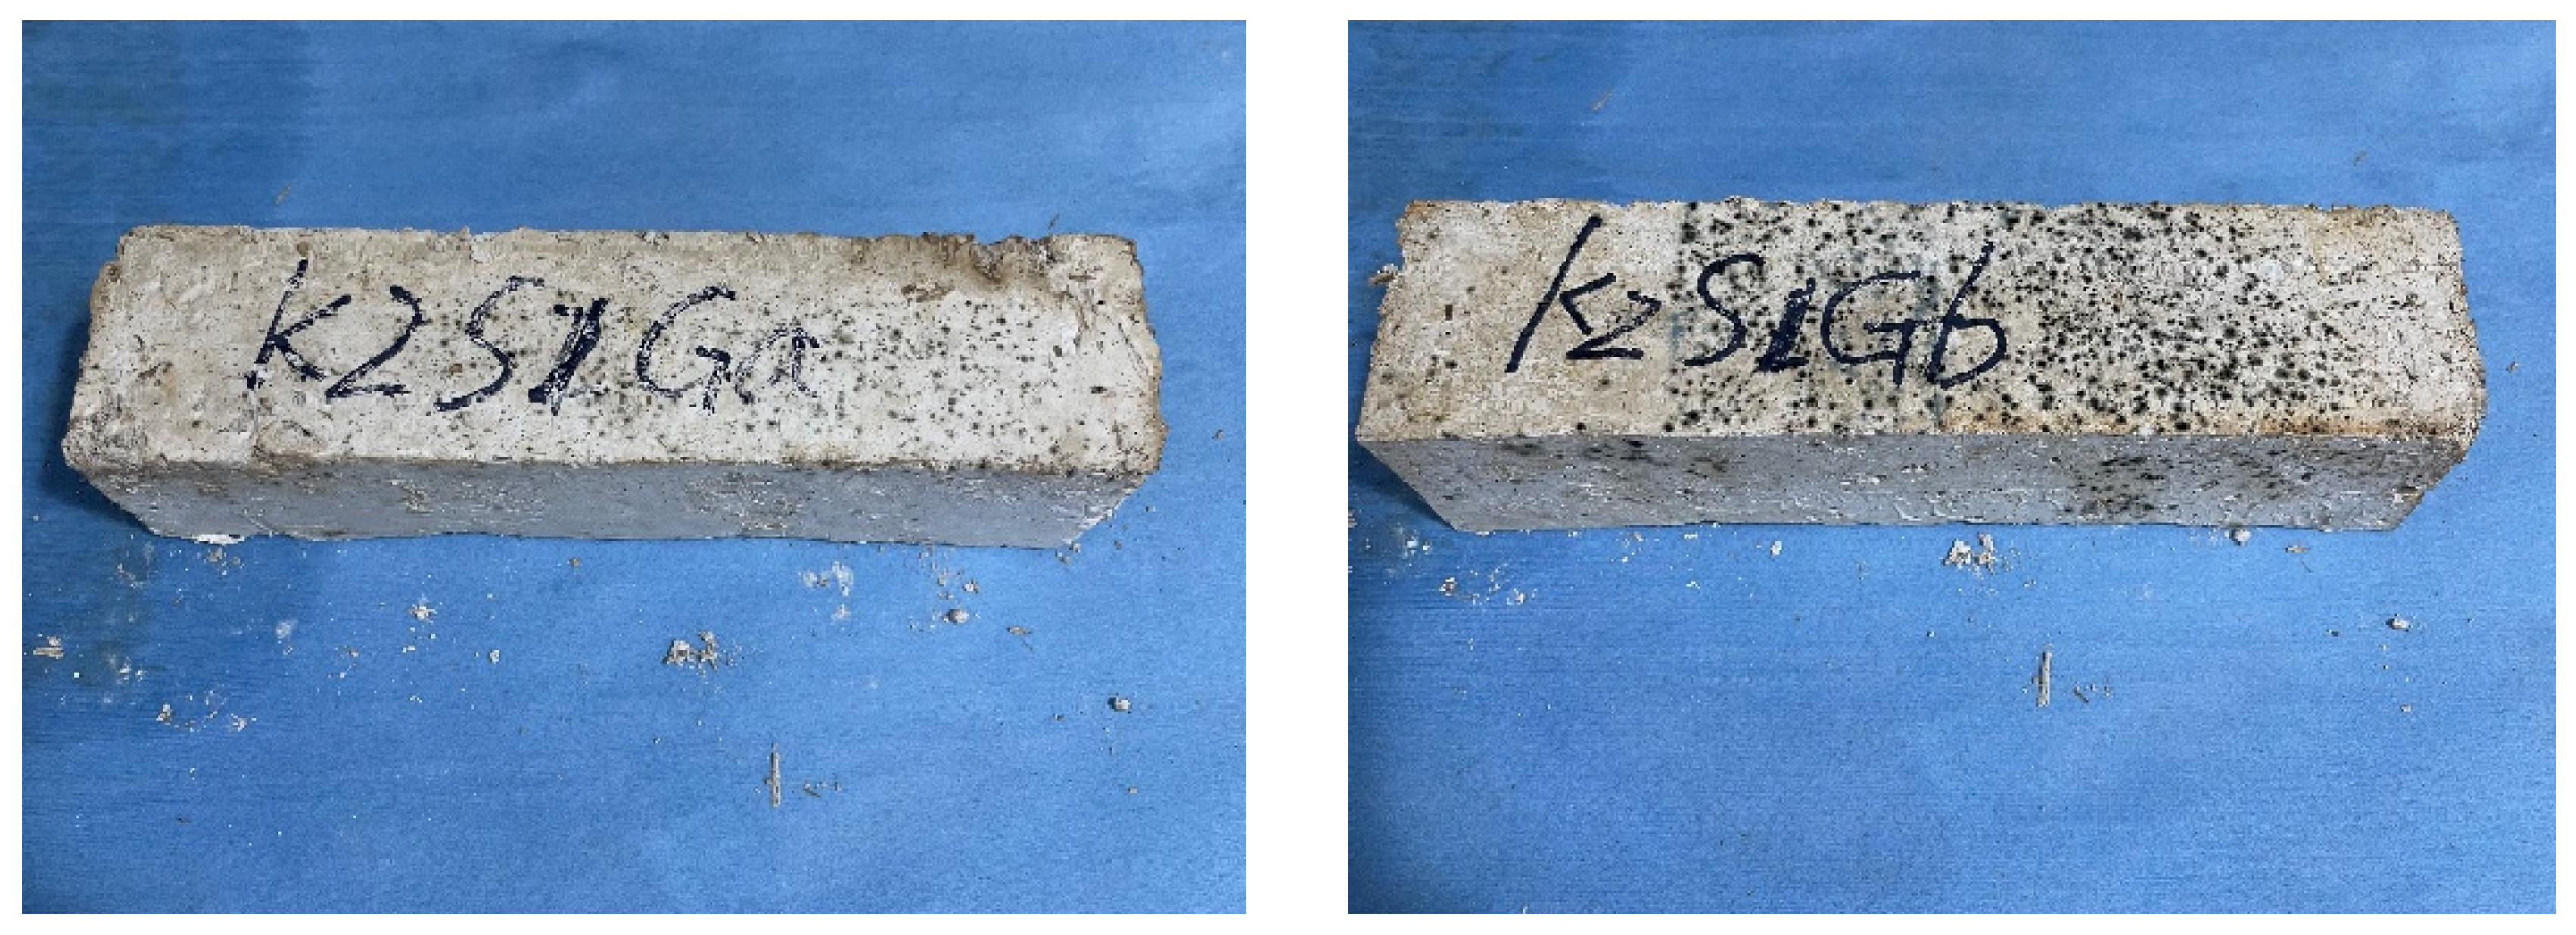
In the initial round of experiments, the test groups consisted of slag, grass, sand, additives, and water. During the curing process, it was observed that the grass bricks exhibited varying degrees of mold growth, as shown in Figure 3. After reviewing the literature and analyzing the causes, it was found that grass contains cellulose, hemicellulose, lignin, pectin (Pectin is broken down into sugars and used as a nutrient by bacteria), wax layers, ash, proteins, and other components [45,46,47,48]. These organic substances serve as excellent nutrients for microorganisms, promoting their growth and reproduction. The warm and humid environments further facilitate the microbial decomposition of fats, waxes, and other easily degradable organic materials present on the untreated fiber surfaces. Moreover, Pectin and waxes in the cell walls of plant fibers also inhibit the interlocking of fibers within the matrix, resulting in poor adhesion between the fibers and the matrix. Consequently, this leads to reduced strength performance and inefficient stress distribution [49,50,51]. For the treatment of plant fibers, existing research has proposed various techniques, including treatments with benzoyl chloride, alkali, acetic anhydride, potassium permanganate, acetic acid, silane, and peroxides [52,53,54]. These treatment techniques aim to improve the mechanical properties of plant fibers by altering their crystallinity and removing weaker components from the fiber surface, such as fats, lignin, and pectin [55]. Therefore, in this experiment, quicklime was added to the original mix. Quicklime is a binding material for the blocks and affects the grass explicitly. When quicklime reacts with water, it forms calcium hydroxide, a strong alkali. The grass fibers eroded by the strong alkali lose moisture due to the dissolution of a large amount of sugar-like substances, causing them to shrink. The smooth wax layer on the surface of the fibers is corroded and roughened [56], which improves the physical properties of the plant fibers and enhances the bonding of substances inside the blocks.

Figure 3.
Picture of moldy grass bricks in the front.
2.2. Performance Test Experiments
2.2.1. Microstructural Observations
- X-ray diffractometer
The dried grass powder was characterized using an X-ray diffractometer (model D8, Advance). Whenever the experimental material was sieved through a standard sieve with a mesh size of 70–80, 0.5 g of sample was added. The scanning range of the sample was set between 50° and 80°, with a scanning speed of 10°/min.
- Scanning Electron Microscope (SEM)
The samples’ porous structure and microstructure were visually analyzed using the HITACHI-S-3400N by Hitachi High-Technologies Corporation in Tokyo, Japan scanning electron microscope (SEM). Using image acquisition in low vacuum mode, the microscopic surface structure of the composite material particles was investigated. The experimental setup included an acceleration pressure range of 0.3–30 kV, a maximum sample diameter of 200 mm, and a low vacuum mode backscattered electron (BSE) resolution of 30 kV. Test samples with a diameter smaller than 10 mm were wrapped on five sides with tin foil, leaving only the top surface exposed for observation. Subsequently, they were fixed to glass slides using conductive adhesive. Before testing, the samples underwent gold sputtering using an ion-sputtering instrument. The samples that had been gold-plated were put on a holder and vacuum-treated. Appropriate magnification was selected to obtain SEM images of the respective materials.
2.2.2. Physical Property Tests
- Apparent density
This study employed the procedure outlined in BS EN 1015-10 [57] to measure the sample density. The mass of the sample prism was obtained by weighing it on a micro-digital balance. Subsequently, the samples were uniformly dried at approximately 60 °C ± 5 °C until a continuous weight was reached within 2 h. The density was then determined by dividing the mass by the prism’s volume.
- Apparent porosity
The apparent porosity is calculated using Equation (4) [58]:
represents the apparent porosity (%), WA is the water absorption (%), is the apparent density (kg/m3), and is the density of water (kg/m3).
- Water absorption
The water absorption (WA) coefficient, caused by the capillary action of the tested material, was measured at 20 °C [59]. The composite material samples were immersed in 5–10 mm of water for 24 h until fully saturated [60]. Two samples of each composite material were prepared for testing, and the average of the two results was taken.
WA represents the water absorption (%), W1 is the weight of the dried sample (g), and W2 is the weight of the saturated sample (g).
2.2.3. Mechanical Property Tests
- Flexural strength
The flexural strength was measured using the central loading method described in the standard as per the Chinese national standard for test methods of mechanical properties of ordinary concrete (GB/T 50129-2011) [61] for testing the basic mechanical properties of masonry. An automatic cement flexural and compressive testing machine (DYH-300B, manufactured by Shandong Luda Testing Equipment Manufacturing Co., Ltd., Tai’an, China) was used to test the mechanical properties of the specimens; As shown in Figure 4a. Each group consisted of three samples with dimensions of 40 mm × 40 mm × 160 mm. After forming the specimens, they were placed in the testing machine with the surface facing up. The loading speed was set to 50 N/s. The specimen is subjected to a bending load until a visible crack appears, as shown in Figure 4b. The test is repeated three times for each specimen. The average of the three measurements was taken as the flexural strength of the sample.
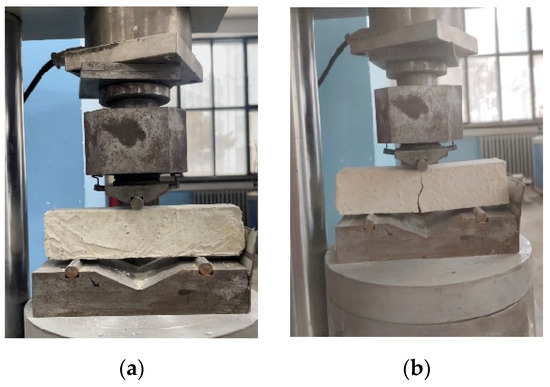
Figure 4.
Flexural strength test Compressive strength. (a) Place the test block on the instrument; (b) Test block destroyed.
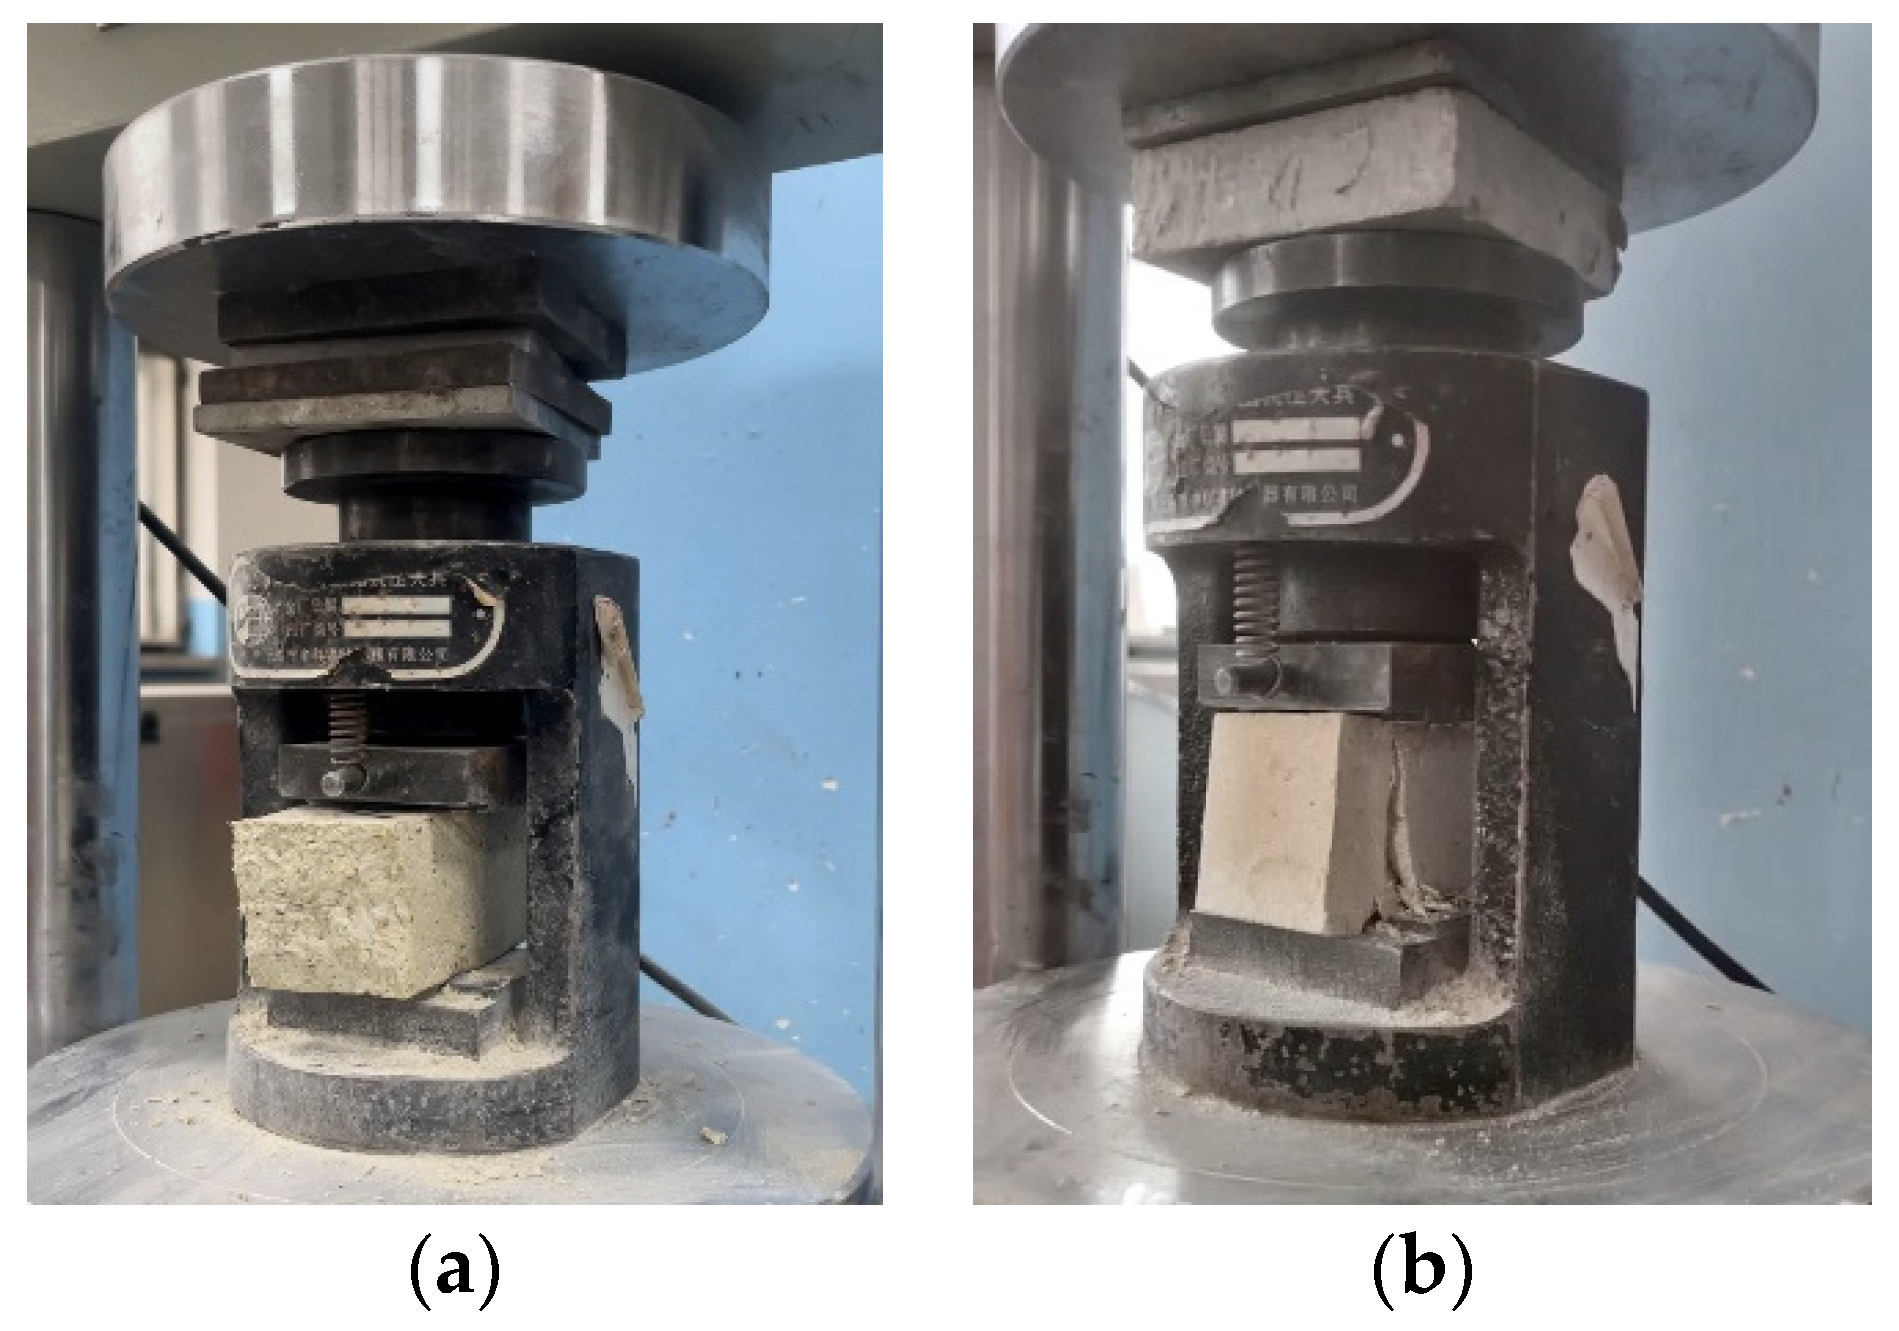
The compressive strength was determined using the central loading method described in the standard as per the Chinese national standard for test methods of mechanical properties of ordinary concrete (GB/T 50129-2011) [61] for testing the basic mechanical properties of masonry. An automatic cement flexural and compressive testing machine (DYH-300B, manufactured by Shandong Luda Testing Equipment Manufacturing Co., Ltd., Tai’an, China) was employed to test the mechanical properties of the specimens. The blocks obtained from the flexural tests (six per group) were used for the compressive strength tests. As shown in Figure 5a. Before placing the samples into the fixtures, the surface debris was removed. The sides of the specimens were used as the compression surfaces, and the loading speed was set to 1 kN/s. The specimen is subjected to a compressive load from the testing machine until failure occurs. As shown in Figure 5b. The average of the three test results was taken as the compressive strength.
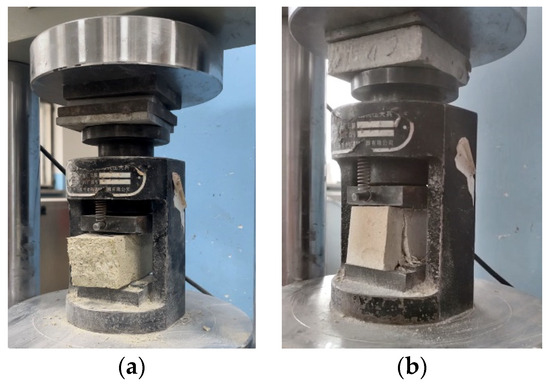
Figure 5.
Compressive strength test. (a) Place the test block on the instrument; (b) Test block destroyed.
2.3. Response Surface Method (RSM)
RSM is an optimization technique that measures a system’s reaction in relation to one or more variables. It employs graphical methods to illustrate functional correlations, enabling the selection of ideal circumstances for experimental design by intuitive observation [62,63]. RSM considers experimental random errors and fits complex, unknown functional relationships within a small region using a quadratic polynomial model to obtain continuous predictive models. These models allow for continuous evaluation at every stage of this study. Before using RSM, a single-factor experiment was conducted to study the effects of different proportions of three factors—grass content (5 g–15 g), grass size (1–3 mm), and quicklime content (27.5 g–47.5 g)—on the physical and mechanical properties of the composite material.
Using the Box-Behnken response surface optimization design, each factor in the Box-Behnken design method has three levels; each level is coded as (−1, 0, 1). The design matrix is centered at 0, with +1 and −1 representing the high and low values of the cube points, respectively. Through single-factor trials, appropriate ratios of grass content, grass size, and quicklime content were found for the experimental design. The statistical program Design Expert 10.0.3 was utilized in this investigation. Thirteen matching schemes and four repeat matching schemes were part of the experimental design, and the experimental variables were coded. The general form of the predictive polynomial equation is:
where Y represents the response variables (flexural strength (MPa), compressive strength (MPa), water absorption rate (%) in this case; Xi and Xj are the independent variables (i, j = 1, 2, 3, …, k); and β0, βi, βii, βij are the regression constant coefficients, linear coefficients, second-order coefficients, and interaction coefficients, respectively. The mathematical model was fitted using an analysis of variance (ANOVA); significance tests were run on linear, second-order, and third-order models to choose the best model. Using an ANOVA, the p-values for the model and each of its terms were determined in order to assess the statistical significance. Tests for significance and consistency were conducted to evaluate further the model’s validity, including residual vs. predicted value analysis, residual analysis, and predicted vs. observed value tests. An appropriate model that passes all necessary statistical tests can be used to predict responses or optimize processes [64]. Plotting response surface graphs and contour maps, which illustrate the correlations between factors and response values, was done using the generated data after it had been fitted to the model. The best process parameters for the material were found by modifying the additive optimization settings, and they were then experimentally confirmed.
3. Results and Discussion
3.1. Single-Factor Experimental
3.1.1. Effect of Grass Size, Grass Content, and Quicklime Content on Compressive Strength
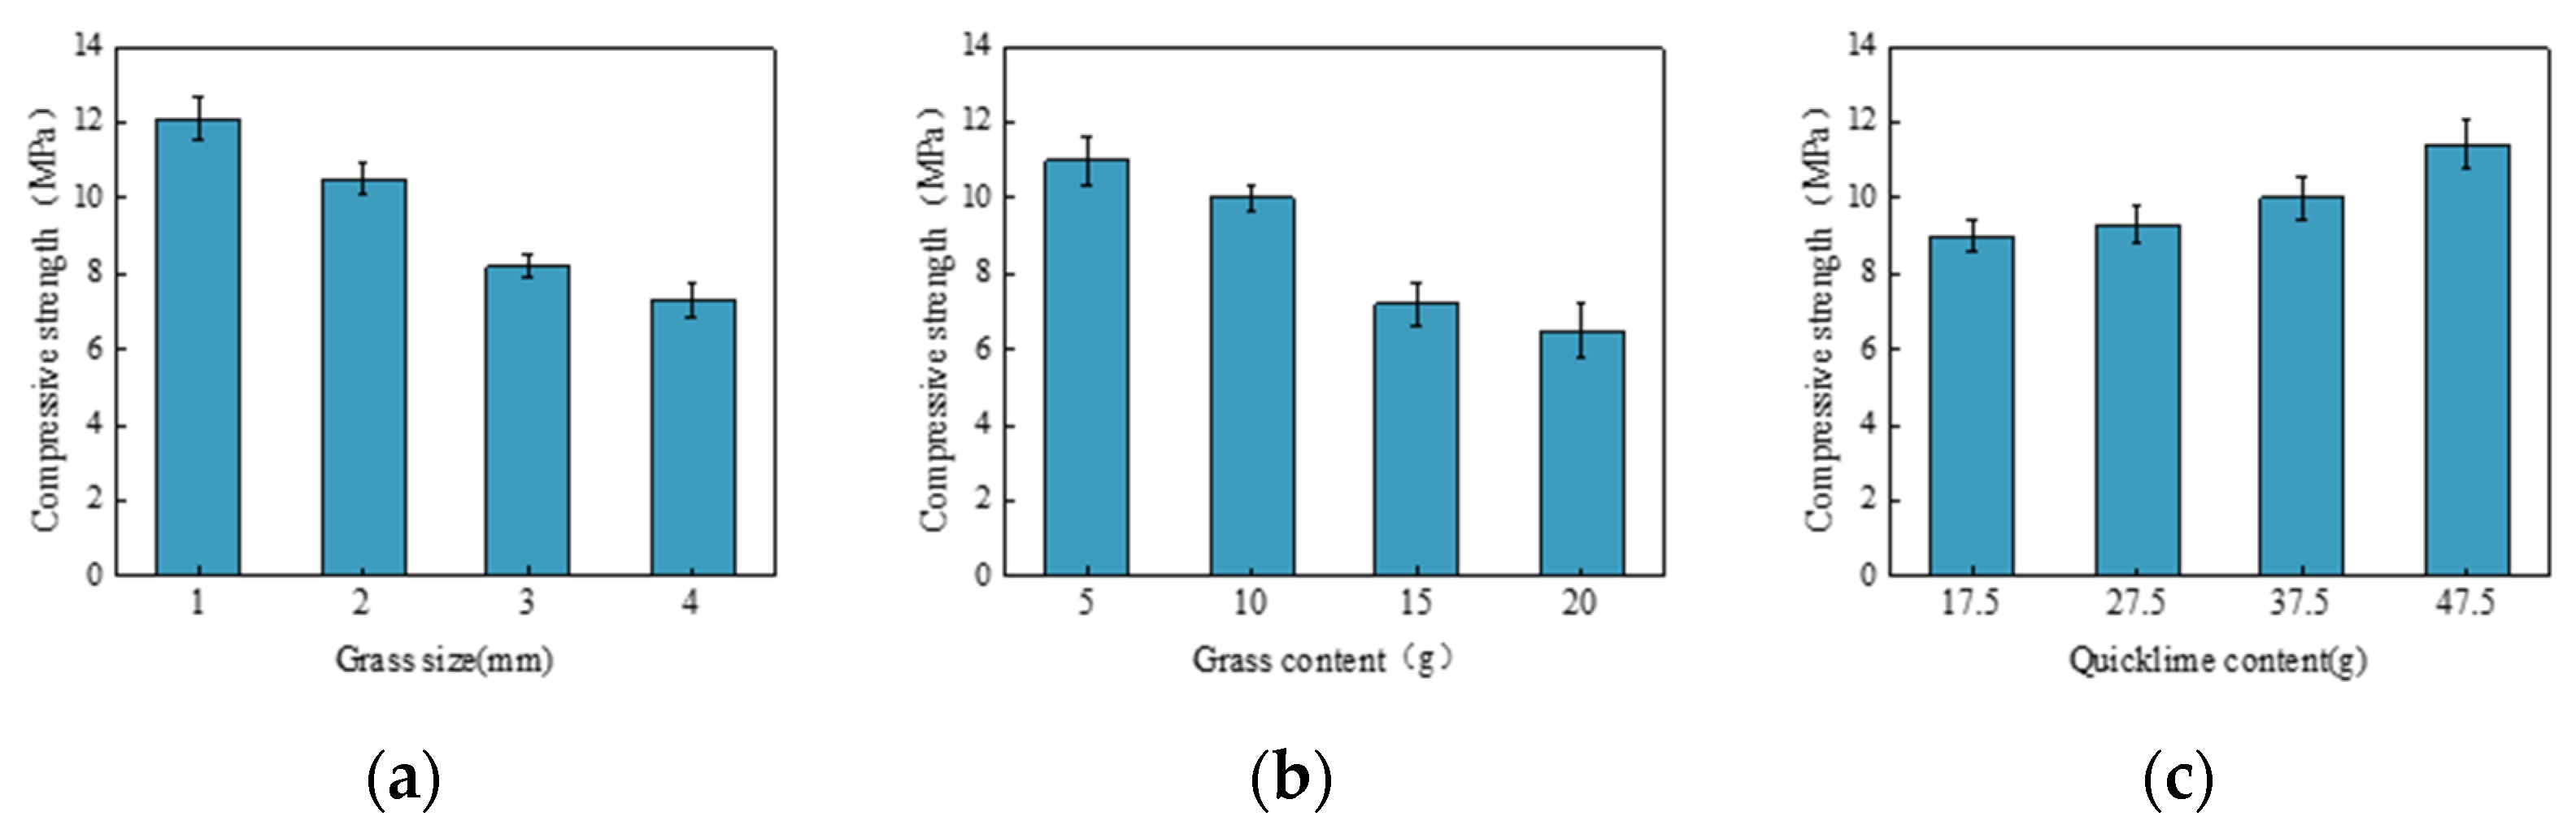
Figure 6 shows the compressive strength test results from the single-factor experiment. The changes in grass size, as in Figure 6a and grass content, as in Figure 6b, exhibit similar patterns. The compressive strength of the samples shows a clear trend: it gradually decreases with the increase in grass size or grass content. Adding grass increases the composite material’s porosity, and excessive porosity decreases compressive strength. Additionally, as the amount of grass increases, the slag matrix cannot effectively bond with the grass fibers, weakening its mechanical properties.
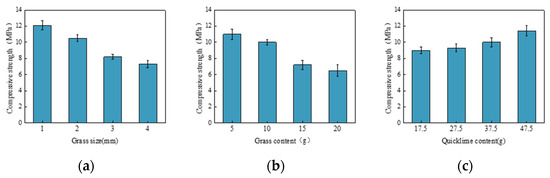
Figure 6.
(a) Effect of grass size on compressive strength; (b) Effect of grass content on compressive strength; (c) Effect of quicklime content on compressive strength.
On the other hand, adding quicklime leads to a gradual increase in compressive strength, as in Figure 6c. This is because quicklime reacts with the water in the composite material, creating a cementing effect and forming a solid structure. The calcium hydroxide further reacts with carbonate ions in the water to form calcium carbonate crystals, enhancing the block’s strength and hardness. This process addresses the issue of low early compressive strength and further improves the strength of the composite material.
3.1.2. Effect of Grass Size, Grass Content, and Quicklime Content on Flexural Strength
Figure 7 illustrates the flexural strength test results from the single-factor experiment. The variations in grass size, as in Figure 7a and quicklime content, as in Figure 7c, follow similar trends. The flexural strength of the samples first increases and then decreases with the increase in grass size or quicklime content. The samples achieve maximum flexural strength when the grass size is 2 mm. Beyond this threshold, the flexural strength decreases, likely because appropriately sized grass fibers enhance the material’s toughness, thus increasing flexural strength. However, excessively long fibers result in an uneven internal structure, increasing cracks and defects, which reduce strength.
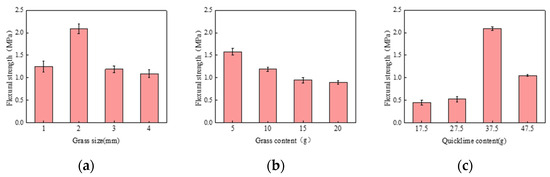
Figure 7.
(a) Effect of grass size on flexural strength; (b) Effect of grass content on flexural strength; (c) Effect of quicklime content on flexural strength.
Similarly, the flexural strength reaches its optimum when the quicklime content is 37.5 g. If the quicklime content is too low, it cannot adequately react with the base material. Conversely, an excessively high quicklime content makes the composite material overly dense, causing internal stress concentration and reducing flexural strength. Furthermore, as the grass content, as in Figure 7b, increases, the flexural strength gradually decreases.
3.1.3. Effect of Grass Size, Grass Content, and Quicklime Content on Water Absorption Strength
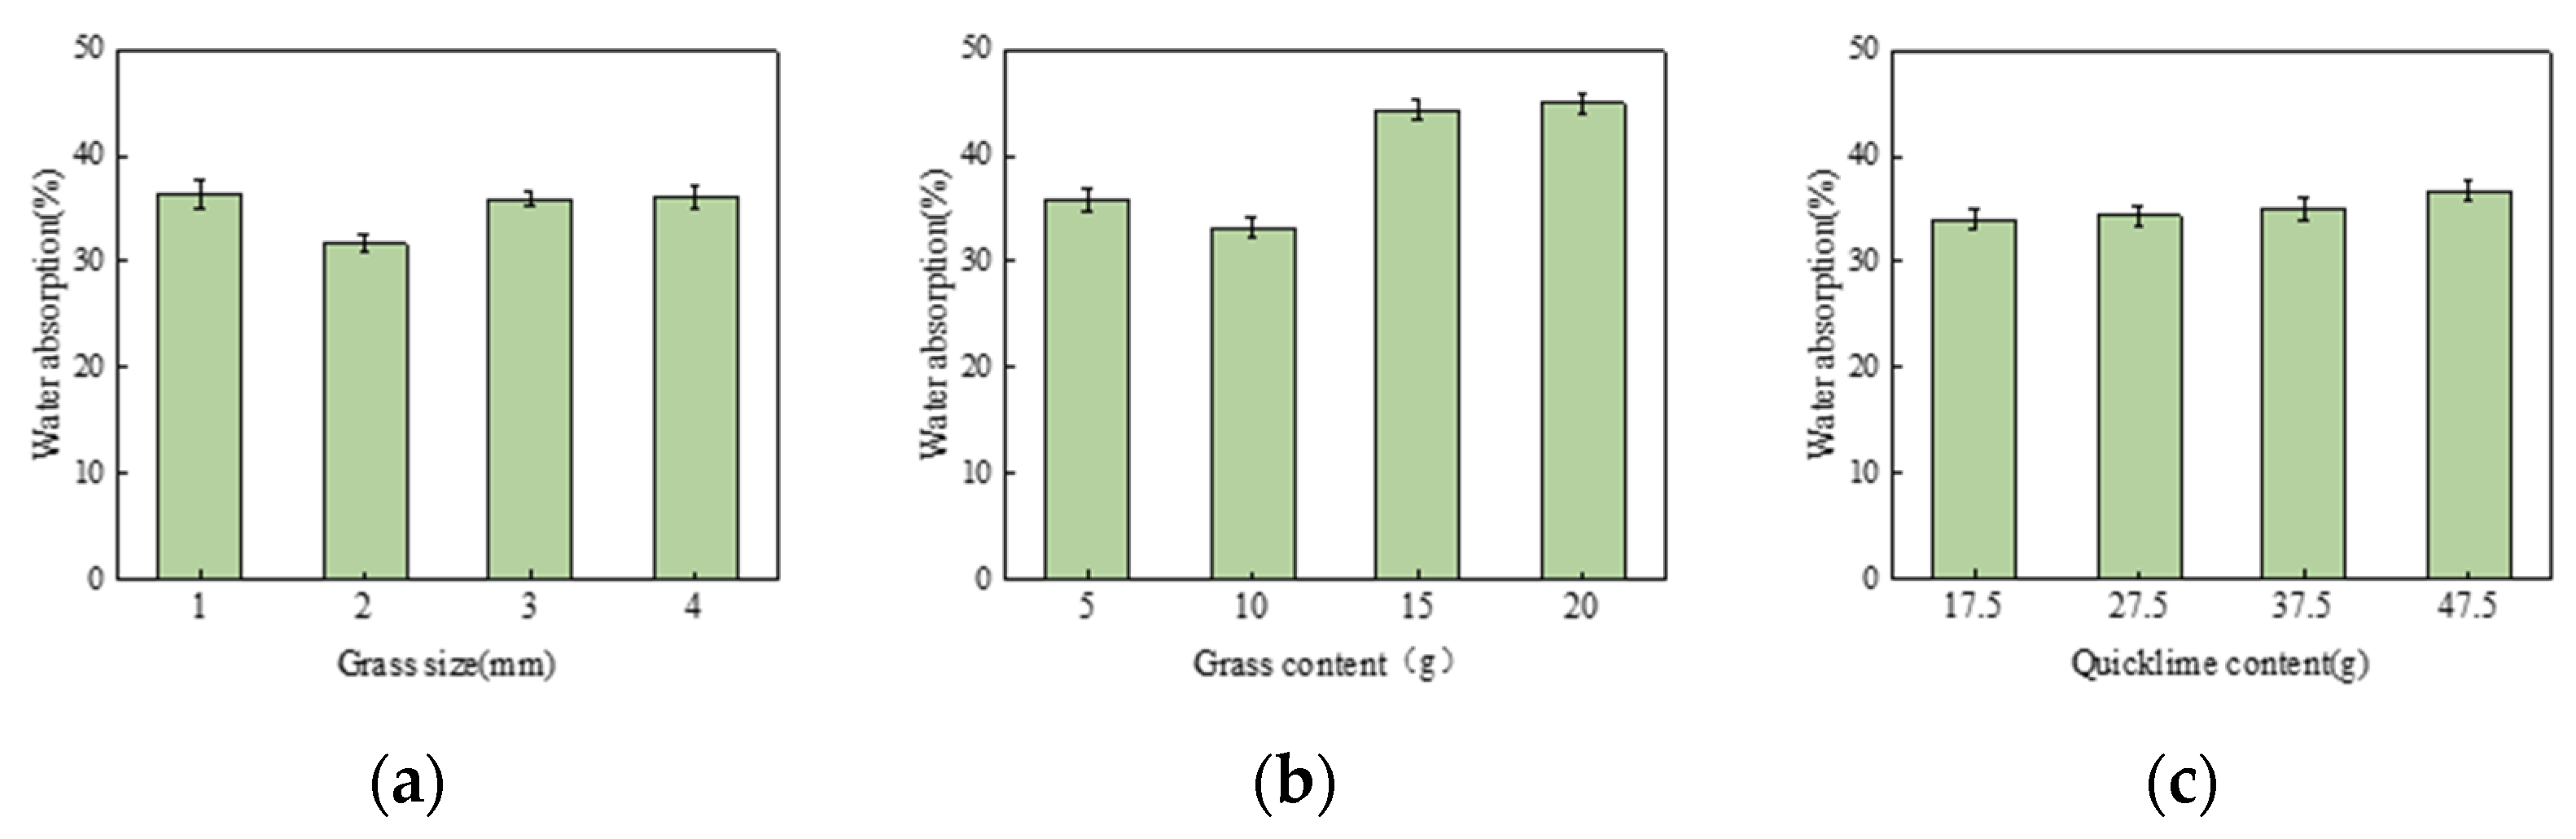
Figure 8 shows the water absorption test results from the single-factor experiment. The variation in grass size, as in Figure 8a, exhibits a trend of initially decreasing and increasing water absorption. When the grass size is 2 mm, the water absorption rate is at its lowest, at 21.52%. This might be because smaller grass fibers react and bond more easily with the slag matrix, reducing water penetration. In contrast, larger grass fibers may have more gaps, increasing water penetration and, thus, water absorption. Both the grass content, as in Figure 8b, and the quicklime content, as in Figure 8c, show similar trends in their effect on water absorption: as their content increases, water absorption also increases. The high grass content leads to higher water absorption due to the high cellulose content, which has strong hydrophilic properties. Quicklime also has strong water absorption characteristics, so as its content increases, water absorption likewise increases.
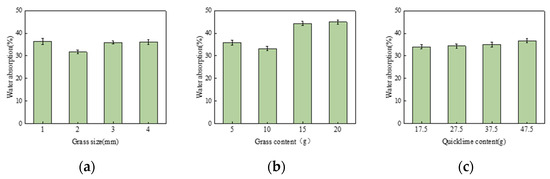
Figure 8.
(a) Effect of grass size on water absorption rate; (b) Effect of grass content on water absorption rate; (c) Effect of quicklime content on water absorption rate.
Therefore, the optimal ranges are determined: grass size between 1–3 mm, grass content between 5–15 g, and quicklime content between 27.5–47.5 g.
3.2. RSM Experiment
3.2.1. Design of Experiment (DoE)
Based on the results of the single-factor experiments, Design Expert 10.0.3 software was used to perform a Box-Behnken design optimization. The factors were grass content, grass size, and quicklime content, with compressive strength, flexural strength, and water absorption as responses. An L17 (33) orthogonal array was obtained, containing 17 sample groups, including 13 unique schemes and four repetitions. The level values for every design factor are displayed in Table 3. The design approaches indicated in Table 4 were followed in preparing the samples, which were then put through mechanical and physical testing. Table 4 presents the results of this study.
Table 3.
Table of experimental design for 3-factor, 3-level response surface analysis.
Table 4.
Response surface optimization experimental design and results.
3.2.2. Model Building and Testing
The data were fitted to polynomial models using variance analysis (ANOVA). Model p-values and consistency tests were used to perform significance tests for linear, quadratic, and cubic models in order to determine which model was appropriate. The quadratic model was shown to be the most significant based on the results. The obtained second-order polynomial regression model is as follows:
where the grass size, grass content, and quicklime content are denoted as A, B, and C, respectively, and the responses of compressive strength (α), flexural strength (β), and water absorption (γ) are used for multiple regression fitting.
Yα = 10.6 − 1.87 × A − 1.42 × B + 1.77 × C + 0.22 × AB + 0.73 × AC + 0.27 × BC − 0.91 × A2 − 1.31 × B2 − 1.46 × C2
Yβ = 2.08 + 0.24 × A − 0.11 × B + 0.16 × C − 0.2 × AB − 0.028 × AC − 0.12 × BC − 0.46 × A2 − 0.68 × B2 − 0.71 × C2
Yγ = 22.02 − 0.54 × A + 2.5 × B + 2.85 × C − 0.29 × AB + 0.72 × AC − 1.1 × BC + 2.89 × A2 + 1.77 × B2 + 4.4 × C2
Yβ = 2.08 + 0.24 × A − 0.11 × B + 0.16 × C − 0.2 × AB − 0.028 × AC − 0.12 × BC − 0.46 × A2 − 0.68 × B2 − 0.71 × C2
Yγ = 22.02 − 0.54 × A + 2.5 × B + 2.85 × C − 0.29 × AB + 0.72 × AC − 1.1 × BC + 2.89 × A2 + 1.77 × B2 + 4.4 × C2
The optimum approach for confirming the relevance of the model is an analysis of variance (ANOVA), which was utilized to get the p-values for each model [65]. As shown in Table 5 through 7, the p-values of the regression models are all less than 0.0001, indicating that the regression models are statistically significant and highly significant. The p-values for the lack-of-fit terms (p = 0.2592 in Table 5, p = 0.1650 in Table 6, p = 0.3190 in Table 7) are all greater than 0.05, indicating that the lack-of-fit terms are not significant and the models have a good fit.
Table 5.
Results of regression analysis for compressive strength model and regression coefficients.
Table 6.
Results of regression analysis of flexural strength model and regression coefficients.
Table 7.
Results of regression analysis for water absorption model and regression coefficients.
The p-values for the grass size, grass content, and quicklime content are all less than 0.05, indicating significant interactions among these three factors in the regression model. In Table 5, the primary terms of grass size, grass content, and quicklime content significantly impact compressive strength (p < 0.01). The main effects analysis shows the relationship among the factors: A > C > B, i.e., grass size > quicklime content > grass content. The second-order interaction term AC has a significant impact on compressive strength (p < 0.01), while BC and AB do not have significant effects (p > 0.05). The influence of the second-order interactions on compressive strength is ranked as AC > BC > AB.
In Table 6, the primary terms of grass size and quicklime content have a highly significant impact on flexural strength (p < 0.01), and grass size also significantly affects flexural strength (p < 0.05). The main effects analysis shows the relationship among the factors: A > C > B, i.e., grass size > quicklime content > grass content. The second-order interaction term AB has a significant impact on flexural strength (p < 0.05), while AC and BC do not have significant effects (p > 0.05). The influence of the second-order interactions on flexural strength is ranked as AB > BC > AC.
In Table 7, the primary factors of grass content and quicklime content have a highly significant effect on water absorption (p < 0.01), while grass size has a significant effect on water absorption (p < 0.05). The analysis of the main effects of each factor is ranked as follows: C > B > A, meaning quicklime content > grass content > grass size. The secondary interaction BC has a highly significant effect on water absorption (p < 0.01), AC has a significant effect on water absorption (p < 0.05), and AB has no significant effect on water absorption (p > 0.05).
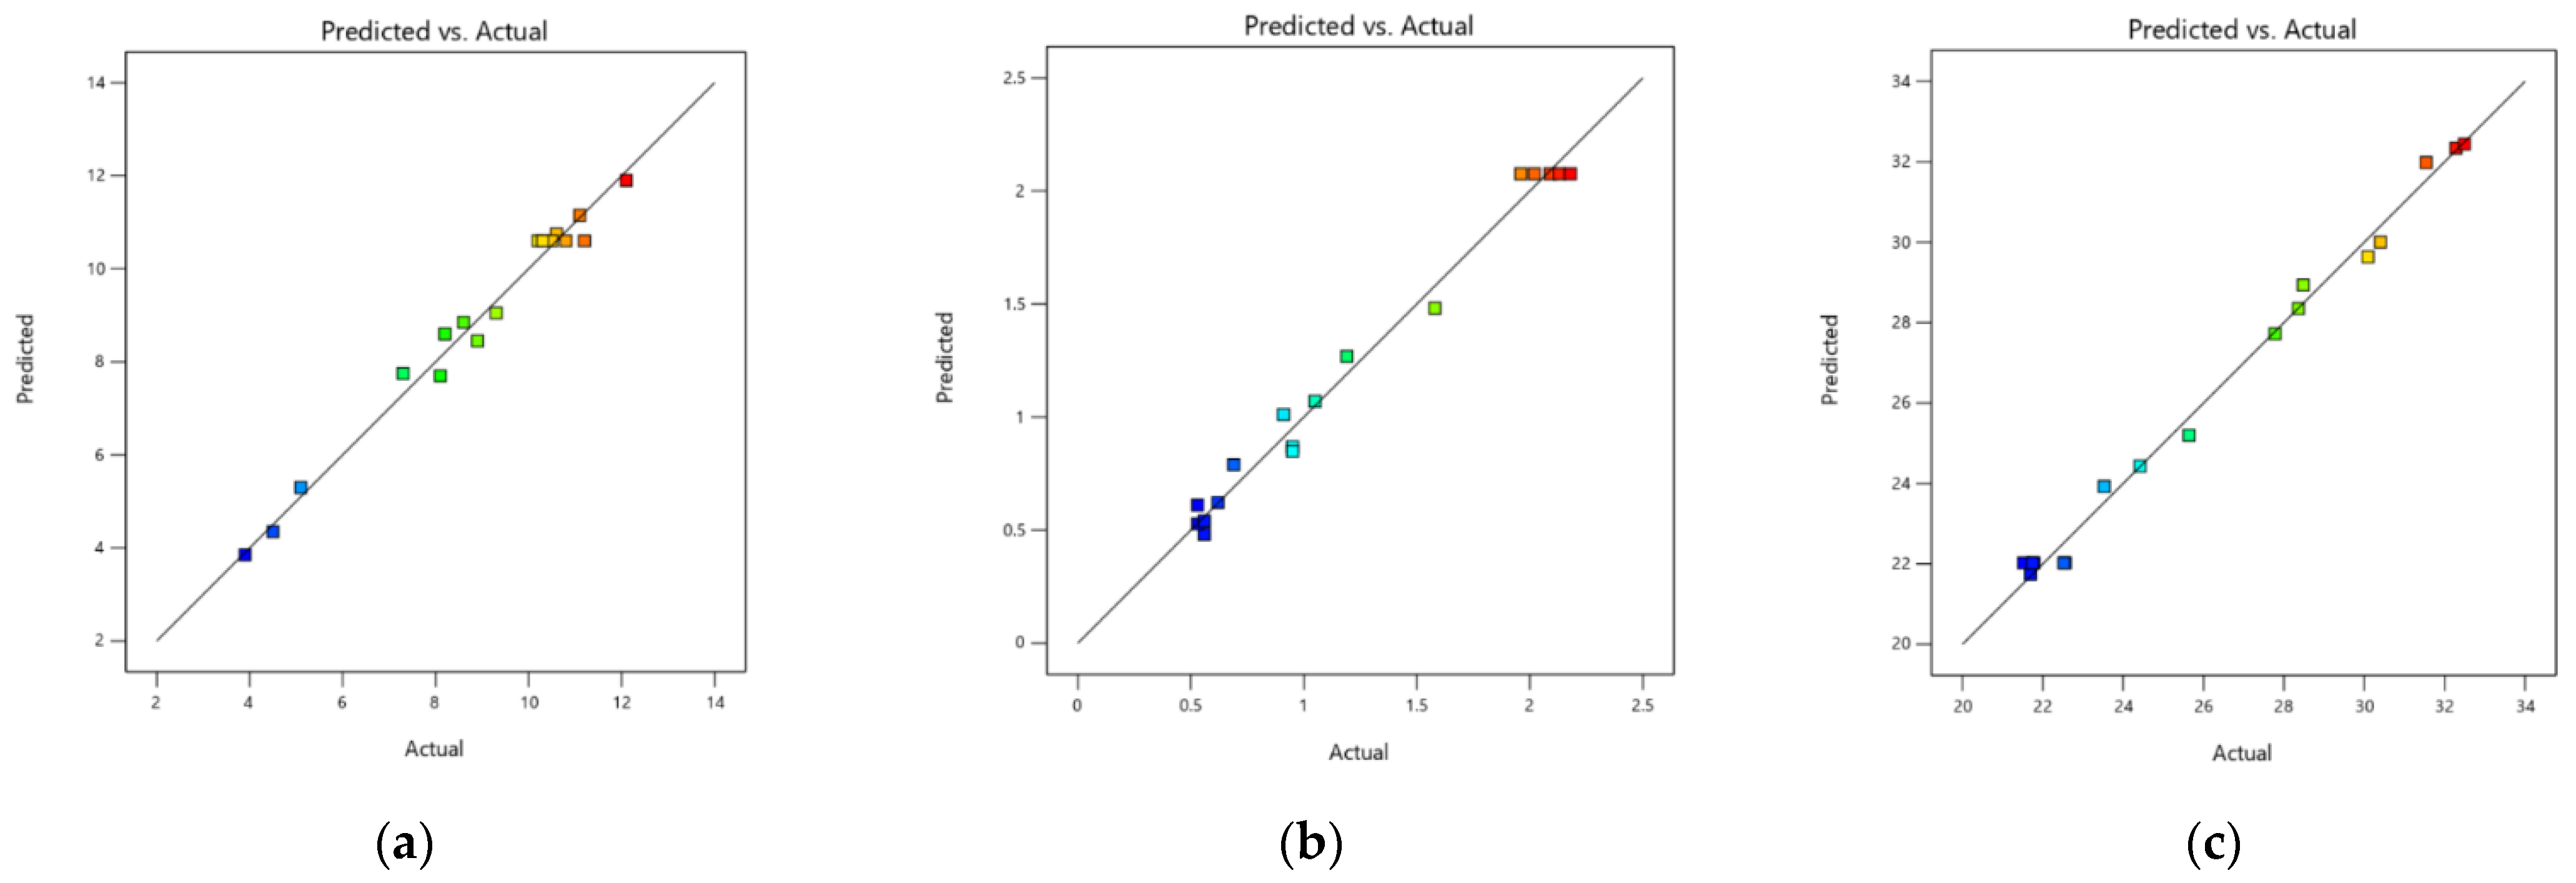
Additional methods for testing the model included the Pareto test, residual analysis, and comparison of anticipated and experimental values. Figure 9a–c display the predicted values versus the actual values for all models. These figures are used to check and evaluate all models’ correlation, goodness of fit, and predictive accuracy. A perfect fit model would have all data points aligned perfectly along the linear trend line in the prediction versus actual plots [66].
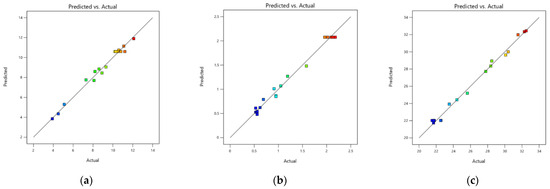
Figure 9.
Diagnostic Plots: (a) Predicted versus actual graph of compressive strength; (b) Predicted versus actual graph of flexural strength; (c) Predicted versus actual graph of water absorption rate. (Blue indicates the lowest response, represents residuals that are small or negative. Green represents the median response, represents residuals that are close to zero, indicating good model fit. and red means the highest response peak in the plot, indicates large or positive residuals, showing significant deviation from the model’s predictions).
Figure 9a–c show that the data points for all models reasonably fit the drawn linear trend lines, indicating good predictive performance and model fit, with all transformed models having a correlation coefficient greater than 0.9. In Figure 9c, the data points for the slump model show the best fit, resulting in a line with a slope of 0.9826. In Figure 9a–c, the data points’ color explains each response’s ranking; blue indicates the lowest response, represent residuals that are small or negative., green represents the median response, represents residuals that are close to zero, indicating good model fit. and red means the highest response peak in the plot, indicates large or positive residuals, showing significant deviation from the model’s predictions [67,68].
3.2.3. Multi-Factor Experimental Results
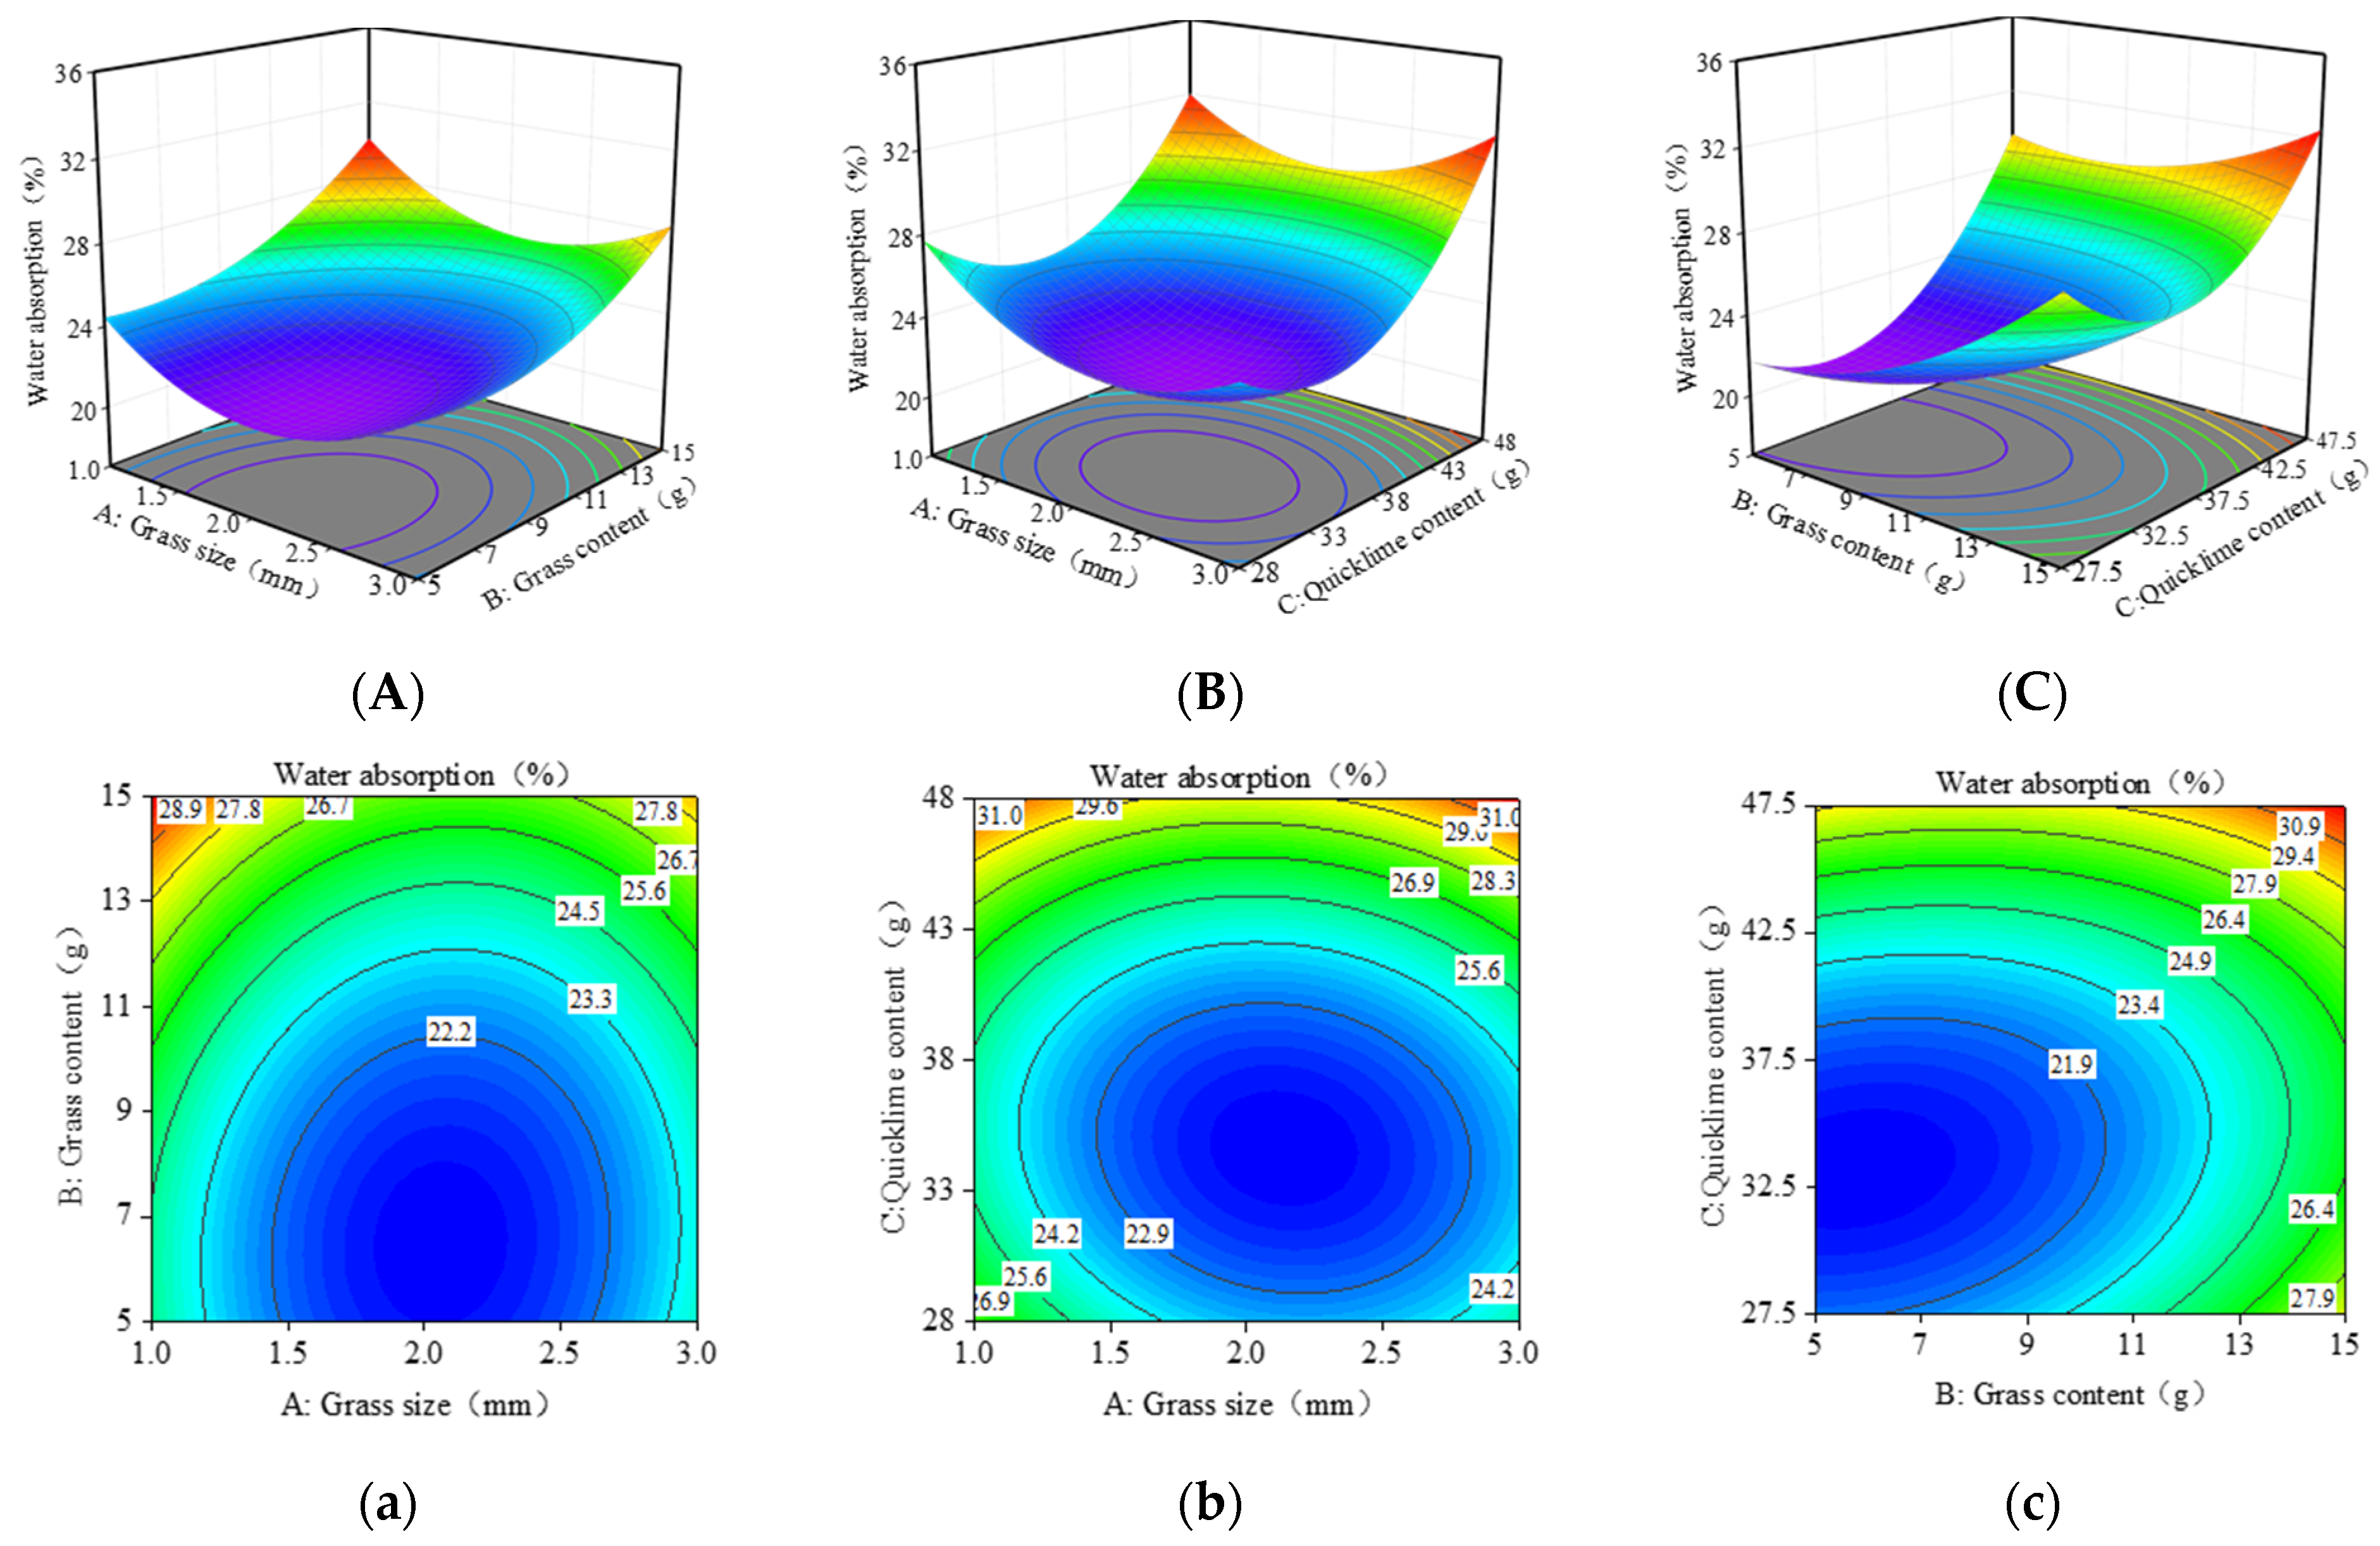
The related response surface and contour plots were created using the regression equations of the response values in order to further maximize the strength of the composite material [66]. The contour and three-dimensional response surfaces of the quadratic model’s polynomial regression equation represent the interaction results of various factors. These plots not only help predict and optimize the response values but also analyze the interaction effects between any two factors to understand their interaction patterns. Contour plots consist of multiple lines of equal response values, connecting neighboring points with the same response values into closed curves. The curvature of the response surface plots shows a positive correlation with the factors’ effect on the response values. The steeper the surface and the greater the curvature, the more significant the effect of the factor on the response value [69]. The curvature’s dimension is shown by the color change trend; the more the curvature, the faster the blue-to-red color shift. Response surface plots and contour plots are analyzed similarly. The intensity of the interaction effect between the two parameters is also determined by the contour lines’ form. When the contour pattern is circular, there is little interaction between the two elements and a similar influence on the response value. The two elements’ interaction is more significant if the form is elliptical [70].
Figure 10 illustrates the three-dimensional surface and contour plots showing the effects of three factors (grass size, grass content, and quicklime content) on the compressive strength of the composite material. The interaction between grass content and grass size on compressive strength is depicted in Figure 10a. The highest compressive strength is achieved when the grass size is between 1 and 1.5 mm, and the grass content is around 5–7 g. This observation is consistent with the analysis results in Table 5.
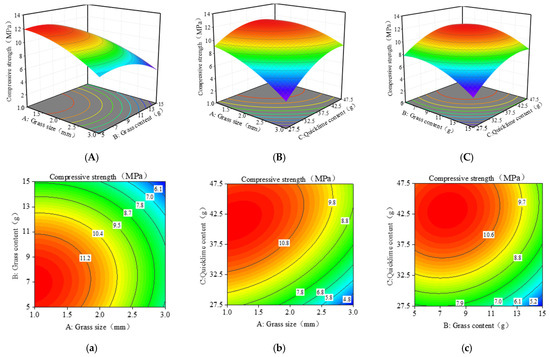
Figure 10.
RSM model plots for compressive strength: (A–C) 3D response surface; (a–c) Contour line diagram of the model. (The blue to red color represents the change in output value from low to high. The numbers in the graph are generally used to label the response values at specific points or contours. The line in the figure represents the set of points on the response surface that have the same response value. The dots in the graph represent experimental or simulated data points).
The interaction between grass content and quicklime content on compressive strength is shown in Figure 10B,b. The compressive strength increases with a decrease in grass content and an increase in quicklime content up to a certain threshold. Beyond this threshold, the compressive strength starts to decrease. The maximum compressive strength is achieved when the grass content is around 5–7 g, and the quicklime content is around 42.5–47.5 g. Figure 10C,c displays the impact of grass size and quicklime content on compressive strength. When the quicklime content is low, the compressive strength decreases with increased grass size. When the quicklime content is high, the compressive strength initially remains stable and then decreases with increased grass size. The highest compressive strength is observed when the grass size is between 1.0 and 1.5 mm and the quicklime content is around 42.5–47.5 g.
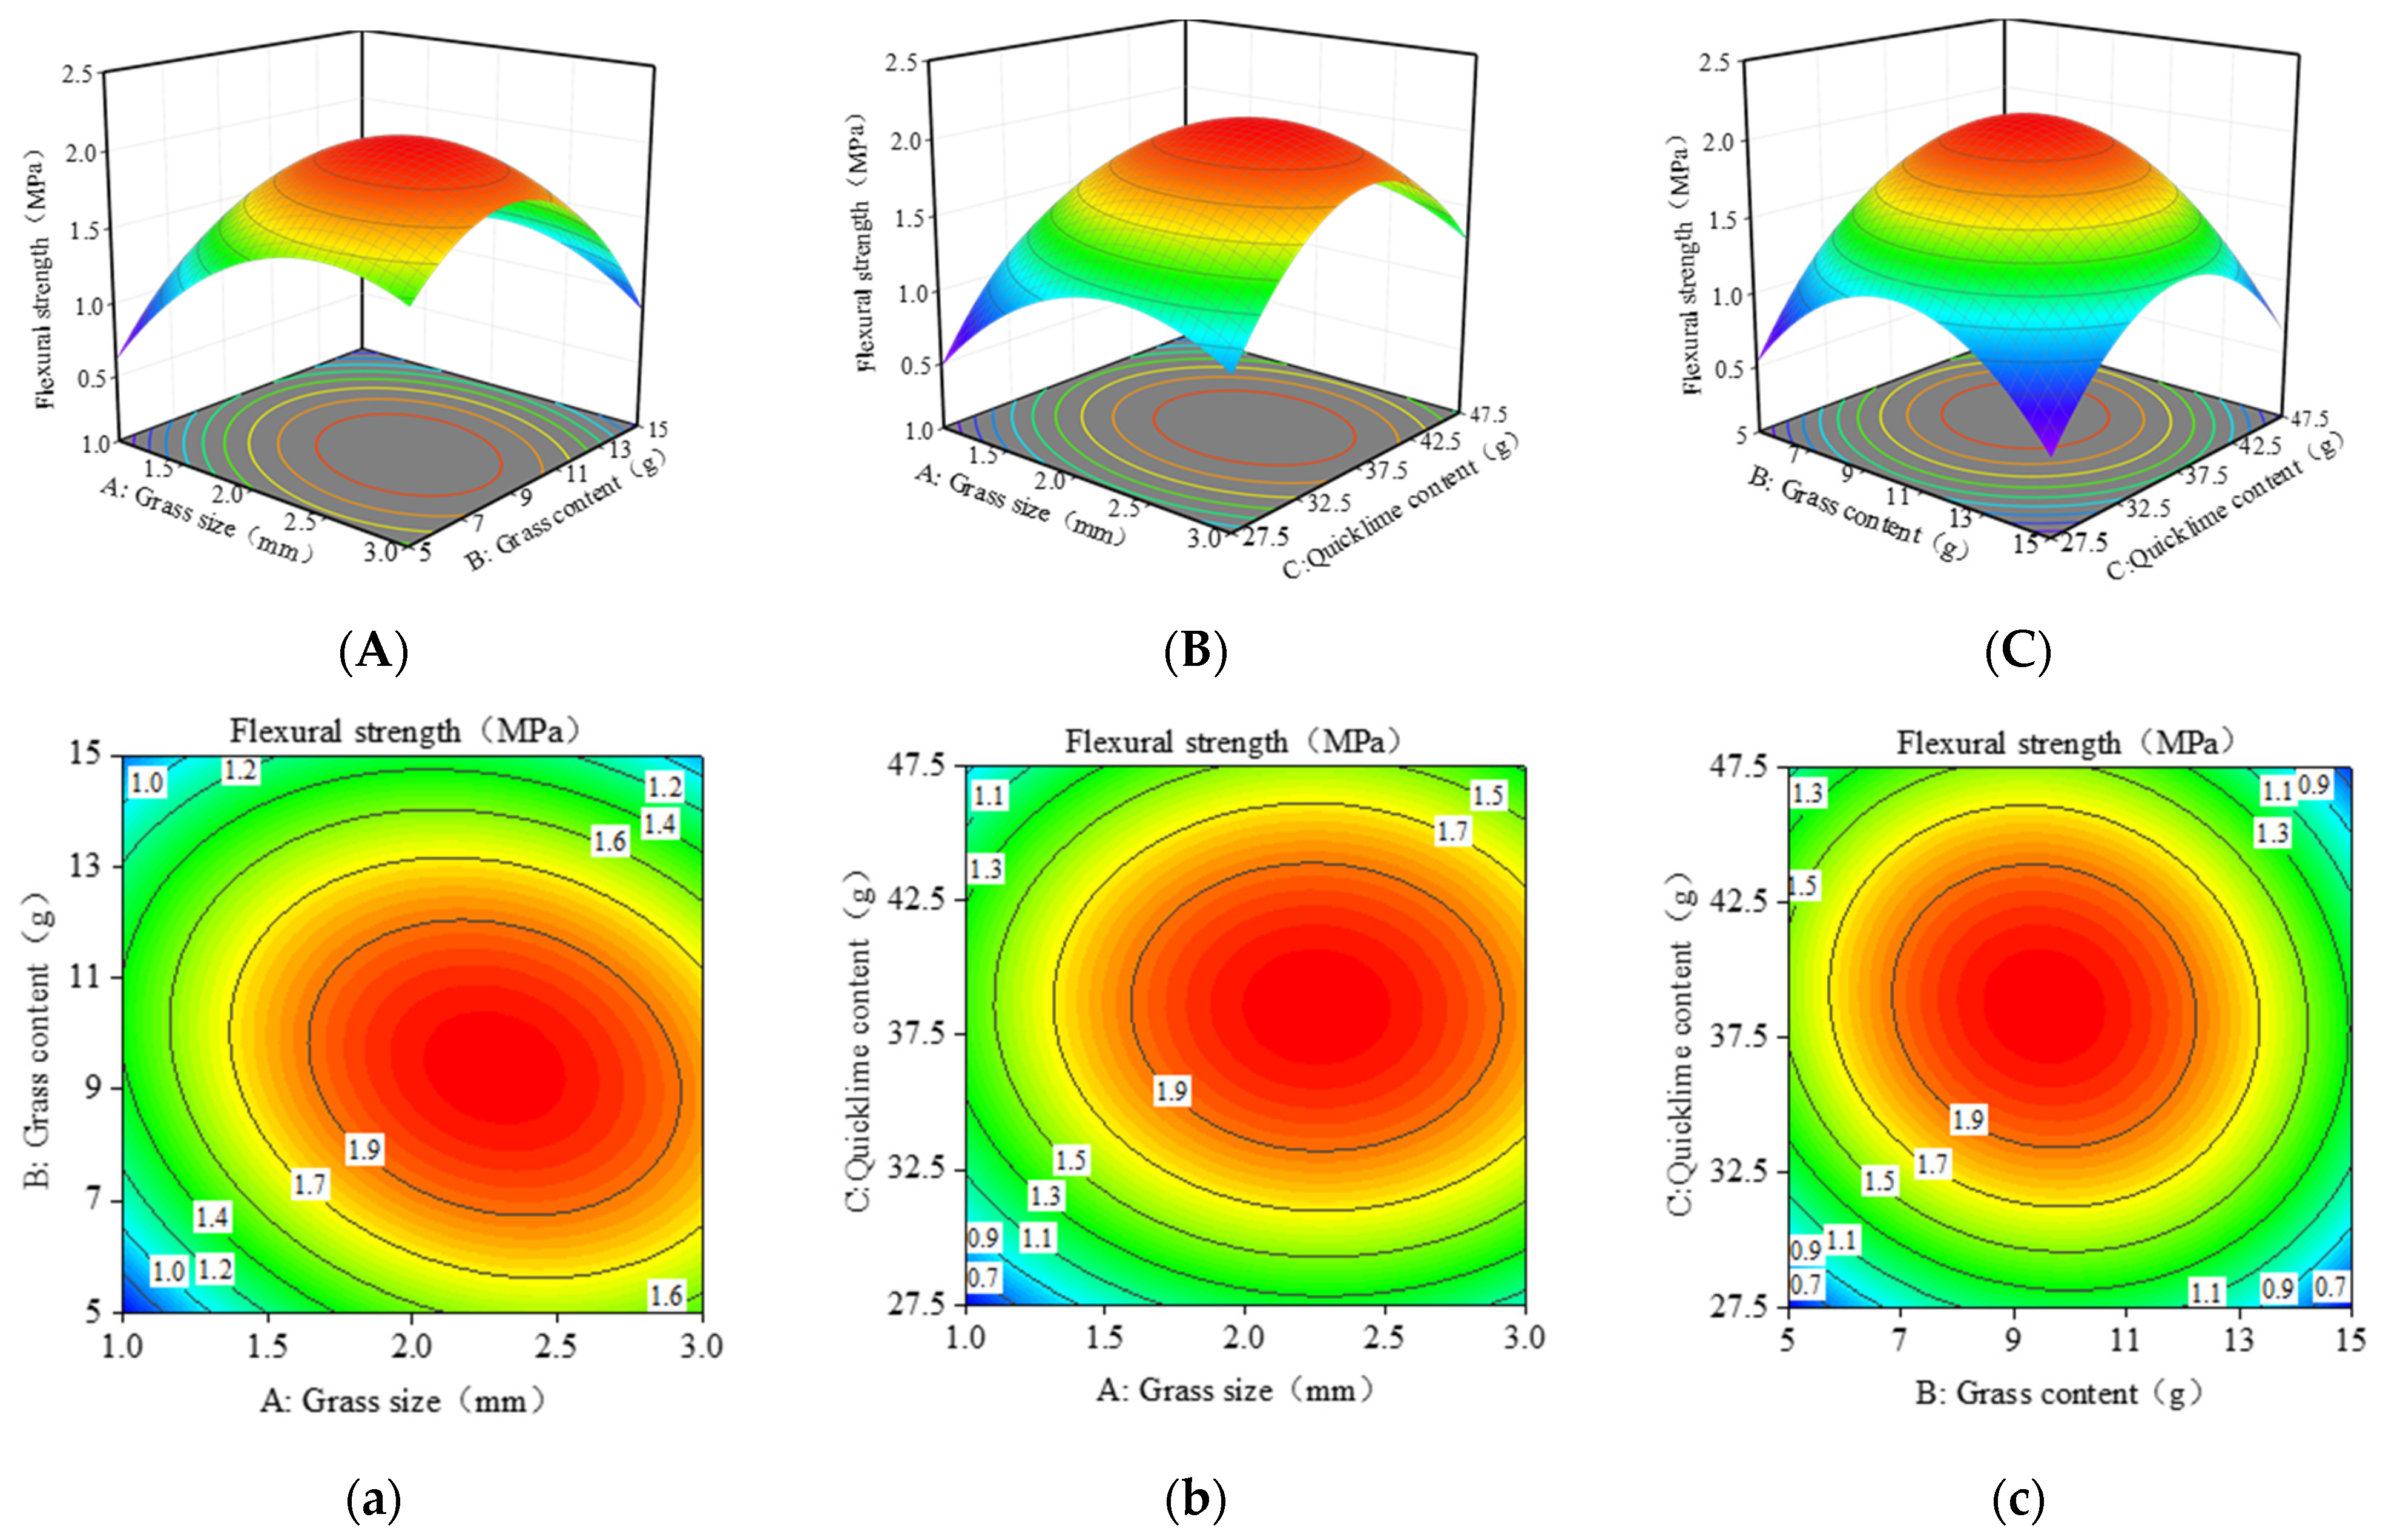
In Figure 11, the contour shapes indicate that the interaction between grass content and grass size is the most significant, which is consistent with the analysis results in Table 6.

Figure 11.
RSM model plots for flexural strength: (A–C) 3D response surface; (a–c) Contour line diagram of the model. (The blue to red color represents the change in output value from low to high. The numbers in the graph are generally used to label the response values at specific points or contours. The line in the figure represents the set of points on the response surface that have the same response value. The dots in the graph represent experimental or simulated data points.).
In Figure 11A,a, the slope of grass size is steeper than grass content, indicating that grass size has a more significant impact on flexural strength. This is because the appropriate length of grass fibers can bond the bricks, thus affecting their flexural strength. The maximum flexural strength is achieved when the grass size is between 2–3 mm and the grass content is around 7–13 g.
Figure 11B,b shows the effect of quicklime content and grass content on flexural strength. In the three-dimensional surface plot, the slope change of quicklime content is steeper, indicating that quicklime has a more significant effect on flexural strength than grass content. The flexural strength gradually improves and then falls as the amount of grass and quicklime increases. When the quicklime content is between 32.5 and 42.5 g and the grass content is between 7 and 13 g, the maximum flexural strength is attained.
Figure 11C,c shows the effect of quicklime content and grass size on flexural strength. In the three-dimensional plot 11-C, the slopes of grass size and quicklime content are comparable, indicating that both factors significantly affect flexural strength. The impact of quicklime on flexural strength is mainly due to the stress within the bricks, which influences the flexural strength. When the values reach a certain threshold, the material becomes too dense, causing internal stress concentration, which reduces flexural strength. The maximum flexural strength is observed when the grass size is 1.5–2.5 mm and the quicklime content is around 32.5–42.5 g.
In Figure 12, the contour shapes reveal that the interaction between grass content and grass size is the most significant, which aligns with the analysis results in Table 7.

Figure 12.
RSM model plots for water absorption: (A–C) 3D response surface; (a–c) Contour line diagram of the model. (The blue to red color represents the change in output value from low to high. The numbers in the graph are generally used to label the response values at specific points or contours. The line in the figure represents the set of points on the response surface that have the same response value. The dots in the graph represent experimental or simulated data points.).
In Figure 12A,a, the slope of grass content is steeper than grass size, indicating that grass content significantly impacts water absorption capacity. The minimum water absorption rate is achieved when the grass content is between 5 and 9 g and the grass size is around 1.5 and 2.5 mm.
Figure 12B,b shows the effect of quicklime content and grass content on water absorption capacity. In the three-dimensional surface plot, the steep slope associated with quicklime content indicates its significant influence on water absorption capacity, compared to grass content. Initially, the water absorption rate remains constant with increasing quicklime content, then rises. At low quicklime content, the interaction between quicklime and grass fibers is weak, leading to a gradual increase in water absorption as grass content rises. Conversely, at high quicklime content, the interaction strengthens, allowing grass fibers to enhance their water absorption capacity fully. The minimum water absorption rate is achieved when the quicklime content is between 27.5 and 42.5 g and the grass content is around 5–9 g.
Figure 12C,c shows the effect of quicklime content and grass size on water absorption capacity. In the three-dimensional plot 12-C, the slope of quicklime content is steeper than that of grass size, indicating that quicklime significantly impacts water absorption capacity. Quicklime inherently has strong moisture absorption properties, hence its strong water absorption capacity. When the quicklime content is low, the water absorption rate initially decreases and then slowly increases with an increase in grass size, with a relatively small increase. When the quicklime content is high, the water absorption rate initially decreases slightly and increases significantly with increased grass size. This is primarily because smaller grass fibers react and bind more easily with quicklime, reducing water permeability and lowering the water absorption rate. Larger grass fibers may have more gaps, increasing water permeability and thus increasing the water absorption rate. The minimum water absorption rate is achieved when the quicklime content is 32.5–42.5 g and the grass size is around 1.5–2.5 mm.
3.2.4. Optimization and Validation
To maximize the workability and mechanical strength of the composite material while minimizing its water absorption rate, a multi-objective optimization method from Response Surface Methodology (RSM) was employed. The optimization aimed to achieve the desired parameter proportions and potential combinations by setting specific goals for each variable and response. Table 8 summarizes the optimization criteria and objectives for these variables and responses, focusing on maximizing compressive strength and flexural strength while minimizing water absorption. During the optimization, the grass size, grass content, and quicklime content were maintained within 1–3 mm, 5–15 g, and 27.5–47.5 g, respectively.
Table 8.
Optimization objectives for composite fabrication process variables.
As shown in Table 8, setting the grass size to 2 mm with a grass content of 8.4 g and a quicklime content of 38 g is the best choice for producing composite materials.
To confirm the accuracy of the optimization results, composite material blocks were produced utilizing the ideal process parameters of quicklime content, grass size, and grass content. The compressive strength, flexural strength, and water absorption rate were measured at 11.425 MPa, 2.145 MPa, and 21.89%, respectively. The relative errors between these experimental values and the predicted values of total compressive strength (11.019 MPa), flexural strength (2.042 MPa), and water absorption rate (21.538%) were within an 8% range. This confirms the excellent correlation between predicted and experimental values, indicating that the optimal processing technique obtained through the response surface methodology is reasonable.
3.3. Analysis of Microscopic Performance
3.3.1. X-ray Diffraction
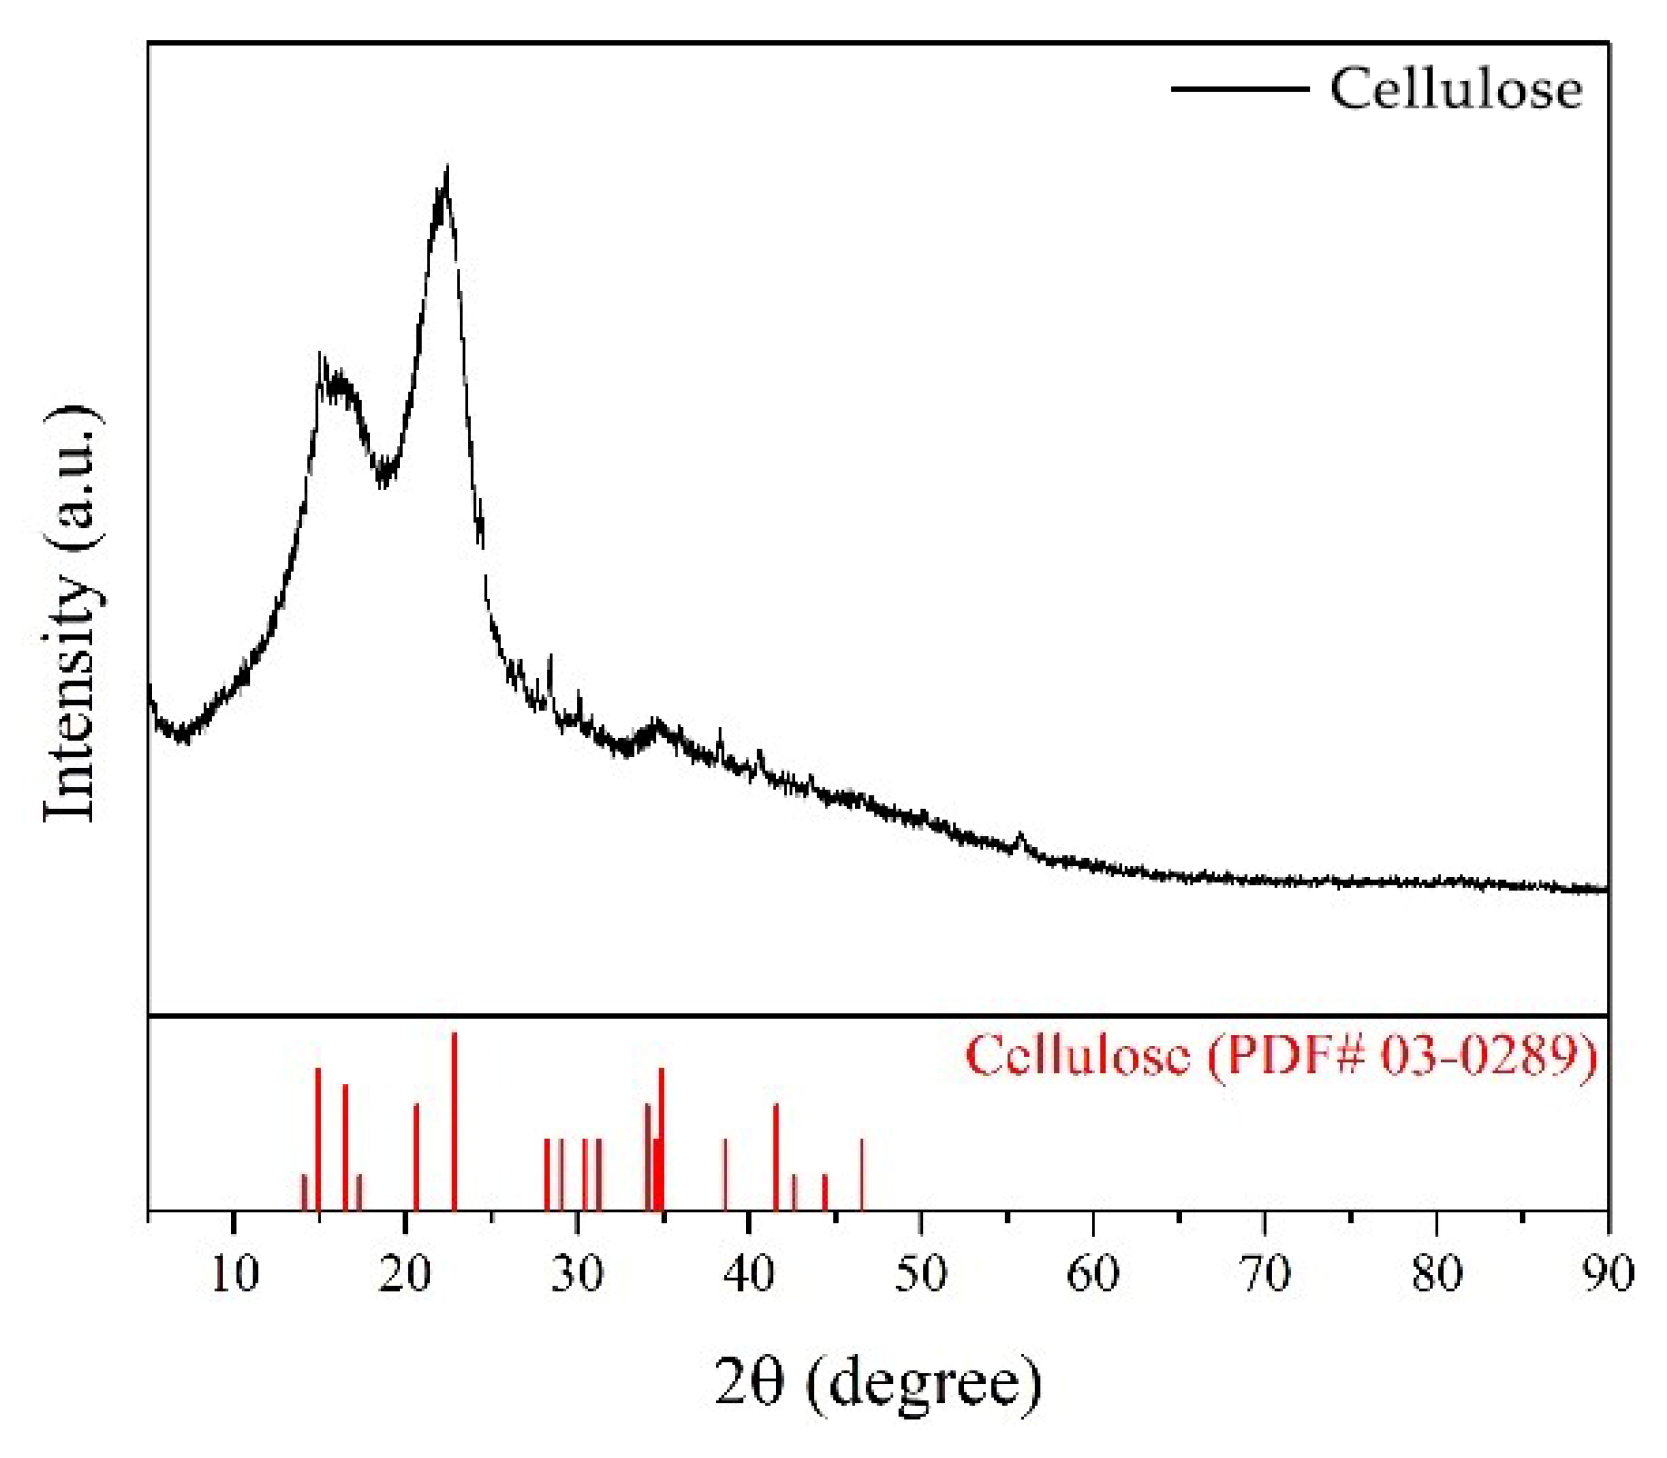
X-ray analysis was conducted on the grass fibers to investigate the crystalline structure of cellulose in the grass, aiming to observe the overall impact of grass on the mechanical properties of the composite material. As shown in Figure 13, the XRD pattern of the sample exhibits a series of characteristic diffraction peaks that can be attributed to natural cellulose (PDF# 03-0289). Precisely, the diffraction peaks near 2θ = 16.5°, 22.8°, and 34.9° correspond to the (-111), (002), and (040) crystal planes of natural cellulose, respectively. These results indicate that the sample is primarily composed of cellulose. Organic cellulose molecules are polar, with strong intermolecular forces and the ability to form hydrogen bonds between molecules. This leads to the crystallization of multiple cellulose chains into insoluble microfibrils and the formation of two structural regions: crystalline and amorphous. X-ray diffraction (XRD) can quantitatively measure the crystalline regions in cellulose. By analyzing the intensity and position of the diffraction peaks, we can calculate the crystallinity index, which is the ratio of the crystalline region to the amorphous region. The higher the crystallinity of the cellulose, the stronger and more durable the material. For grass fiber-reinforced slag-based composites, higher crystallinity results in greater structural integrity and load-bearing capacity. All characteristics impart high strength, stiffness, durability, and biocompatibility to cellulose [71]. In particular, intramolecular hydrogen bonds prevent the rotation of glycosidic bonds, significantly increasing rigidity. Using fibers with a high cellulose content to produce building materials can positively affect their mechanical properties [72]. Furthermore, because cellulose is biodegradable, using it in the construction industry may reduce the negative environmental effects of construction waste by acting as an effective means for the recycling and utilization of resources.
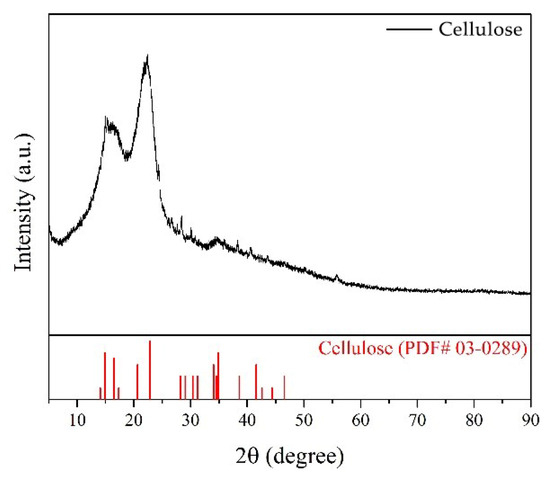
Figure 13.
XRD pattern of alfalfa grass.
3.3.2. Micromorphology
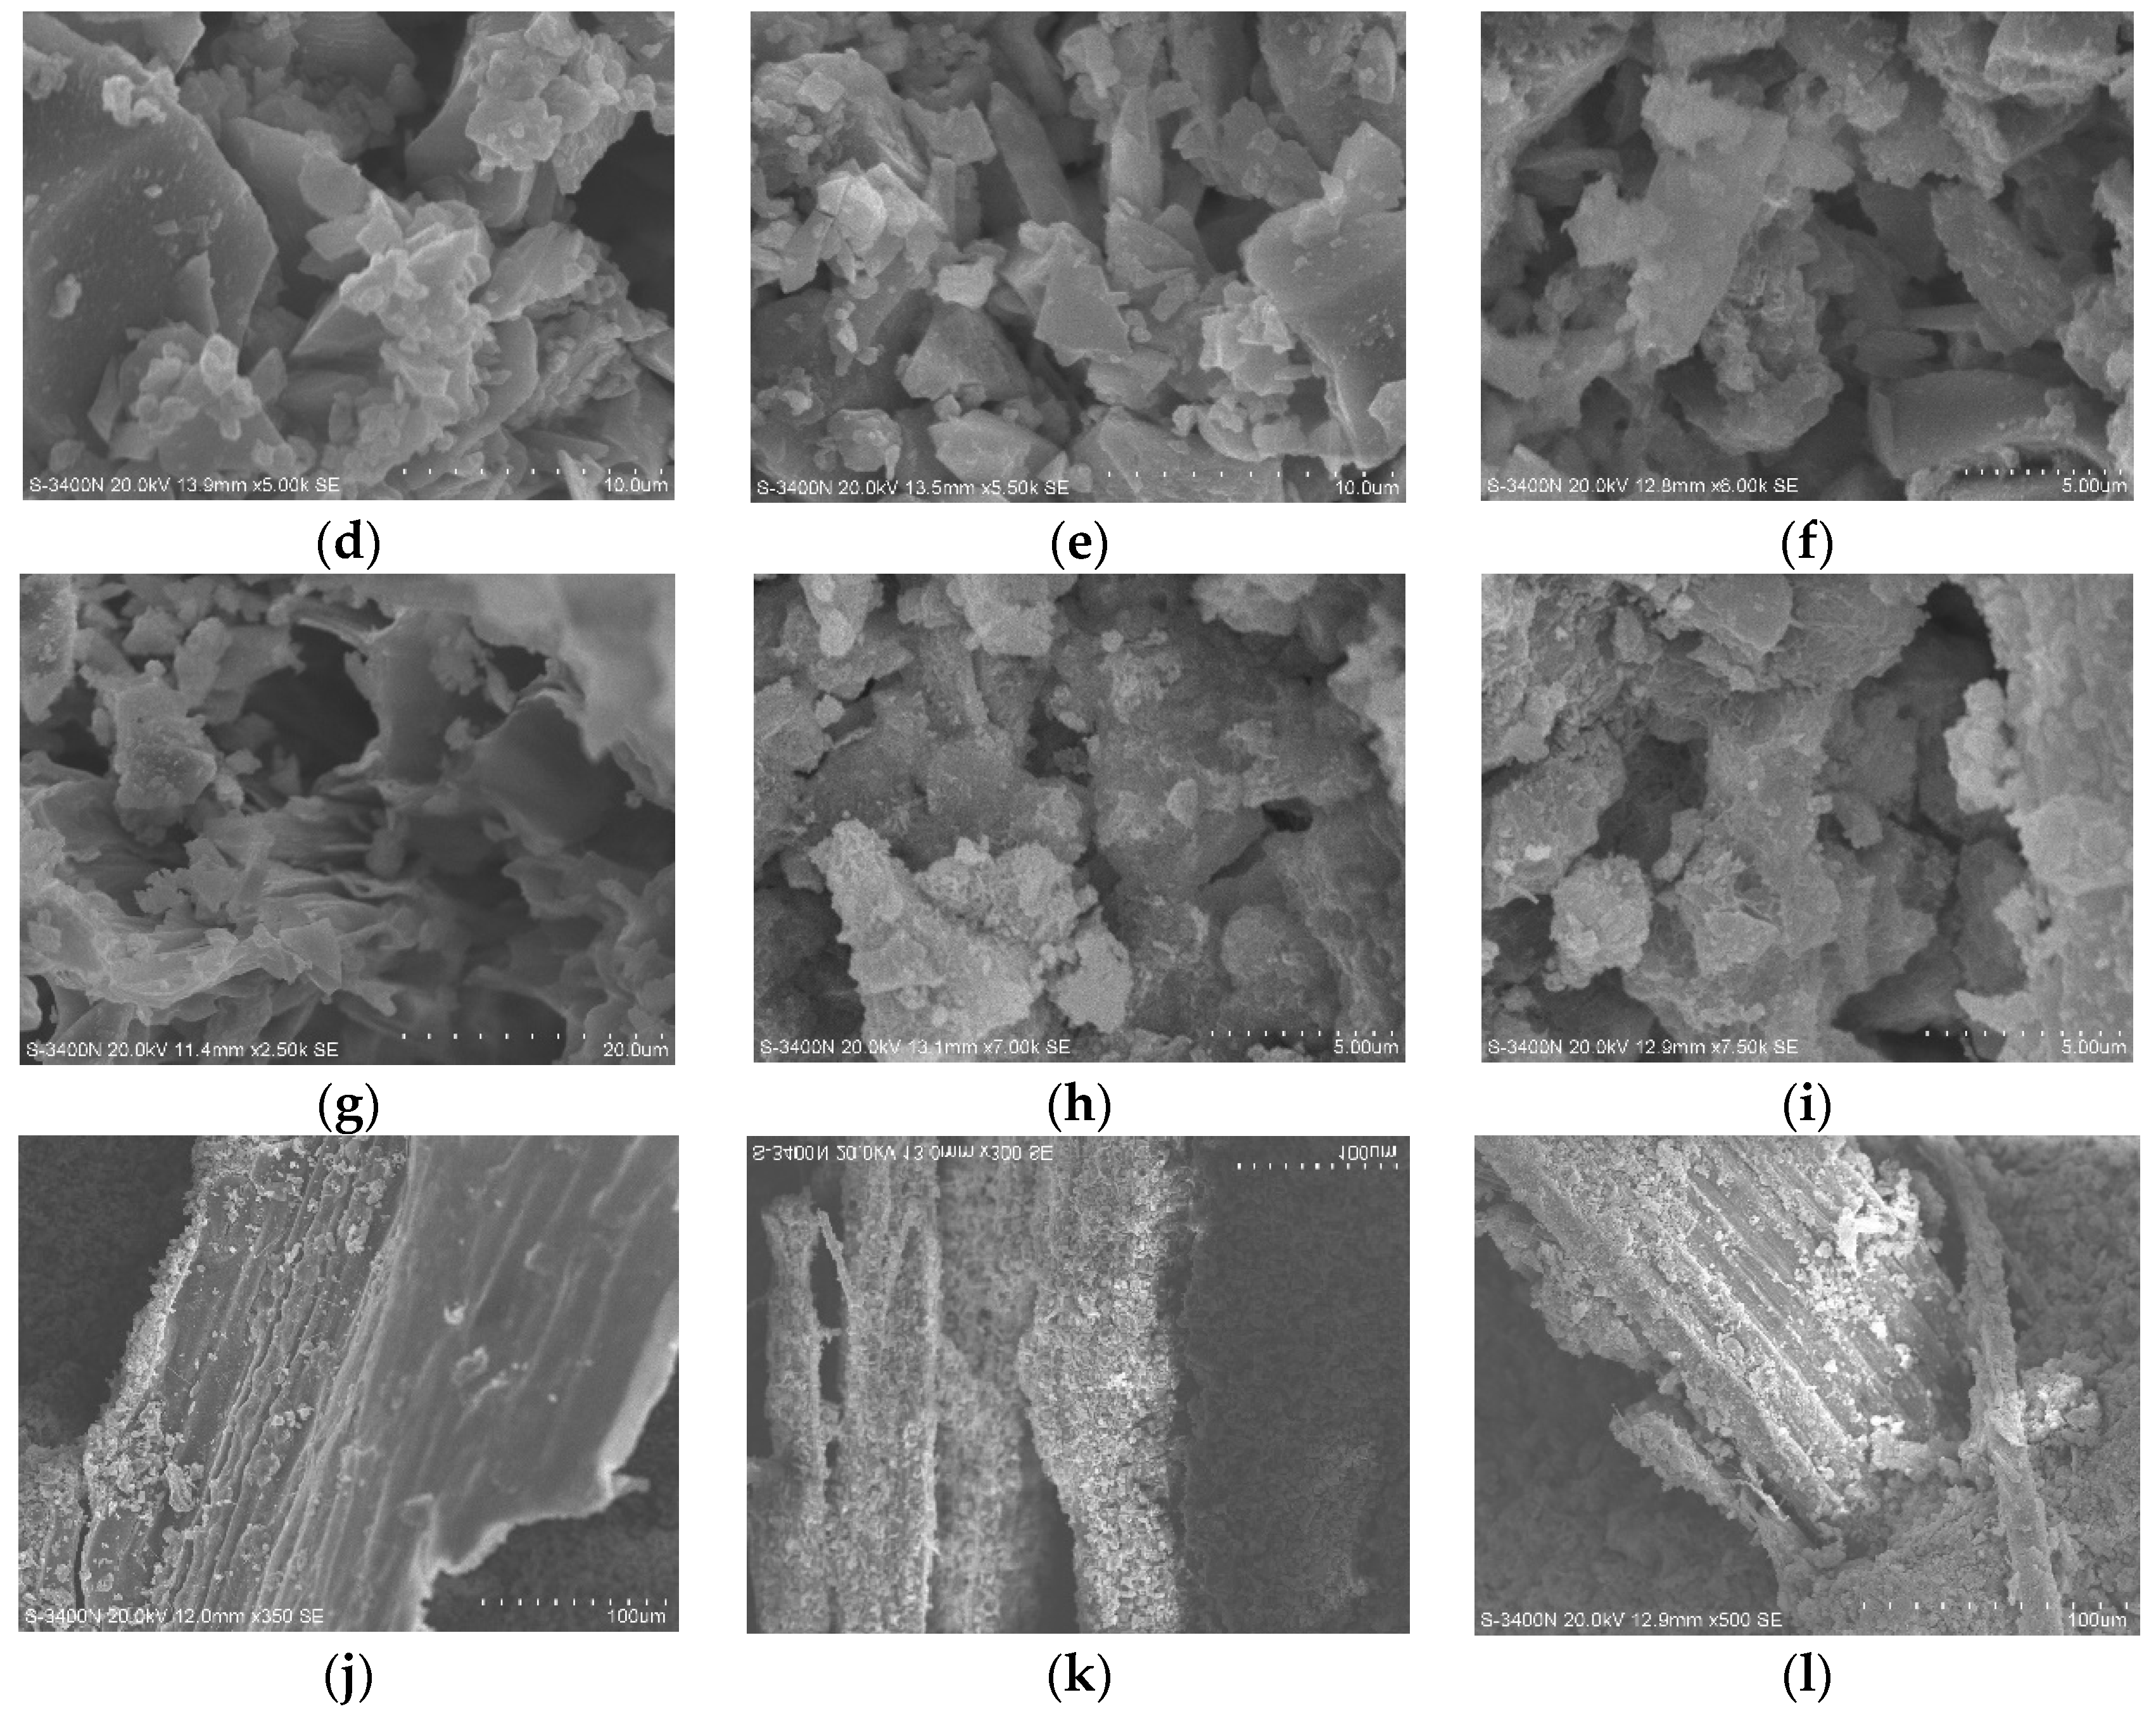
The hydration of quicklime produces calcium hydroxide, which chemically reacts with the surface of grass fibers, causing changes to their surface. Additionally, the hydration reaction generates a significant amount of heat, which may also affect the internal structure of the grass fibers. SEM experiments were conducted on the composite materials to observe the synergistic effects of the microscopic structures of the various materials. SEM is typically used to observe the fine structure of materials that ordinary microscopes cannot resolve, examining the microscopic morphology of samples to analyze their influence on mechanical properties. The changes in the components after the hydration reaction and the microscopic images of the pores and grass fibers in the composite materials were observed under a scanning electron microscope (SEM). The mechanical strength of the plant fiber blocks is primarily determined by the interaction between the Ca(OH)2 matrix, formed after the hydration reaction of quicklime with grass straw, and the slag matrix. As shown in Figure 14a–i, the Ca(OH)2 and slag powder raw materials appear as loosely packed, porous structures with relatively large pore sizes.
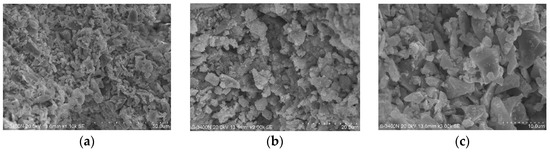
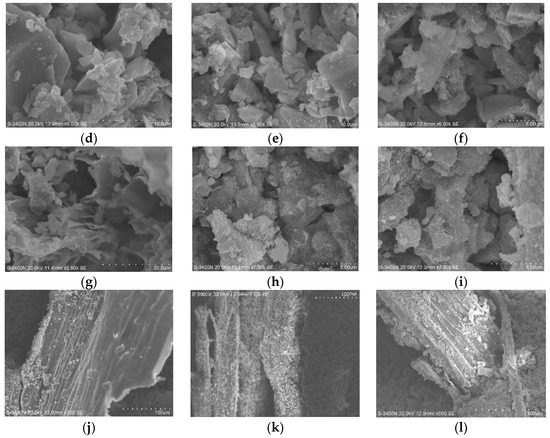
Figure 14.
SEM images of grass fiber slag-based composites. ((a–i) show the relationship between the various materials in the composite at the microscopic level); (j–l) show the morphology of the grasses at the microscopic level in the composite).
The grass straw fibers serve as the dispersed phase, while Ca(OH)2 and slag powder form the continuous phase. After being molded into bricks, the Ca(OH)2 and slag are compressed, resulting in a relatively dense structure. Moreover, this process reduces the gaps between fibers, increasing the contact area. The straw fibers appear to be embedded within the dense Ca(OH)2 powder in the bricks [73]. It is suggested that this may be due to the formation of primary metal complexes through hydrogen bonding between Ca2+ ions and the OH− functional groups in cellulose and lignin, as indicated in previous studies. The Ca(OH)2 particles may concentrate on cellulose’s inner and outer surfaces, as proposed by [73,74]. However, this interpretation is based on earlier research and has not been directly verified in the current study. From Figure 14j–l, it can be observed that the surface of the grass fibers is relatively rough, leading to a tighter integration with the slag matrix material, which positively influences mechanical properties.
Additionally, observations reveal that grass fibers are not easily discernible in the microscopic morphology of the composite material, likely due to the better homogeneity of the fiber material within the composite, resulting in a reduced pore volume [60].
4. Conclusions
In this study, the response surface methodology (RSM) was used to examine the effects of three key factors—grass size, grass content, and quicklime content—on three response variables: compressive strength, flexural strength, and water absorption rate. This approach also helps determine the optimal levels of these factors and facilitates predictive modeling and optimization of the mixture ratios. The conclusions are as follows:
- The effects of grass size, grass content, and quicklime content on compressive strength, flexural strength, and water absorption rate were studied through single-factor experiments. Based on these results, the influencing factors and levels for the response surface experiments were determined: the range of grass size is 1–3 mm, the range of grass content is 5–15 g, and the range of quicklime content is 27.5–47.5 g.
- A second-order polynomial regression equation was used to fit the experimental data, establishing a response surface model to describe the relationship between the three factors and the three response variables. RSM predicts that when the grass size, grass content, and quicklime content are 2.0 mm, 8.2 g, and 38 g, respectively, the compressive strength and flexural strength reach their maximum values. In contrast, the water absorption rate reaches its minimum, precisely 12.1 MPa, 2.18 MPa, and 21.52%. The optimized experimental values were 11.425 MPa, 2.145 MPa, and 21.89%, respectively. The experimental and predicted values differ by only 8%, indicating a good fit.
- The use of microstructural properties provides valuable insights into the characterization of materials. XRD analysis indicated that the primary component of alfalfa fiber is cellulose, which is hydrophilic and increases the water absorption rate of the composite material. This leads to the degradation of cellulose and results in poor stress transfer efficiency, subsequently decreasing the mechanical properties of the composite material. SEM experiments were conducted on well-performing specimens to analyze the internal structural characteristics of the composite material. The results showed that the grass material was not easily detected under microscopic observation, likely due to the better uniformity of the fiber material within the composite, which reduces pore volume. Additionally, the rough surface of the grass fibers facilitates better bonding with the matrix material, enhancing the density and strength of the composite.
Author Contributions
Conceptualization, J.M. and L.H.; methodology, J.M.; software, J.M.; validation, J.M.; formal analysis, J.M. and L.H.; investigation, Z.W. and J.H.; resources, J.M.; data curation, J.M.; writing—original draft preparation, J.M.; writing—review and editing, J.M.; visualization, J.M.; supervision, Z.W.; project administration, L.H.; funding acquisition, L.H. All authors have read and agreed to the published version of the manuscript.
Funding
Project of Support Programme for Young Talents in Colleges and Universities in Inner Mongolia Autonomous Region (NJYT22077); Project of Basic Research Operating Expenses of Colleges and Universities directly under Inner Mongolia Autonomous Region (JY20220058); Inner Mongolia Natural Science Foundation: Research on Weathering Mechanism and Efficiency Enhancement Structure of New Grass Brick Building Facades Based on Climate Adaptation in Inner Mongolia (2024MS05020).
Institutional Review Board Statement
Not applicable.
Informed Consent Statement
Not applicable.
Data Availability Statement
No new data were created or analyzed in this study.
Conflicts of Interest
The authors declare no conflicts of interest.
References
- Damtoft, J.S.; Lukasik, J.; Herfort, D.; Sorrentino, D.; Gartner, E.M. Sustainable development and climate change initiatives. Cem. Concr. Res. 2008, 38, 115–127. [Google Scholar] [CrossRef]
- Malhotra, V.J. Introduction: Sustainable development and concrete technology. Concr. Int. 2002, 24, 22. [Google Scholar]
- Pacheco-Torgal, F.; Castro-Gomes, J.; Jalali, S. Alkali-activated binders: A review. Part 2. About materials and binders manufacture. Constr. Build. Mater. 2008, 22, 1315–1322. [Google Scholar] [CrossRef]
- Palomo, A.; Grutzeck, M.; Blanco, M.J.C. Alkali-activated fly ashes: A cement for the future. Cem. Concr. Res. 1999, 29, 1323–1329. [Google Scholar] [CrossRef]
- Wang, S.-D.; Pu, X.-C.; Scrivener, K.; Pratt, P.J. Alkali-activated slag cement and concrete: A review of properties and problems. Cem. Concr. Res. 1995, 7, 93–102. [Google Scholar] [CrossRef]
- Collins, F.; Sanjayan, J.G. Workability and mechanical properties of alkali activated slag concrete. Cem. Concr. Res. 1999, 29, 455–458. [Google Scholar] [CrossRef]
- Yang, K.-H.; Song, J.-K.; Ashour, A.F.; Lee, E.-T. Properties of cementless mortars activated by sodium silicate. Constr. Build. Mater. 2008, 22, 1981–1989. [Google Scholar] [CrossRef]
- Oh, J.E.; Monteiro, P.J.; Jun, S.S.; Choi, S.; Clark, S.M. The evolution of strength and crystalline phases for alkali-activated ground blast furnace slag and fly ash-based geopolymers. Cem. Concr. Res. 2010, 40, 189–196. [Google Scholar] [CrossRef]
- Choi, J.-I.; Song, K.-I.; Song, J.-K.; Lee, B.Y. Composite properties of high-strength polyethylene fiber-reinforced cement and cementless composites. Constr. Build. Mater. 2016, 138, 116–121. [Google Scholar] [CrossRef]
- Lee, B.Y.; Cho, C.-G.; Lim, H.-J.; Song, J.-K.; Yang, K.-H.; Li, V.C. Strain hardening fiber reinforced alkali-activated mortar—A feasibility study. Cem. Concr. Compos. 2012, 37, 15–20. [Google Scholar] [CrossRef]
- Choi, J.-I.; Lee, B.Y.; Ranade, R.; Li, V.C.; Lee, Y. Ultra-high-ductile behavior of a polyethylene fiber-reinforced alkali-activated slag-based composite. Cem. Concr. Res. 2016, 70, 153–158. [Google Scholar] [CrossRef]
- Dias, D.P.; Thaumaturgo, C. Fracture toughness of geopolymeric concretes reinforced with basalt fibers. Cem. Concr. Compos. 2005, 27, 49–54. [Google Scholar] [CrossRef]
- Savastano, H., Jr.; Warden, P.G.; Coutts, R.S. Potential of alternative fibre cements as building materials for developing areas. Cem. Concr. Compos. 2003, 25, 585–592. [Google Scholar] [CrossRef]
- Nehdi, M.; Khan, A. Cementitious composites containing recycled tire rubber: An overview of engineering properties and potential applications. Cem. Concr. Compos. 2001, 23, 3–10. [Google Scholar] [CrossRef]
- Li, G.; Garrick, G.; Eggers, J.; Abadie, C.; Stubblefield, M.A.; Pang, S.-S. Waste tire fiber modified concrete. Compos. Part B. 2004, 35, 305–312. [Google Scholar] [CrossRef]
- Eldin, N.N.; Senouci, A.B. Measurement and prediction of the strength of rubberized concrete. Cem. Concr. Compos. 1994, 16, 287–298. [Google Scholar] [CrossRef]
- Poletanovic, B.; Dragas, J.; Ignjatovic, I.; Komljenovic, M.; Merta, I. Physical and mechanical properties of hemp fibre reinforced alkali-activated fly ash and fly ash/slag mortars. Constr. Build. Mater. 2020, 259, 119677. [Google Scholar] [CrossRef]
- Liu, Z.; Tisserat, B.H. Coating applications to natural fiber composites to improve their physical, surface and water absorption characters. Ind. Crops Prod. 2018, 112, 196–199. [Google Scholar] [CrossRef]
- Zhao, J.; Yao, Y.; Cui, Q.; Wang, X.-M. Optimization of processing variables and mechanical properties in rubber-wood particles reinforced cement based composites manufacturing technology. Constr. Build. Mater. 2013, 50, 193–201. [Google Scholar] [CrossRef]
- Coutts, R.S. A review of Australian research into natural fibre cement composites. Cem. Concr. Compos. 2005, 27, 518–526. [Google Scholar] [CrossRef]
- Toledo Filho, R.D.; Ghavami, K.; Sanjuán, M.A.; England, G.L. Free, restrained and drying shrinkage of cement mortar composites reinforced with vegetable fibres. Cem. Concr. Compos. 2005, 27, 537–546. [Google Scholar] [CrossRef]
- Tolêdo Filho, R.D.; Scrivener, K.; England, G.L.; Ghavami, K. Durability of alkali-sensitive sisal and coconut fibres in cement mortar composites. Cem. Concr. Compos. 2000, 22, 127–143. [Google Scholar] [CrossRef]
- de Almeida Melo Filho, J.; de Andrade Silva, F.; Toledo Filho, R.D. Degradation kinetics and aging mechanisms on sisal fiber cement composite systems. Cem. Concr. Compos. 2013, 40, 30–39. [Google Scholar] [CrossRef]
- Silva, F.d.A.; Filho, R.D.T.; Filho, J.d.A.M.; Fairbairn, E.d.M.R. Physical and mechanical properties of durable sisal fiber–cement composites. Constr. Build. Mater. 2010, 24, 777–785. [Google Scholar] [CrossRef]
- Jarabo, R.; Fuente, E.; Monte, M.; Savastano, H., Jr.; Mutjé, P.; Negro, C. Use of cellulose fibers from hemp core in fiber-cement production. Effect on flocculation, retention, drainage and product properties. Ind. Crops Prod. 2012, 39, 89–96. [Google Scholar] [CrossRef]
- Sedan, D.; Pagnoux, C.; Smith, A.; Chotard, T. Mechanical properties of hemp fibre reinforced cement: Influence of the fibre/matrix interaction. Cem. Concr. Compos. 2008, 28, 183–192. [Google Scholar] [CrossRef]
- Andiç-Çakir, Ö.; Sarikanat, M.; Tüfekçi, H.B.; Demirci, C.; Erdoğan, Ü.H. Physical and mechanical properties of randomly oriented coir fiber–cementitious composites. Compos. Part B 2014, 61, 49–54. [Google Scholar] [CrossRef]
- Asasutjarit, C.; Charoenvai, S.; Hirunlabh, J.; Khedari, J. Materials and mechanical properties of pretreated coir-based green composites. Compos. Part B 2009, 40, 633–637. [Google Scholar] [CrossRef]
- Li, Z.; Wang, L.; Wang, X. Flexural characteristics of coir fiber reinforced cementitious composites. Cem. Concr. Compos. 2006, 7, 286–294. [Google Scholar] [CrossRef]
- Ardanuy, M.; Claramunt, J.; García-Hortal, J.A.; Barra, M. Fiber-matrix interactions in cement mortar composites reinforced with cellulosic fibers. Cem. Concr. Compos. 2011, 18, 281–289. [Google Scholar] [CrossRef]
- Petrella, A.; Spasiano, D.; Liuzzi, S.; Ayr, U.; Cosma, P.; Rizzi, V.; Petrella, M.; Di Mundo, R. Use of cellulose fibers from wheat straw for sustainable cement mortars. J. Sustain. Cem. Based Mater. 2019, 8, 161–179. [Google Scholar] [CrossRef]
- Pachla, E.C.; Silva, D.B.; Stein, K.J.; Marangon, E.; Chong, W. Sustainable application of rice husk and rice straw in cellular concrete composites. Constr. Build. Mater. 2021, 283, 122770. [Google Scholar] [CrossRef]
- Millogo, Y.; Morel, J.-C.; Aubert, J.-E.; Ghavami, K. Experimental analysis of Pressed Adobe Blocks reinforced with Hibiscus cannabinus fibers. Constr. Build. Mater. 2014, 52, 71–78. [Google Scholar] [CrossRef]
- Li, Z.; Wang, L.; Wang, X. Compressive and flexural properties of hemp fiber reinforced concrete. Fibers Polym. 2004, 5, 187–197. [Google Scholar] [CrossRef]
- Reis, J.M.L. Fracture and flexural characterization of natural fiber-reinforced polymer concrete. Constr. Build. Mater. 2006, 20, 673–678. [Google Scholar] [CrossRef]
- Chin, S.C.; Shaaban, I.G.; Rizzuto, J.P.; Khan, S.U.; Mohamed, D.; Roslan, N.I.M.; Aziz, A.A. Predictive models for mechanical properties of hybrid fibres reinforced concrete containing bamboo and basalt fibres. Structures 2024, 61, 106093. [Google Scholar] [CrossRef]
- Feng, B.; Liu, J.; Lu, Z.; Zhang, M.; Tan, X. Study on properties and durability of alkali activated rice straw fibers cement composites. J. Build. Eng. 2023, 63, 105515. [Google Scholar] [CrossRef]
- Bentchikou, M.; Guidoum, A.; Scrivener, K.; Silhadi, K.; Hanini, S. Effect of recycled cellulose fibres on the properties of lightweight cement composite matrix. Constr. Build. Mater. 2012, 34, 451–456. [Google Scholar] [CrossRef]
- Soroushian, P.; Elzafraney, M.; Nossoni, A.; Chowdhury, H. Evaluation of normal-weight and light-weight fillers in extruded cellulose fiber cement products. Cem. Concr. Compos. 2006, 28, 69–76. [Google Scholar] [CrossRef]
- Wang, L.; Wang, H.; Yang, H.; Abdo, H. Compressive Toughness Loss Rate and Softening Characteristic Analysis of Pasture Fiber-Rubber Powder Concrete. Adv. Mater. Sci. Eng. 2022, 2022, 7028755. [Google Scholar] [CrossRef]
- GB/T 18046-2017; Ground Granulated Blast Furnace Slag Used for Cement, Mortar and Concrete. Standardization Administration of China: Beijing, China, 2017.
- JCT 621-1996; Lime Used in Silicate Building Products. Standardization Administration of China: Beijing, China, 1996.
- GB/T 14684-2011; Sand for Construction. Standardization Administration of China: Beijing, China, 2011.
- ASTM C33/C33M-18; Coarse and Fine Aggregates for Concrete Standard Specification. ASTM International: West Conshohocken, PA, USA, 2018.
- Kumar, R.; Singh, V.; Bansal, A.; Singla, A.K.; Singla, J.; Gupta, S.; Rajput, A.; Singh, J.; Khanna, N. Experimental research on the physical and mechanical properties of rice straw-rice straw ash composite materials. Int. J. Interact. Des. Manuf. 2024, 18, 721–731. [Google Scholar] [CrossRef]
- Königsberger, M.; Senk, V.; Lukacevic, M.; Wimmer, M.; Füssl, J. Micromechanics stiffness upscaling of plant fiber-reinforced composites. Compos. Part B Eng. 2024, 281, 111571. [Google Scholar] [CrossRef]
- Mochane, M.J.; Magagula, S.I.; Sefadi, J.S.; Mokhena, T.C. A Review on Green Composites Based on Natural Fiber-Reinforced Polybutylene Succinate (PBS). Polymers 2021, 13, 1200. [Google Scholar] [CrossRef] [PubMed]
- Imran, M.A.; Gowthaman, S.; Nakashima, K.; Kawasaki, S. The Influence of the Addition of Plant-Based Natural Fibers (Jute) on Biocemented Sand Using MICP Method. Materials 2020, 13, 4198. [Google Scholar] [CrossRef]
- Amiandamhen, S.O.; Meincken, M.; Tyhoda, L. Natural fibre modification and its influence on fibre-matrix interfacial properties in biocomposite materials. Polymers 2020, 21, 677–689. [Google Scholar] [CrossRef]
- Pickering, K.L.; Efendy, M.A.; Le, T.M. A review of recent developments in natural fibre composites and their mechanical performance. Compos. Part A Appl. Sci. Manuf. 2016, 83, 98–112. [Google Scholar] [CrossRef]
- Amin, M.N.; Ahmad, W.; Khan, K.; Ahmad, A. A Comprehensive Review of Types, Properties, Treatment Methods and Application of Plant Fibers in Construction and Building Materials. Materials 2022, 15, 4362. [Google Scholar] [CrossRef]
- Sever, K. The improvement of mechanical properties of jute fiber/LDPE composites by fiber surface treatment. Compos. Part A Appl. Sci. Manuf. 2010, 29, 1921–1929. [Google Scholar] [CrossRef]
- Zaman, H.U.; Khan, M.A.; Khan, R.A.; Arifur Rahman, M.; Das, L.R.; Al-Mamun, M. Role of potassium permanganate and urea on the improvement of the mechanical properties of jute polypropylene composites. J. Compos. Mater. 2010, 11, 455–463. [Google Scholar] [CrossRef]
- George, G.; Jose, E.T.; Jayanarayanan, K.; Nagarajan, E.R.; Skrifvars, M.; Joseph, K. Novel bio-commingled composites based on jute/polypropylene yarns: Effect of chemical treatments on the mechanical properties. Compos. Part A Appl. Sci. Manuf. 2012, 43, 219–230. [Google Scholar] [CrossRef]
- Godara, S. Effect of chemical modification of fiber surface on natural fiber composites: A review. Polymers 2019, 18, 3428–3434. [Google Scholar]
- Mittal, V.; Sinha, S. Study the effect of fiber loading and alkali treatment on the mechanical and water absorption properties of wheat straw fiber-reinforced epoxy composites. Sci. Eng. Compos. Mater 2017, 24, 731–738. [Google Scholar] [CrossRef]
- EN 1015-11:2019; Methods of Test for Mortar for Masonry—Part 11: Determination of Flexural and Compressive Strength of Hardened Mortar. European Committee for Standardization: Brussels, Belgium, 2019.
- Mlinárik, L.; Kopecskó, K.; Borosnyói, A. Properties of cement mortars in fresh and hardened condition infl uenced by combined application of SCMs. Epa. J. Silic. Based Compos. Mater. 2016, 68, 62–66. [Google Scholar] [CrossRef]
- EN 1015-18:2002; Methods of Test for Mortar for Masonry–Part 18: Determination of Water Absorption Coefficient Due to Capillary Action of Hardened Mortar. CEN: Brussels, Belgium, 2002.
- Awoyera, P.O.; Akinrinade, A.D.; de Sousa Galdino, A.G.; Althoey, F.; Kirgiz, M.S.; Tayeh, B.A. Thermal insulation and mechanical characteristics of cement mortar reinforced with mineral wool and rice straw fibers. J. Build. Eng. 2022, 53, 104568. [Google Scholar] [CrossRef]
- GB/T 50129-2011; Standard for Test Methods of Mechanical Properties of Ordinary Concrete. Standardization Administration of China: Beijing, China, 2011.
- Rahimipetroudi, I.; Rashid, K.; Yang, J.B.; Dong, S.K. Use of response surface methodology to optimize NOx emissions and efficiency of W-type regenerative radiant tube burner under plasma-assisted combustion. J. Clean. Prod. 2020, 244, 118626. [Google Scholar] [CrossRef]
- Mao, J.; Guanhua, N.; Yuhang, X.; Hui, W.; Zhao, L.; Zhenyang, W. Modeling and optimization of mechanical properties of drilling sealing materials based on response surface method. J. Clean. Prod. 2022, 377, 134452. [Google Scholar] [CrossRef]
- Tedesco, S.; Benyounis, K.Y.; Olabi, A.G. Mechanical pretreatment effects on macroalgae-derived biogas production in co-digestion with sludge in Ireland. Energy 2013, 61, 27–33. [Google Scholar] [CrossRef]
- Zainoodin, A.M.; Kamarudin, S.K.; Masdar, M.S.; Daud, W.R.W.; Mohamad, A.B.; Sahari, J. Optimization of a porous carbon nanofiber layer for the membrane electrode assembly in DMFC. Energy Convers. Manag. 2015, 101, 525–531. [Google Scholar] [CrossRef]
- Ren, Z.; Liu, Y.; Yuan, L.; Luan, C.; Wang, J.; Cheng, X.; Zhou, Z. Optimizing the content of nano-SiO2, nano-TiO2 and nano-CaCO3 in Portland cement paste by response surface methodology. J. Build. Eng. 2021, 35, 102073. [Google Scholar] [CrossRef]
- Adamu, M.; Ibrahim, Y.E.; Abdel Daiem, M.M.; Alanazi, H.; Elalaoui, O.; Ali, N.M. Optimization and Modelling the Mechanical Performance of Date Palm Fiber-Reinforced Concrete Incorporating Powdered Activation Carbon Using Response Surface Methodology. Materials 2023, 16, 2977. [Google Scholar] [CrossRef]
- Adamu, M.; Ibrahim, Y.E.; Alanazi, H. Evaluating the Influence of Elevated Temperature on Compressive Strength of Date-Palm-Fiber-Reinforced Concrete Using Response Surface Methodology. Materials 2022, 15, 8129. [Google Scholar] [CrossRef] [PubMed]
- Ebrahimzade, I.; Ebrahimi-Nik, M.; Rohani, A.; Tedesco, S. Higher energy conversion efficiency in anaerobic degradation of bioplastic by response surface methodology. J. Clean. Prod. 2021, 290, 125840. [Google Scholar] [CrossRef]
- Wang, Z.; Jia, Y.; Song, W.; Li, X.; Xu, K.; Wang, Z. Optimization of boron adsorption from desalinated seawater onto UiO-66-NH2/GO composite adsorbent using response surface methodology. J. Clean. Prod. 2021, 300, 126974. [Google Scholar] [CrossRef]
- Shaghaleh, H.; Xu, X.; Wang, S. Current progress in production of biopolymeric materials based on cellulose, cellulose nanofibers, and cellulose derivatives. RSC Adv. 2018, 8, 825–842. [Google Scholar] [CrossRef] [PubMed]
- McFarlane, H.E.; Döring, A.; Persson, S. The Cell Biology of Cellulose Synthesis. Annu. Rev. Plant Biol. 2014, 65, 69–94. [Google Scholar] [CrossRef] [PubMed]
- Ma, C.; Zhang, S.; Dong, R.; Wang, M.; Jia, W.; Lu, Z. Corn Stalk Fiber-Based Biomass Brick Reinforced by Compact Organic/Inorganic Calcification Composites. ACS Sustain. Chem. Eng. 2018, 6, 2086–2093. [Google Scholar] [CrossRef]
- Lisowski, A.; Matkowski, P.; Mieszkalski, L.; Mruk, R.; Stasiak, M.; Piątek, M.; Świętochowski, A.; Dąbrowska, M.; Obstawski, P.; Bakoń, T.; et al. Influence of Fraction Particle Size of Pure Straw and Blends of Straw with Calcium Carbonate or Cassava Starch on Pelletising Process and Pellet. Materials 2020, 13, 4623. [Google Scholar] [CrossRef]


Disclaimer/Publisher’s Note: The statements, opinions and data contained in all publications are solely those of the individual author(s) and contributor(s) and not of MDPI and/or the editor(s). MDPI and/or the editor(s) disclaim responsibility for any injury to people or property resulting from any ideas, methods, instructions or products referred to in the content. |
© 2024 by the authors. Licensee MDPI, Basel, Switzerland. This article is an open access article distributed under the terms and conditions of the Creative Commons Attribution (CC BY) license (https://creativecommons.org/licenses/by/4.0/).