Abstract
The n-type semiconductor SnO2 with a wide band gap (3.6 eV) is massively used in gas-sensitive materials, but pure SnO2 still suffers from a high operating temperature, low response, and tardy responding speed. To solve these problems, we prepared small-sized pure SnO2 using hydrothermal and freeze-drying methods (SnO2-FD) and compared it with SnO2 prepared using a normal drying method (SnO2-AD). The sensor of SnO2-FD had an ultra-high sensitivity to NO2 at 100 °C with excellent selectivity and humidity stability. The outstanding gas sensing properties are attributed to the modulation of energy band structure and the increased carrier concentration, making it more accessible for electron exchange with NO2. The excellent gas sensing properties of SnO2-FD indicate its tremendous potential as a NO2 sensor.
1. Introduction
With the development of industry, global environmental pollution has become increasingly serious, and the World Health Organization (WHO) considers nitrogen dioxide (NO2) to be a serious pollutant [1]. NO2 is a significant source of global warming, haze, acid rain, and photochemical smog [2]. Moreover, NO2 has an impact on vegetation and crops by affecting plant growth efficiency and reducing crop yields [3]. On the other hand, NO2 is hazardous to human health, and high levels of NO2 inhalation can cause severe health risks such as pulmonary edema, breathing difficulties, and bronchospasm [4]. Long-term exposure to NO2 increases the risk of high blood pressure [4]. According to statistical analyses, each 10 μg/m3 increase in NO2 exposure increases all-cause mortality by 2%, acute lower respiratory disease by 6%, and chronic obstructive pulmonary illness by 3% [1,5,6]. Therefore, the development of sensors responding to low concentrations of NO2 is urgently demanded for improving the air environment and protecting human health.
Currently, the most common gas sensors are electrochemical sensors [7,8], solid electrolyte sensors [9], optical sensors [10,11], and semiconductor sensors [12,13]. Semiconductor sensors are widely used in the detection of toxic and hazardous gases owing to their low cost, high sensitivity, and good stability [14]. However, semiconductor sensors still have problems such as poor selectivity, high operating temperature, etc., which hampers their actual applications.
As a typical n-type metal oxide, SnO2 has excellent physical and chemical stability, with a low cost and non-toxic characteristics, which makes it widely used in gas sensors [15]. In recent decades, researchers have been devoted to tackling the aforementioned problems via multiple approaches for metal oxide semiconductor (MOS) sensors, including geometric structure modification [16], elemental doping [17], heterostructure construction [18,19], and noble metal loading [20]. Huang et al. prepared nanoflower-like Au/SnS2/SnO2 heterojunctions using a solvothermal method and in situ decoration. The response value to 8 ppm NO2 was 22.3 at 80 °C. These good gas-sensitizing properties were attributed to the formation of heterojunctions and the formation of more S vacancies, promoting more gas adsorption on the material surface [21]. Mnrugesh et al. synthesized p-Co3O4/n-SnO2 heterojunctions using a hydrothermal method. The prepared 10% Co3O4/SnO2 had a response of 88% at 150 °C for 100 ppm NO2 with good selectivity. The enhancement of the sensing properties was attributed to the formation of a potential barrier at the Co3O4/SnO2 heterointerface, the high specific surface area, and the increase in oxygen vacancy content [22].
Unfortunately, disadvantages still exist with the above modification strategies. Doping inhomogeneous elements into the MOS matrix will change the original crystal structure and increase surface defects [23]. The construction of heterojunctions via exogenous MOS or noble metals will increase the interfacial potential barrier, thereby increasing the baseline resistance and power consumption as well [24,25,26]. All of the above methods require the introduction of other elements into the MOS matrix, which increases the preparation cost and makes the production process more cumbersome. Moreover, freeze-drying treatment does not form a gas–liquid interface during the whole process, and the capillary force does not cause structural collapse. During the freeze-drying process, the material is first cooled below its freezing point, where the moisture in it freezes to form ice crystals. The formation and growth of ice crystals exert physical stresses on the surrounding material [27,28]. For semiconductor materials, this stress can lead to lattice distortions, which can introduce defects such as point defects, dislocations, and other defects, which, in turn, affect the electronic properties of the material. And the introduction of these defects can introduce new energy levels in the forbidden bands of semiconductors as trap energy levels or composite centers [29,30]. Hitherto, fewer studies have been reported on pristine MOS-based material sensors through freeze-drying treatments.
In this work, SnO2 nanoparticles were prepared using both a hydrothermal method and the following freeze-drying treatments. The results showed that the response value of SnO2-FD (886.2) to 10 ppm NO2 at 100 °C was 17 times higher than that of SnO2-AD (52.5), with a shorter response recovery time (74/27 s) and a low detection limit (1.69 ppb). The effect of the drying method on their gas-sensitizing properties was systematically investigated. The small particle size of the nanoparticles allowed a larger area to be in full contact with the target gas, which provided more active sites for gas adsorption. The enhanced performance is also attributed to the increase in adsorbed oxygen and the improvement of electronic structure. Therefore, this study paves novel ways for developing high-performance MOS-based sensors.
2. Experimental Section
2.1. Chemicals
Tin tetrachloride pentahydrate (SnCl4·5H2O, 99.0%), urea (CO(NH2)2, 99.5%), and ammonia solution (NH3, 25.0 ~ 28.0%) were purchased from Sinopharm Chemical Co., Ltd (Shanghai, China) and were used without further purification. Deionized water (DI) and absolute ethanol (C2H5OH, 99.7%) were also used in this work.
2.2. Synthesis of SnO2 Nanoparticles
SnO2 nanoparticles were synthesized using a facile hydrothermal method. In total, 2.35 mmol SnCl4·5H2O and 10.8 mmol urea were dissolved in a mixed solvent with a volume of 17.2 mL deionized water and 2 mL absolute ethanol with 15 min magnetic stirring. Then, 2 mL ammonia was added to the above solution. After another 15 min of magnetic stirring, the mixture was transferred into a 100 mL Teflon-lined stainless-steel autoclave and was maintained at 200 °C for 14 h. The white products were collected and washed with deionized water and absolute ethanol. Two drying methods were employed to remove solvents. One involved drying the products obtained via centrifugation at 80 °C. The other involved rapidly pre-freezing the products in liquid nitrogen after aging them in deionized water for 1 day to improve the stability of the samples and to form a more homogeneous ice crystal structure. And then, the samples were further freeze-dried at −50 °C for 2 days. The white powders obtained using the two methods were calcined at 500 °C for 2 h and were, respectively, named SnO2-AD and SnO2-FD.
2.3. Material Characterizations
The crystal structure of the samples was analyzed by X-ray diffraction analysis (XRD, DMAX-2500 PC, Tokyo, Japan) with Cu-Kα (λ = 1.5418 Å) from 10° to 90° with a scanning speed of 10°/min. The chemical compositions and the valence state of elements were characterized via an X-ray photoelectron spectrometer (XPS, AXIS Supra, Manchester, UK) with Al-Kα (hν = 1486.6 eV). The binding energy was calibrated using C 1s peaks at 284.8 eV. The morphology and microstructure of the samples were investigated by scanning electron microscope (SEM SU-70, Tokyo, Japan). The specific surface areas and pore size assignment of the samples were tested by a full-automatic specific surface and porosity analyzer (TriStar II 3flex, Micromeritics, Norcross, GA, USA) and separately calculated through Brunauer–Emmett–Teller (BET) and Barrett–Joiner–Halenda (BJH) methods. The electrical properties and carrier concentrations of the samples were measured by Hall Effect Measurement (HSM-5000, Seoul, Republic of Korea). The UV-vis spectra and band gaps of the samples were characterized via UV-vis diffuse reflection spectrum (Uv3600plus Shimadzu, Kyoto, Japan). The molecular structure of samples was analyzed by Raman spectroscopy (Thermo DXR2xi, Waltham, MA, USA) with a 1064 nm laser excitation.
2.4. Gas Sensing Performance Test
The gas sensors were fabricated using the prepared SnO2 materials. First, the prepared samples were dispersed in deionized water with a mass of 1:5 and thoroughly ground in a mortar to form a homogeneous paste. The paste was applied to an Al2O3 substrate with four electrodes printed on it and dried at 80 °C. This process was repeated five times to form a homogeneous sensitive film and heated in air for 10 h at 80 °C. Then, the substrates coated with the sensing layer were soldered to the pedestal and aged for one week at 3 V to ensure their stability. The gas sensing properties were measured with a WS-30B gas sensitivity instrument (Zhengzhou Winsen Electronics Co., Ltd., Zhengzhou, China). The target gases were injected into the test chamber via a syringe. Built-in fans in the test chamber rotated to bring the target gas into rapid and full contact with the sensor. Ra and Rg represent the stable resistance of the sensing material in air and after exposure to the target gas, respectively. The response value (S) is denoted by S = Rg/Ra for oxidizing gases and S = Ra/Rg for reducing gases. Response and recovery time are recorded as 90% time of total resistance changes in responding/recovering processes.
3. Results and Discussion
3.1. Characterizations
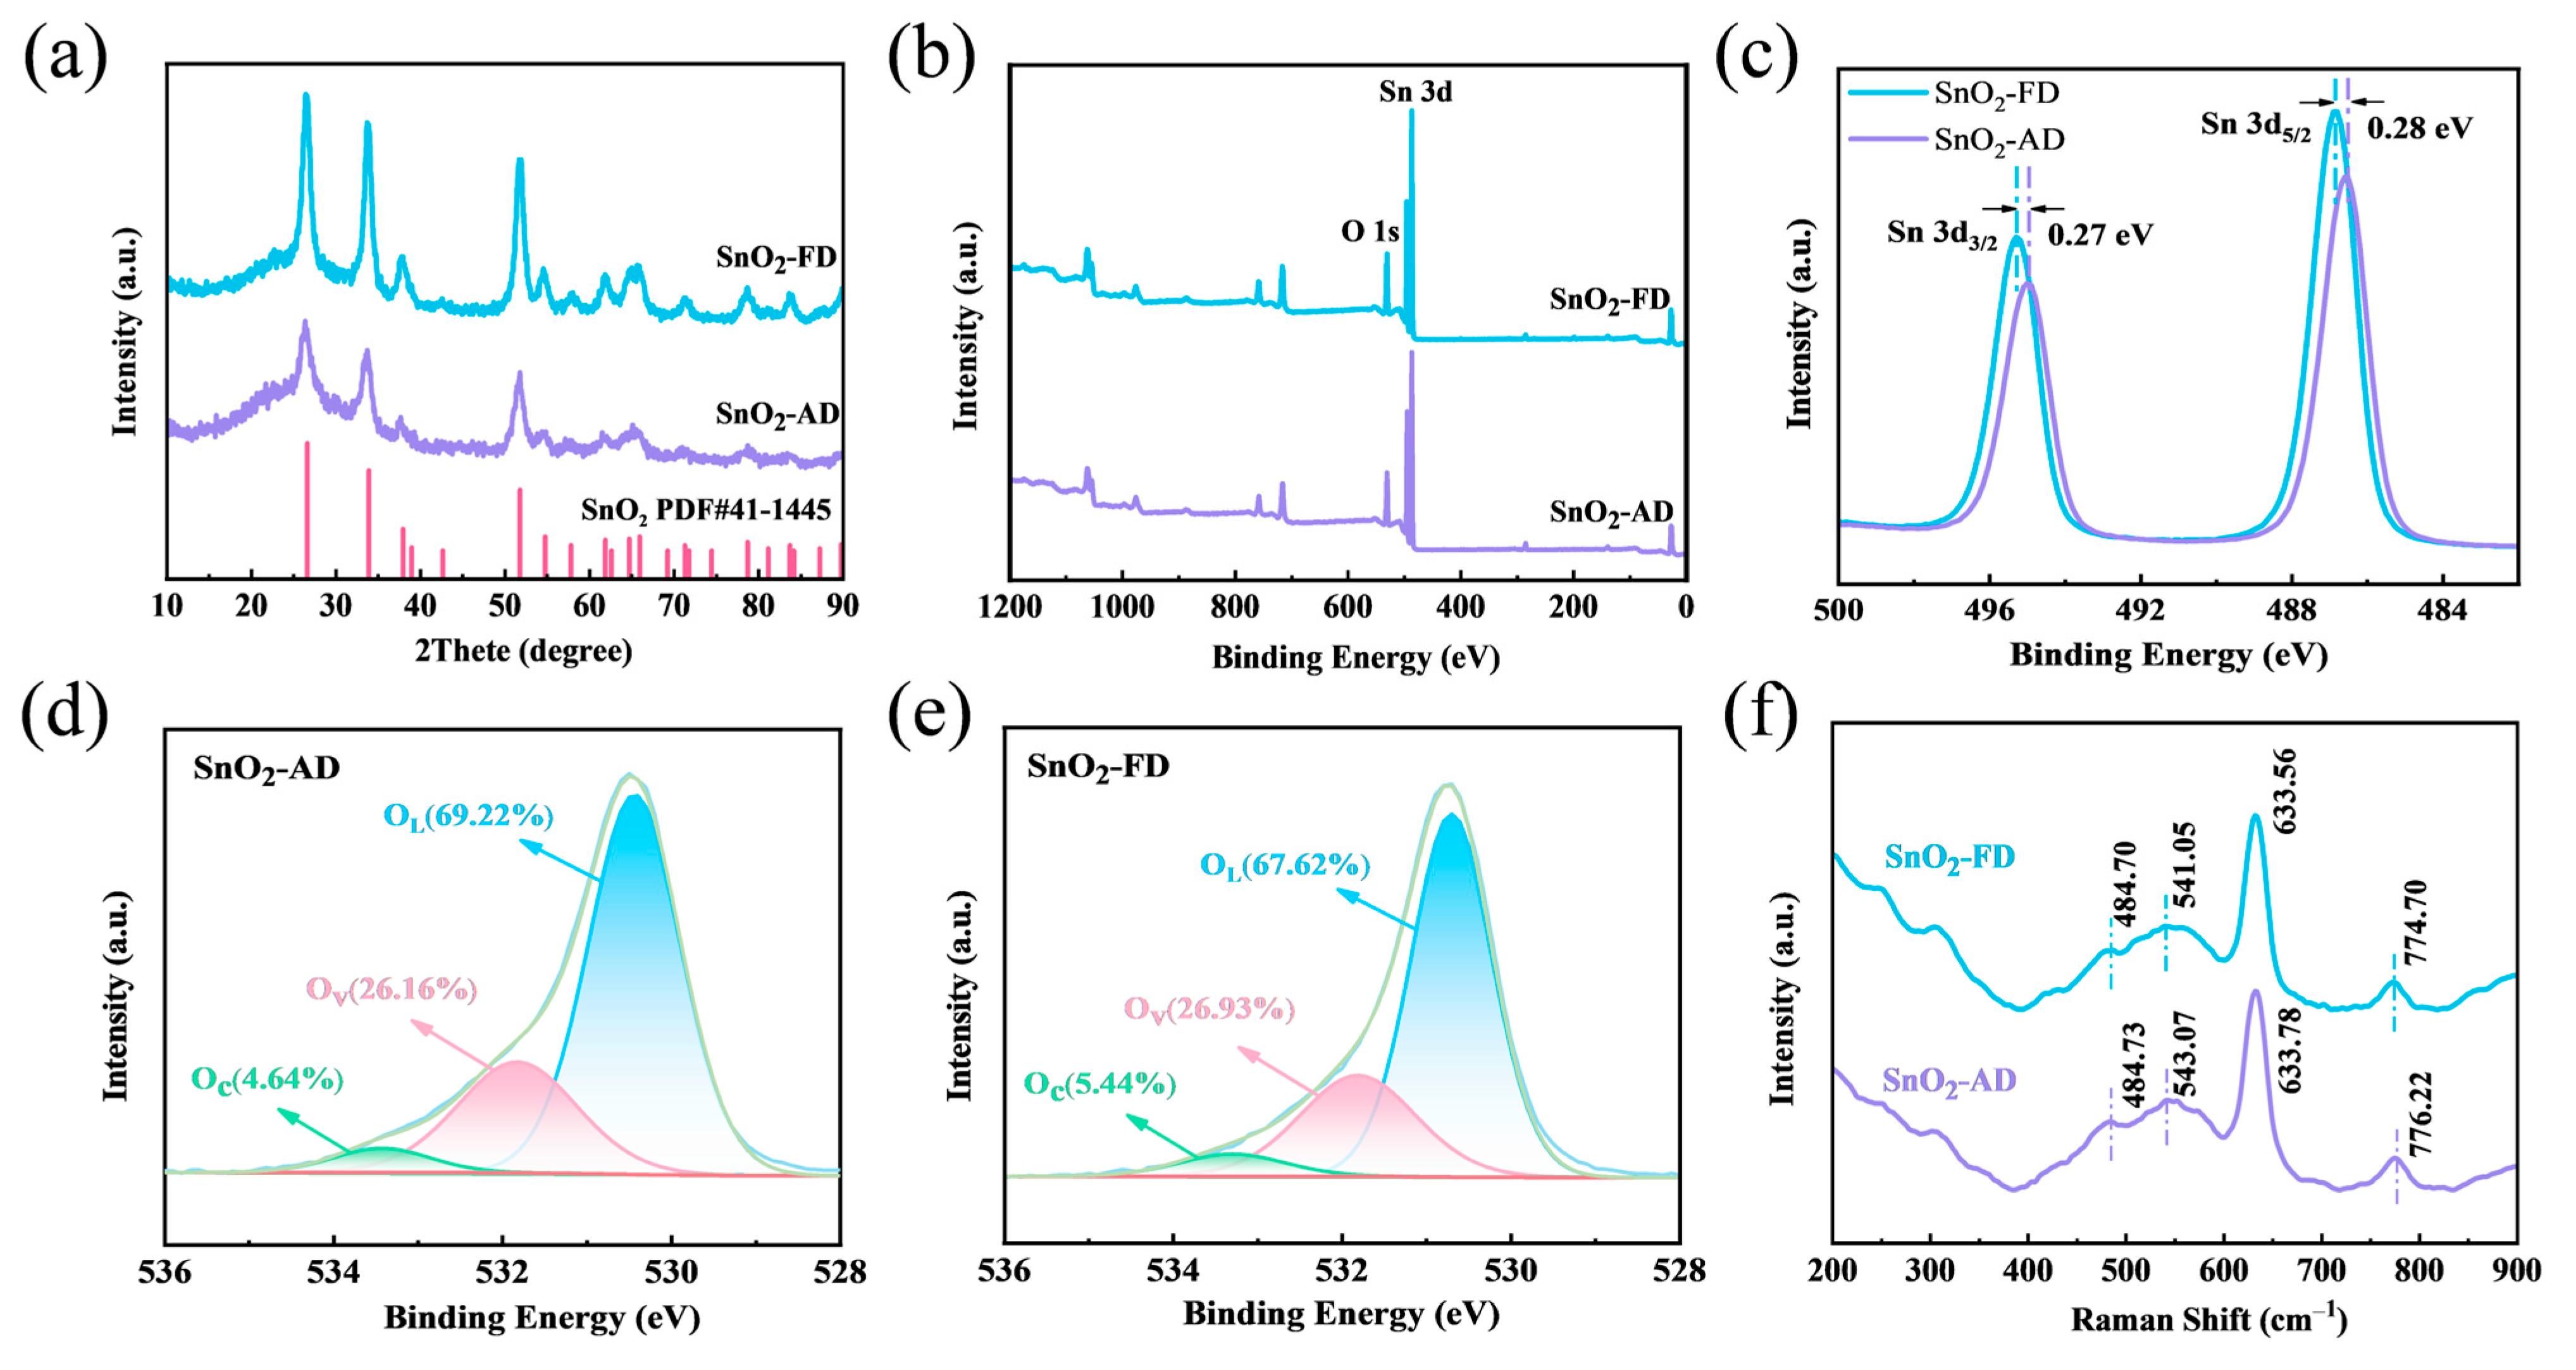
The crystal structure of SnO2 was measured by XRD as shown in Figure 1a. All diffraction peaks of SnO2-AD and SnO2-FD are in accordance with the tetragonal structure of SnO2 (JCPDS 41-1445). No other diffraction peaks appeared in the pattern, proving that the synthesized samples did not contain any other material phases. It can be observed that the SnO2-FD diffraction peaks are of higher intensity, indicating superior crystallinity compared to SnO2-AD [31]. Increased crystallinity means fewer grain boundaries, which are the scattering centers of carriers since the arrangement of atoms on the grain boundaries is different from that inside the grains [32]. On the other hand, grain boundaries are commonly accompanied by localized stresses and strains [33]. Therefore, the reduction in grain boundaries reduces carrier trapping and scattering at grain boundaries, thus improving carrier mobility of SnO2-FD [34]. The prepared SnO2 grain sizes can be approximately calculated using the Debye–Scherrer equation as indicated in Equation (1) [35]:
where λ is the wavelength of the radiation (1.5418 Å), β is the half-height width of the peak, and θ is the Bragg diffraction angle. The average grain sizes are 10.3 and 9.0 nm, corresponding to SnO2-AD and SnO2-FD samples. SnO2-FD has a smaller grain size, and its grain size is close to twice the Debye length of SnO2 (3 nm) [36]. As we know, when the grain size of aerogels is nearly twice the Debye length, the size of the grains affects their electrical conductivity, that is, they are more likely to be activated for some nanometer effects [37]. Therefore, the depletion layer accounts for a large proportion of the particle volume, which is more favorable for exposing the SnO2 active surface and thus exchanging electrons with the target gas. Thereby, the response value and the response/recovery speed of SnO2-FD can be improved [38].

Figure 1.
(a) XRD spectra of SnO2 samples. (b) XPS full-survey spectra and (c) Sn 3d XPS spectra of SnO2 samples. O 1s XPS spectra of (d) SnO2-AD and (e) SnO2-FD. (f) Raman spectra of SnO2 samples.
The chemical compositions and the valence state of elements were characterized via XPS. As shown in Figure 1b, the Sn and O elements are identified in the wide spectrum. The Sn 3d XPS spectrum of SnO2 is shown in Figure 1c, the two peaks at 486.52 eV and 495.03 eV corresponding to SnO2-AD are Sn 3d5/2 and Sn 3d3/2, respectively [39]. It can be observed that the Sn 3d5/2 and Sn 3d3/2 peaks of SnO2-FD are, respectively, shifted by 0.28 eV and 0.27 eV toward the high binding energy. Previous studies have shown that the total charge of an atom has a close influence on the chemical shifts of the peaks of the energy spectrum [40]. The SnO2-FD binding energy displays a redshift, indicating that more electrons are captured by the O2 molecules in air, resulting in a lower density of nearby electron clouds and an increase in the binding energy [41]. Figure 1d, e shows the O 1s XPS spectra. The peaks of SnO2-AD located at ca. 530.4, 531.8, and 533.4 eV correspond to lattice oxygen (OL), oxygen vacancy (Ov), and adsorbed oxygen (Oc), respectively [24,42]. It can be noted that the Oc and Ov contents of SnO2-FD are higher than those of SnO2-AD. The presence of Ov can supply more electrons and promote the formation of adsorbed oxygen ions [43,44]. On the other hand, Ov disrupts the metal oxide integrity and provides more active sites for target gas adsorptions and gas-sensitization reactions [45,46,47]. In particular, the increase in Oc may promote an alternative gas-sensitive reaction pathway for NO2 at the material surface [48,49,50].
The crystallography and structural features of SnO2-AD and SnO2-FD were investigated via a Raman system as shown in Figure 1f. The SnO2 lattice typically generates the following major vibrational modes [51]:
where A1g, B1g, B2g, Eg are Raman active modes, A2u and Eu are infrared active modes, A2g and B1u are inactive modes. The peak at around 633 cm−1 is assigned to the symmetric O-Sn-O vibration (A1g). The broadening of the A1g peak of SnO2-FD indicates a reduction in its grain size [52]. The Raman peak at around 484 cm−1 corresponds to the shear vibration of the oxide (Eg) [53]. And the Raman peak at around 776 cm−1 is due to the asymmetric O-Sn-O stretching (B2g) [54]. The Raman peaks of SnO2-FD all showed different degrees of blue shift, which might be caused by the increased content of oxygen vacancies [52]. The appearance of these Raman peaks indicates the tetragonal structure of SnO2. The peaks near 249 and 306 cm−1 are inactive Raman modes, which can be attributed to localized structural disturbances [55]. The enhancement of their strength is possibly due to structural defects introduced during the freeze-drying process.
Γ = A1g + A2g + B1g + B2g + Eg + A2u + 2B1u + 3Eu
The morphology and microstructure of the samples were investigated by SEM as shown in Figure 2. It can be seen that both SnO2-AD and SnO2-FD are homogeneous nanospheres. It is indicated that the two drying methods have no significant effect on their morphology. The diameters of the SnO2 nanospheres are all approximately 10 nm, corresponding to the XRD results. This suggests that each SnO2 nanosphere is composed of a single crystal [56]. Moreover, such a small particle size gives them a larger specific surface area for full contact with the target gas [57]. The presence of abundant pore structures between the nanospheres further facilitates target gas diffusion.

Figure 2.
SEM images of (a,b) SnO2-AD samples and (c,d) SnO2-FD samples.
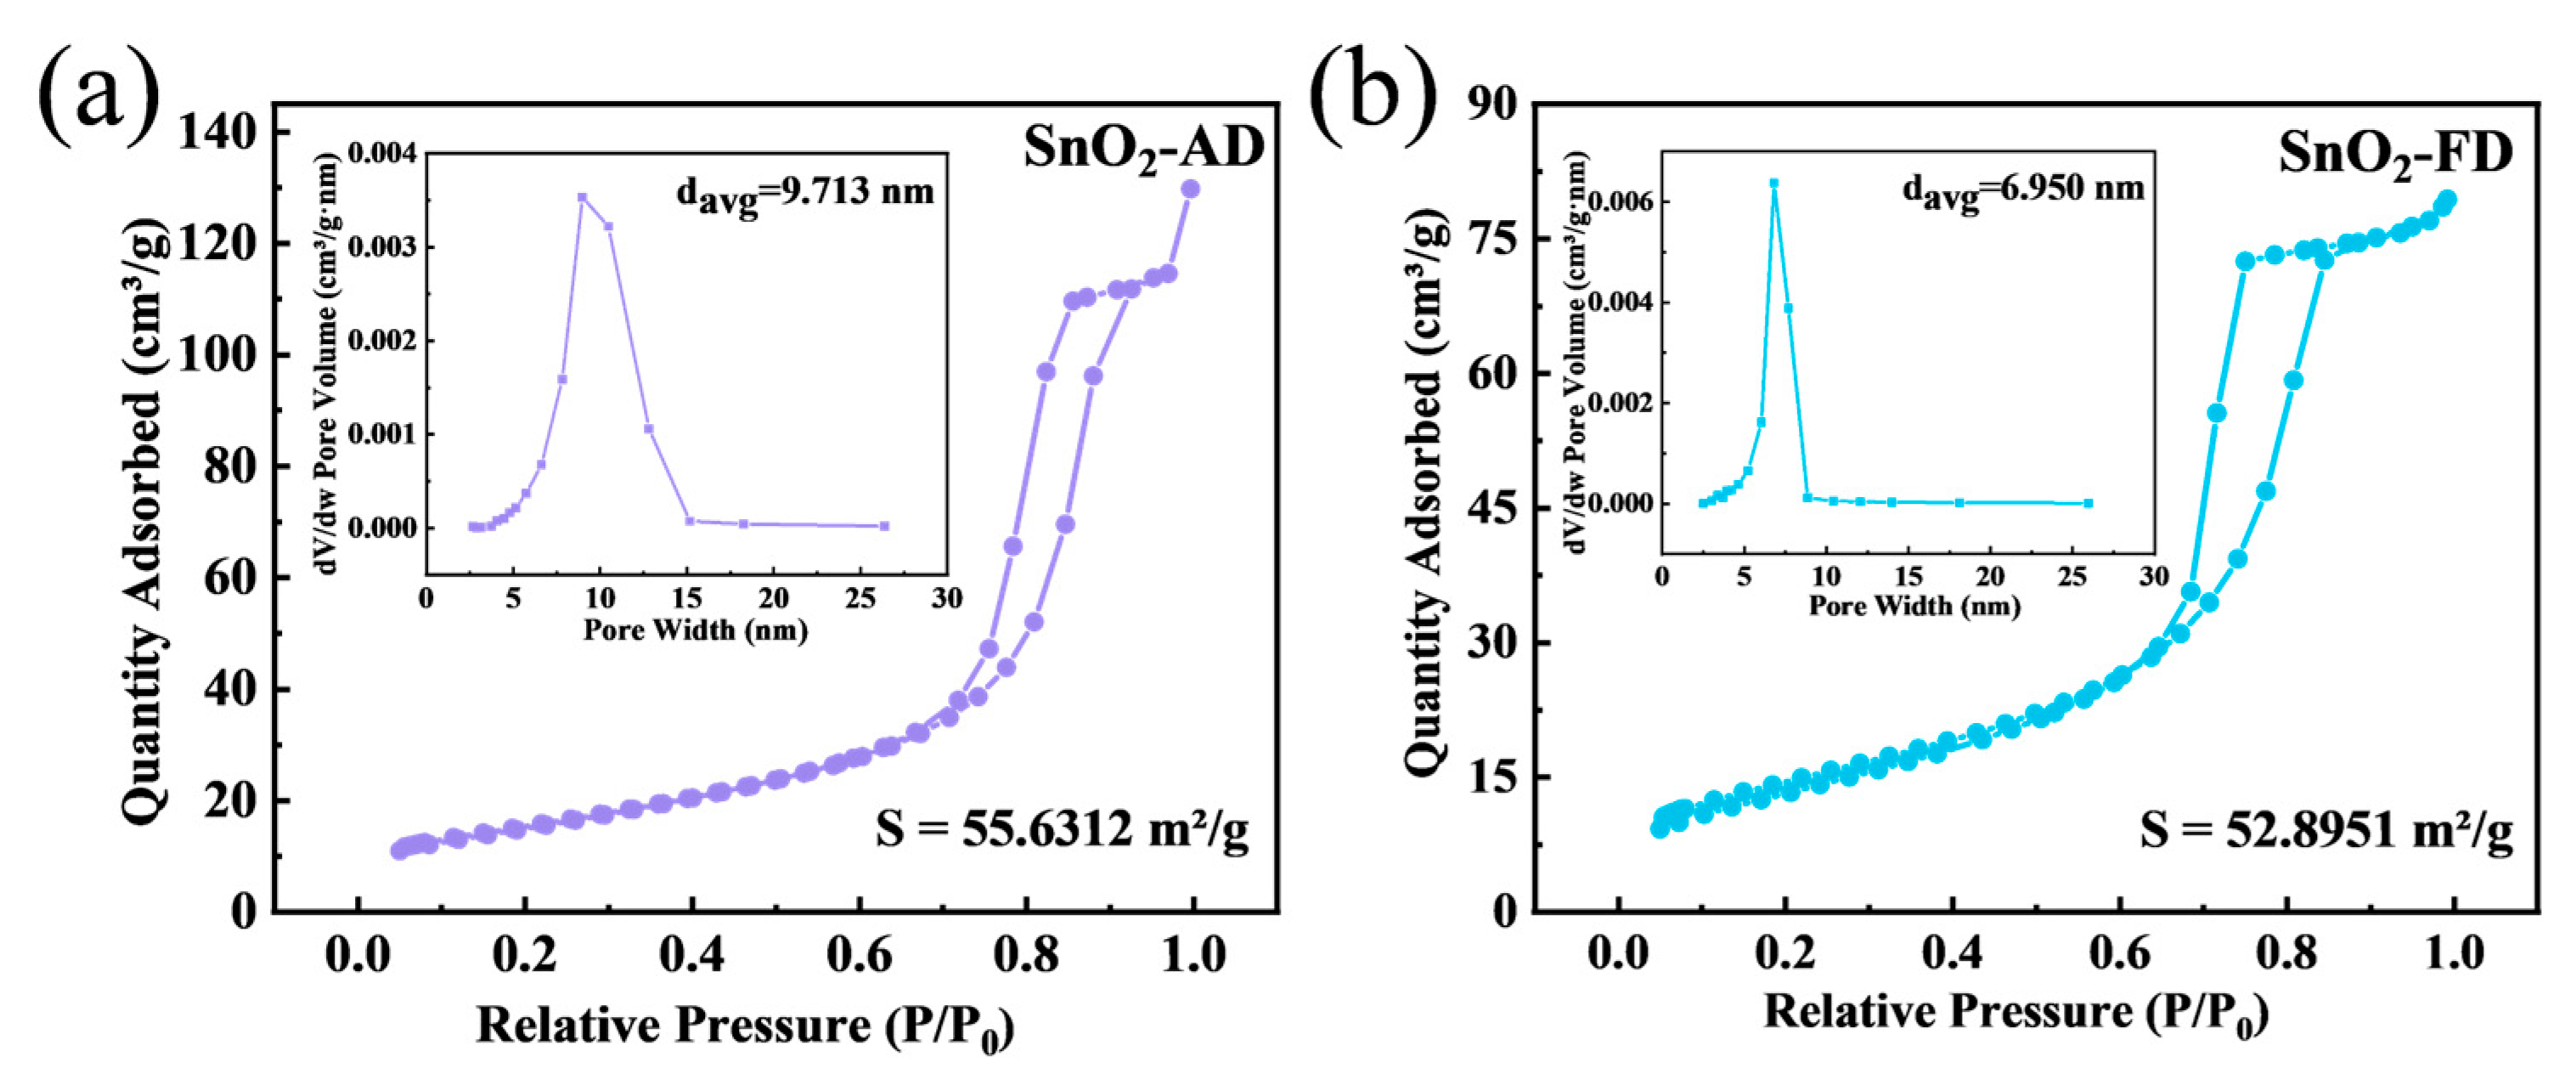
To further analyze the specific surface area and pore size distribution of SnO2, N2 adsorption–desorption tests were performed as shown in Figure 3. The N2 adsorption–desorption isotherms of both SnO2-FD and SnO2-AD are of type IV mode with the type H2(b) hysteresis loop, indicating that both of them have mesoporous structures with similar hierarchical structures [58]. The specific surface areas of SnO2-AD and SnO2-FD are ca. 55.63 and 52.90 m2/g, respectively. The larger specific surface areas are attributed to the small particle size of SnO2 nanoparticles. This large specific surface area supplies more active sites for the adsorption of the target gas, which is positive for the surface of the gas-sensitive reaction, thus shortening the response/recovery time of the sensors and enhancing the response value [59,60]. As displayed in BJH measurement, the average pore sizes of SnO2-AD and SnO2-FD were calculated as ca. 9.71 and 6.95 nm, respectively. The smaller pore size of SnO2-FD indicates the presence of smaller primary particles formed, tightly aggregating to form smaller mesopores [61]. The pore size of the mesopore facilitates the adsorption and desorption of the target gas, thus effectively enhancing the gas sensing performance of SnO2 [62,63].

Figure 3.
N2 adsorption–desorption isotherms and BJH pore size distributions (inset) of (a) SnO2-AD and (b) SnO2-FD.
3.2. Gas Sensing Performance
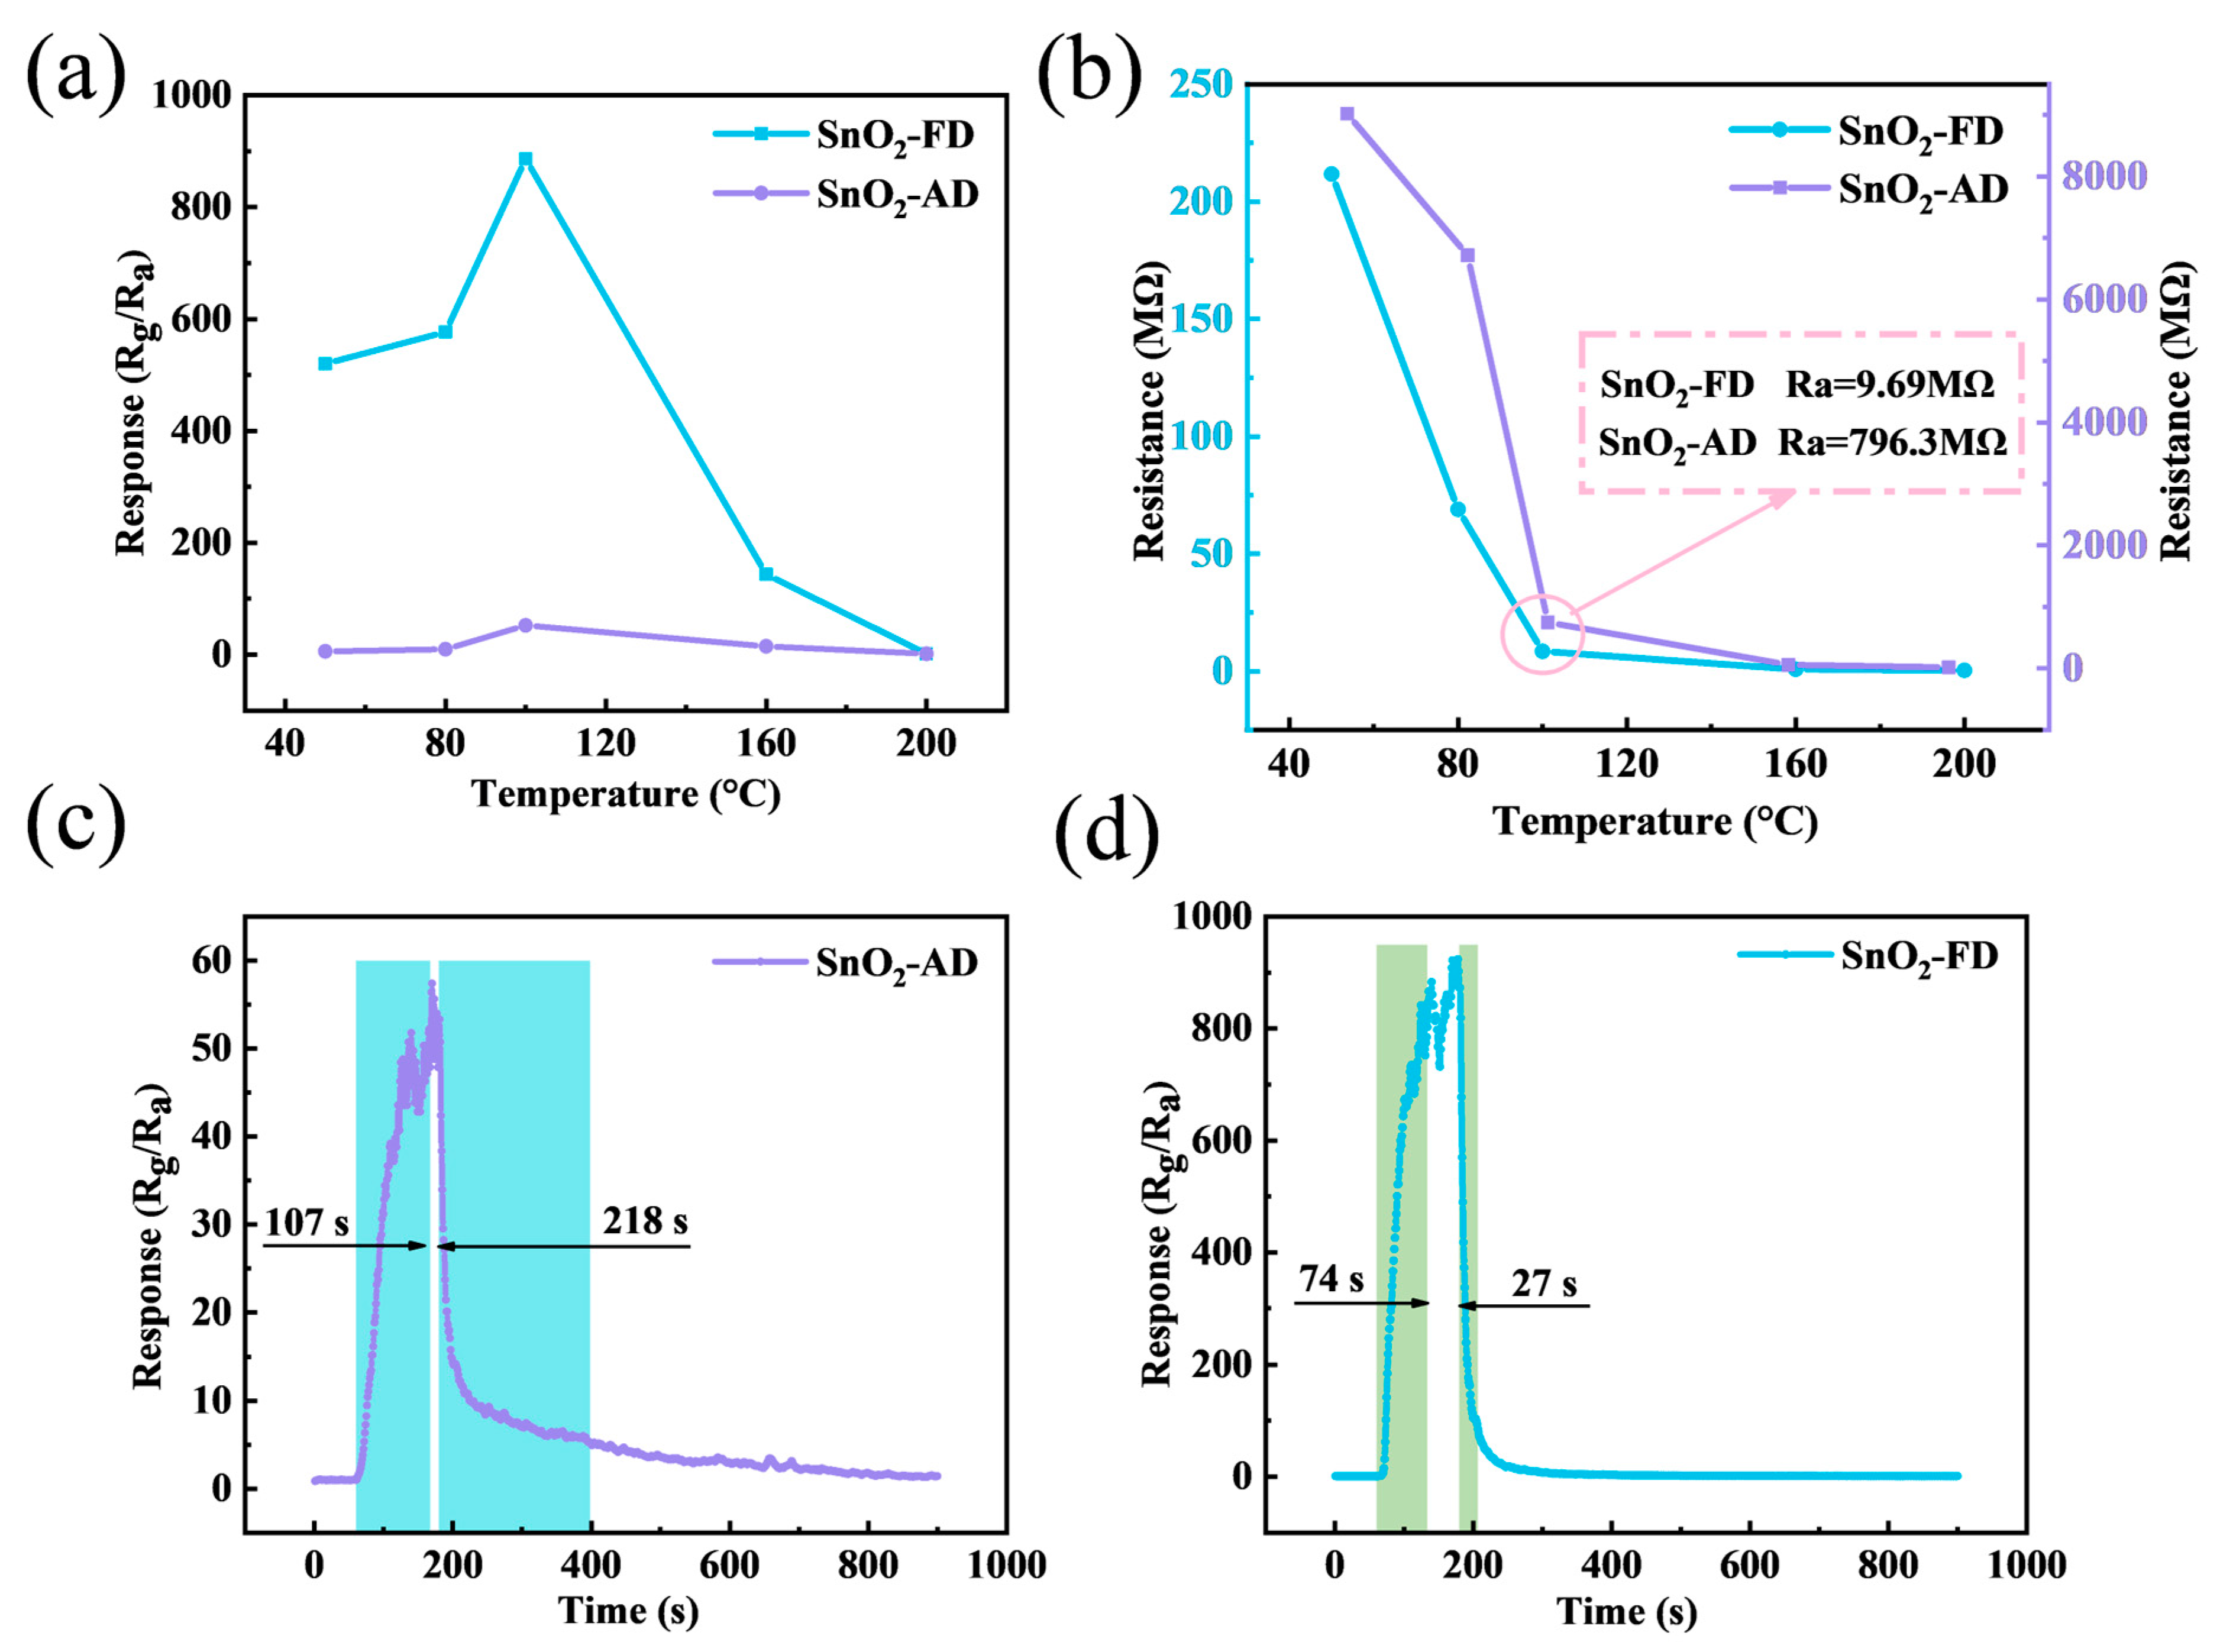
The NO2 sensing characteristics of SnO2 sensors were investigated. The optimal operating temperature is an important indicator for evaluating the performance of gas sensors. Figure 4a shows the response of SnO2 sensors to 10 ppm NO2 under different operation temperatures. The response values of both SnO2-FD and SnO2-AD increase with increasing temperature and decrease after reaching a maximum at 100 °C. The reason is that the lack of thermal energy leads to gas adsorption that is weak or insufficient to overcome the energy barrier for gas-sensitive reactions at low temperatures, while the gas desorption rate is too fast for gas-sensitive reactions to occur at higher temperatures [64,65]. The response value of SnO2-FD (886.2) to 10 ppm NO2 at 100 °C is about 17 times higher than that of SnO2-AD (52.5).

Figure 4.
(a) The response of SnO2 sensors to 10 ppm NO2 under different operation temperatures. (b) The resistance of SnO2 sensors at various operation temperatures. The response/recovery curves of (c) SnO2-AD and (d) SnO2-FD sensors to 10 ppm NO2 at 100 °C.
Figure 4b illustrates the baseline resistance variation of SnO2-FD and SnO2-AD at various temperatures, and it can be observed that the baseline resistance of the SnO2 samples decreases with increasing temperature, exhibiting typical semiconductor characteristics [66]. Interestingly, the baseline resistance of SnO2-AD is about two magnitudes higher than that of SnO2-FD at the respective temperatures. This may be due to differences in carrier concentration. SnO2-FD has a higher concentration of carriers and therefore has a higher conductivity leading to a lower baseline resistance [67]. On the other hand, as an n-type semiconductor, the response value (S) of SnO2 to the oxidizing gas NO2 is defined by the ratio of the stabilized resistance (Rg) exposed to NO2 to the baseline resistance (Ra) in air. A small baseline resistance causes a more significant change in resistance, resulting in a larger response value [68,69]. The response/recovery curves of SnO2-AD and SnO2-FD sensors to 10 ppm NO2 at 100 °C are shown in Figure 4c,d. The response/recovery times of SnO2-FD are all shorter than those of SnO2-AD. In particular, the recovery time of SnO2-FD is 27 s profoundly lower than that of SnO2-AD (218 s), which is due to the increased porosity and the small particle size of SnO2-FD that promotes gas diffusion. To avoid errors due to serendipity, we performed two repetitive response recovery tests for SnO2-FD and SnO2-AD, respectively. As shown in Figure S1, the response/recovery times of SnO2-AD were 83/244 s and 96/202 s, whereas the response/recovery times of SnO2-FD were 71/43 s and 85/25 s, respectively. This indicates a significant improvement in the adsorption/desorption kinetics of SnO2-FD.
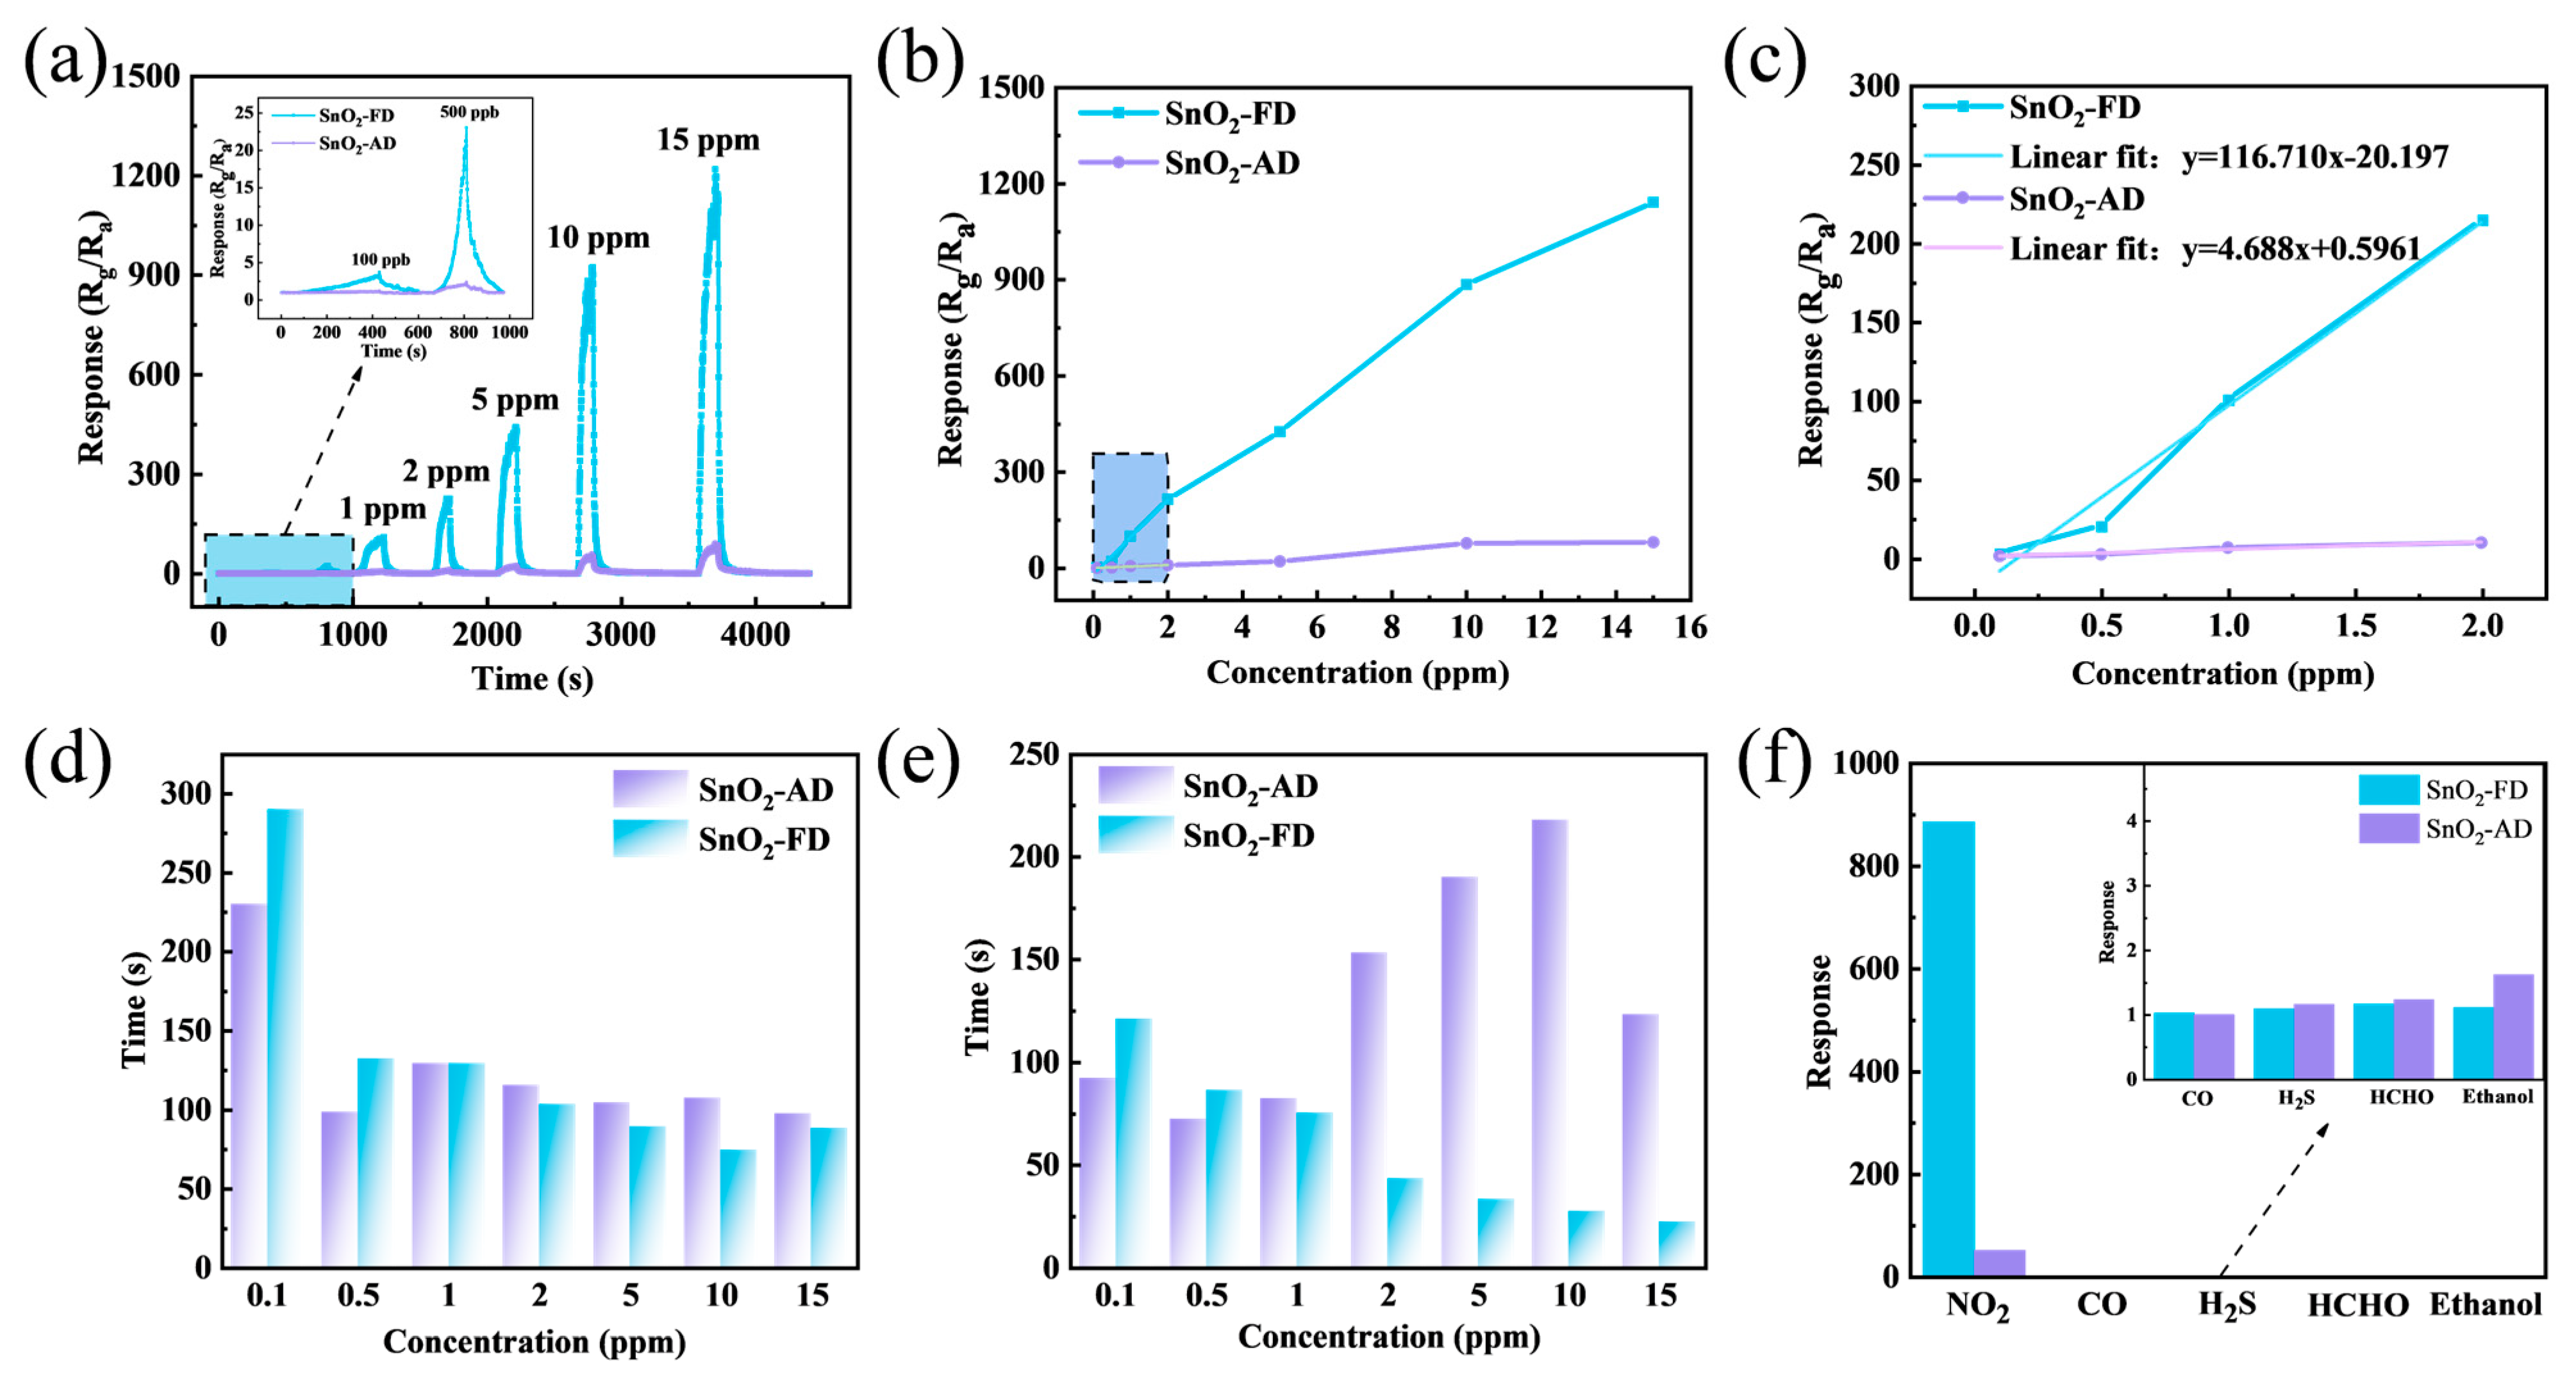
The dynamic response curves of SnO2 sensors toward 0.1–15 ppm NO2 at 100 °C are shown in Figure 5a. The response values of SnO2-AD and SnO2-FD increase continuously with increasing NO2 concentration, and the response value of SnO2-FD is much higher than that of SnO2-AD over the entire concentration range. It can be observed that there is still a significant response of SnO2-FD to 100 ppb NO2. Figure 5b records the response of SnO2 sensors toward different concentrations of NO2 at 100 °C. The response value of the sensor is basically linear with NO2 concentration, indicating its potential capability of quantitative NO2 detection. Figure 5c is a magnified image of the NO2 concentration in the range of 0.1–2 ppm in Figure 5b. As can be seen from Figure 5c, the SnO2-AD sensor response values are all below 10 when the NO2 concentration is less than 2 ppm, whereas the SnO2-FD sensor still has a high response value toward a low concentration of NO2, which is still as high as 214.9 at 2 ppm. A linear fit is performed for the response values versus the concentration of NO2 in this range. The slope of SnO2-FD (116.7) is 25 times higher than the slope of SnO2-AD (4.7), indicating that the presence of a trace amount of NO2 can cause a variation in the response value. Moreover, the regression value (R2) of SnO2-FD reached 0.975, indicating a favorable linearity, which is capable of providing accurate concentration measurements. Furthermore, the good linearity simplifies data analysis [70]. We can calculate the actual gas concentration from the response value of the sensor output by the known linear equation fitted [59,71]. The detection limit (LOD) of the sensor is predicted by Equation (3) [72]:
where rms is the root mean square deviation of the baseline resistance and slope is the slope of the fitted line. The LOD of SnO2-AD is 127.53 ppb, and that of SnO2-FD is 1.69 ppb NO2. And the regression value (R2) of SnO2-FD amounts to 0.975, indicating a high reliability in practical applications.

Figure 5.
(a) Dynamic response curves of SnO2 sensors toward 0.1–15 ppm NO2 at 100 °C. (b) The response of SnO2 sensors toward different concentrations of NO2 at 100 °C. (c) The linear relationship between response value and NO2 concentration from 0.1 ppm to 2 ppm for SnO2 sensors. (d) The response time and (e) the recovery time of SnO2 sensors in response to NO2 with different concentrations. (f) The response of SnO2 sensors to 10 ppm NO2, 10 ppm H2S, 100 ppm CO, 100 ppm HCHO, and 100 ppm ethanol.
Figure 5d,e show the response/recovery time of SnO2 sensors to NO2 with different concentrations. It can be observed that the recovery time of SnO2-FD exposed to high NO2 concentration is drastically shortened, and the response time is also reduced. The response/recovery time of a gas sensor is related to the diffusion rate of the gas and its surface reaction rate [73]. Its response/recovery at low concentrations is dominated by the effect of the gas diffusion rate [74]. The target gas concentration gradient at the sensor surface is quite low, resulting in a long response/recovery time [75,76]. The responses of SnO2 sensors to 10 ppm NO2, 10 ppm H2S, 100 ppm CO, 100 ppm HCHO, and 100 ppm ethanol at 100 °C are displayed in Figure 5f. The sensor is generally unresponsive to all gases except NO2, indicating that the sensor has excellent selectivity for NO2. The comparison of the performance of the SnO2-FD sensor in this work with the reported NO2 sensor is shown in Table 1. Compared to the reported NO2 sensor, the SnO2-FD sensor exhibits a high NO2 response value (886.2) and a short response recovery time (74/27 s) towards 10 ppm NO2 at 100 °C with an extremely low detection limit (1.69 ppb).

Table 1.
The NO2 sensing performance of reported sensors and this work.
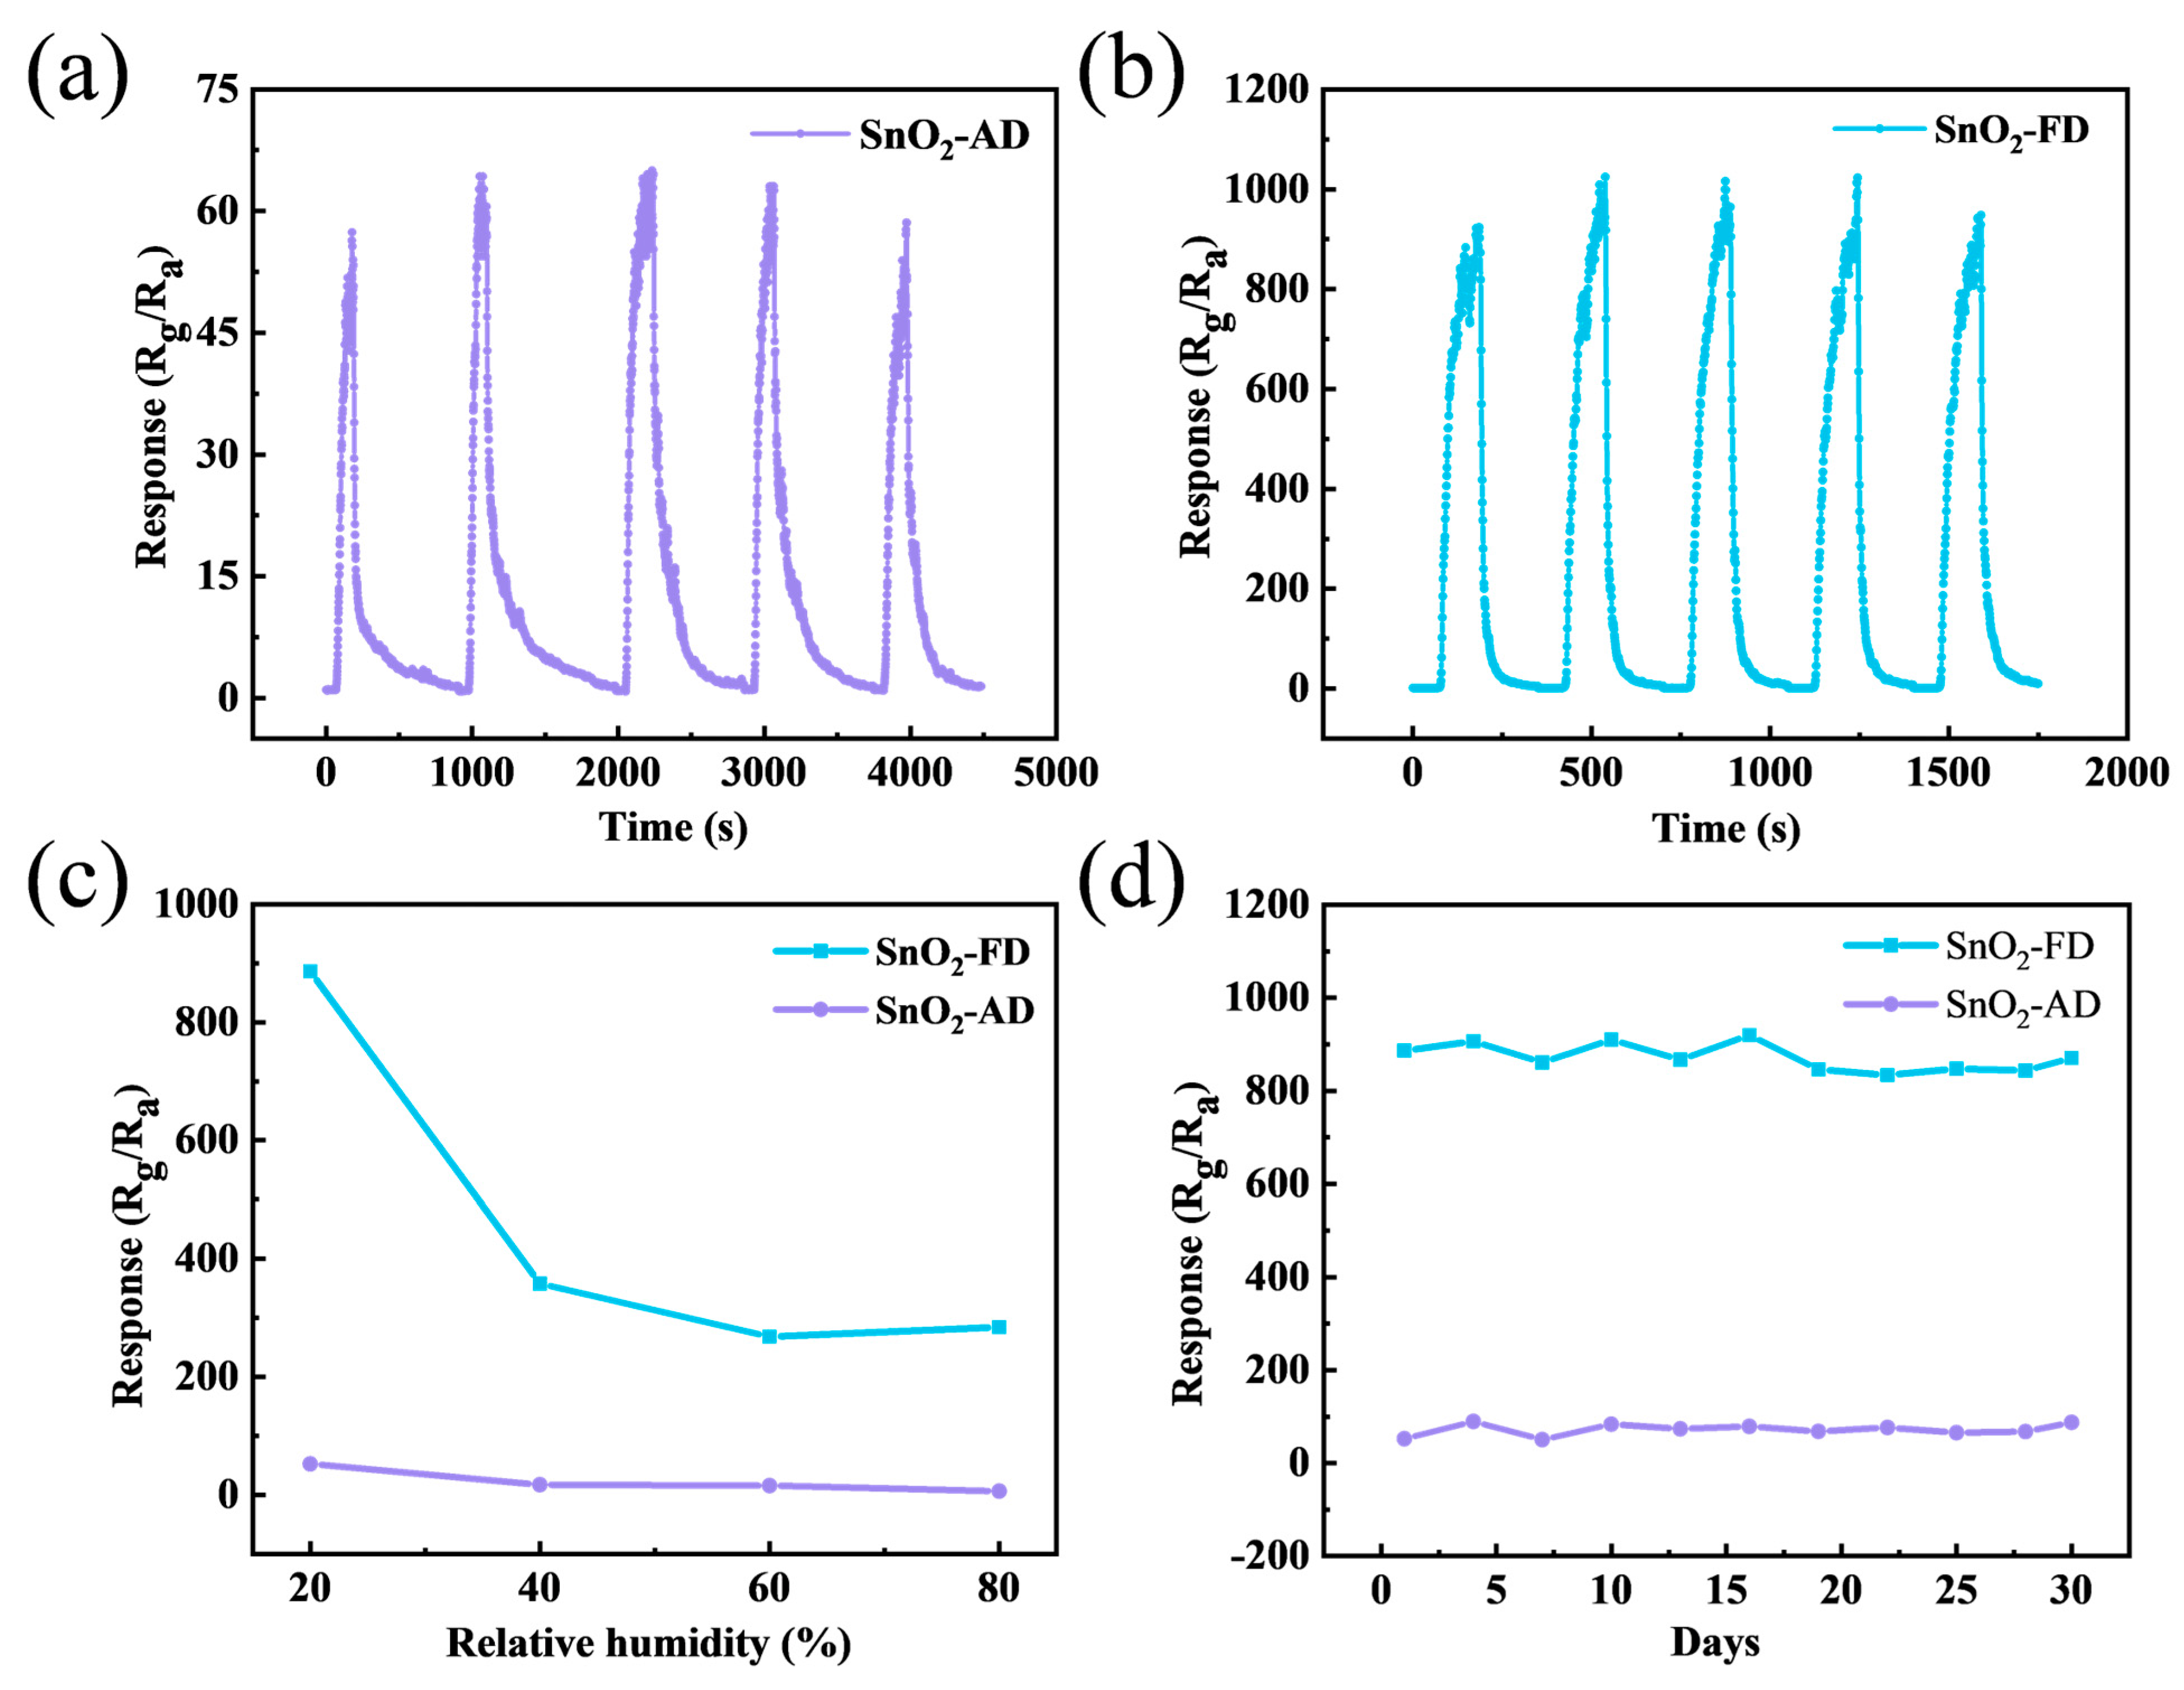
Figure 6a,b show the stability of SnO2-AD and SnO2-FD sensors to 10 ppm NO2 at 100 °C in five cycles. The response values of the sensors remain essentially unchanged over the five cycles, indicating the good reliability of the sensors. Ambient humidity is a factor that must be taken into account in the practical application of gas sensors. The response of SnO2 sensors under different humidity levels to 10 ppm NO2 at 100 °C is shown in Figure 6c. The increased humidity leads to a reduction in the resistance of the material, as shown in Figure S2. It is attributed to the reaction of water molecules with adsorbed oxygen species on the surface of the material to form hydroxyl groups and release electrons into the conduction band of the material [81]. Moreover, the hydroxyl groups formed by water molecules can occupy the active sites on the material surface, which leads to metal oxide hydroxyl poisoning and inhibits gas adsorption [82,83]. On the other hand, the reaction of water molecules with adsorbed oxygen on the surface of the material generates a competitive relationship with the reaction of NO2 and adsorbed oxygen, which affects the gas-sensitive response of the sensor [84]. They stabilize at relative humidity up to 40 RH% and SnO2-FD still has a higher response value (284.29) at 80 RH% compared to SnO2-AD (6.41). Figure 6d shows the response change of SnO2 sensors to 10 ppm NO2 at 100 °C for 30 days. The response values of the SnO2-FD sensors are generally stable over a period of 30 days with an average value of about 871.86, indicating favorable long-term stability.

Figure 6.
The stability of (a) SnO2-AD and (b) SnO2-FD sensors in response to 10 ppm NO2 at 100 °C in 5 cycles. (c) The response of SnO2 sensors under different humidity levels to 10 ppm NO2 at 100 °C. (d) The response change of SnO2 sensors in response to 10 ppm NO2 at 100 °C for 30 days.
3.3. Gas Sensing Mechanism
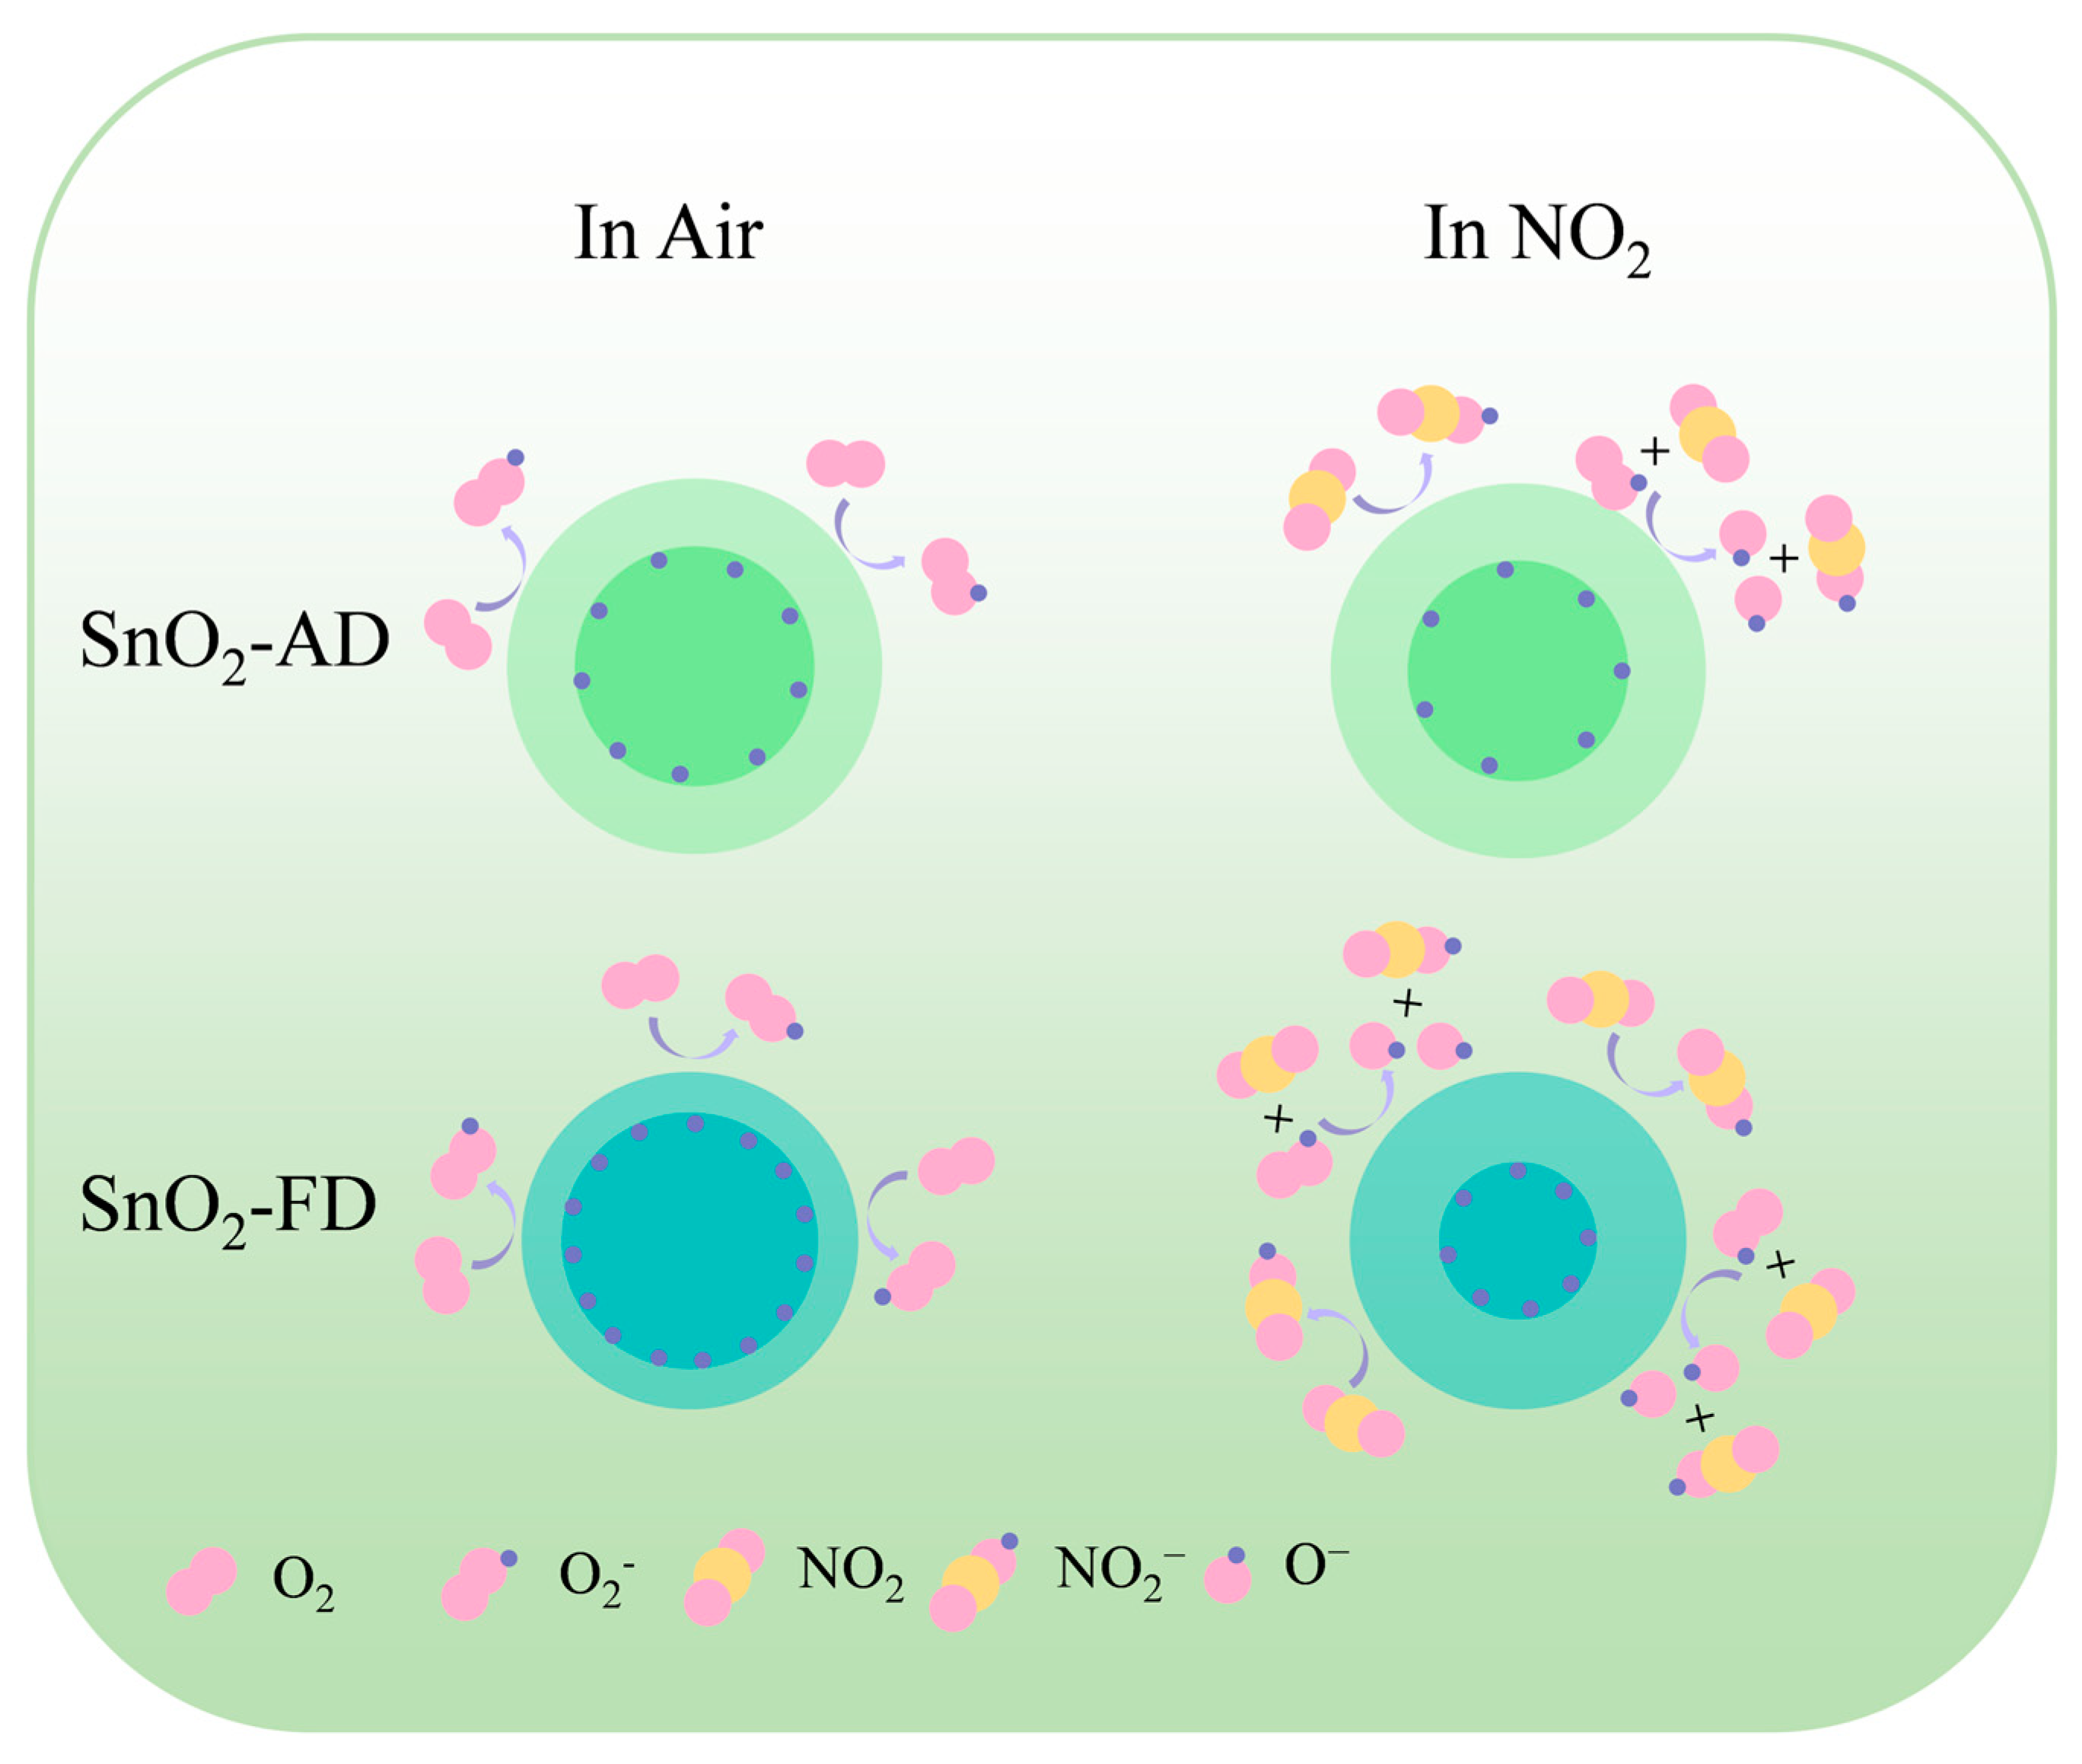
The gas sensing mechanism can be explained as the change in resistance of a semiconductor before and after exposure to a target gas, as shown in Figure 7. In air, oxygen molecules are adsorbed on the surface of the SnO2 sensor to capture its conduction band electrons to form reactive adsorbed oxygen species, resulting in an increase in SnO2 resistance [59]. Upon exposure of the sensor to NO2, NO2 further traps electrons in the conduction band of SnO2 due to its higher electron affinity than O2, leading to a further increase in its resistance [85]. On the other hand, NO2 reacts with adsorbed oxygen on the surface to form NO2− resulting in a decrease in the content of O2−, which further robs the electrons in the SnO2 conduction band, leading to an increase in resistance [86]. The SnO2-FD and adsorbed oxygen content is higher than that of SnO2-AD as shown in Figure 1d, which may also be reasonable for why the response value and the response/recovery rate of SnO2-FD are much higher than those of SnO2-AD at a high NO2 concentration.

Figure 7.
The NO2 gas sensing mechanism of SnO2-AD and SnO2-FD.
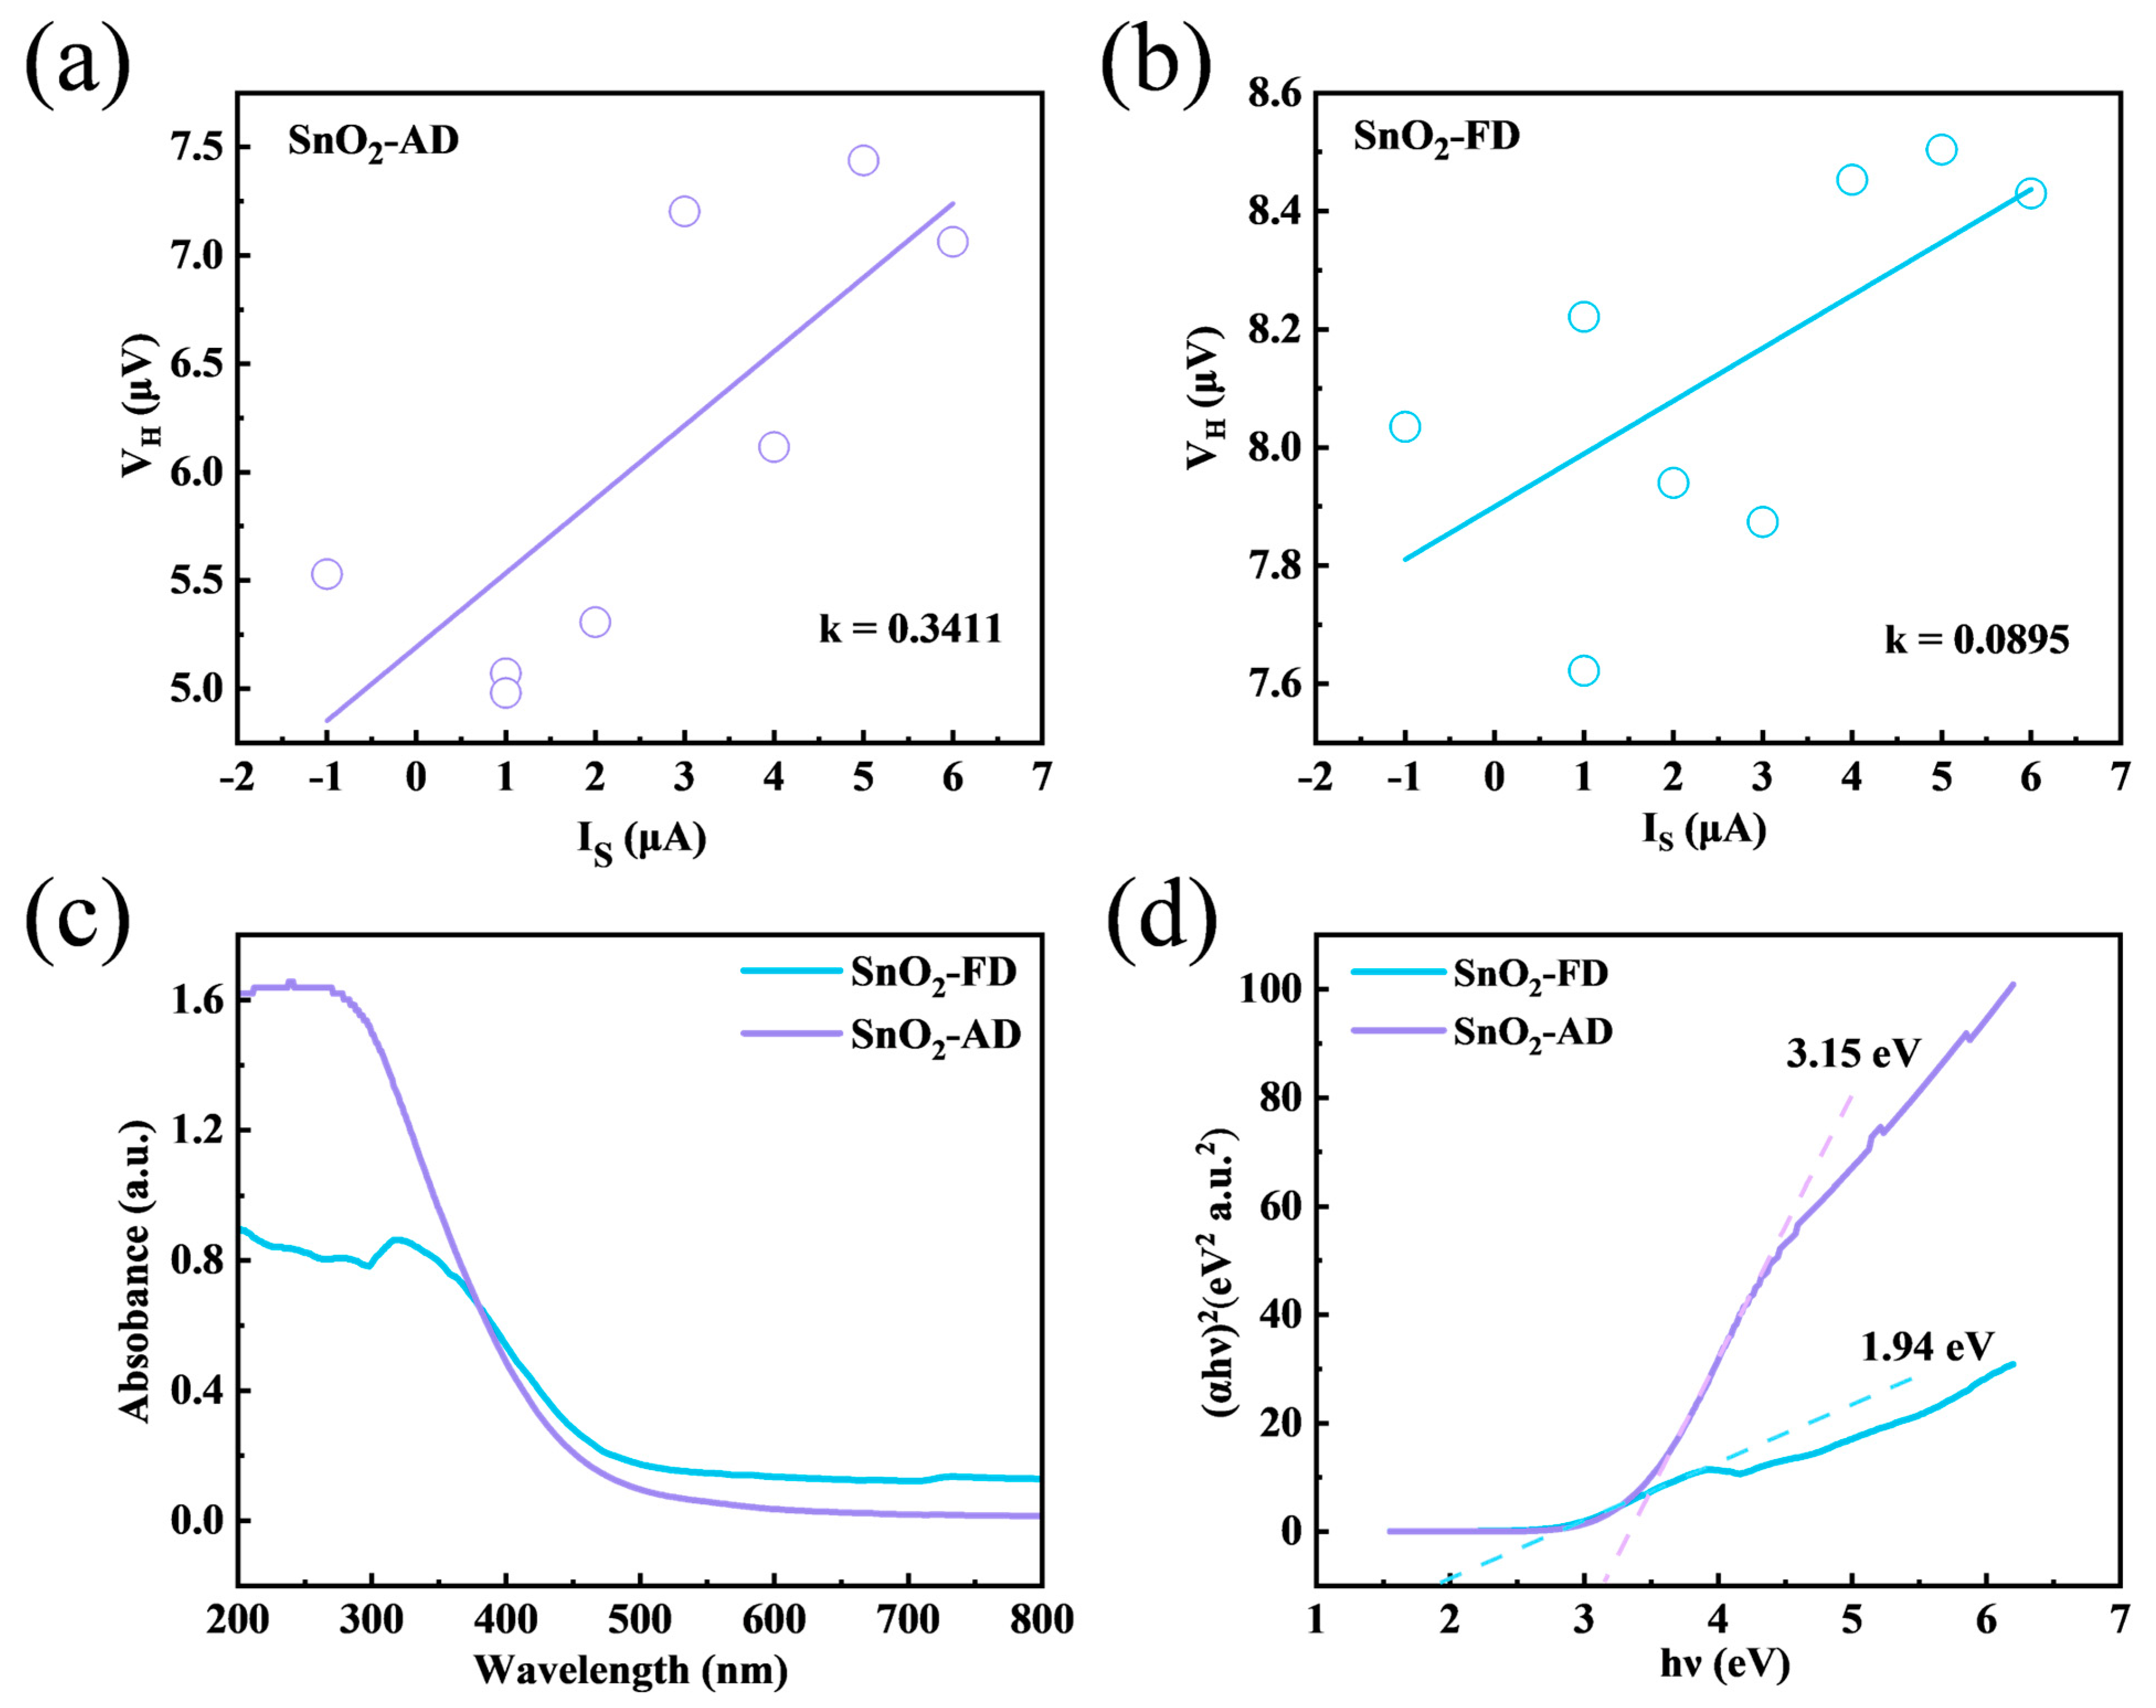
In order to further understand the electrical properties, VH-I curves were tested using a Hall effect test system, as shown in Figure 8a,b, and the carrier concentrations were then calculated by Equation (4) [87]:
where I is the excitation current, B is the magnetic induction, VH is the Hall voltage, and d is the material thickness. Here, VH/I can be expressed as the slope of the fitted straight line. The deviation of these dispersed points from the fitted straight line may be attributed to the non-uniform thickness of the coated gas-sensitive sensing layer, which results in a different concentration of electrons in each cross-section. During the measurement process, multi-point data were measured and fitted to minimize the error. The calculated carrier concentrations of SnO2-AD and SnO2-FD are 1.903 × 10¹² and 7.251 × 1012 cm−3, respectively. According to the XPS results, the content of O/Sn in SnO2-AD (1.76) is higher than that in SnO2-FD (1.60), indicating that the intrinsic defects of n-type SnO2 recombine with oxygen, thus leading to a lower carrier concentration in SnO2-AD [88]. And the higher carrier concentration in SnO2-FD promotes a rapid gas sensing reaction [67]. To have a better understanding of the energy band structure, the UV-vis diffuse reflectance spectra of SnO2-AD and SnO2-FD were tested, as shown in Figure 8c,d. In the visible light wavelength range, the absorbance of SnO2-FD is higher than that of SnO2-AD, indicating that more carriers can be produced in SnO2-FD [89]. The UV absorption edge of SnO2-FD is redshifted; this is due to the straightforward electron transition between the valence bands and conduction bands, suggesting that the decrease in the band gap of SnO2-FD reduces the activation energy of the electron transition [90]. The band gap energies of SnO2-AD and SnO2-FD are ca. 3.15 and 1.94 eV, respectively, indicating that the preparation of SnO2 with the freeze-drying method significantly narrows the band gap. The reduction in the band gap may be due to the introduction of extensive defects [91]. This reduces activation energy for electron migration and allows NO2 to obtain electrons from the SnO2 conduction band more efficiently, thus increasing its response value and response recovery rate [40,72]. On the other hand, more electrons can be excited into the conduction band at a certain temperature, thus increasing the carrier concentration, which in turn promotes the electron transfer between the sensors and NO2 that facilitates the gas-sensitized reaction.

Figure 8.
The VH−I curves measured by Hall Effect Measurement of (a) SnO2-AD and (b) SnO2-FD. (c) The UV−vis absorption spectrum of SnO2. (d) T−plots of (αhν)2 versus hν of SnO2.
In this work, SnO2-FD has excellent NO2 sensing properties. First, the increase in chemisorbed oxygen content promotes an alternative reaction pathway for NO2 at high concentrations. Second, the SnO2-FD particle size is closer to the Debye length of SnO2, affecting its conductivity and facilitating the target gas contact with SnO2. In addition, SnO2-FD has a higher carrier concentration, which promotes electron exchange between the target gas and the sensing materials. Moreover, the band gap of SnO2-FD is drastically reduced, which lowers the activation energy of electrons transiting from the valence band to the conduction band and promotes the capture of electrons from the conduction band by the target gas, thus improving the response value of the sensor and the response/recovery speed.
4. Conclusions
Small-sized SnO2-FD particles prepared by hydrothermal and freeze-drying methods have good gas-sensitive properties for NO2 at lower temperatures. The SnO2-FD sensor exhibits an ultra-high response (886.2) with a short response recovery time (74/27 s) for 10 ppm NO2 at 100 °C. Moreover, the sensor exhibits an extremely low detection limit, good selectivity, and humidity stability. The SnO2 prepared by the freeze-drying method exhibits a significantly shortened band gap and increased carrier concentration, as well as a reduced particle size of SnO2 particles. This study provides a new idea for research on semiconductor gas-sensitive material preparation methods.
Supplementary Materials
The following supporting information can be downloaded at: https://www.mdpi.com/article/10.3390/ma17153714/s1, Figure S1. The repetitive tests on the response-recovery of SnO2-AD and SnO2-FD to 10 ppm NO2 at 100 °C. Figure S2. The baseline resistance of SnO2-AD and SnO2-FD sensors at different humidity.
Author Contributions
L.L.: methodology, investigation, writing—original draft. J.Z.: formal analysis. Z.J.: data curation, project administration, resources. F.L.: data curation, formal analysis, validation. D.Z.: conceptualization, project administration, resources. Z.L.: resources, data curation. F.W.: writing—review and editing, formal analysis. Z.W.: formal analysis, data curation. J.L.: writing—review and editing, resources. L.W.: writing—review and editing, investigation. All authors have read and agreed to the published version of the manuscript.
Funding
This work was supported by the Natural Science Foundation of Shandong Province (ZR2022MF311), The Project of Innovation Team in Jinan City for Universities and institutes (2021GXRC036), the Natural Science and Development Foundation of Shenzhen (JCYJ20190807093205660), and the Young Scholars Program of Shandong University (2018WLJH25).
Institutional Review Board Statement
Not applicable.
Informed Consent Statement
Not applicable.
Data Availability Statement
Data are contained within the article.
Conflicts of Interest
The authors declare no conflicts of interest.
References
- Melamed, M.L.; Schmale, J.; von Schneidemesser, E. Sustainable policy—Key considerations for air quality and climate change. Curr. Opin. Environ. Sustain. 2016, 23, 85–91. [Google Scholar] [CrossRef]
- Landau, D.; Novack, L.; Yitshak-Sade, M.; Sarov, B.; Kloog, I.; Hershkovitz, R.; Grotto, I.; Karakis, I. Nitrogen Dioxide pollution and hazardous household environment: What impacts more congenital malformations. Chemosphere 2015, 139, 340–348. [Google Scholar] [CrossRef]
- Jion, M.M.M.F.; Jannat, J.N.; Mia, M.Y.; Ali, M.A.; Islam, M.S.; Ibrahim, S.M.; Pal, S.C.; Islam, A.; Sarker, A.; Malafaia, G.; et al. A critical review and prospect of NO2 and SO2 pollution over Asia: Hotspots, trends, and sources. Sci. Total Environ. 2023, 876, 162851. [Google Scholar] [CrossRef]
- Cai, Y.; Zhang, B.; Ke, W.; Feng, B.; Lin, H.; Xiao, J.; Zeng, W.; Li, X.; Tao, J.; Yang, Z.; et al. Associations of Short-Term and Long-Term Exposure to Ambient Air Pollutants with Hypertension. Hypertension 2016, 68, 62–70. [Google Scholar] [CrossRef]
- Huangfu, P.; Atkinson, R. Long-term exposure to NO2 and O3 and all-cause and respiratory mortality: A systematic review and meta-analysis. Environ. Int. 2020, 144, 105998. [Google Scholar] [CrossRef]
- Huang, S.; Li, H.; Wang, M.; Qian, Y.; Steenland, K.; Caudle, W.M.; Liu, Y.; Sarnat, J.; Papatheodorou, S.; Shi, L. Long-term exposure to nitrogen dioxide and mortality: A systematic review and meta-analysis. Sci. Total Environ. 2021, 776, 145968. [Google Scholar] [CrossRef]
- Hinojo, A.; Lujan, E.; Nel-lo, M.; Colominas, S.; Abella, J. BaCe0.6Zr0.3Y0.1O3-α electrochemical hydrogen sensor for fusion applications. Fusion Eng. Des. 2023, 188, 113452. [Google Scholar] [CrossRef]
- Zhi, Z.; Gao, W.; Yang, J.; Geng, C.; Yang, B.; Tian, C.; Fan, S.; Li, H.; Li, J.; Hua, Z. Amperometric hydrogen gas sensor based on Pt/C/Nafion electrode and ionic electrolyte. Sens. Actuators B Chem. 2022, 367, 132137. [Google Scholar] [CrossRef]
- Zhou, Q.; Xu, L.; Umar, A.; Chen, W.; Kumar, R. Pt nanoparticles decorated SnO2 nanoneedles for efficient CO gas sensing applications. Sens. Actuators B Chem. 2018, 256, 656–664. [Google Scholar] [CrossRef]
- Chen, K.; Guo, M.; Yang, B.; Jin, F.; Wang, G.; Ma, F.; Li, C.; Zhang, B.; Deng, H.; Gong, Z. Highly Sensitive Optical Fiber Photoacoustic Sensor for In Situ Detection of Dissolved Gas in Oil. IEEE Trans. Instrum. Meas. 2021, 70, 1–8. [Google Scholar] [CrossRef]
- Yin, X.; Gao, M.; Miao, R.; Zhang, L.; Zhang, X.; Liu, L.; Shao, X.; Tittel, F.K. Near-infrared laser photoacoustic gas sensor for simultaneous detection of CO and H2S. Opt. Express 2021, 29, 34258–34268. [Google Scholar] [CrossRef]
- Wu, Y.; Li, J.; Lv, M.; Zhang, X.; Gao, R.; Guo, C.; Cheng, X.; Zhou, X.; Xu, Y.; Gao, S.; et al. Selective detection of trace carbon monoxide at room temperature based on CuO nanosheets exposed to (111) crystal facets. J. Hazard. Mater. 2023, 442, 130041. [Google Scholar] [CrossRef]
- Nakate, U.T.; Patil, P.; Na, S.-I.; Yu, Y.T.; Suh, E.-k.; Hahn, Y.-B. Fabrication and enhanced carbon monoxide gas sensing performance of p-CuO/n-TiO2 heterojunction device. Colloids Surf. A Physicochem. Eng. Asp. 2021, 612, 125962. [Google Scholar] [CrossRef]
- Srivastava, S.; Sharma, T.; Deshwal, M. Study of Nanostructured Metal Oxide Semiconductor Based Gas Sensors for Toxic Gas Detection. In Proceedings of the 2023 International Conference on Sustainable Emerging Innovations in Engineering and Technology (ICSEIET), Ghaziabad, India, 14–15 September 2023; pp. 657–662. [Google Scholar]
- Liu, H.; Liu, B.; Li, P.; Kang, W.; Zhang, Y. High sensitivity and anti-humidity gas sensor for nitrogen dioxide based on Ce/SnO2 nanomaterials. Sens. Actuators A Phys. 2022, 344, 113717. [Google Scholar] [CrossRef]
- Wang, L.; Zhang, R.; Zhou, T.; Lou, Z.; Deng, J.; Zhang, T. P-type octahedral Cu2O particles with exposed {111} facets and superior CO sensing properties. Sens. Actuators B Chem. 2017, 239, 211–217. [Google Scholar] [CrossRef]
- Molavi, R.; Sheikhi, M.H. Facile wet chemical synthesis of Al doped CuO nanoleaves for carbon monoxide gas sensor applications. Mater. Sci. Semicond. Process. 2020, 106, 104767. [Google Scholar] [CrossRef]
- Dan, M.; Qiao, T.; Wang, G.; Shen, Y.; San, X.; Li, R.; Meng, F. Rational design of CuO/In2O3 heterostructures with flower-like structures for low temperature detection of formaldehyde. J. Alloys Compd. 2022, 896, 162959. [Google Scholar] [CrossRef]
- Sun, Y.; Zhao, Z.; Suematsu, K.; Li, P.; Yu, Z.; Zhang, W.; Hu, J.; Shimanoe, K. Rapid and Stable Detection of Carbon Monoxide in Changing Humidity Atmospheres Using Clustered In2O3/CuO Nanospheres. ACS Sens. 2020, 5, 1040–1049. [Google Scholar] [CrossRef]
- Sun, Y.; Zhao, Z.; Zhou, R.; Li, P.; Zhang, W.; Suematsu, K.; Hu, J. Synthesis of In2O3 nanocubes, nanocube clusters, and nanocubes-embedded Au nanoparticles for conductometric CO sensors. Sens. Actuators B Chem. 2021, 345, 130433. [Google Scholar] [CrossRef]
- Huang, B.; Zhu, Q.; Xu, H.; Li, X.; Li, X.; Li, X. Ultrasensitive NO2 sensors based on Au/SnS2/SnO2 nanoflower-like heterojunctions at low temperature. Sens. Actuators B Chem. 2023, 380, 133303. [Google Scholar] [CrossRef]
- Murugesh, P.; Ganesan, M.; Udaiyar, P.S.; Krishnan, H.S.; Jayaram, A.; Mani, N. Mesoporous Co3O4/SnO2 Nanostructure-Based Heterojunctions for NO2 Sensors. ACS Appl. Nano Mater. 2023, 6, 17433–17444. [Google Scholar] [CrossRef]
- Zhang, Y.; Wu, C.; Xiao, B.; Yang, L.; Jiao, A.; Li, K.; Chen, T.; Zhan, R.; Huang, Z.; Lin, H. Chemo-resistive NO2 sensor using La-doped WO3 nanoparticles synthesized by flame spray pyrolysis. Sens. Actuators B Chem. 2022, 369, 132247. [Google Scholar] [CrossRef]
- Hu, K.; Yang, Y.; Hu, Y.; Zeng, W.; Zhang, Y.; Wang, M. CuO surface doped In2O3/CeO2 nanofibers for ppb-ppm level carbon monoxide gas detection in low-temperature. Sens. Actuators B Chem. 2023, 376, 132984. [Google Scholar] [CrossRef]
- Li, X.; Tan, T.; Ji, W.; Zhou, W.; Bao, Y.; Xia, X.; Zeng, Z.; Gao, Y. Remarkably enhanced methane sensing performance at room temperature via constructing a self–assembled mulberry–like ZnO/SnO2 hierarchical structure. Energy Environ. Mater. 2023, 7, e12624. [Google Scholar] [CrossRef]
- Wan, C.; Duan, X. Single Atoms at Crystal Ladder Steps. Chem 2020, 6, 3169–3171. [Google Scholar] [CrossRef]
- Zhi, M.; Tang, H.; Wu, M.; Ouyang, C.; Hong, Z.; Wu, N. Synthesis and Photocatalysis of Metal Oxide Aerogels: A Review. Energy Fuels 2022, 36, 11359–11379. [Google Scholar] [CrossRef]
- Yang, J.; Li, Y.; Zheng, Y.; Xu, Y.; Zheng, Z.; Chen, X.; Liu, W. Versatile Aerogels for Sensors. Small 2019, 15, e1902826. [Google Scholar] [CrossRef] [PubMed]
- Giri, S.; Anantharamaiah, P.N.; Sahoo, B. Sensing of oxidizing and reducing gases by sensors prepared using nanoscale Co3O4 powders: A study through Cu substitution. Adv. Powder Technol. 2022, 33, 103529. [Google Scholar] [CrossRef]
- Vafaei, S.; Wolosz, A.; Ethridge, C.; Schnupf, U.; Hattori, N.; Sugiura, T.; Manseki, K. Elucidation of the Crystal Growth Characteristics of SnO2 Nanoaggregates Formed by Sequential Low-Temperature Sol-Gel Reaction and Freeze Drying. Nanomaterials 2021, 11, 1738. [Google Scholar] [CrossRef]
- Chen, B.; Yang, X.; Zeng, X.; Huang, Z.; Xiao, J.; Wang, J.; Zhan, G. Multicomponent metal oxides derived from Mn-BTC anchoring with metal acetylacetonate complexes as excellent catalysts for VOCs and CO oxidation. Chem. Eng. J. 2020, 397, 125424. [Google Scholar] [CrossRef]
- Zhang, X.; Hui, K.S.; Hui, K.N.; Cho, Y.R.; Zhou, W.; Mane, R.S.; Chun, H.-H. Microstructure and electro-optical properties of Cu–Ni co-doped AZO transparent conducting thin films by sol–gel method. J. Mater. Sci. Mater. Electron. 2014, 26, 1151–1158. [Google Scholar] [CrossRef]
- Wu, J.; Hui, K.S.; Hui, K.N.; Li, L.; Chun, H.-H.; Cho, Y.R. Characterization of Sn-doped CuO thin films prepared by a sol–gel method. J. Mater. Sci. Mater. Electron. 2015, 27, 1719–1724. [Google Scholar] [CrossRef]
- Oosthuizen, D.N.; Motaung, D.E.; Swart, H.C. Selective detection of CO at room temperature with CuO nanoplatelets sensor for indoor air quality monitoring manifested by crystallinity. Appl. Surf. Sci. 2019, 466, 545–553. [Google Scholar] [CrossRef]
- Gildo-Ortiz, L.; Guillén-Bonilla, H.; Rodríguez-Betancourtt, V.M.; Blanco-Alonso, O.; Guillén-Bonilla, A.; Santoyo-Salazar, J.; Romero-Ibarra, I.C.; Reyes-Gómez, J. Key processing of porous and fibrous LaCoO3 nanostructures for successful CO and propane sensing. Ceram. Int. 2018, 44, 15402–15410. [Google Scholar] [CrossRef]
- Zhang, T.; Liu, L.; Qi, Q.; Li, S.; Lu, G. Development of microstructure In/Pd-doped SnO2 sensor for low-level CO detection. Sens. Actuators B Chem. 2009, 139, 287–291. [Google Scholar] [CrossRef]
- Li, H.; Zhu, D.; Yang, Z.; Lu, W.; Pu, Y. The ethanol-sensitive property of hierarchical MoO3-mixed SnO2 aerogels via facile ambient pressure drying. Appl. Surf. Sci. 2019, 489, 384–391. [Google Scholar] [CrossRef]
- Jin, Z.; Wang, C.; Wu, L.; Song, H.; Yao, X.; Liu, J.; Zhao, J.; Zeng, Z.; Wang, F. Fast responding and recovering of NO2 sensors based on Ni-doped In2O3 nanoparticles. Sens. Actuators B Chem. 2023, 377, 133058. [Google Scholar] [CrossRef]
- Li, Y.; Song, X.; Li, L.; Wu, W.; Tao, K.; Ying, Z.; Hu, Y.; Zhou, Y.; Zhang, R.; Wang, G.; et al. Low concentration CO gas sensor constructed from MoS2 nanosheets dispersed SnO2 nanoparticles at room temperature under UV light. Ceram. Int. 2023, 49, 10249–10254. [Google Scholar] [CrossRef]
- Yan, W.; Ai, W.; Liu, W.; Zhao, Z.; Hu, X.; Cui, S.; Shen, X. Ultra-sensitive SnO2 aerogel in nano-trace ethanol detection. J. Alloys Compd. 2023, 943, 169042. [Google Scholar] [CrossRef]
- Yan, W.; Zhu, K.; Cui, Y.; Li, Y.; Dai, T.; Cui, S.; Shen, X. NO2 detection and redox capacitance reaction of Ag doped SnO2/rGO aerogel at room temperature. J. Alloys Compd. 2021, 886, 161287. [Google Scholar] [CrossRef]
- Park, H.; Lee, E.J.; Woo, H.; Yoon, D.; Kim, C.H.; Jung, C.H.; Lee, K.B.; Lee, K.-Y. Enhanced hydrothermal durability of Co3O4@CuO–CeO2 Core-Shell catalyst for carbon monoxide and propylene oxidation. Appl. Surf. Sci. 2022, 606, 154916. [Google Scholar] [CrossRef]
- Wang, L.; Peng, H.; Shi, S.-L.; Hu, Z.; Zhang, B.-Z.; Ding, S.-M.; Wang, S.-H.; Chen, C. Metal-organic framework derived hollow CuO/CeO2 nano-sphere: To expose more highly dispersed Cu-O-Ce interface for enhancing preferential CO oxidation. Appl. Surf. Sci. 2022, 573, 151611. [Google Scholar] [CrossRef]
- Zhang, Y.; Cao, J.; Wang, Y. Ultrahigh methane sensing properties based on Ni-doped hierarchical porous In2O3 microspheres at low temperature. Vacuum 2022, 202, 111149. [Google Scholar] [CrossRef]
- Zhang, C.; Liu, G.; Geng, X.; Wu, K.; Debliquy, M. Metal oxide semiconductors with highly concentrated oxygen vacancies for gas sensing materials: A review. Sens. Actuators A Phys. 2020, 309, 112026. [Google Scholar] [CrossRef]
- Liu, H.; Fu, H.; Liu, Y.; Chen, X.; Yu, K.; Wang, L. Synthesis, characterization and utilization of oxygen vacancy contained metal oxide semiconductors for energy and environmental catalysis. Chemosphere 2021, 272, 129534. [Google Scholar] [CrossRef]
- Yuan, T.; Ma, Z.; Nekouei, F.; Zhang, W.; Xu, J. Zeolitic imidazolate framework-derived n-ZnO/p-Co3O4 heterojunction by ion-etching method for superior CO toxic gas sensor. Sens. Actuators B Chem. 2023, 374, 132717. [Google Scholar] [CrossRef]
- Sun, N.; Tian, Q.; Bian, W.; Wang, X.; Dou, H.; Li, C.; Zhang, Y.; Gong, C.; You, X.; Du, X.; et al. Highly sensitive and lower detection-limit NO2 gas sensor based on Rh-doped ZnO nanofibers prepared by electrospinning. Appl. Surf. Sci. 2023, 614, 156213. [Google Scholar] [CrossRef]
- Ren, X.; Xu, Z.; Zhang, Z.; Tang, Z. Enhanced NO2 Sensing Performance of ZnO-SnO2 Heterojunction Derived from Metal-Organic Frameworks. Nanomaterials 2022, 12, 3726. [Google Scholar] [CrossRef]
- Sun, K.; Zhan, G.; Zhang, L.; Wang, Z.; Lin, S. Highly sensitive NO2 gas sensor based on ZnO nanoarray modulated by oxygen vacancy with Ce doping. Sens. Actuators B Chem. 2023, 379, 133294. [Google Scholar] [CrossRef]
- Ali, S.M.; Hussain, S.T.; Bakar, S.A.; Muhammad, J.; ur Rehman, N. Effect of doping on the Structural and Optical Properties of SnO2 Thin Films fabricated by Aerosol Assisted Chemical Vapor Deposition. J. Phys. Conf. Ser. 2013, 439, 012013. [Google Scholar] [CrossRef]
- Manikandan, D.; Murugan, R. Room temperature dilute magnetism in nanoscale Co and Zn co-doped SnO2. Superlattices Microstruct. 2016, 89, 7–14. [Google Scholar] [CrossRef]
- Ferreira, C.S.; Santos, P.L.; Bonacin, J.A.; Passos, R.R.; Pocrifka, L.A. Rice Husk Reuse in the Preparation of SnO2/SiO2Nanocomposite. Mater. Res. 2015, 18, 639–643. [Google Scholar] [CrossRef]
- Costa, I.M.; Colmenares, Y.N.; Pizani, P.S.; Leite, E.R.; Chiquito, A.J. Sb doping of VLS synthesized SnO2 nanowires probed by Raman and XPS spectroscopy. Chem. Phys. Lett. 2018, 695, 125–130. [Google Scholar] [CrossRef]
- Chetri, P.; Choudhury, B.; Choudhury, A. Room temperature ferromagnetism in SnO2 nanoparticles: An experimental and density functional study. J. Mater. Chem. C 2014, 2, 9294–9302. [Google Scholar] [CrossRef]
- Jian, K.-S.; Chang, C.-J.; Wu, J.J.; Chang, Y.-C.; Tsay, C.-Y.; Chen, J.-H.; Horng, T.-L.; Lee, G.-J.; Karuppasamy, L.; Anandan, S.; et al. High response CO sensor based on a polyaniline/SnO2 nanocomposite. Polymers 2019, 11, 184. [Google Scholar] [CrossRef]
- Li, G.; Wang, X.; Yan, L.; Wang, Y.; Zhang, Z.; Xu, J. PdPt Bimetal-Functionalized SnO2 Nanosheets: Controllable Synthesis and its Dual Selectivity for Detection of Carbon Monoxide and Methane. Acs Appl. Mater. Interfaces 2019, 11, 26116–26126. [Google Scholar] [CrossRef] [PubMed]
- Yuan, H.; Aljneibi, S.A.A.A.; Yuan, J.; Wang, Y.; Liu, H.; Fang, J.; Tang, C.; Yan, X.; Cai, H.; Gu, Y.; et al. ZnO Nanosheets Abundant in Oxygen Vacancies Derived from Metal-Organic Frameworks for ppb-Level Gas Sensing. Adv. Mater. 2019, 31, 1807161. [Google Scholar] [CrossRef] [PubMed]
- Yang, G.; Cao, C.; Zhong, H.; Cheng, Y.; Zhang, W.; Wang, D. Construction of SnO2 nanofibers @ MoS2 nanosheets core-shell nanocomposites for high efficiency xylene detection. Colloids Surf. A Physicochem. Eng. Asp. 2023, 659, 130813. [Google Scholar] [CrossRef]
- Meng, F.-J.; Guo, X.-M. Tuning the oxygen defects and Fermi levels via In3+ doping in SnO2-In2O3 nanocomposite for efficient CO detection. Sens. Actuators B Chem. 2022, 357, 131412. [Google Scholar] [CrossRef]
- Khaleel, A.; Al-Marzouqi, A. Alkoxide-free sol–gel synthesis of aerogel iron–chromium mixed oxides with unique textural properties. Mater. Lett. 2012, 68, 385–387. [Google Scholar] [CrossRef]
- Qin, C.; Wang, B.; Wang, Y. Metal-organic frameworks-derived Mn-doped Co3O4 porous nanosheets and enhanced CO sensing performance. Sens. Actuators B Chem. 2022, 351, 130943. [Google Scholar] [CrossRef]
- Bai, X.; Lv, H.; Liu, Z.; Chen, J.; Wang, J.; Sun, B.; Zhang, Y.; Wang, R.; Shi, K. Thin-layered MoS2 nanoflakes vertically grown on SnO2 nanotubes as highly effective room-temperature NO2 gas sensor. J. Hazard Mater. 2021, 416, 125830. [Google Scholar] [CrossRef] [PubMed]
- Xu, Y.; Zheng, L.; Yang, C.; Liu, X.; Zhang, J. Highly sensitive and selective electronic sensor based on Co catalyzed SnO2 nanospheres for acetone detection. Sens. Actuators B Chem. 2020, 304, 127237. [Google Scholar] [CrossRef]
- Yuan, K.-P.; Zhu, L.-Y.; Yang, J.-H.; Hang, C.-Z.; Tao, J.-J.; Ma, H.-P.; Jiang, A.-Q.; Zhang, D.W.; Lu, H.-L. Precise preparation of WO3@SnO2 core shell nanosheets for efficient NH3 gas sensing. J. Colloid Interface Sci. 2020, 568, 81–88. [Google Scholar] [CrossRef]
- Cao, E.; Wu, L.; Zhang, Y.; Sun, L.; Yu, Z.; Nie, Z. Hydrothermal synthesis of cubic-rhombohedral-In2O3 microspheres with superior acetone sensing performance. Appl. Surf. Sci. 2023, 613, 156045. [Google Scholar] [CrossRef]
- Liu, F.; Jiang, Z.; Zhao, J.; Chen, C.; Zhou, H.; Xiang, N.; Liu, J.; Wu, L. Creating oxygen vacancies on porous tungsten oxide nanospheres via one-step muffle calcination for ultra-fast detection of ppb-level hydrogen sulfide sensors. J. Alloys Compd. 2024, 971, 172782. [Google Scholar] [CrossRef]
- Meng, F.-J.; Guo, X.-M. Co/Au bimetal synergistically modified SnO2-In2O3 nanocomposite for efficient CO sensing. Ceram. Int. 2023, 49, 15979–15989. [Google Scholar] [CrossRef]
- Shi, J.; Liu, S.; Zhang, P.; Sui, N.; Cao, S.; Zhou, T.; Zhang, T. Sb/Pd co-doped SnO2 nanoparticles for methane detection: Resistance reduction and sensing performance studies. Nanotechnology 2021, 32, 475506. [Google Scholar] [CrossRef] [PubMed]
- Zhang, H.; Guo, S.; Zheng, W.; Wang, H.; Li, H.-Y.; Yu, M.-H.; Chang, Z.; Bu, X.-H.; Liu, H. Facile engineering of metal–organic framework derived SnO2-ZnO composite based gas sensor toward superior acetone sensing performance. Chem. Eng. J. 2023, 469, 143927. [Google Scholar] [CrossRef]
- Li, C.; Kim, K.; Fuchigami, T.; Asaka, T.; Kakimoto, K.-i.; Masuda, Y. Acetone gas sensor based on Nb2O5 @SnO2 hybrid structure with high selectivity and ppt-level sensitivity. Sens. Actuators B Chem. 2023, 393, 134144. [Google Scholar] [CrossRef]
- Liu, F.; Song, H.; Wu, L.; Zhao, J.; Yao, X.; Fu, K.; Jin, Z.; Liu, J.; Wang, F.; Wang, Z. Excellent NO2 gas sensor based on the oxygen inhibiting effect of Ni3+-doped WO3. Colloids Surf. A Physicochem. Eng. Asp. 2023, 666, 131329. [Google Scholar] [CrossRef]
- Kida, T.; Kuroiwa, T.; Yuasa, M.; Shimanoe, K.; Yamazoe, N. Study on the response and recovery properties of semiconductor gas sensors using a high-speed gas-switching system. Sens. Actuators B Chem. 2008, 134, 928–933. [Google Scholar] [CrossRef]
- Lyu, N.; Shi, S.; Lu, H.; Song, Y.; Jiang, X.; Jin, Y. Hydrogen gas diffusion behavior under fault conditions and detector installation optimization of electric vehicles. Process Saf. Environ. Prot. 2023, 175, 565–574. [Google Scholar] [CrossRef]
- Bai, H.; Guo, H.; Wang, J.; Dong, Y.; Liu, B.; Xie, Z.; Guo, F.; Chen, D.; Zhang, R.; Zheng, Y. A room-temperature NO2 gas sensor based on CuO nanoflakes modified with rGO nanosheets. Sens. Actuators B Chem. 2021, 337, 129783. [Google Scholar] [CrossRef]
- Zhang, S.; Li, Y.; Sun, G.; Zhang, B.; Wang, Y.; Cao, J.; Zhang, Z. Enhanced methane sensing properties of porous NiO nanaosheets by decorating with SnO2. Sens. Actuators B Chem. 2019, 288, 373–382. [Google Scholar] [CrossRef]
- Shah, S.; Han, S.; Hussain, S.; Liu, G.; Shi, T.; Shaheen, A.; Xu, Z.; Wang, M.; Qiao, G. NO2 gas sensing responses of In2O3 nanoparticles decorated on GO nanosheets. Ceram. Int. 2022, 48, 12291–12298. [Google Scholar] [CrossRef]
- Hu, Y.; Li, T.; Zhang, J.; Guo, J.; Wang, W.; Zhang, D. High-sensitive NO2 sensor based on p-NiCo2O4/n-WO3 heterojunctions. Sens. Actuators B Chem. 2022, 352, 130912. [Google Scholar] [CrossRef]
- Yang, Z.; Zhang, D.; Chen, H. MOF-derived indium oxide hollow microtubes/MoS2 nanoparticles for NO2 gas sensing. Sens. Actuators B Chem. 2019, 300, 127037. [Google Scholar] [CrossRef]
- Ri, J.; Li, X.; Shao, C.; Liu, Y.; Han, C.; Li, X.; Liu, Y. Sn-doping induced oxygen vacancies on the surface of the In2O3 nanofibers and their promoting effect on sensitive NO2 detection at low temperature. Sens. Actuators B Chem. 2020, 317, 128194. [Google Scholar] [CrossRef]
- Shooshtari, M.; Salehi, A.; Vollebregt, S. Effect of temperature and humidity on the sensing performance of TiO2 nanowire-based ethanol vapor sensors. Nanotechnology 2021, 32, 325501. [Google Scholar] [CrossRef]
- Zhang, W.-H.; Zhang, W.-D. Fabrication of SnO2–ZnO nanocomposite sensor for selective sensing of trimethylamine and the freshness of fishes. Sens. Actuators B Chem. 2008, 134, 403–408. [Google Scholar] [CrossRef]
- Xia, Y.; Guo, S.; Yang, L.; He, S.; Zhou, L.; Wang, M.; Gao, J.; Hou, M.; Wang, J.; Komarneni, S. Enhanced Free–Radical Generation on MoS2/Pt by Light and Water Vapor Co-Activation for Selective CO Detection with High Sensitivity. Adv. Mater. 2023, 35, 2303523. [Google Scholar] [CrossRef] [PubMed]
- Yamazoe, N.; Sakai, G.; Shimanoe, K. Oxide Semiconductor Gas Sensors. Catal. Surv. Asia 2003, 7, 63–75. [Google Scholar] [CrossRef]
- Zhang, J.; Zhang, F.; Li, X.; Wang, Q. Ppb-Level NO2 Sensor with High Selectivity Fabricated by Flower-like Au-Loaded In2O3. Chemosensors 2023, 11, 289. [Google Scholar] [CrossRef]
- Xin, J.; Wang, W.; Xie, L.; Li, X.; Yao, Y.; Zhao, X.; Zhu, Z. MOF-derived Al3+-doped Co3O4 nanocomposites for highly n-butanol gas sensing performance at low operating temperature. J. Alloys Compd. 2024, 978, 173341. [Google Scholar] [CrossRef]
- Fleischer, M.; Meixner, H. Electron mobility in single- and polycrystalline Ga2O3. J. Appl. Phys. 1993, 74, 300–305. [Google Scholar] [CrossRef]
- Huang, J.; Hu, Y.; Ma, Y.; Li, B.; Tang, K.; Shi, H.; Gou, S.; Zou, T.; Wang, L.; Lu, Y. B-doping and annealing on the properties of B and Ga co-doped ZnO films. Surf. Coat. Technol. 2019, 358, 223–227. [Google Scholar] [CrossRef]
- Jia, Y.; Li, S.; Ma, H.; Gao, J.; Zhu, G.; Zhang, F.; Park, J.Y.; Cha, S.; Bae, J.-S.; Liu, C. Oxygen vacancy rich Bi2O4-Bi4O7-BiO2-x composites for UV–vis-NIR activated high efficient photocatalytic degradation of bisphenol A. J. Hazard. Mater. 2020, 382, 121121. [Google Scholar] [CrossRef]
- Agarwal, S.; Rai, P.; Gatell, E.N.; Llobet, E.; Güell, F.; Kumar, M.; Awasthi, K. Gas sensing properties of ZnO nanostructures (flowers/rods) synthesized by hydrothermal method. Sens. Actuators B Chem. 2019, 292, 24–31. [Google Scholar] [CrossRef]
- Gao, Y.; Wang, X.; Zhang, Q.; Wang, H.; Xu, G.; Wang, X. Influence of La doping on the ethanol gas sensing properties of CdSnO3 micro-cubes. Sens. Actuators B Chem. 2023, 394, 134447. [Google Scholar] [CrossRef]

Disclaimer/Publisher’s Note: The statements, opinions and data contained in all publications are solely those of the individual author(s) and contributor(s) and not of MDPI and/or the editor(s). MDPI and/or the editor(s) disclaim responsibility for any injury to people or property resulting from any ideas, methods, instructions or products referred to in the content. |
© 2024 by the authors. Licensee MDPI, Basel, Switzerland. This article is an open access article distributed under the terms and conditions of the Creative Commons Attribution (CC BY) license (https://creativecommons.org/licenses/by/4.0/).