
Crystal Plasticity Finite Element Simulation of Grain Evolution Behavior in Aluminum Alloy Rolling


Abstract
1. Introduction
2. Crystal Plasticity Model
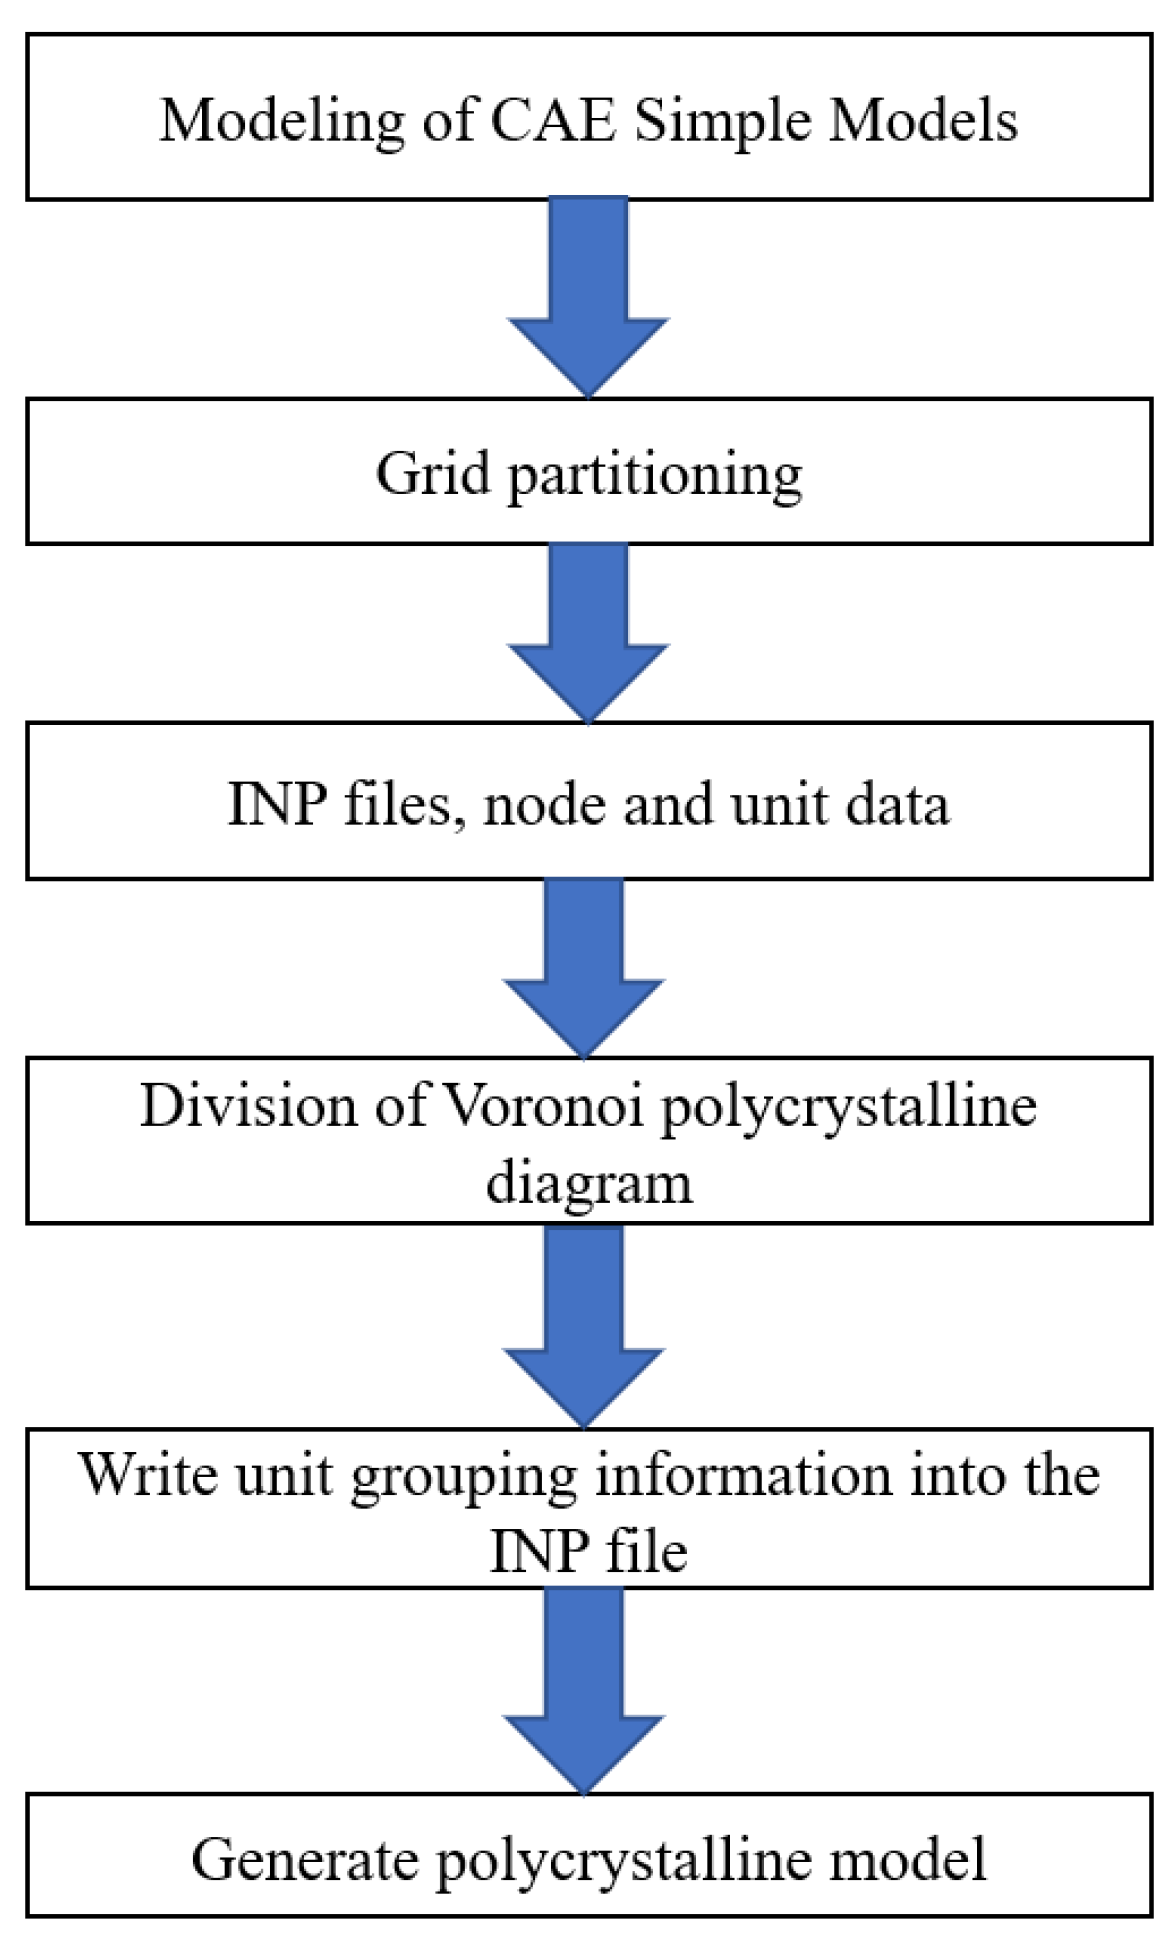
2.1. Modeling Approach
- (1)
- ABAQUS/CAE was used for simple modeling of computational models, and regular grids were used for grid partitioning. Then, the model nodes and unit information after grid division are exported and saved in a specific file format.
- (2)
- Based on the model size set in ABAQAUS/CAE, the number and orientation of grains are set in the MATLAB (R2021a) program, and a polycrystalline geometric model is established.
- (3)
- By calculating the coordinates of the cells and nodes generated in the first step, it was determined which grain they belonged to, and group the cells were grouped according to the grain.
- (4)
- The obtained cell information was written into the input file (INP file) of ABAQUS based on the grouping information of grains.
- (5)
- Compiling the information of each grain into the INP file and constructing a finite element model.
2.2. Polycrystalline Modeling
- represents the hardening modulus of the slip system;
- represents potential hardening;
- represents the hardening coefficient at which yield occurs;
- represents the cumulative shear strain of all slip systems;
- represents the critical value of the initial decomposing shear stress;
- represents the critical value of shear stress of saturation decomposition;
- represents the interaction coefficient between slip system and slip system . When = , is 1, and when ≠, is 0.
- represents the slip hardening coefficient, which is used to represent the hardening effect of slip shear strain in slip system on slip system .
2.3. Material Parameters
- C11 represents elastic deformation along the crystal axis direction.
- C12 represents elastic deformation within the crystal plane.
- C44 represents shear deformation when the principal axis is along the crystal diagonal direction.
- n represents the hardening index.
- represents the critical value of the initial decomposing shear stress.
- represents the critical value of shear stress of saturation decomposition.
- represents the hardening coefficient at which yield occurs.
- Latent hardening description.
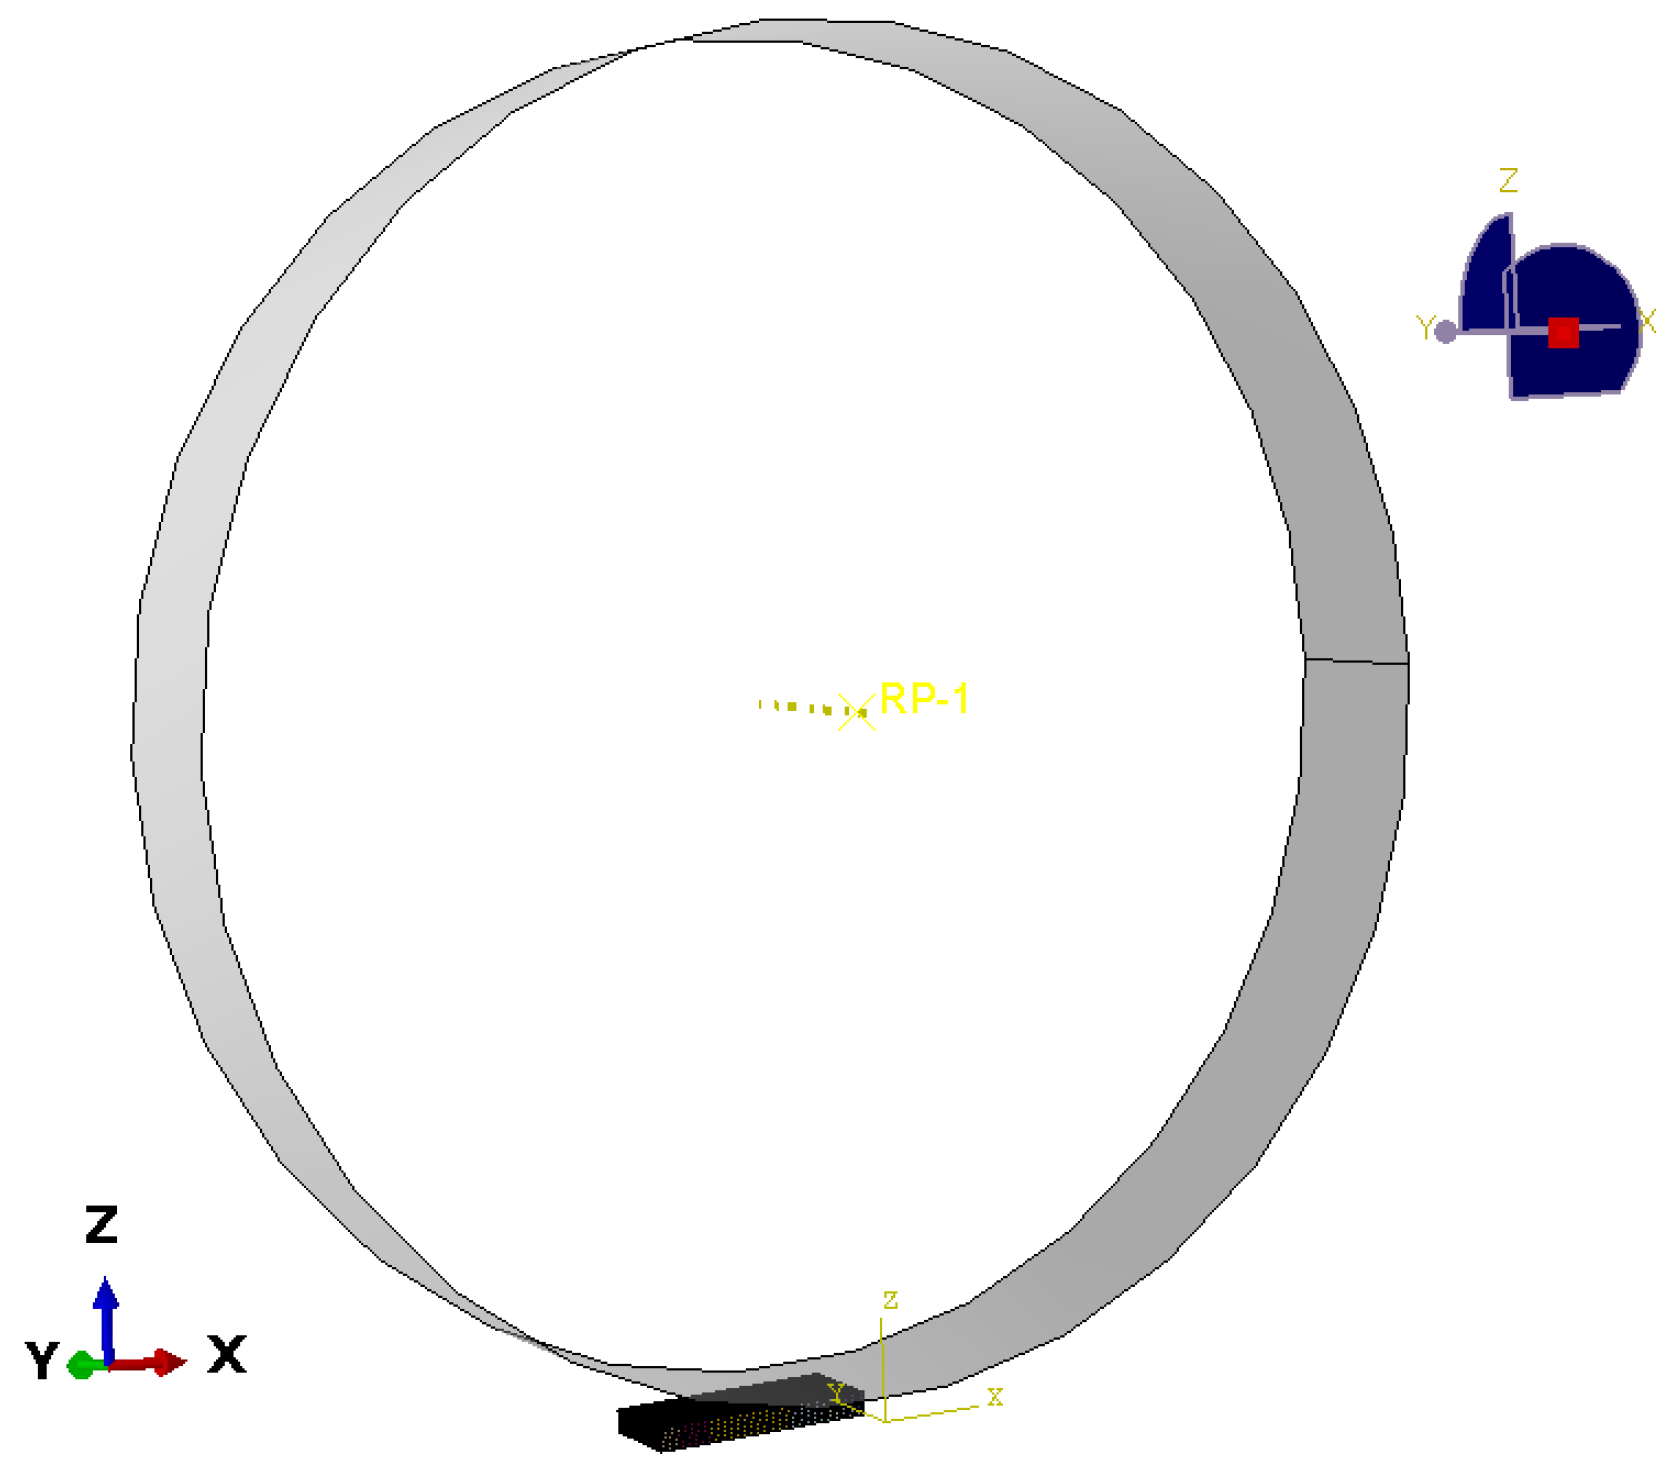
2.4. Finite Element Model
3. Results and Discussion
3.1. Current Strength of Rolling Aluminum Alloy
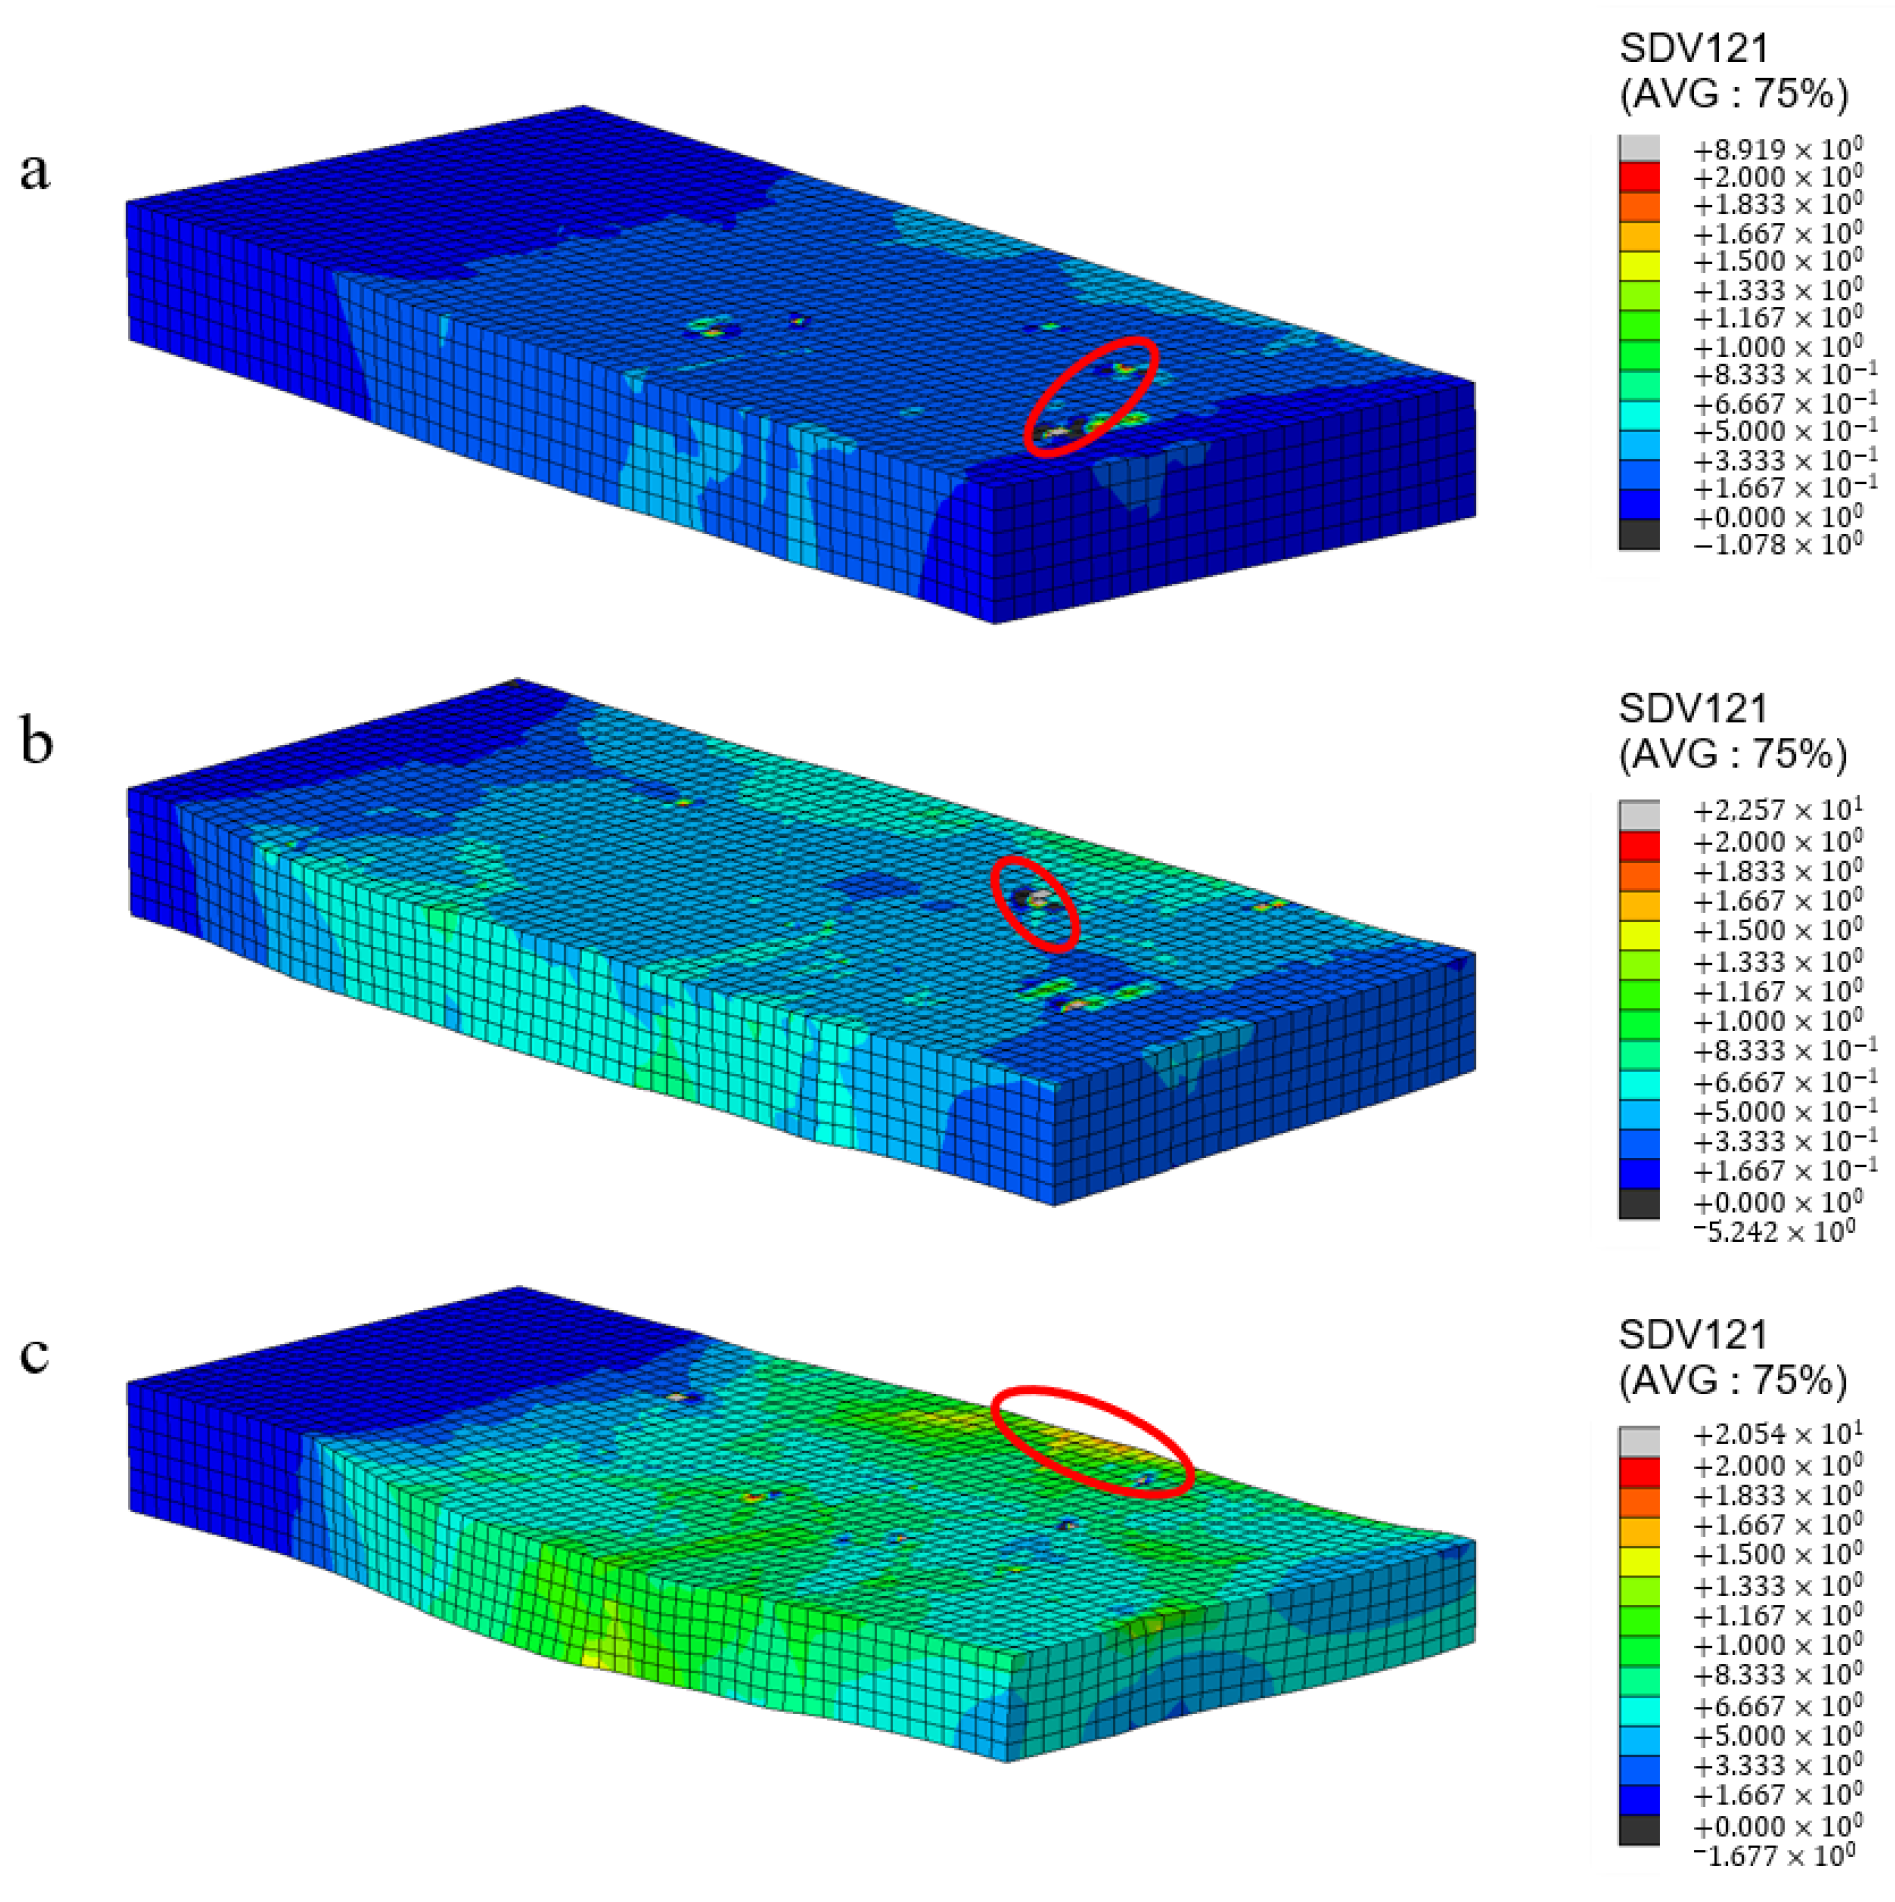
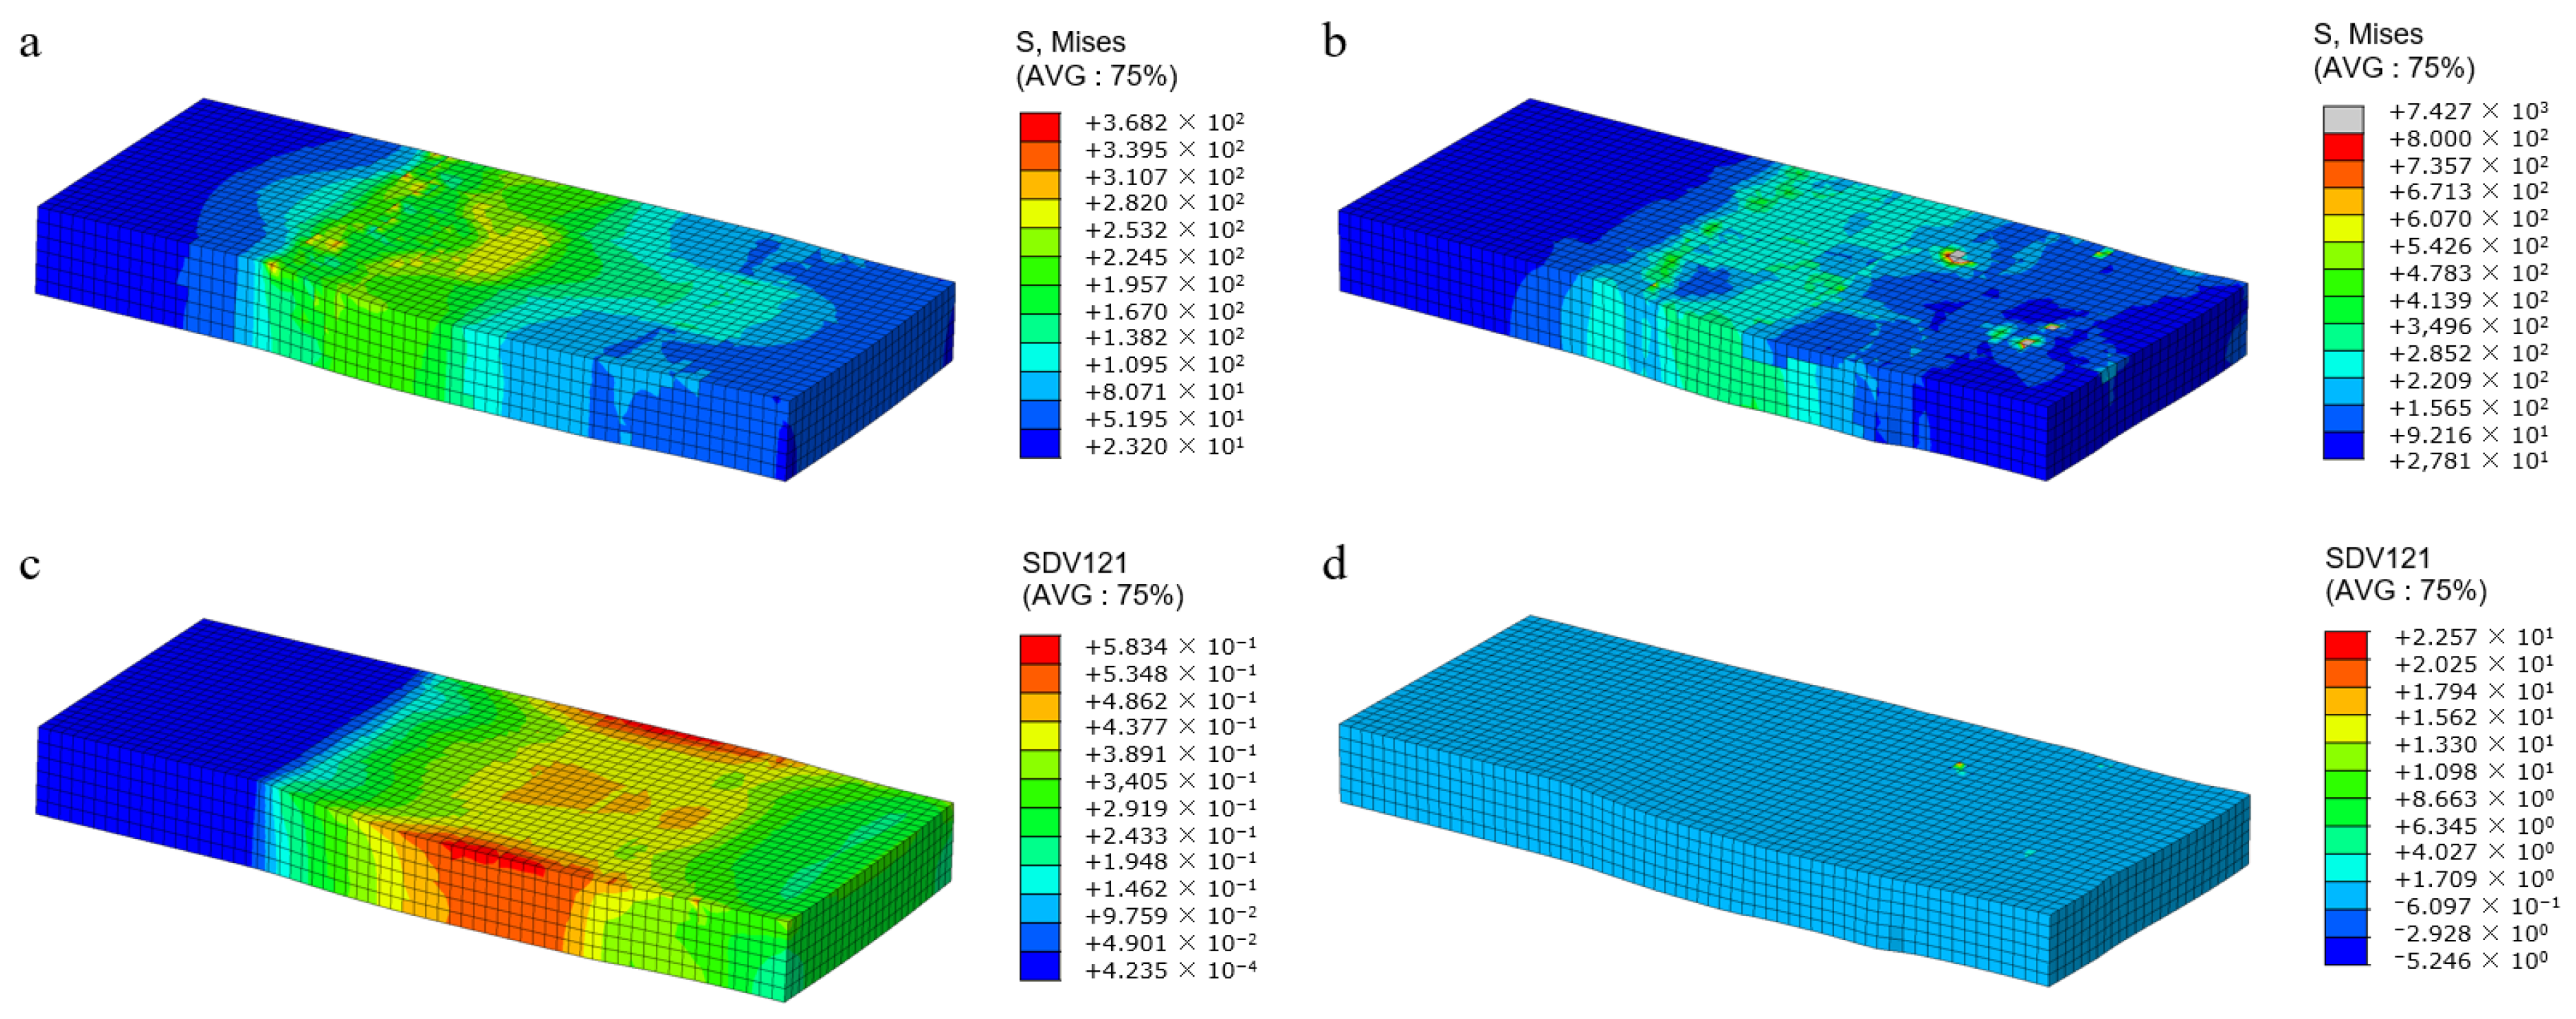
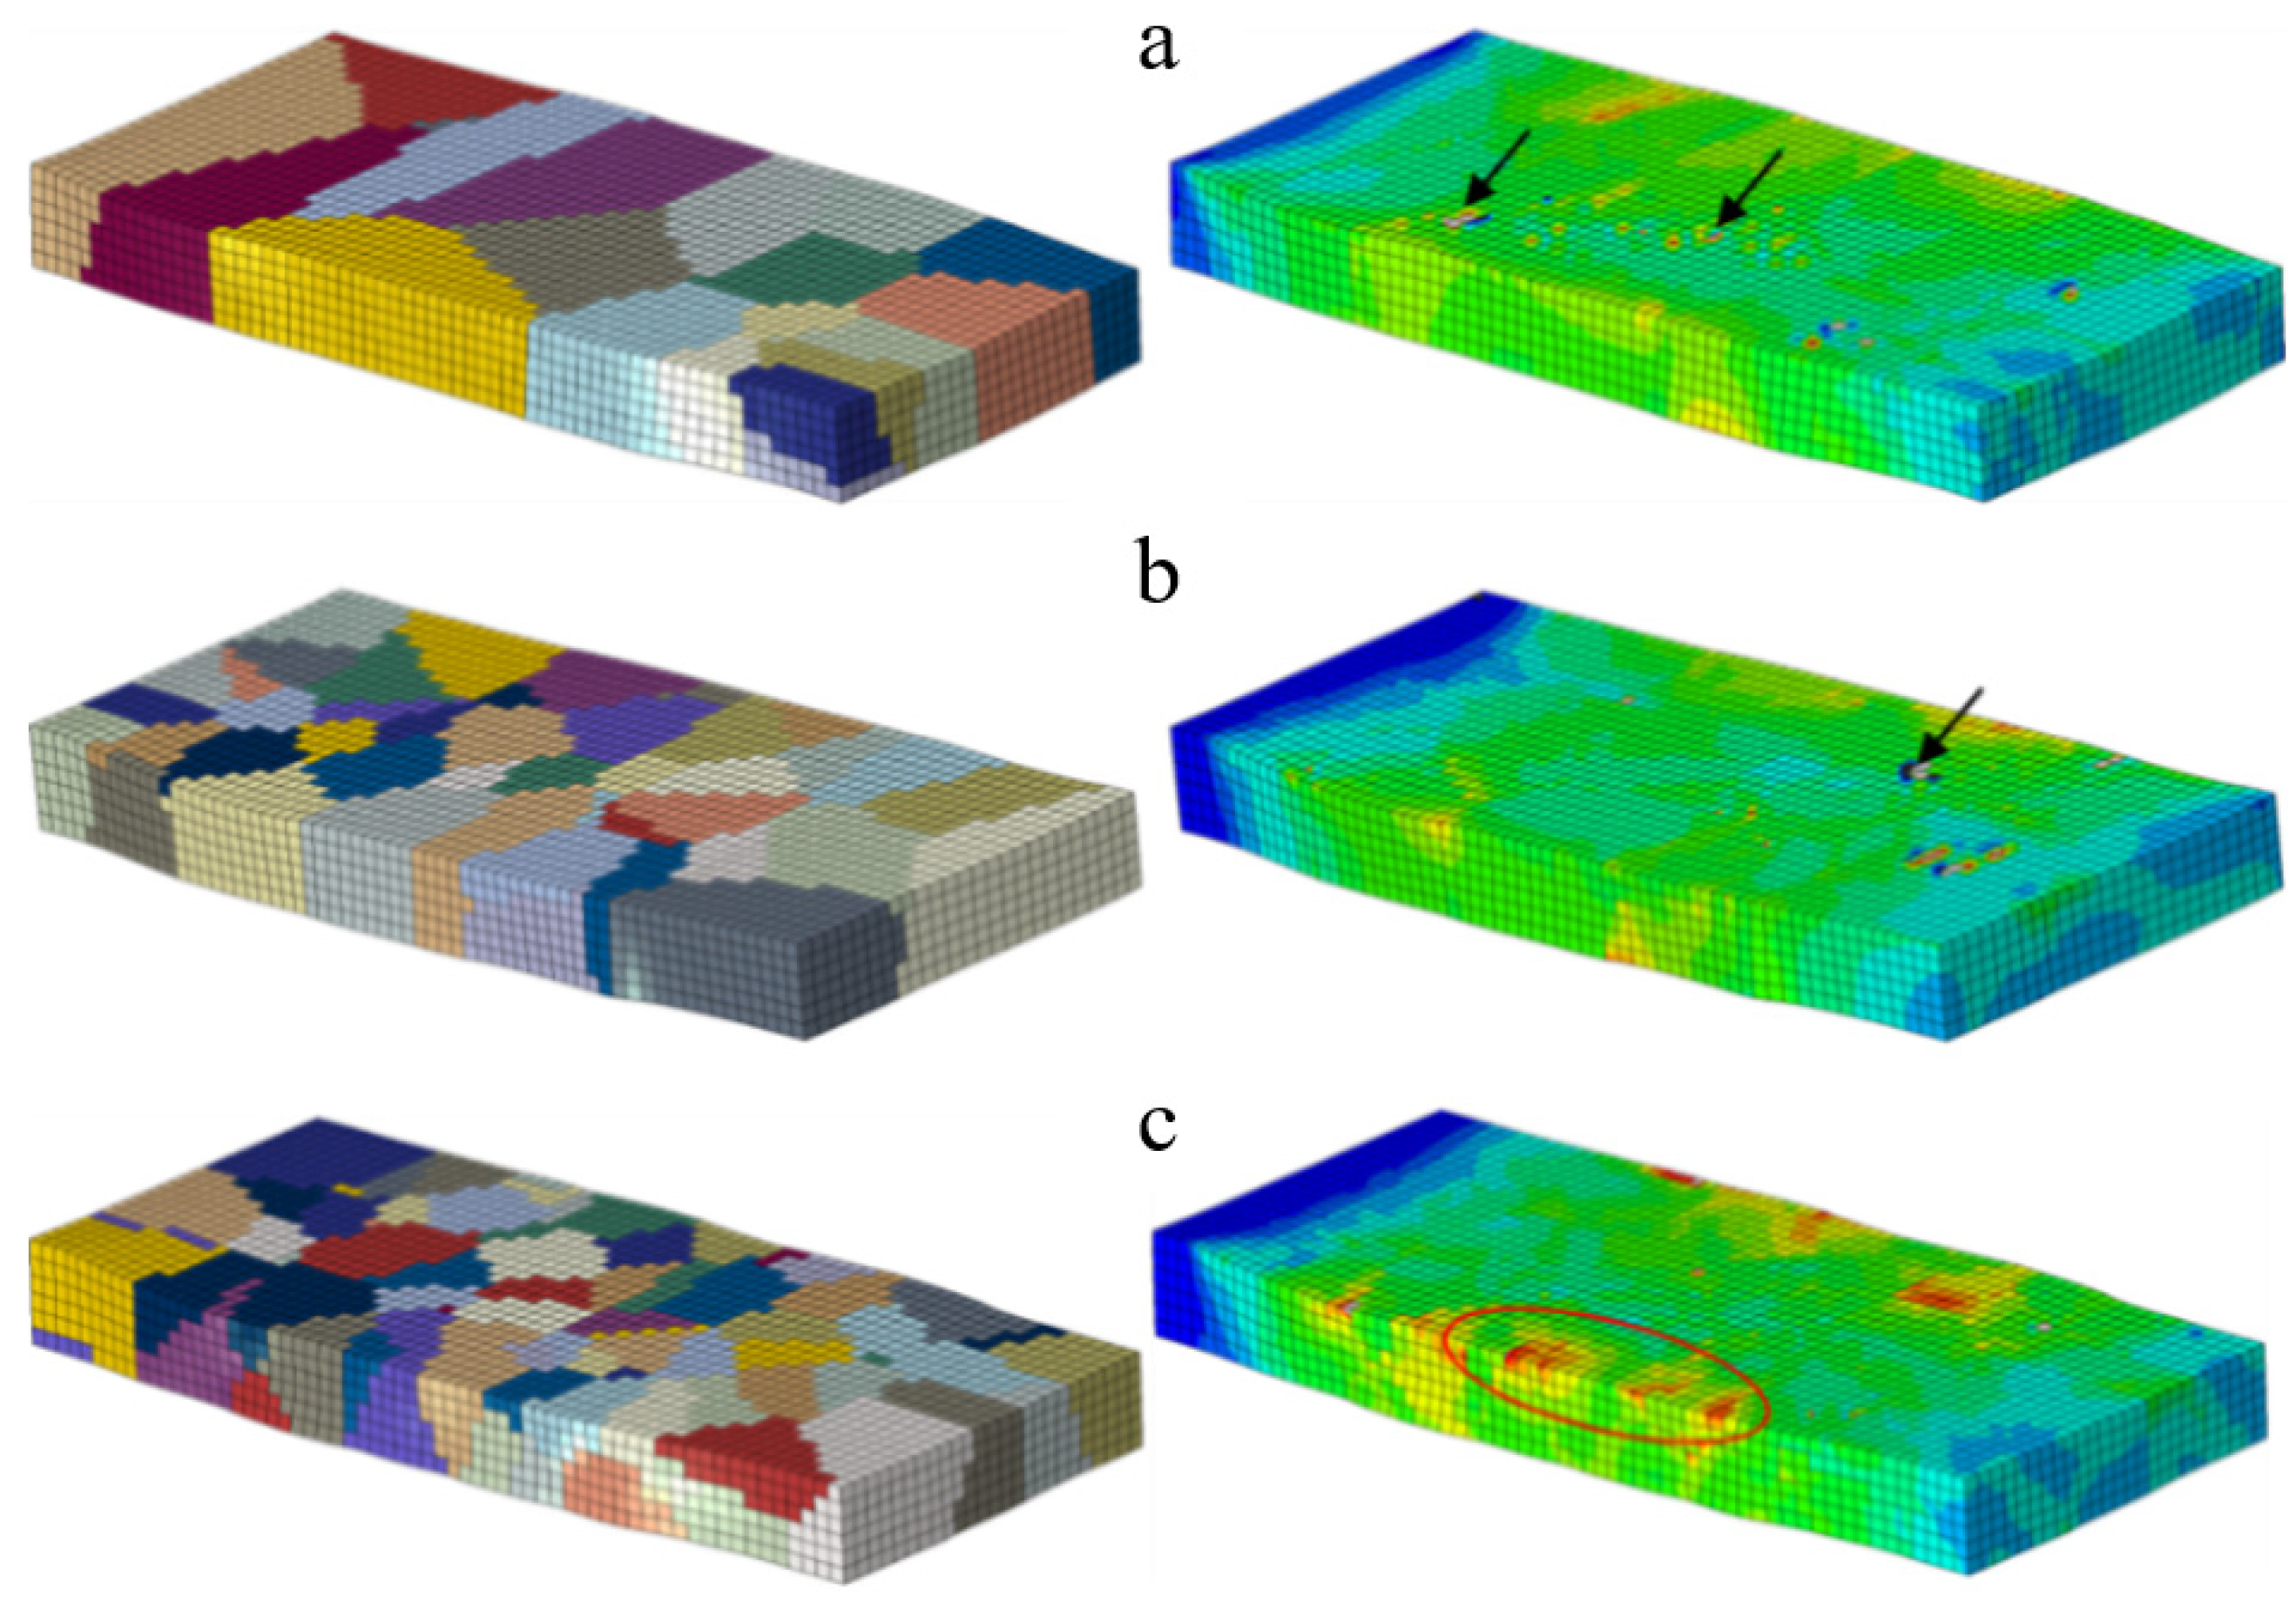
3.2. Stress and Strain Distribution
3.3. Shear Stress and Strain
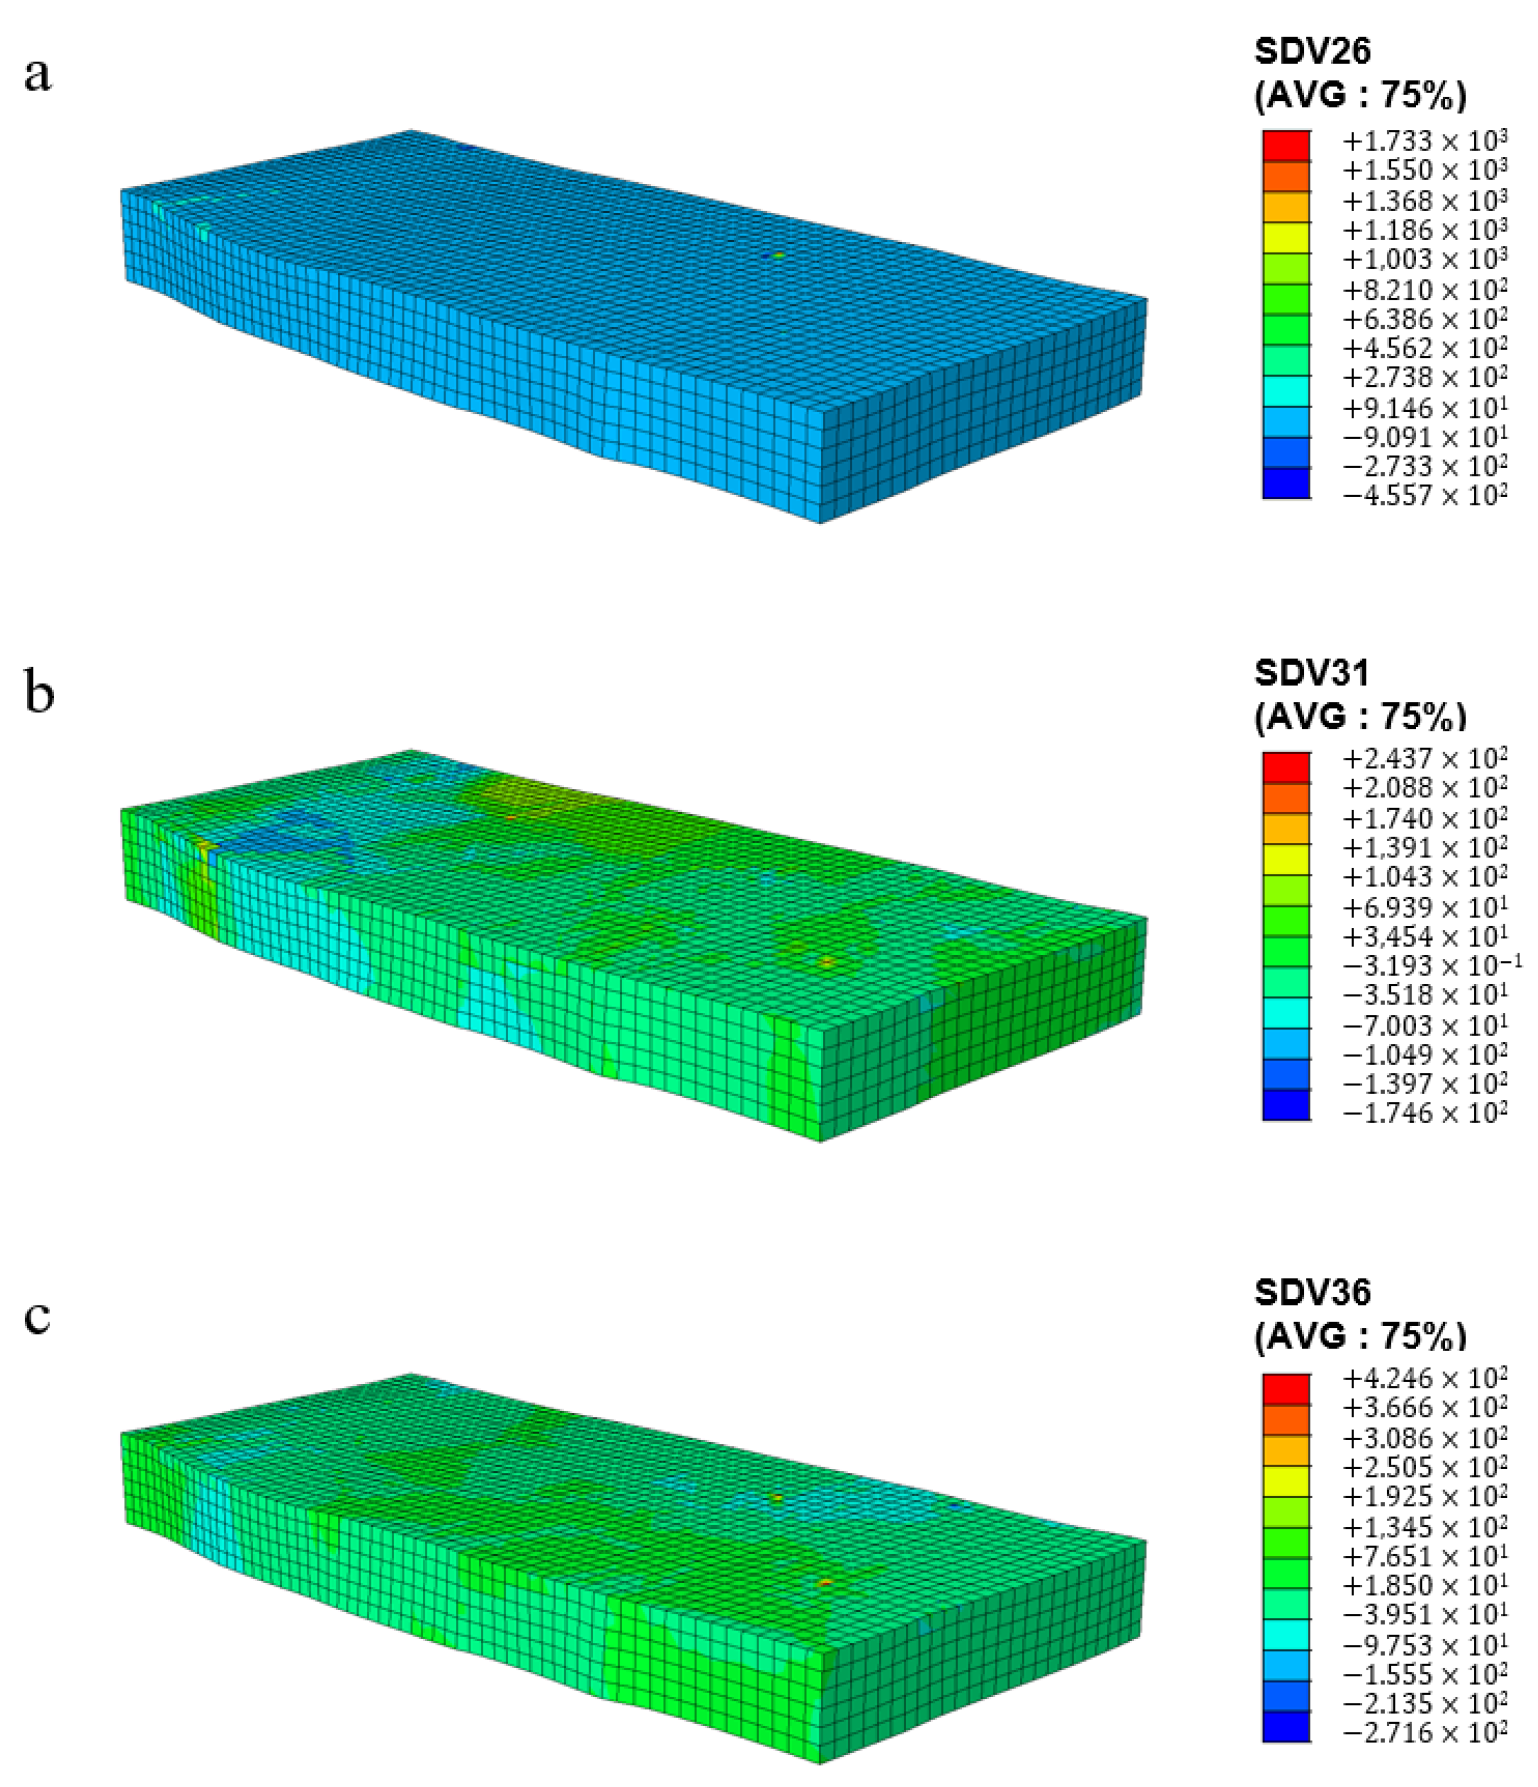
3.4. Shear Stress and Strain in Different Slip Systems
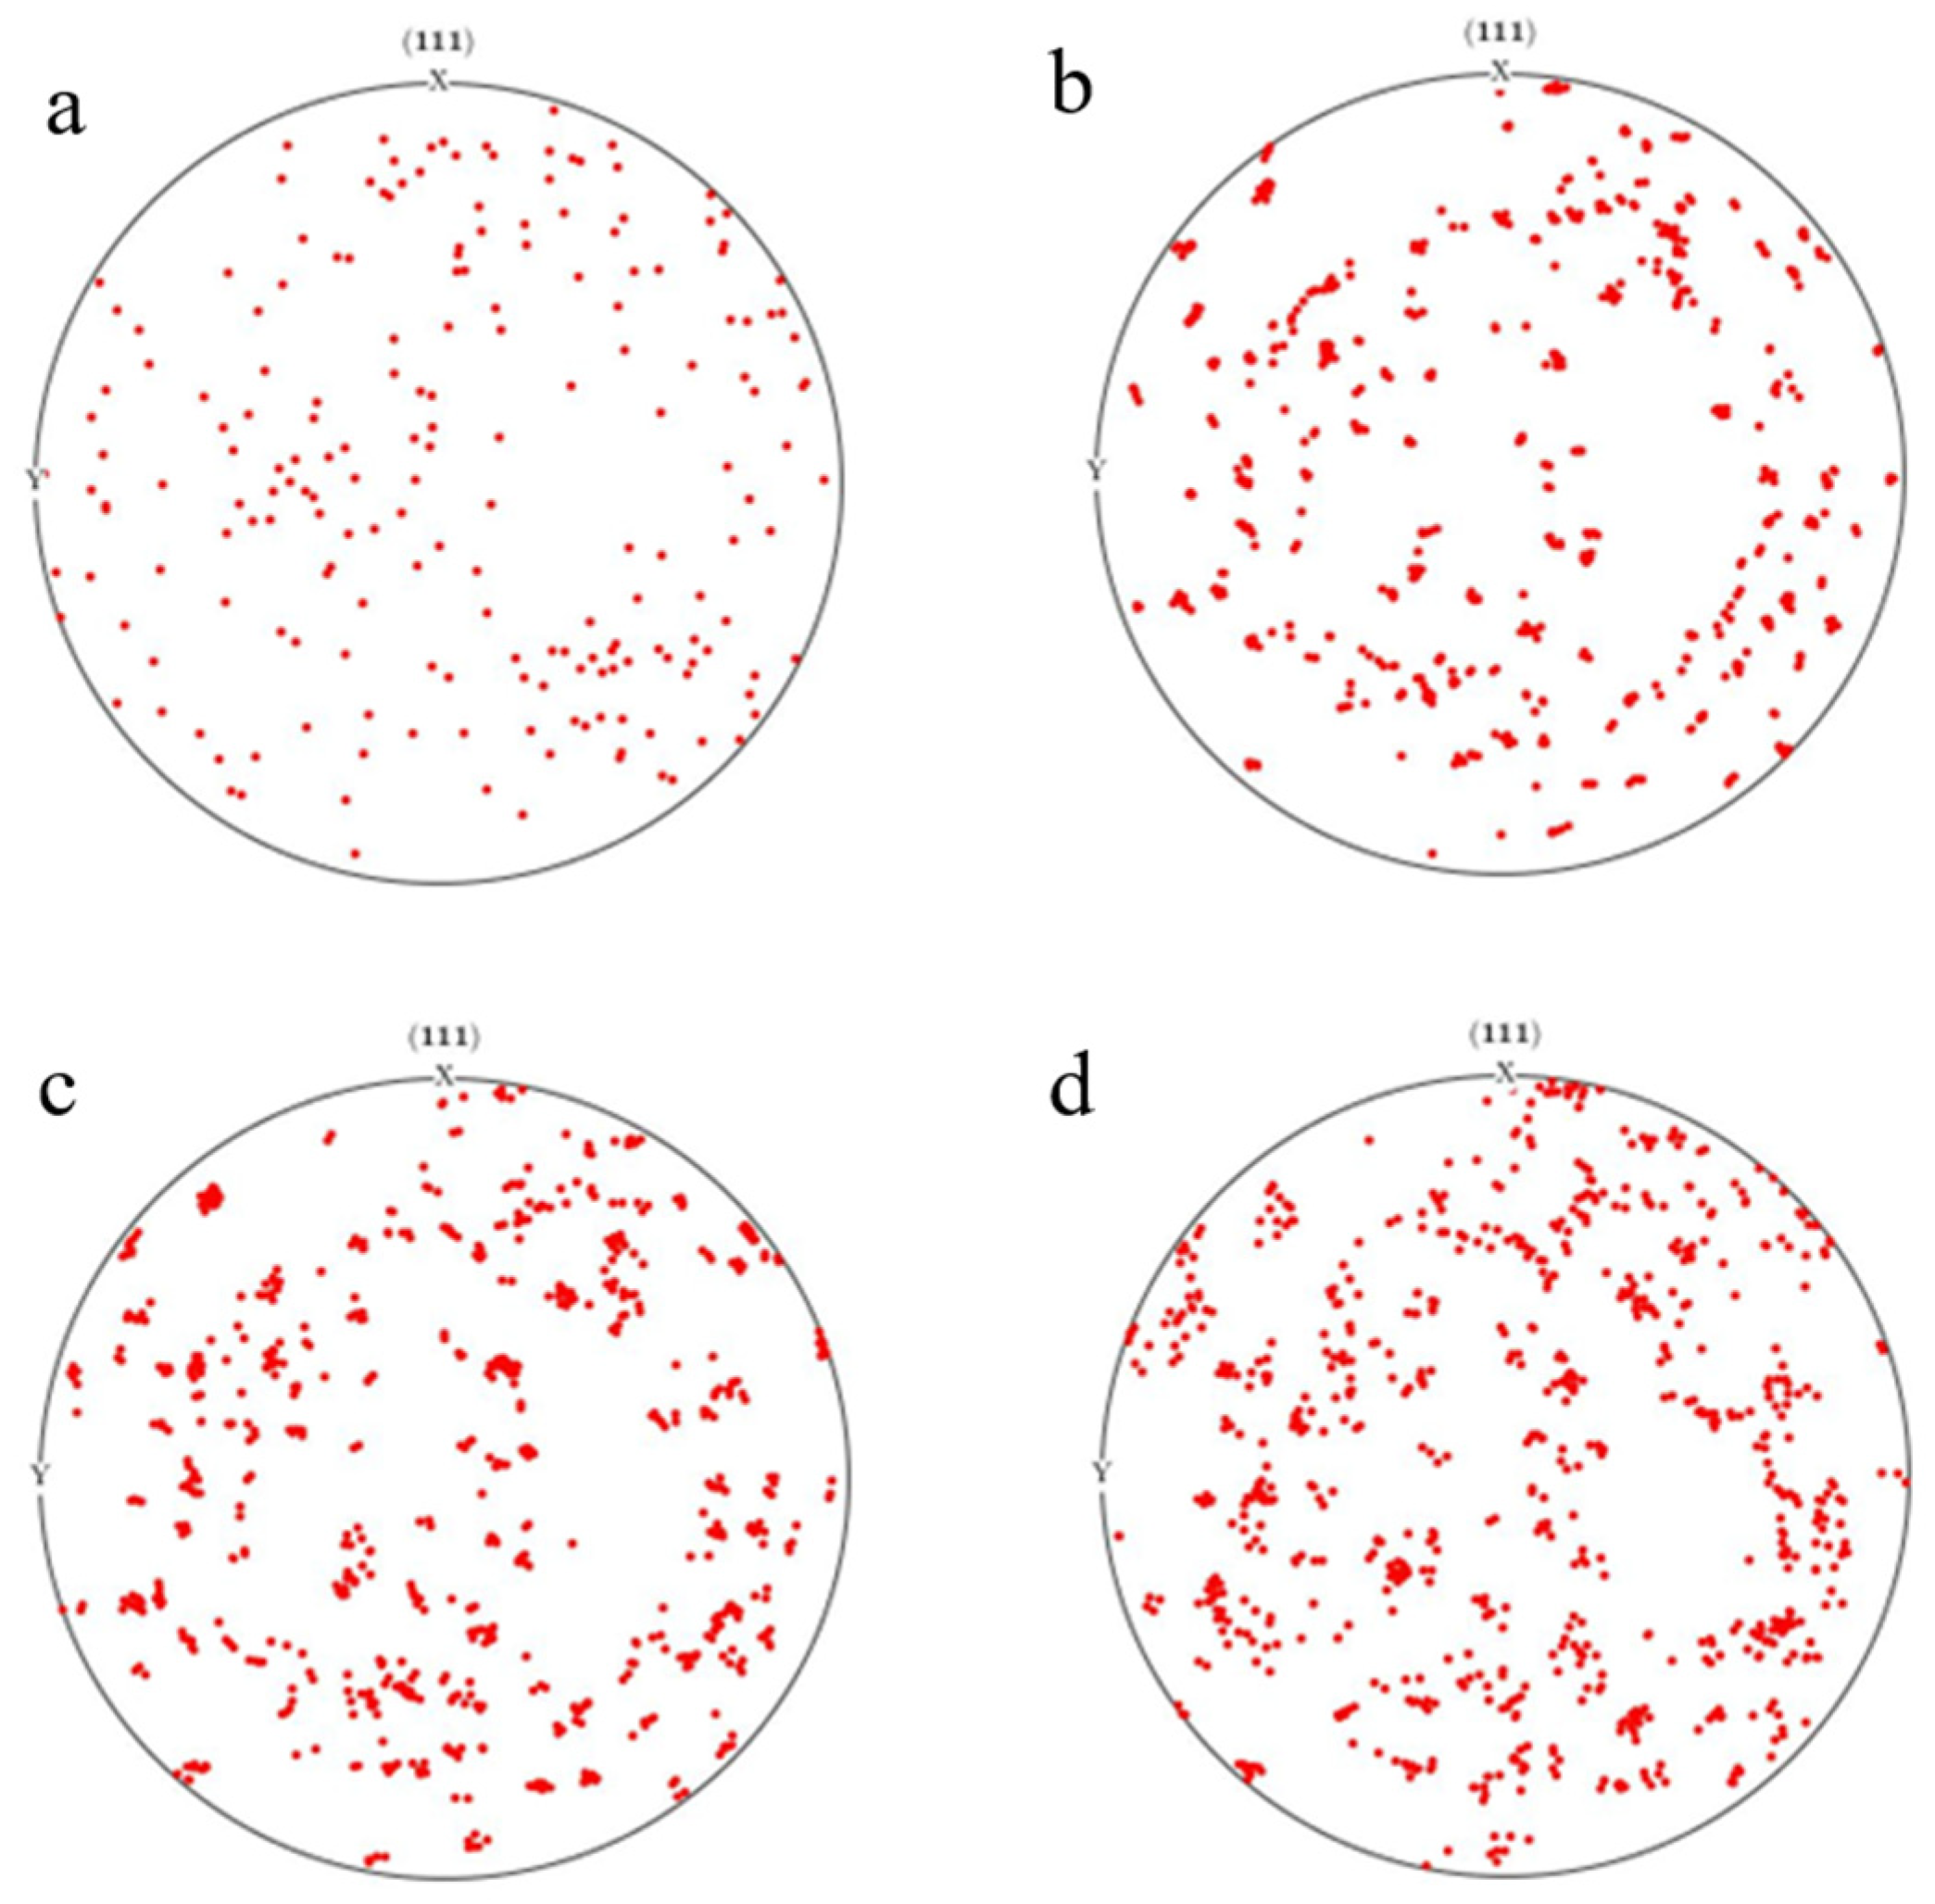
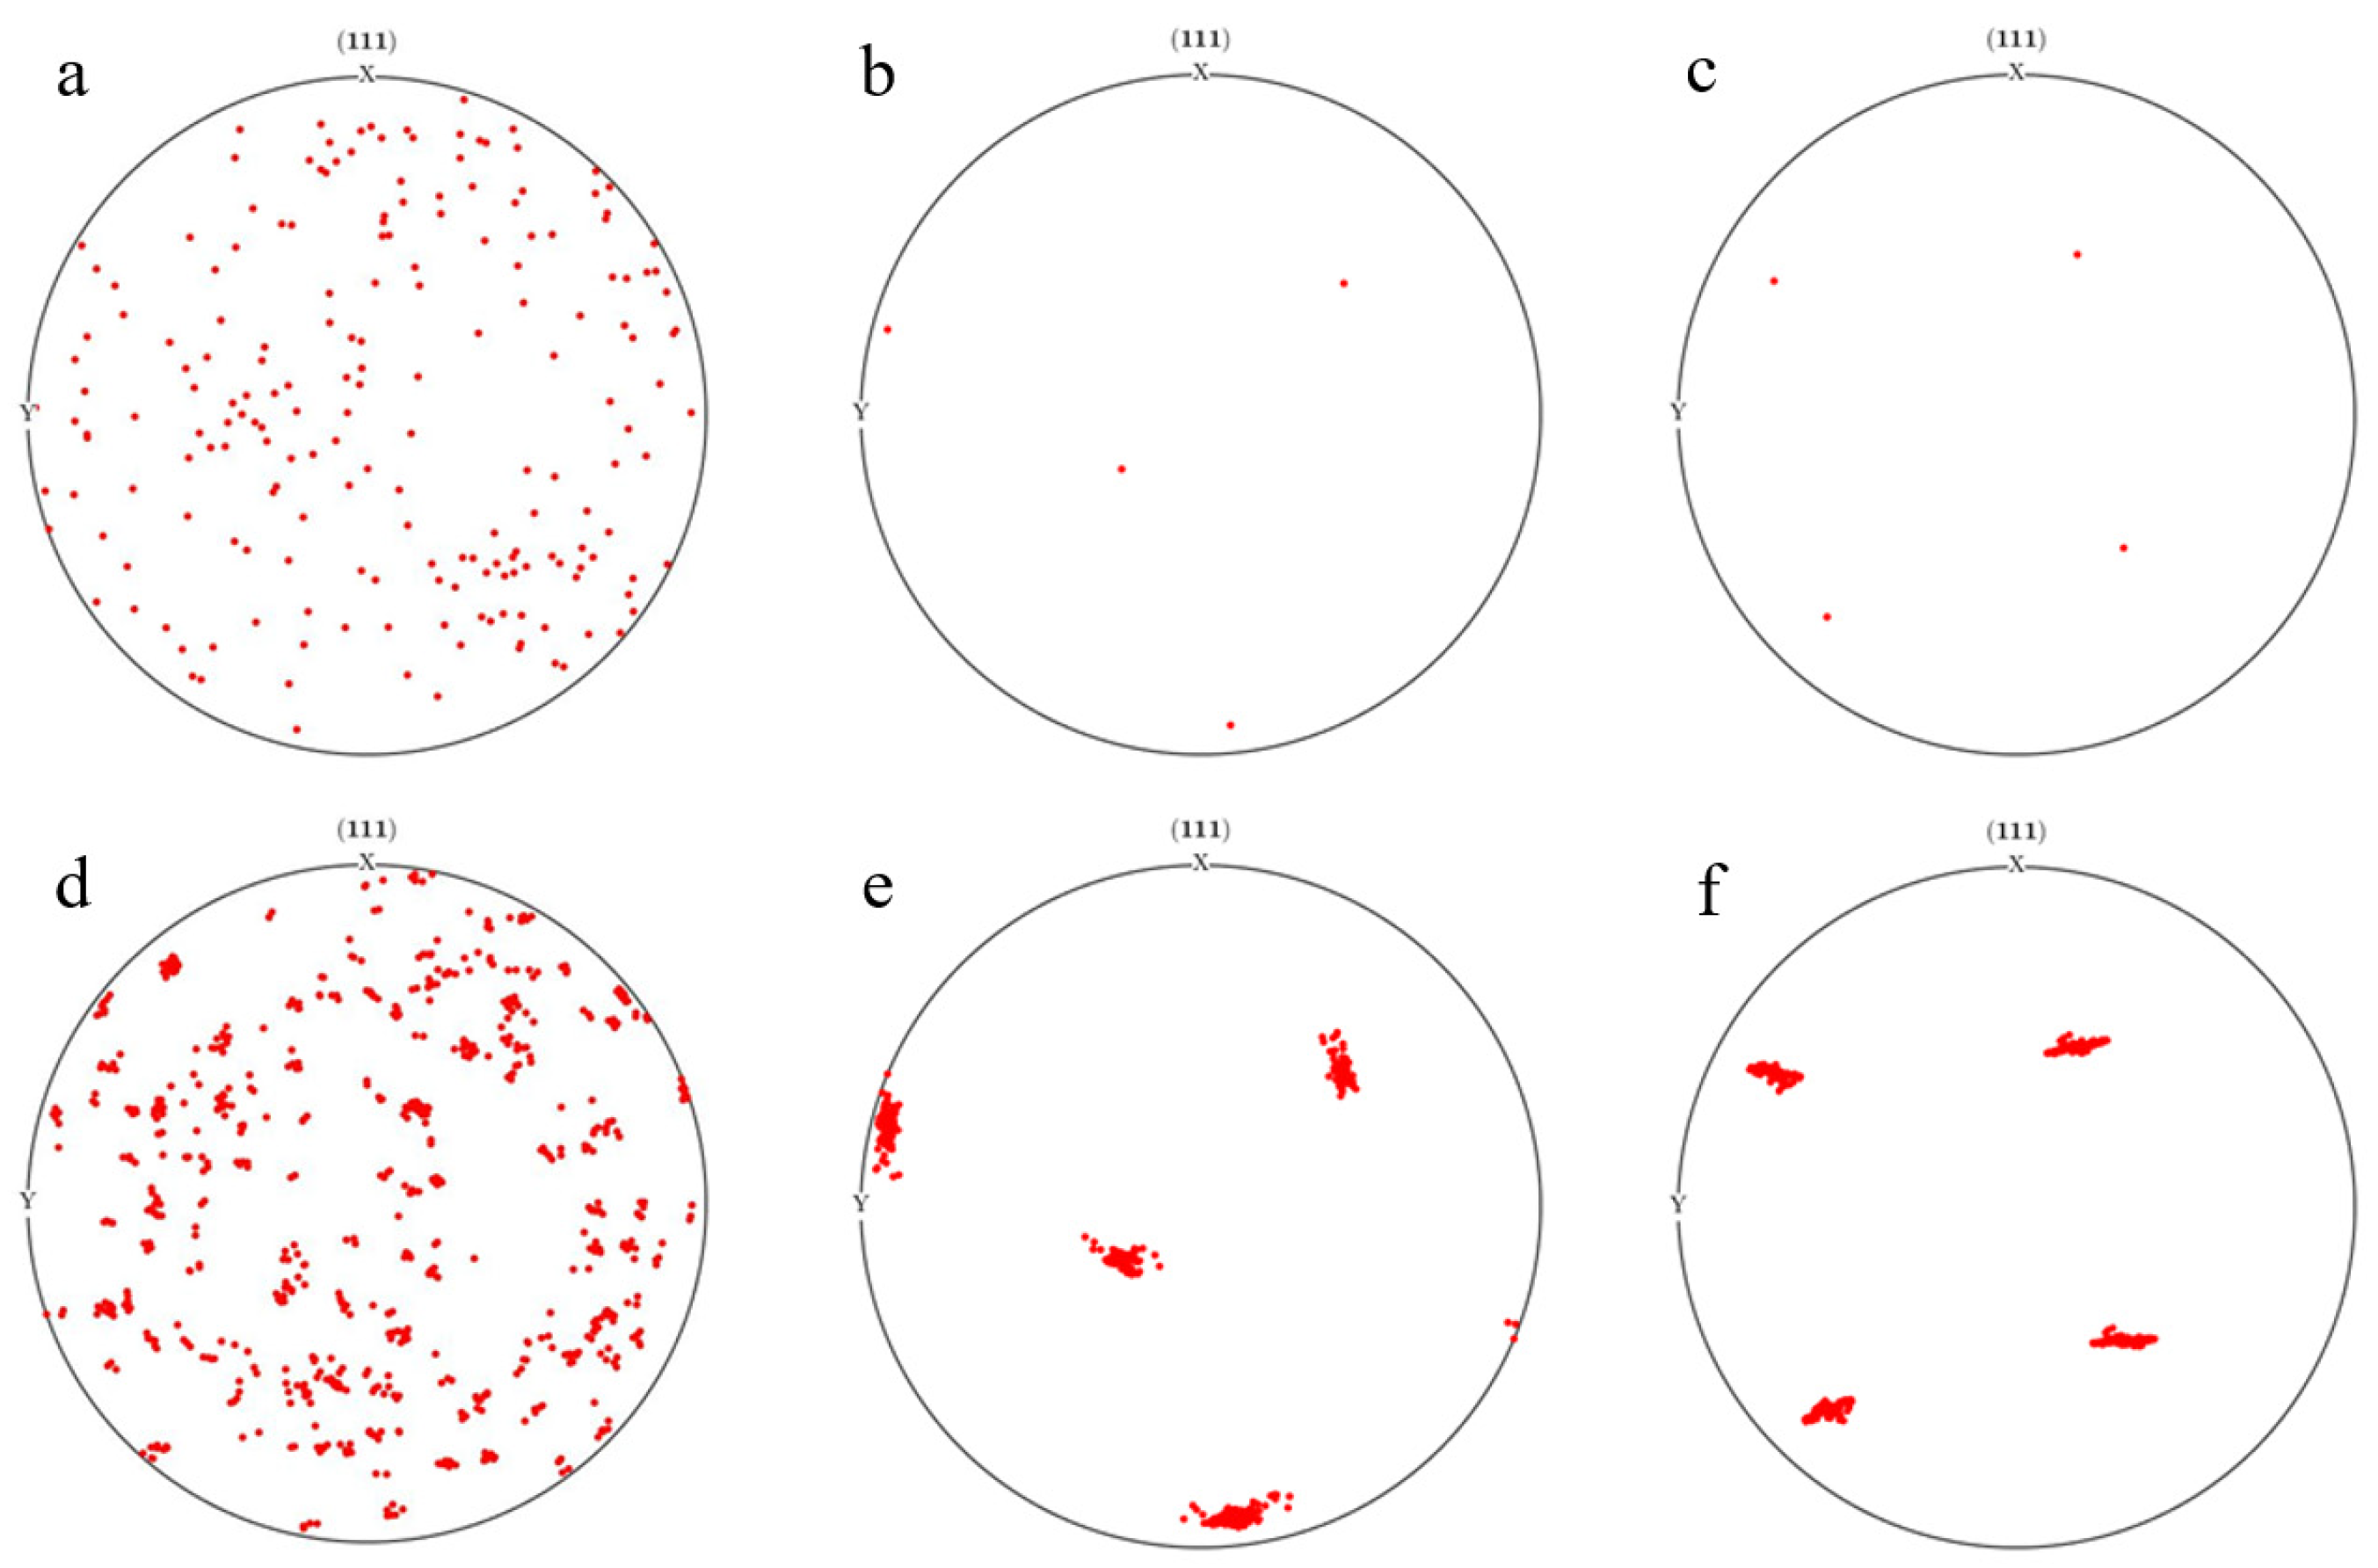
3.5. Influence of Rolling Deformation on Grain Orientation
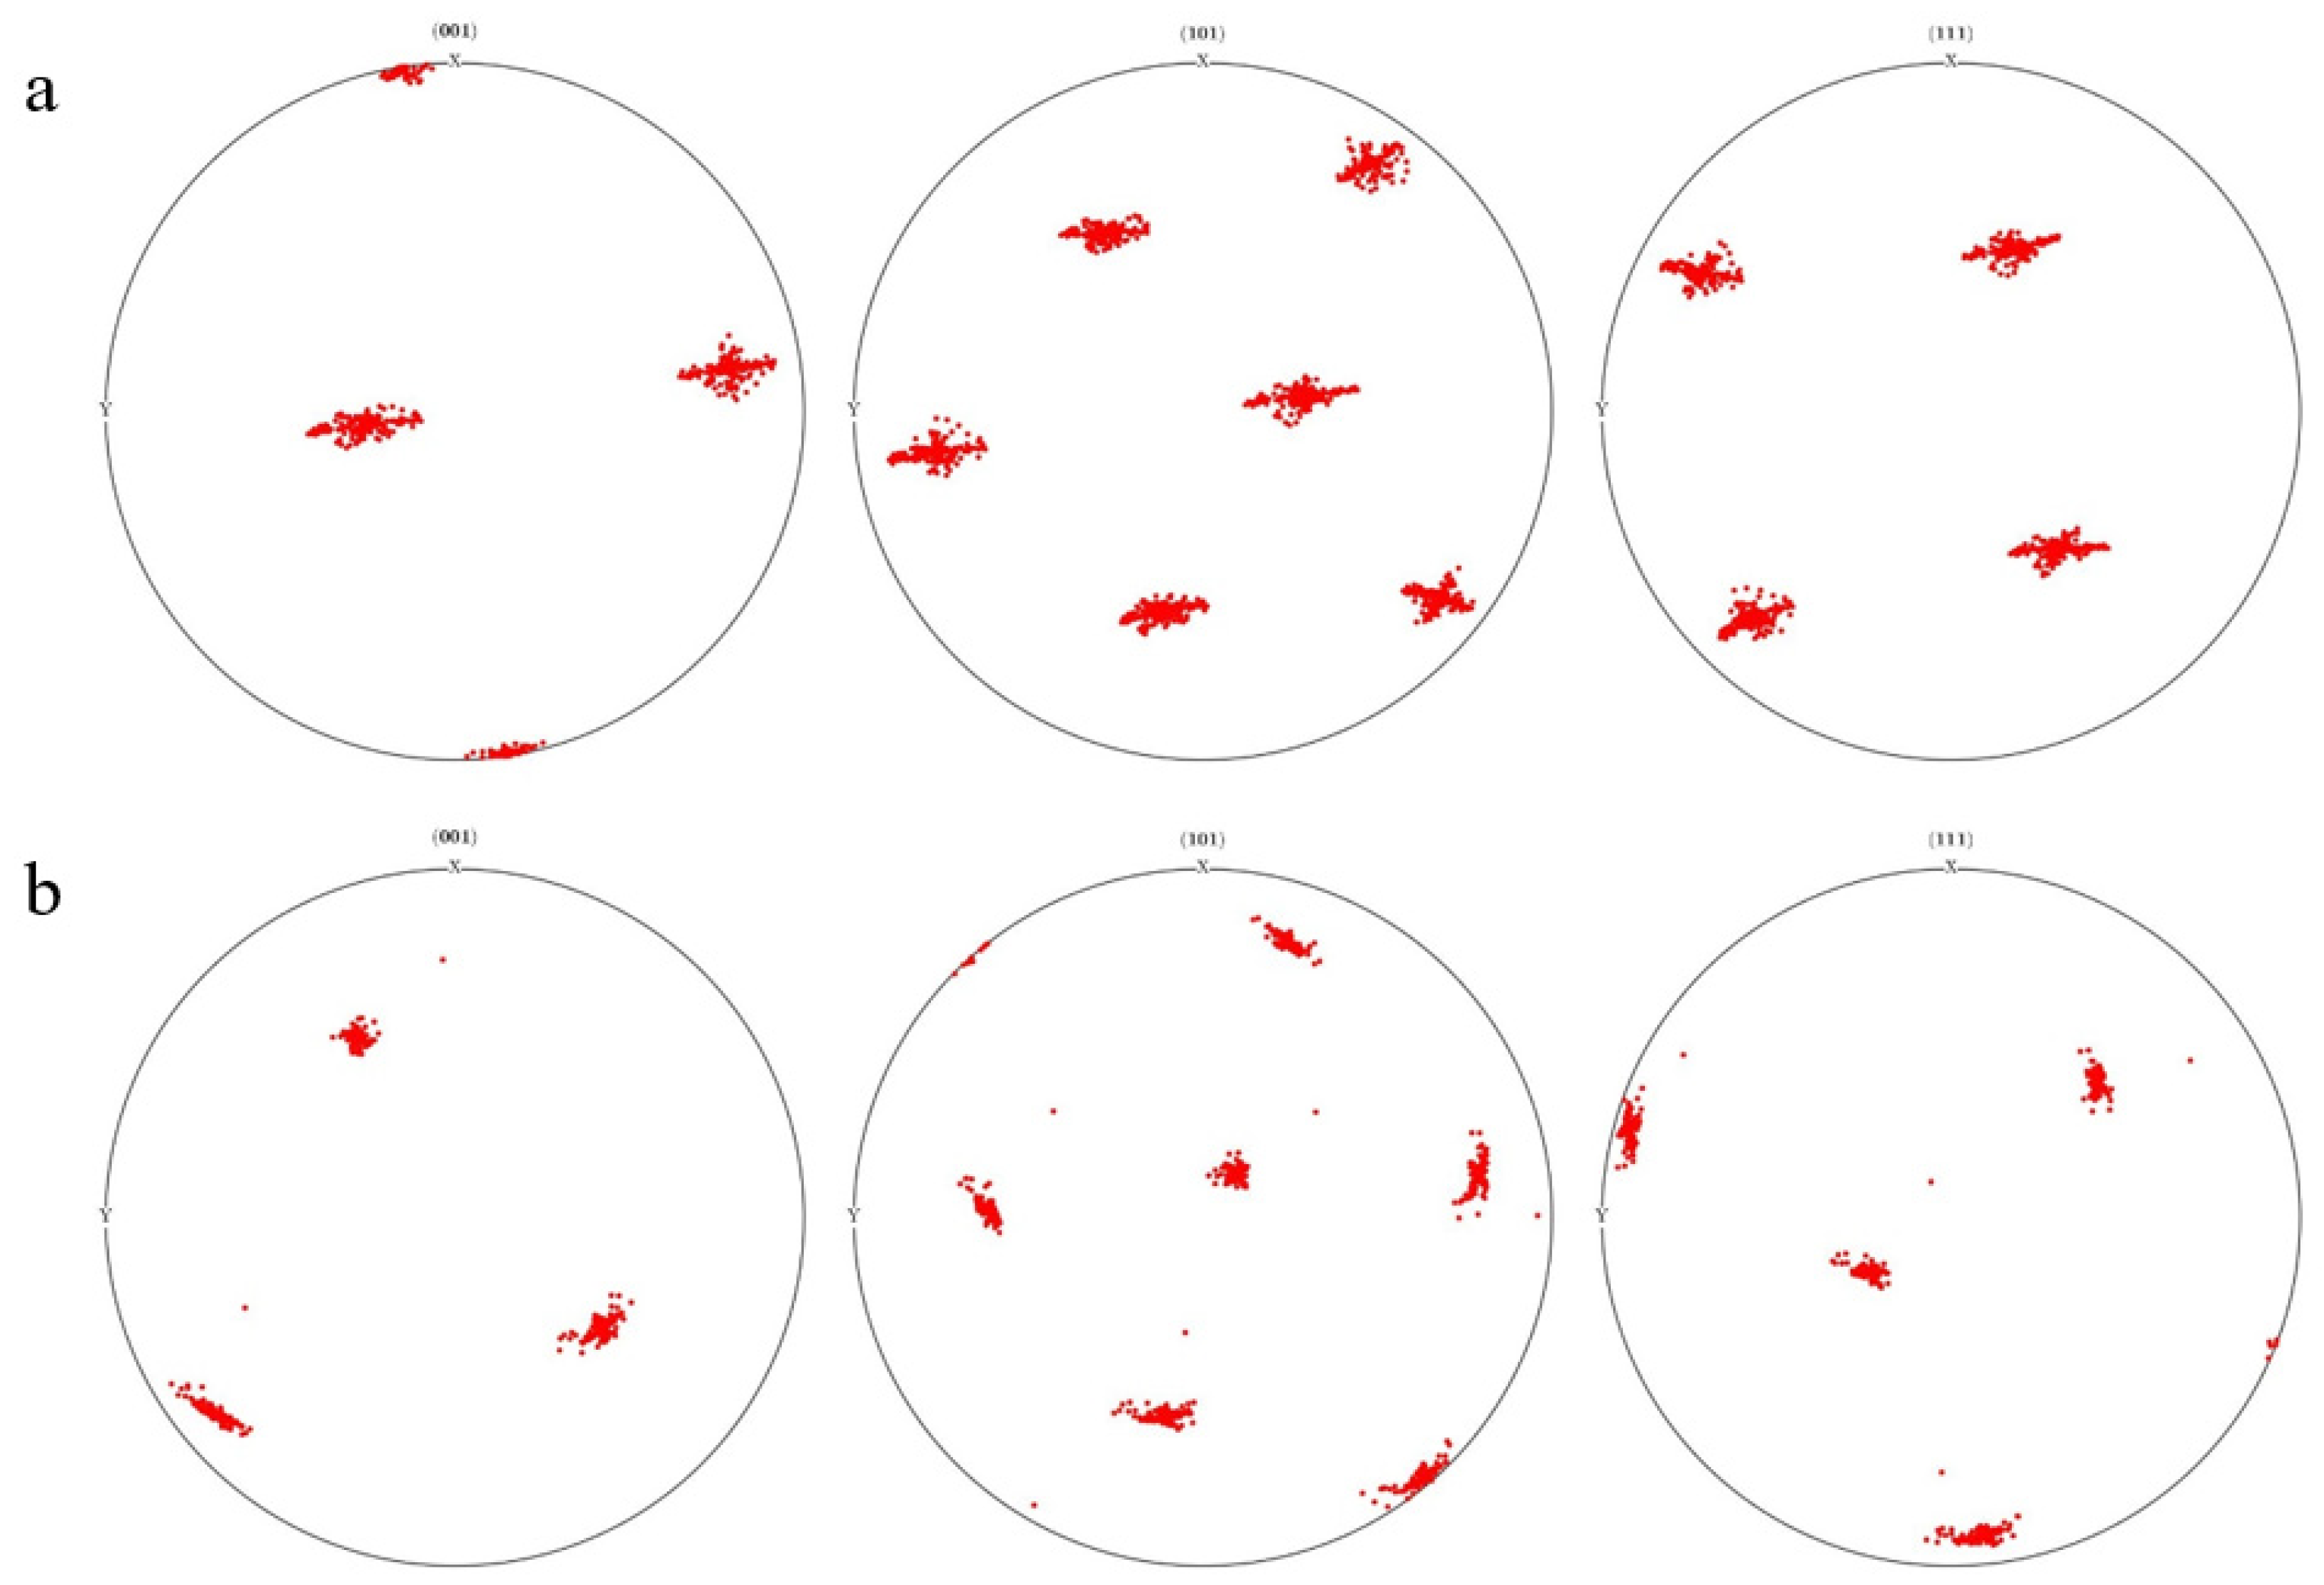
3.6. Experimental Study on Grain Characteristics after Cold Rolling
- The rolling process involved hot rolling followed by cold rolling. After homogenizing, the block was heated in a box resistance furnace to 550 °C for 2 h, then underwent multi-pass rolling. The starting rolling temperature was 550 °C, and the final rolling temperature should not be lower than 300 °C. The block was rolled to produce sheets approximately 120 mm wide and with a thickness reduced from 60 mm to 5 mm. After rolling, the sheets were air-cooled to room temperature.
- The cold rolling process involved taking the 5 mm thick hot-rolled sheet and cold rolling it in 5 passes at room temperature to produce thin cold-rolled sheets approximately 130 mm wide and 1mm thick.
- The cold-rolled sheets were processed into rectangular plates measuring 220 mm × 70 mm. They underwent solution treatment at 550 °C for 25 min followed by quenching in water, and then underwent aging treatment in a resistance furnace.
4. Conclusions
- (1)
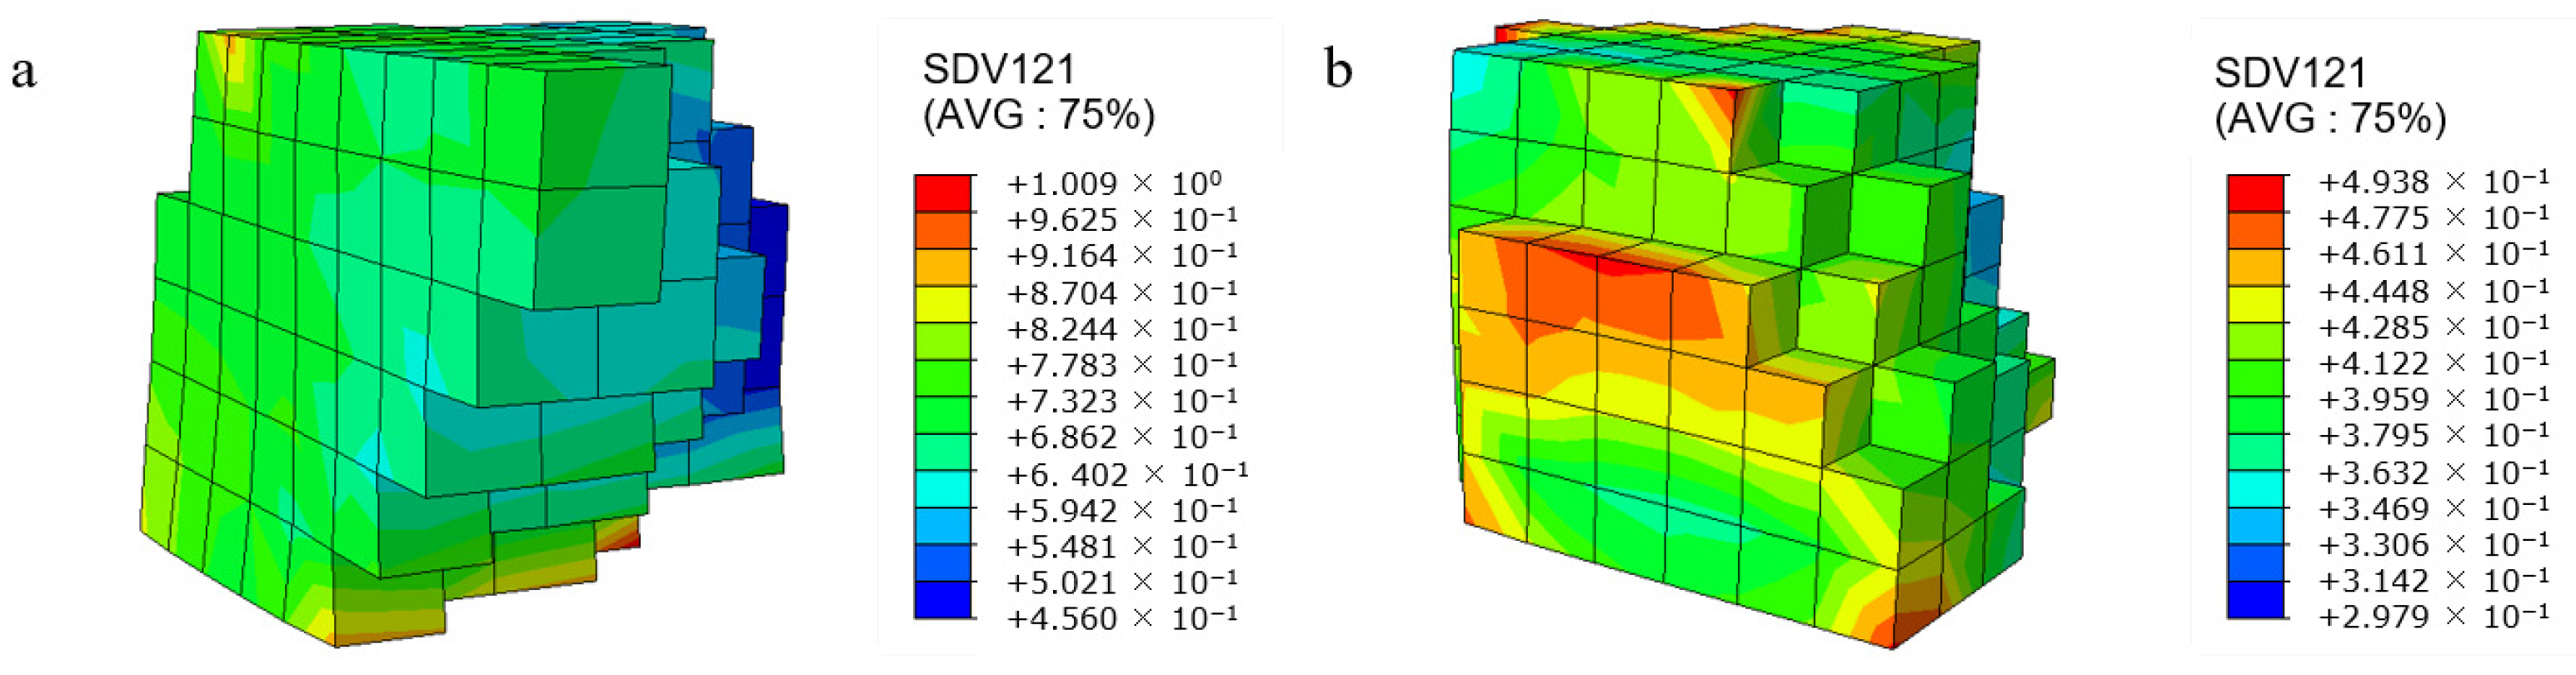
- At the grain scale, there was a significantly uneven distribution of strain in polycrystalline aluminum cold rolling, and the stress value showed an upward trend with the increase in compression. The strain and shear strain at the surface of the model were larger than those inside, which made a larger contribution to plastic deformation. The interaction between grains in the central position was stronger, and the deformation was limited during the rolling process. The smaller the grain size, the lower the strain concentration at the grain boundary.
- (2)
- The grains were rotated and the initial orientation of the grains was different, resulting in significant differences in deformation and rotation during the rolling deformation process. In the cold rolling process of polycrystalline aluminum, S12 (11-1) <-110> slip had a larger contribution to the plastic deformation.
- (3)
- After rolling deformation, new orientation poles appeared and the concentration of orientation increased. The orientation of the grains expanded into more poles, and the grains rotated. The strength of texture and the volume fraction of texture increased with the increase in deformation.
Author Contributions
Funding
Institutional Review Board Statement
Informed Consent Statement
Data Availability Statement
Conflicts of Interest
References
- Liu, M.; Chen, J.; Lin, Y.; Xue, Z.; Roven, H.J.; Skaret, P.C. Microstructure, Mechanical Properties and Wear Resistance of an Al–Mg–Si Alloy Produced by Equal Channel Angular Pressing. Prog. Nat. Sci. 2020, 30, 485–493. [Google Scholar] [CrossRef]
- Prillhofer, R.; Rank, G.; Berneder, J.; Antrekowitsch, H.; Uggowitzer, P.J.; Pogatscher, S. Property Criteria for Automotive Al-Mg-Si Sheet Alloys. Materials 2014, 7, 5047–5068. [Google Scholar] [CrossRef] [PubMed]
- Xu, X.; Jiang, L.; Lu, W.; Lu, Y.; Fei, Z.; Cheng, C. Effect of Rolling and Subsequent Heat Treatment on Tensile Property and Crystal Orientation of 5052 Al Alloy. Rare Metal Mater. Eng. 2014, 43, 245–248. [Google Scholar]
- Liang, C.; Deng, W.; Shi, Z.; Han, Q. Large Plastic Deformation and Material Microstructure Characterization; Science Press: Beijing, China, 2016. [Google Scholar]
- Pérez-Alvarado, A.; Arreola-Villa, S.A.; Calderón-Ramos, I.; Servín Castañeda, R.; Mendoza de la Rosa, L.A.; Chattopadhyay, K.; Morales, R. Numerical Simulation of the Hot Rolling Process of Steel Beams. Materials 2021, 14, 7038. [Google Scholar] [CrossRef] [PubMed]
- Li, L.; Xie, H.; Liu, T.; Li, X.; Liu, X.; Huo, M.; Wang, E.; Li, J.; Liu, H.; Sun, L.; et al. Effects of Rolling Force on Strip Shape during Tandem Cold Rolling Using a Novel Multistand Finite Element Model. Steel Res. Int. 2022, 93, 2100359. [Google Scholar] [CrossRef]
- Zhang, T.; Wu, Y.; Gong, H.; Shi, W.; Jiang, F.; Jiang, S.; Jiang, S. Analysis of Temperature Asymmetry of Aluminum Alloy Thick Plate During Snake Hot Rolling. Int. J. Adv. Manuf. Technol. 2016, 87, 941–948. [Google Scholar]
- Wu, Q.; He, B.; Song, T.; Gao, J.; Shi, S. Cluster Expansion Method and Its Application in Computational Materials Science. Comput. Mater. Sci. 2016, 125, 243–254. [Google Scholar] [CrossRef]
- Ha, S.; Jang, J.-H.; Kim, K.T. Finite Element Implementation of Dislocation-Density-Based Crystal Plasticity Model and Its Application to Pure Aluminum Crystalline Materials. Int. J. Mech. Sci. 2017, 120, 249–262. [Google Scholar] [CrossRef]
- Zhao, Y.; Hu, G.; Zhao, D.; Zhang, T.; Ma, S.; Wang, Z. Crystal Plastic Finite Element Analysis of Dynamic Compression of Aluminum Alloy Considering Dislocation Density. J. Taiyuan Univ. Technol. 2023, 54, 162–169. [Google Scholar]
- Iadicola, M.A.; Hu, L.; Rollett, A.D.; Foecke, T. Crystal Plasticity Analysis of Constitutive Behavior of 5754 Aluminum Sheet Deformed Along Bi-linear Strain Paths. Int. J. Solids Struct. 2012, 49, 3507–3516. [Google Scholar] [CrossRef]
- Pustovoytov, D.; Pesin, A.; Biryukova, O. Finite Element Analysis of Strain Gradients in Aluminium Alloy Sheets Processed by Asymmetric Rolling. Procedia Manuf. 2018, 15, 129–136. [Google Scholar] [CrossRef]
- Akopyan, T.K.; Gamin, Y.V.; Galkin, S.P.; Prosviryakov, A.S.; Alechchenko, A.S.; Noshin, M.A.; Koshmin, A.N.; Fomin, A.V. Radial-shear Rolling of High-Strength Aluminum Alloys: Finite Element Simulation and Analysis of Microstructure and Mechanical Properties. Mater. Sci. Eng. 2020, 786, 139424. [Google Scholar] [CrossRef]
- Jagadish, A.R.; Pereira, A.; Thorat, A.; Kumar, P. Finite Element Simulation of Liquid Nitrogen Temperature Rolling of Marine Grade Aluminium Alloy 5754. Mater. Today Proc. 2022, 62, 5861–5866. [Google Scholar] [CrossRef]
- Cho, J.-H.; Lee, G.-Y.; Lee, S.-H. Dynamic Shear Texture Evolution during the Symmetric and Differential Speed Rolling of Al-Si-Mg Alloys Fabricated by Twin Roll Casting. Materials 2024, 17, 179. [Google Scholar] [CrossRef]
- Korkolis, Y.P.; Knysh, P.; Sasaki, K.; Furushima, T.; Knezevic, M. Deformation-Induced Surface Roughening of an Aluminum–Magnesium Alloy: Experimental Characterization and Crystal Plasticity Modeling. Materials 2023, 16, 5601. [Google Scholar] [CrossRef]
- Shiraiwa, T.; Briffod, F.; Enoki, M. Prediction of Fatigue Crack Initiation of 7075 Aluminum Alloy by Crystal Plasticity Simulation. Materials 2023, 16, 1595. [Google Scholar] [CrossRef]
- Abd El-Aty, A.; Ha, S.; Xu, Y.; Hou, Y.; Zhang, S.-H.; Alzahrani, B.; Ali, A.; Ahmed, M.M.Z. Coupling Computational Homogenization with Crystal Plasticity Modelling for Predicting the Warm Deformation Behaviour of AA2060-T8 Al-Li Alloy. Materials 2023, 16, 4069. [Google Scholar] [CrossRef]
- Zheng, Z.; Wang, Z.; Feng, Q.; Yuan, S.; Wang, J. A Method of Polycrystal Finite Element Modeling Based on Voronoi Diagram. J. Guangxi Univ. 2016, 41, 460–469. [Google Scholar]
- Si, L.; Deng, G.; Cheng, L.; Liu, X. Polycrystal geometry modeling of crystal plasticity finite element method with voronoi diagram. J. Mater. Metall. 2009, 8, 193–197, 216. [Google Scholar]
- Bassani, J.L.; Wu, T.Y. Latent Hardening in Single Crystals II. Analytical Characterization and Predictions. Proc. R. Soc. A 1991, 435, 21–41. [Google Scholar]
- Alcalá, J.; Casals, O.; Očenášek, J. Micromechanics of Pyramidal Indentation in Fcc metals: Single Crystal Plasticity Finite Element Analysis. J. Mech. Phys. Solids 2008, 56, 3277–3303. [Google Scholar] [CrossRef]
- Wang, K.; Chen, J.; Li, Y.; Zhang, X.; Beake, B.D. Probing the Small-scale Impact Deformation Mechanism in An Aluminum Single-crystal. J. Mater. Sci. Tecnol. 2024, 187, 212–220. [Google Scholar] [CrossRef]


| C11/MPa | C12/MPa | C44/MPa | /MPa | /MPa | /MPa | |||
|---|---|---|---|---|---|---|---|---|
| 108,200 | 61,300 | 28,500 | 20 | 1.1 | 1 | 96 | 23.5 | 54 |
| Serial Number of Sliding System | UMAT Component | Sliding System | Shear Strain |
|---|---|---|---|
| S1 | SDV13 | (111)<0-11> |  |
| S2 | SDV14 | (111)<10-1> | 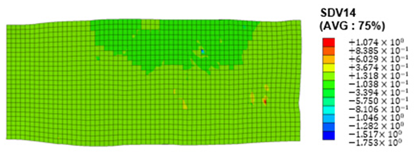 |
| S3 | SDV15 | (111)<-110> | 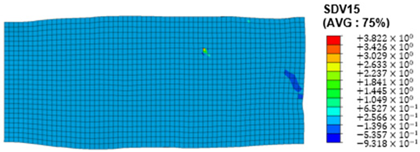 |
| S4 | SDV16 | (-111)<101> | 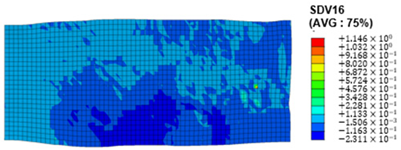 |
| S5 | SDV17 | (-111)<110> | 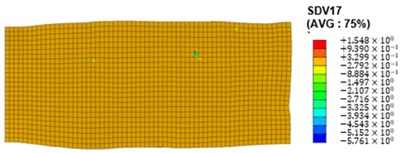 |
| S6 | SDV18 | (-111)<0-11> | 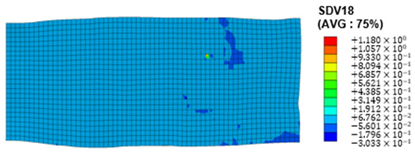 |
| S7 | SDV19 | (1-11)<011> | 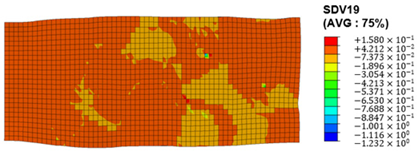 |
| S8 | SDV20 | (1-11)<110> |  |
| S9 | SDV21 | (1-11)<10-1> | 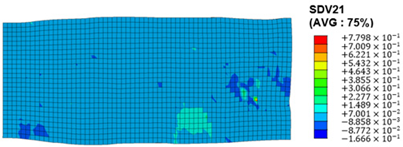 |
| S10 | SDV22 | (11-1)<011> | 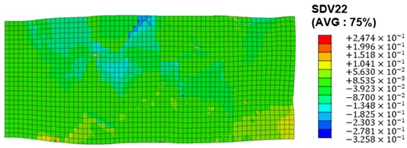 |
| S11 | SDV23 | (11-1)<101> |  |
| S12 | SDV24 | (11-1)<-110> |  |
Disclaimer/Publisher’s Note: The statements, opinions and data contained in all publications are solely those of the individual author(s) and contributor(s) and not of MDPI and/or the editor(s). MDPI and/or the editor(s) disclaim responsibility for any injury to people or property resulting from any ideas, methods, instructions or products referred to in the content. |
© 2024 by the authors. Licensee MDPI, Basel, Switzerland. This article is an open access article distributed under the terms and conditions of the Creative Commons Attribution (CC BY) license (https://creativecommons.org/licenses/by/4.0/).
Share and Cite
Li, J.; Wu, X.; Jiang, H. Crystal Plasticity Finite Element Simulation of Grain Evolution Behavior in Aluminum Alloy Rolling. Materials 2024, 17, 3749. https://doi.org/10.3390/ma17153749
Li J, Wu X, Jiang H. Crystal Plasticity Finite Element Simulation of Grain Evolution Behavior in Aluminum Alloy Rolling. Materials. 2024; 17(15):3749. https://doi.org/10.3390/ma17153749
Chicago/Turabian StyleLi, Jun, Xiaoyan Wu, and Haitao Jiang. 2024. "Crystal Plasticity Finite Element Simulation of Grain Evolution Behavior in Aluminum Alloy Rolling" Materials 17, no. 15: 3749. https://doi.org/10.3390/ma17153749
APA StyleLi, J., Wu, X., & Jiang, H. (2024). Crystal Plasticity Finite Element Simulation of Grain Evolution Behavior in Aluminum Alloy Rolling. Materials, 17(15), 3749. https://doi.org/10.3390/ma17153749