Article

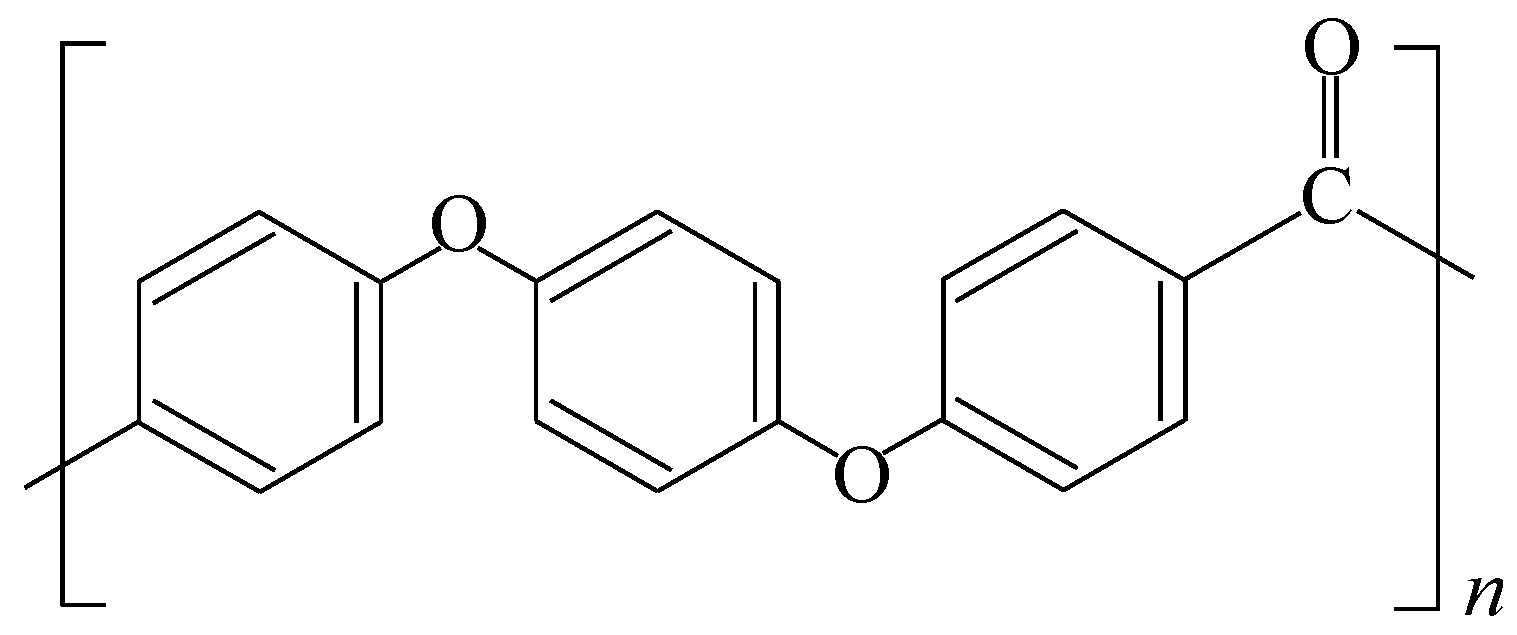
Low-Frequency Raman Spectroscopy on Amorphous Poly(Ether Ether Ketone) (PEEK)

1
Department of Systems Design Engineering, Akita University, 1-1 Tegatagakuen-machi, Akita 010-8502, Japan
2
Horiba Techno Service Co., Ltd., Chiyoda-ku, Tokyo 101-0063, Japan
3
Kiguchi Technics Inc., 114-15 Enoshima-cho, Yasugi-shi 692-0057, Japan
4
Division of Applied Chemistry, Faculty of Engineering, Hokkaido University, Kita 13 Nishi 8, Kita-ku, Sapporo 060-8628, Japan
5
Department of Chemistry, University of Otago, Dunedin 9016, New Zealand
*
Author to whom correspondence should be addressed.
Materials 2024, 17(15), 3755; https://doi.org/10.3390/ma17153755
Submission received: 31 May 2024 / Revised: 9 July 2024 / Accepted: 16 July 2024 / Published: 30 July 2024

Abstract

:
Low-frequency peaks in the Raman spectra of amorphous poly(ether ether ketone) (PEEK) were investigated. An amorphous sample with zero crystallinity, as confirmed by wide-angle X-ray diffraction, was used in this study. In a previous study, two peaks were observed in the low-frequency Raman spectra of the crystallized samples. Among these, the peaks at 135 cm−1 disappeared for the amorphous sample. Meanwhile, for the first time, the peak at 50 cm−1 was observed in the crystallized sample. Similar to the peak at 135 cm−1, the peak at 50 cm−1 disappeared in the amorphous state, and its intensity increased with increasing crystallinity. The origins of the two peaks were associated with the Ph-CO-Ph-type intermolecular vibrational modes in the simulation. This suggests that the Ph-CO-Ph vibrational mode observed in the low-frequency region of PEEK was strongly influenced by the intermolecular order.

1. Introduction

In recent years, carbon fiber–reinforced plastic (CFRP) has gained attention in multiple fields, including aircraft and automobile fuselage materials, due to its potential as an alternative to conventional steel materials. CFRP offers equivalent or superior strength and a substantial weight reduction, making it an attractive option. There are two primary types of CFRP: thermosetting CFRP, which uses a thermosetting polymer as the base material, and thermoplastic CFRP, which uses a thermoplastic polymer as the matrix material. Thermoplastic polymers soften and melt when heated and solidify when cooled. Thermoplastic CFRP has attracted attention in various fields because it requires a short molding time, is inexpensive, and has high productivity [1]. Poly(ether ether ketone) (PEEK) (Figure 1) is a high-performance thermoplastic polymer developed by Imperial Chemical Industries (now Victrex) in Thornton-Cleveleys, UK, and it has excellent mechanical and chemical properties and thermal stability [2]. The degree of crystallinity of the crystalline polymers greatly influences their mechanical, optical, electrical, and other properties [3,4,5,6,7,8,9,10,11,12]. As such, the evaluation of the crystallinity of PEEK is highly important [13,14].
Numerous techniques have been utilized to evaluate the crystallinity of polymers, including PEEK [14]. Among these, Wide-angle X-ray diffraction (WAXRD), differential scanning calorimetry (DSC) [15], and Fourier-transform infrared spectroscopy [13] are frequently used techniques. In composite materials, the crystal structure of polymers and behavior of crystal nucleus precipitation are reported to differ near fibers [16,17]. The degree of crystallinity is expected to be spatially unevenly distributed owing to the influence of the carbon fibers. Therefore, a crystallinity evaluation method with a high spatial resolution is required.
Raman spectroscopy is one of the most commonly used techniques for investigating polymer material [18]. In addition, high spatial resolution can be achieved using a microscopic optical system. Previous studies used Raman spectroscopy to assess the crystallinity of PEEK [14,19,20,21,22]. As carbon materials exhibit prominent D- and G-band signals at approximately 1600 cm−1 [23], interference between the signals from carbon and polymer is a problem for composite materials. Consequently, frequencies within a range without carbon signals should be employed. To address this problem, we recently reported the evaluation of the crystallinity of PEEK using the peak in the low-frequency region (<100 cm−1) [24].
Raman scattering in the low-frequency region has attracted attention in various fields because it is easier to measure owing to the development of optical components. Similarly, remarkable progress has been made in the research of spectroscopy in the terahertz region in recent years. In some polymer materials, the peaks obtained by low-frequency Raman scattering spectroscopy [25,26,27,28] and THz vibrational spectroscopy [29,30,31] are caused by intermolecular vibrations. Classical molecular dynamics (MD) simulations have noted the intermolecular vibrational mode in the terahertz region for n-poly-l-lactide [32]. For PEEK, intermolecular ordering affects the low-frequency Raman spectra, as obtained by MD simulations [33]; however, no direct experimental evidence has been reported. We investigated the behavior of low-frequency Raman spectra in an amorphous sample, which is thought to have no intermolecular ordering.
The origins of low-frequency peaks, which are reliable indicators of crystallinity, should be clarified. This study aims to evaluate the Raman spectra of amorphous PEEK in the low-frequency region using a sample with zero crystallinity and discuss the origin of these peaks.

2. Materials and Methods

2.1. Sample Preparation

A Grade 2000 APTIV PEEK film produced by Victrex (t = 25 μm, UK), which is an unfilled amorphous film with zero crystallinity [14], was used as the sample. Various degrees of crystallinity were achieved by the heat treatment of the as-received films. Heat treatment above the glass transition temperature and below the melting temperature induces cold crystallization, resulting in an increased degree of crystallinity. The heat-treatment temperatures of 150, 175, 200, 250, and 300 °C were selected. The samples were kept at the annealing temperature for 2 h in air before they were cooled to room temperature in the same environment.

2.2. Experiments

WAXRD (Rigaku Ultima IV, Tokyo, Japan) was employed at room temperature to determine crystallinity. CuKα X-rays with a wavelength of 0.154 nm were used, with a rotating anode operating at 40 kV and 30 mA. The diffraction angle, 2θ, was in the range from 5° to 40°.
A micro-Raman spectroscopic system (Horiba Jobin Yvon, LablamHR spectrometer, Kyoto, Japan) with a backscattered geometry was used. The spot diameter was approximately 1 μm using an objective lens of 50×. In our PEEK sample, highly strong fluorescence was observed when excited at 633 nm or 532 nm, which are commonly used wavelengths in Raman scattering spectroscopy. An infrared light with a wavelength of 1064 nm was selected as the excitation light to avoid fluorescence. In order to measure the low-frequency region, a notch filter capable of measuring up to 20 cm−1 (the ultra-low-frequency (ULF) module) was used. An InGaAs detector with a resolution of 1.83 cm−1/pixel using cooled liquid nitrogen was used. The laser power incident on the sample was limited to 60 mW to avoid damage and further crystallization. The exposure duration was 10 s, and the measurements were integrated four times.

2.3. Density Functional Theory (DFT) and MD Simulation

The molecular vibrations of single-stranded PEEK oligomers were calculated using DFT (B3LYP/6-31G) in Gaussian16. The vibrations of the crystalline PEEK were calculated using MD simulations in a large-scale atomic/molecular massively parallel simulator (LAMMPS, 2 Aug 2023 version) with a generalized AMBER FF (GAFF, 2004 version). The calculation details are provided in Ref. [31].

3. Results and Discussion

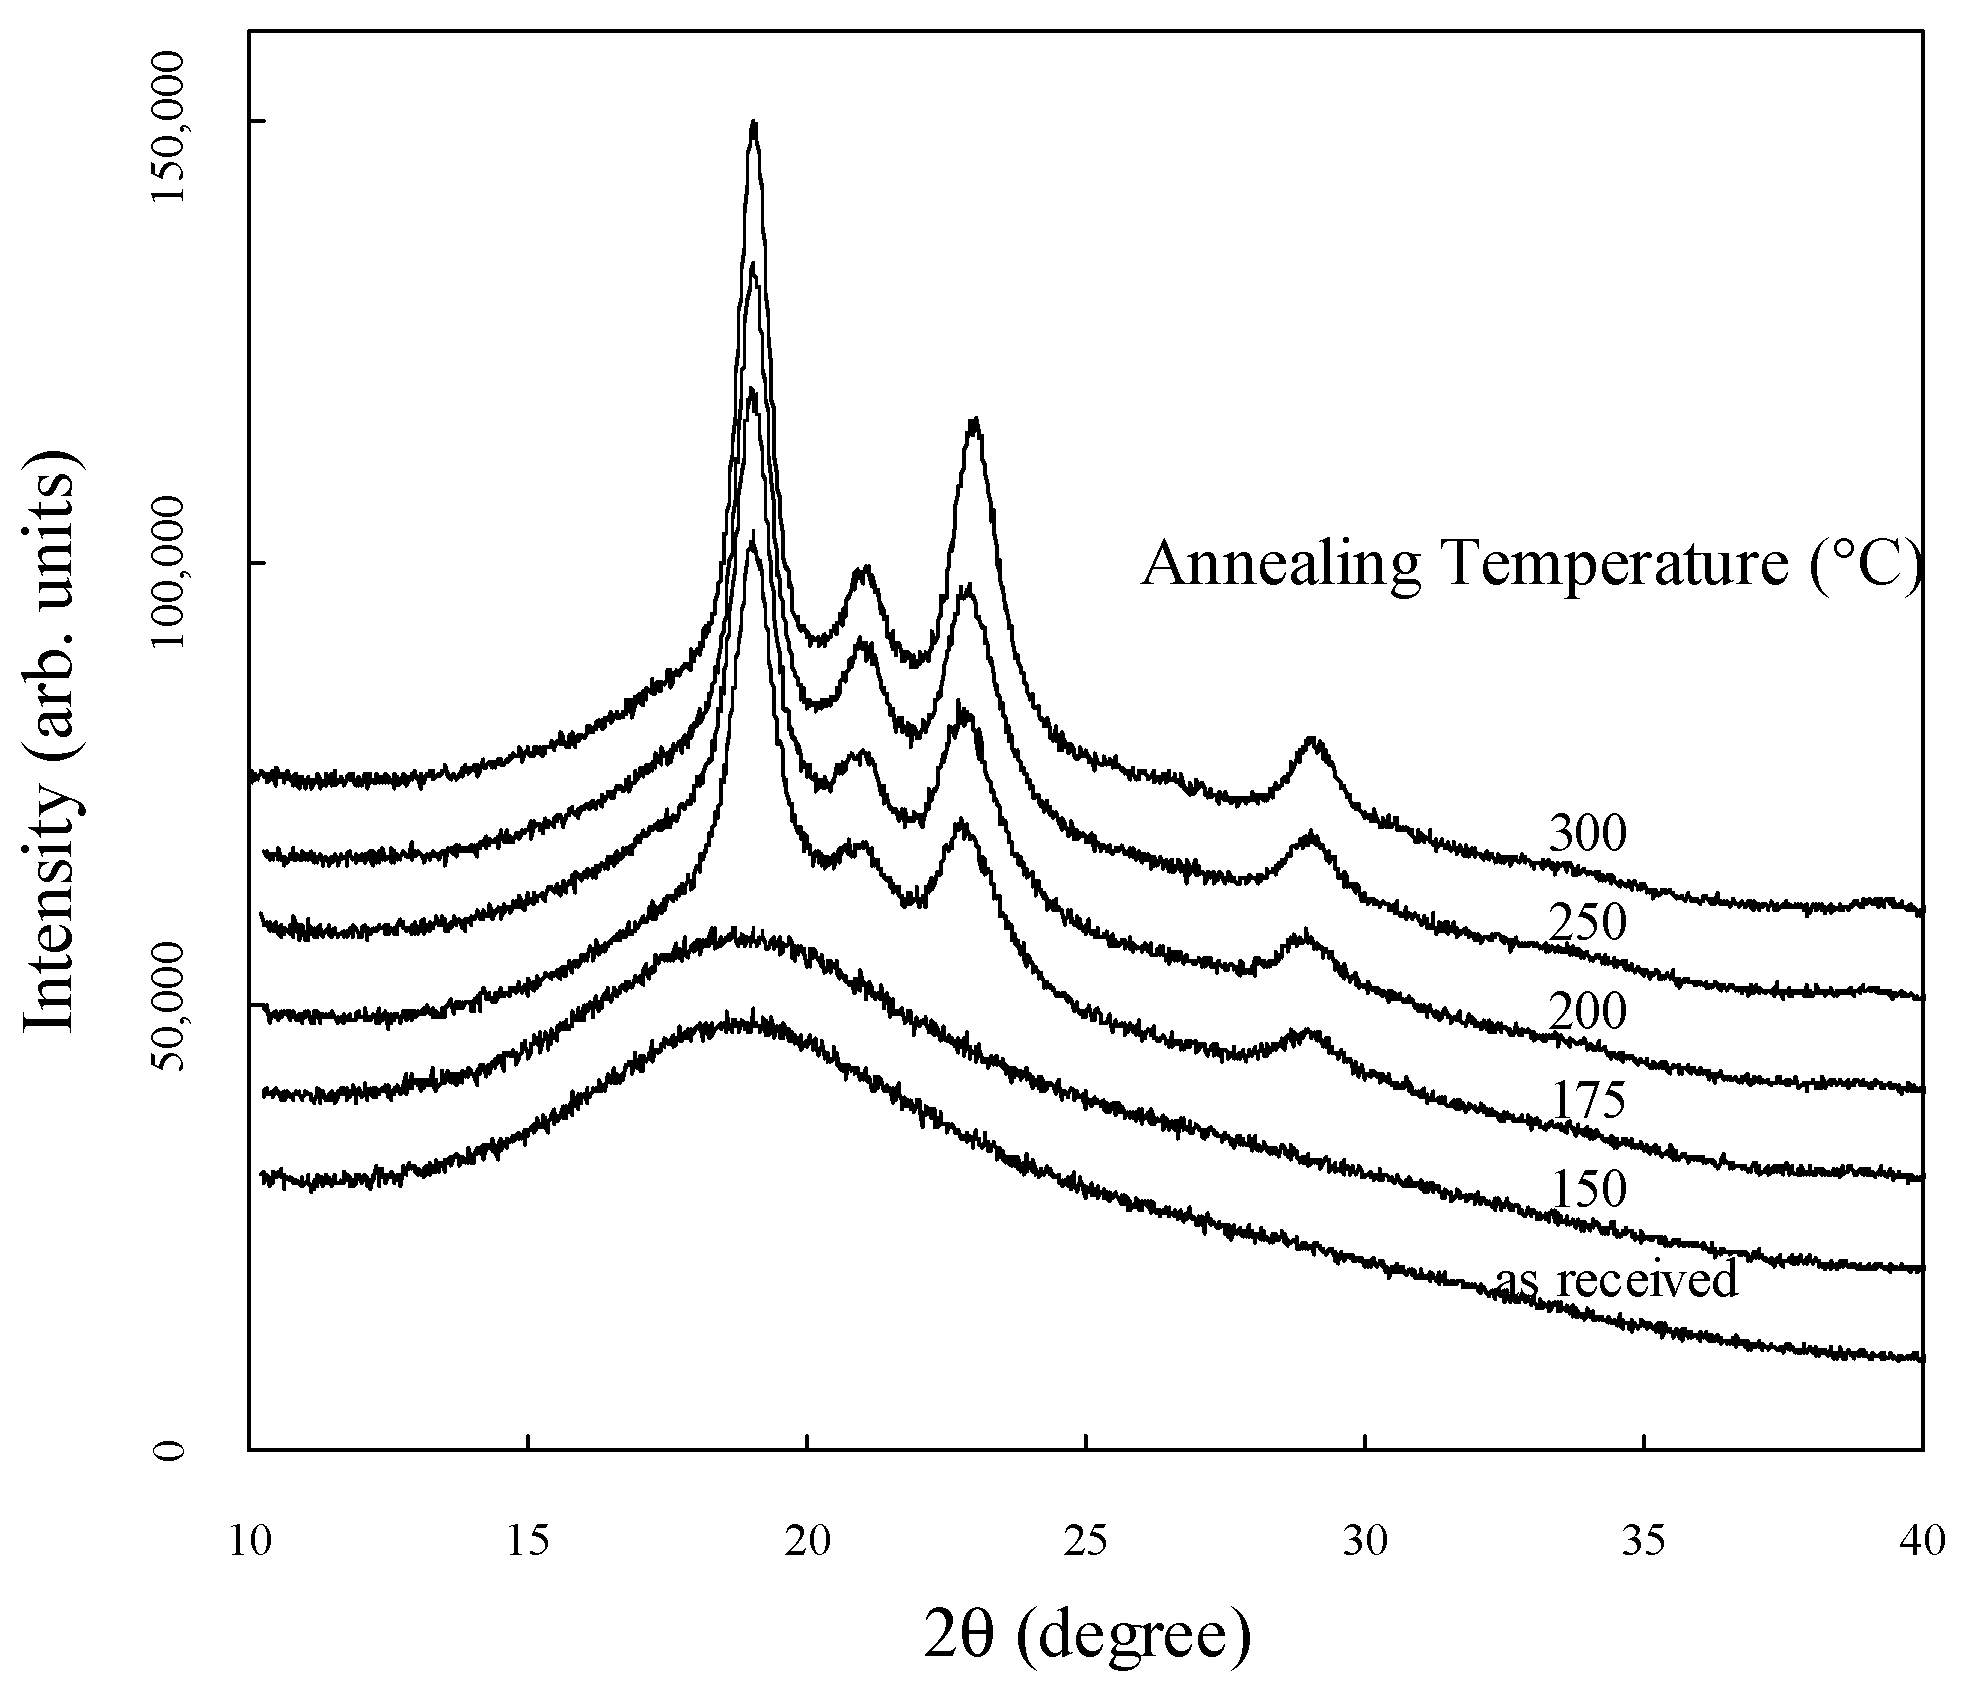
3.1. WAXRD Diffractograms
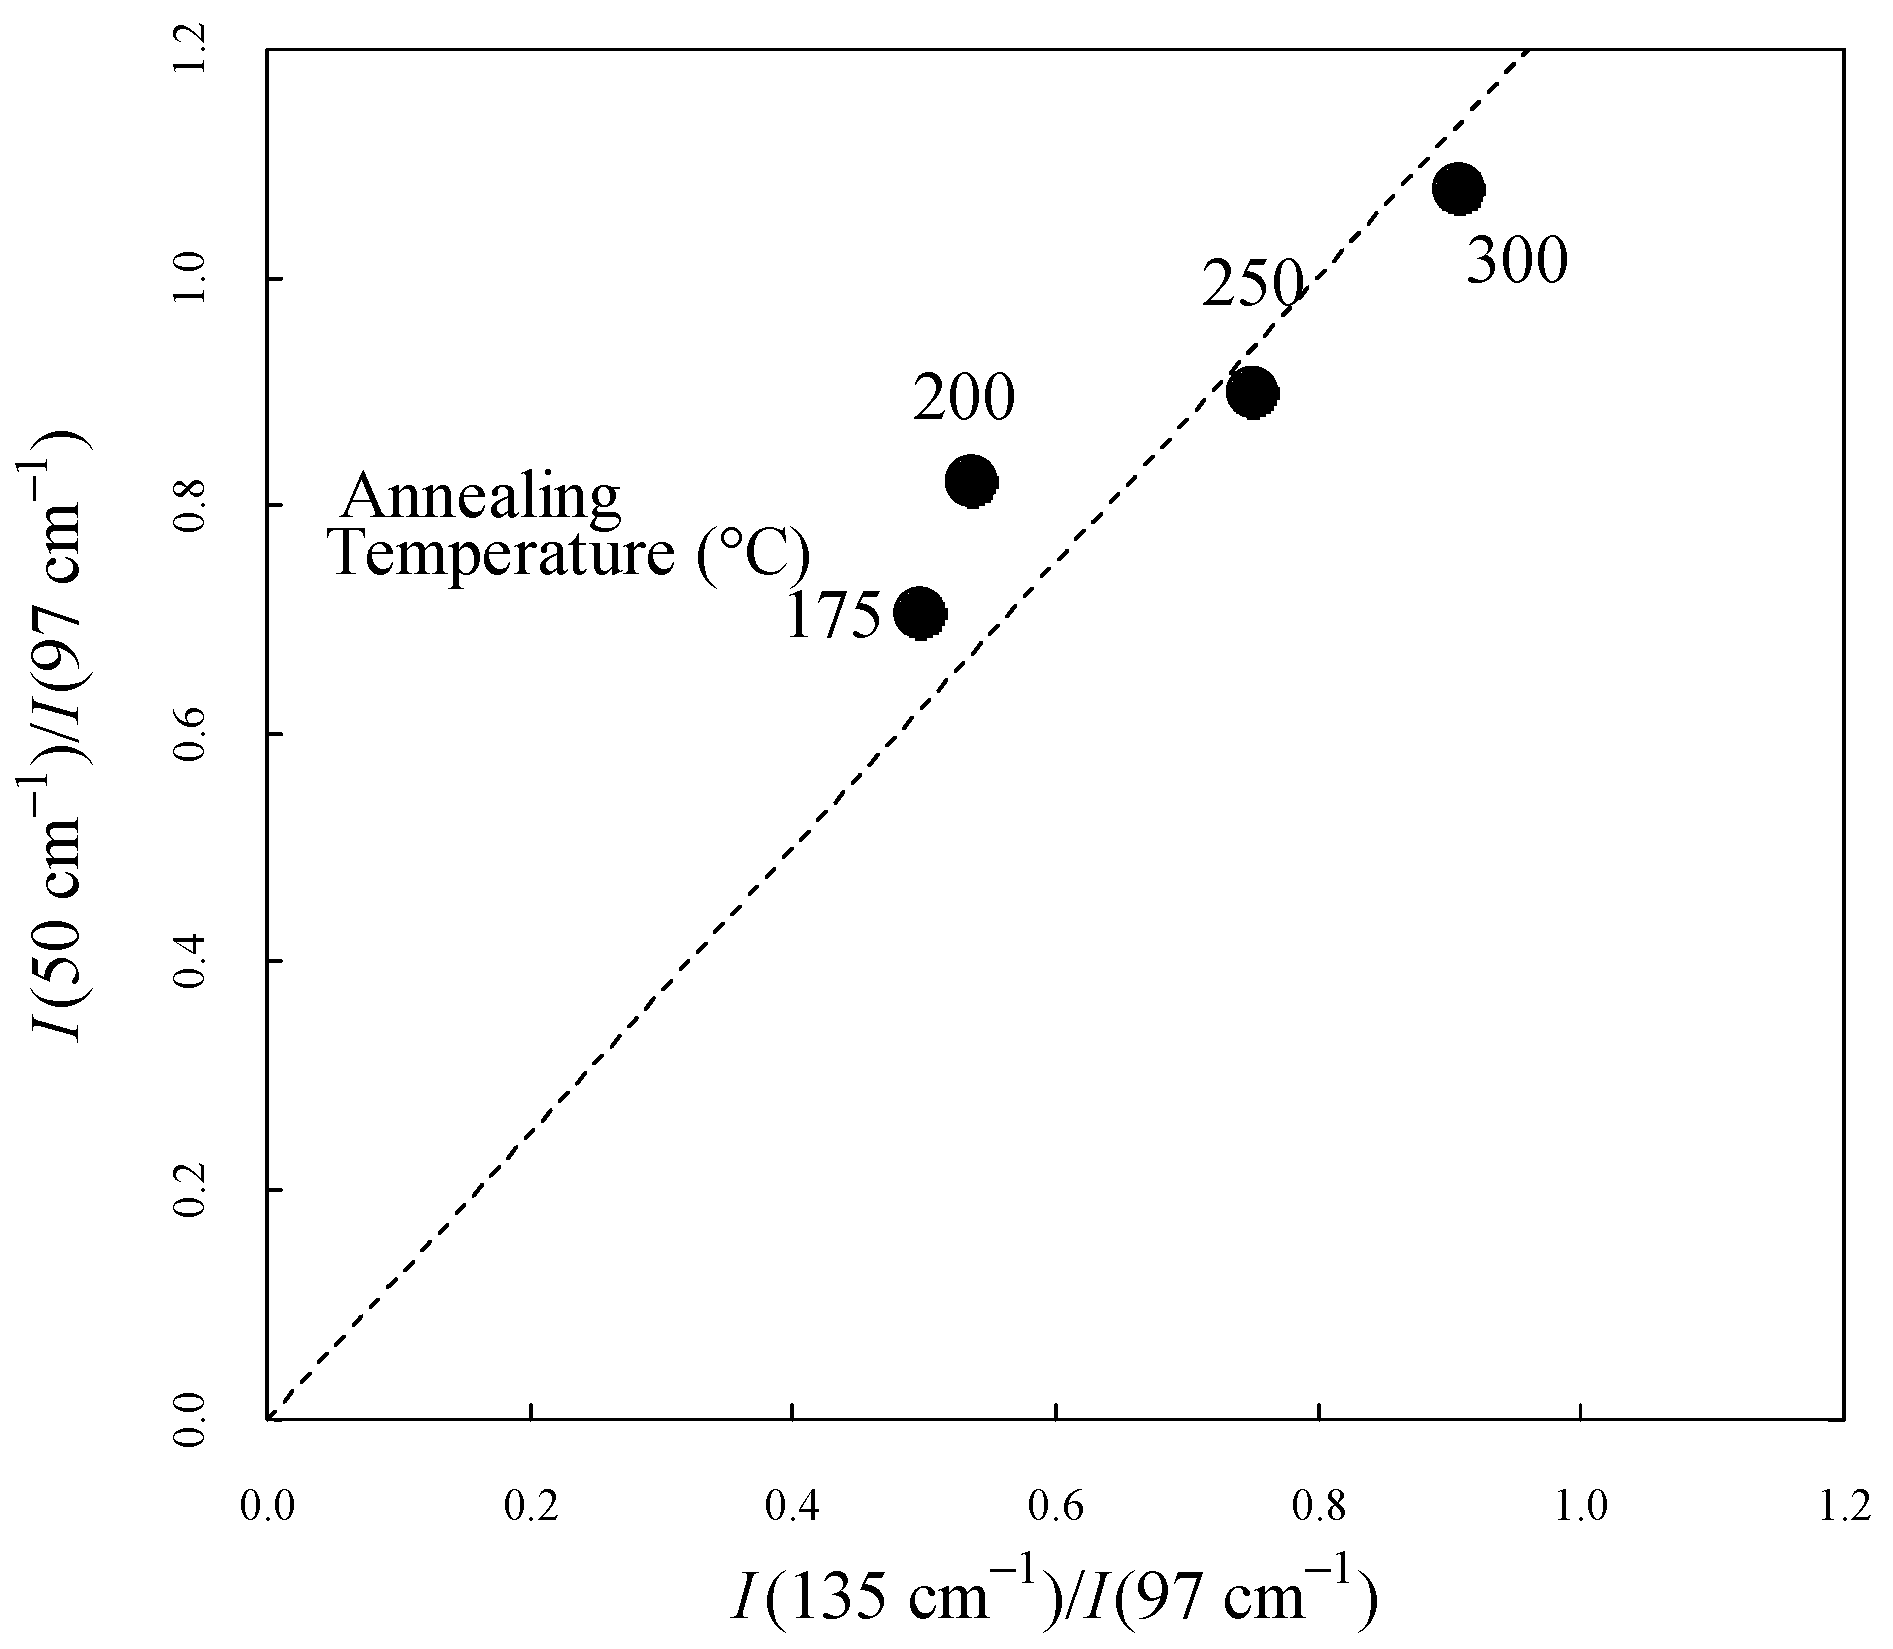
Figure 2 shows the WAXRD diffractograms measured from 5° to 40° for each annealing temperature. The diffractograms are shown on the same scale and are vertically shifted to show them more clearly. Sharp peaks are observed at 2θ values of approximately 19°, 21°, 23°, and 29°, corresponding to the 110, 111, 200, and 211 planes, respectively [34]. The broad peak observed at approximately 19° is associated with the amorphous structure. In the as-received sample without annealing, no crystallinity peak is observed, similar to previous studies [14,35]. The crystallinity was determined by fitting each obtained WAXRD spectrum to separate sharp peaks due to crystallinity and broad peaks due to the amorphous structure of the Lorentzian and Gaussian functions, respectively.

3.2. Raman Spectra

The Raman spectra of PEEK, standardized in the range of 40 cm−1 to 2000 cm−1, are shown in Figure 3. For clarity, the spectra are shown to be vertically shifted. Several strong peaks are observed in the low- and mid-frequency regions of all spectra. The origins of the peaks in the mid-frequency region have been identified in previous studies [19,20,21,22] and have been summarized in a recent report [14].
Enlarged spectra of each region are shown in Figure 4a–d to observe the spectral shape in more detail. Each spectrum was standardized in the area displayed on the horizontal axis. Figure 4a shows the peaks at 50 cm−1, 97 cm−1, and 135 cm−1 in samples annealed at temperatures above 175 °C. In our previous study, we reported that the peak at 135 cm−1 was significantly related to crystallinity and associated with intermolecular vibration modes [24,33]. The peak at 50 cm−1, which is markedly dependent on the degree of crystallinity, similar to the peak at 135 cm−1, is observed for the first time. Crystallinity dependence has been reported for various peaks in the mid-frequency region, such as the peak center at 1644 cm−1, intensity ratio of 1597 cm−1 and 1607 cm−1, intensity ratio of the bands at 800 cm−1 and 810 cm−1 [19], and center frequency at 1146 cm−1 [36] and 1651 cm−1 [14]. Similarly, the peaks at 50 cm−1 and 135 cm−1 in the low-frequency region are highly sensitive to crystallinity. Furthermore, the peaks at 50 cm−1 and 135 cm−1 completely disappeared in the sample with zero crystallinity.
The Raman spectra in the low-frequency region were decomposed into peaks at 50 cm−1, 97 cm−1, and 135 cm−1 expressed by a Lorenz function, a Gaussian function, and a linear function as the baseline data. The Lorenz function can be characterized based on the intensity, half-width at half maximum, and center frequency. The Gaussian function represents the background with a center frequency of 0 cm−1, and the half-width at half maximum and intensity are used as fitting parameters. Each parameter was independently adjusted to achieve the minimum chi-square value using the Levenberg-Marquardt nonlinear least-squares optimization. A sample fit of the Raman spectra is shown in Figure 5.
Figure 6 shows the intensity ratio between 50 cm−1 and 97 cm−1 ( I 50 c m 1 / I 97 c m 1 ) and between 135 cm−1 and 97 cm−1 ( I 135 c m 1 / I 97 c m 1 ). The dashed line demonstrates the good correlation of the parameters. Both values increased with increasing crystallinity. Along with the disappearance of the peaks in the amorphous state, this result suggests that the two peaks were influenced by the intermolecular order through the same mechanism.

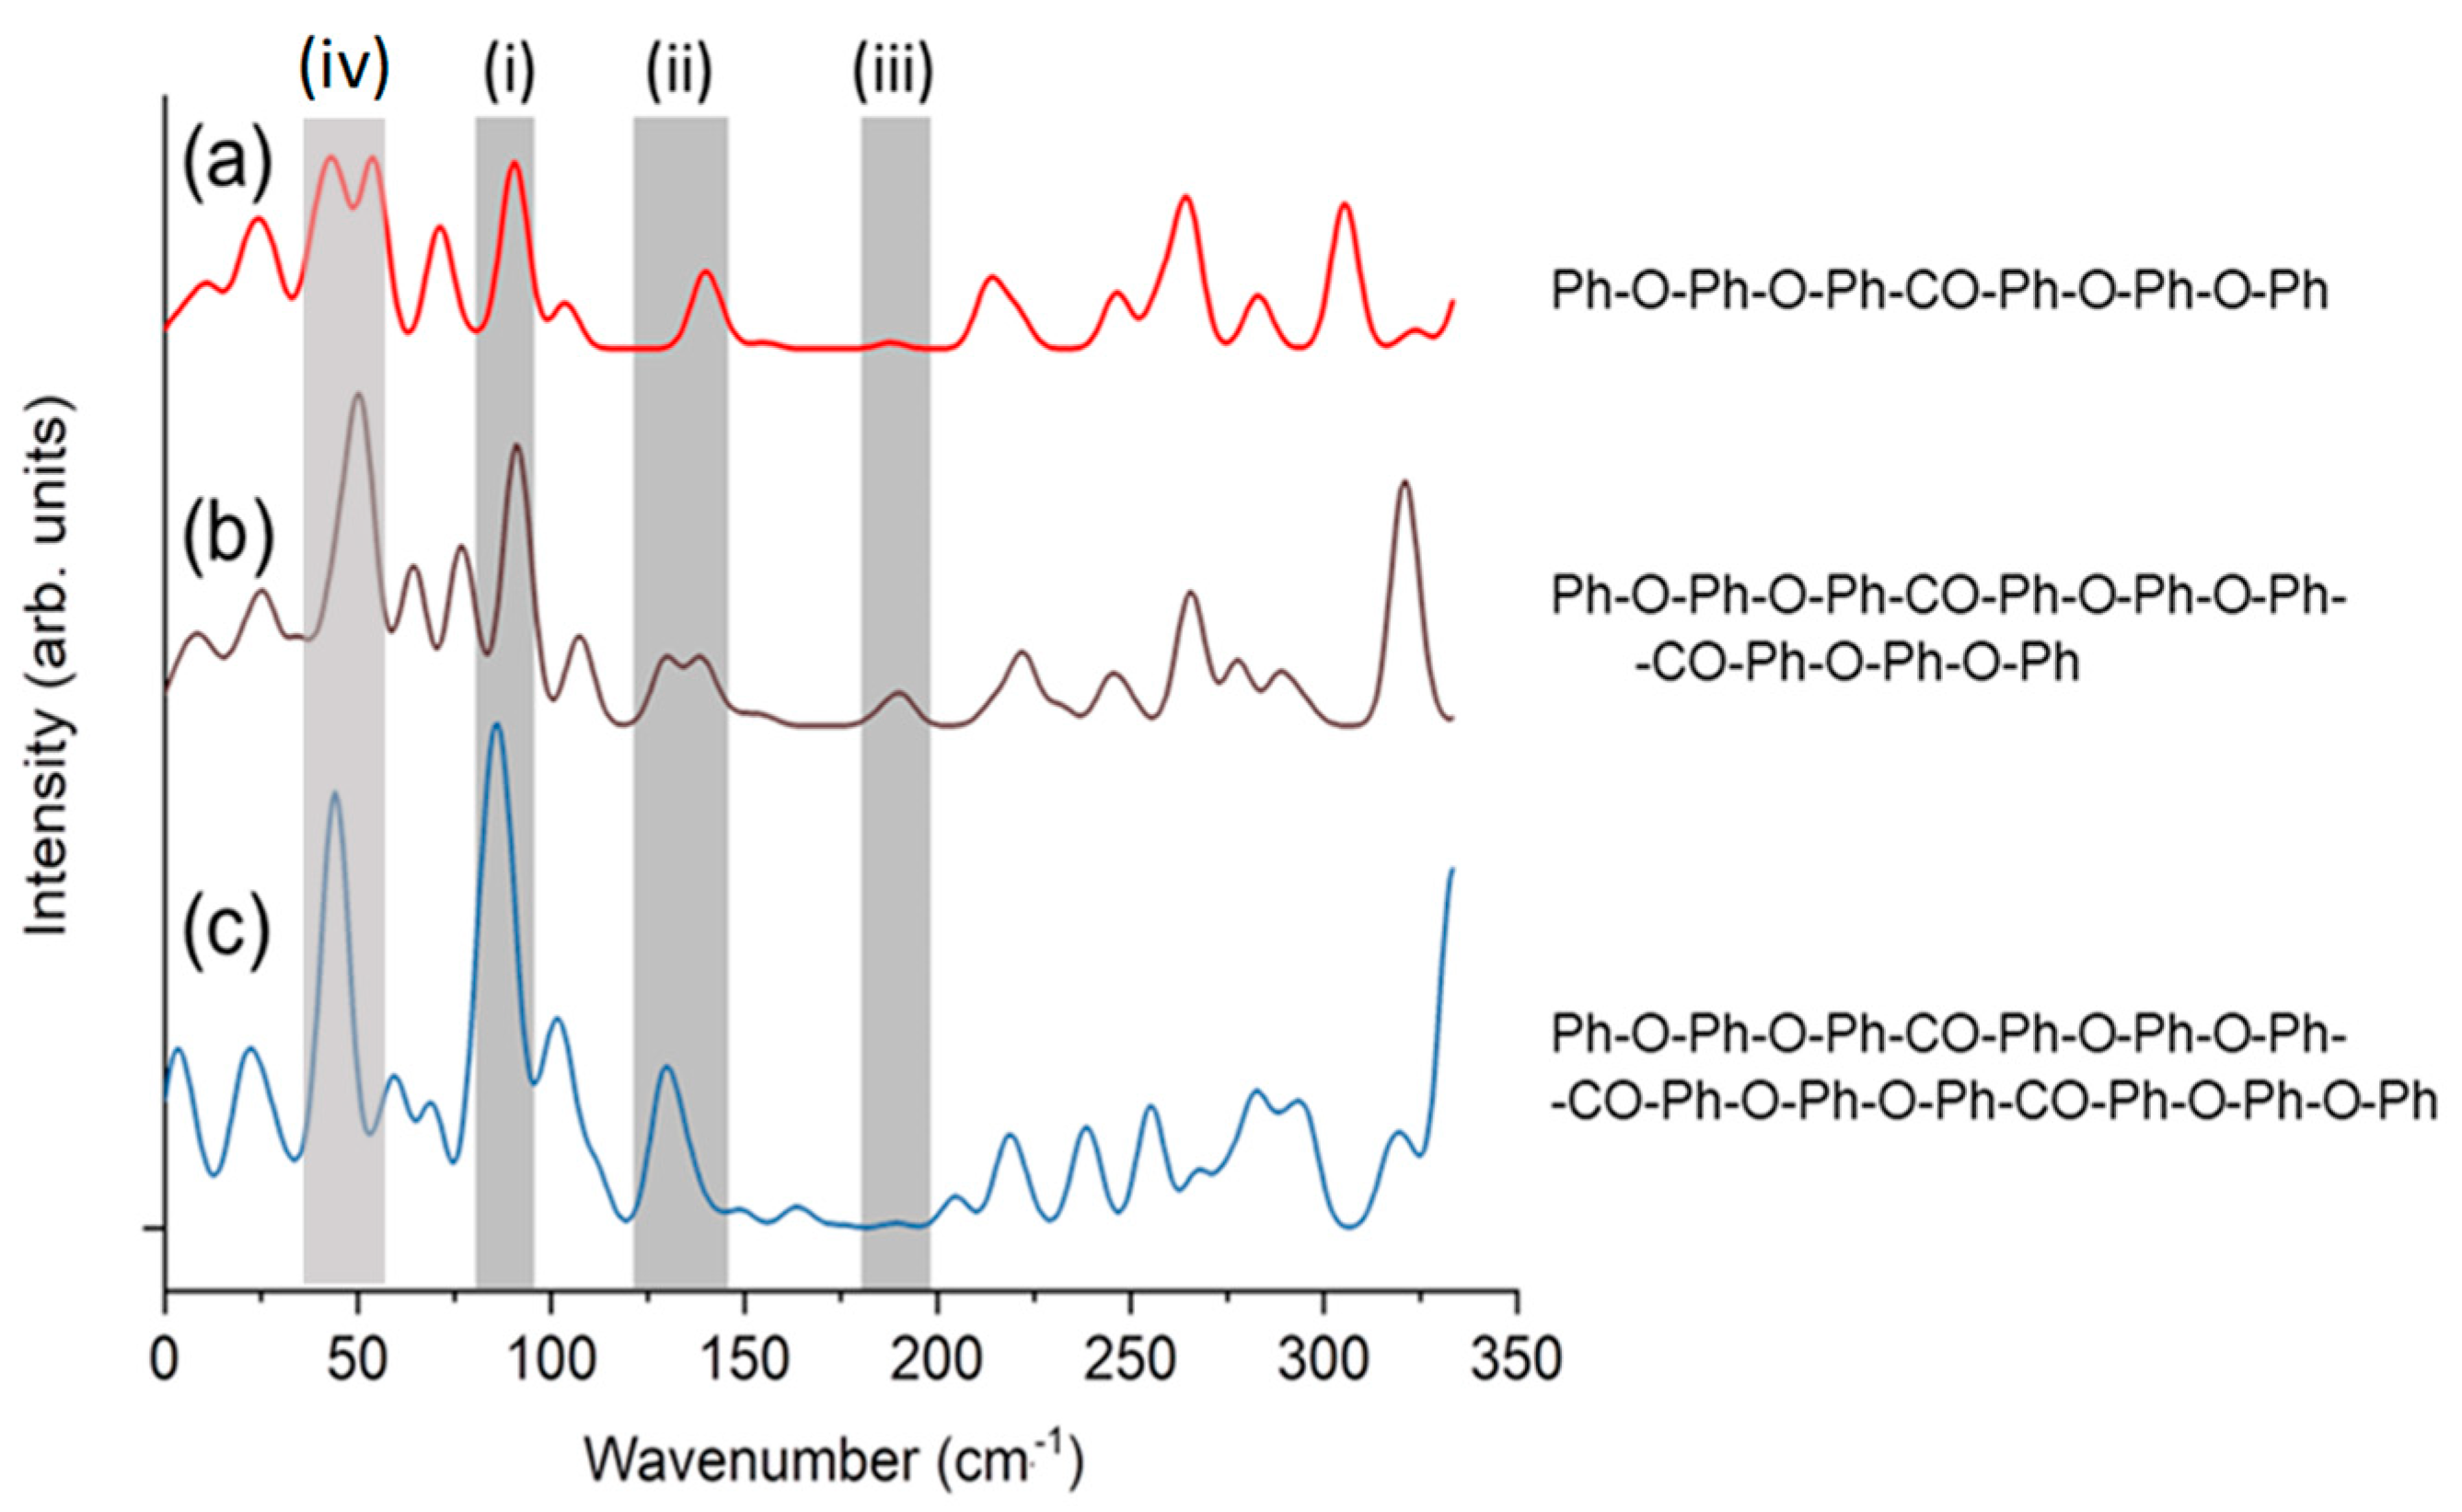
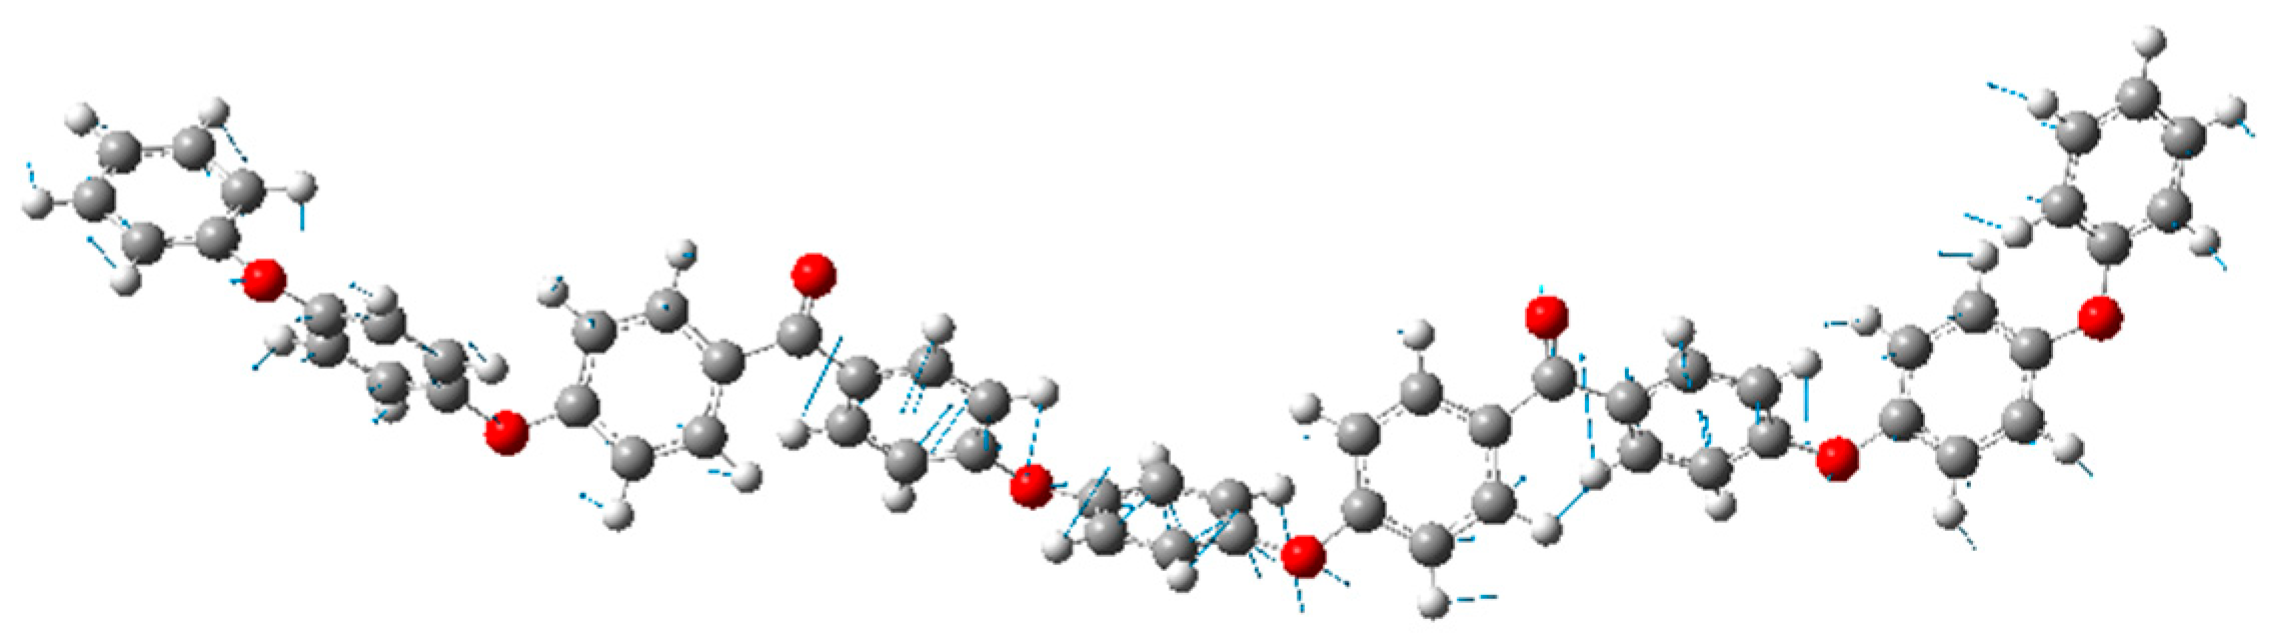
3.3. DFT and MD Simulations

Simulations were performed to clarify the origin of the peak at 50 cm−1. Figure 7 shows the Raman spectra calculated using DFT. Figure 7, which was modified from previous work Ref. [28], shows the spectra of PEEK oligomers with different lengths, terminated with phenyl groups. Peaks (i)–(iii) in the gray-shaded region are described in previous work [33]. Figure 8 shows the atomic motion in the vibrational modes at approximately 50 cm−1 (peak (iv)) calculated for a single oligomer molecule using DFT. The peak at 50 cm−1 is ascribed to the twisting motion of the ketone and connected benzene rings (Ph-O-Ph), similar to the peak at 135 cm−1 (peak (ii)). MD simulations were performed using LAMMPS. The simulation video is provided as Supplemental Video S1, whereby the time interval corresponds to 50 cm−1. The peaks at 50 cm−1 and 135 cm−1 are associated with Ph-CO-Ph-type intermolecular vibrational modes. Ketone groups have high polarity; therefore, the ketone group plays a major role in molecular interactions. Moreover, the peaks at 50 cm−1 and 135 cm−1 are not observed in the amorphous state and are sensitive to crystallinity. They are related to ketone groups, which are strongly related to the intermolecular order.
Delbé et al. observed three peaks at 77 cm−1, 109 cm−1, and 135 cm−1 in the low-frequency region of poly(ether ketone ketone) (PEKK) [37]. The peaks at 109 and 135 cm−1 in PEKK corresponded to the peaks at 97 and 135 cm−1 in PEEK, respectively. The vibration frequency decreased because of the addition of a ketone group in PEKK. Thus, the peak at 50 cm−1 in PEEK corresponds to the peak at 77 cm−1 in PEKK (Table 1). Among the three peaks in the low-frequency region observed for crystalline PEEK, two peaks assigned to ketone group vibrations disappeared in the amorphous PEEK. In contrast, a peak assigned to the vibration of the ketone group is observed even in the amorphous state. The Ph-CO-Ph vibration mode was enhanced by intermolecular interactions in PEEK and intramolecular interactions in PEKK. In the future, further clarification on this matter will be provided through extensive simulations focused on ketone groups.

4. Conclusions

The low-frequency peaks in the Raman spectra of the amorphous PEEK were studied. An amorphous sample with zero crystallinity, as confirmed by WAXRD, was used in this study. The peaks at 50 cm−1, which were observed for the first time, and 135 cm−1 disappeared in the amorphous sample. The peak intensities at 135 cm−1 and 50 cm−1 increased as the crystallinity increased. Along with the disappearance of the peaks in the amorphous state, these results suggest that the two peaks were influenced by the intermolecular order through the same mechanism. The peak at 50 cm−1 indicates the twisting motion of the ketone and connected benzene rings (Ph-O-Ph), which were similar to the peak at 135 cm−1 obtained using DFT and MD simulations. Furthermore, the peaks in the low-frequency region of PEEK and PEKK suggested the important role of the ketone group.

Supplementary Materials

Video S1: MD snapshots corresponding to vibration at 50 cm−1. Available online: https://youtu.be/sS23bM8gP8g (accessed on 30 May 2024).

Author Contributions

Conceptualization, T.S., K.C.G. and. M.Y.; experimental, T.N. and M.Y.; validation, M.Y.; supervision, N.I. All authors have read and agreed to the published version of the manuscript.

Funding

This work was supported by JSPS KAKENHI grant number 23H01310.

Institutional Review Board Statement

Not applicable.

Informed Consent Statement

Not applicable.

Data Availability Statement

The original contributions presented in the study are included in the article/supplementary material, further inquiries can be directed to the corresponding author.

Conflicts of Interest

Author Tomoko Numata was employed by the company Horiba Techno Service Co, Ltd. Author Naomoto Ishikawa was employed by the company Kiguchi Technics Inc. The remaining authors declare that the research was conducted in the absence of any commercial or financial relationships that could be construed as a potential conflict of interest.

References

  1. Biron, M. Handbook of Thermoplastic Elastomers; William Andrew Publishing: Norwich, NY, USA, 2012. [Google Scholar]
  2. Blundell, D.J.; Osborn, B.N. The morphology of poly(aryl-ether-ether-ketone). Polymer 1983, 24, 953–958. [Google Scholar] [CrossRef]
  3. Gao, S.-L.; Kim, J.-K. Cooling rate influences in carbon fibre/PEEK composites. Part 1. Crystallinity and interface adhesion. Compos. A 2000, 31, 517–530. [Google Scholar] [CrossRef]
  4. Huo, P.; Cebe, P. Temperature-dependent relaxation of the crystal-amorphous interphase in poly(ether ether ketone). Macromolecules 1992, 25, 902–909. [Google Scholar] [CrossRef]
  5. Cogswell, F.N.; Hopprich, M. Environmental resistance of carbon fibre-reinforced polyether etherketone. Composites 1983, 14, 251–253. [Google Scholar] [CrossRef]
  6. Comer, A.J.; Ray, D.; Obande, W.O.; Jones, D.; Lyons, J.; Rosca, I.; O’higgins, R.M.; McCarthy, M.A. Mechanical characterization of carbon fiber–PEEK manufactured by laser-assisted automated-tape-placement and autoclave. Compos. A 2015, 69, 10–20. [Google Scholar] [CrossRef]
  7. Deignan, A.; Stanley, W.; McCarthy, M. Insights into wide variations in carbon fiber/polyetheretherketone rheology data under automated tape placement processing conditions. J. Compos. Mater. 2018, 52, 2213–2228. [Google Scholar] [CrossRef]
  8. Yang, D.; Cao, Y.; Zhang, Z.; Yin, Y.; Li, D. Effects of crystallinity control on mechanical properties of 3D-printed short-carbon-fiber-reinforced polyether ether ketone composites. Polym. Test. 2021, 97, 107149. [Google Scholar] [CrossRef]
  9. Jiang, W.; Chen, C.; Chen, Z.; Huang, Z.; Zhou, H. Effect of crystallinity on optical properties of PEEK prepreg tapes for laser-assisted automated fiber placement. Compos. Commun. 2023, 38, 101490. [Google Scholar] [CrossRef]
  10. Rusakov, D.; Menner, A.; Spieckermann, F.; Wilhelm, H.; Bismarck, A. Morphology and properties of foamed high crystallinity PEEK prepared by high temperature thermally induced phase separation. J. Appl. Polym. Sci. 2021, 139, 5143. [Google Scholar] [CrossRef]
  11. Zhen, H.; Zhao, B.; Quan, L.; Fu, J. Effect of 3D Printing Process Parameters and Heat Treatment Conditions on the Mechanical Properties and Microstructure of PEEK Parts. Polymers 2023, 15, 2209. [Google Scholar] [CrossRef]
  12. Katsifis, G.A.; Suchowerska, N.; McKenzie, D.R. Optical properties of plasma-treated PEEK: Monitoring colour and crystallinity for applications in medicine and dentistry using ellipsometry. Plasma Process. Polym. 2022, 19, 2100241. [Google Scholar] [CrossRef]
  13. Regis, M.; Bellare, A.; Pascolini, T.; Bracco, P. Characterization of thermally annealed PEEK and CFR-PEEK composites: Structure-properties relationships. Polym. Degrad. Stab. 2017, 136, 121–130. [Google Scholar] [CrossRef]
  14. Doumeng, M.; Makhlouf, L.; Berthet, F.; Marsan, O.; Delbé, K.; Denape, J.; Chabert, F. A comparative study of the crystallinity of polyetheretherketone by using density, DSC, XRD, and Raman spectroscopy techniques. Polym. Test. 2021, 93, 106878. [Google Scholar] [CrossRef]
  15. Bas, C.; Battesti, P.; Albérola, N.D. Crystallization and melting behaviors of poly(aryletheretherketone) (PEEK) on origin of double melting peaks. J. Appl. Polym. Sci. 1994, 53, 1745–1757. [Google Scholar] [CrossRef]
  16. Uematsu, H.; Kawasaki, T.; Koizumi, K.; Yamaguchi, A.; Sugihara, S.; Yamane, M.; Kawabe, K.; Ozaki, Y.; Tanoue, S. Relationship between crystalline structure of polyamide 6 within carbon fibers and their mechanical properties studied using Micro-Raman spectroscopy. Polymer 2021, 223, 123711. [Google Scholar] [CrossRef]
  17. Lee, Y.; Porter, R.S. Crystallization of poly(etheretherketone) (PEEK) in carbon fiber composites. Polym. Eng. Sci. 1986, 26, 633–639. [Google Scholar] [CrossRef]
  18. Hsu, S.L.; Patel, J.; Zhao, W. Molecular Characterization of Polymers: A Fundamental Guide; Elsevier: Amsterdam, The Netherlands, 2021; Chapter 10; p. 369. [Google Scholar]
  19. Louden, J.D. Crystallinity in poly(aryl ether ketone) films studied by raman spectroscopy. Polym. Commun. 1986, 27, 82–84. [Google Scholar]
  20. Everall, N.J.; Chalmers, J.M.; Ferwerda, R.; van der Maas, J.H.; Hendra, P.J. Measurement of poly(aryl ether ether ketone) crystallinity in isotropic and uniaxial samples using Fourier transform-Raman spectrocopy: A comparison of univariate and partial least-squares calibrations. J. Raman Spectrosc. 1994, 25, 43–51. [Google Scholar] [CrossRef]
  21. Briscoe, B.J.; Stuart, B.H.; Thomas, P.S.; Williams, D.R. A comparison of thermal- and solvent-induced relaxation of poly(ether ether ketone) using Fourier transform Raman spectroscopy. Spectrochim. Acta A Mol. Biomol. Spectrosc. 1991, 47, 1299–1303. [Google Scholar] [CrossRef]
  22. Ellis, G.; Naffakh, M.; Marco, C.; Hendra, P.J. Fourier transform Raman spectroscopy in the study of technological polymers Part 1: Poly(aryl ether ketones), their composites and blends. Spectrochim. Acta A Mol. Biomol. Spectrosc. 1997, 53, 2279–2294. [Google Scholar] [CrossRef]
  23. Qian, X.; Wang, X.; Zhong, J.; Zhi, J.; Heng, F.; Zhang, Y.; Song, S. Effect of fiber microstructure studied by Raman spectroscopy upon the mechanical properties of carbon fibers. J. Raman Spectrosc. 2019, 50, 665–673. [Google Scholar] [CrossRef]
  24. Yamaguchi, M.; Kobayasi, S.; Numata, T.; Kamihara, N.; Shimda, T.; Jikei, M.; Muraoka, M.; Barnsley, J.E.; Fraser-Miller, S.J.; Gordon, K.C. Evaluation of crystallinity in carbon fiber-reinforced poly(ether ether ketone) by using infrared low frequency Raman spectroscopy. J. Appl. Polym. Sci. 2022, 139, 51677. [Google Scholar] [CrossRef]
  25. Walker, G.; Römann, P.; Poller, B.; Löbmann, K.; Grohganz, H.; Rooney, J.S.; Huff, G.S.; Smith, G.P.S.; Rades, T.; Gordon, K.C.; et al. Probing pharmaceutical mixtures during milling: The potency of low-frequency raman spectroscopy in identifying disorder. Mol. Pharm. 2017, 14, 4675–4684. [Google Scholar] [CrossRef] [PubMed]
  26. Lipiäinen, T.; Fraser-Miller, S.J.; Gordon, K.C.; Strachan, C.J. Direct comparison of low- and mid-frequency Raman spectroscopy for quantitative solid-state pharmaceutical analysis. J. Pharm. Biomed. Anal. 2018, 149, 343–350. [Google Scholar] [CrossRef] [PubMed]
  27. Yamamoto, S.; Ohnishi, E.; Sato, H.; Hoshina, H.; Ishikawa, D.; Ozaki, Y. Low-frequency vibrational modes of Nylon 6 studied by using infrared and raman spectroscopies and density functional theory calculations. J. Phys. Chem. B 2019, 123, 5368–5376. [Google Scholar] [CrossRef] [PubMed]
  28. Yamamoto, S.; Miyada, M.; Sato, H.; Hoshina, H.; Ozaki, Y. Low-Frequency Vibrational Modes of poly(glycolic acid) and Thermal Expansion of Crystal Lattice Assigned on the Basis of DFT-Spectral Simulation Aided with a Fragment Method. J. Phys. Chem. B 2017, 121, 1128–1138. [Google Scholar] [CrossRef] [PubMed]
  29. Funaki, C.; Yamamoto, S.; Hoshina, H.; Ozaki, Y.; Sato, H. Three different kinds of weak C-H⋯O=C inter- and intramolecular interactions in poly(ε-caprolactone) studied by using terahertz spectroscopy, infrared spectroscopy and quantum chemical calculations. Polymer 2018, 137, 245–254. [Google Scholar] [CrossRef]
  30. Funaki, C.; Toyouchi, T.; Hoshina, H.; Ozaki, Y.; Sato, H. Terahertz imaging of the distribution of crystallinity and crystalline orientation in a poly(ε-caprolactone) film. Appl. Spectrosc. 2017, 71, 1537–1542. [Google Scholar] [CrossRef] [PubMed]
  31. Kaneko, T.; Hirai, N.; Ohki, Y. Terahertz absorption spectroscopy of poly(ether ether ketone). In Proceedings of the 2017 International Symposium on Electrical Insulating Materials, Toyohashi, Japan, 1–15 September 2017; pp. 539–542. [Google Scholar] [CrossRef]
  32. Hiroshiba, N.; Akiraka, M.; Kojima, H.; Ohnishi, S.; Ebata, A.; Tsuji, H.; Tanaka, S.; Koike, K.; Ariyoshi, S. Broadband infrared absorption spectroscopy of low-frequency inter-molecular vibrations in crystalline poly(L-lactide). Phys. B 2023, 649, 414488. [Google Scholar] [CrossRef]
  33. Yang, X.; Yokokura, S.; Nagahama, T.; Yamaguchi, M.; Shimada, T. Molecular Dynamics simulation of poly(ether ether ketone)(PEEK) polymer to analyze intermolecular ordering by low wavenumber Raman spectroscopy and X-ray diffraction. Polymers 2022, 14, 5406. [Google Scholar] [CrossRef]
  34. Dawson, P.C.; Blundell, D.J. X-ray data for poly(aryl ether ketones). Polymer 1980, 21, 577–578. [Google Scholar] [CrossRef]
  35. Li, Q.; Perrie, W.; Tang, Y.; Allegre, O.; Ho, J.; Chalker, P.; Li, Z.; Edwardson, S.; Dearden, G. A study on ultrafast laser micromachining and optical properties of amorphous polyether(ether)ketone (PEEK) films. Procedia CIRP 2020, 94, 840–845. [Google Scholar] [CrossRef]
  36. Doumeng, M.; Ferry, F.; Delbé, K.; Mérian, T.; Chabert, F.; Berthet, F.; Marsan, O.; Nassiet, V.; Denape, J. Evolution of crystallinity of PEEK and glass-fibre reinforced PEEK under tribological conditions using Raman spectroscopy. Wear 2019, 426–427, 1040–1046. [Google Scholar] [CrossRef]
  37. Delbé, K.; Chabert, F. Raman spectroscopy investigation on amorphous Polyetherketoneketone (PEKK). Vib. Spectrosc. 2023, 129, 103620. [Google Scholar] [CrossRef]
Figure 1. Chemical structure of PEEK.
Materials 17 03755 g001
Figure 2. WAXRD diffractograms measured from 5° to 40° for different temperatures.
Materials 17 03755 g002
Figure 3. Standardized Raman spectra of PEEK in the range of 40 cm−1 to 2000 cm−1.
Materials 17 03755 g003
Figure 4. Enlarged spectra in the frequency range of (a) 20–220 cm−1, (b) 650–950 cm−1, (c) 1000–1300 cm−1, and (d) 1450–1750 cm−1. Each spectrum was standardized along the horizontal axis.
Materials 17 03755 g004
Figure 5. A typical example of the fitting analysis of the Raman spectra. The dashed lines represent the decomposed elements with three peaks and a baseline curve.
Materials 17 03755 g005
Figure 6. Correlation between I 50 c m 1 / I 135   c m 1 and I 50 c m 1 / I 97 c m 1 . The dashed line represents a visual guide.
Materials 17 03755 g006
Figure 7. Raman spectra of phenyl-terminated PEEK oligomers calculated using DFT. The peaks at 85–98 cm−1, 130–145 cm−1, 190 cm−1, and 50 cm−1 are labeled as (i), (ii), (iii), and (iv), respectively. (ac) represent different lengths of a PEEK molecular chain. The molecular structures are shown in the right panel. The calculated molecular structures are shown on the right, where “Ph-”, “-Ph-”, “-O-”, and “-CO-” represent C6H5-, -C6H4-, ether, and ketone, respectively.
Materials 17 03755 g007
Figure 8. Atomic motion in the vibrational modes at 50 cm−1 calculated for a single oligomer molecule using DFT. The white, red, and gray spheres represent hydrogen, oxygen, and carbon, respectively. The blue lines show the direction of the movement of the atom, and their lengths show the magnitude of the displacement.
Materials 17 03755 g008
Table 1. Raman peak of PEEK and PEKK [37] in the low-frequency region.
PEEKPEKKAssignment
-Ph-O-Ph-O-Ph-CO--Ph-O-Ph-CO-Ph-CO-
crystalamorphousamorphous
wavenumber (cm−1)wavenumber (cm−1)
50Not observed77phonon Ph-CO-Ph
97100109phonon Ph-O-Ph
135Not observed135phonon Ph-CO-Ph
Disclaimer/Publisher’s Note: The statements, opinions and data contained in all publications are solely those of the individual author(s) and contributor(s) and not of MDPI and/or the editor(s). MDPI and/or the editor(s) disclaim responsibility for any injury to people or property resulting from any ideas, methods, instructions or products referred to in the content.

