
Assessment of Shear Fracture Energy in Hybrid Composites with Natural and Synthetic Fibers

 , , and
Abstract
1. Introduction
2. Materials and Methods
2.1. Materials
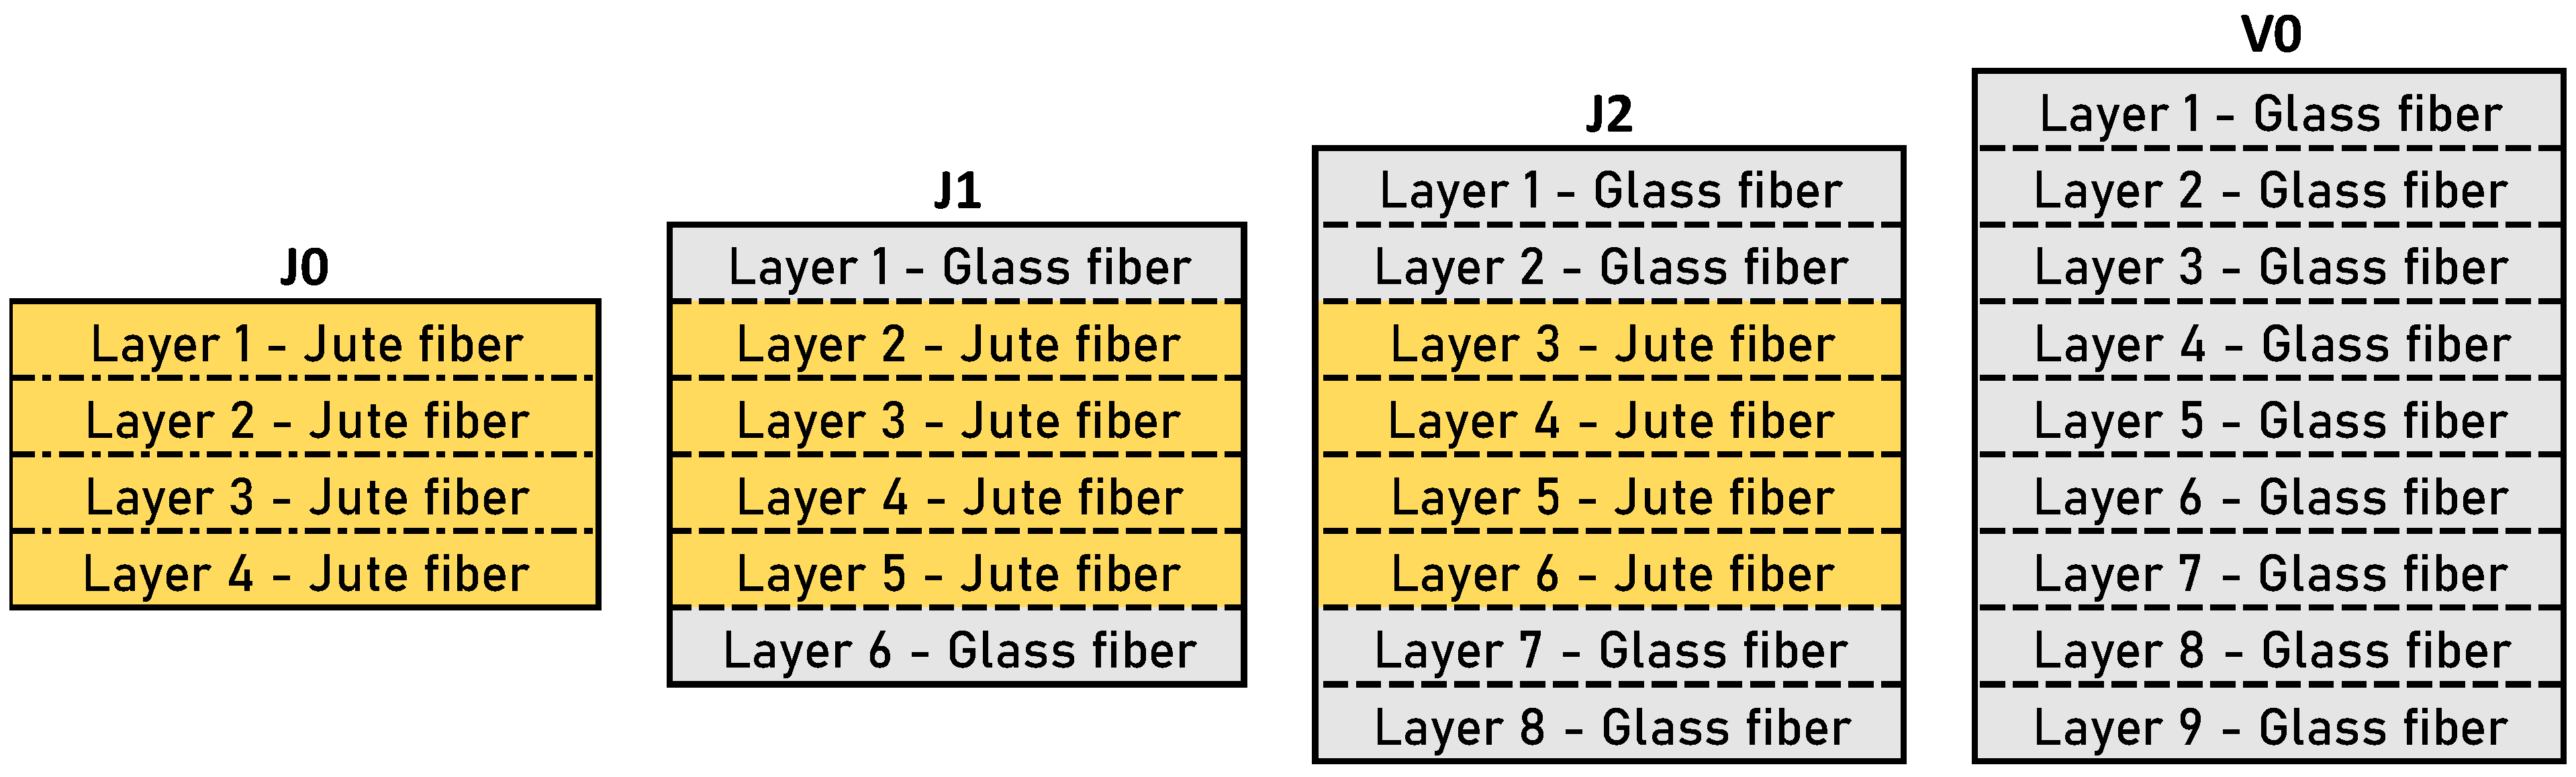
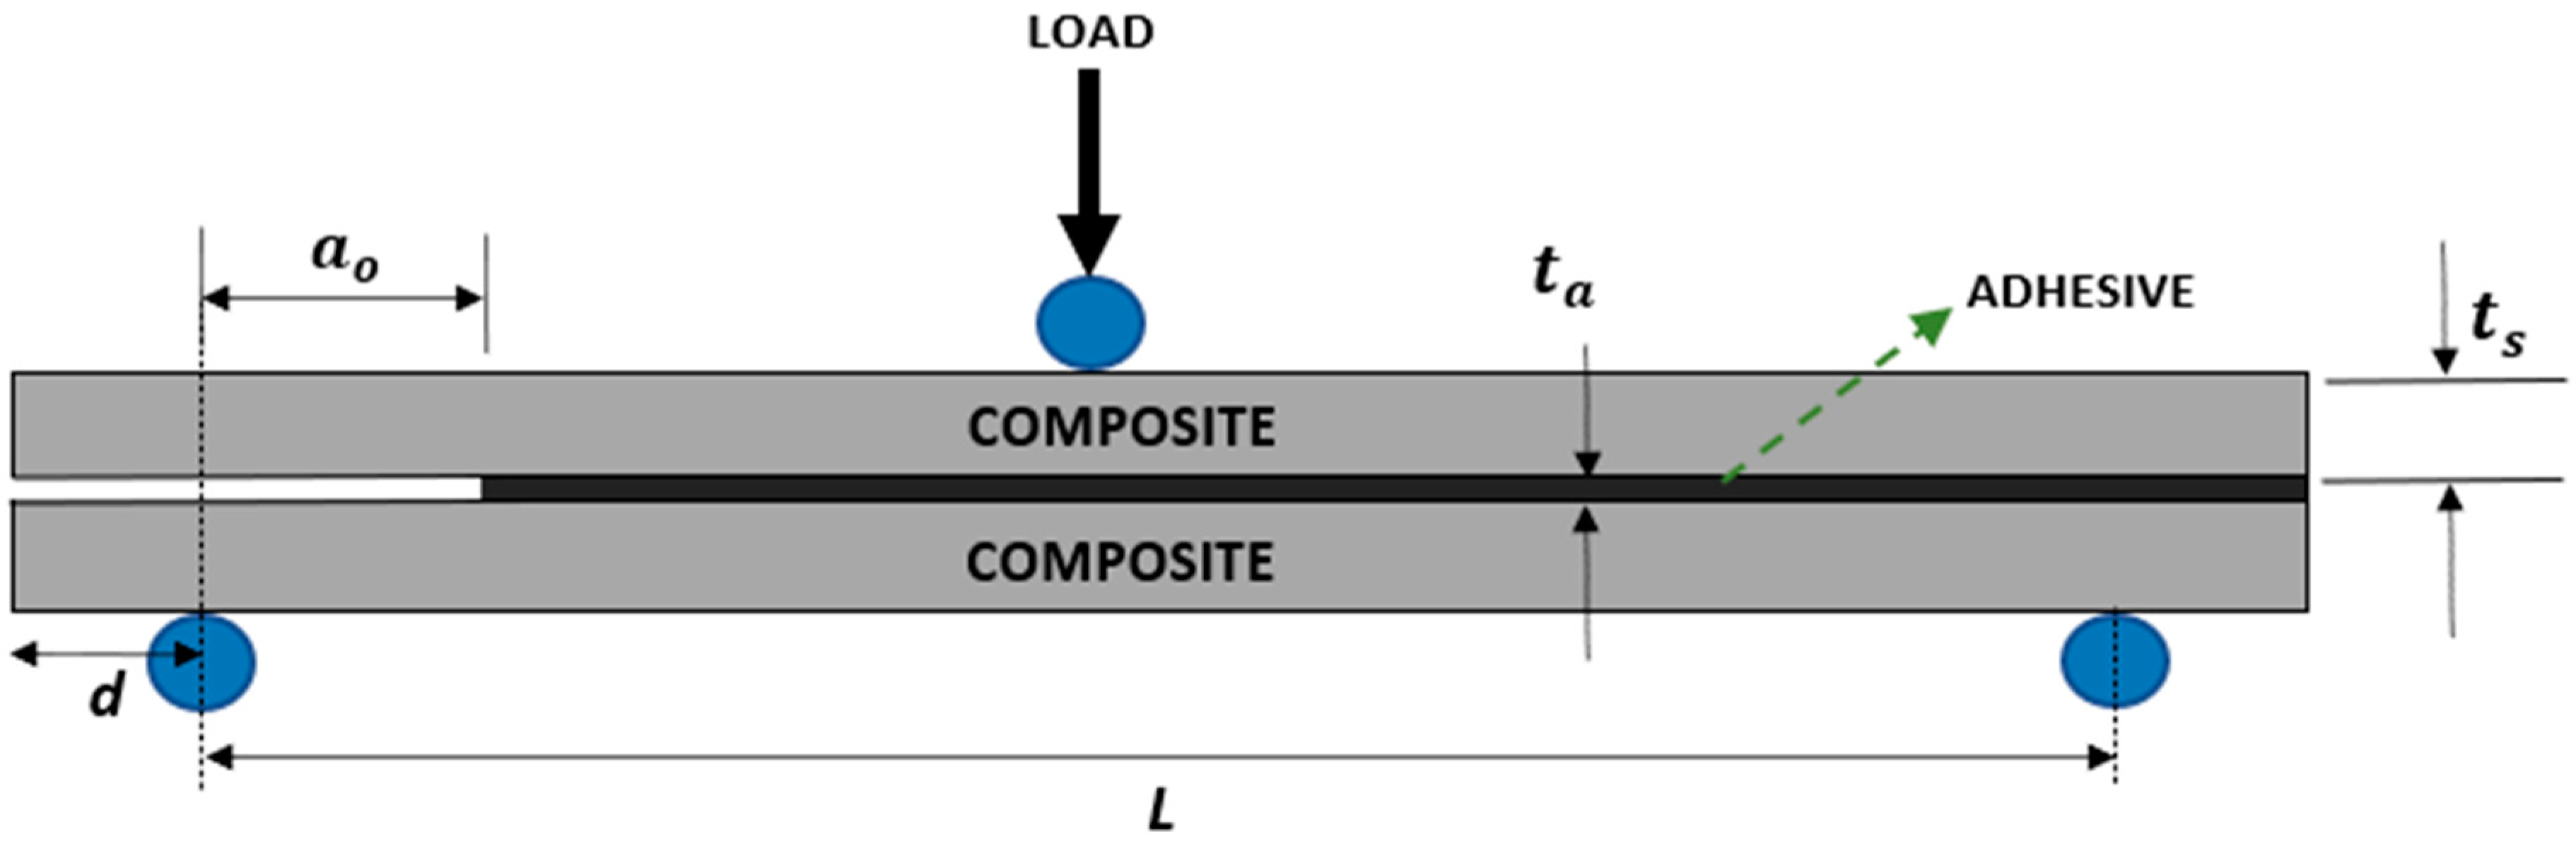
2.2. Joint Geometry and Manufacturing
2.3. Testing Conditions
2.4. Data Reduction Method
3. Results and Discussion
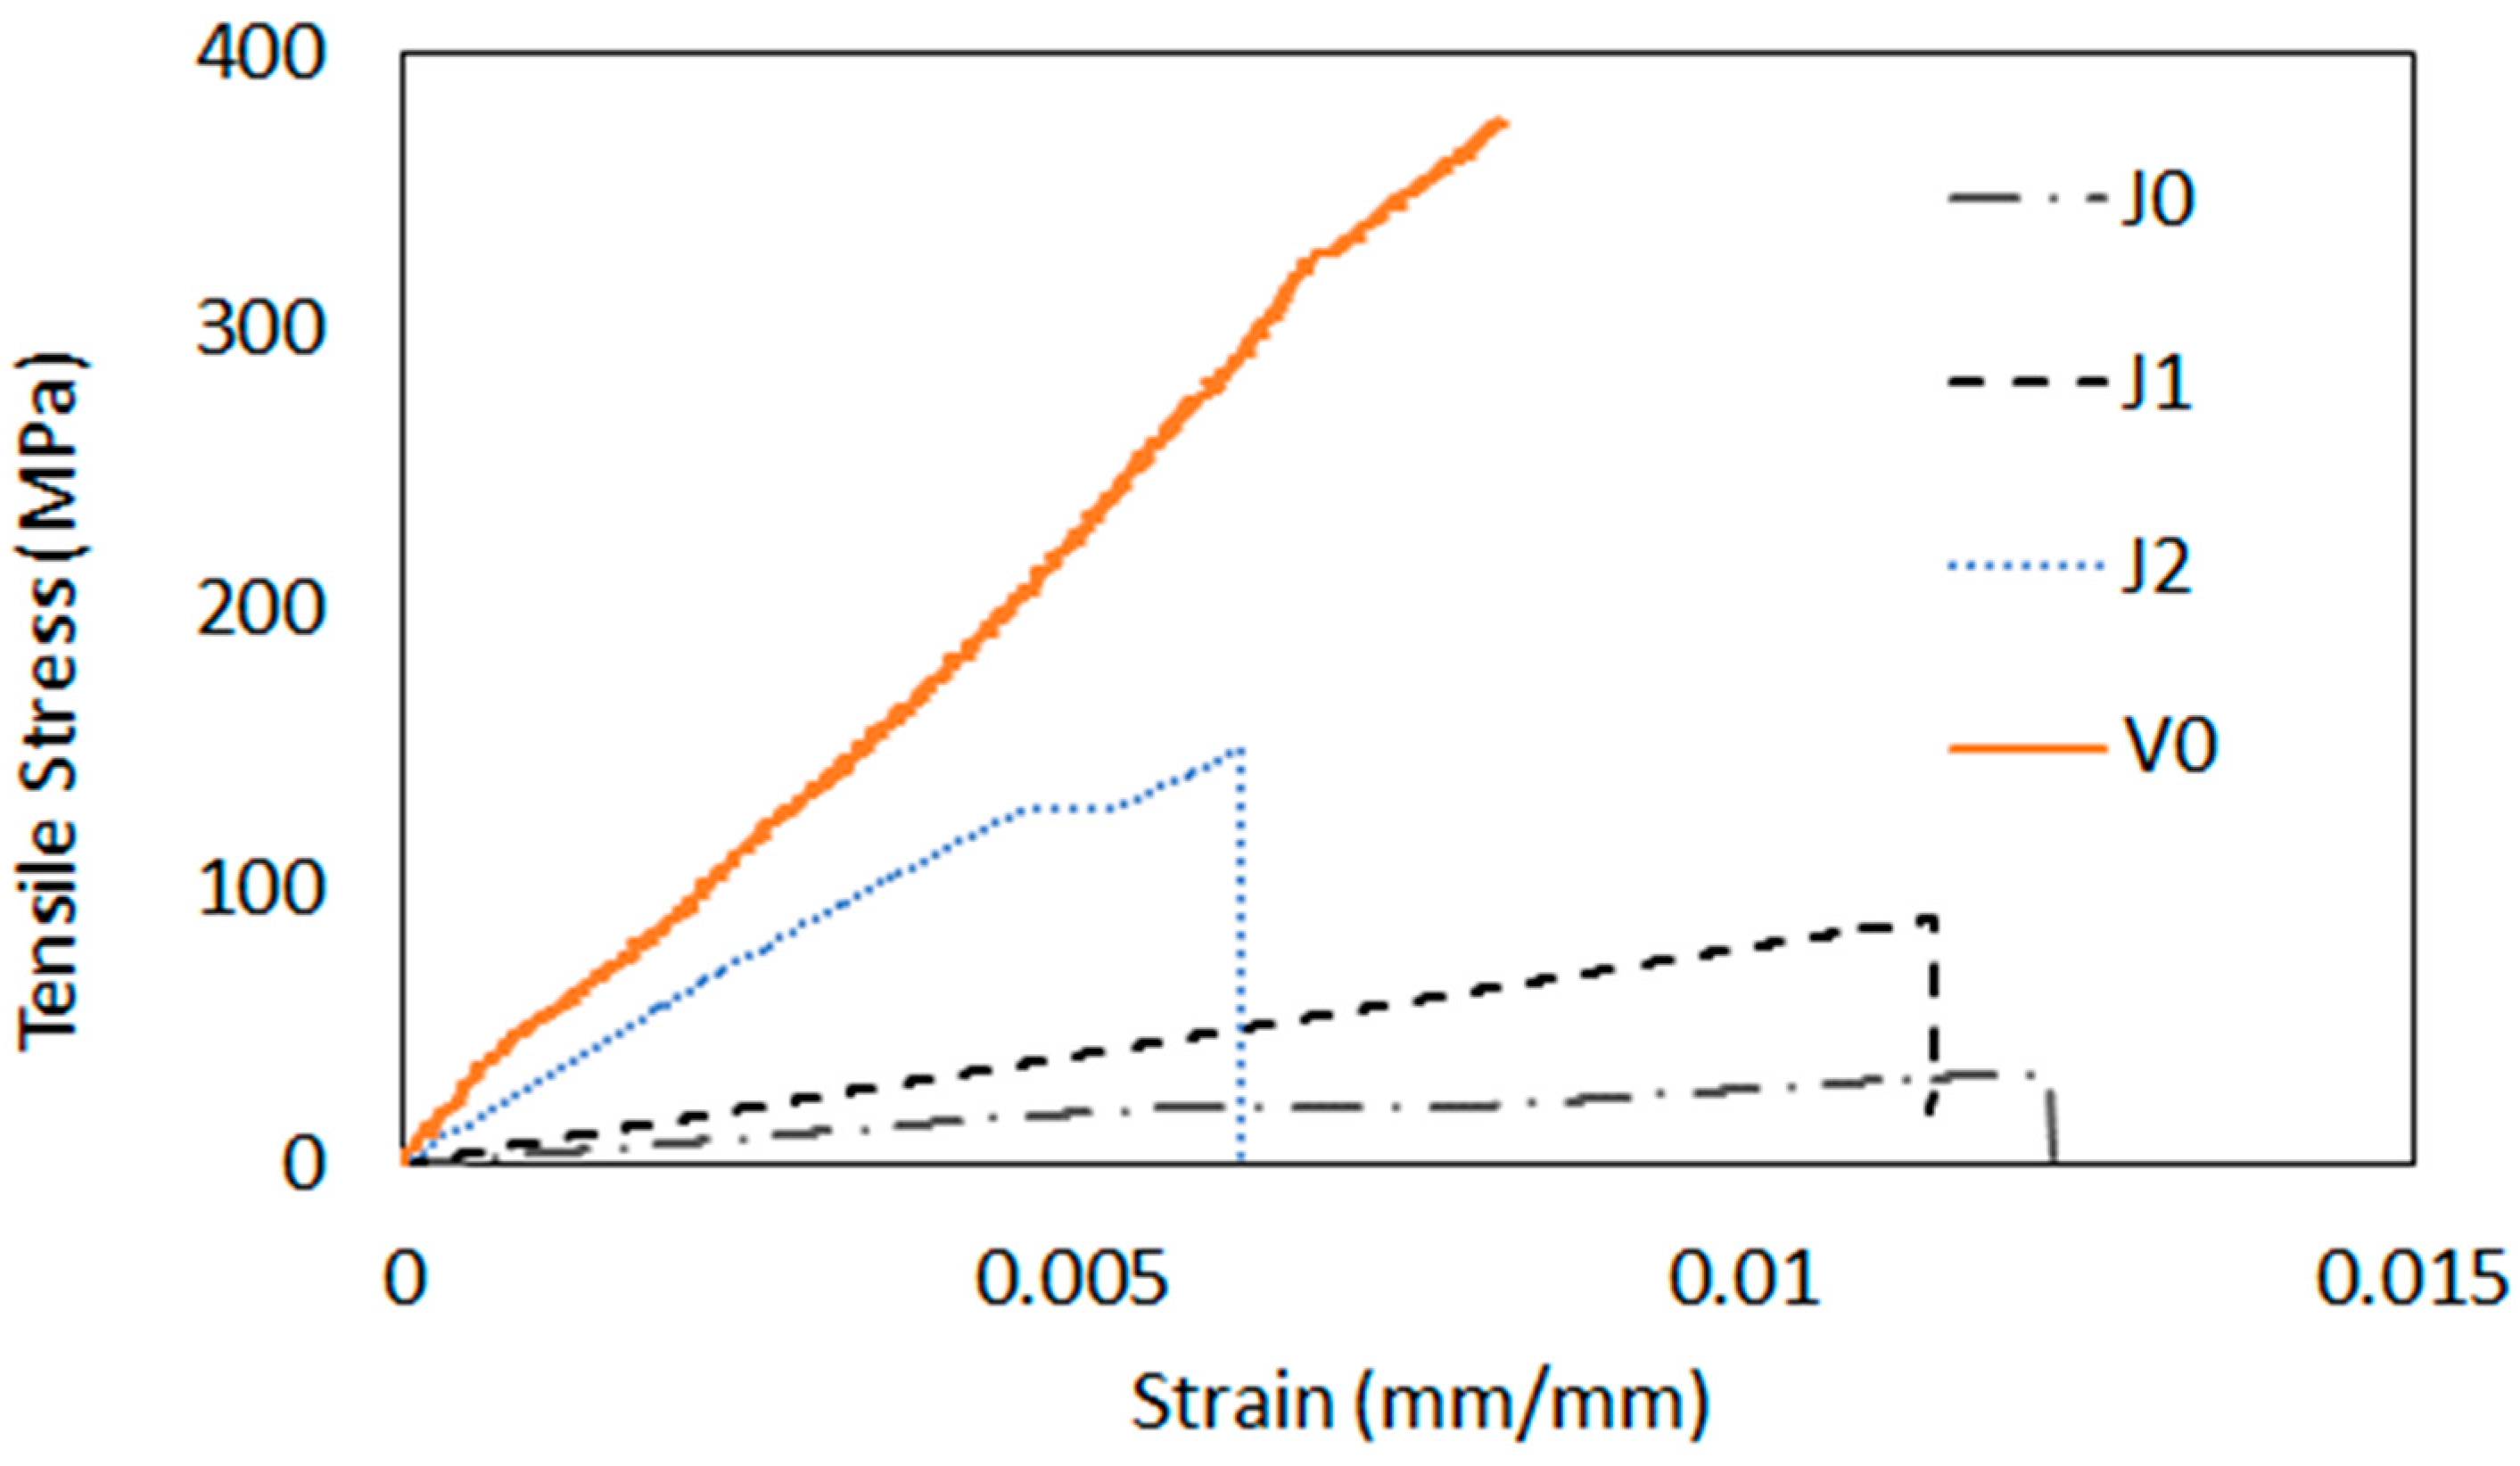
3.1. Tensile Tests
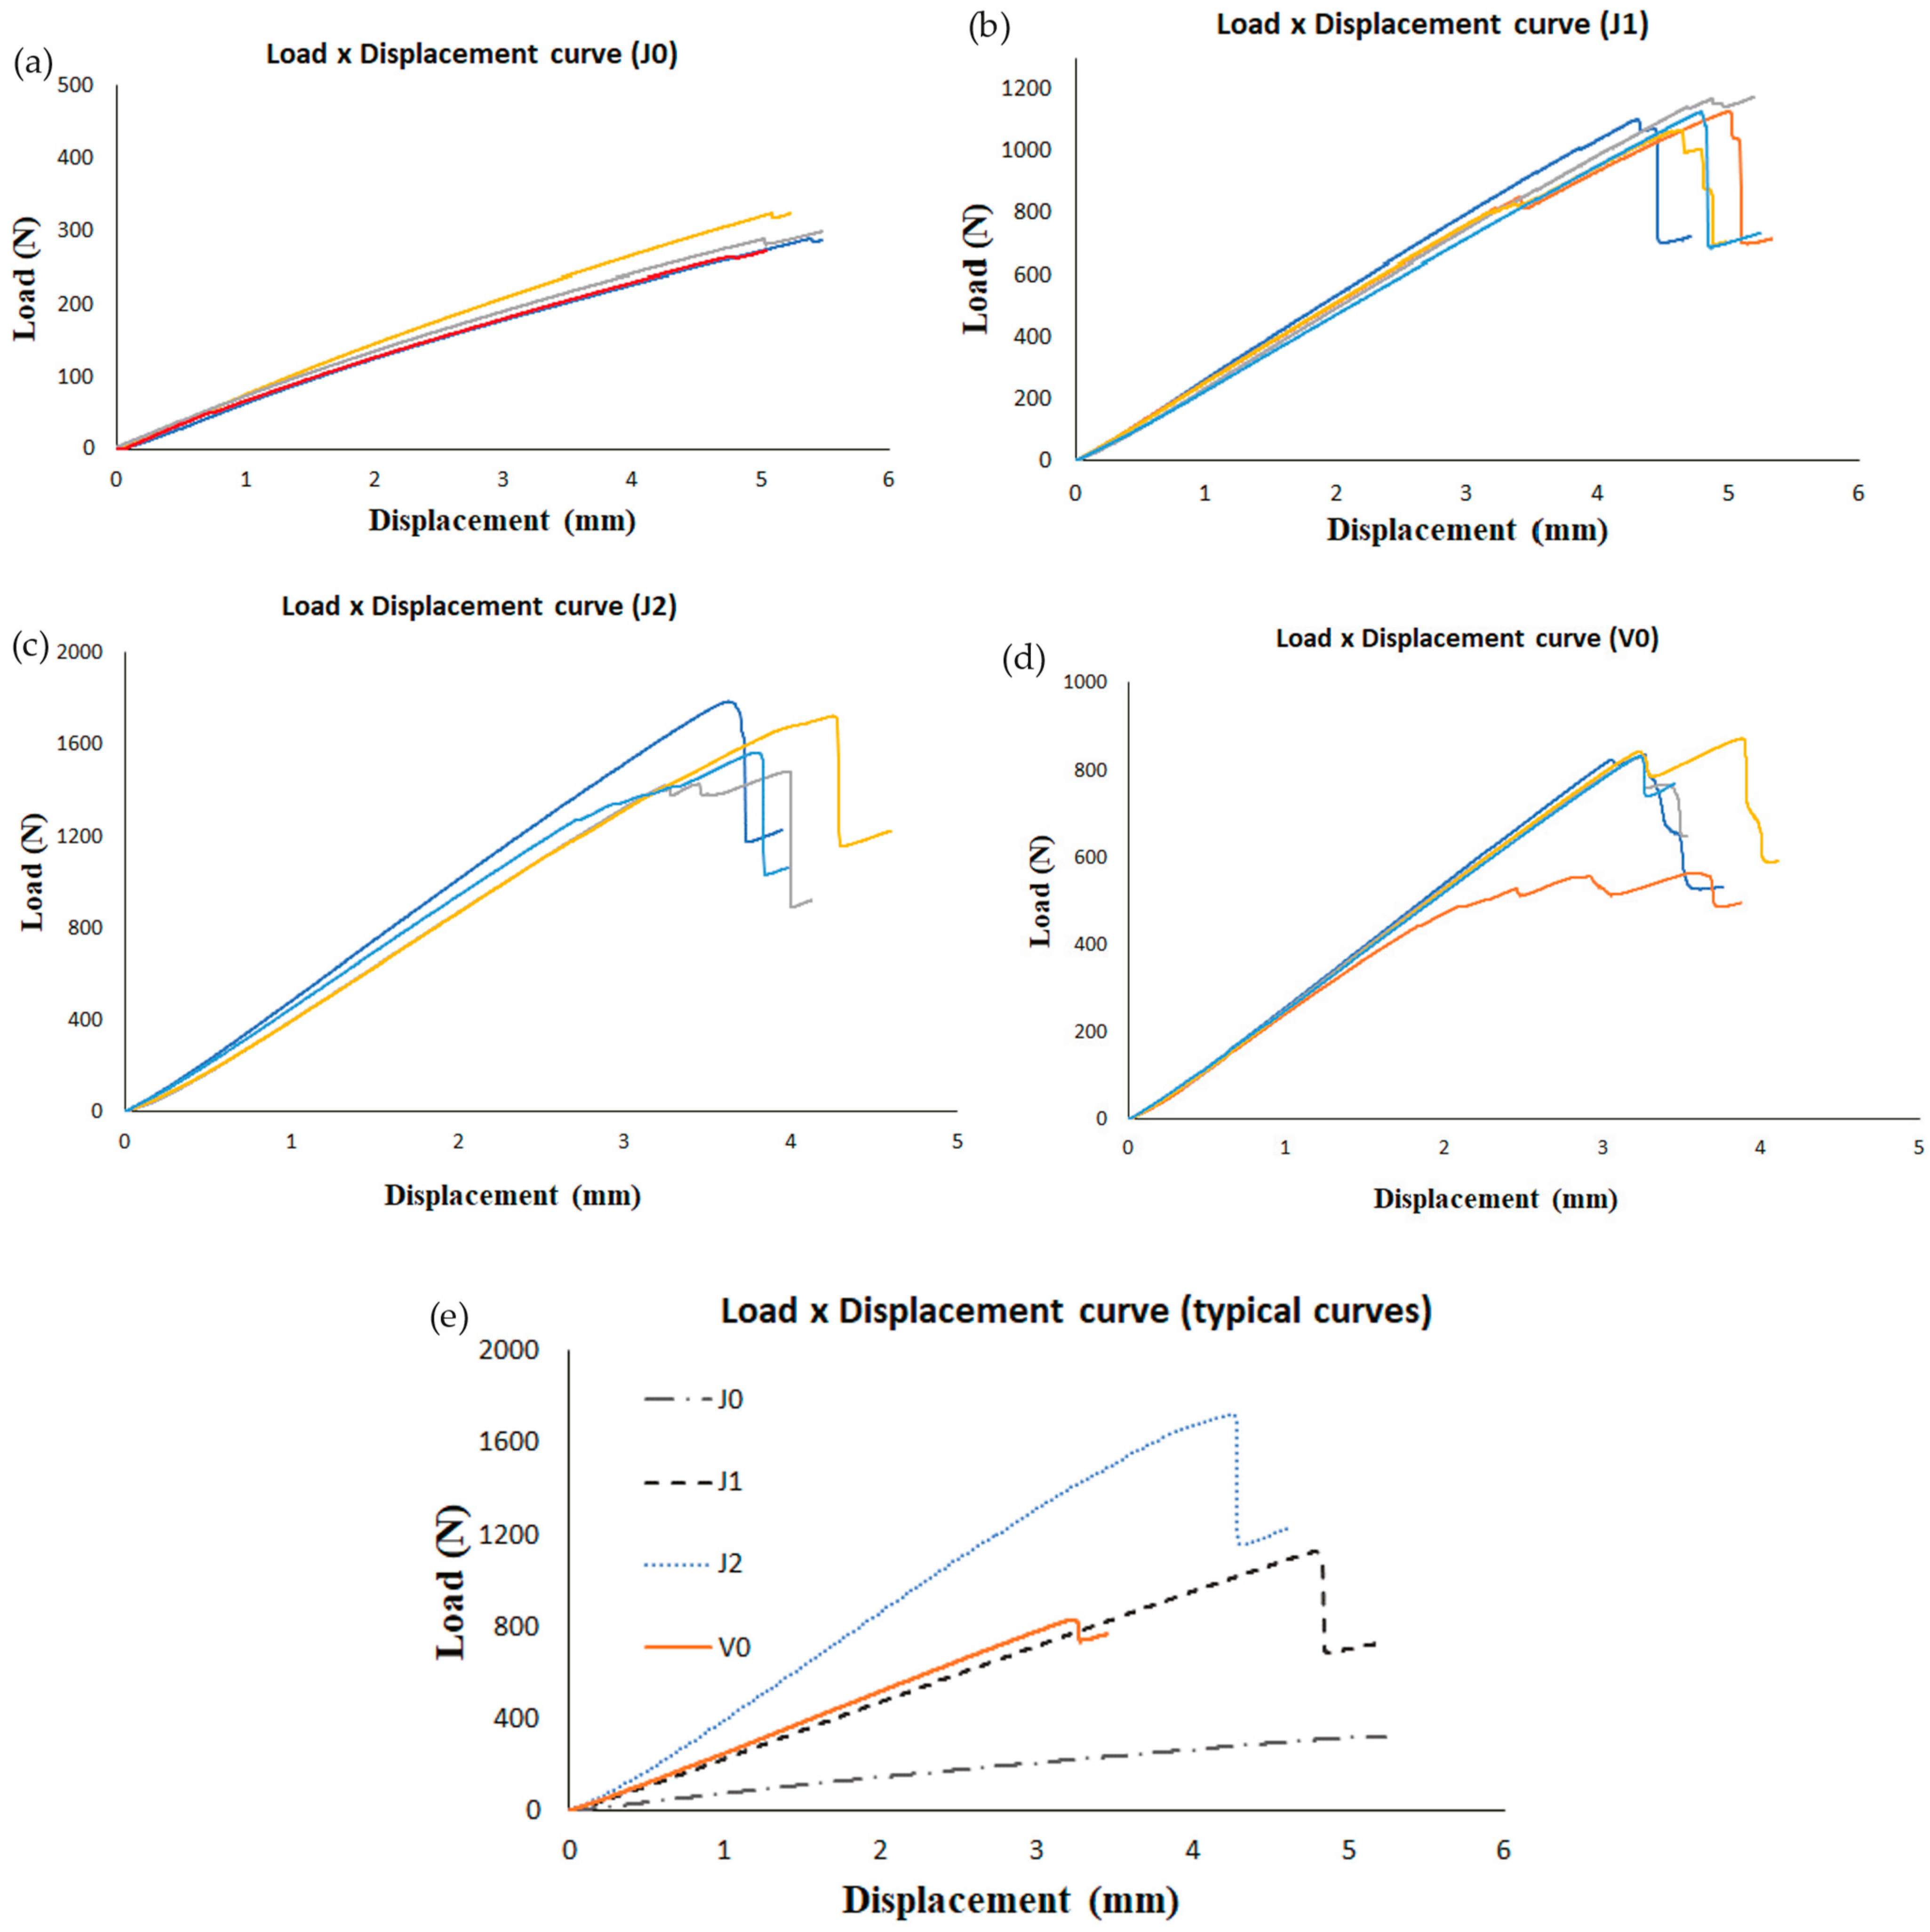
3.2. ENF Tests
3.2.1. Maximum Load
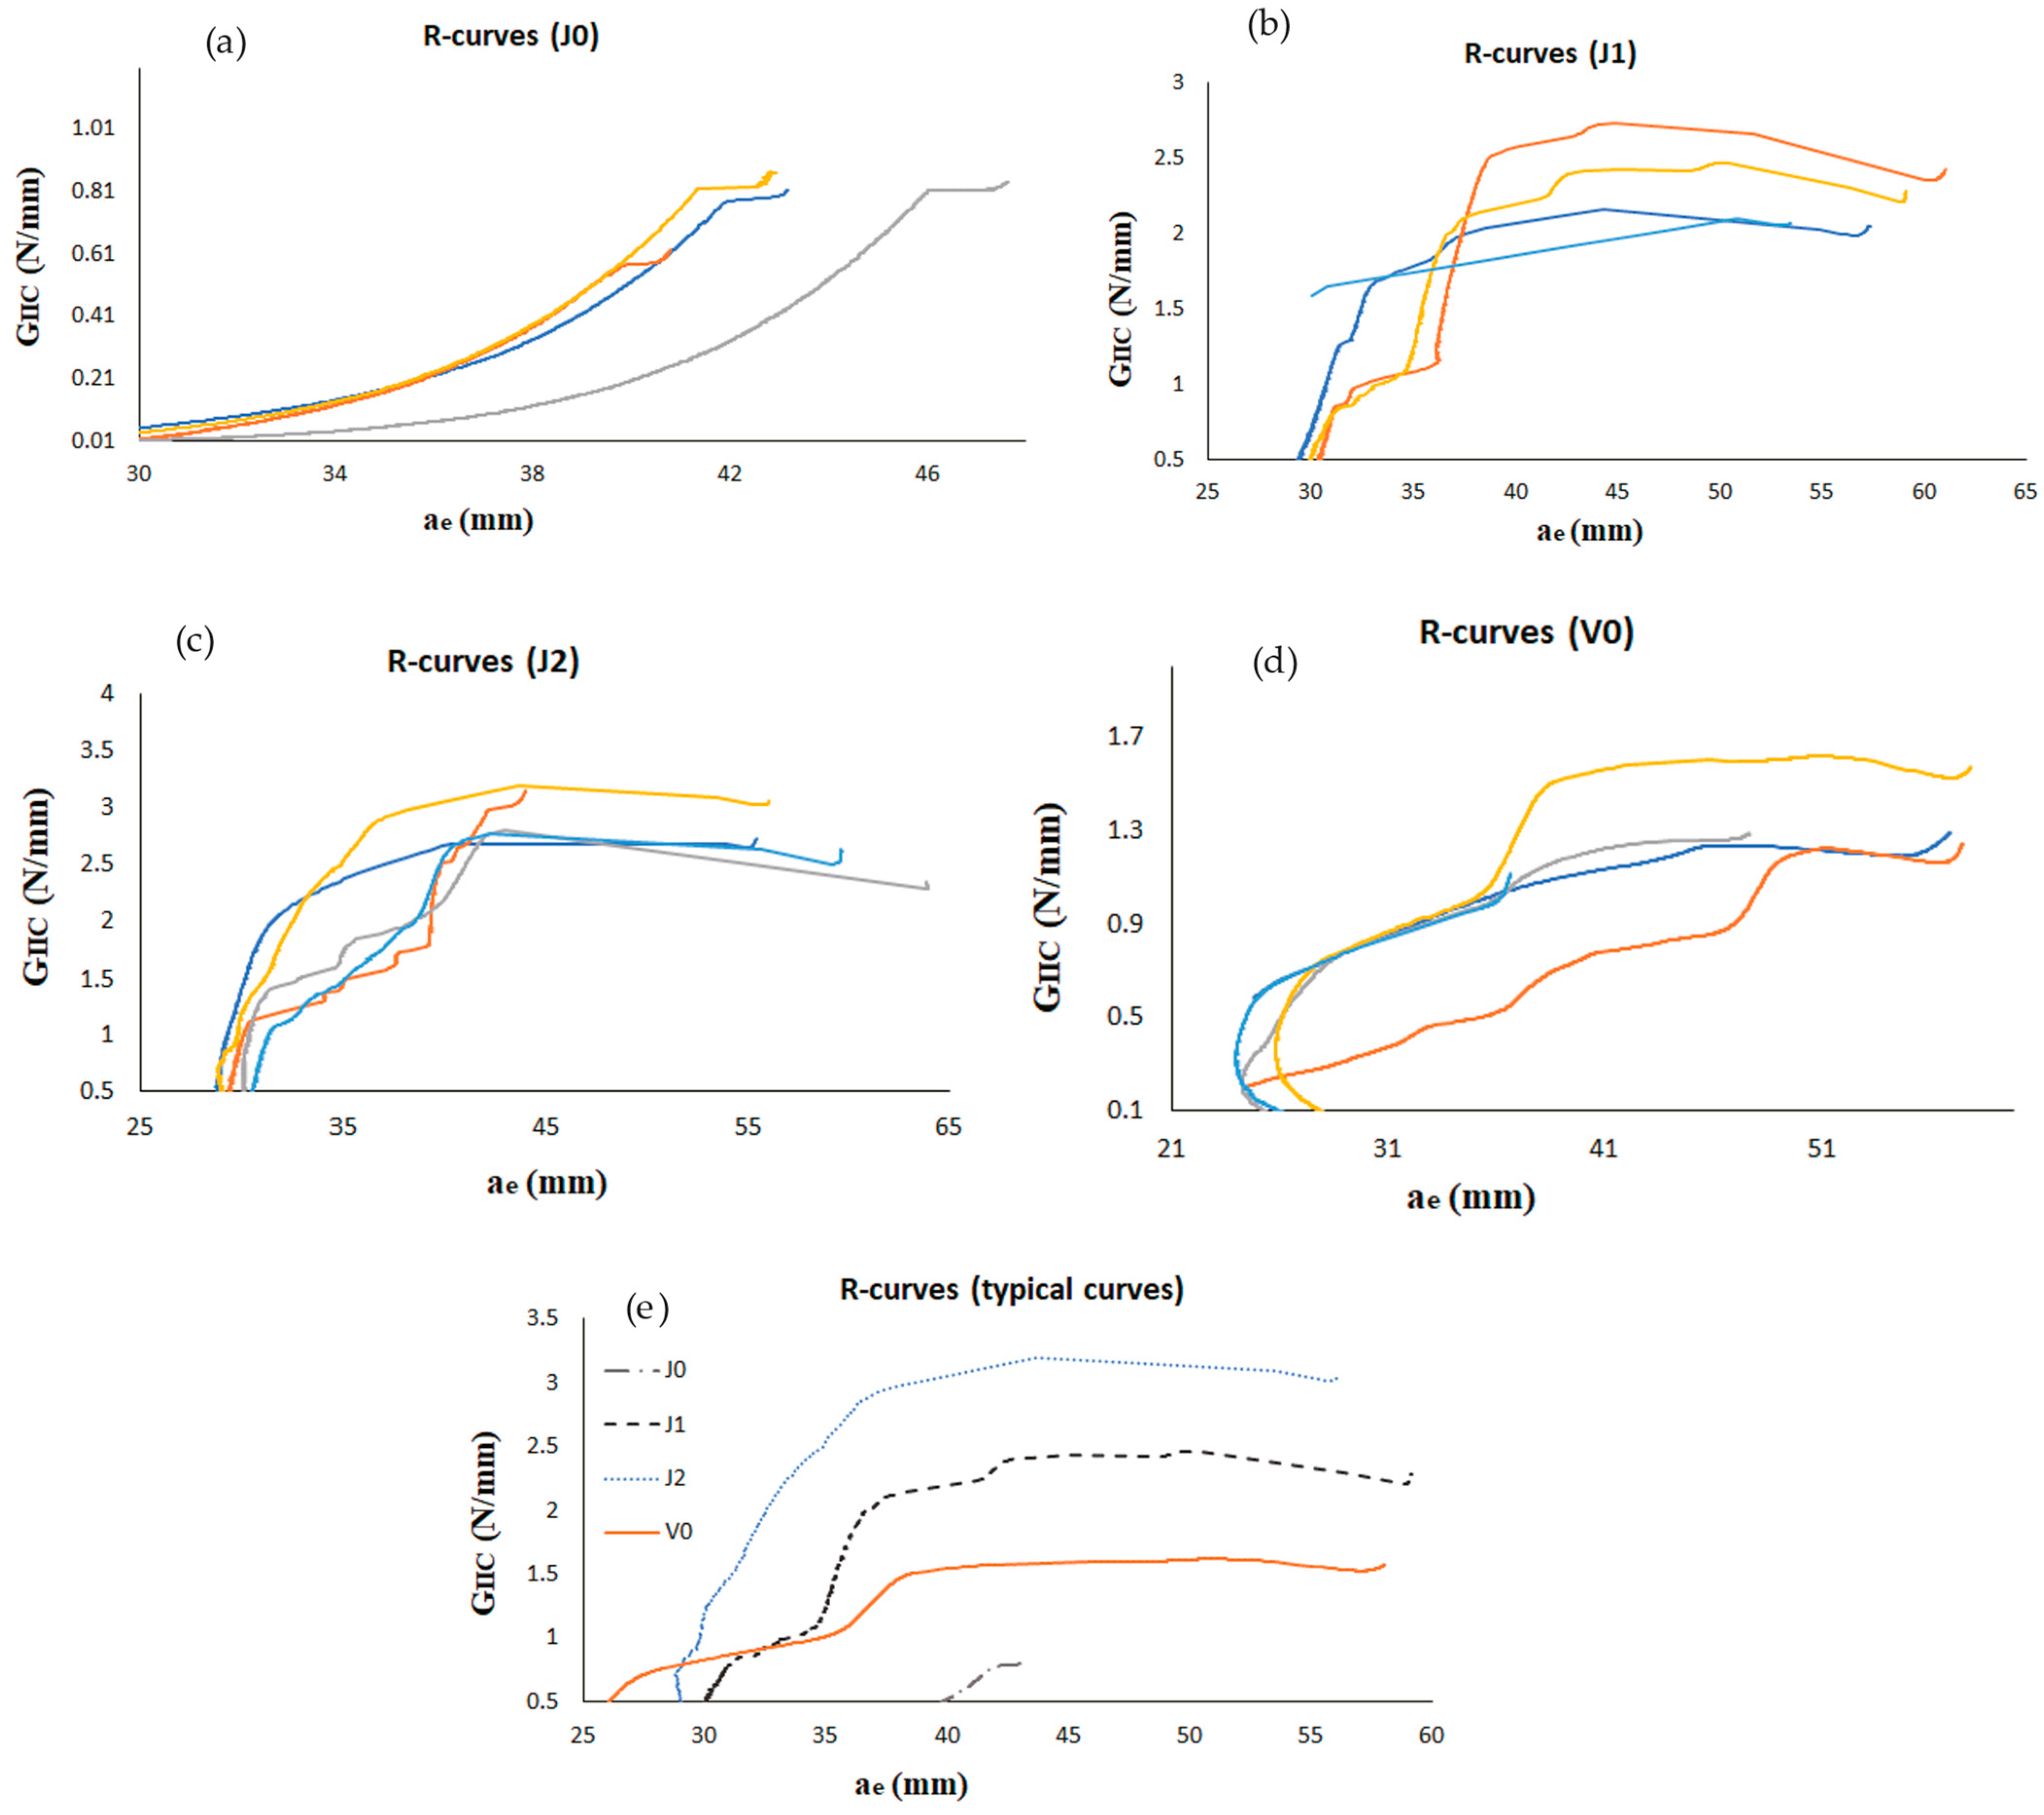
3.2.2. Fracture Energy
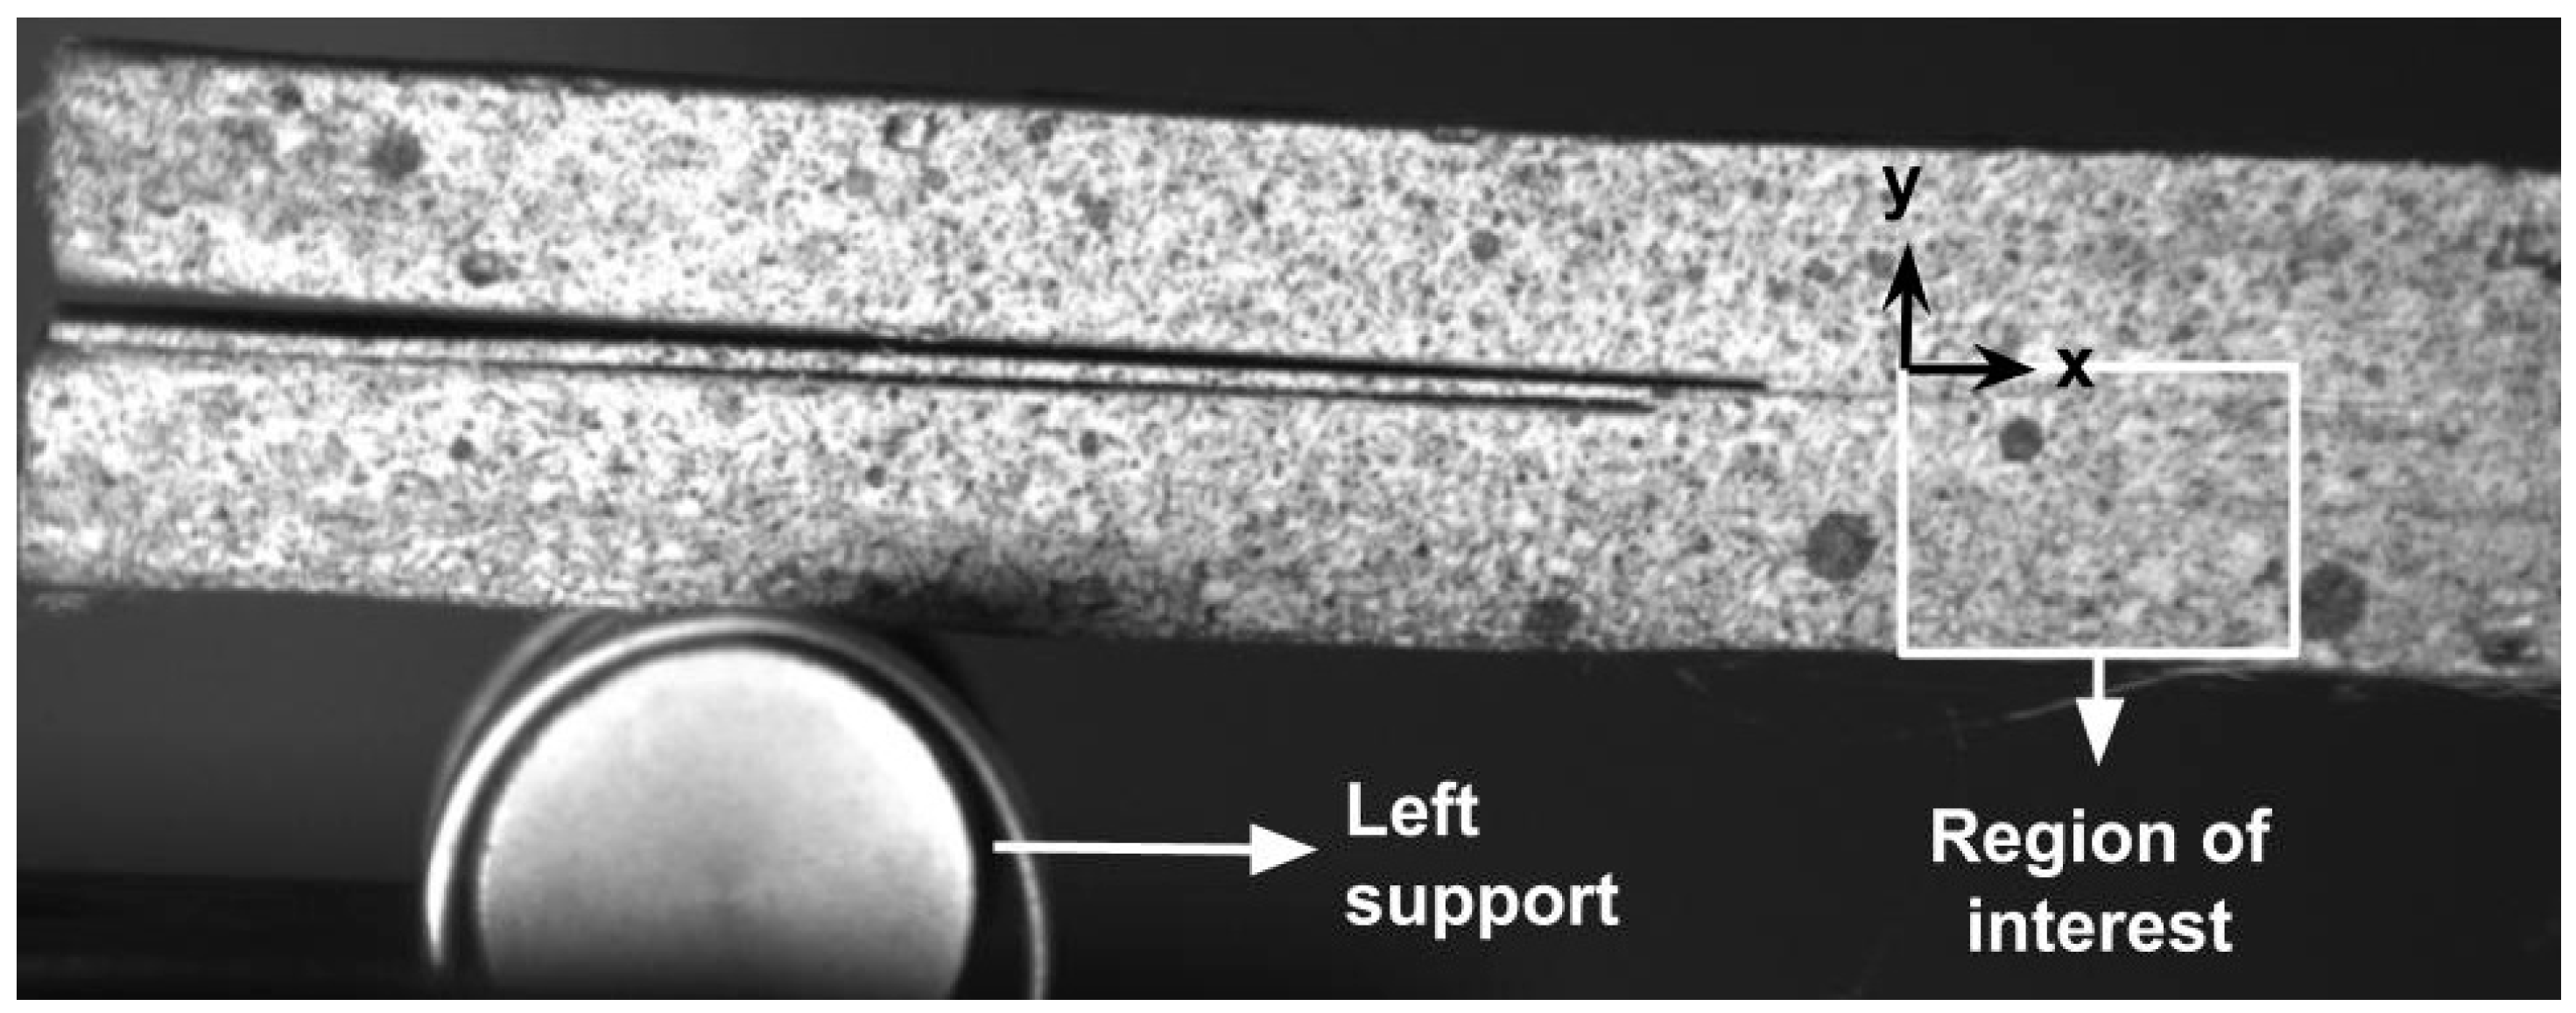
3.2.3. DIC Analysis
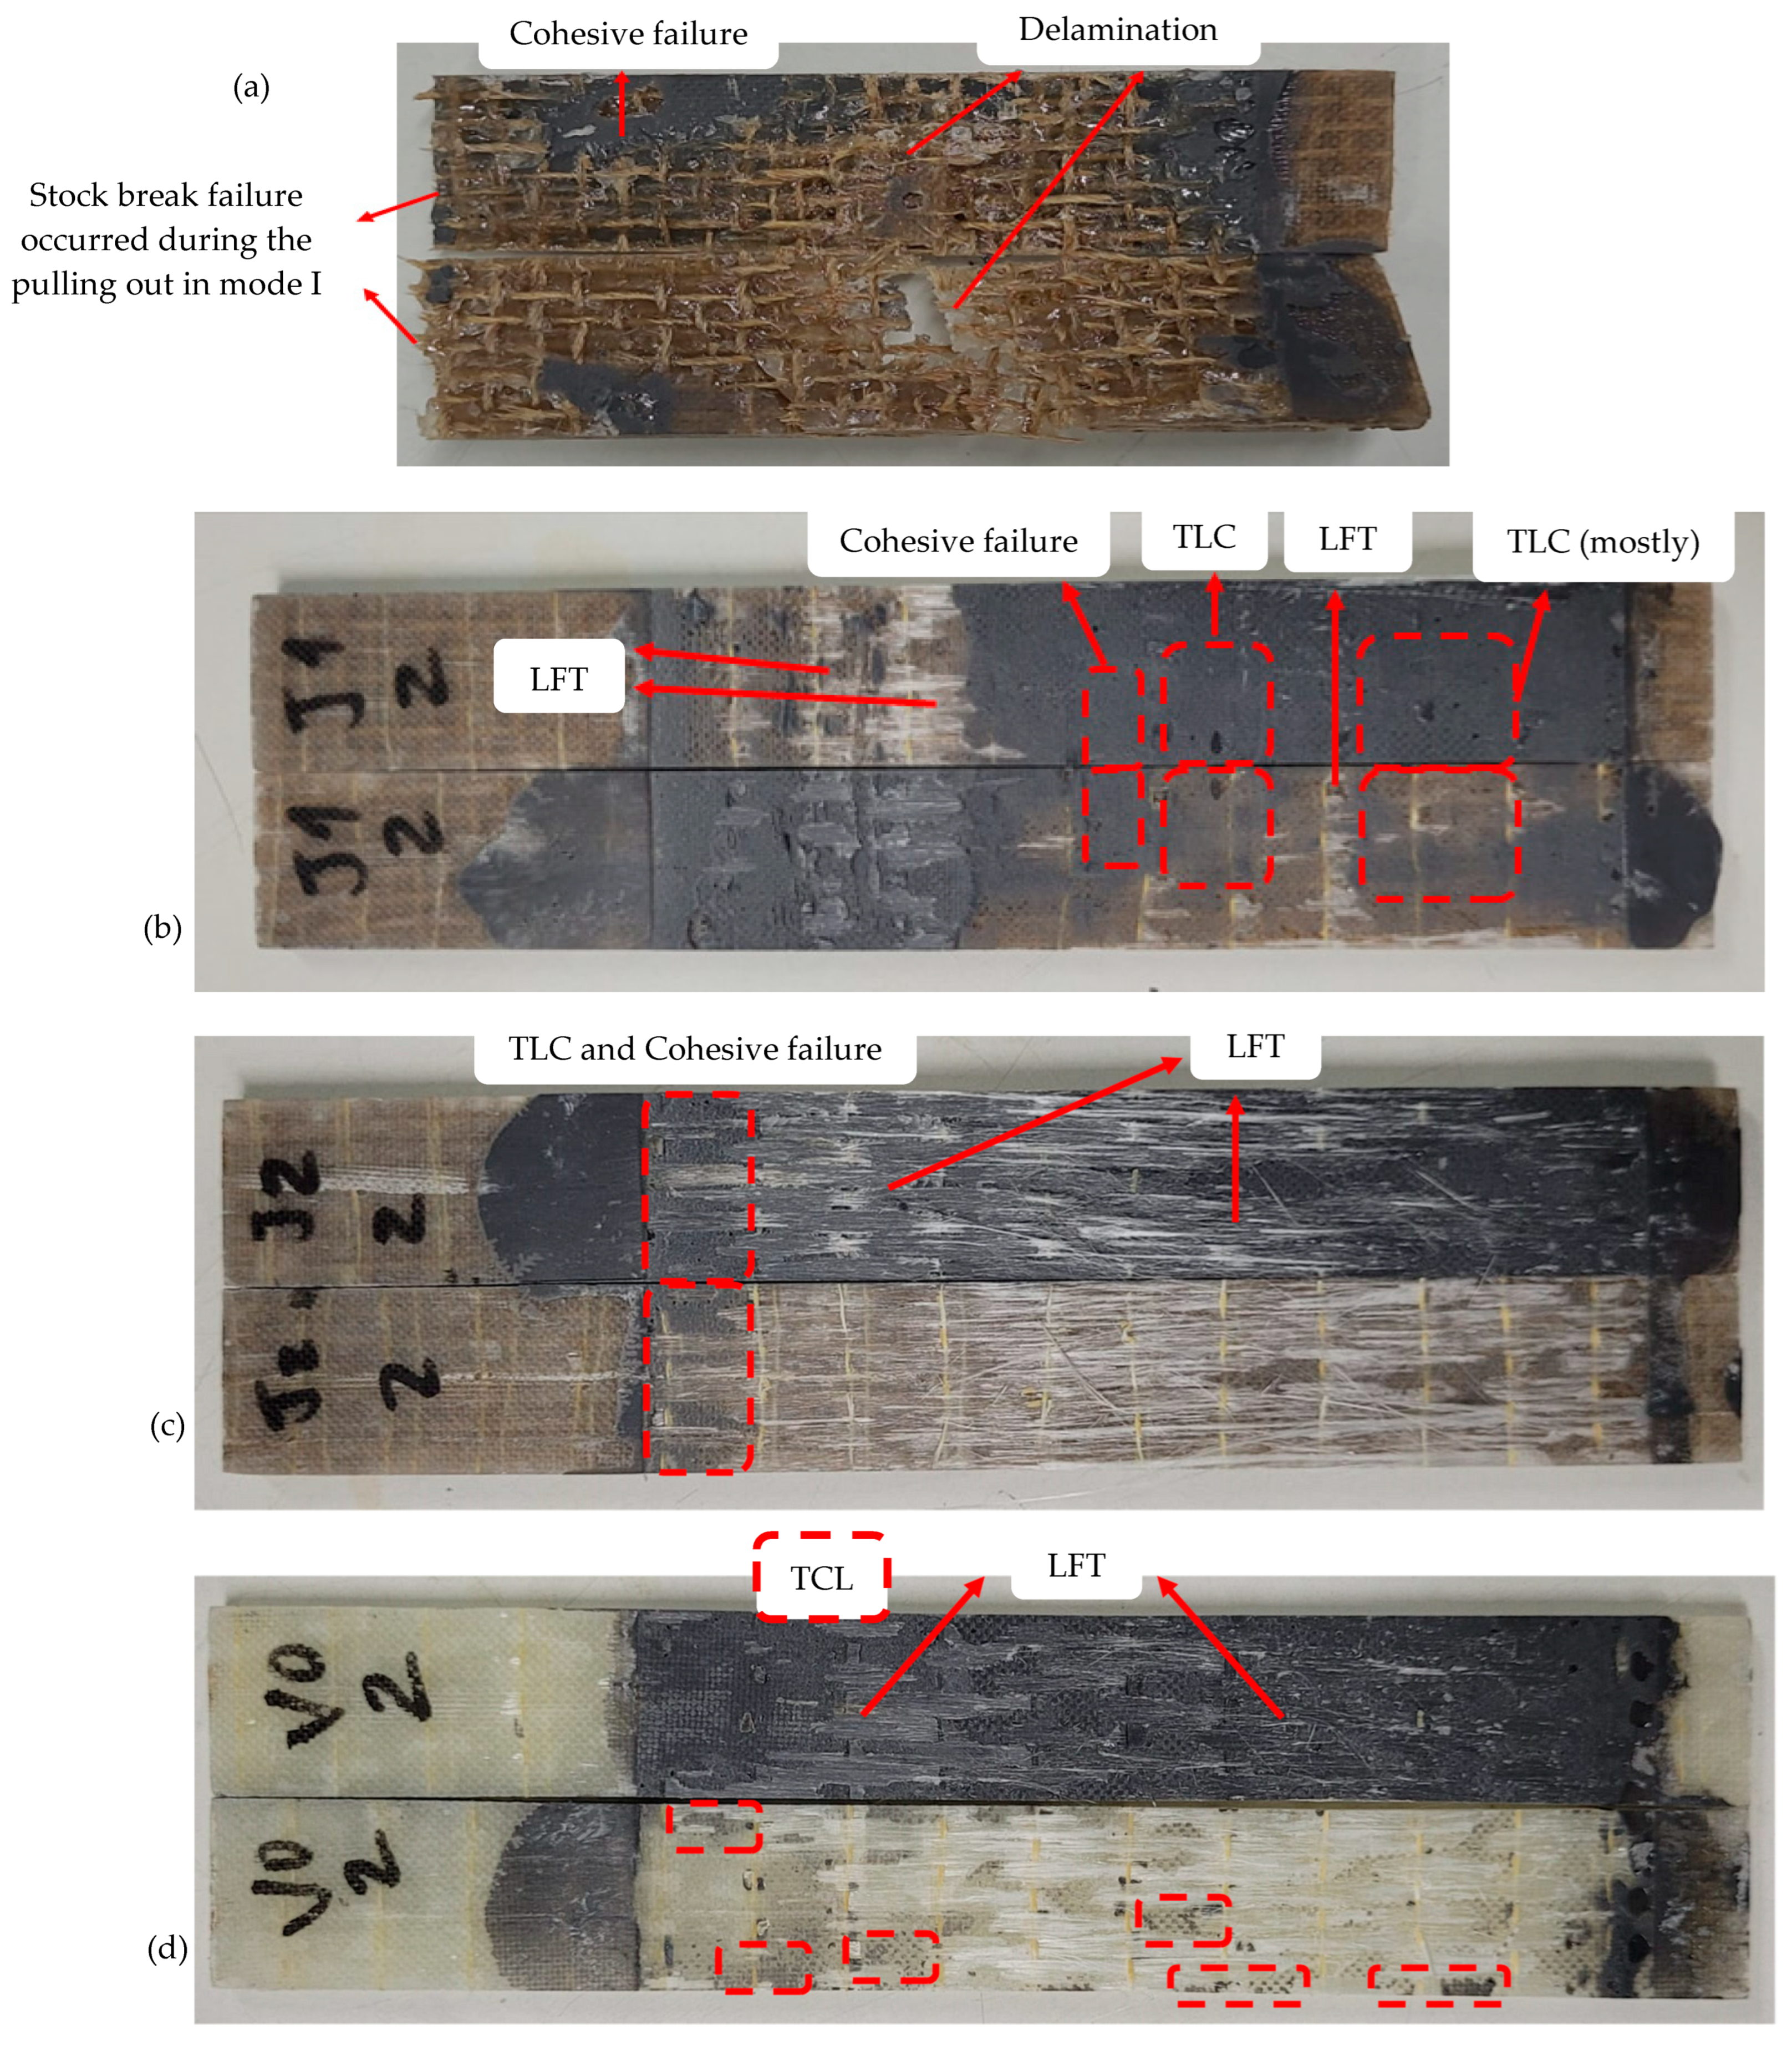
3.2.4. Failure Modes
4. Conclusions
Author Contributions
Funding
Institutional Review Board Statement
Informed Consent Statement
Data Availability Statement
Acknowledgments
Conflicts of Interest
References
- Rajak, D.K.; Pagar, D.D.; Kumar, R.; Pruncu, C.I. Recent progress of reinforcement materials: A comprehensive overview of composite materials. J. Mater. Res. Technol. 2019, 8, 6354–6374. [Google Scholar] [CrossRef]
- Vignoli, L.L.; de Castro, J.T.P. A parametric study of stress concentration issues in unidirectional laminates. Mech. Adv. Mater. Struct. 2021, 28, 1554–1569. [Google Scholar] [CrossRef]
- Campilho, R.; Moura, D.; Gonçalves, D.; da Silva, J.; Banea, M.D.; da Silva, L. Fracture toughness determination of adhesive and co-cured joints in natural fibre composites. Compos. Part B Eng. 2013, 50, 120–126. [Google Scholar] [CrossRef]
- Wambua, P.; Ivens, J.; Verpoest, I. Natural fibres: Can they replace glass in fibre reinforced plastics? Compos. Sci. Technol. 2003, 63, 1259–1264. [Google Scholar] [CrossRef]
- Herrera-Franco, P.J.; Valadez-González, A. A study of the mechanical properties of short natural-fiber reinforced composites. Compos. Part B Eng. 2005, 36, 597–608. [Google Scholar] [CrossRef]
- Ramesh, M.; Deepa, C.; Kumar, L.R.; Sanjay, M.R.; Siengchin, S. Life-cycle and environmental impact as-sessments on processing of plant fibres and its bio-composites: A critical review. J. Ind. Tex. 2020, 51 (Suppl. S4), 5518S–5542S. [Google Scholar] [CrossRef]
- Magalhães, A.; de Moura, M.; Gonçalves, J. Evaluation of stress concentration effects in single-lap bonded joints of laminate composite materials. Int. J. Adhes. Adhes. 2005, 25, 313–319. [Google Scholar] [CrossRef]
- de Queiroz, H.; Neto, J.; Cavalcanti, D.; Banea, M.D. A novel 3D fibre-reinforcement architecture for high performance natural fibre reinforced composite adhesively bonded joints. J. Adhes. 2023, 100, 118–138. [Google Scholar] [CrossRef]
- de Queiroz, H.F.; Banea, M.D. Methods to increase the mechanical performance of composite adhesive joints: An overview with focus on joints with natural fibre composite adherends. J. Compos. Mater. 2022, 56, 3993–4010. [Google Scholar] [CrossRef]
- de Queiroz, H.; Pastor, V.; de Mendonça, A.; Neto, J.; Cavalcanti, D.; Banea, M.D. Effect of hybridization and composite architecture symmetry in the bonded joint performance of jute/carbon fibre-reinforced composites. Int. J. Adhes. Adhes. 2024, 133, 103745. [Google Scholar] [CrossRef]
- de Queiroz, H.; Banea, M.D.; Cavalcanti, D. Experimental analysis of adhesively bonded joints in synthetic- and natural fibre-reinforced polymer composites. J. Compos. Mater. 2020, 54, 1245–1255. [Google Scholar] [CrossRef]
- de Queiroz, H.F.M.; Banea, M.D.; Cavalcanti, D.K.K. Adhesively bonded joints of jute, glass and hybrid jute/glass fibre-reinforced polymer composites for automotive industry. Appl. Adhes. Sci. 2021, 9, 2. [Google Scholar] [CrossRef]
- Neto, R.M.C.; Akhavan-Safar, A.; Sampaio, E.M.; Assis, J.T.; da Silva, L.F.M. Effect of Creep on the mode II Residual Fracture Energy of Adhesives. J. Appl. Polym. Sci. 2021, 138, 51387. [Google Scholar] [CrossRef]
- Figueiredo, J.; Campilho, R.; Marques, E.; Machado, J.; da Silva, L. Adhesive thickness influence on the shear fracture toughness measurements of adhesive joints. Int. J. Adhes. Adhes. 2018, 83, 15–23. [Google Scholar] [CrossRef]
- Da Silva, L.F.M.; Campilho, R.D.; da Silva, L.F.; Campilho, R.D. Advances in Numerical Modelling of Adhesive Joints; Springer: Berlin/Heidelberg, Germany, 2012. [Google Scholar] [CrossRef]
- Zulkifli, R.; Pei, K.S.; Azha, C.H. Interlaminar Fracture Properties of Multi-Layer Woven Silk Fibre/Polyester Composites. Asian J. Appl. Sci. 2008, 1, 177–184. [Google Scholar] [CrossRef]
- Prasad, V.; Sekar, K.; Varghese, S.; Joseph, M. Enhancing Mode I and Mode II interlaminar fracture toughness of flax fibre reinforced epoxy composites with nano TiO2. Compos. Part A Appl. Sci. Manuf. 2019, 124, 105505. [Google Scholar] [CrossRef]
- Zhang, Y.; Li, Y.; Ma, H.; Yu, T. Tensile and interfacial properties of unidirectional flax/glass fiber reinforced hybrid composites. Compos. Sci. Technol. 2013, 88, 172–177. [Google Scholar] [CrossRef]
- Ekeoseye, W.S.; Kolasangiani, K.; Oguamanam, D.C.; Bougherara, H. Mode II Interlaminar Fracture Toughness of Flax/Glass/Epoxy Hybrid Composite Materials: An Experimental and Numerical Study. J. Nat. Fibers 2020, 19, 4286–4300. [Google Scholar] [CrossRef]
- Bensadoun, F.; Verpoest, I.; Van Vuure, A. Interlaminar fracture toughness of flax-epoxy composites. J. Reinf. Plast. Compos. 2017, 36, 121–136. [Google Scholar] [CrossRef]
- Chandel, P.S.; Tyagi, Y.K.; Jha, K.; Kumar, R.; Sharma, S.; Singh, J.; A Ilyas, R. Study of mode II interlaminar fracture toughness of laminated composites of glass and jute fibres in epoxy for structural applications. Funct. Compos. Struct. 2021, 3, 044002. [Google Scholar] [CrossRef]
- Wang, F.; Shao, Z.; Wu, Y. Mode II interlaminar fracture properties of Moso bamboo. Compos. Part B Eng. 2013, 44, 242–247. [Google Scholar] [CrossRef]
- Neto, R.M.C.; Vignoli, L.L.; Moreira, C.S.; Rohem, N.R.; Sampaio, E.M. Increase of shear fracture energy of adhesive joints using double-double laminates. J. Adhes. 2024, 1–19. [Google Scholar] [CrossRef]
- Sadeghi, A.; Mahshid, R.; Heidari-Rarani, M.; Lessard, L. Effect of Lamina Fiber Orientation Interfaced with Semi-Flexible Adhesive Layer on Strength and Failure Mode of Composite Single-Lap Joints. Int. J. Adhes. Adhes. 2022, 118, 103232. [Google Scholar] [CrossRef]
- Morgado, M.; Carbas, R.; dos Santos, D.; da Silva, L. Strength of CFRP Joints Reinforced with Adhesive Layers. Int. J. Adhes. Adhes. 2020, 97, 102475. [Google Scholar] [CrossRef]
- de Moura, M.; de Morais, A. Equivalent crack based analyses of ENF and ELS tests. Eng. Fract. Mech. 2008, 75, 2584–2596. [Google Scholar] [CrossRef]
- Fernández, M.V.; de Moura, M.F.; da Silva, L.F.; Marques, A.T. Characterization of composite bonded joints under pure mode II fatigue loading. Compos. Struct. 2013, 95, 222–226. [Google Scholar] [CrossRef]
- de Moura, M.; Campilho, R.; Gonçalves, J. Pure mode II fracture characterization of composite bonded joints. Int. J. Solids Struct. 2009, 46, 1589–1595. [Google Scholar] [CrossRef]
- Kanninen, M.F.; Popelar, C.H. Advanced Fracture Mechanics; Oxford University Press: Oxford, UK, 1985. [Google Scholar]
- Shahzad, A. 11—Mechanical properties of lignocellulosic fiber composites. In Lignocellulosic Fibre and Biomass-Based Composite Materials; Woodhead Publishing Series in Composites Science and Engineering; Jawaid, M., Md Tahir, P., Saba, N., Eds.; Woodhead Publishing: Cambridge, UK, 2017; pp. 193–223. [Google Scholar] [CrossRef]
- de Araujo Alves Lima, R.; Kawasaki Cavalcanti, D.; de Souza e Silva Neto, J.; Meneses da Costa, H.; Banea, M.D. Effect of surface treatments on interfacial properties of natural intralaminar hybrid composites. Polym. Compos. 2020, 41, 314–325. [Google Scholar] [CrossRef]


| Group | Young’s Modulus (GPa) | Tensile Strength (MPa) |
|---|---|---|
| J0 | 4.18 ± 0.34 | 37.45 ± 5.10 |
| J1 | 7.9 ± 0.64 | 98.18 ± 8.52 |
| J2 | 10.88 ± 1.69 | 149.87 ± 6.34 |
| V0 | 38.9 ± 2.47 | 357.47 ± 18.99 |
| Group | Fmax (N) | % Increase in Relation to J0 |
|---|---|---|
| J0 | 337.31 ± 51.18 | - |
| J1 | 1131.93 ± 40.50 | 236% |
| J2 | 1626.36 ± 102.99 | 382% |
| V0 | 786.37 ± 88.77 | 133% |
| Group | GIIc (N/mm) | % Increase in Relation to J0 |
|---|---|---|
| J0 | 0.87 ± 0.15 | - |
| J1 | 2.15 ± 0.33 | 147% |
| J2 | 2.90 ± 0.38 | 233% |
| V0 | 1.33 ± 0.14 | 53% |
Disclaimer/Publisher’s Note: The statements, opinions and data contained in all publications are solely those of the individual author(s) and contributor(s) and not of MDPI and/or the editor(s). MDPI and/or the editor(s) disclaim responsibility for any injury to people or property resulting from any ideas, methods, instructions or products referred to in the content. |
© 2024 by the authors. Licensee MDPI, Basel, Switzerland. This article is an open access article distributed under the terms and conditions of the Creative Commons Attribution (CC BY) license (https://creativecommons.org/licenses/by/4.0/).
Share and Cite
Neto, R.; Mendes, B.; Borges, B.; Moreira, C.; Sampaio, E.; Banea, M. Assessment of Shear Fracture Energy in Hybrid Composites with Natural and Synthetic Fibers. Materials 2024, 17, 3794. https://doi.org/10.3390/ma17153794
Neto R, Mendes B, Borges B, Moreira C, Sampaio E, Banea M. Assessment of Shear Fracture Energy in Hybrid Composites with Natural and Synthetic Fibers. Materials. 2024; 17(15):3794. https://doi.org/10.3390/ma17153794
Chicago/Turabian StyleNeto, Ranulfo, Bernardo Mendes, Bernardo Borges, Carolina Moreira, Eduardo Sampaio, and Mariana Banea. 2024. "Assessment of Shear Fracture Energy in Hybrid Composites with Natural and Synthetic Fibers" Materials 17, no. 15: 3794. https://doi.org/10.3390/ma17153794
APA StyleNeto, R., Mendes, B., Borges, B., Moreira, C., Sampaio, E., & Banea, M. (2024). Assessment of Shear Fracture Energy in Hybrid Composites with Natural and Synthetic Fibers. Materials, 17(15), 3794. https://doi.org/10.3390/ma17153794