Fatigue Crack Monitoring Method Based on the Lamb Wave Damage Index

Abstract
:1. Introduction
2. Damage Index
3. Experiments
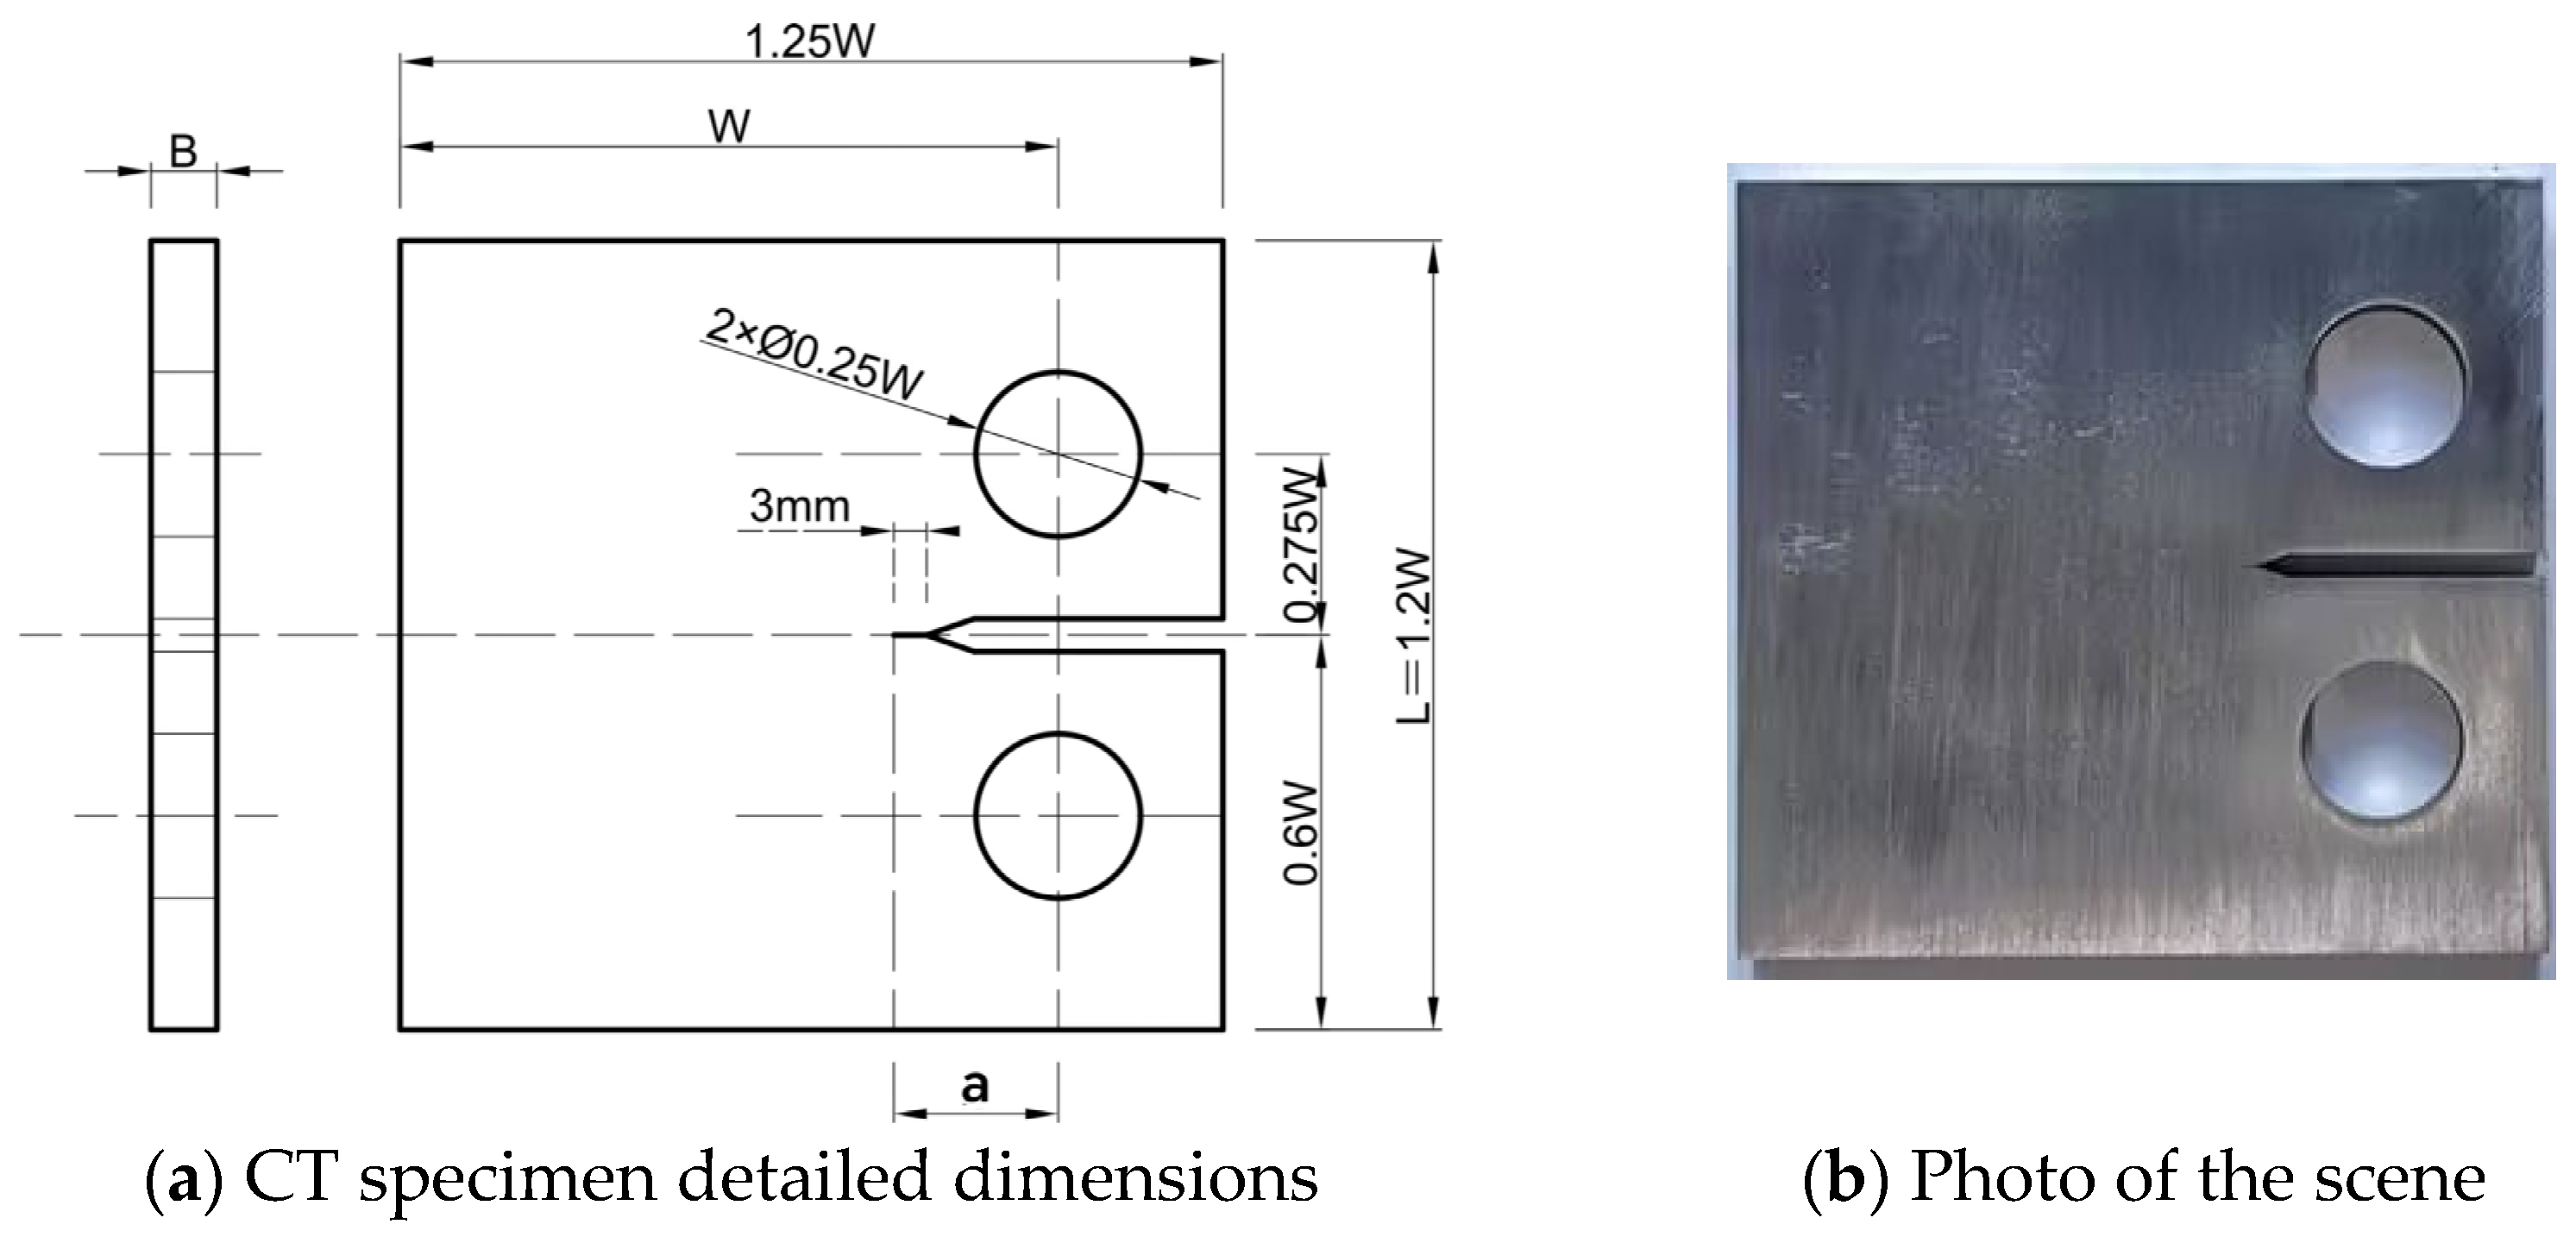
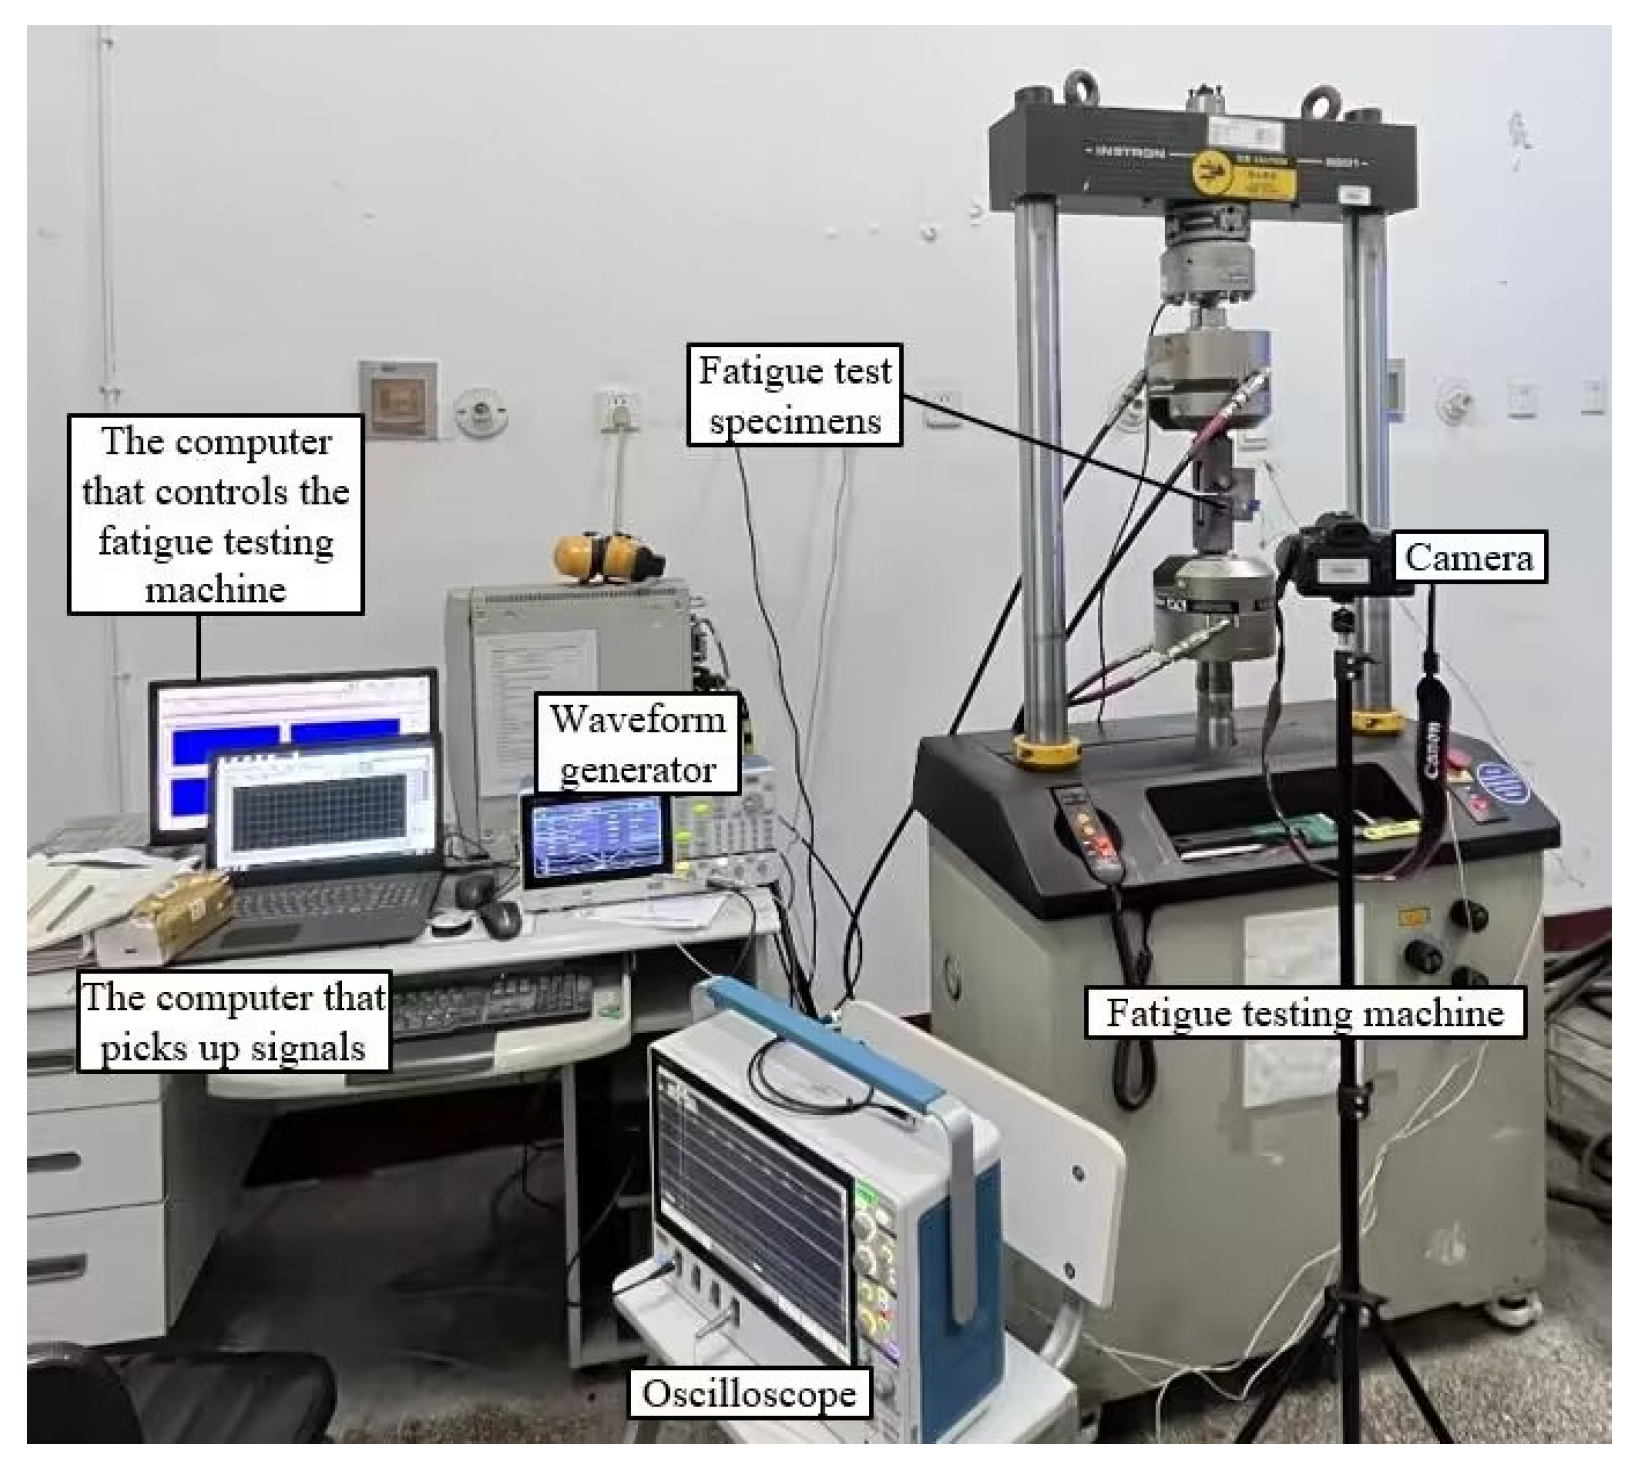
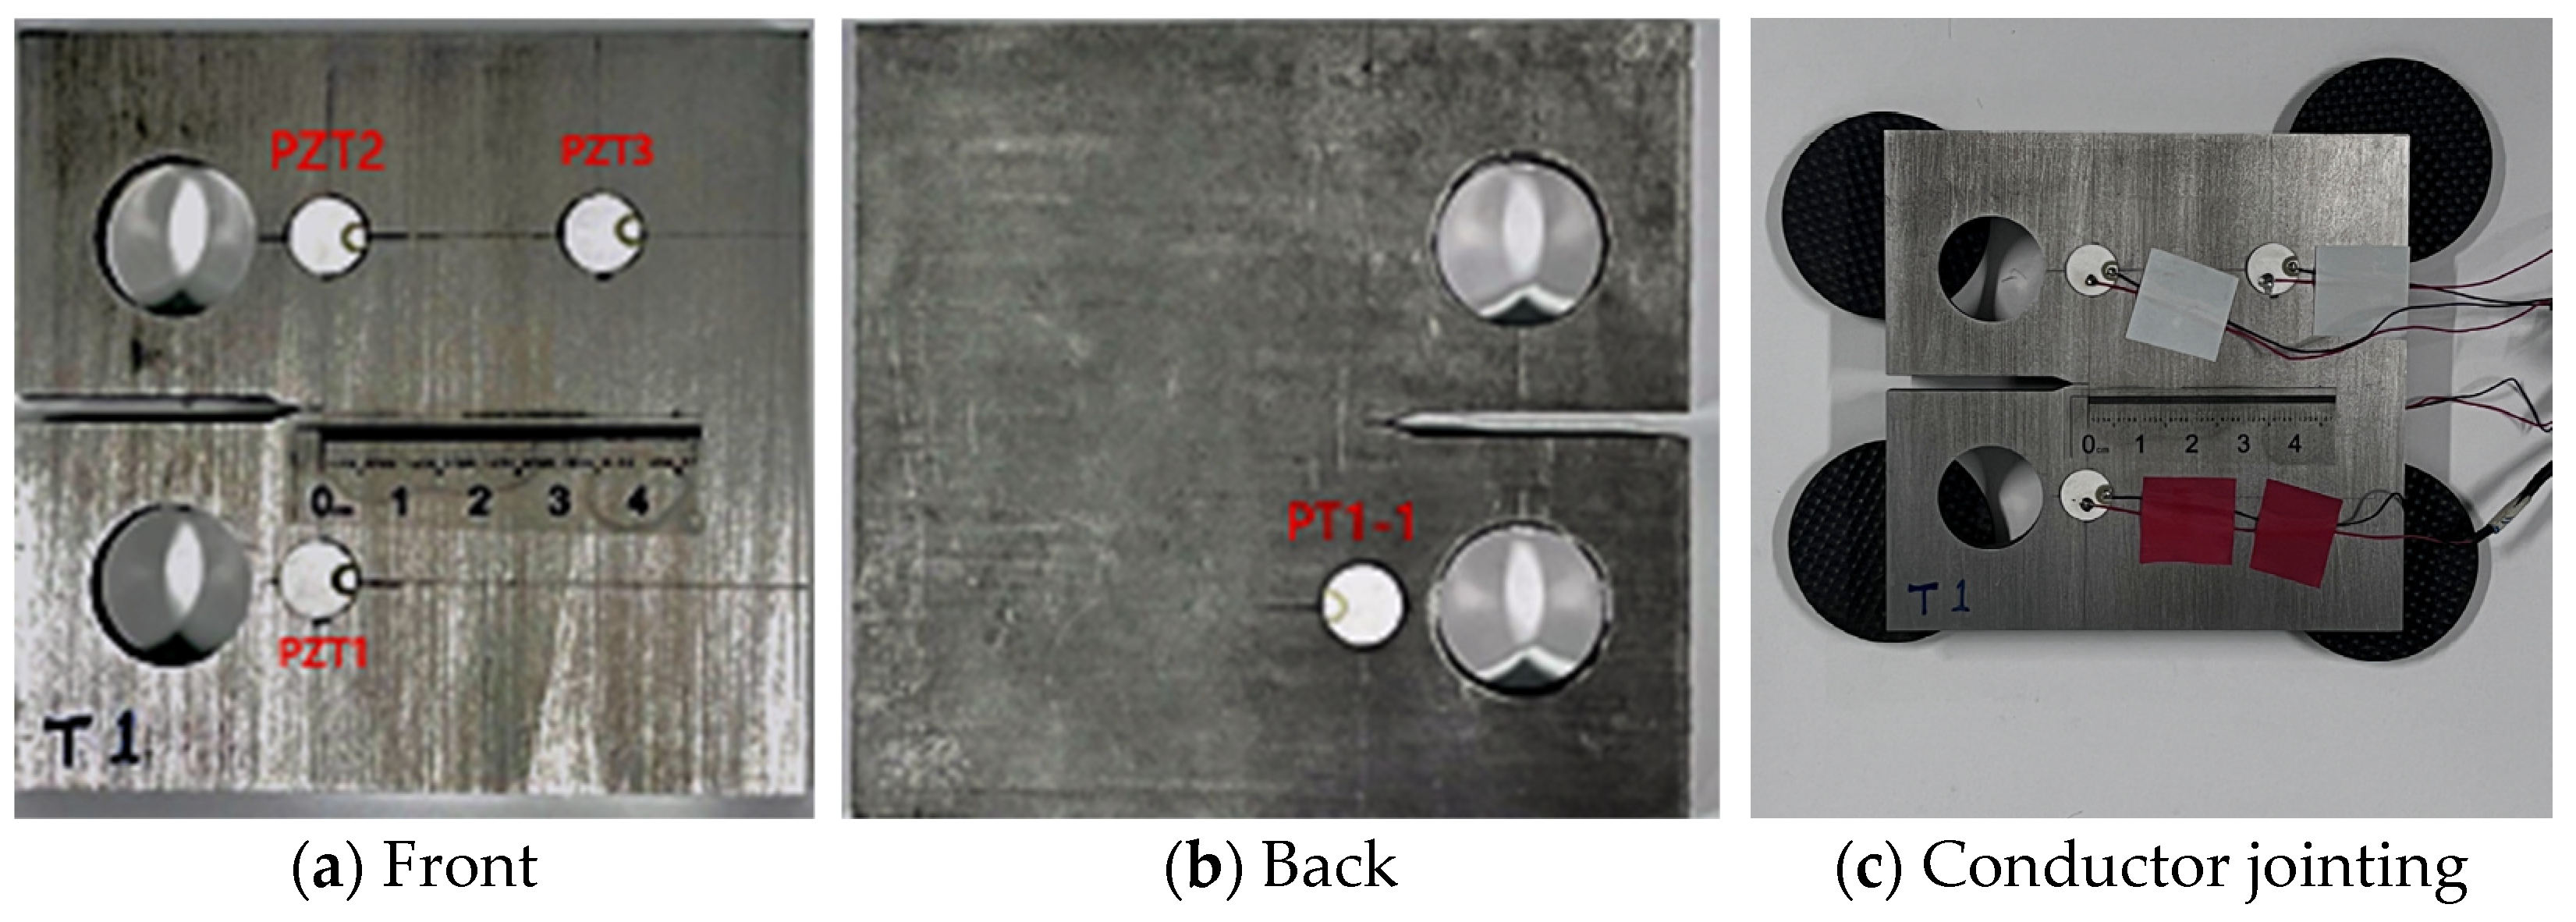
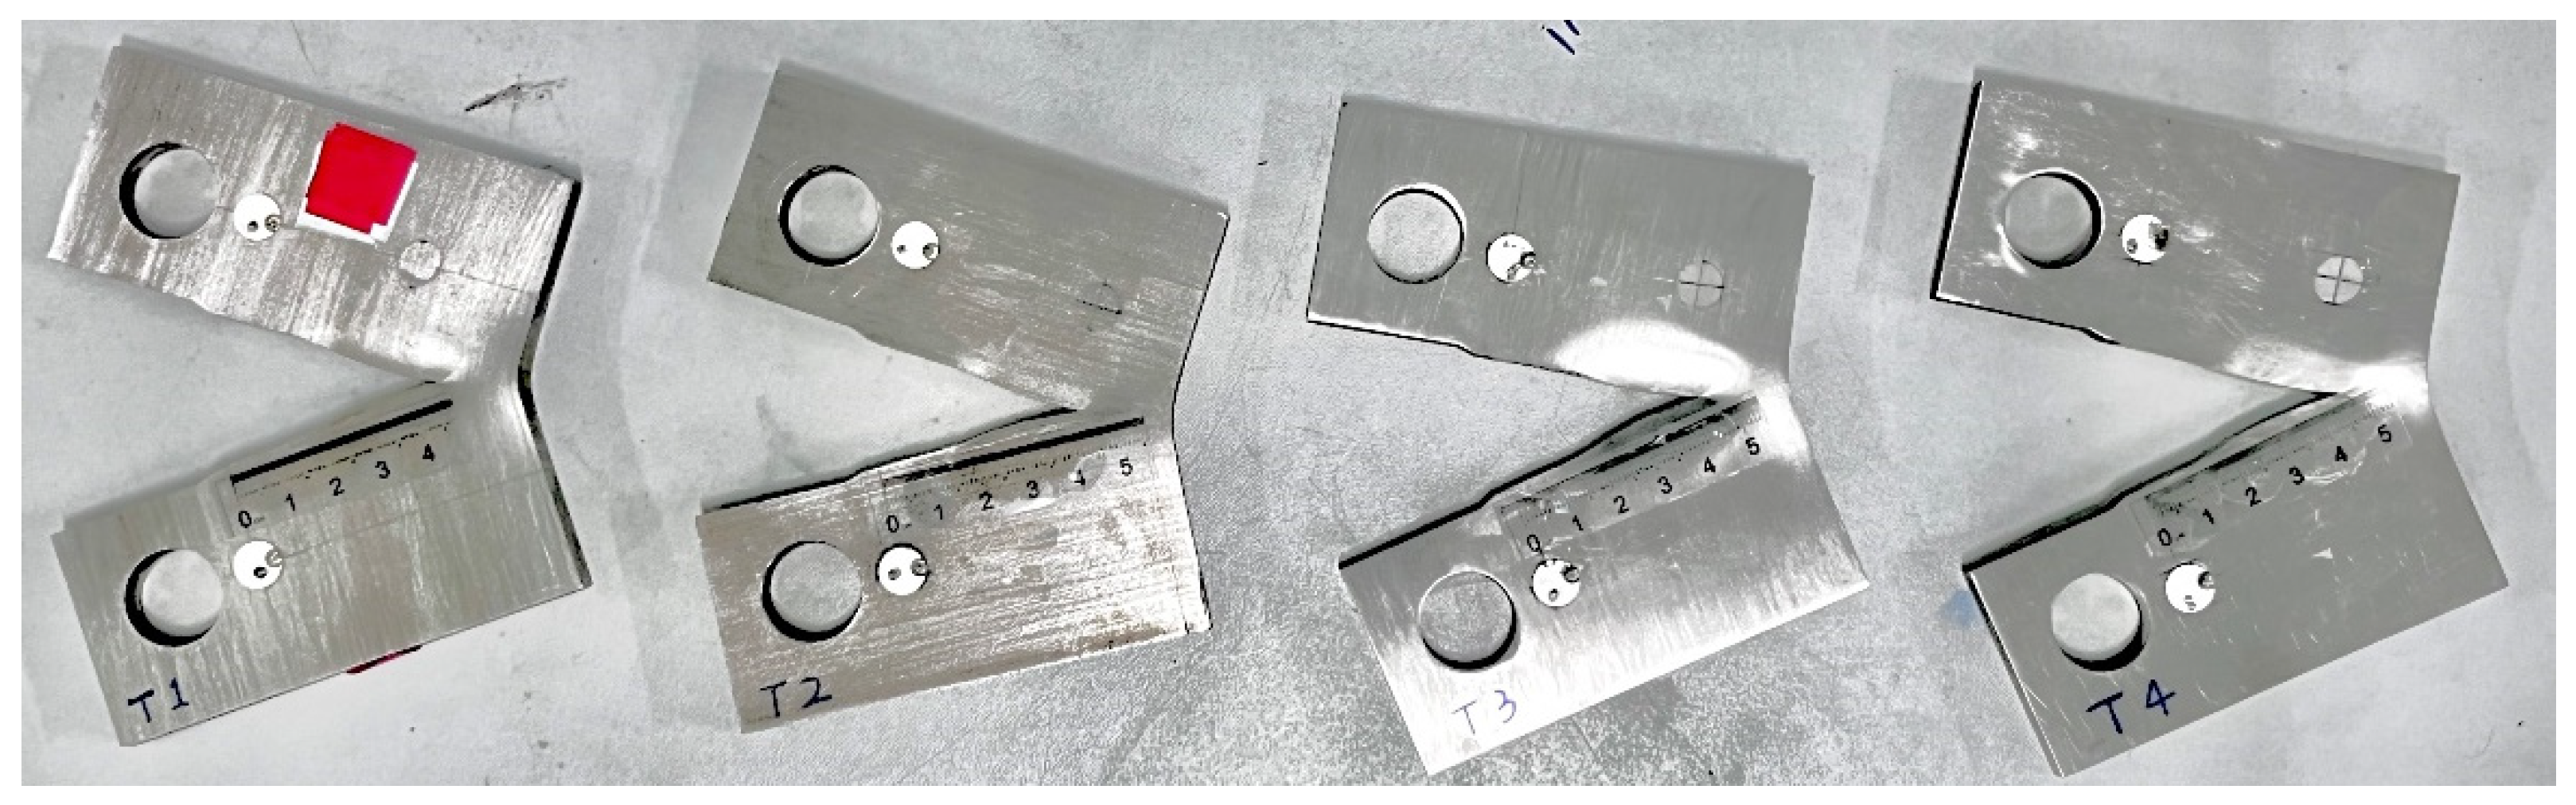
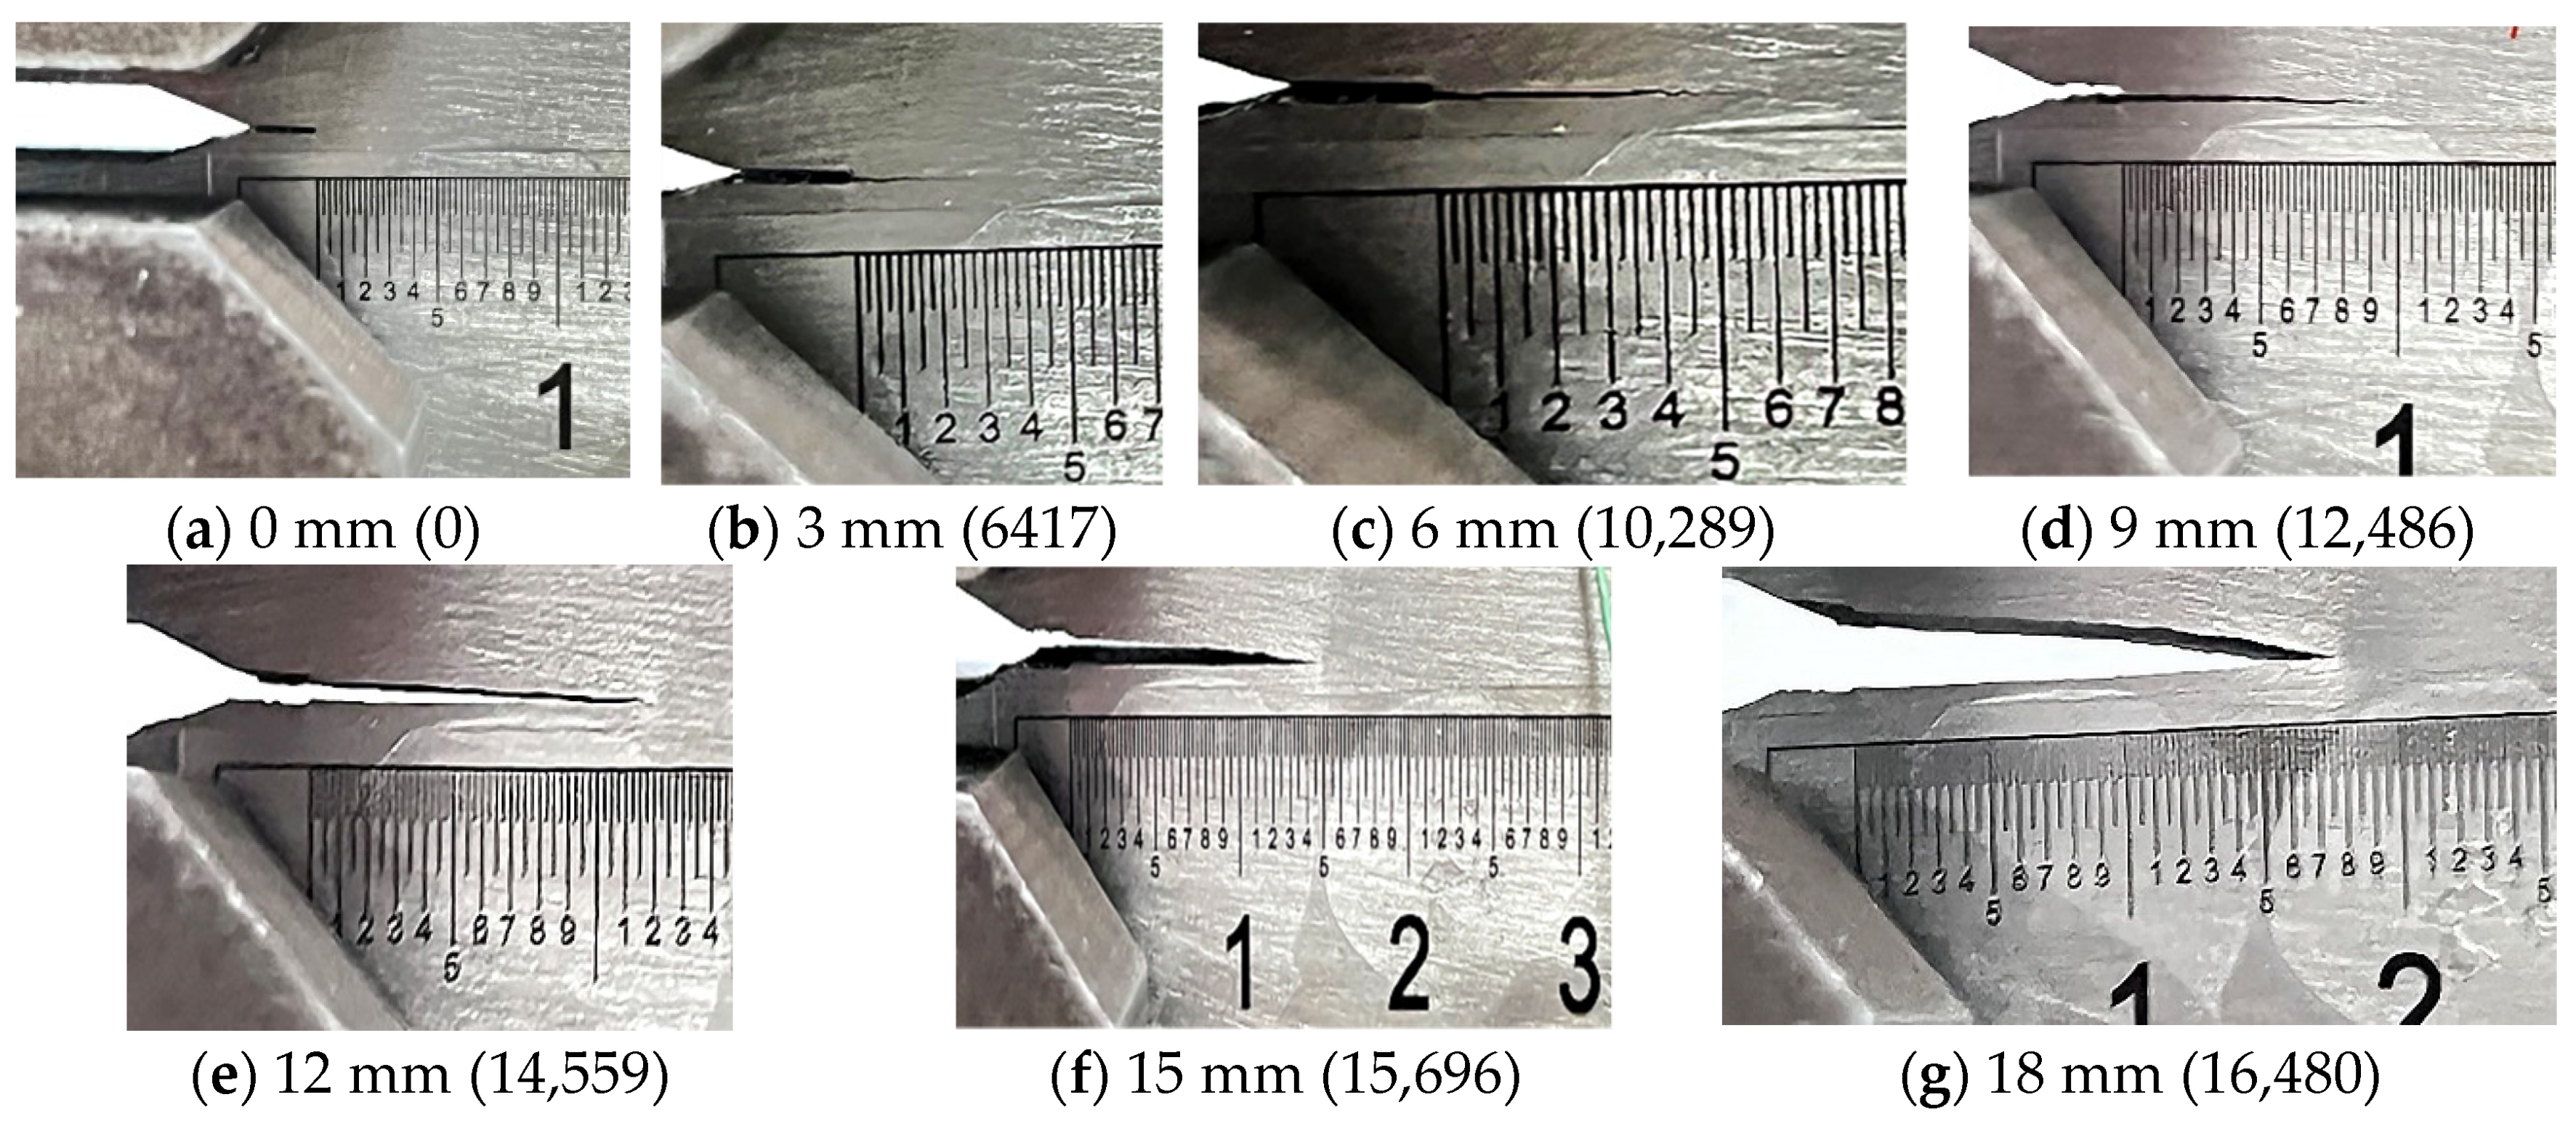
3.1. Fatigue Crack Propagation Experiment
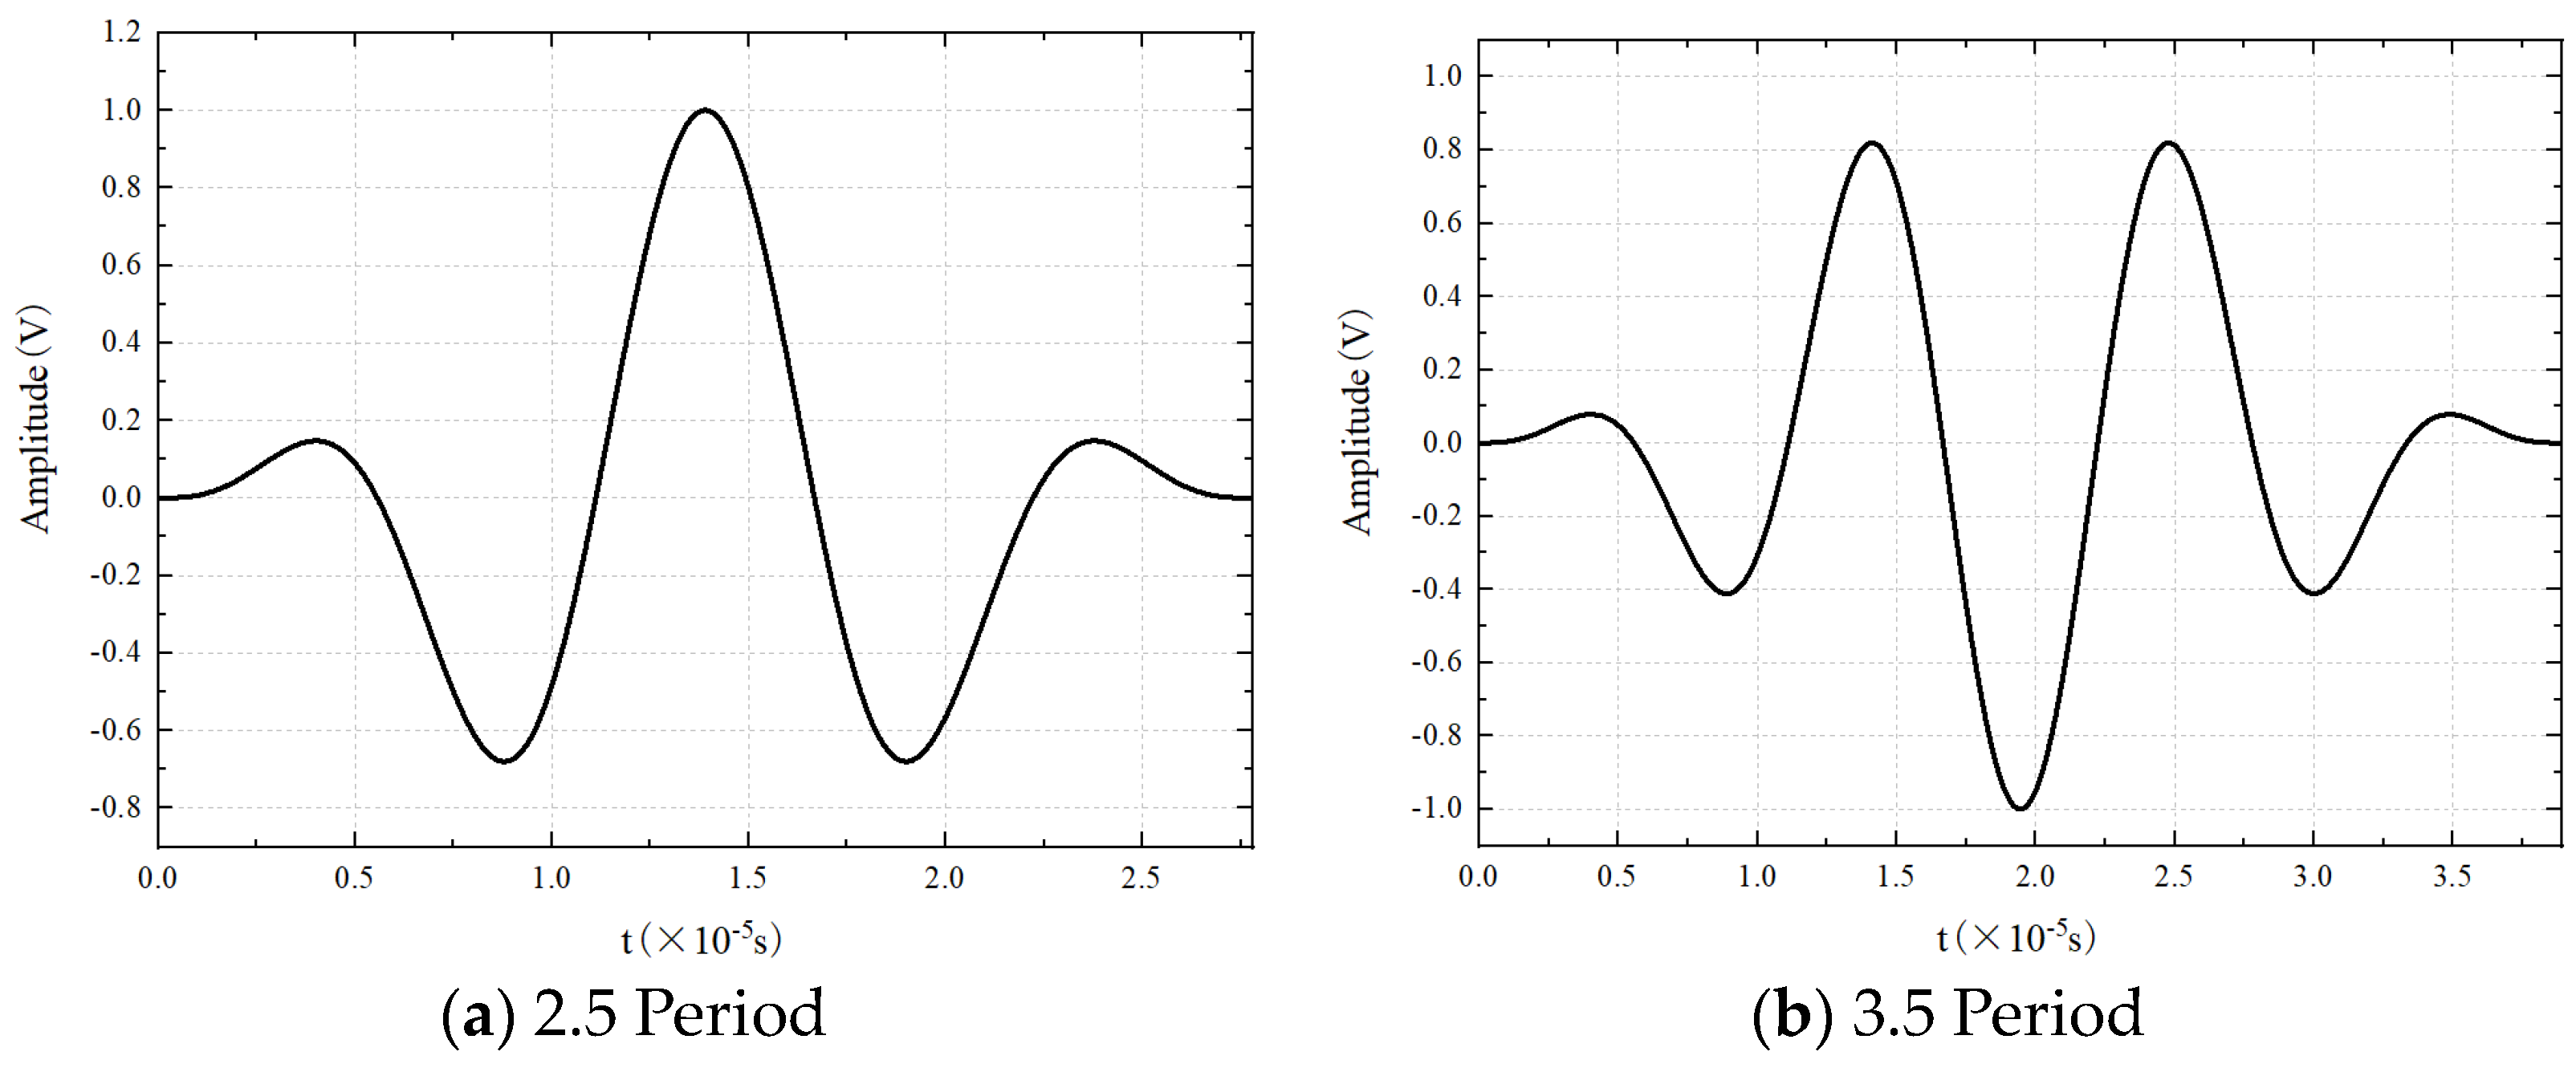
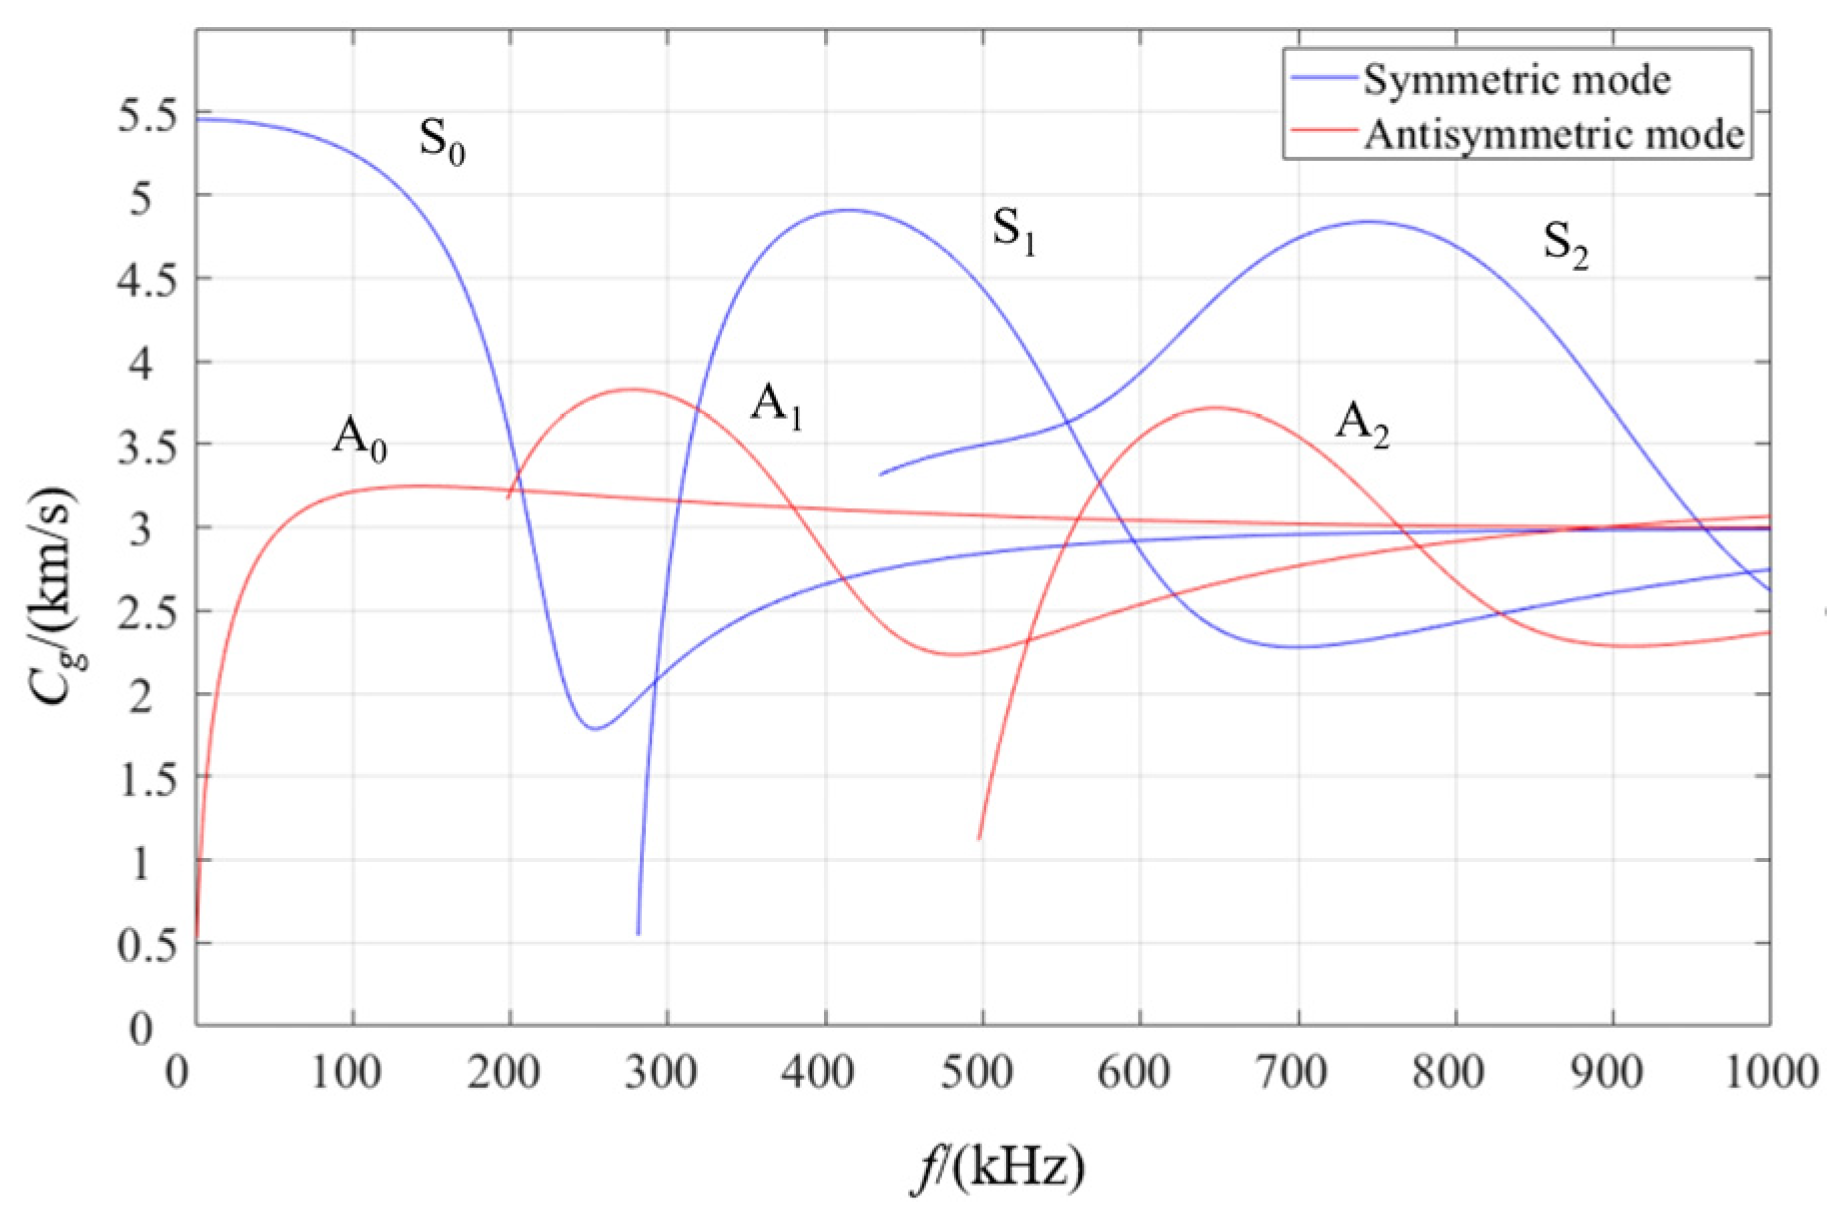
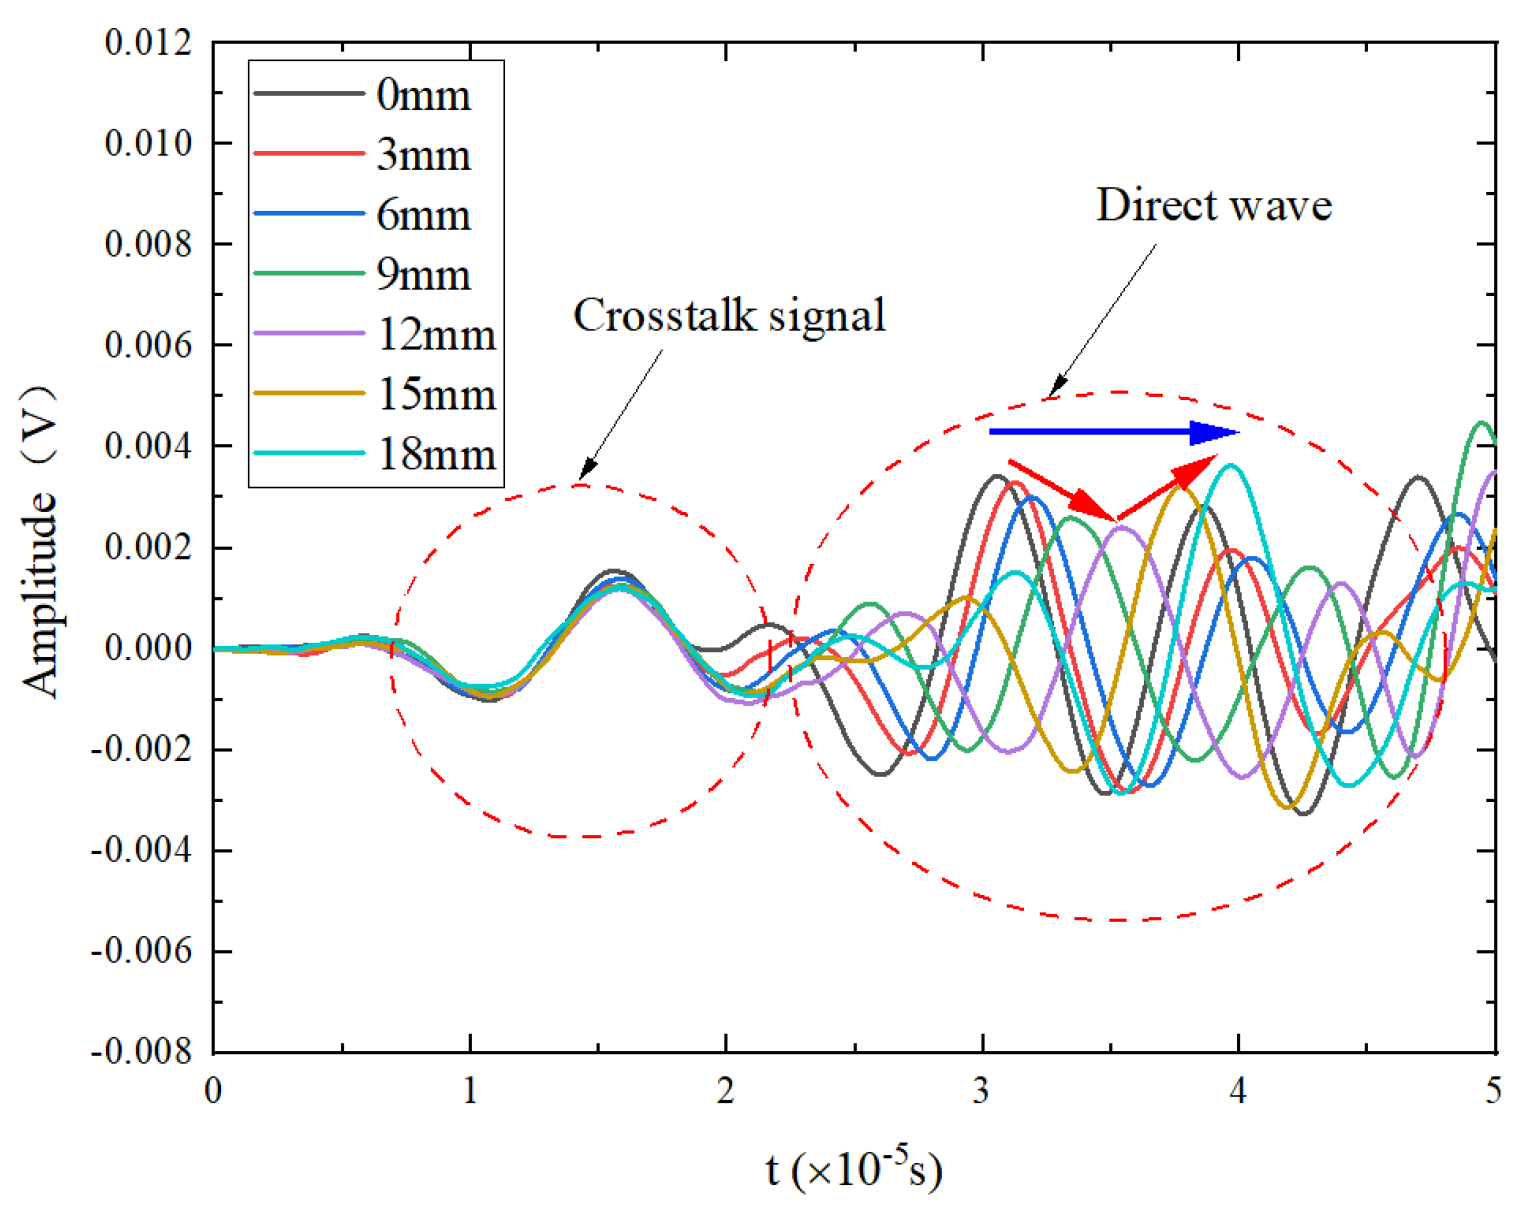
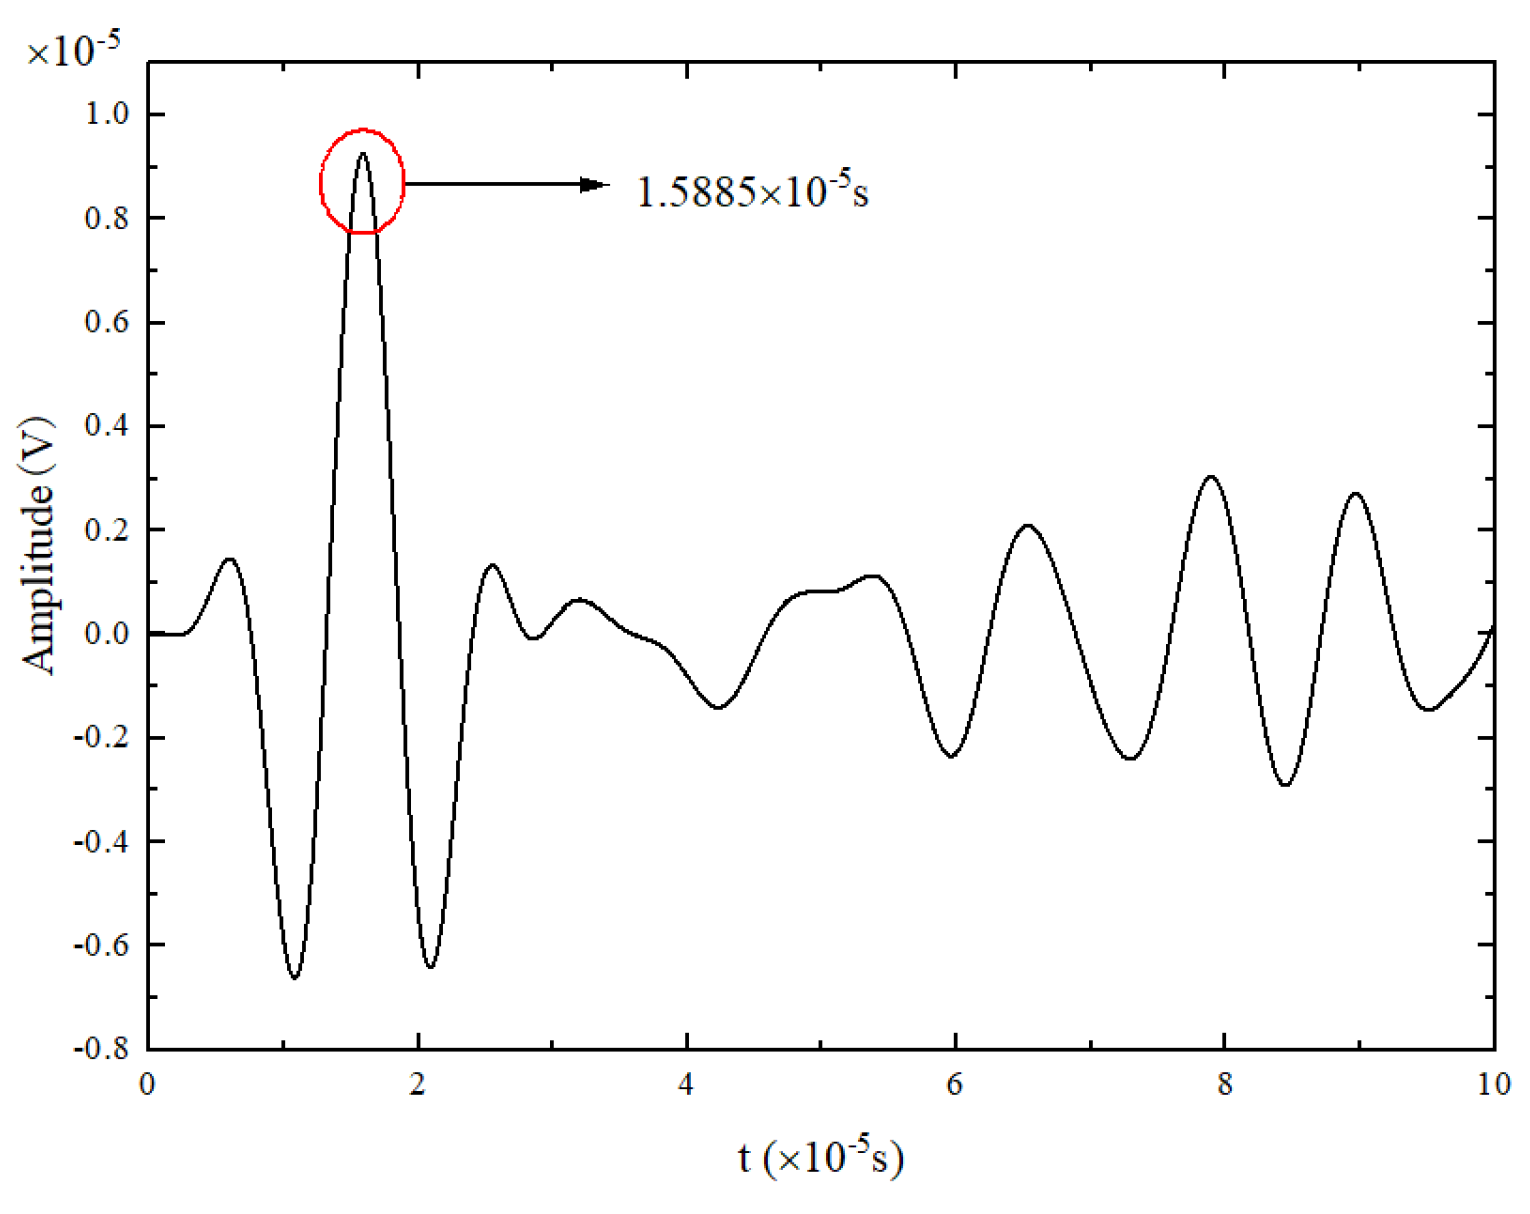
3.2. Excitation Signal
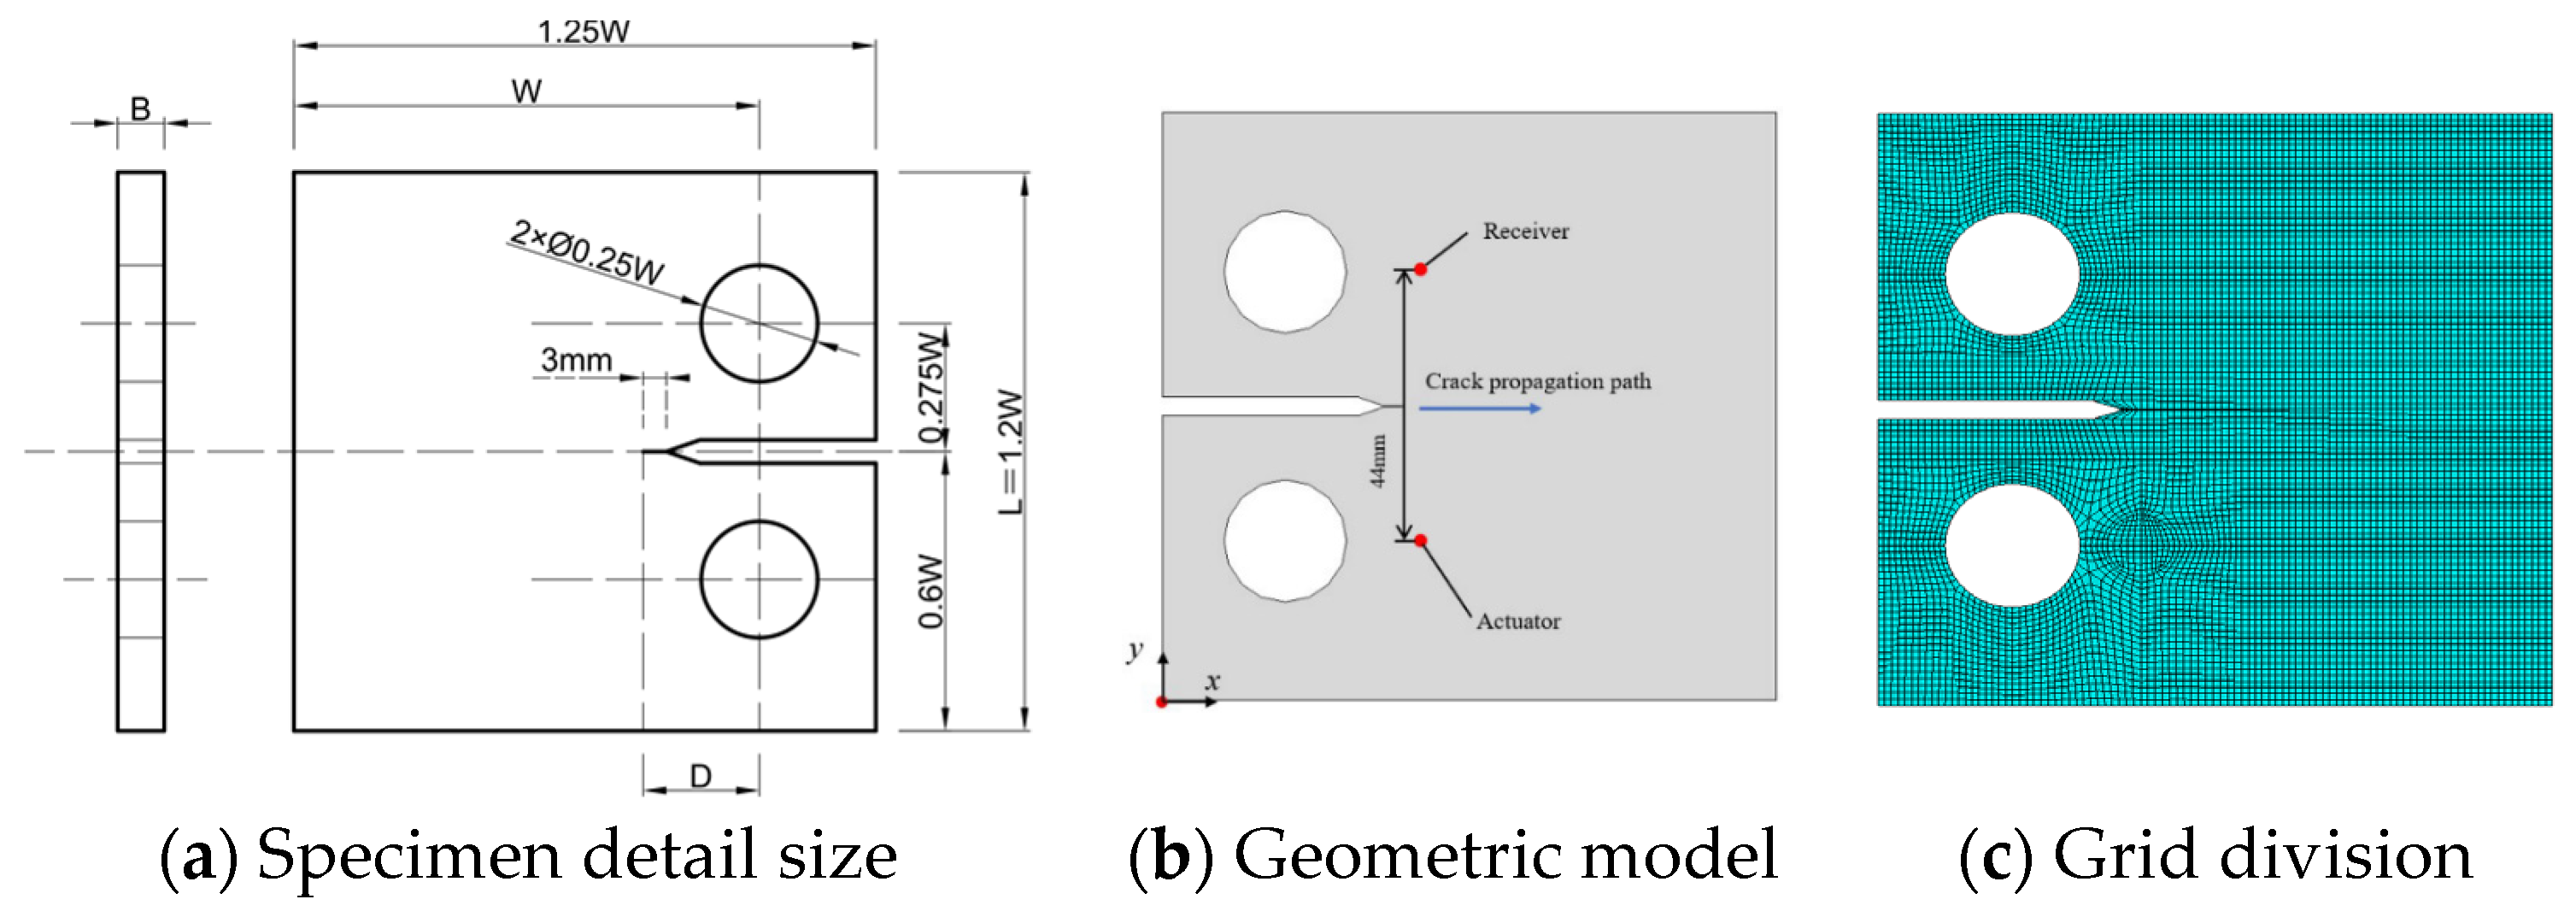
3.3. Crack Extension Model for the CT Specimen
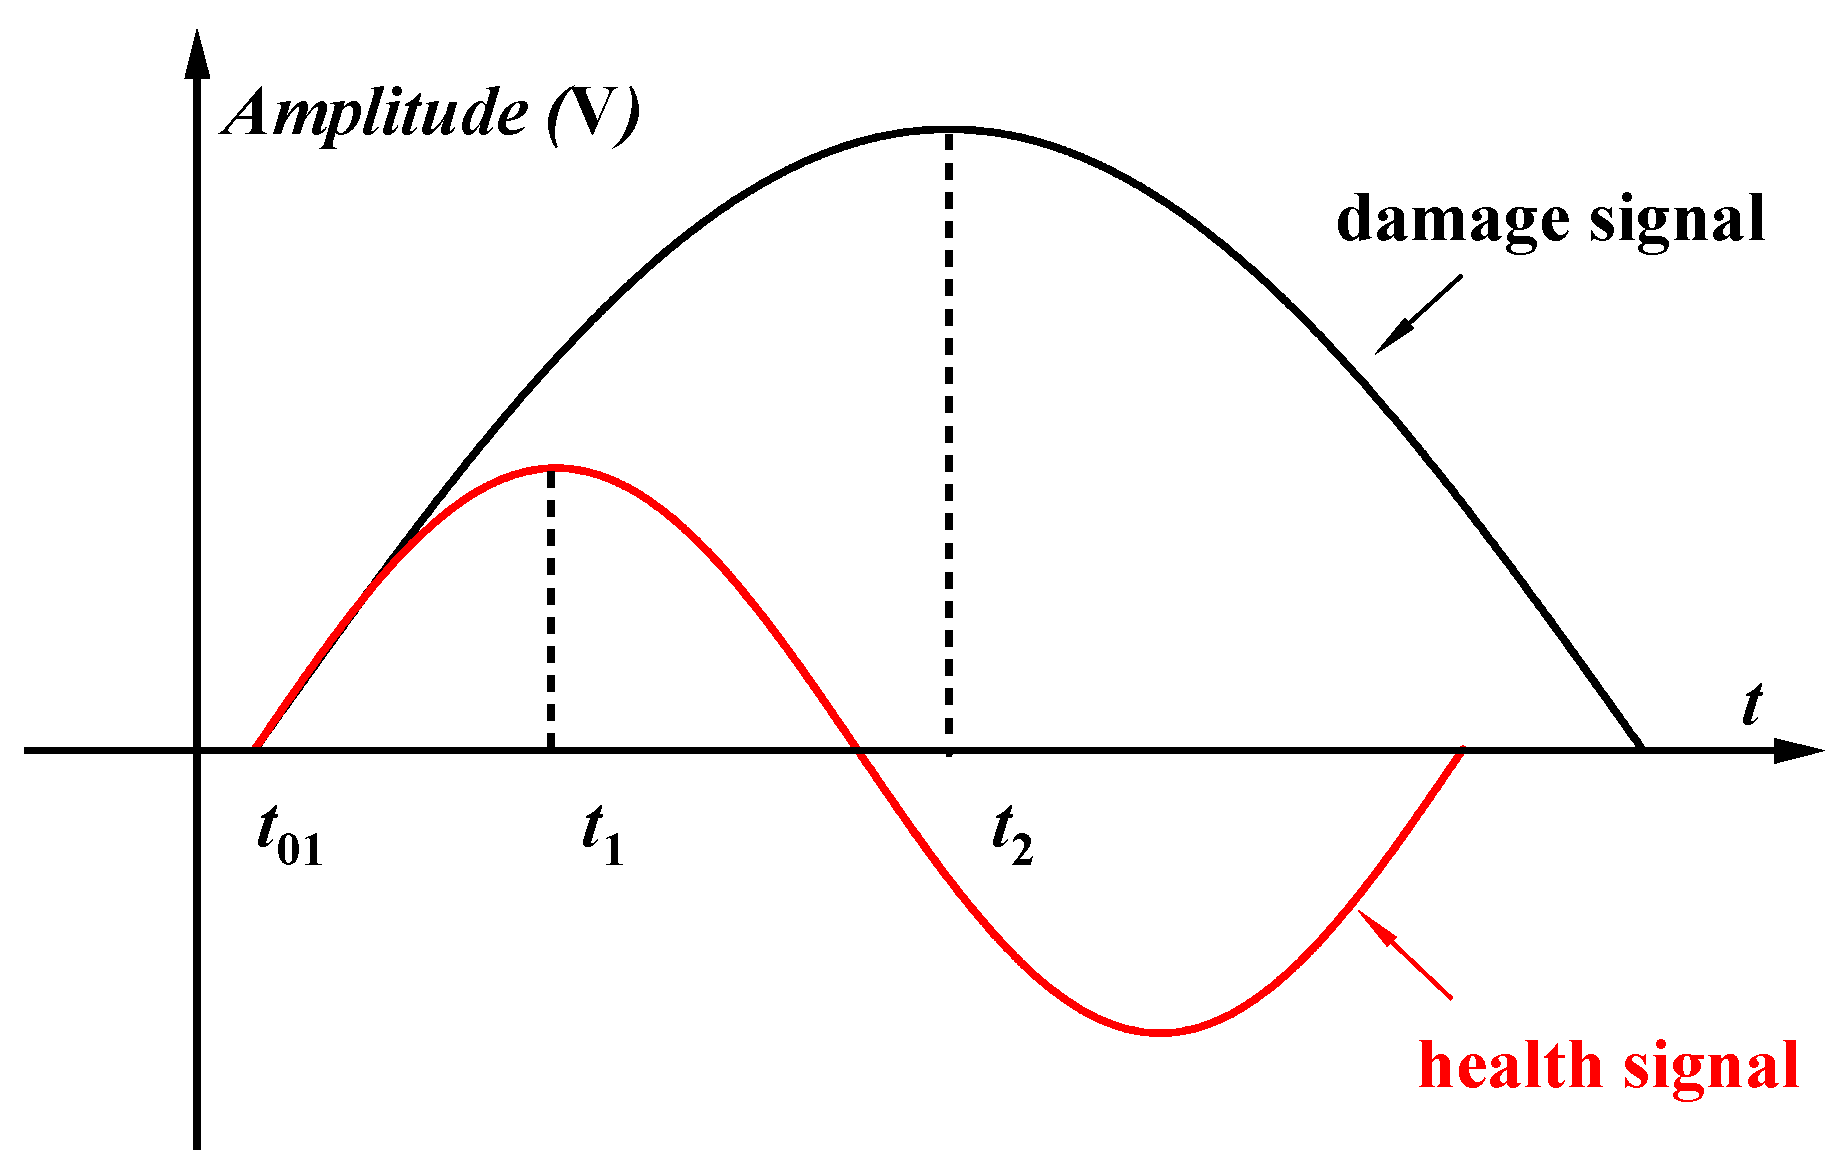
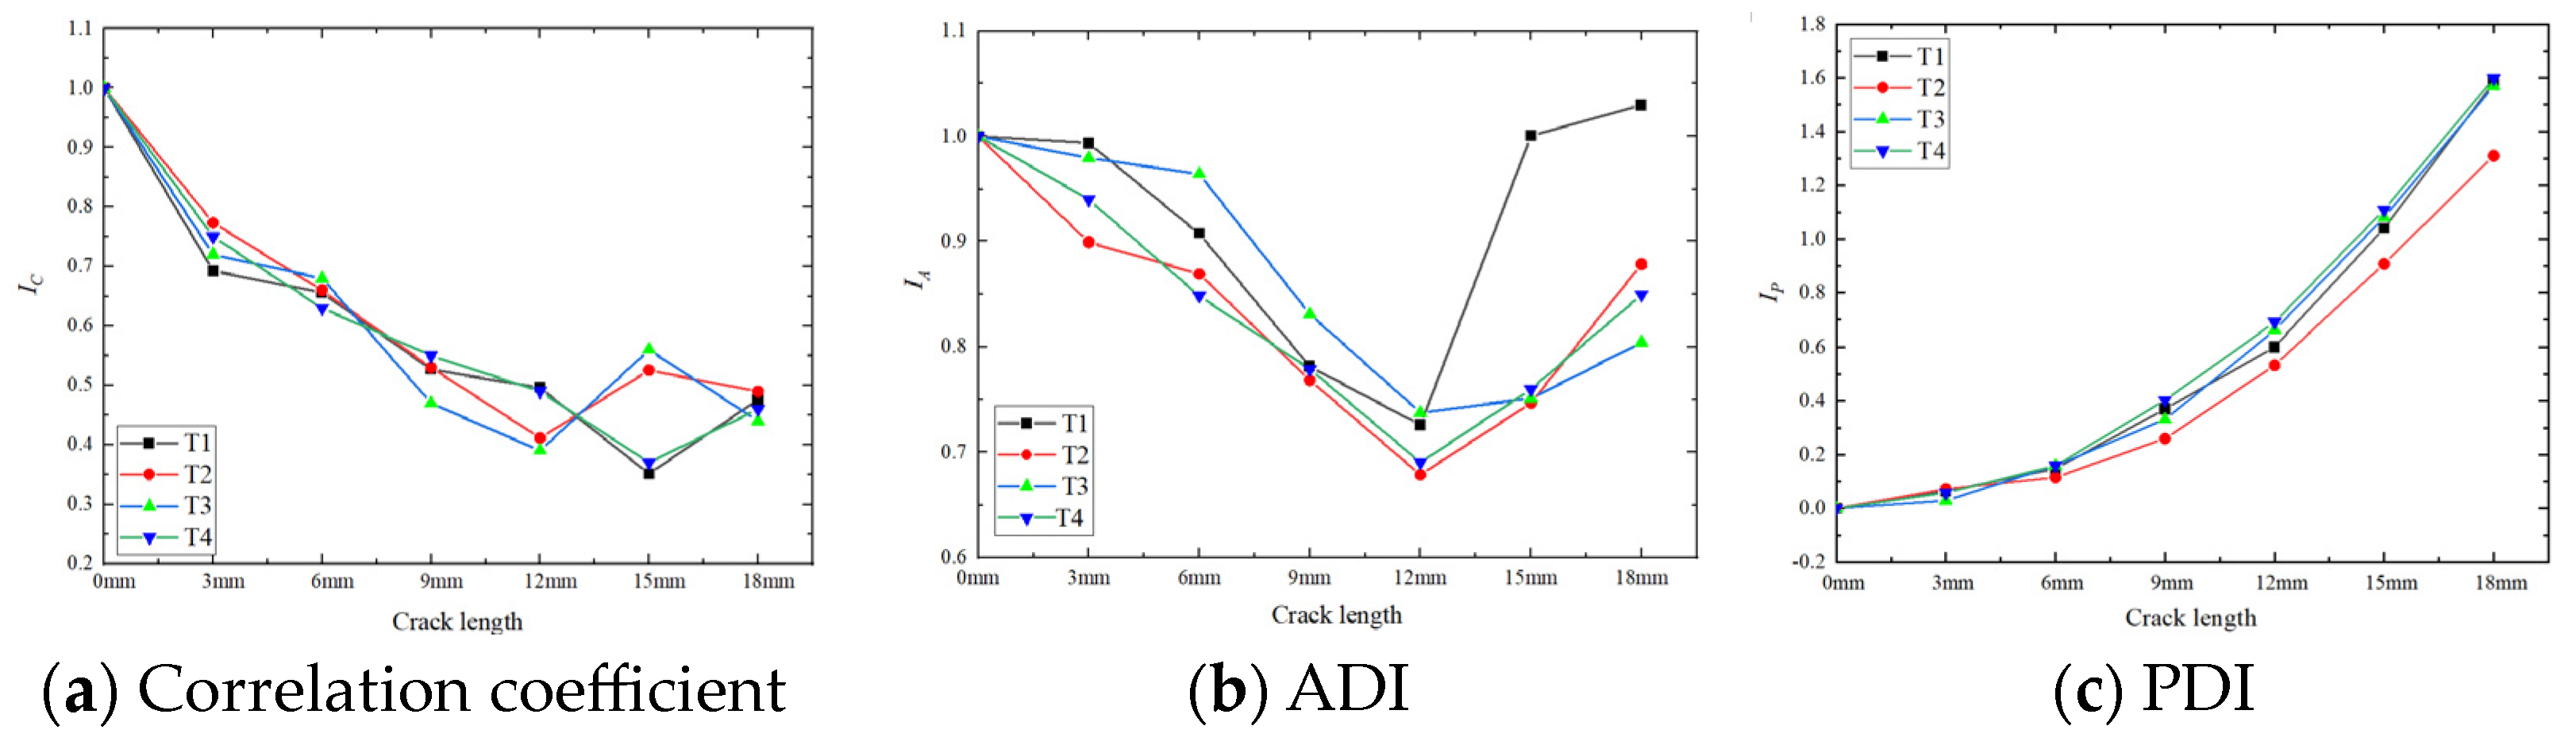
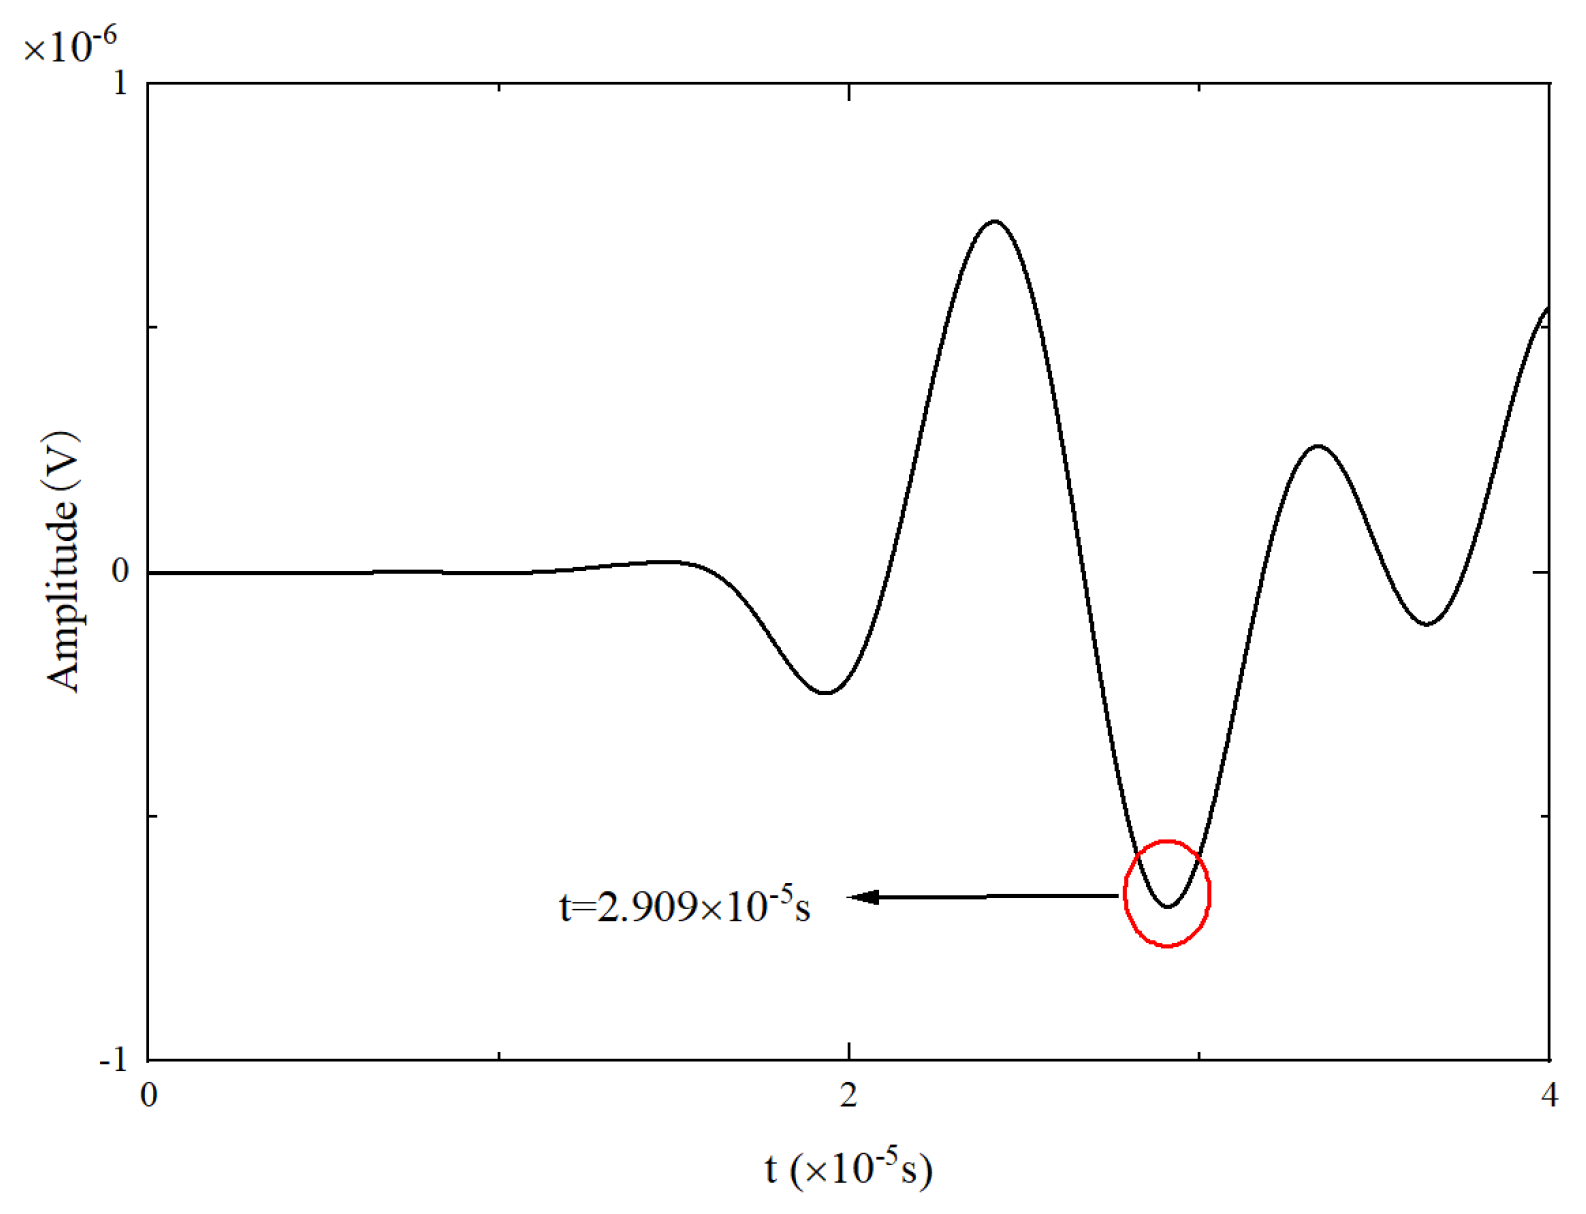
3.4. Lamb Wave Signal Damage Index
3.5. Analysis of the Causes of Trends in the Damage Index
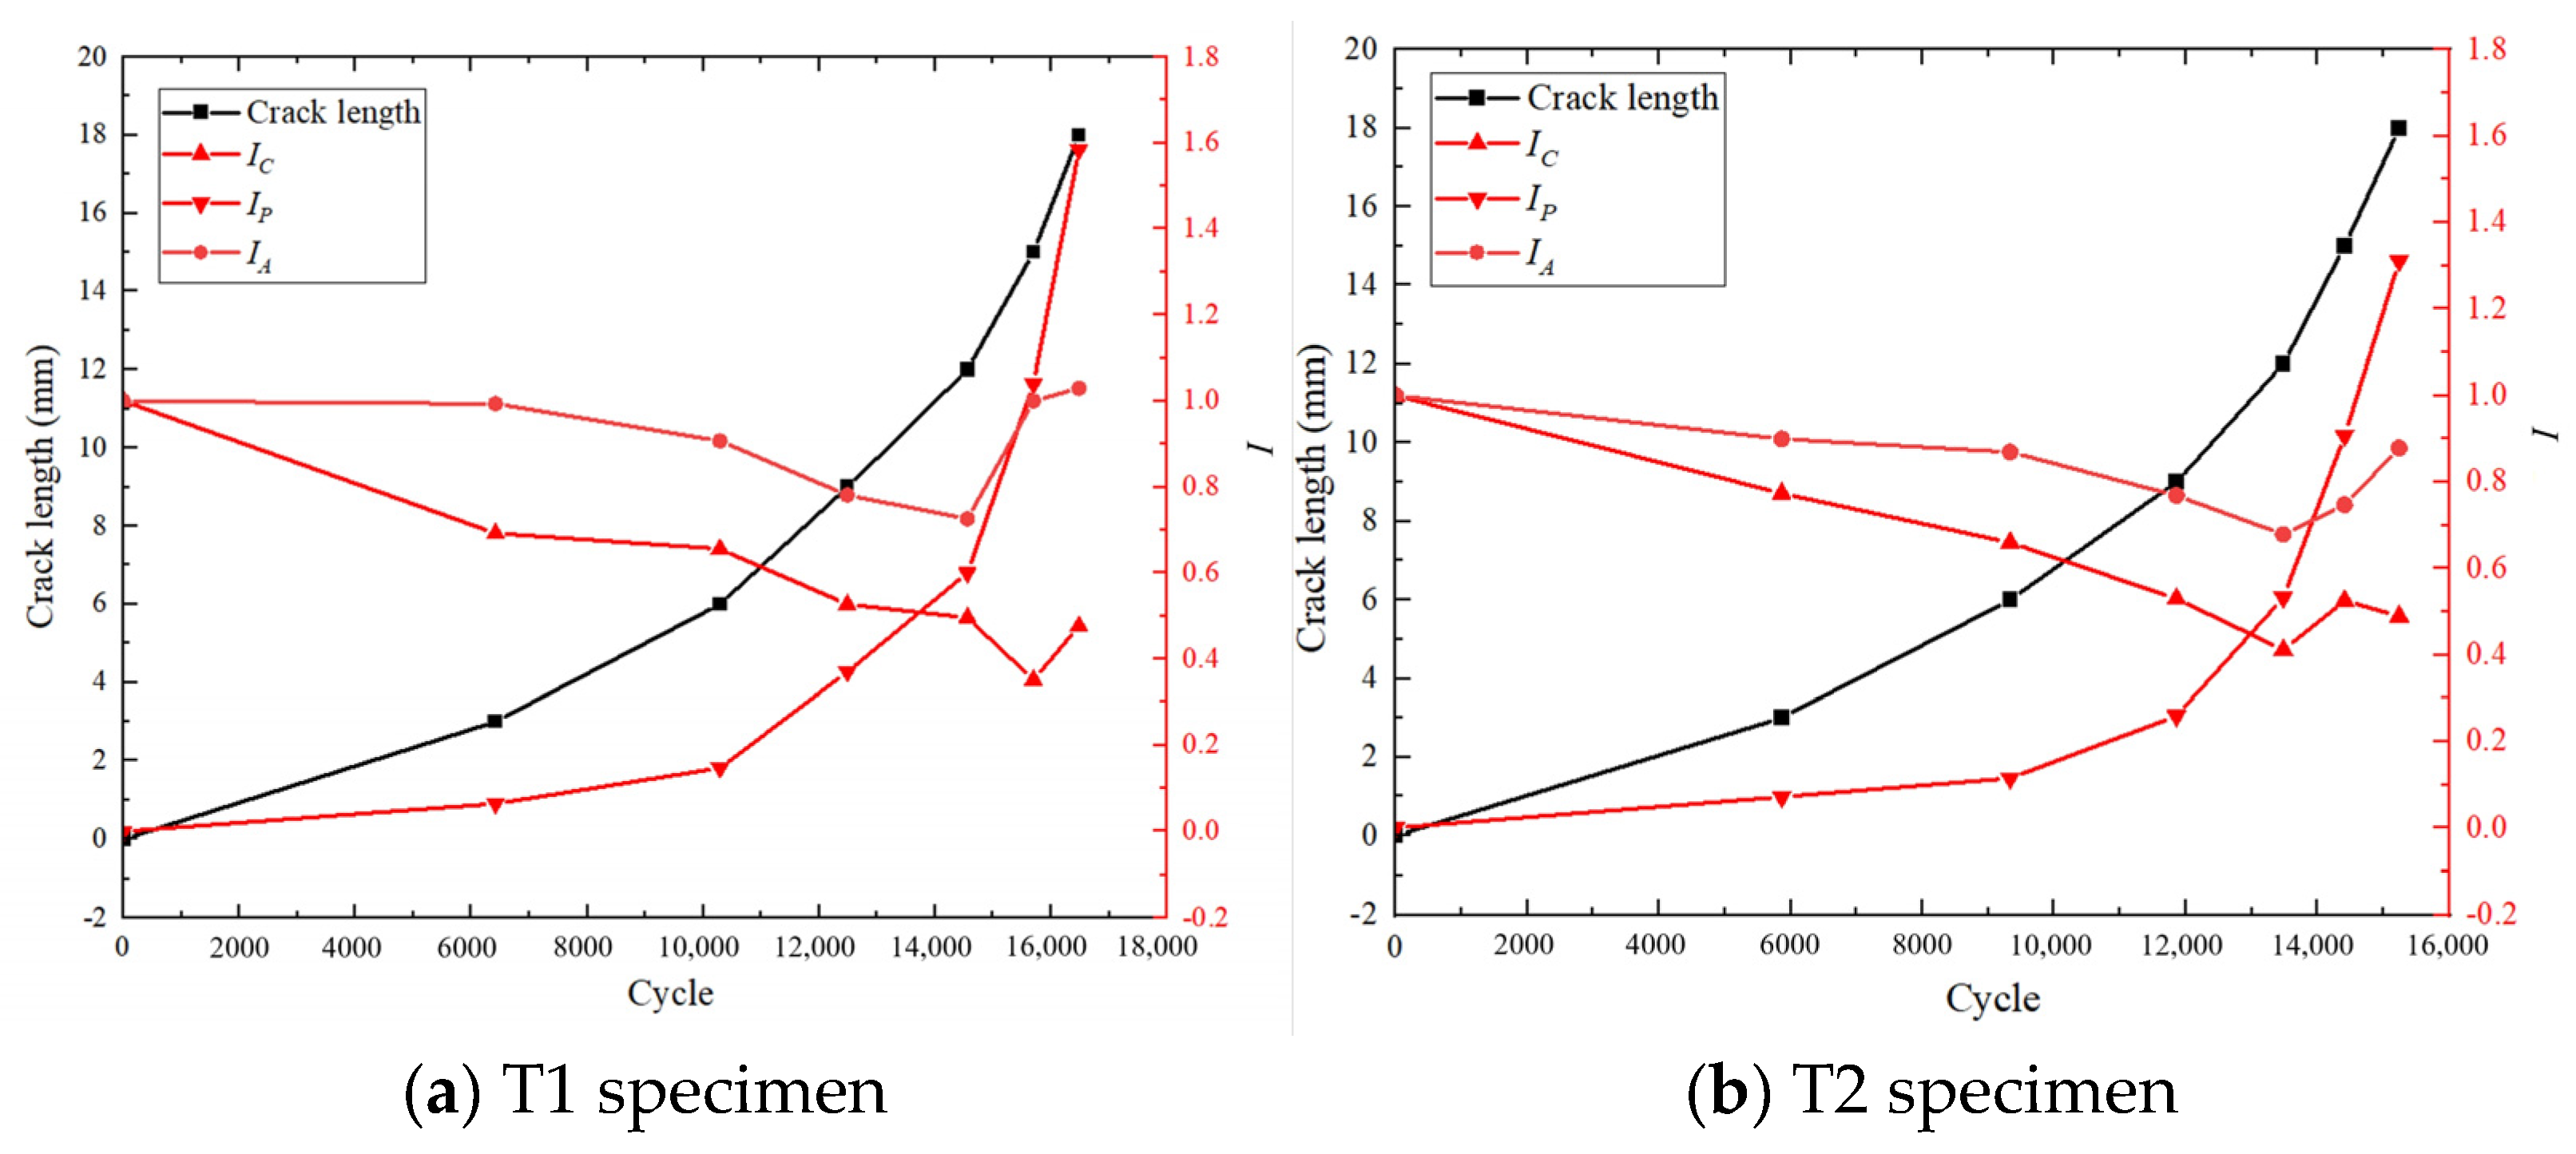
3.6. Trends of Each Index and (a-N) Crack Propagation
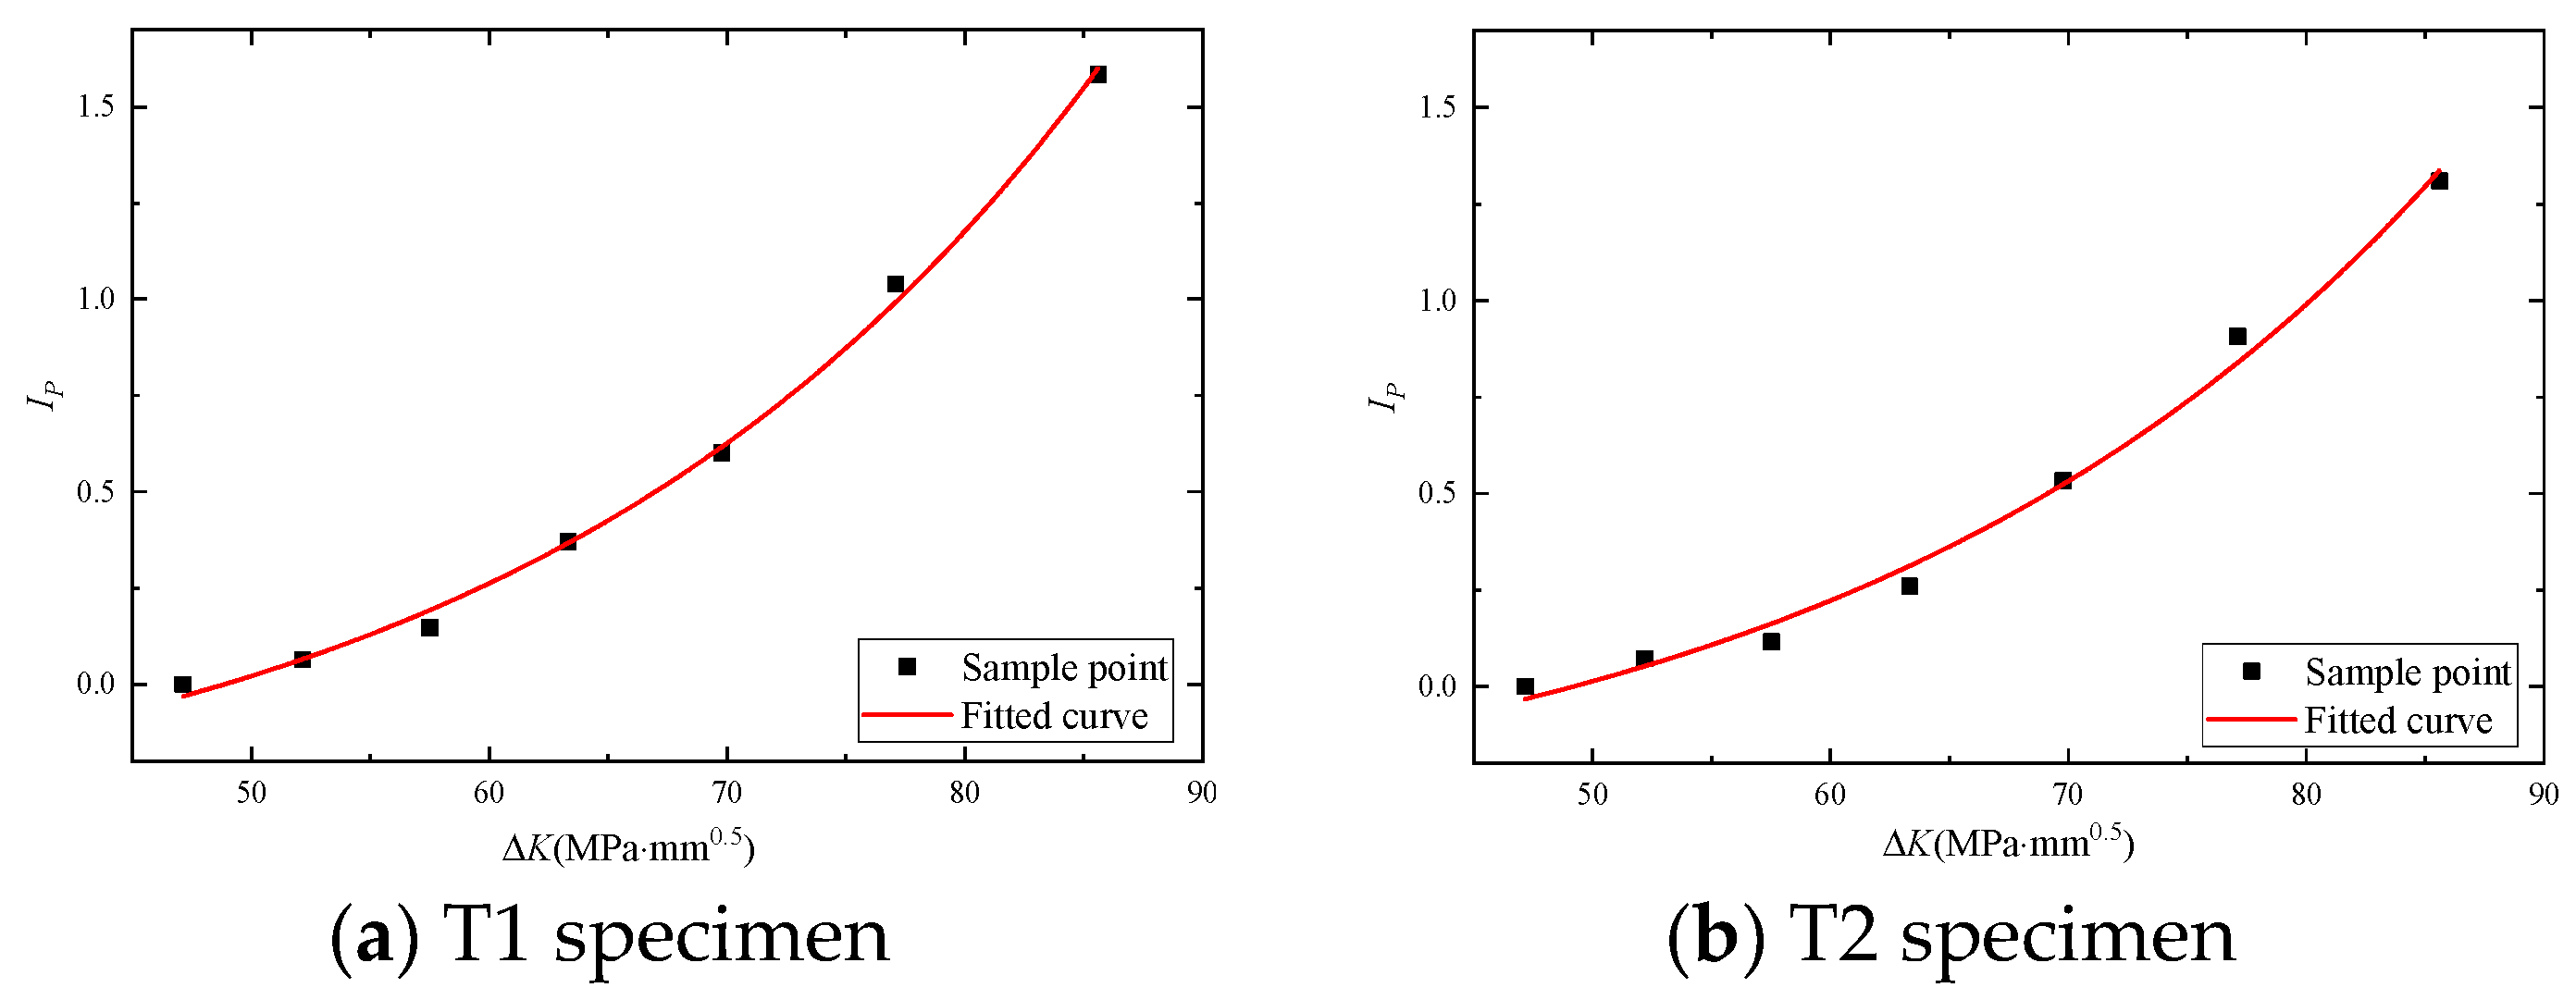
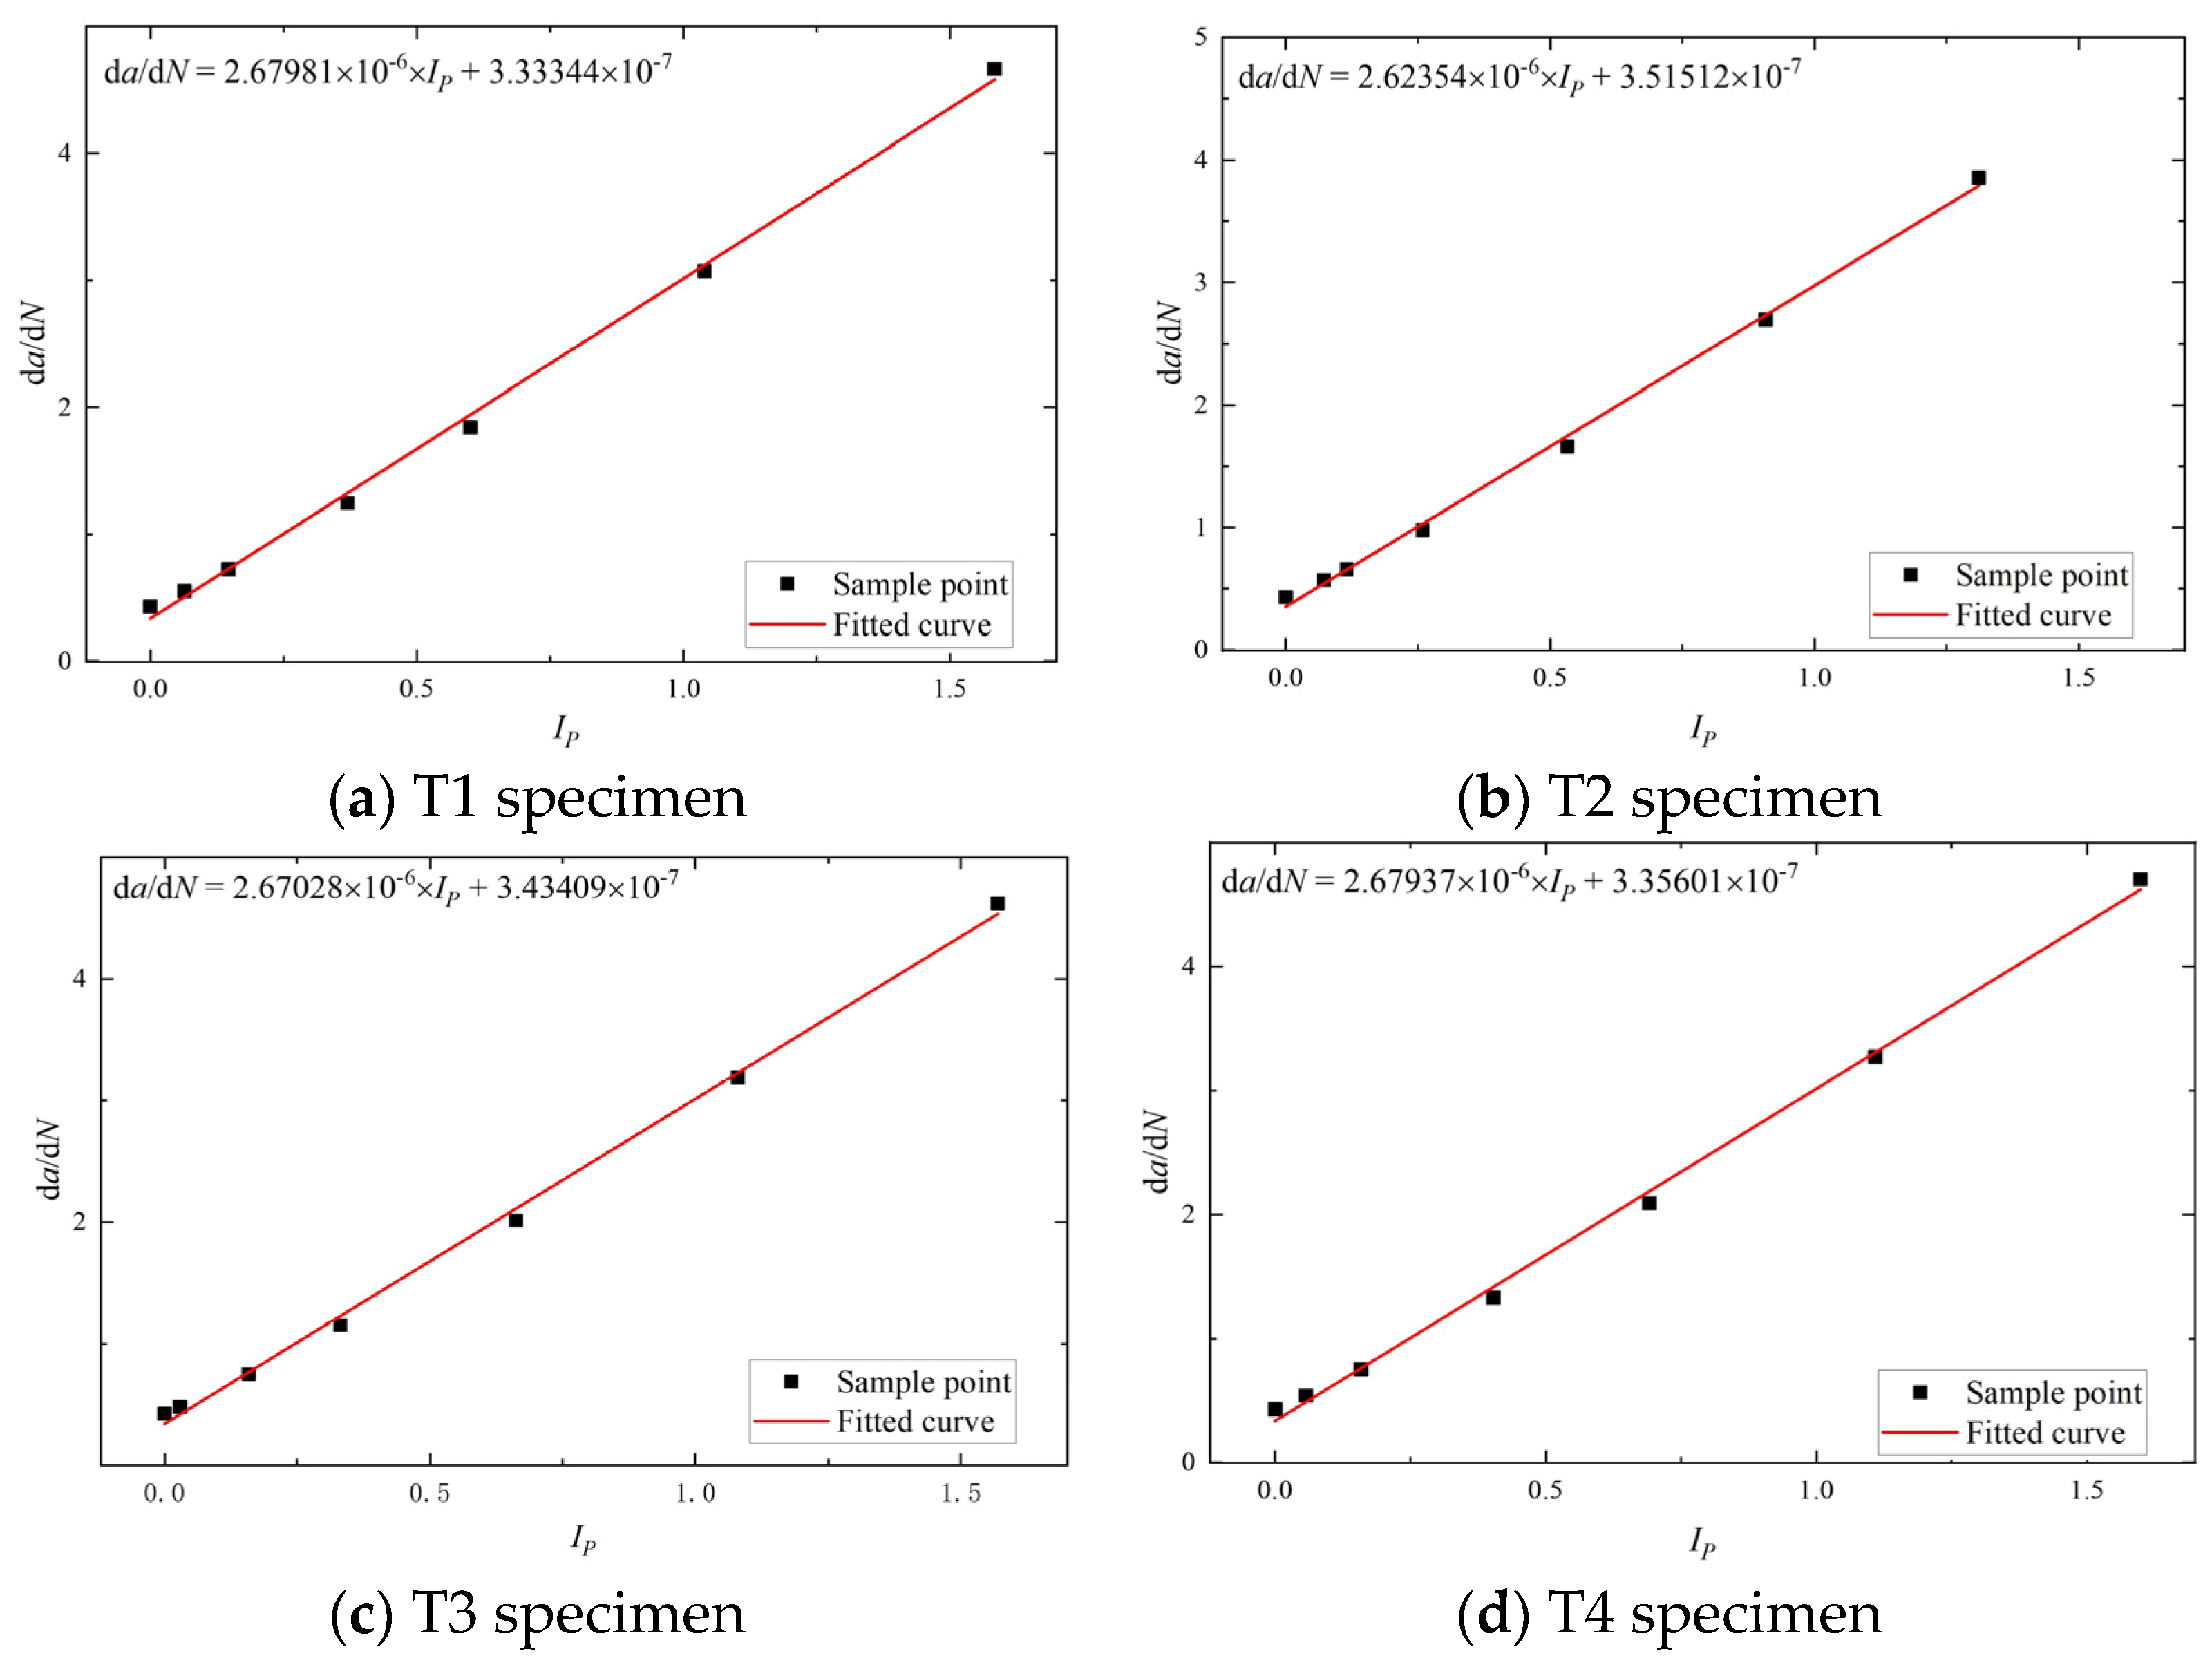
3.7. Monitoring of Crack Extension Rates by Phase Damage Indices
4. Finite Element Analysis
4.1. Model and Preprocessing
4.2. Mesh Size Calculation
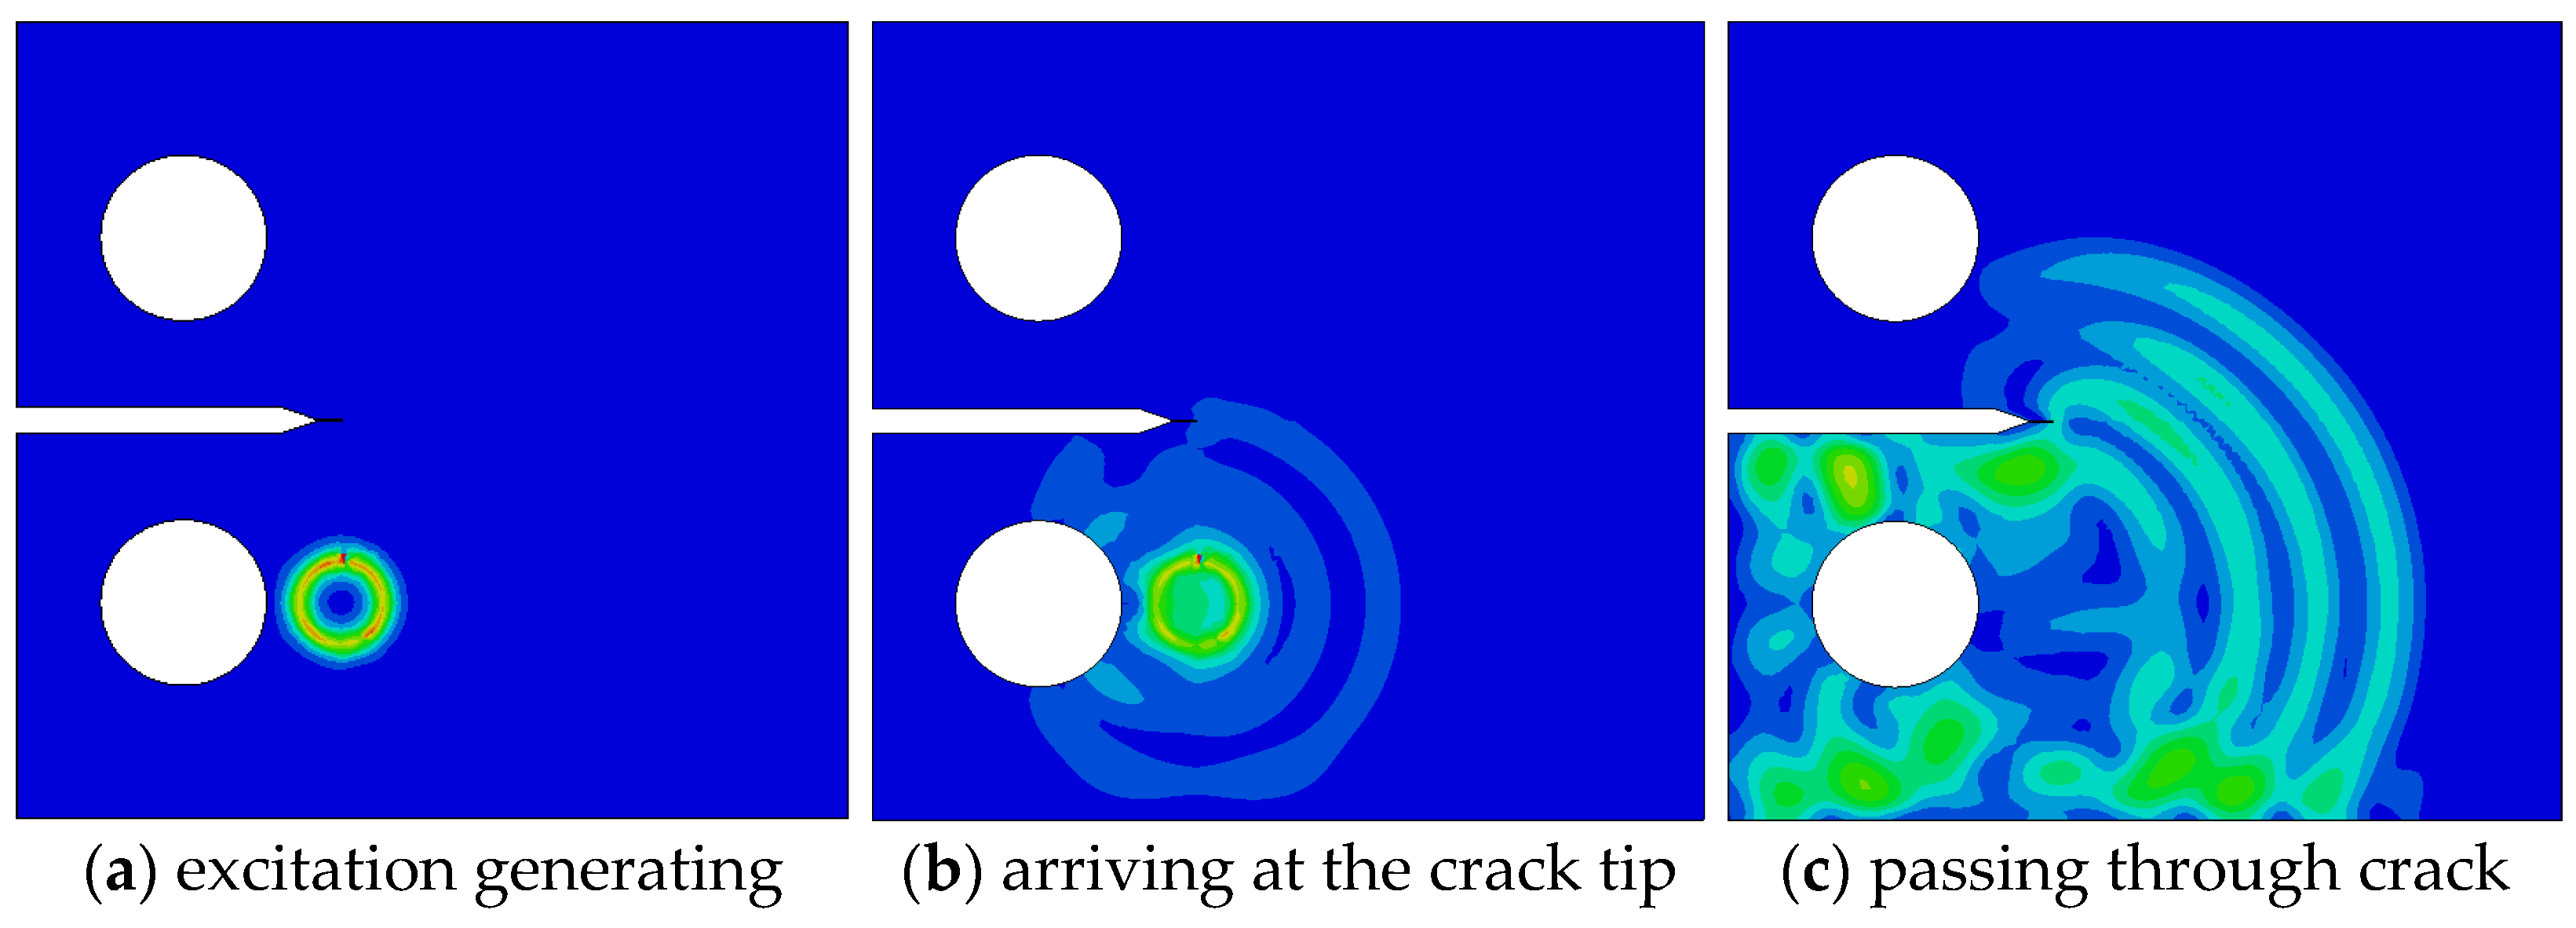
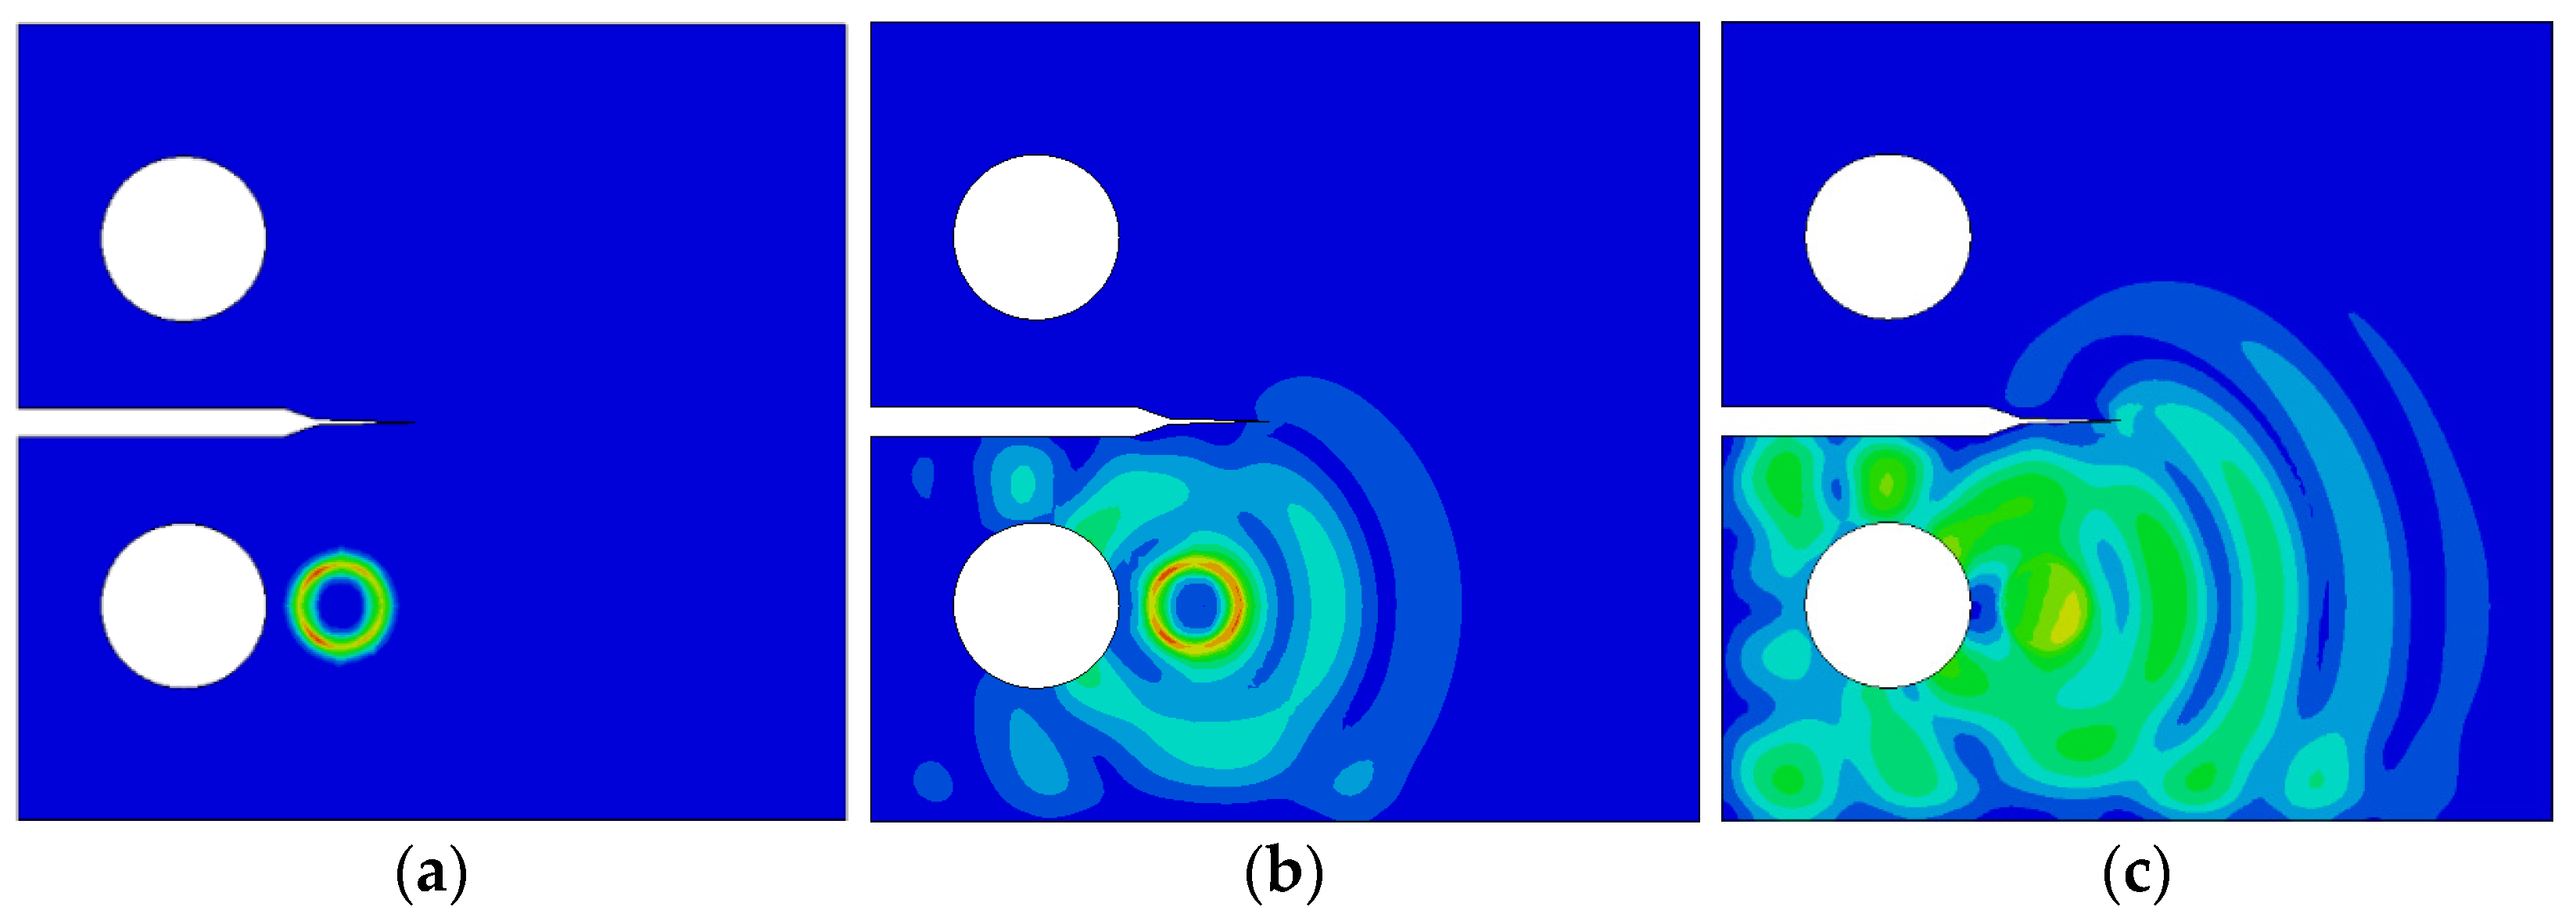
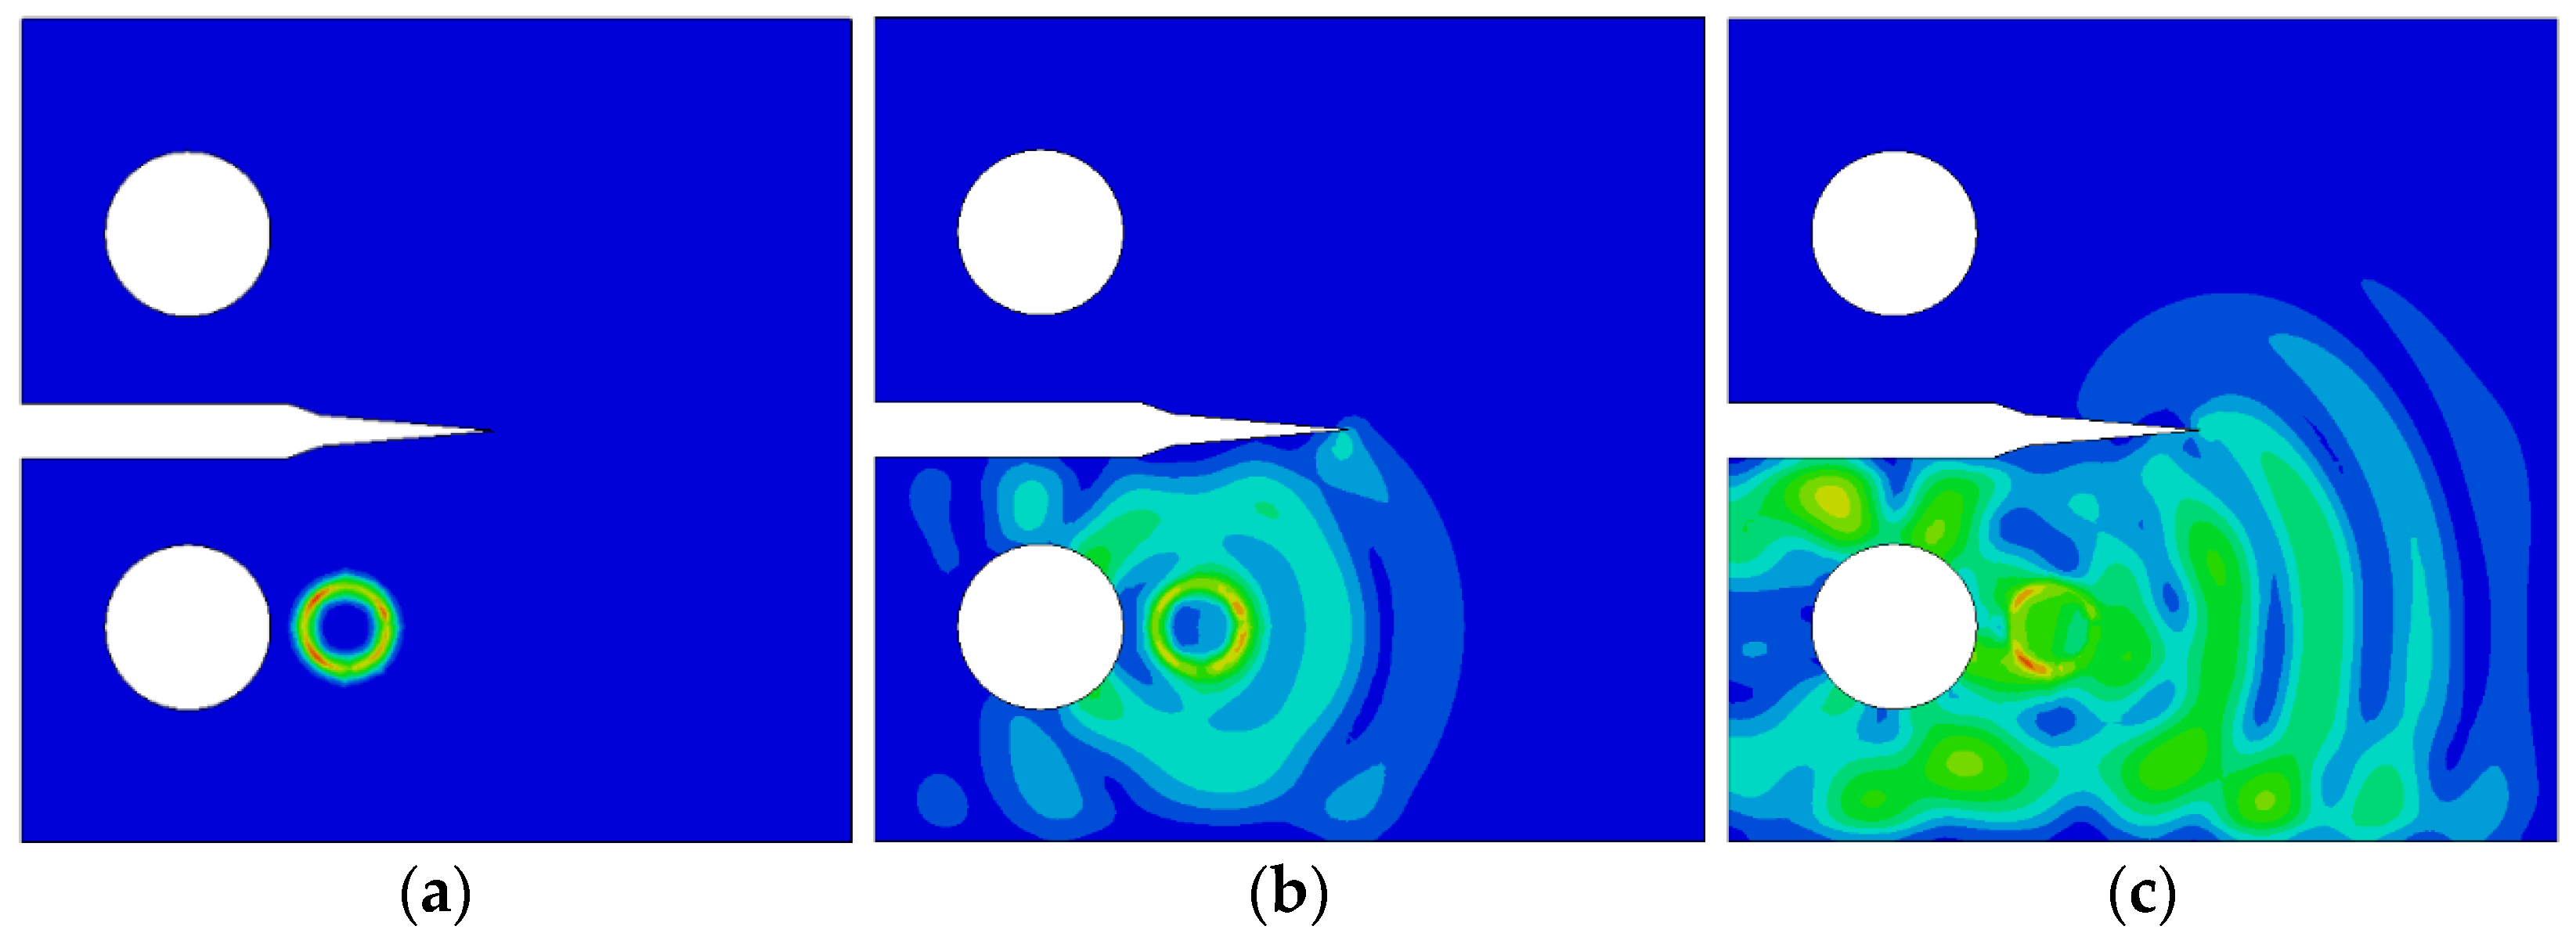
4.3. Analysis of Lamb Wave Propagation Process
4.4. Change in the Damage Index of Lamb Waves
5. Conclusions
- (1)
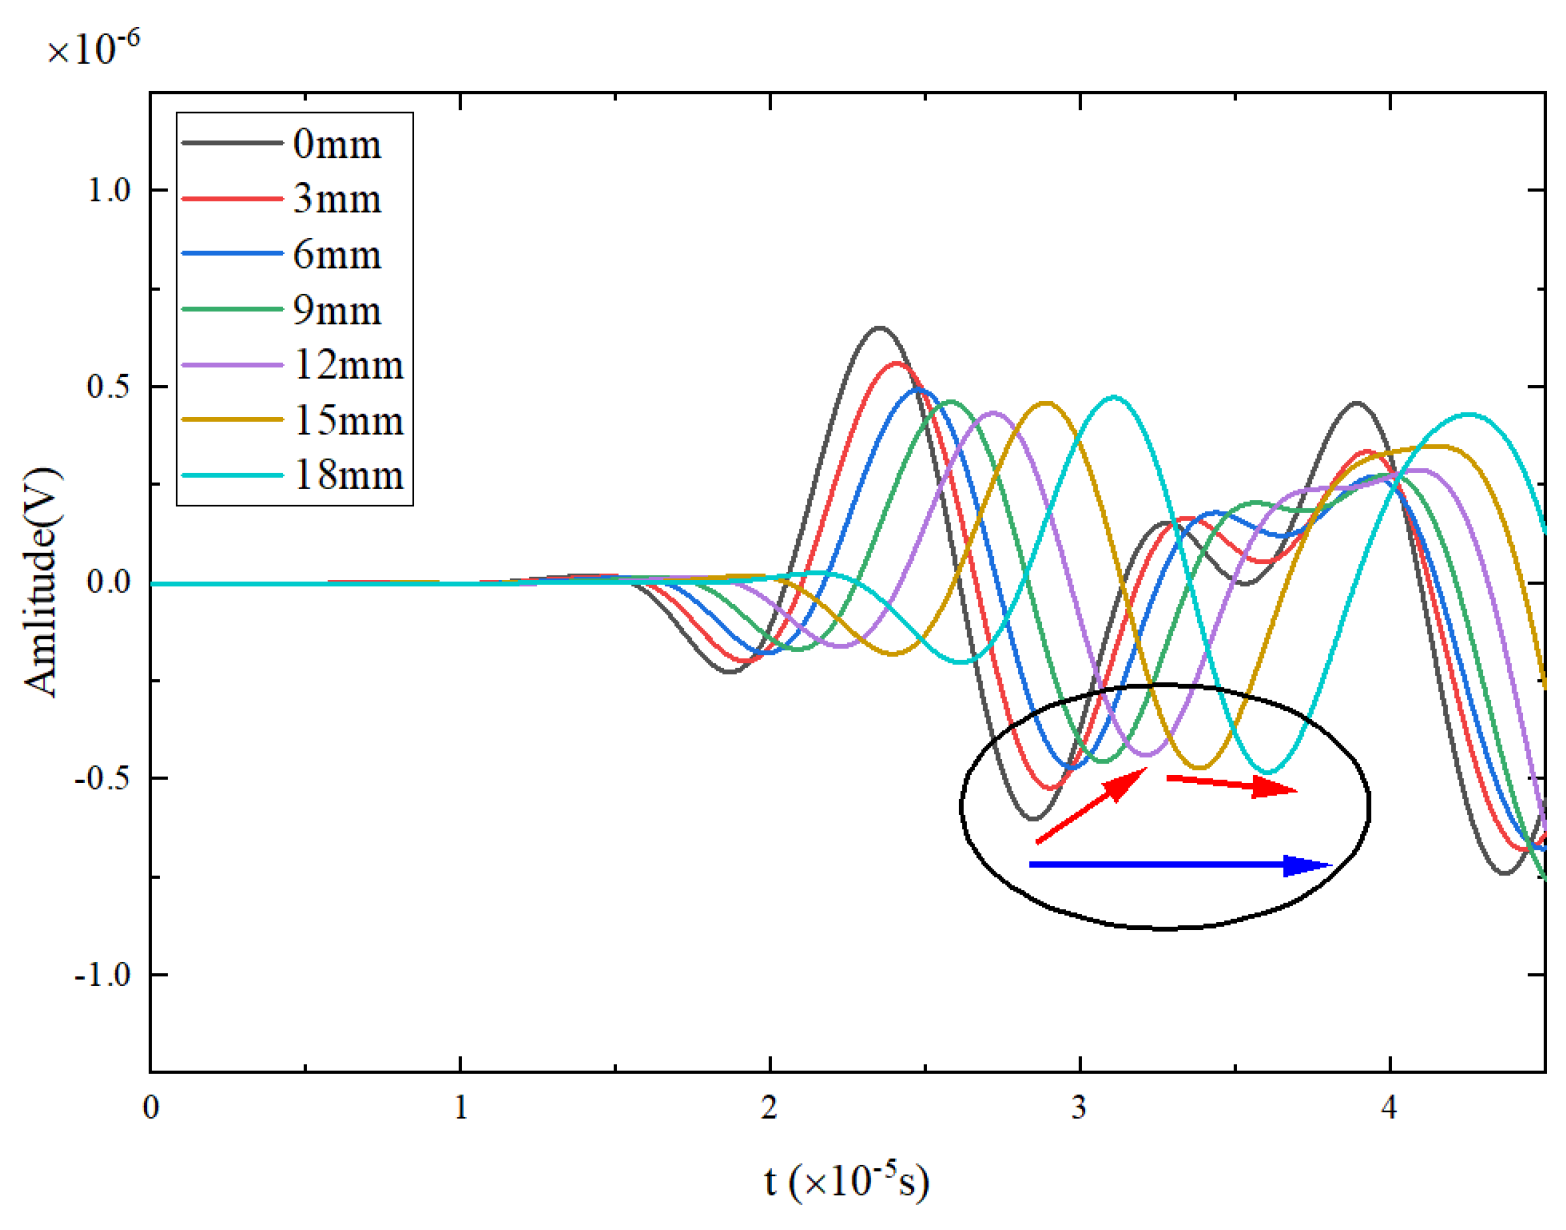
- The variation in the damage index is highly correlated with changes in the crack. When the crack width and angle are small, Lamb waves predominantly propagate at the crack tip through transmission and reflection. As the crack enlarges, Lamb waves mainly propagate through reflections at the crack tip. The propagation form at the crack tip changes by approximately 12 mm.
- (2)
- (2) The numerical simulations employed simplifications. Notably, the transition of the model from an intact to a cracked state was not simulated. Instead, models with crack sizes of 0 mm, 3 mm, and 6 mm were directly established based on experimental measurements of the specimen dimensions. Therefore, the numerical simulation results exhibit a linear trend and do not show a particularly sensitive pattern.
- (3)
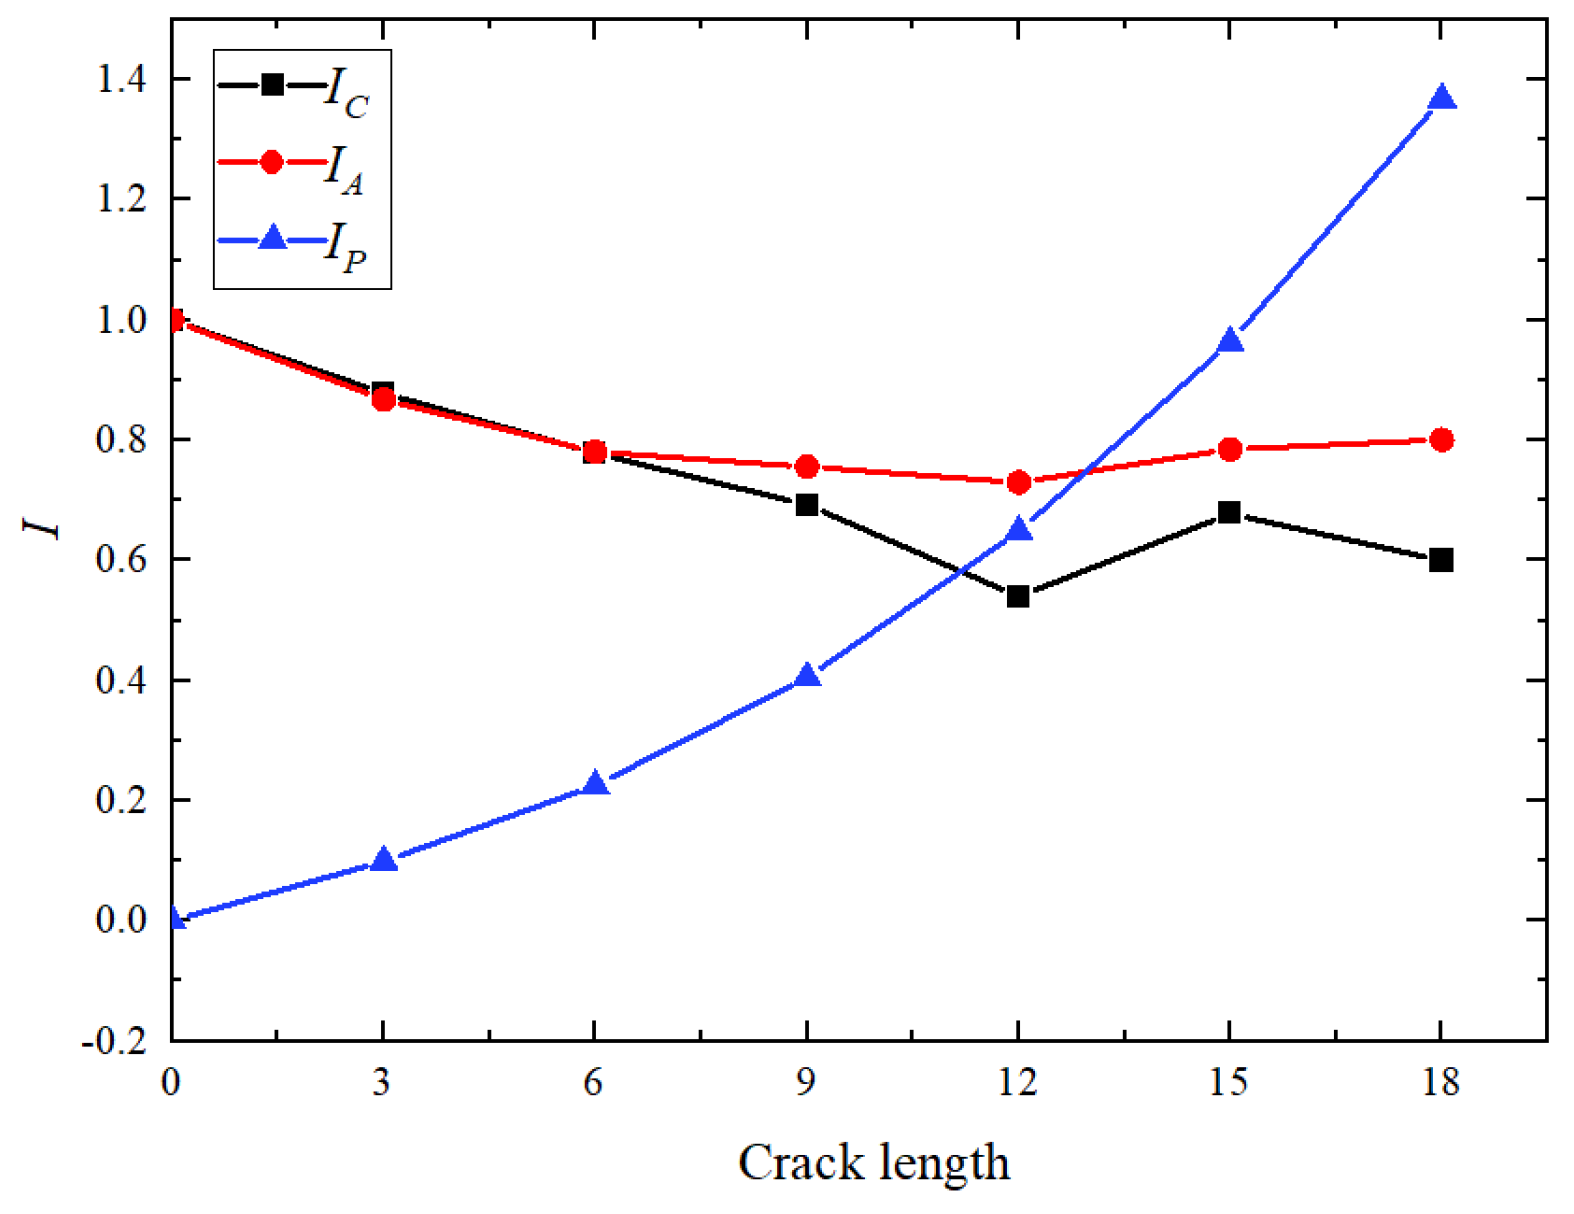
- A novel conclusion drawn from this experiment is that fatigue already exceeds 80% of the total life when the amplitude damage index reaches a minimum value (at 12 mm crack extension). Constructing a crack propagation rate monitoring model based on the phase damage index revealed a strong linear relationship between the phase damage index and crack propagation rate, which validates the feasibility of using Lamb waves to monitor the crack propagation rate. This finding provides a reference for monitoring methods of fatigue crack propagation in actual engineering for bridges.
- (1)
- The propagation of Lamb waves at the crack tip needs further research, and it is necessary to quantitatively study the crack width and crack growth angle when the propagation of Lamb waves changes.
- (2)
- The change in Lamb wave signal damage index reflects fatigue life, and further exploration should include visualizing the damage index more concisely.
Author Contributions
Funding
Institutional Review Board Statement
Informed Consent Statement
Data Availability Statement
Conflicts of Interest
References
- Ye, X.W.; Su, Y.H.; Han, J.P. A State-of-the-Art Review on Fatigue Life Assessment of Steel Bridges. Math. Probl. Eng. 2014, 2014, 956473. [Google Scholar] [CrossRef]
- Shevtsov, S.; Chebanenko, V.; Shevtsova, M.; Chang, S.H.; Kirillova, E.; Rozhkov, E. On the Directivity of Lamb Waves Generated by Wedge PZT Actuator in Thin CFRP Panel. Materials 2020, 13, 907. [Google Scholar] [CrossRef]
- Gebhardt, S.; Flössel, M.; Lieske, U.; Klesse, T.; Schönecker, A. Compact Structural Health Monitoring Transducers Made by Ceramic Multilayer Technology. Ferroelectrics 2013, 446, 107–117. [Google Scholar] [CrossRef]
- Lin, J.T.; Rajesh, P.K.; Lin, C.C.H.; Chou, M.Y.; Liu, J.Y.; Yue, J.; Hsiao, T.Y.; Tsai, H.F.; Chao, H.M.; Kung, M.M. Rapid Conjugate Appearance of the Giant Ionospheric Lamb Wave Signatures in the Northern Hemisphere After Hunga-Tonga Volcano Eruptions. Geophys. Res. Lett. 2022, 49, e2022GL098222. [Google Scholar] [CrossRef]
- Yu, J.G.; Wang, X.H.; Zhang, X.M.; Li, Z.; Li, F.L. An analytical integration Legendre polynomial series approach for Lamb waves in fractional order thermoelastic multilayered plates. Math. Methods Appl. Sci. 2022, 45, 7631–7651. [Google Scholar] [CrossRef]
- Terrien, N.; Osmont, D.; Royer, D.; Lepoutre, F.; Déom, A. A combined finite element and modal decomposition method to study the interaction of Lamb modes with micro-defects. Ultrasonics 2007, 46, 74–88. [Google Scholar] [CrossRef]
- Kuznetsov, S.V. Lamb waves in three-layered plates: Crossing fundamental branches and wave bifurcation. Acta Mech. 2024, 235, 4057–4065. [Google Scholar] [CrossRef]
- Huang, T.T.; Ren, X.; Zeng, Y.; Zhang, Y.; Luo, C.; Zhang, X.Y.; Xie, Y.M. Based on auxetic foam: A novel type of seismic metamaterial for Lamb waves. Eng. Struct. 2021, 246, 112976. [Google Scholar] [CrossRef]
- Giridhara, G.; Rathod, V.T.; Naik, S.; Mahapatra, D.R.; Gopalakrishnan, S. Rapid localization of damage using a circular sensor array and Lamb wave based triangulation. Mech. Syst. Signal Process. 2010, 24, 2929–2946. [Google Scholar] [CrossRef]
- Haider, M.F.; Bhuiyan, M.Y.; Poddar, B.; Lin, B.; Giurgiutiu, V. Analytical and experimental investigation of the interaction of Lamb waves in a stiffened aluminum plate with a horizontal crack at the root of the stiffener. J. Sound Vib. 2018, 431, 212–225. [Google Scholar] [CrossRef]
- Tua, P.S.; Quek, S.T.; Wang, Q. Detection of cracks in plates using piezo-actuated Lamb waves. Smart Mater. Struct. 2004, 13, 643–660. [Google Scholar] [CrossRef]
- Biemans, C.; Staszewski, W.J.; Boller, C.; Tomlinson, G.R. Crack detection in metallic structures using broadband excitation of acousto-ultrasonics. J. Intell. Mater. Syst. Struct. 2001, 12, 589–597. [Google Scholar] [CrossRef]
- Loutridis, S.; Douka, E.; Trochidis, A. Crack identification in double-cracked beams using wavelet analysis. J. Sound Vib. 2004, 277, 1025–1039. [Google Scholar] [CrossRef]
- Douka, E.; Loutridis, S.; Trochidis, A. Crack identification in beams using wavelet analysis. Int. J. Solids Struct. 2003, 40, 3557–3569. [Google Scholar] [CrossRef]
- Lu, Y.; Ye, L.; Su, Z.Q.; Yang, C.H. Quantitative assessment of through-thickness crack size based on Lamb wave scattering in aluminium plates. NDT E Int. 2008, 41, 59–68. [Google Scholar] [CrossRef]
- Gangadharan, R.; Mahapatra, D.R.; Gopalakrishnan, S.; Murthy, C.R.L.; Bhat, M.R. On the sensitivity of elastic waves due to structural damages: Time-frequency based indexing method. J. Sound Vib. 2009, 320, 915–941. [Google Scholar] [CrossRef]
- He, J.J.; Guan, X.F.; Peng, T.S.; Liu, Y.M.; Saxena, A.; Celaya, J.; Goebel, K. A multi-feature integration method for fatigue crack detection and crack length estimation in riveted lap joints using Lamb waves. Smart Mater. Struct. 2013, 22, 105007. [Google Scholar] [CrossRef]
- Wang, D.J.; He, J.J.; Guan, X.F.; Yang, J.S.; Zhang, W.F. A model assessment method for predicting structural fatigue life using Lamb waves. Ultrasonics 2018, 84, 319–328. [Google Scholar] [CrossRef]
- Xu, J.M.; Wang, K.; Ma, Q.T.; Li, H.R.; Wang, P.; Chen, R.; Qian, Y.; Zeng, D.F. Study on acoustic emission properties and crack growth rate identification of rail steels under different fatigue loading conditions. Int. J. Fatigue 2023, 172, 107638. [Google Scholar] [CrossRef]
- Greve, D.W.; Oppenheim, I.J.; Zheng, P. Lamb waves and nearly-longitudinal waves in thick plates. In Proceedings of the Sensors and Smart Structures Technologies for Civil, Mechanical, and Aerospace Systems, San Diego, CA, USA, 10–13 March 2008. [Google Scholar]
- Sun, K.; Meng, G.; Li, F.C.; Ye, L.; Lu, Y. Damage detection in thick steel beam using lamb waves. In Proceedings of the Smart Materials, Adaptive Structures and Intelligent Systems, Ellicott City, MD, USA, 28–30 October 2008. [Google Scholar]
- Grisso, B.L.; Salvino, L.W.; Singh, G.; Singh, G.; Tansel, I.N. A comparison of impedance and Lamb wave SHM techniques for monitoring structural integrity of and through welded joints. In Health Monitoring of Structural and Biological Systems; SPIE: Bellingham, WA, USA, 2011. [Google Scholar]
- Schaal, C.; Zhang, S.Z.; Samajder, H.; Mal, A. Analytical Investigation of the Interaction of Rayleigh and Lamb Waves at a Delamination-like Discontinuity in a Thick Plate. In Proceedings of the 10th International Workshop on Structural Health Monitoring (IWSHM), Stanford Univ, Stanford, CA, USA, 1–3 September 2015. [Google Scholar]
- Shao, Y.S.; Zeng, L.; Lin, J. Damage detection of thick plates using trailing pulses at large frequency-thickness products. Applied Acoustics 2021, 174, 107767. [Google Scholar] [CrossRef]
- Michaels, J.E. Detection, localization and characterization of damage in plates with an in situ array of spatially distributed ultrasonic sensors. Smart Mater. Struct. 2008, 17, 035035. [Google Scholar] [CrossRef]
- Qian, C.; Ran, Y.M.; He, J.J.; Ren, Y.; Sun, B.; Zhang, W.F.; Wang, R.Q. Application of artificial neural networks for quantitative damage detection in unidirectional composite structures based on Lamb waves. Adv. Mech. Eng. 2020, 12, 1687814020914732. [Google Scholar] [CrossRef]
- GB/T 6398-2017; Metal Material—Fatigue Testing—Fatigue Crack Growth Method. National Standard of the People’s Republic of China: Beijing, China, 2017.
- Li, Y.Z.; Wang, H.; Gong, D.Z. The interrelation of the parameters in the Paris equation of fatigue crack growth. Eng. Fract. Mech. 2012, 96, 500–509. [Google Scholar] [CrossRef]
- Philip, R. Nonlinear Regression with Functional Data; Israel Science Foundation (ISF): Jerusalem, Israel, 2016. [Google Scholar]


| Poisson’s Ratio | Young’s Modulus | Longitudinal Wave Velocity | Transverse Wave Velocity | Density |
|---|---|---|---|---|
| 0.3 | 216.43 | 6036.33 | 3226.55 | 7980 |
| Specimen Number | Stress Ratio | Thickness (mm) | Width (mm) | Crack Length (mm) | Payload Range (kN) |
|---|---|---|---|---|---|
| T1 | 0.1 | 10.04 | 80.0 | 19.02 | 27 |
| T2 | 0.1 | 10.02 | 80.0 | 19.05 | 27 |
| T3 | 0.1 | 10.06 | 80.0 | 19.06 | 27 |
| T4 | 0.1 | 10.04 | 80.0 | 19.03 | 27 |
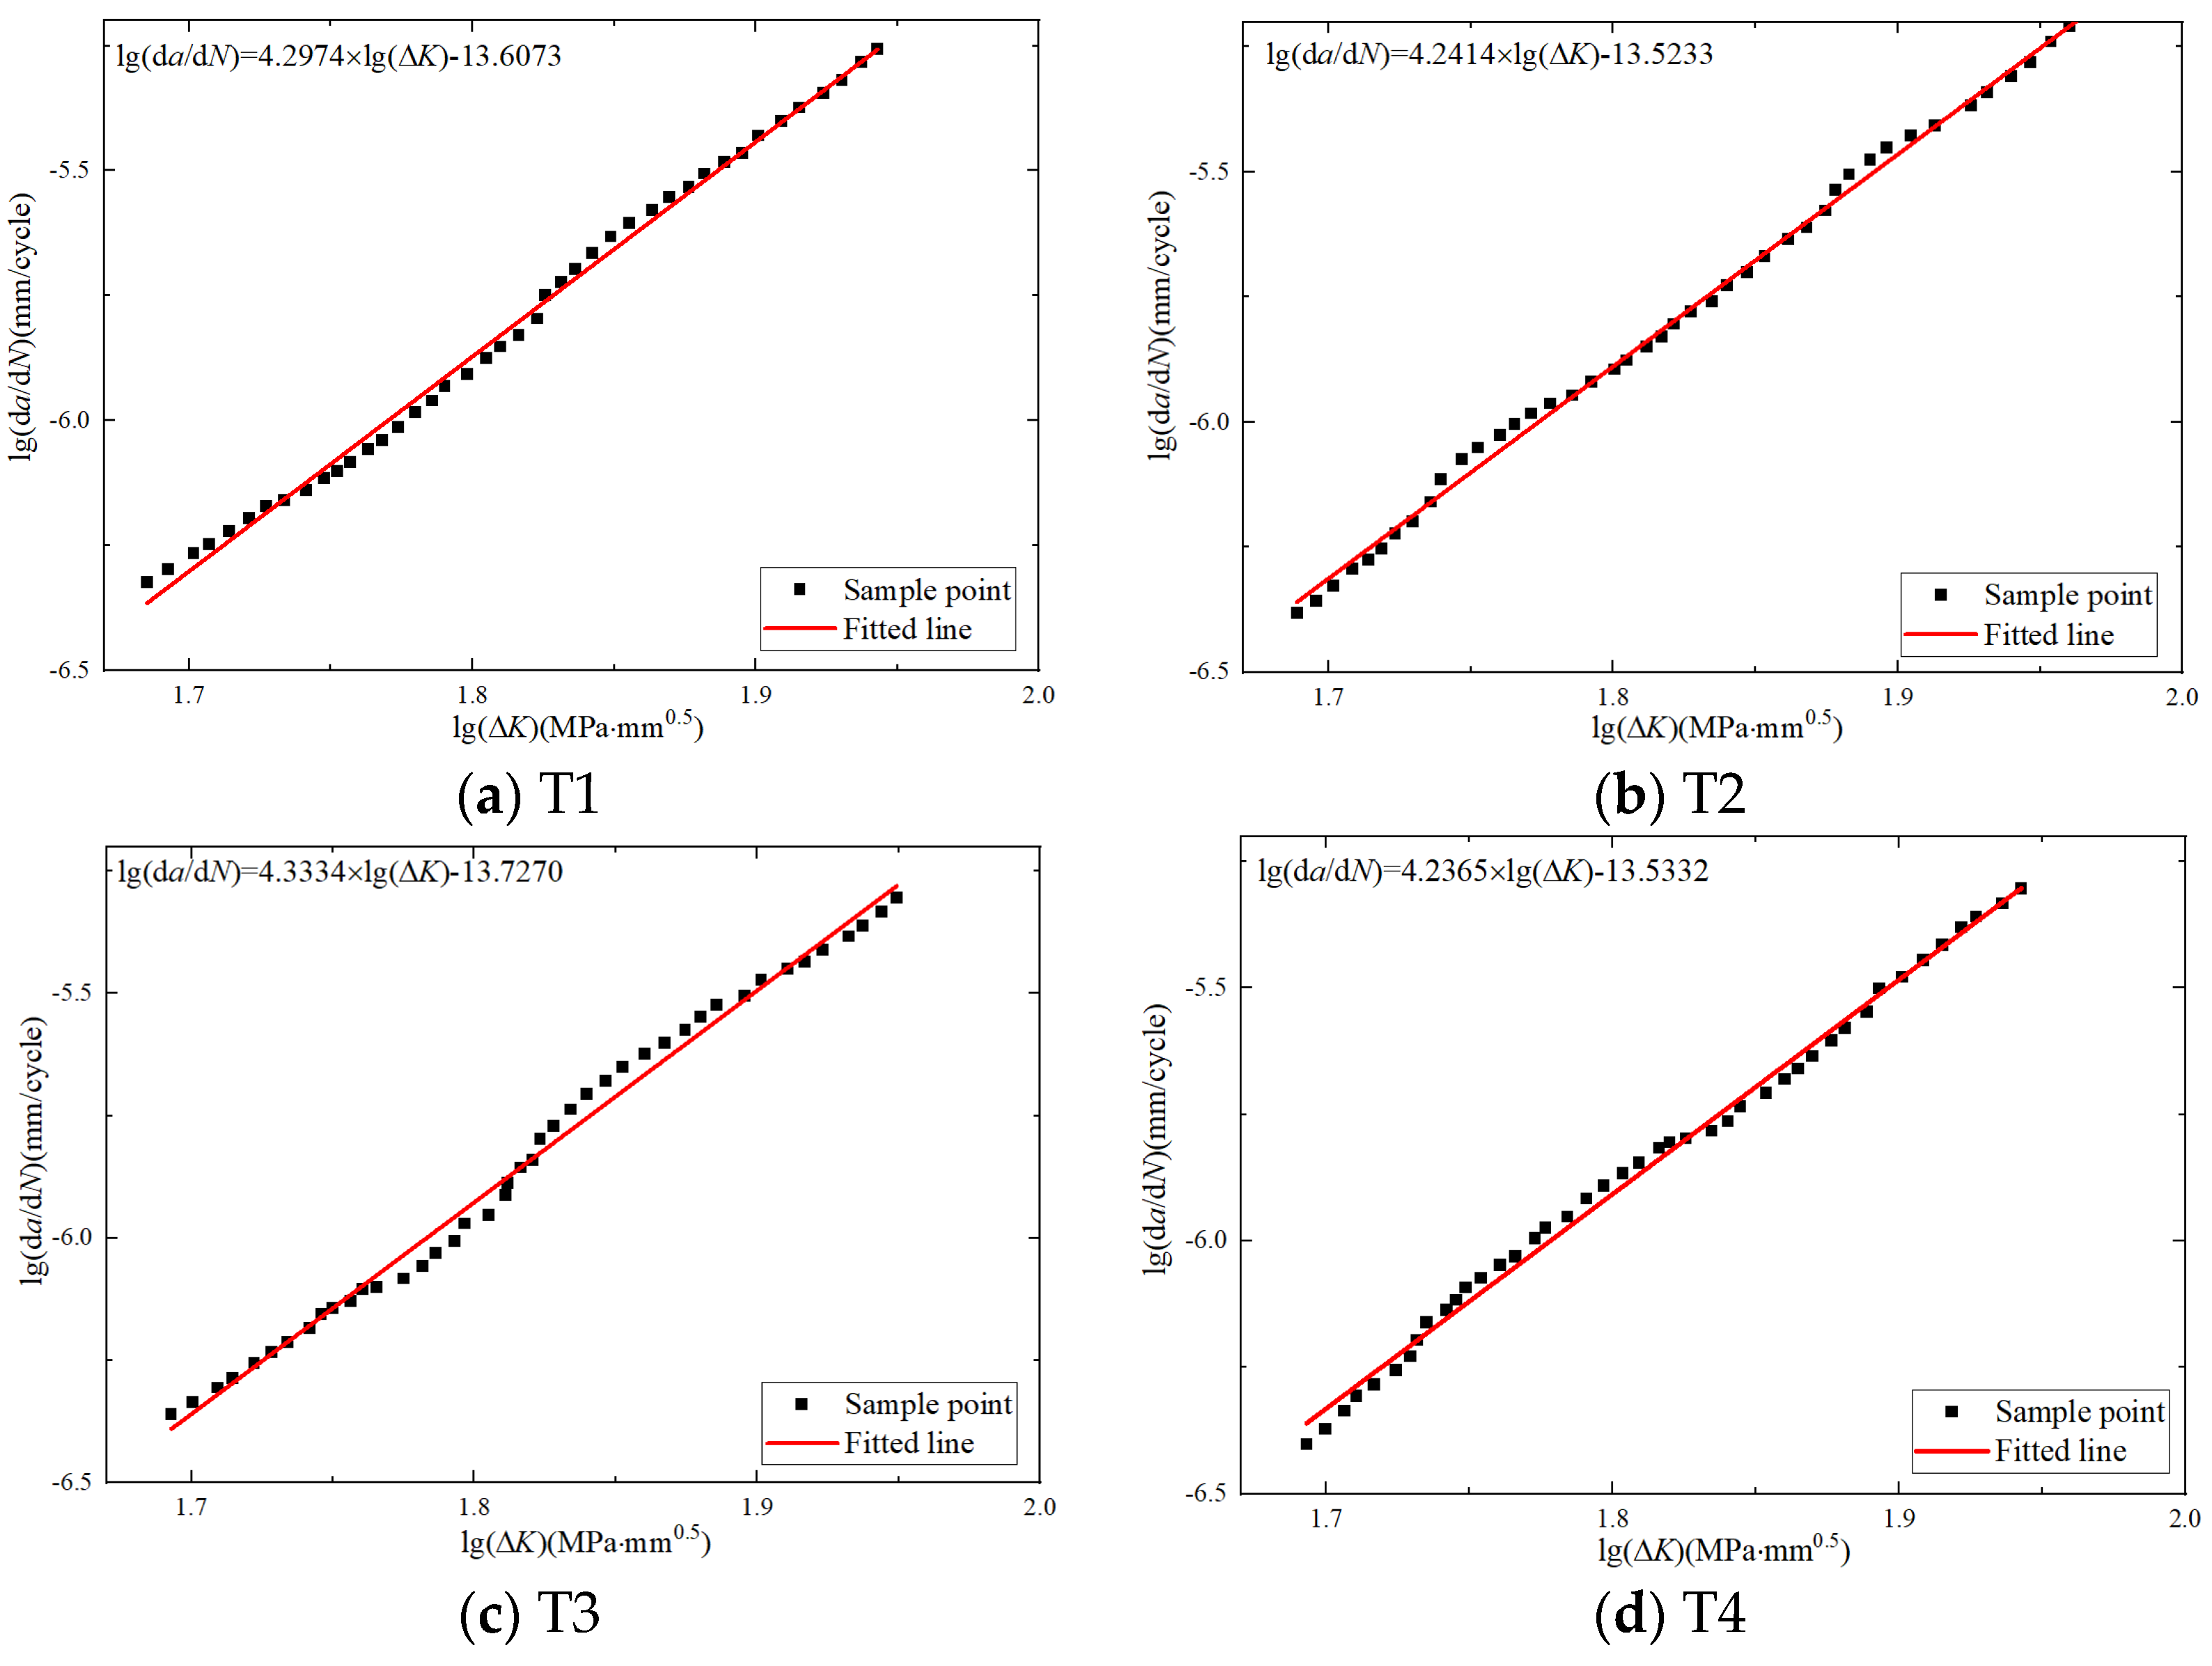
| Specimen Number | Stress Ratio | lgC | m | Correlation Coefficient | Paris Formula |
|---|---|---|---|---|---|
| T1 | 0.1 | −13.6073 | 4.2974 | 0.9978 | = 2.4700 × 10⁻¹⁴ΔK4.2974 |
| T2 | 0.1 | −13.5233 | 4.2414 | 0.9989 | = 2.9971 × 10⁻¹⁴ΔK4.2414 |
| T3 | 0.1 | −13.7270 | 4.3334 | 0.9957 | = 1.8750 × 10⁻¹⁴ΔK4.3334 |
| T4 | 0.1 | −13.5332 | 4.2365 | 0.9973 | = 2.9295 × 10⁻¹⁴ΔK4.2365 |
| lgC | m | Correlation Coefficient | Paris Formula | |
|---|---|---|---|---|
| Average | −13.5977 | 4.2772 | 0.9974 | = 2.5679 × 10⁻¹⁴ΔK4.2772 |
| Variance | 0.0942 | 0.04662 | 0.00132 |
| Specimen Number | Cycle at 12 mm | Cycle at 18 mm | Cycle at Destruction | Percentage of Cycles at 12 mm | Percentage of Cycles at 18 mm |
|---|---|---|---|---|---|
| T1 | 14,559 | 16,480 | 16,931 | 85.99% | 97.34% |
| T2 | 13,481 | 15,239 | 15,635 | 86.22% | 97.47% |
| T3 | 14,795 | 17,027 | 17,767 | 83.27% | 95.83% |
| T4 | 14,701 | 16,366 | 16,947 | 86.75% | 96.57% |
| c1 | c2 | c3 | COD | |
|---|---|---|---|---|
| T1 | −0.38942 | 0.00246 | 0.04134 | 0.99717 |
| T2 | −0.36055 | 0.0024 | 0.03922 | 0.99168 |
| T3 | −0.51555 | 0.00374 | 0.03563 | 0.9939 |
| T4 | −0.57649 | 0.00473 | 0.03244 | 0.9954 |
| Average value | −0.46050 | 0.00333 | 0.03715 | 0.99454 |
| Sample variance | 0.10252 | 0.00112 | 0.00392 | 0.002332 |
| h1 | h2 | Linear Regression Coefficient | |
|---|---|---|---|
| T1 | 2.67981 × 10⁻⁶ | 3.33344 × 10⁻⁷ | 0.99877 |
| T2 | 2.62354 × 10⁻⁶ | 3.51512 × 10⁻⁷ | 0.99885 |
| T3 | 2.67028 × 10⁻⁶ | 3.43409 × 10⁻⁷ | 0.9988 |
| T4 | 2.67937 × 10⁻⁶ | 3.35601 × 10⁻⁷ | 0.99881 |
| Average value | 2.66325 × 10⁻⁶ | 3.40967 × 10⁻⁷ | 0.99881 |
| Sample variance | (2.68353 × 10⁻⁸)2 | (8.24751 × 10⁻⁹)2 | (3.30404 × 10⁻⁵)2 |
Disclaimer/Publisher’s Note: The statements, opinions and data contained in all publications are solely those of the individual author(s) and contributor(s) and not of MDPI and/or the editor(s). MDPI and/or the editor(s) disclaim responsibility for any injury to people or property resulting from any ideas, methods, instructions or products referred to in the content. |
© 2024 by the authors. Licensee MDPI, Basel, Switzerland. This article is an open access article distributed under the terms and conditions of the Creative Commons Attribution (CC BY) license (https://creativecommons.org/licenses/by/4.0/).
Share and Cite
He, M.; Dong, C.; Sun, X.; He, J. Fatigue Crack Monitoring Method Based on the Lamb Wave Damage Index. Materials 2024, 17, 3836. https://doi.org/10.3390/ma17153836
He M, Dong C, Sun X, He J. Fatigue Crack Monitoring Method Based on the Lamb Wave Damage Index. Materials. 2024; 17(15):3836. https://doi.org/10.3390/ma17153836
Chicago/Turabian StyleHe, Muyang, Chengwu Dong, Xiaodan Sun, and Jiayi He. 2024. "Fatigue Crack Monitoring Method Based on the Lamb Wave Damage Index" Materials 17, no. 15: 3836. https://doi.org/10.3390/ma17153836