


Artificial Neural Network Model for Predicting Mechanical Strengths of Economical Ultra-High-Performance Concrete Containing Coarse Aggregates: Development and Parametric Analysis

Abstract
1. Introduction
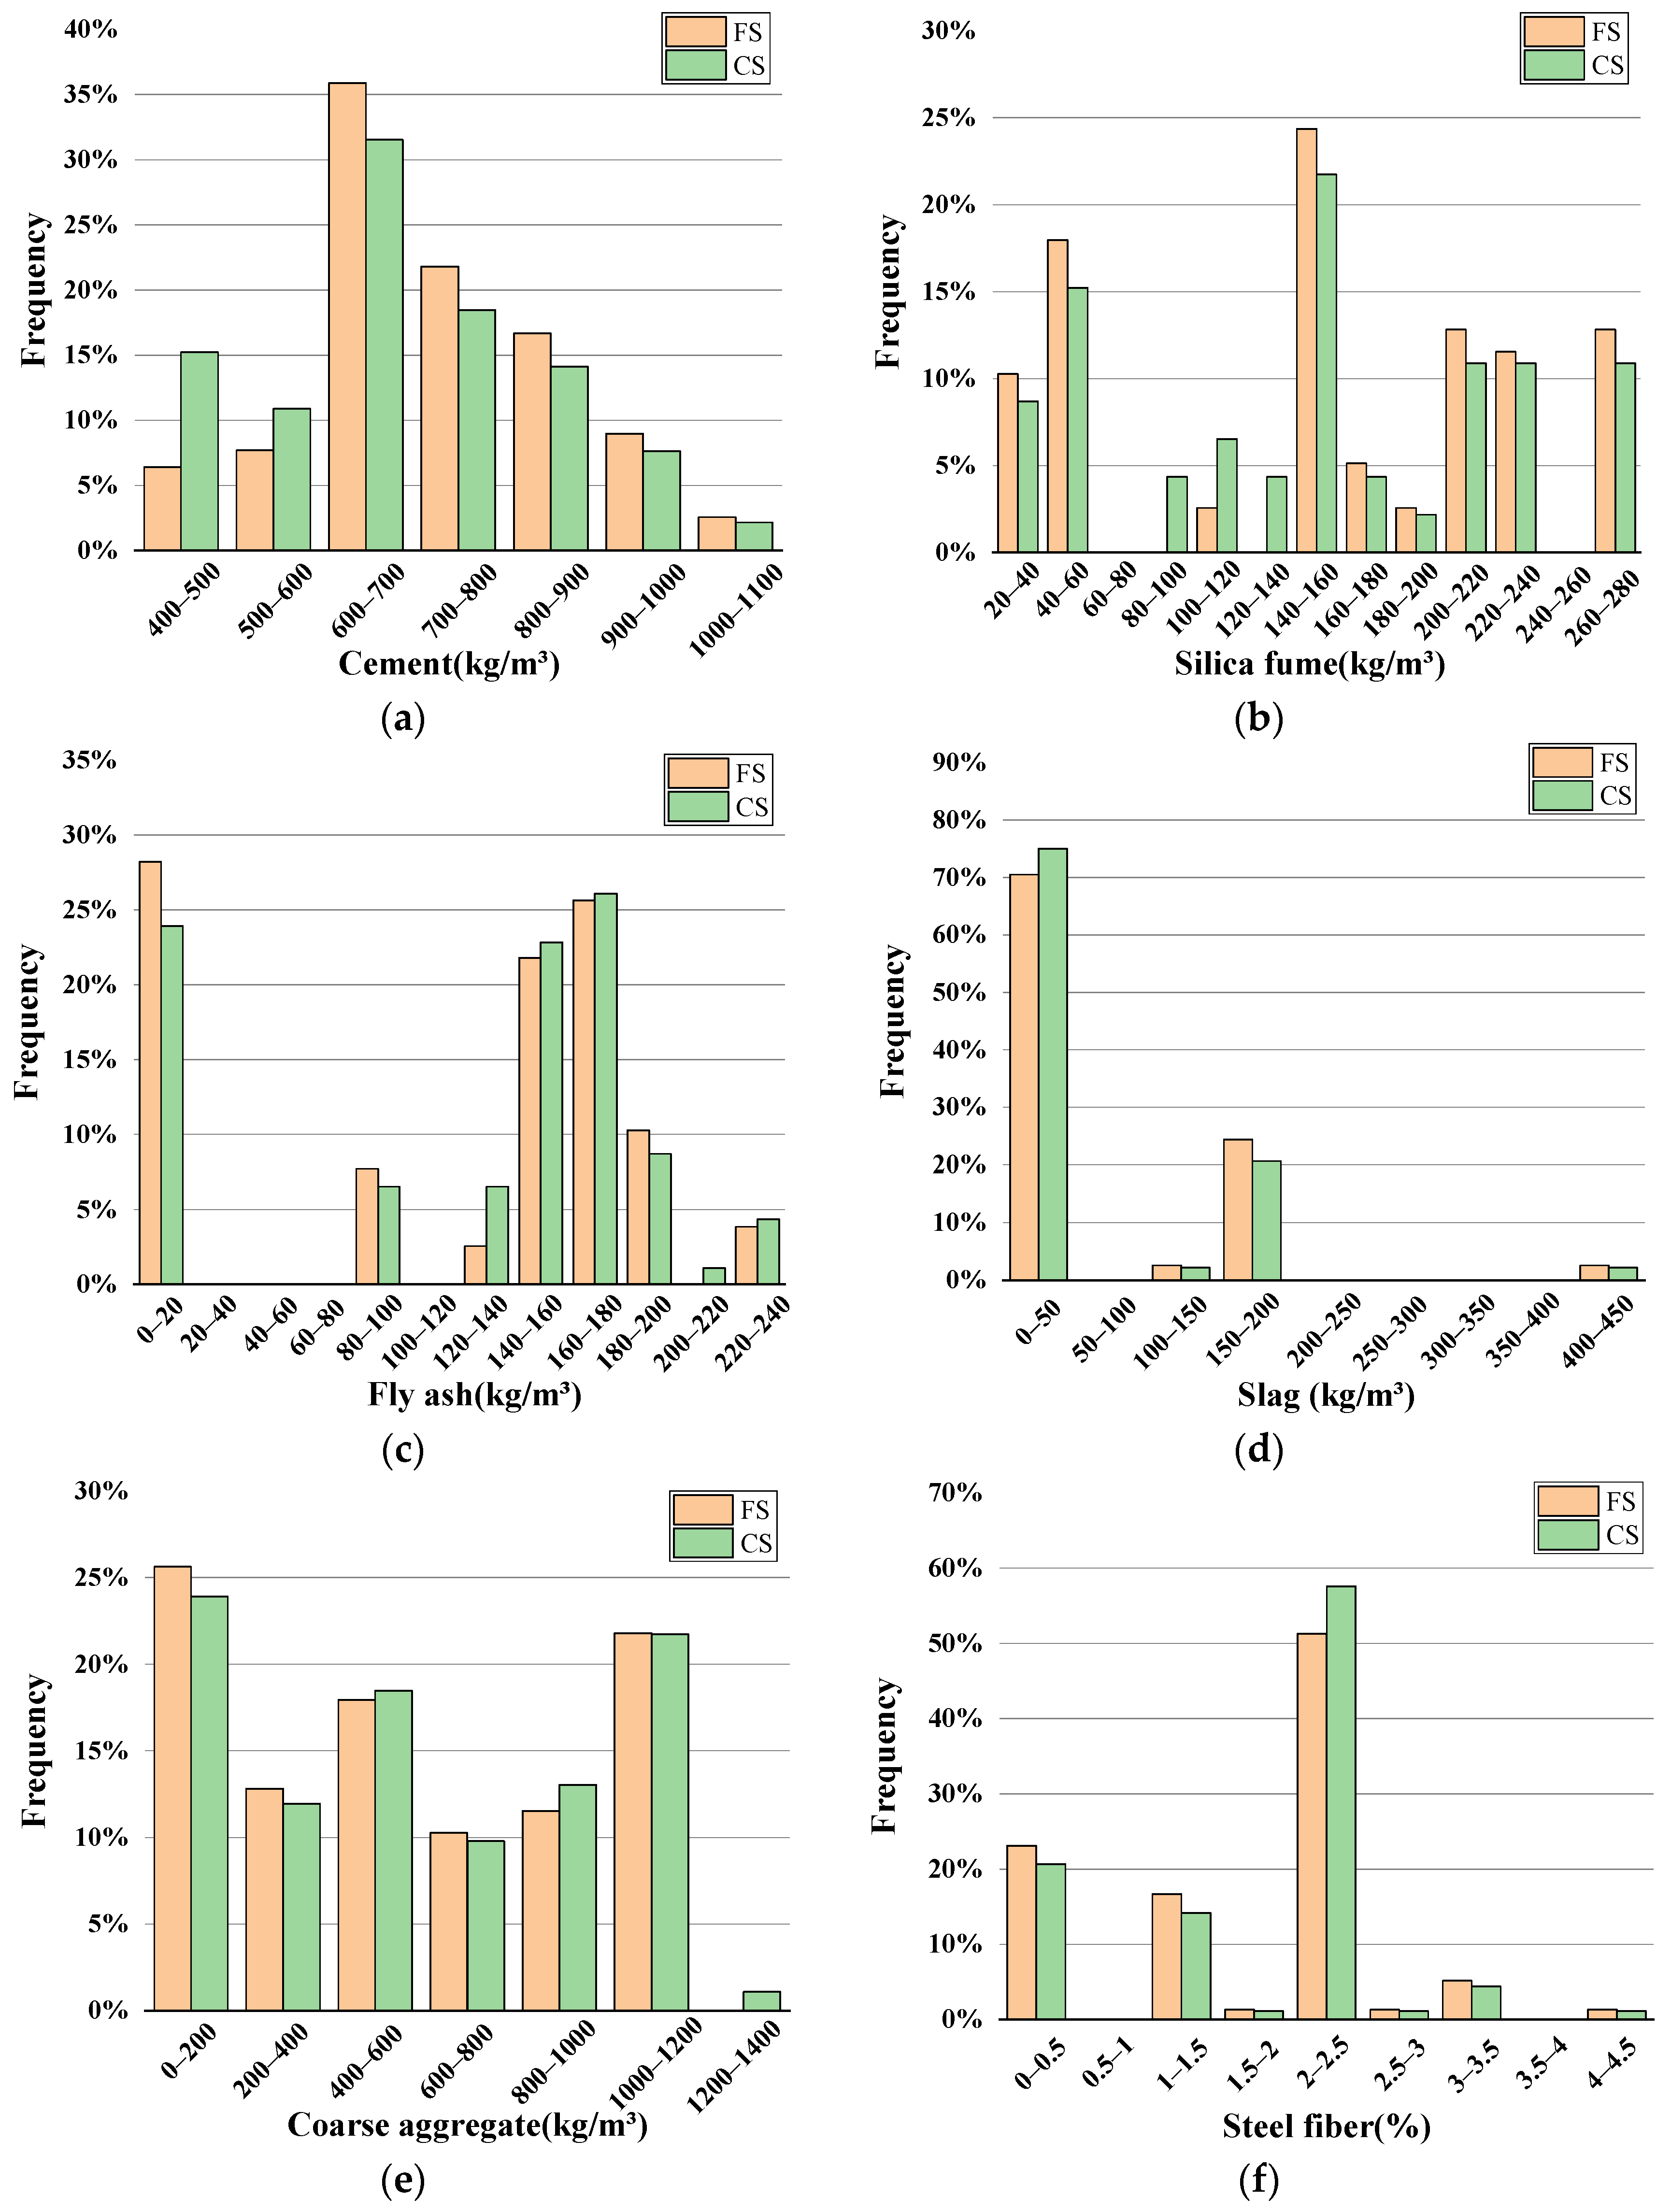
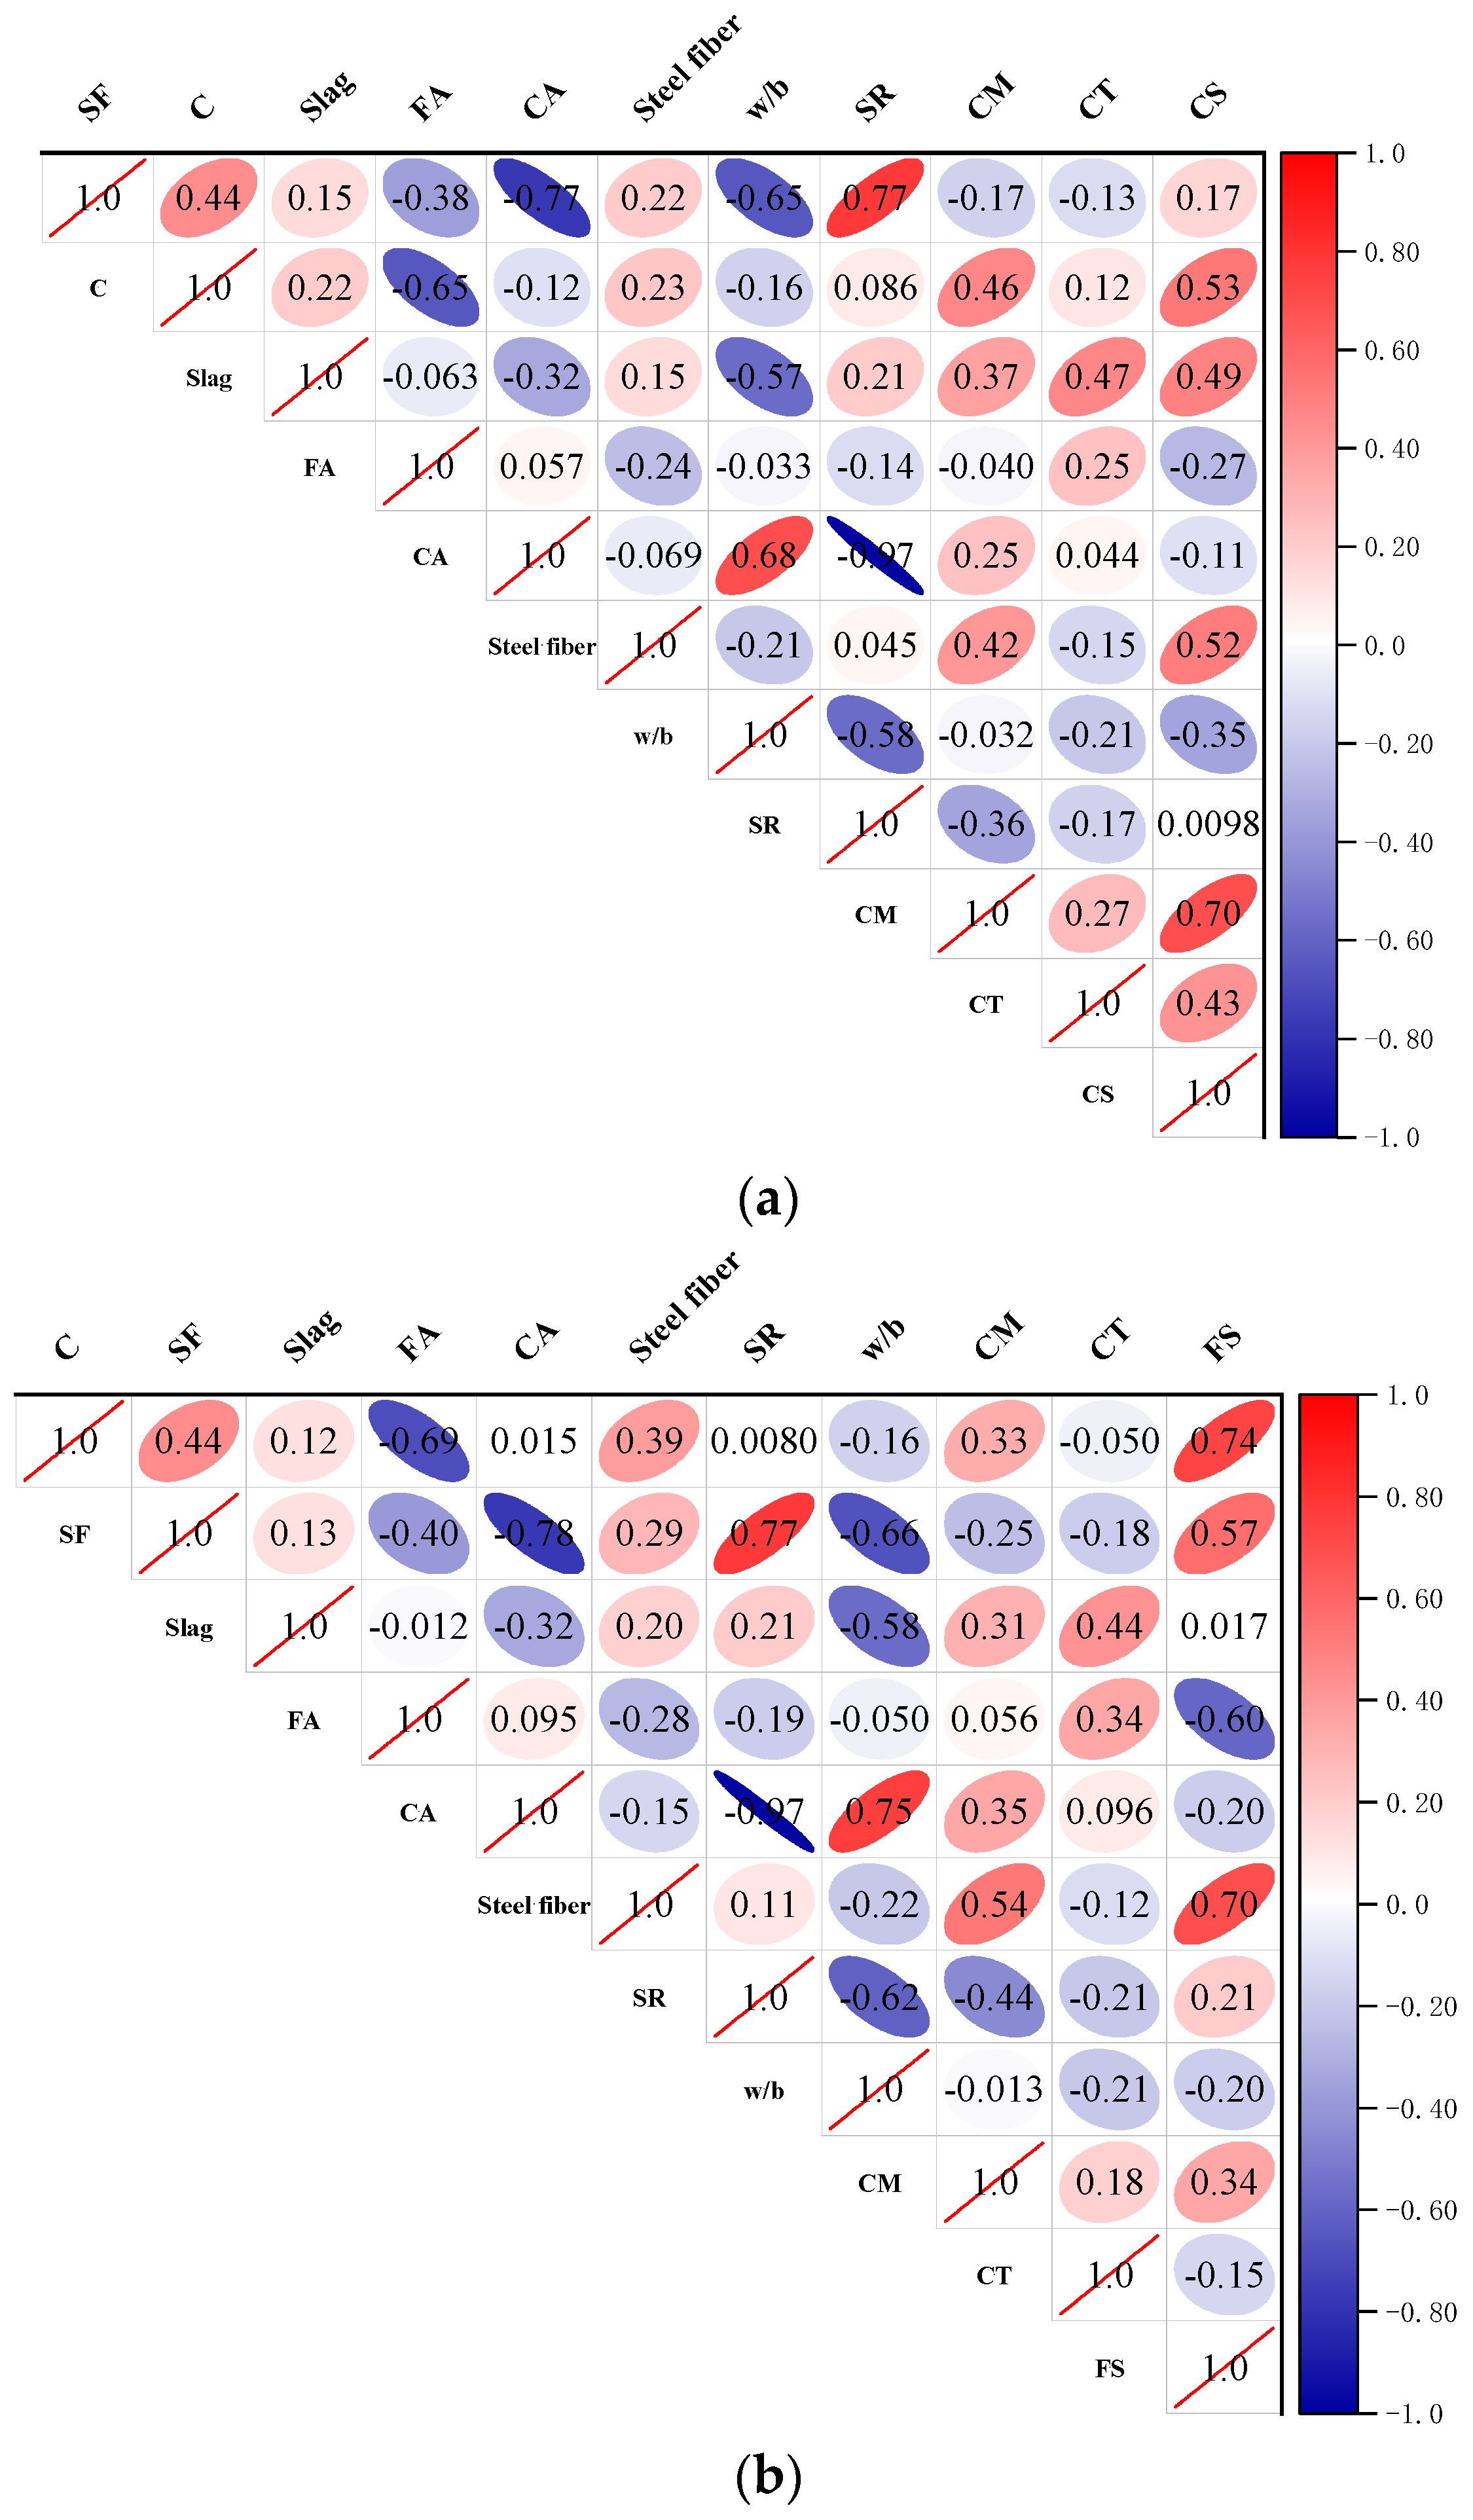
2. Dataset Establishment
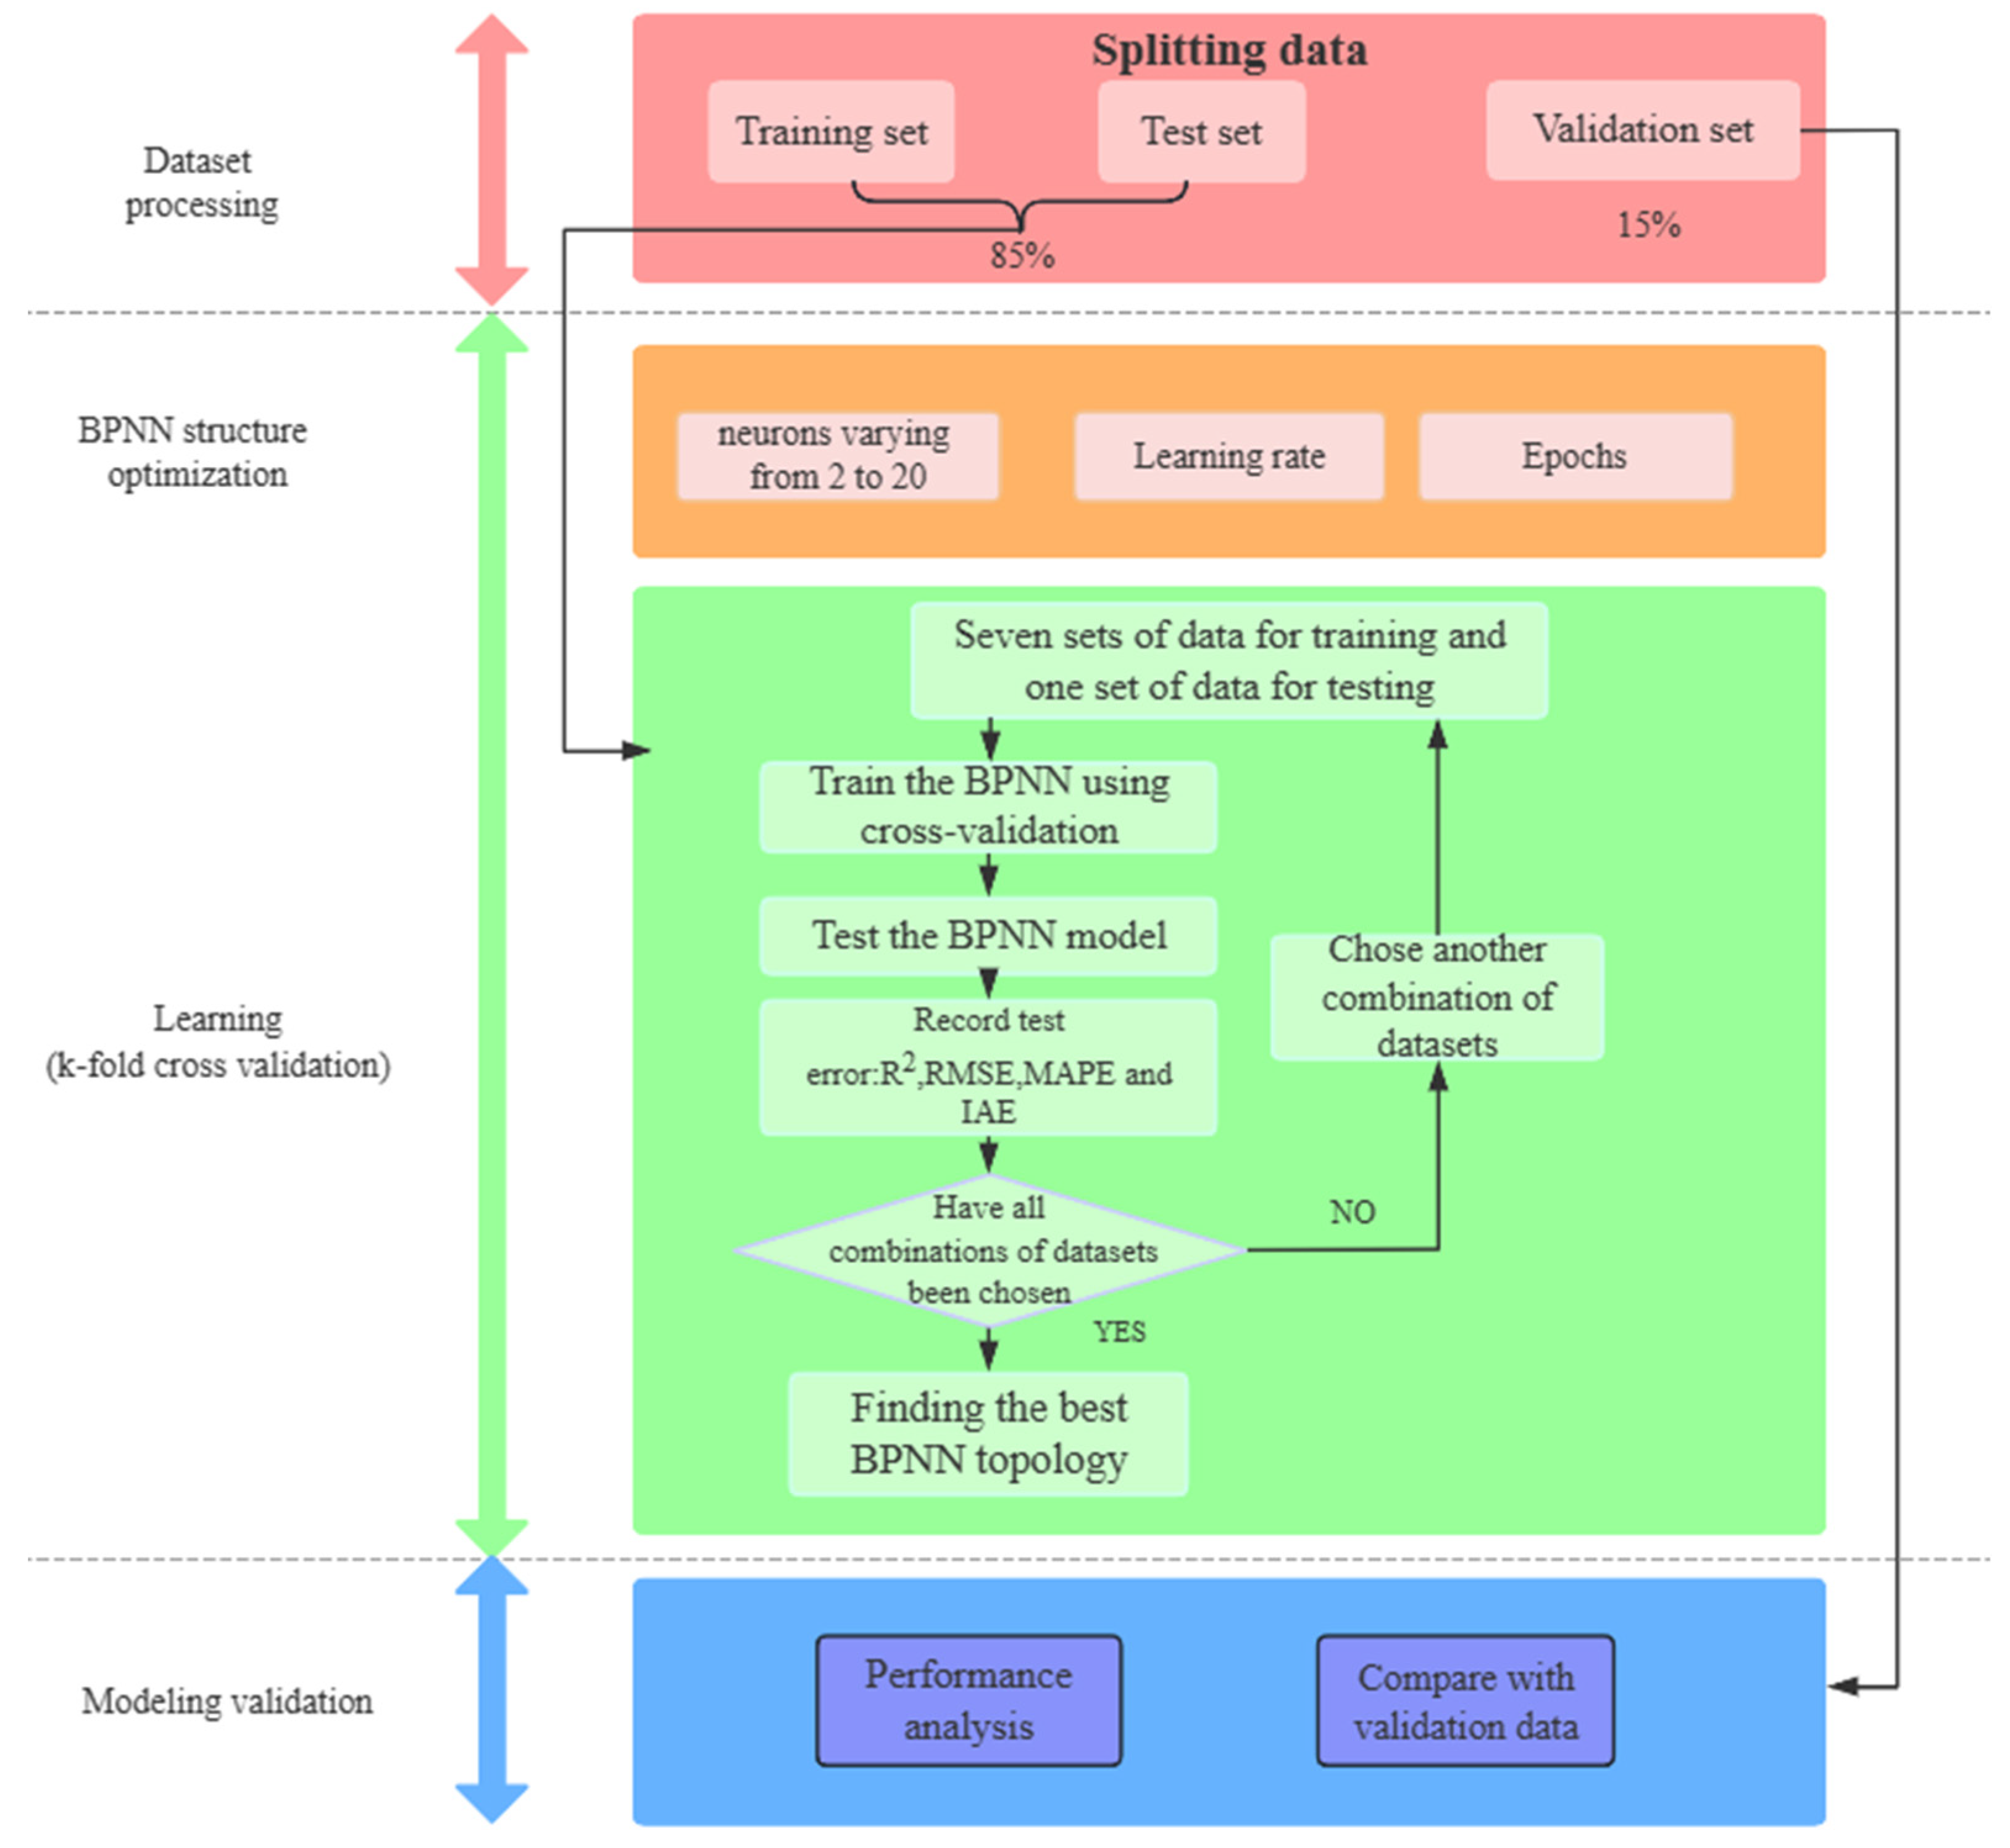
3. Methodology
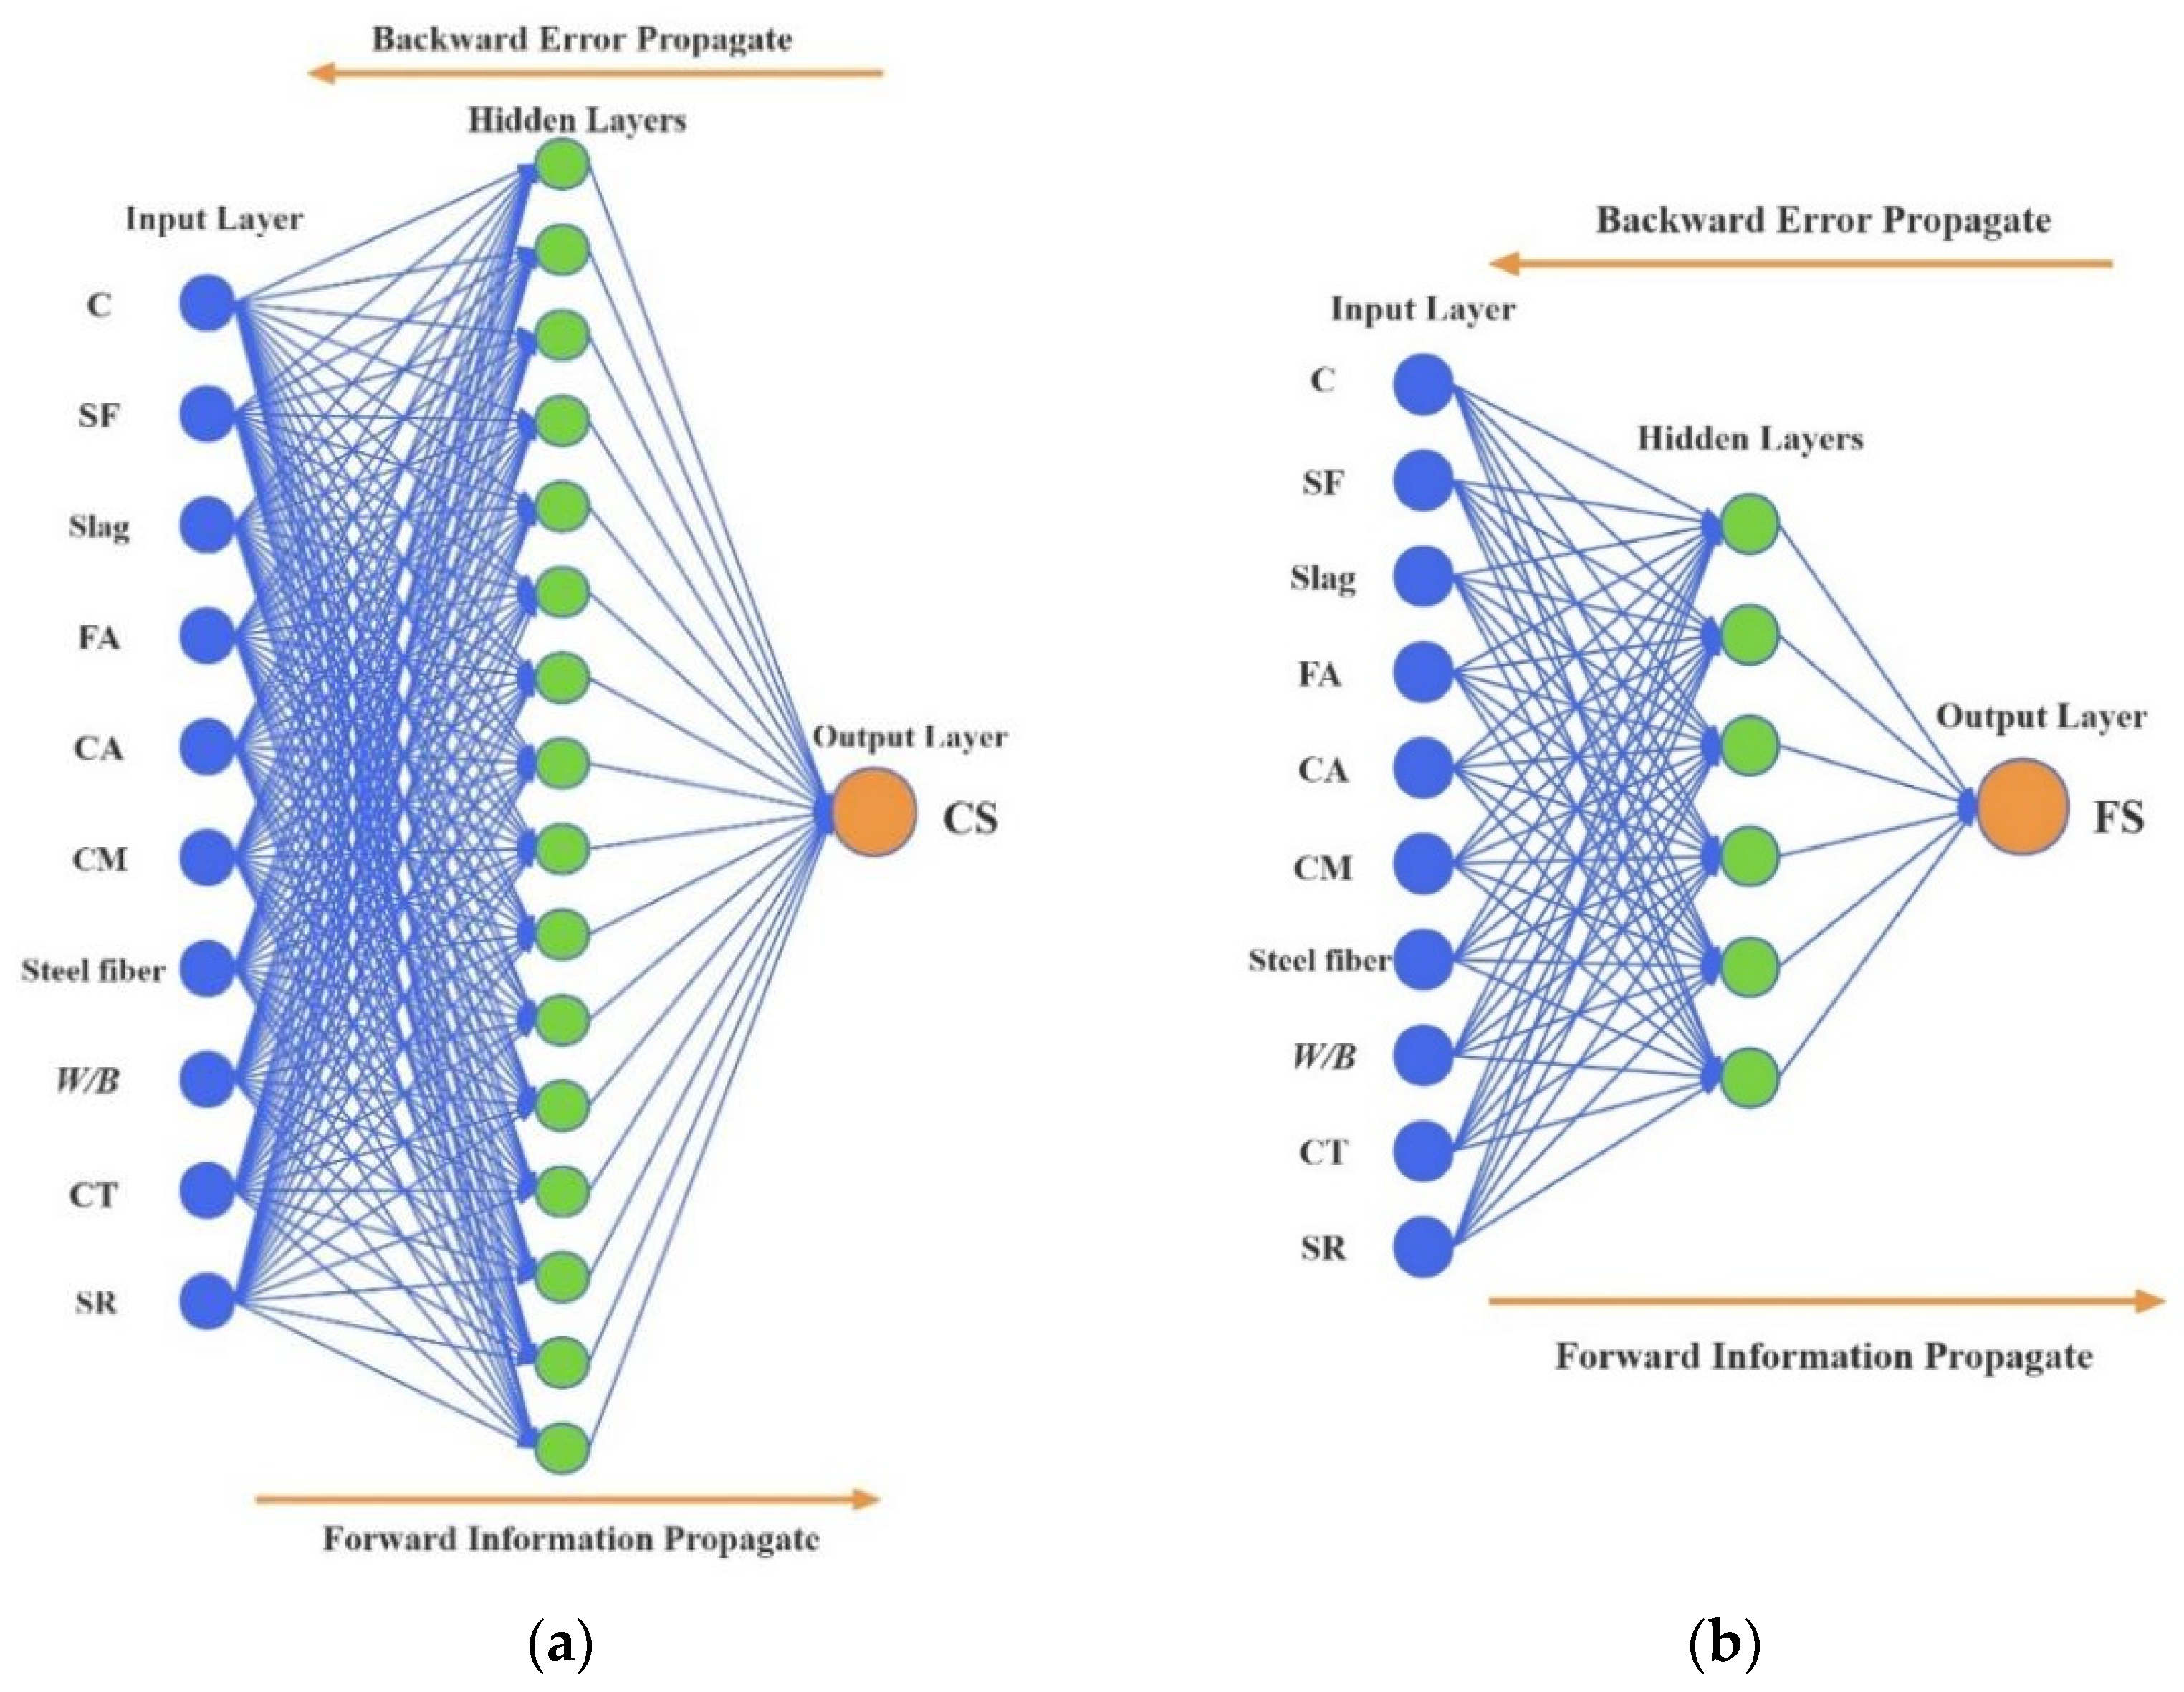
3.1. BP Artificial Neural Network
3.2. Evaluating Indicator
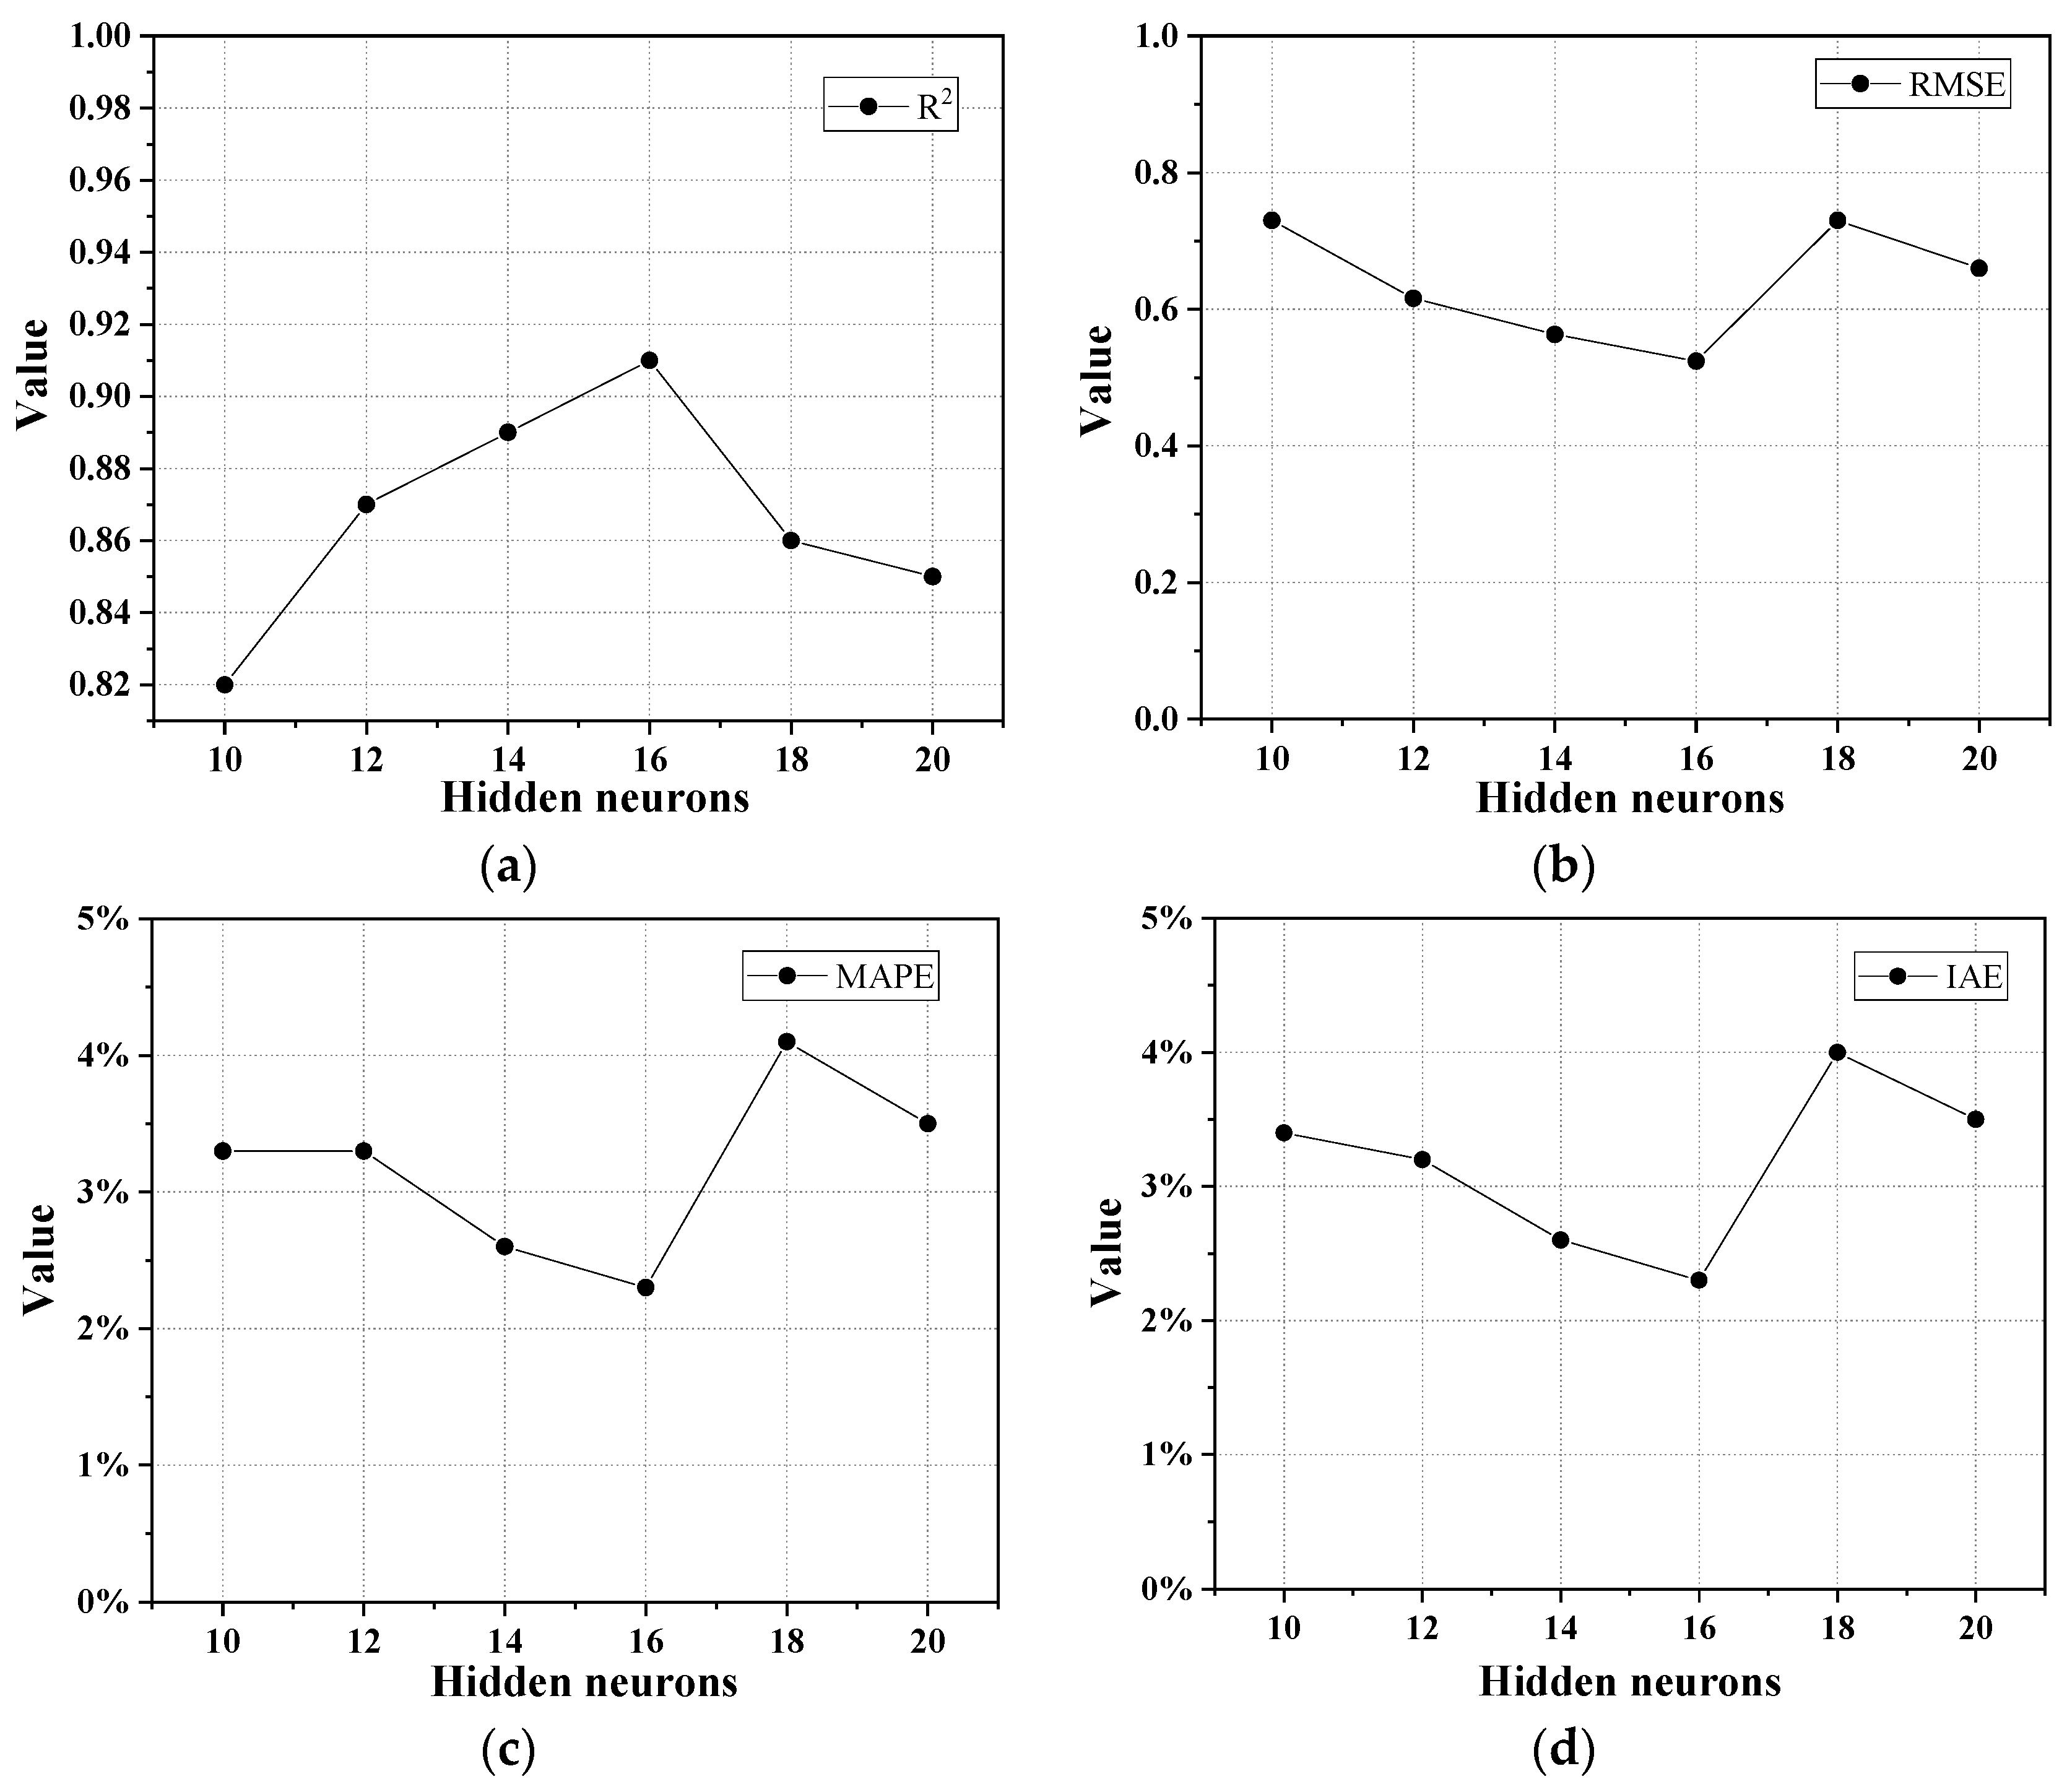
3.3. Determination of the Neurons in the Hidden Layer
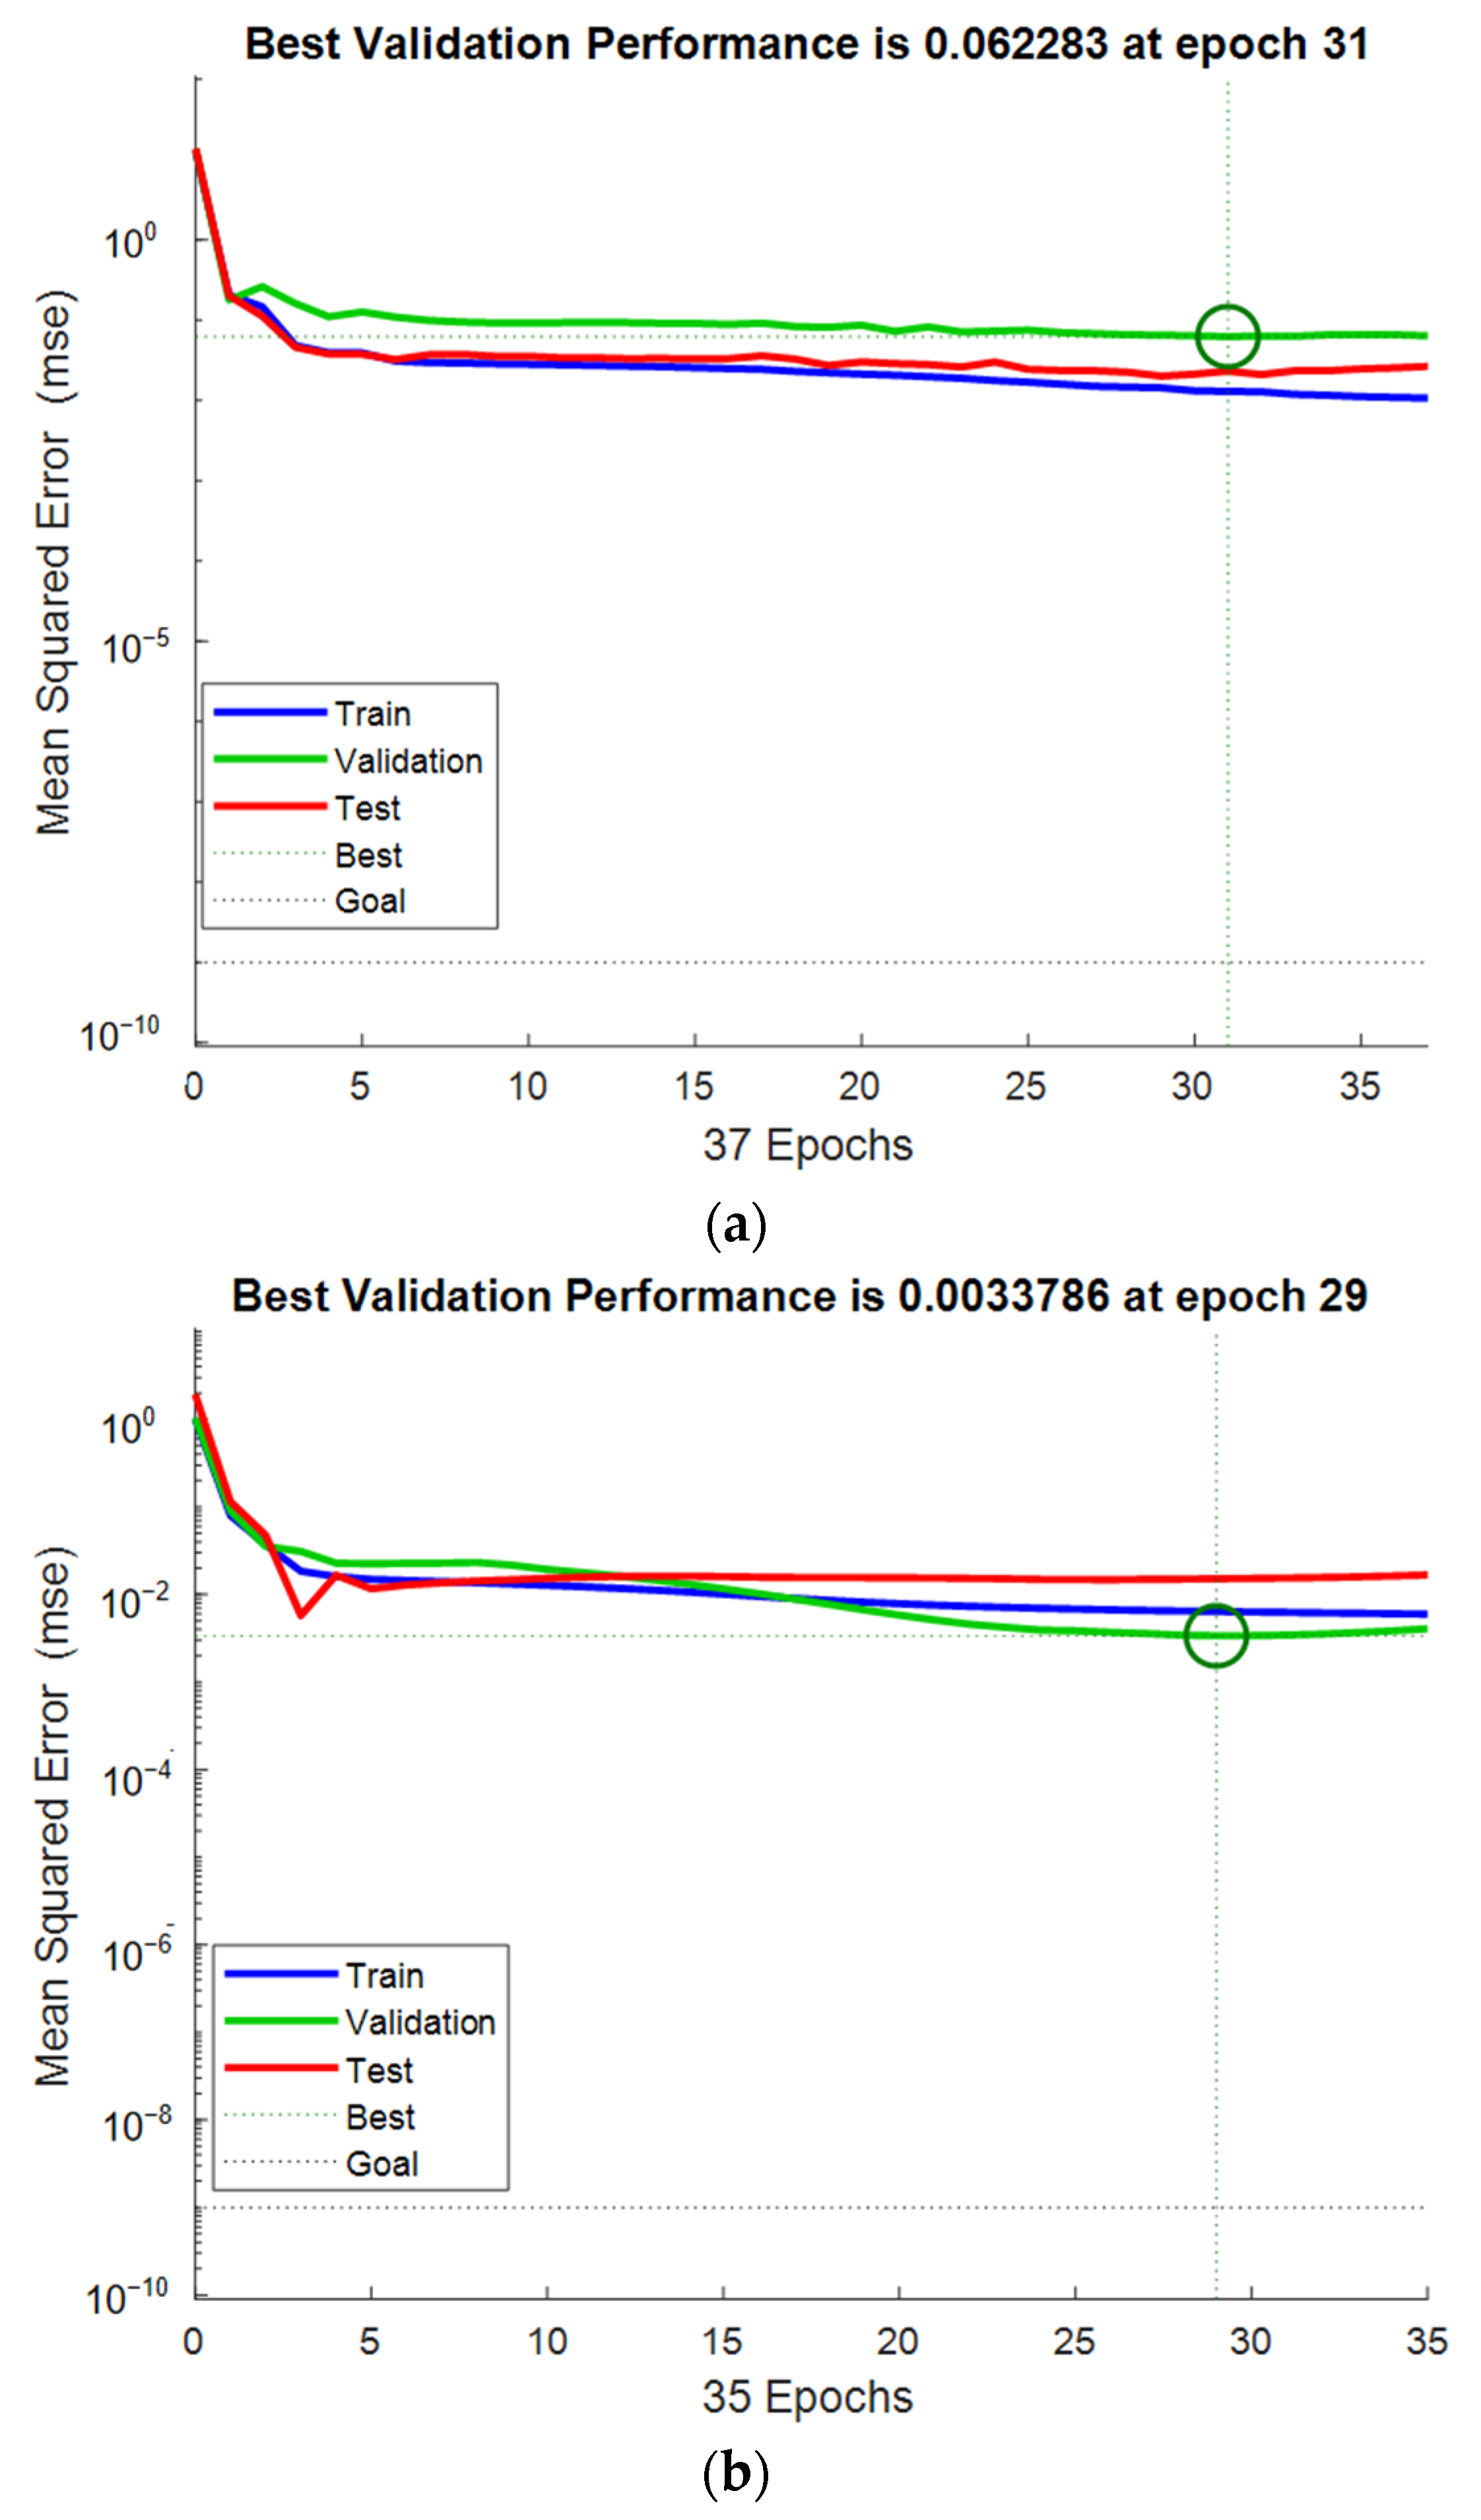
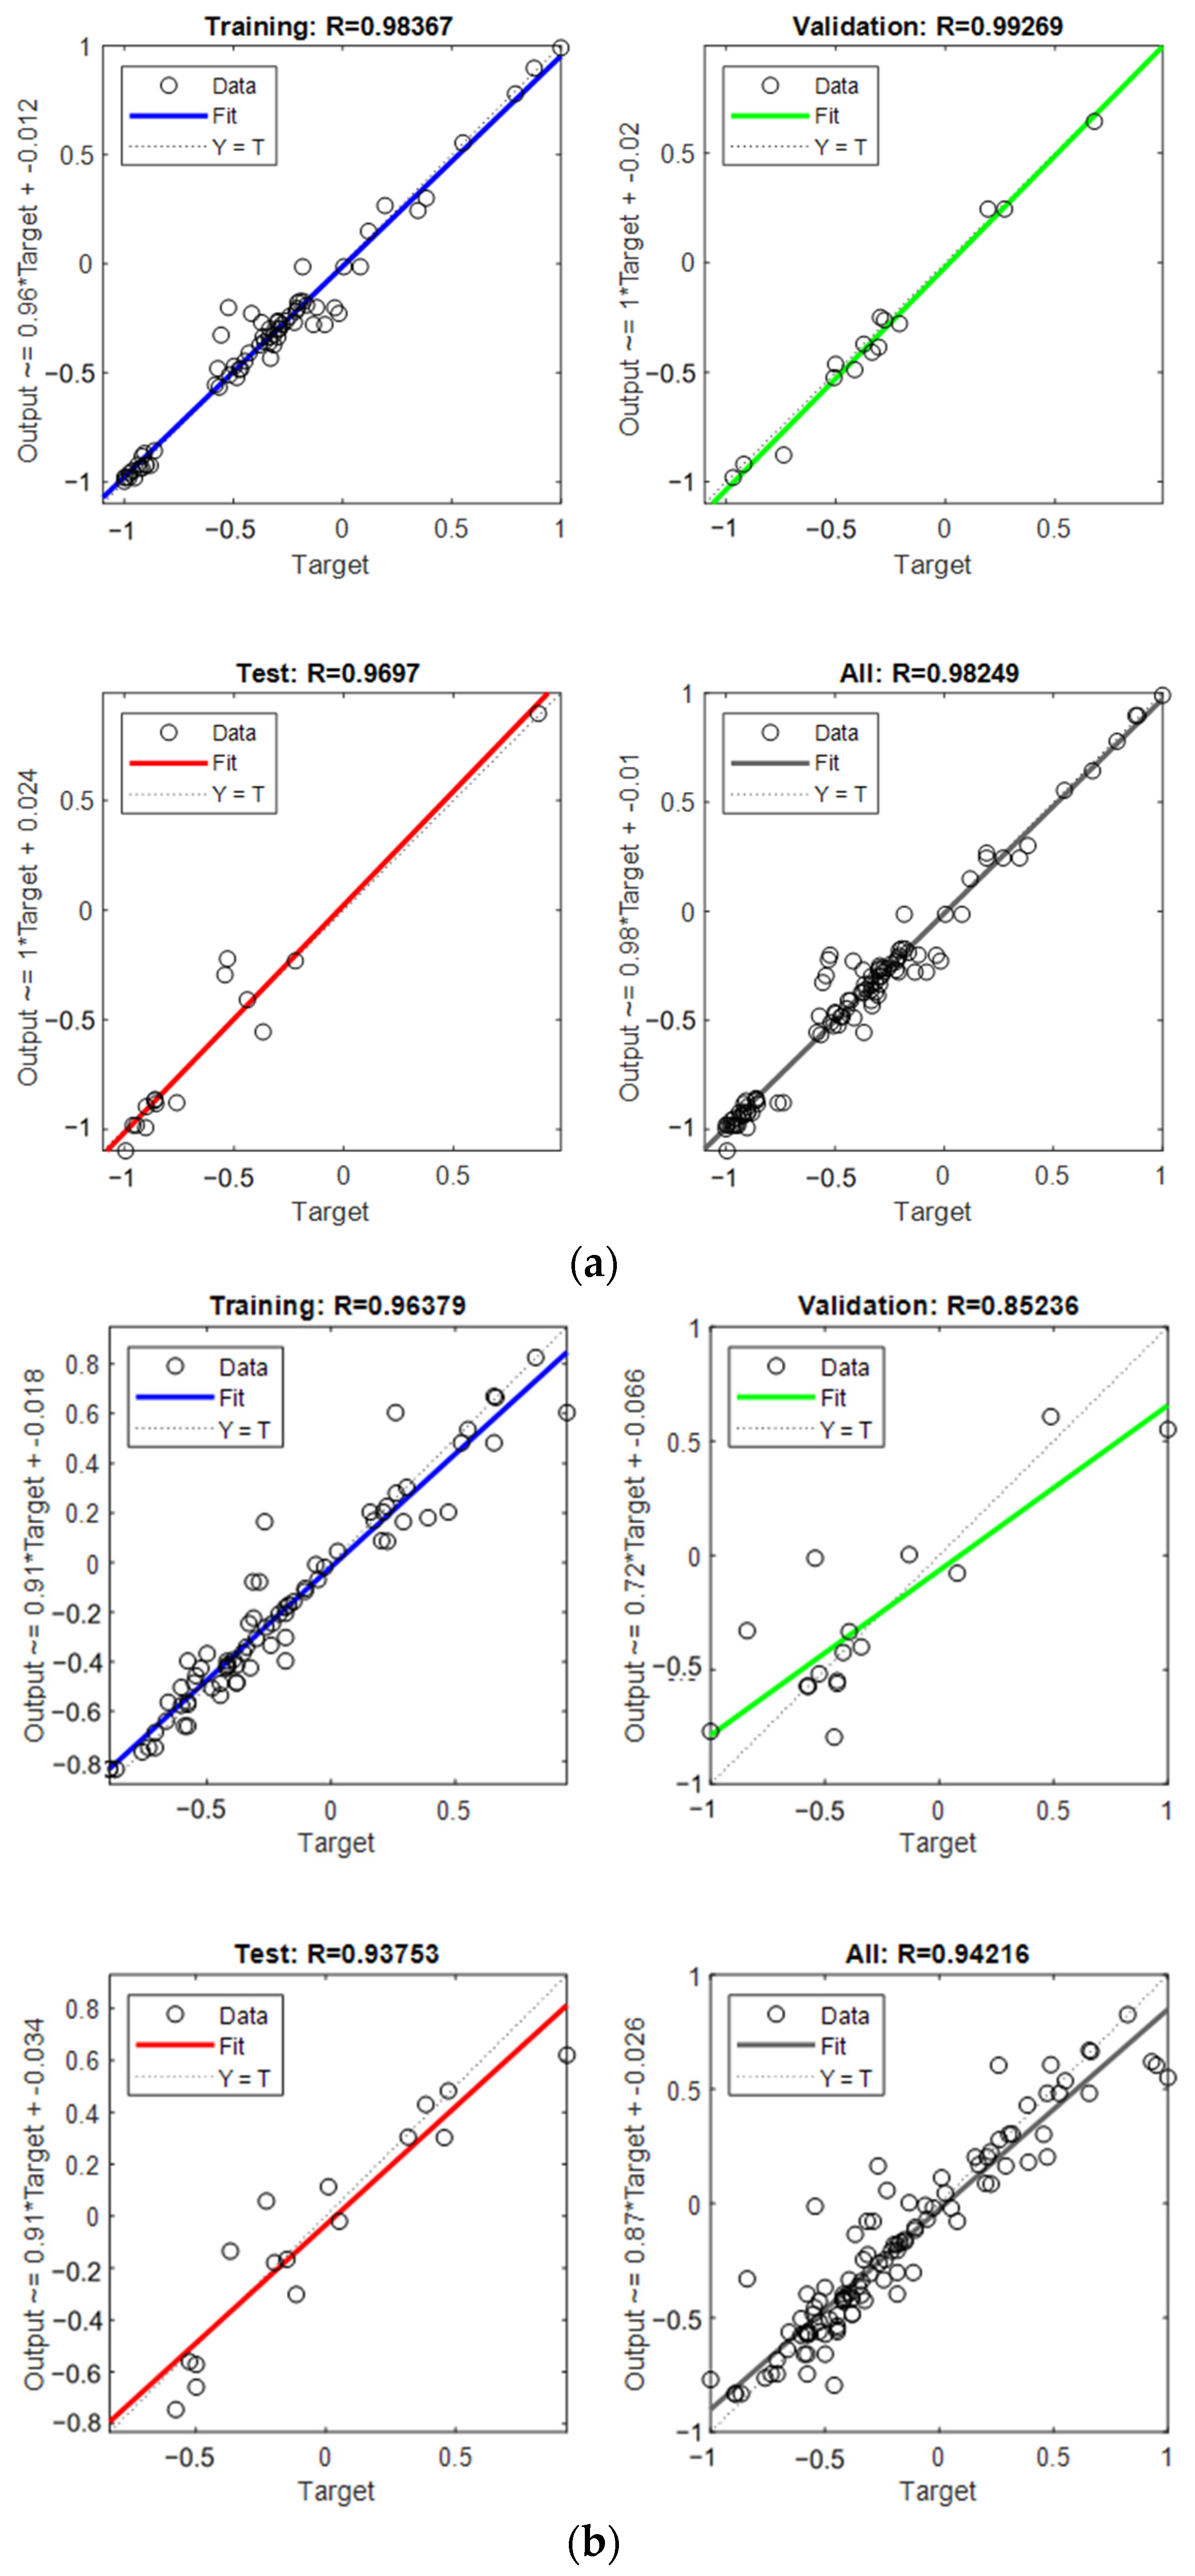
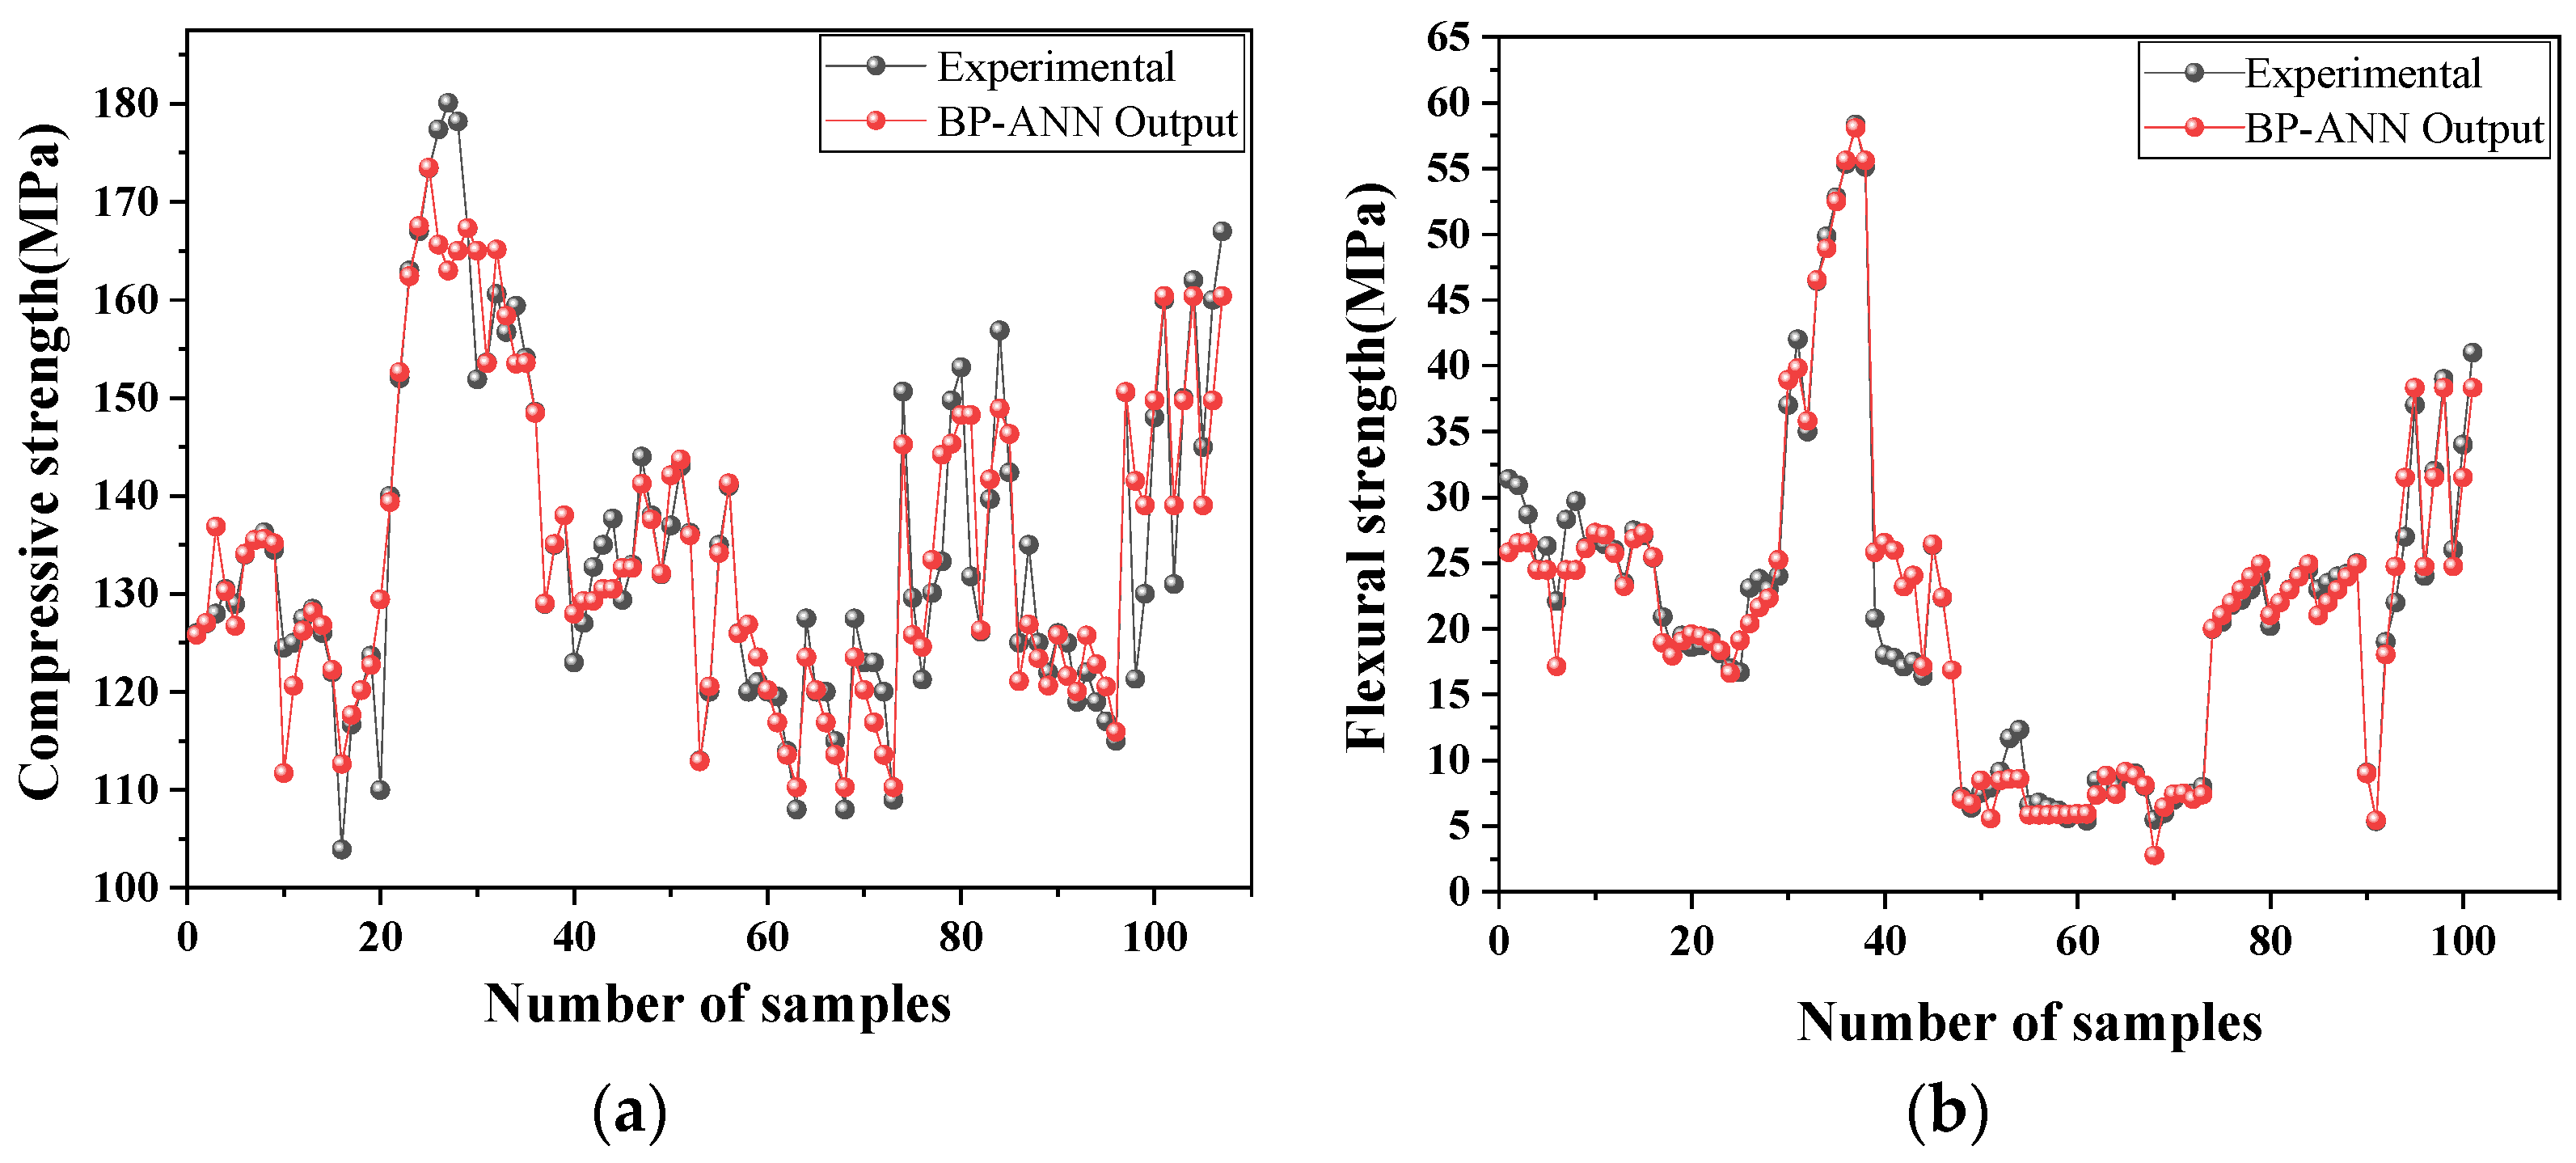
3.4. BP-ANN Performance
4. Results and Discussions
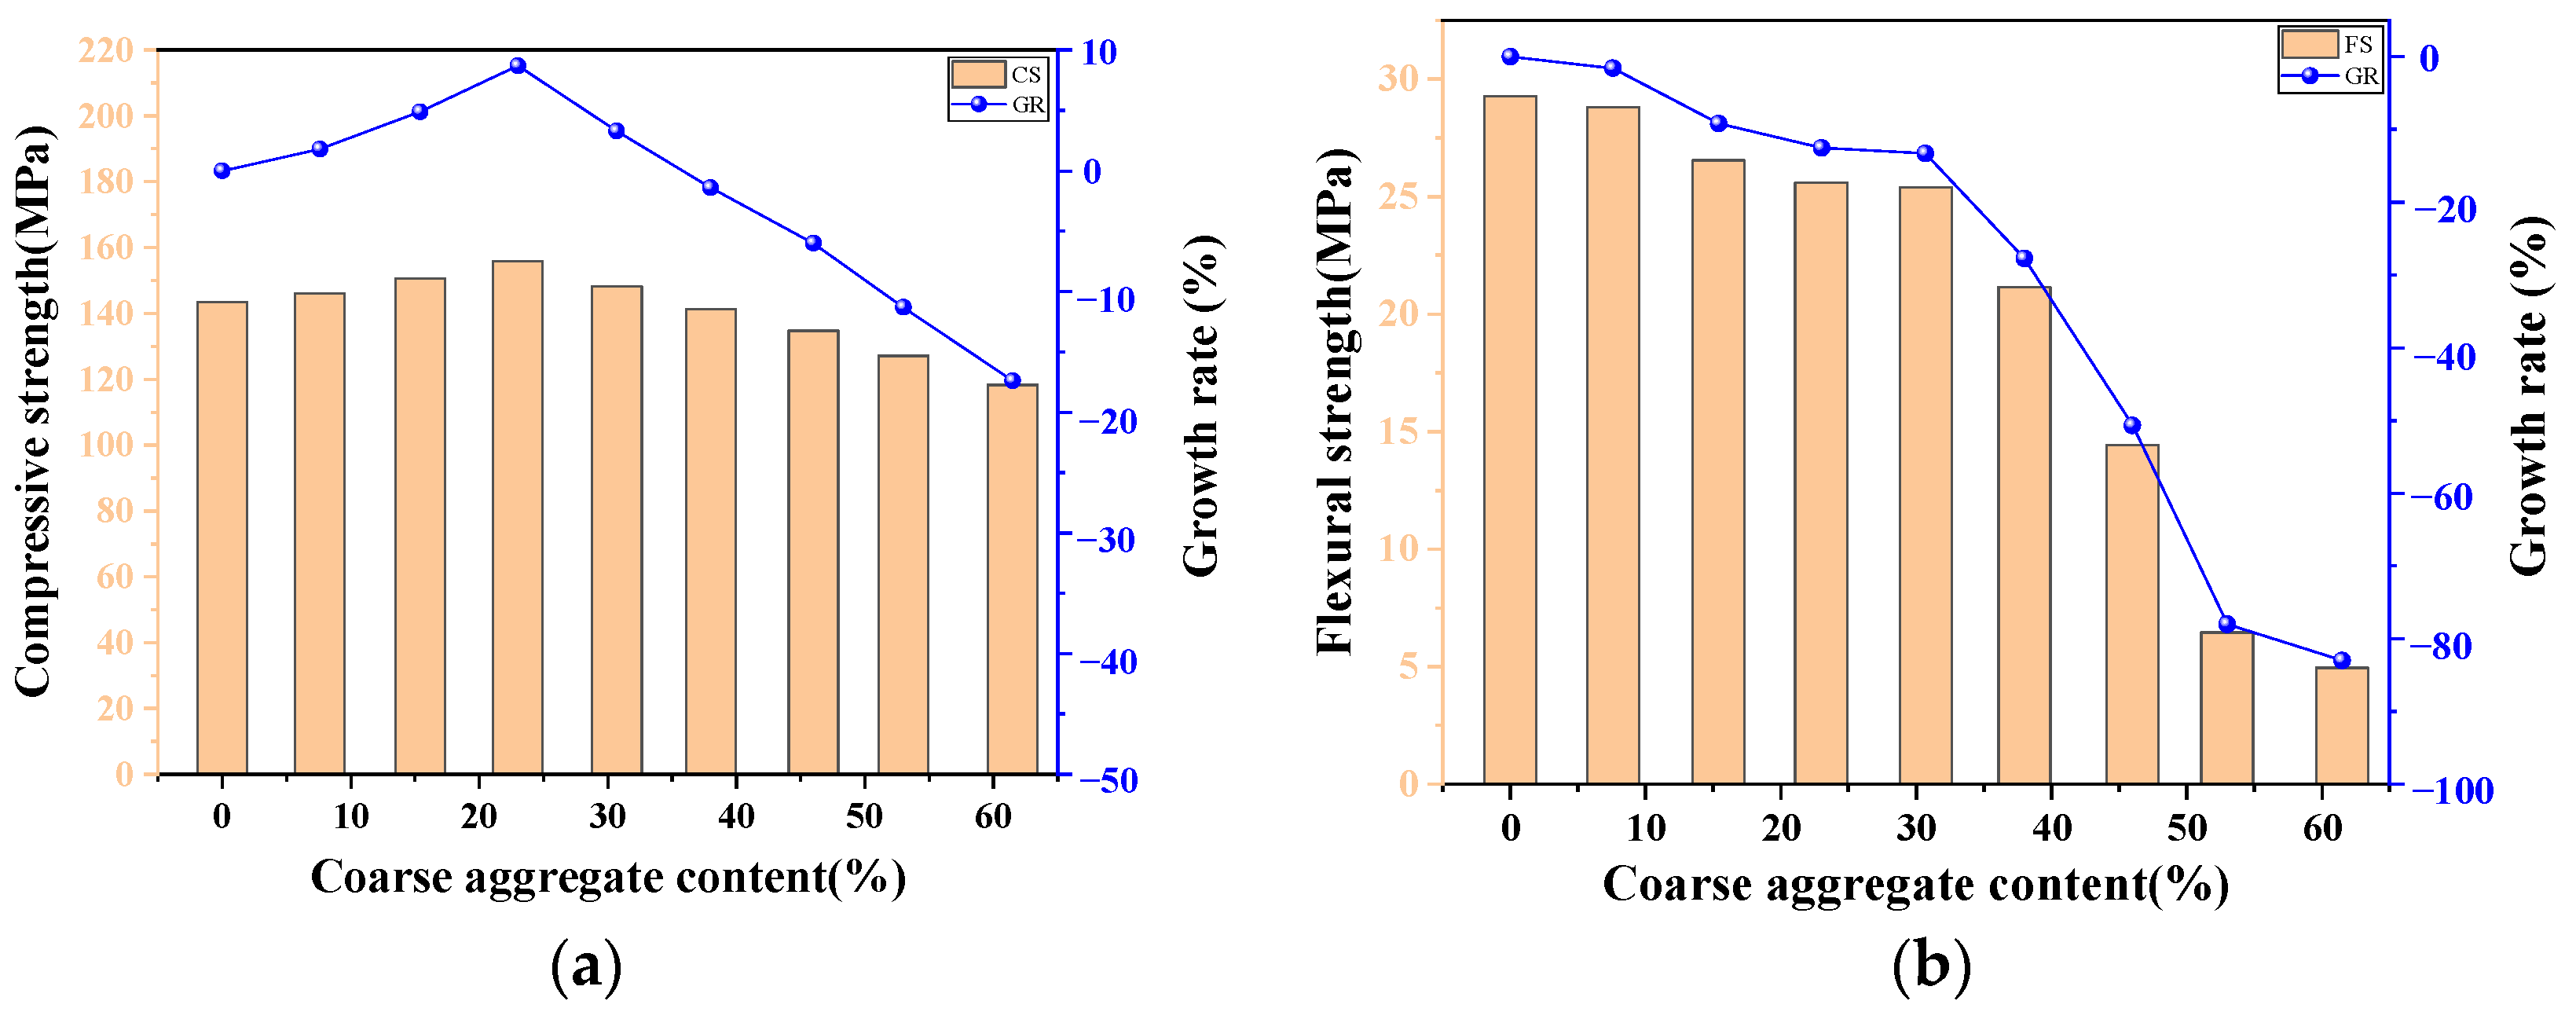
4.1. The Influence of Coarse Aggregate Content
4.2. The Influence of the Water–Binder Ratio
4.3. The Influence of Steel Fiber Volume Fraction
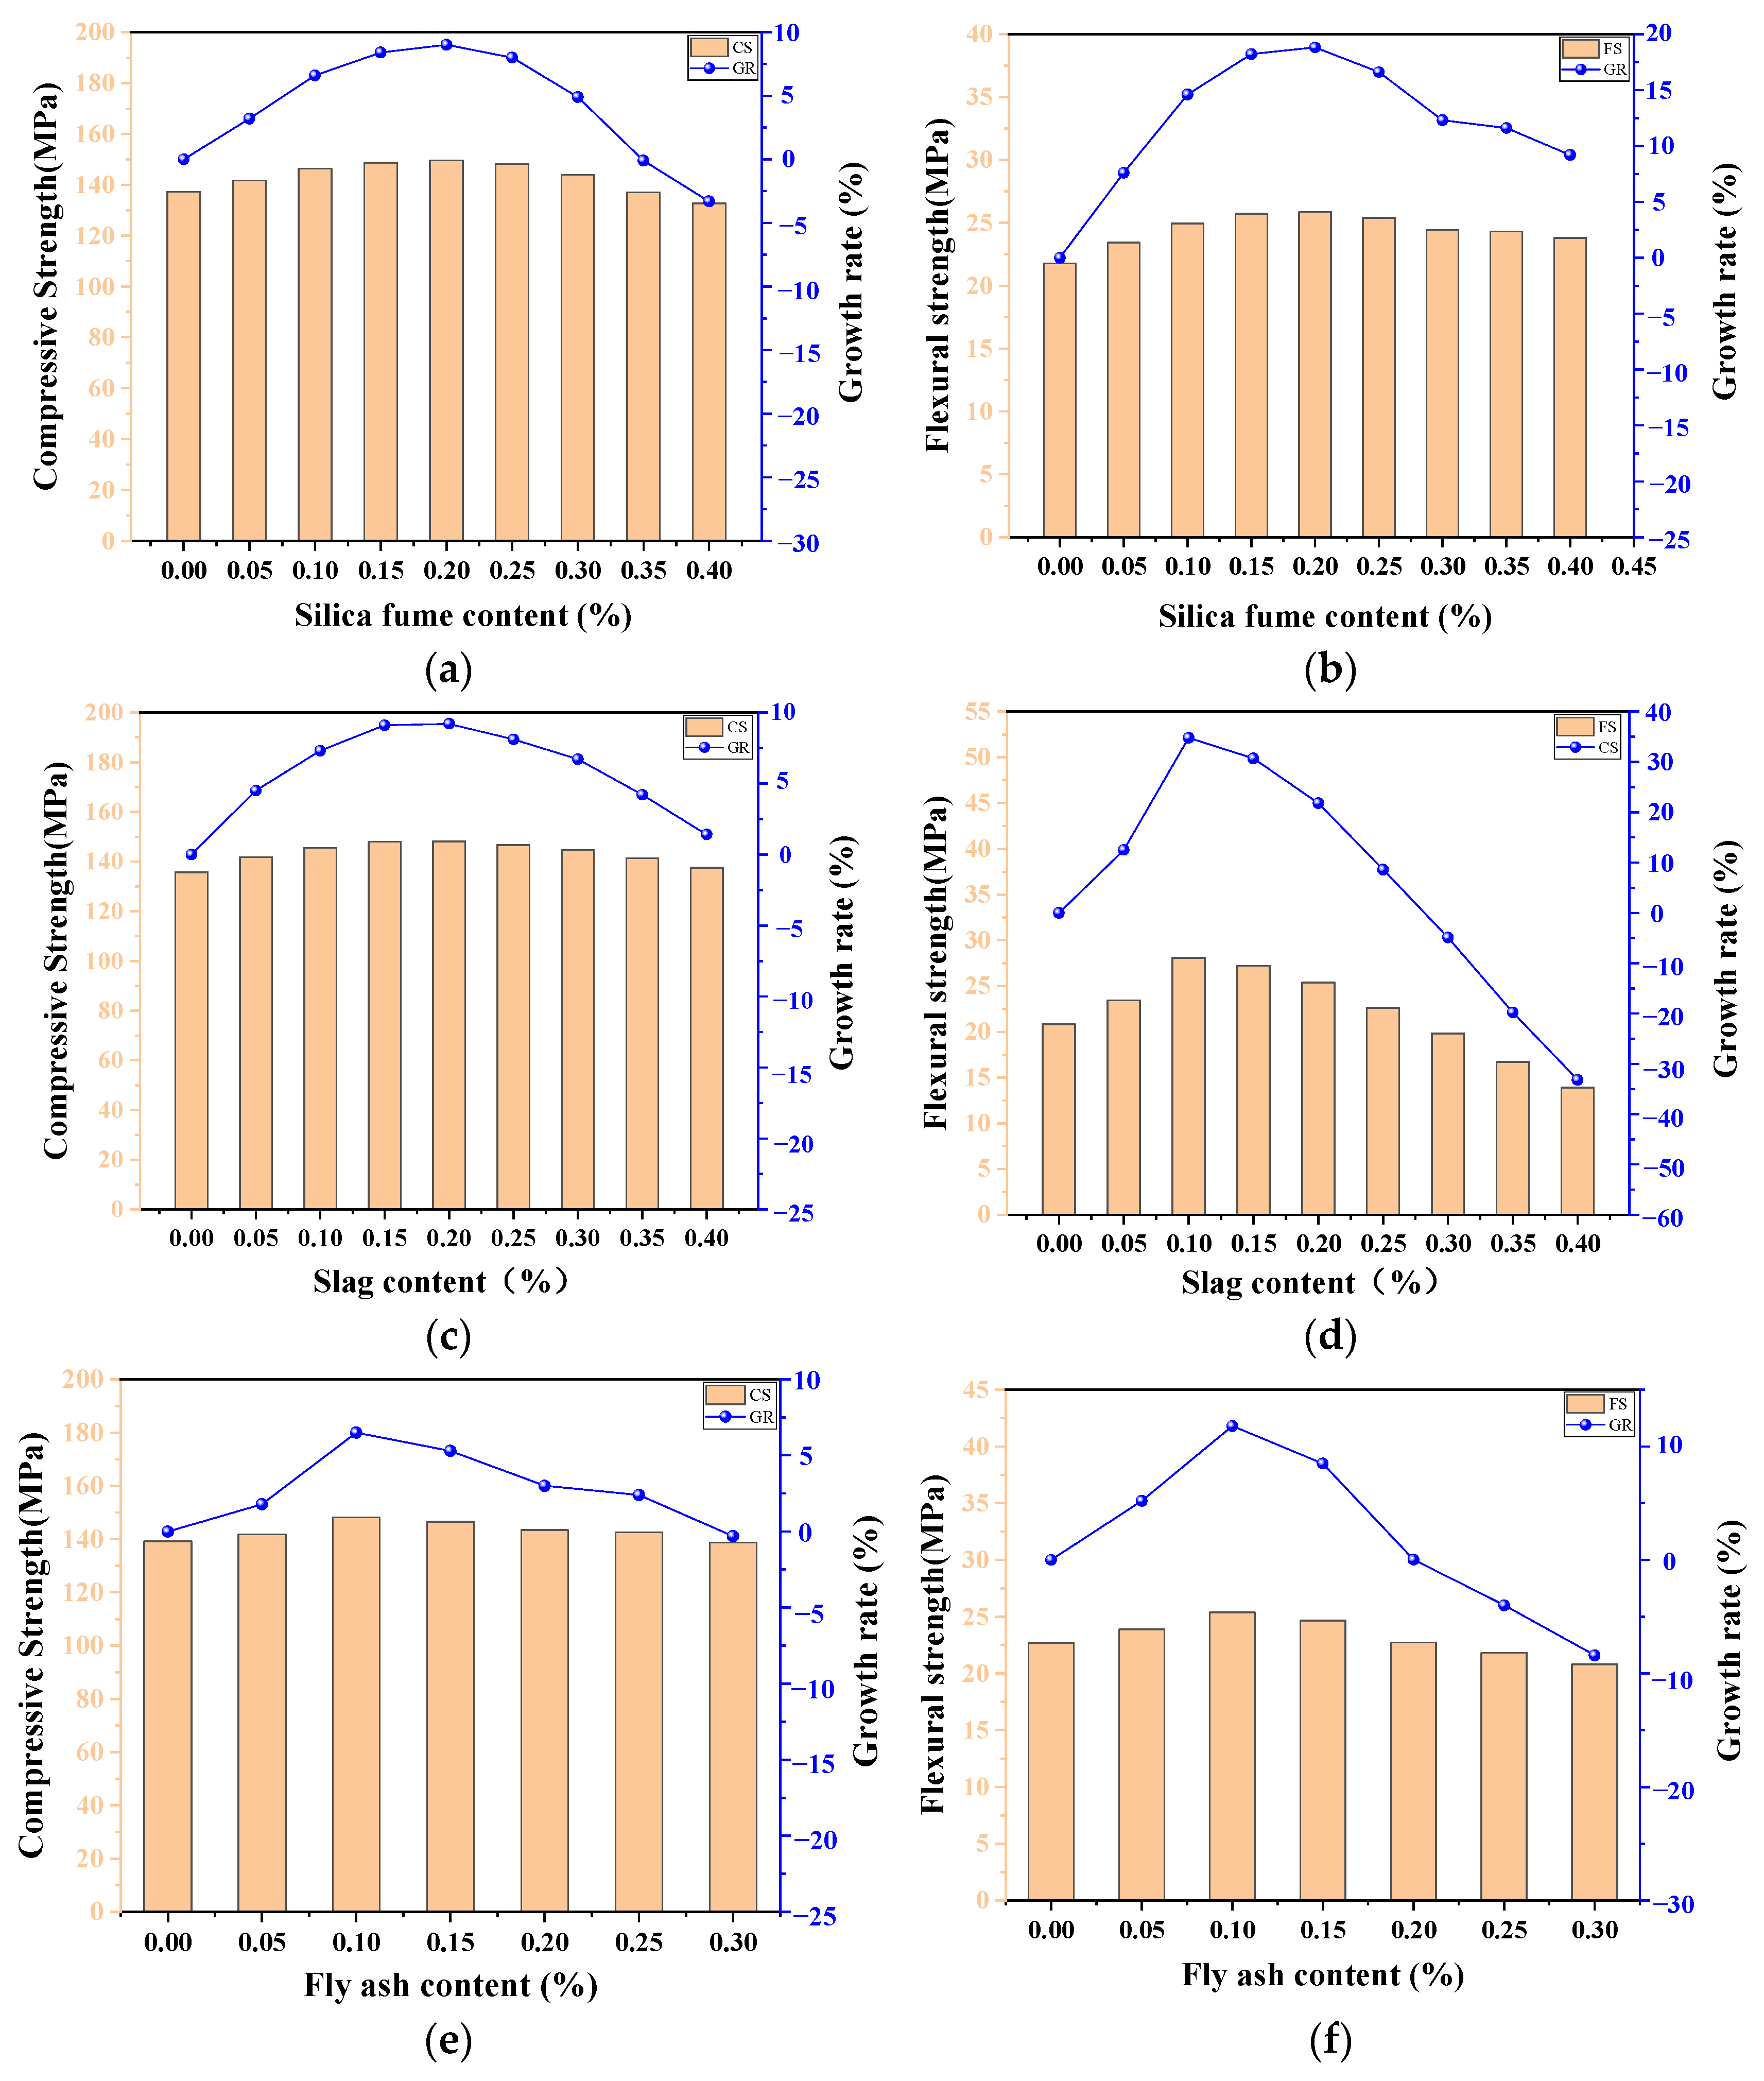
4.4. The Influence of Supplementary Cementitious Materials
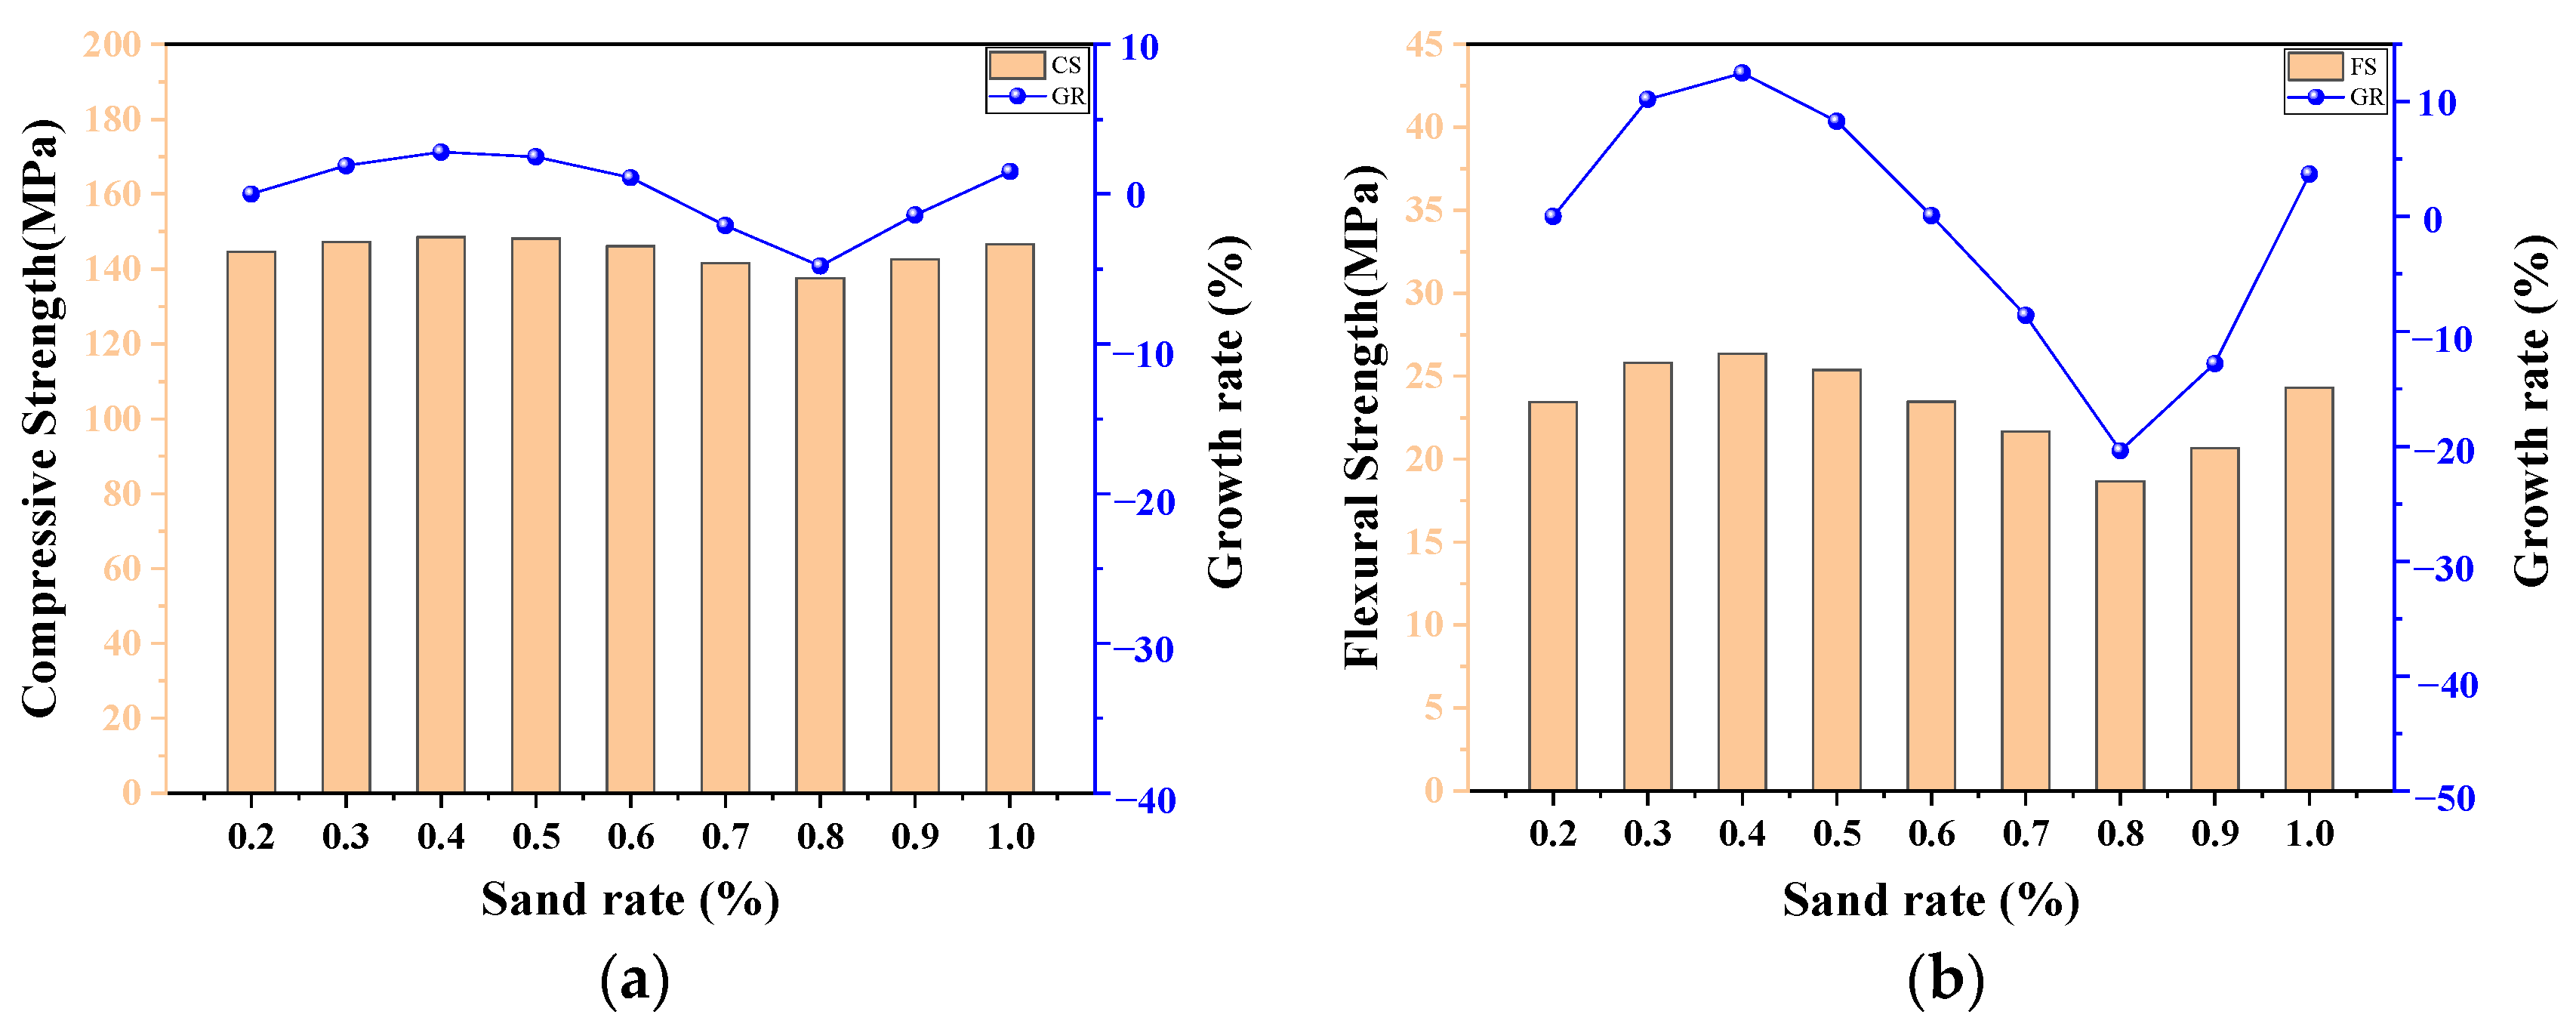
4.5. The Influence of the Sand Rate
5. Conclusions
- (1)
- Based on a process of trial and error, the BP-ANN models with 16 and 6 neurons in the hidden layer were selected as being optimal for predicting the CS and FS of UHPC-CA. The evaluated indices of the R2, MSE, MAPE, and IAE for the CS and FS prediction models were 0.91, 0.524, 0.023, and 0.018, and 0.96, 0.238, 0.08, and 0.064, respectively, demonstrating the higher accuracy and generality of the proposed ANN models.
- (2)
- As the mass fraction of coarse aggregates in UHPC-CA increased from 0 to 60%, the CS of the UHPC-CA exhibited a trend of first increasing and then decreasing. The CS reached a maximum value when the coarse aggregate content reached 23%. While there were no significant variations in the FS of UHPC-CA when the mass fraction of coarse aggregate increased from 0 to 30%, it exhibited a sharp decline with the increase in CA. Consequently, it can be concluded that the optimum mass fraction of UHPC-CA is about 23%.
- (3)
- When the water–binder ratio (w/b) increased from 0.10 to 0.28, both the CS and the FS of UHPC-CA presented a similar variation trend that was firstly improved (w/b = 0.1~1.18) and then decreased (w/b = 0.18~0.28). Meanwhile, it can be observed from the parametric analysis based on the ANN model that the addition of supplementary cementitious materials was beneficial to the strength of UHPC-CA within an appropriate range of the mass ratio between the admixtures and cements.
- (4)
- The incorporation of steel fiber is favorable for both the CS and the FS of UHPC-CA. However, when the steel fiber volume fraction increases to a certain value, the workability of UHPC-CA may be worse due to the fiber agglomeration, and the defects in the microstructure will be increased leading to a reduction in the growth rate of the CS and FS of UHPC-CA. The parametric analysis indicated that the optimal steel fiber volume fraction for UHPC-CA is about 1.5~2%.
- (5)
- An excessive or low value in the sand rate may have an adverse effect on the mechanical properties of UHPC-CA. Based on the predicted results from the ANN models, the FS and CS of UHPC-CA are the best when the sand rate is about 40%.
Author Contributions
Funding
Institutional Review Board Statement
Informed Consent Statement
Data Availability Statement
Conflicts of Interest
Appendix A

| No. | Ref. | Country | C (kg/m3) | SF (kg/m3) | Slag (kg/m3) | FA (kg/m3) | CA (kg/m3) | Vf (%) | W/B | SR (%) | CM | CT | CS (MPa) |
|---|---|---|---|---|---|---|---|---|---|---|---|---|---|
| 1 | [4] | China | 894.6 | 125.2 | 125.2 | 53.7 | 0 | 0 | 0.2 | 100 | SC | P.O 42.5 | 120 |
| 2 | 894.6 | 125.2 | 125.2 | 53.7 | 0 | 0.5 | 0.2 | 100 | SC | P.O 42.5 | 121 | ||
| 3 | 894.6 | 125.2 | 125.2 | 53.7 | 0 | 1 | 0.2 | 100 | SC | P.O 42.5 | 120 | ||
| 4 | 894.6 | 125.2 | 125.2 | 53.7 | 0 | 1.5 | 0.2 | 100 | SC | P.O 42.5 | 119.5 | ||
| 5 | 894.6 | 125.2 | 125.2 | 53.7 | 0 | 2 | 0.2 | 100 | SC | P.O 42.5 | 114 | ||
| 6 | 894.6 | 125.2 | 125.2 | 53.7 | 0 | 2.5 | 0.2 | 100 | SC | P.O 42.5 | 108 | ||
| 7 | 894.6 | 125.2 | 125.2 | 53.7 | 0 | 0.5 | 0.2 | 100 | SC | P.O 42.5 | 127.5 | ||
| 8 | 894.6 | 125.2 | 125.2 | 53.7 | 0 | 1 | 0.2 | 100 | SC | P.O 42.5 | 120 | ||
| 9 | 894.6 | 125.2 | 125.2 | 53.7 | 0 | 1.5 | 0.2 | 100 | SC | P.O 42.5 | 120 | ||
| 10 | 894.6 | 125.2 | 125.2 | 53.7 | 0 | 2 | 0.2 | 100 | SC | P.O 42.5 | 115 | ||
| 11 | 894.6 | 125.2 | 125.2 | 53.7 | 0 | 2.5 | 0.2 | 100 | SC | P.O 42.5 | 108 | ||
| 12 | 894.6 | 125.2 | 125.2 | 53.7 | 0 | 0.5 | 0.2 | 100 | SC | P.O 42.5 | 127.5 | ||
| 13 | 894.6 | 125.2 | 125.2 | 53.7 | 0 | 1 | 0.2 | 100 | SC | P.O 42.5 | 123 | ||
| 14 | 894.6 | 125.2 | 125.2 | 53.7 | 0 | 1.5 | 0.2 | 100 | SC | P.O 42.5 | 123 | ||
| 15 | 894.6 | 125.2 | 125.2 | 53.7 | 0 | 2 | 0.2 | 100 | SC | P.O 42.5 | 120 | ||
| 16 | 894.6 | 125.2 | 125.2 | 53.7 | 0 | 2.5 | 0.2 | 100 | SC | P.O 42.5 | 109 | ||
| 17 | [30] | China | 724.0 | 48.5 | 0 | 195.5 | 615.4 | 0 | 0.2 | 60 | SC | P.O 52.5 | 144 |
| 18 | 706.6 | 47.3 | 0 | 190.8 | 939.8 | 0 | 0.2 | 40 | SC | P.O 52.5 | 138 | ||
| 19 | 707.4 | 47.4 | 0 | 191.0 | 1252.1 | 0 | 0.2 | 20 | SC | P.O 52.5 | 132 | ||
| 20 | 671.2 | 45.0 | 0 | 181.2 | 892.7 | 0 | 0.2 | 45 | SC | P.O 52.5 | 137 | ||
| 21 | 634.0 | 42.5 | 0 | 171.2 | 841.4 | 0 | 0.2 | 50 | SC | P.O 52.5 | 143 | ||
| 22 | 586.4 | 39.3 | 0 | 158.3 | 809.2 | 0 | 0.2 | 54 | SC | P.O 52.5 | 136.25 | ||
| 23 | 724.1 | 48.5 | 0 | 195.5 | 1252.7 | 0 | 0.23 | 17 | SC | P.O 52.5 | 100 | ||
| 24 | 677.3 | 45.4 | 0 | 182.9 | 1205.5 | 0 | 0.23 | 24 | SC | P.O 52.5 | 113 | ||
| 25 | 636.1 | 42.6 | 0 | 171.8 | 1157.7 | 0 | 0.23 | 30 | SC | P.O 52.5 | 120 | ||
| 26 | 593.3 | 39.8 | 0 | 160.2 | 1103.6 | 0 | 0.23 | 36 | SC | P.O 52.5 | 135 | ||
| 27 | 556.7 | 37.3 | 0 | 150.3 | 1052.8 | 0 | 0.23 | 41 | SC | P.O 52.5 | 141 | ||
| 28 | 552.8 | 37.0 | 0 | 149.2 | 895.5 | 0 | 0.23 | 50 | SC | P.O 52.5 | 126 | ||
| 29 | [31] | Japan | 1058.8 | 264.7 | 0 | 0 | 0 | 0 | 0.16 | 100 | SC | P.O 42.5 | 150.64 |
| 30 | 1058.8 | 264.7 | 0 | 0 | 0 | 0 | 0.16 | 100 | SC | P.O 42.5 | 129.6 | ||
| 31 | 1058.8 | 264.7 | 0 | 0 | 0 | 0 | 0.16 | 100 | SC | P.O 42.5 | 121.25 | ||
| 32 | 1058.8 | 264.7 | 0 | 0 | 0 | 0 | 0.16 | 100 | SC | P.O 42.5 | 130.1 | ||
| 33 | 1058.8 | 264.7 | 0 | 0 | 0 | 0 | 0.16 | 100 | SC | P.O 42.5 | 133.3 | ||
| 34 | 1018.9 | 254.7 | 0 | 0 | 0 | 0 | 0.16 | 100 | SC | P.O 42.5 | 149.75 | ||
| 35 | 1018.9 | 254.7 | 0 | 0 | 0 | 0 | 0.16 | 100 | SC | P.O 42.5 | 153.1 | ||
| 36 | 1018.9 | 254.7 | 0 | 0 | 0 | 0 | 0.16 | 100 | SC | P.O 42.5 | 131.8 | ||
| 37 | 885.2 | 221.3 | 0 | 0 | 0 | 0 | 0.16 | 100 | SC | P.O 42.5 | 126.13 | ||
| 38 | 934.3 | 233.6 | 0 | 0 | 0 | 0 | 0.16 | 100 | SC | P.O 42.5 | 139.67 | ||
| 39 | 989.0 | 247.3 | 0 | 0 | 0 | 0 | 0.16 | 100 | SC | P.O 42.5 | 156.87 | ||
| 40 | 1050.6 | 262.6 | 0 | 0 | 0 | 0 | 0.16 | 100 | SC | P.O 42.5 | 142.4 | ||
| 41 | [32] | China | 935.5 | 308.7 | 0 | 0 | 0 | 0 | 0.17 | 100 | SC | P.O 42.5 | 105 |
| 42 | 935.5 | 308.7 | 0 | 0 | 0 | 1 | 0.17 | 100 | SC | P.O 42.5 | 130 | ||
| 43 | 935.5 | 308.7 | 0 | 0 | 0 | 2 | 0.17 | 100 | SC | P.O 42.5 | 148 | ||
| 44 | 935.5 | 308.7 | 0 | 0 | 0 | 3 | 0.17 | 100 | SC | P.O 42.5 | 160 | ||
| 45 | 935.5 | 308.7 | 0 | 0 | 0 | 1 | 0.17 | 100 | SC | P.O 42.5 | 131 | ||
| 46 | 935.5 | 308.7 | 0 | 0 | 0 | 2 | 0.17 | 100 | SC | P.O 42.5 | 150 | ||
| 47 | 935.5 | 308.7 | 0 | 0 | 0 | 3 | 0.17 | 100 | SC | P.O 42.5 | 162 | ||
| 48 | 935.5 | 308.7 | 0 | 0 | 0 | 1 | 0.17 | 100 | SC | P.O 42.5 | 145 | ||
| 49 | 935.5 | 308.7 | 0 | 0 | 0 | 2 | 0.17 | 100 | SC | P.O 42.5 | 160 | ||
| 50 | 935.5 | 308.7 | 0 | 0 | 0 | 3 | 0.17 | 100 | SC | P.O 42.5 | 167 | ||
| 51 | [33] | China | 767.3 | 184.1 | 0 | 237.9 | 0 | 0.24 | 0.18 | 100 | SC | P.O 52.5 | 105 |
| 52 | 630.3 | 145.0 | 0 | 195.4 | 466.4 | 0.28 | 0.18 | 70 | SC | P.O 52.5 | 125 | ||
| 53 | 515.5 | 118.6 | 0 | 159.8 | 881.6 | 0.33 | 0.18 | 50 | SC | P.O 52.5 | 135 | ||
| 54 | 430.8 | 99.1 | 0 | 133.6 | 1150.3 | 0.39 | 0.18 | 40 | SC | P.O 52.5 | 125 | ||
| 55 | 615.9 | 141.7 | 0 | 190.9 | 474.2 | 0.28 | 0.18 | 70 | SC | P.O 52.5 | 122 | ||
| 56 | 502.1 | 115.5 | 0 | 155.7 | 893.8 | 0.33 | 0.18 | 50 | SC | P.O 52.5 | 126 | ||
| 57 | 418.6 | 96.3 | 0 | 129.8 | 1163.6 | 0.39 | 0.18 | 40 | SC | P.O 52.5 | 125 | ||
| 58 | 640.2 | 147.3 | 0 | 198.5 | 461.0 | 0.28 | 0.18 | 70 | SC | P.O 52.5 | 119 | ||
| 59 | 523.5 | 120.4 | 0 | 162.3 | 874.3 | 0.33 | 0.18 | 50 | SC | P.O 52.5 | 122 | ||
| 60 | 437.8 | 100.7 | 0 | 135.7 | 1142.7 | 0.39 | 0.18 | 40 | SC | P.O 52.5 | 119 | ||
| 61 | 572.4 | 131.6 | 0 | 177.4 | 498.0 | 0.28 | 0.18 | 70 | SC | P.O 52.5 | 105 | ||
| 62 | 512.6 | 117.9 | 0 | 158.9 | 1061.1 | 0.33 | 0.18 | 40 | SC | P.O 52.5 | 117 | ||
| 63 | 425.5 | 97.9 | 0 | 131.9 | 1348.8 | 0.39 | 0.18 | 30 | SC | P.O 52.5 | 115 | ||
| 64 | [34] | Britain | 731.1 | 131.6 | 467.9 | 0.0 | 0 | 2 | 0.15 | 100 | SC | P.O 42.5 | 150.56 |
| 65 | 731.1 | 131.6 | 467.9 | 0.0 | 0 | 0 | 0.15 | 100 | SC | P.O 42.5 | 121.32 | ||
| 66 | [1] | China | 998.3 | 219.6 | 429.3 | 0.0 | 0 | 2 | 0.13 | 100 | HTC | P.O 52.5 | 169.3 |
| 67 | 887.3 | 195.2 | 381.5 | 0.0 | 292.8 | 2 | 0.13 | 72 | HTC | P.O 52.5 | 171.4 | ||
| 68 | 846.7 | 186.3 | 364.1 | 0.0 | 414.9 | 2 | 0.13 | 63 | HTC | P.O 52.5 | 175.1 | ||
| 69 | 805.3 | 177.2 | 346.3 | 0.0 | 515.4 | 2 | 0.13 | 57 | HTC | P.O 52.5 | 169.6 | ||
| 70 | 805.3 | 177.2 | 346.3 | 0.0 | 515.4 | 2 | 0.13 | 57 | HTC | P.O 52.5 | 172.5 | ||
| 71 | 763.1 | 167.9 | 328.2 | 0.0 | 625.8 | 2 | 0.13 | 51 | HTC | P.O 52.5 | 168.8 | ||
| 72 | 805.3 | 177.2 | 346.3 | 0.0 | 515.4 | 2 | 0.13 | 57 | HTC | P.O 52.5 | 183.4 | ||
| 73 | 805.3 | 177.2 | 346.3 | 0.0 | 515.4 | 2 | 0.13 | 57 | HTC | P.O 52.5 | 189.4 | ||
| 74 | [35] | China | 673.0 | 215.4 | 215.4 | 121.1 | 0 | 0.21 | 0.13 | 100 | SC | P.O 42.5 | 126 |
| 75 | 594.1 | 190.1 | 190.1 | 106.9 | 0 | 0.23 | 0.13 | 100 | SC | P.O 42.5 | 127 | ||
| 76 | 530.7 | 169.8 | 169.8 | 95.5 | 0 | 0.25 | 0.13 | 100 | SC | P.O 42.5 | 128 | ||
| 77 | 478.6 | 153.2 | 153.2 | 86.2 | 0 | 0.27 | 0.13 | 100 | SC | P.O 42.5 | 130.5 | ||
| 78 | 436.6 | 139.7 | 139.7 | 78.6 | 0 | 0.28 | 0.13 | 100 | SC | P.O 42.5 | 129 | ||
| 79 | 595.4 | 190.5 | 190.5 | 107.2 | 160.7 | 0.23 | 0.2 | 80 | SC | P.O 42.5 | 134 | ||
| 80 | 510.3 | 163.3 | 163.3 | 91.8 | 280.6 | 0.25 | 0.13 | 70 | SC | P.O 42.5 | 135.5 | ||
| 81 | 467.0 | 149.5 | 149.5 | 84.1 | 383.0 | 0.26 | 0.13 | 60 | SC | P.O 42.5 | 136.3 | ||
| 82 | 436.6 | 139.7 | 139.7 | 78.6 | 475.9 | 0.28 | 0.13 | 50 | SC | P.O 42.5 | 134.5 | ||
| 83 | [2] | China | 796.2 | 246.8 | 0.0 | 183.1 | 0.0 | 1.28 | 0.15 | 100 | HTC | P.O 42.5 | 124.5 |
| 84 | 851.5 | 264.0 | 0.0 | 195.8 | 119.2 | 1.28 | 0.15 | 90 | HTC | P.O 42.5 | 125 | ||
| 85 | 590.7 | 183.1 | 0.0 | 135.9 | 165.4 | 1.28 | 0.15 | 90 | HTC | P.O 42.5 | 127.5 | ||
| 86 | 688.6 | 213.5 | 0.0 | 158.4 | 296.1 | 1.28 | 0.15 | 80 | HTC | P.O 42.5 | 128.5 | ||
| 87 | 735.5 | 228.0 | 0.0 | 169.2 | 419.2 | 1.28 | 0.15 | 70 | HTC | P.O 42.5 | 126 | ||
| 88 | 652.5 | 202.3 | 0.0 | 150.1 | 463.3 | 1.28 | 0.15 | 70 | HTC | P.O 42.5 | 122 | ||
| 89 | [36] | China | 521.2 | 260.6 | 0.0 | 260.6 | 0 | 0 | 0.19 | 100 | HTC | P.O 42.5 | 103.9 |
| 90 | 521.2 | 260.6 | 0.0 | 260.6 | 0 | 1 | 0.19 | 100 | HTC | P.O 42.5 | 116.7 | ||
| 91 | 521.2 | 260.6 | 0.0 | 260.6 | 0 | 1.5 | 0.19 | 100 | HTC | P.O 42.5 | 120.2 | ||
| 92 | 521.2 | 260.6 | 0.0 | 260.6 | 0 | 2 | 0.19 | 100 | HTC | P.O 42.5 | 123.7 | ||
| 93 | [37] | China | 769.5 | 123.1 | 0.0 | 0.0 | 977.3 | 0 | 0.2 | 40 | SC | P.O 52.5 | 110 |
| 94 | 816.0 | 130.6 | 0.0 | 0.0 | 938.4 | 1 | 0.2 | 40 | SC | P.O 52.5 | 140 | ||
| 95 | 868.5 | 139.0 | 0.0 | 0.0 | 894.6 | 2 | 0.2 | 40 | SC | P.O 52.5 | 152 | ||
| 96 | 916.3 | 137.4 | 0.0 | 0.0 | 861.3 | 3 | 0.2 | 40 | SC | P.O 52.5 | 163 | ||
| 97 | 969.6 | 135.7 | 0.0 | 0.0 | 824.2 | 4 | 0.2 | 40 | SC | P.O 52.5 | 167 | ||
| 98 | 871.9 | 130.8 | 0.0 | 0.0 | 898.1 | 2 | 0.2 | 40 | SC | P.O 52.5 | 158 | ||
| 99 | 871.9 | 130.8 | 0.0 | 0.0 | 898.1 | 2 | 0.2 | 40 | SC | P.O 52.5 | 160 | ||
| 100 | 871.9 | 130.8 | 0.0 | 0.0 | 898.1 | 2 | 0.2 | 40 | SC | P.O 52.5 | 159.5 | ||
| 101 | 871.9 | 130.8 | 0.0 | 0.0 | 898.1 | 2 | 0.2 | 40 | SC | P.O 52.5 | 145 | ||
| 102 | 871.9 | 130.8 | 0.0 | 0.0 | 898.1 | 2 | 0.2 | 40 | SC | P.O 52.5 | 139 | ||
| 103 | [38] | China | 1000.7 | 250.2 | 200.1 | 100.1 | 0.0 | 2 | 0.16 | 100 | HTC | P.O 42.5 | 173.4 |
| 104 | 931.7 | 232.9 | 186.3 | 93.2 | 205.0 | 2 | 0.16 | 80 | HTC | P.O 42.5 | 177.4 | ||
| 105 | 818.7 | 204.7 | 163.7 | 81.9 | 368.4 | 2 | 0.16 | 70 | HTC | P.O 42.5 | 180.1 | ||
| 106 | 777.4 | 194.4 | 155.5 | 77.7 | 520.9 | 2 | 0.16 | 60 | HTC | P.O 42.5 | 178.2 | ||
| 107 | 750.4 | 187.6 | 150.1 | 75.0 | 675.4 | 2 | 0.16 | 50 | HTC | P.O 42.5 | 167.3 | ||
| 108 | 818.7 | 204.7 | 163.7 | 81.9 | 491.2 | 2 | 0.16 | 60 | HTC | P.O 42.5 | 151.9 | ||
| 109 | 862.3 | 215.6 | 172.5 | 86.2 | 344.9 | 2 | 0.16 | 70 | HTC | P.O 42.5 | 175.3 | ||
| 110 | 862.3 | 215.6 | 172.5 | 86.2 | 344.9 | 2 | 0.16 | 70 | HTC | P.O 42.5 | 173.1 | ||
| 111 | 862.3 | 215.6 | 172.5 | 86.2 | 344.9 | 2 | 0.16 | 70 | HTC | P.O 42.5 | 178.7 | ||
| 112 | 862.3 | 215.6 | 172.5 | 86.2 | 344.9 | 2 | 0.16 | 70 | HTC | P.O 42.5 | 181.2 | ||
| 113 | 965.0 | 241.2 | 193.0 | 96.5 | 193.0 | 2 | 0.16 | 80 | HTC | P.O 42.5 | 176.3 | ||
| 114 | 1000.7 | 250.2 | 200.1 | 100.1 | 0 | 2 | 0.16 | 100 | HTC | P.O 42.5 | 172.5 | ||
| 115 | [39] | China | 998.3 | 219.6 | 429.3 | 0 | 0 | 2 | 0.13 | 100 | SC | P.O 52.5 | 153.6 |
| 116 | 871.6 | 191.7 | 374.8 | 0 | 322.5 | 2 | 0.13 | 70 | SC | P.O 52.5 | 160.6 | ||
| 117 | 833.5 | 183.4 | 358.4 | 0 | 458.4 | 2 | 0.13 | 60 | SC | P.O 52.5 | 156.7 | ||
| 118 | 757.5 | 166.6 | 325.7 | 0 | 515.1 | 2 | 0.13 | 60 | SC | P.O 52.5 | 159.4 | ||
| 119 | 757.5 | 166.6 | 325.7 | 0 | 515.1 | 2.5 | 0.13 | 60 | SC | P.O 52.5 | 154.1 | ||
| 120 | 757.5 | 166.6 | 325.7 | 0 | 515.1 | 1 | 0.13 | 60 | SC | P.O 52.5 | 149.4 | ||
| 121 | 770.4 | 169.5 | 331.3 | 0 | 631.8 | 2 | 0.13 | 50 | SC | P.O 52.5 | 148.6 | ||
| 122 | [40] | China | 600.0 | 120.0 | 78.0 | 0 | 1242.0 | 2 | 0.16 | 30 | HTC | P.O 42.5 | 175 |
| 123 | 638.5 | 127.7 | 83.0 | 0 | 1200.4 | 2 | 0.16 | 30 | HTC | P.O 42.5 | 180 | ||
| 124 | 679.9 | 136.0 | 88.4 | 0 | 1155.8 | 2 | 0.16 | 30 | HTC | P.O 42.5 | 185 | ||
| 125 | 638.5 | 127.7 | 83.0 | 0 | 1200.4 | 2 | 0.16 | 30 | HTC | P.O 42.5 | 190 | ||
| 126 | 638.5 | 127.7 | 83.0 | 0 | 1200.4 | 2 | 0.16 | 30 | HTC | P.O 42.5 | 187 | ||
| 127 | [41] | China | 671.4 | 214.9 | 214.9 | 120.9 | 0 | 0.15 | 0.16 | 100 | SC | P.O 42.5 | 132 |
| 128 | 671.4 | 214.9 | 214.9 | 120.9 | 0 | 0.15 | 0.16 | 100 | SC | P.O 42.5 | 129 | ||
| 129 | 671.9 | 215.0 | 215.0 | 121.0 | 551.0 | 0.15 | 0.16 | 57 | SC | P.O 42.5 | 135 | ||
| 130 | 471.9 | 151.0 | 151.0 | 84.9 | 901.4 | 0.15 | 0.2 | 46 | SC | P.O 42.5 | 138 |
| No. | Ref. | Country | C (kg/m3) | SF (kg/m3) | Slag (kg/m3) | FA (kg/m3) | CA (kg/m3) | Vf (%) | W/B | SR (%) | CM | CT | FS (MPa) |
|---|---|---|---|---|---|---|---|---|---|---|---|---|---|
| 1 | [4] | China | 894.6 | 125.2 | 125.2 | 53.7 | 0.0 | 0 | 0.2 | 100 | SC | P.O 42.5 | 20 |
| 2 | 894.6 | 125.2 | 125.2 | 53.7 | 0.0 | 0.5 | 0.2 | 100 | SC | P.O 42.5 | 20.5 | ||
| 3 | 894.6 | 125.2 | 125.2 | 53.7 | 0.0 | 1 | 0.2 | 100 | SC | P.O 42.5 | 21.8 | ||
| 4 | 894.6 | 125.2 | 125.2 | 53.7 | 0.0 | 1.5 | 0.2 | 100 | SC | P.O 42.5 | 22.2 | ||
| 5 | 894.6 | 125.2 | 125.2 | 53.7 | 0.0 | 2 | 0.2 | 100 | SC | P.O 42.5 | 23 | ||
| 6 | 894.6 | 125.2 | 125.2 | 53.7 | 0.0 | 2.5 | 0.2 | 100 | SC | P.O 42.5 | 24 | ||
| 7 | 894.6 | 125.2 | 125.2 | 53.7 | 0.0 | 0.5 | 0.2 | 100 | SC | P.O 42.5 | 20.2 | ||
| 8 | 894.6 | 125.2 | 125.2 | 53.7 | 0.0 | 1 | 0.2 | 100 | SC | P.O 42.5 | 22 | ||
| 9 | 894.6 | 125.2 | 125.2 | 53.7 | 0.0 | 1.5 | 0.2 | 100 | SC | P.O 42.5 | 23 | ||
| 10 | 894.6 | 125.2 | 125.2 | 53.7 | 0.0 | 2 | 0.2 | 100 | SC | P.O 42.5 | 24 | ||
| 11 | 894.6 | 125.2 | 125.2 | 53.7 | 0.0 | 2.5 | 0.2 | 100 | SC | P.O 42.5 | 24.5 | ||
| 12 | 894.6 | 125.2 | 125.2 | 53.7 | 0.0 | 0.5 | 0.2 | 100 | SC | P.O 42.5 | 23 | ||
| 13 | 894.6 | 125.2 | 125.2 | 53.7 | 0.0 | 1 | 0.2 | 100 | SC | P.O 42.5 | 23.5 | ||
| 14 | 894.6 | 125.2 | 125.2 | 53.7 | 0.0 | 1.5 | 0.2 | 100 | SC | P.O 42.5 | 24 | ||
| 15 | 894.6 | 125.2 | 125.2 | 53.7 | 0.0 | 2 | 0.2 | 100 | SC | P.O 42.5 | 24.2 | ||
| 16 | 894.6 | 125.2 | 125.2 | 53.7 | 0.0 | 2.5 | 0.2 | 100 | SC | P.O 42.5 | 25 | ||
| 17 | [30] | China | 724.0 | 48.5 | 0.0 | 195.5 | 615.4 | 0 | 0.2 | 60 | SC | P.O 52.5 | 8.5 |
| 18 | 706.6 | 47.3 | 0.0 | 190.8 | 939.8 | 0 | 0.2 | 40 | SC | P.O 52.5 | 7.8 | ||
| 19 | 707.4 | 47.4 | 0.0 | 191.0 | 1252.1 | 0 | 0.2 | 20 | SC | P.O 52.5 | 8 | ||
| 20 | 671.2 | 45.0 | 0.0 | 181.2 | 892.7 | 0 | 0.2 | 45 | SC | P.O 52.5 | 9 | ||
| 21 | 634.0 | 42.5 | 0.0 | 171.2 | 841.4 | 0 | 0.2 | 50 | SC | P.O 52.5 | 9 | ||
| 22 | 586.4 | 39.3 | 0.0 | 158.3 | 809.2 | 0 | 0.2 | 54 | SC | P.O 52.5 | 8 | ||
| 23 | 724.1 | 48.5 | 0.0 | 195.5 | 1252.7 | 0 | 0.23 | 17 | SC | P.O 52.5 | 5.5 | ||
| 24 | 677.3 | 45.4 | 0.0 | 182.9 | 1205.5 | 0 | 0.23 | 24 | SC | P.O 52.5 | 6 | ||
| 25 | 636.1 | 42.6 | 0.0 | 171.8 | 1157.7 | 0 | 0.23 | 30 | SC | P.O 52.5 | 7 | ||
| 26 | 593.3 | 39.8 | 0.0 | 160.2 | 1103.6 | 0 | 0.23 | 36 | SC | P.O 52.5 | 7.5 | ||
| 27 | 556.7 | 37.3 | 0.0 | 150.3 | 1052.8 | 0 | 0.23 | 41 | SC | P.O 52.5 | 7.5 | ||
| 28 | 552.8 | 37.0 | 0.0 | 149.2 | 895.5 | 0 | 0.23 | 50 | SC | P.O 52.5 | 8 | ||
| 29 | [34] | Britain | 731.1 | 131.6 | 467.9 | 0.0 | 0.0 | 2 | 0.15 | 100 | SC | P.O 42.5 | 9.07 |
| 30 | 731.1 | 131.6 | 467.9 | 0.0 | 0.0 | 0 | 0.15 | 100 | SC | P.O 42.5 | 5.36 | ||
| 31 | [1] | China | 998.3 | 219.6 | 429.3 | 0.0 | 0.0 | 2 | 0.13 | 100 | HTC | P.O 52.5 | 31.4 |
| 32 | 887.3 | 195.2 | 381.5 | 0.0 | 292.8 | 2 | 0.13 | 72 | HTC | P.O 52.5 | 30.9 | ||
| 33 | 846.7 | 186.3 | 364.1 | 0.0 | 414.9 | 2 | 0.13 | 63 | HTC | P.O 52.5 | 28.7 | ||
| 34 | 805.3 | 177.2 | 346.3 | 0.0 | 515.4 | 2 | 0.13 | 57 | HTC | P.O 52.5 | 24.5 | ||
| 35 | 805.3 | 177.2 | 346.3 | 0.0 | 515.4 | 2 | 0.13 | 57 | HTC | P.O 52.5 | 26.3 | ||
| 36 | 763.1 | 167.9 | 328.2 | 0.0 | 625.8 | 2 | 0.13 | 51 | HTC | P.O 52.5 | 22.1 | ||
| 37 | 805.3 | 177.2 | 346.3 | 0.0 | 515.4 | 2 | 0.13 | 57 | HTC | P.O 52.5 | 28.3 | ||
| 38 | 805.3 | 177.2 | 346.3 | 0.0 | 515.4 | 2 | 0.13 | 57 | HTC | P.O 52.5 | 29.7 | ||
| 39 | [35] | China | 673.0 | 215.4 | 215.4 | 121.1 | 0.0 | 0.21 | 0.13 | 100 | SC | P.O 42.5 | 26.2 |
| 40 | 594.1 | 190.1 | 190.1 | 106.9 | 0.0 | 0.23 | 0.13 | 100 | SC | P.O 42.5 | 26.7 | ||
| 41 | 530.7 | 169.8 | 169.8 | 95.5 | 0.0 | 0.25 | 0.15 | 100 | SC | P.O 42.5 | 26.4 | ||
| 42 | 478.6 | 153.2 | 153.2 | 86.2 | 0.0 | 0.27 | 0.15 | 100 | SC | P.O 42.5 | 26 | ||
| 43 | 436.6 | 139.7 | 139.7 | 78.6 | 0.0 | 0.28 | 0.13 | 100 | SC | P.O 42.5 | 23.5 | ||
| 44 | 595.4 | 190.5 | 190.5 | 107.2 | 160.7 | 0.23 | 0.13 | 80 | SC | P.O 42.5 | 27.5 | ||
| 45 | 510.3 | 163.3 | 163.3 | 91.8 | 280.6 | 0.25 | 0.23 | 70 | SC | P.O 42.5 | 27.1 | ||
| 46 | 467.0 | 149.5 | 149.5 | 84.1 | 383.0 | 0.26 | 0.13 | 60 | SC | P.O 42.5 | 25.4 | ||
| 47 | 436.6 | 139.7 | 139.7 | 78.6 | 475.9 | 0.28 | 0.15 | 50 | SC | P.O 42.5 | 20.9 | ||
| 48 | [2] | China | 796.2 | 246.8 | 0.0 | 183.1 | 0.0 | 1.28 | 0.15 | 100 | HTC | P.O 42.5 | 18.4 |
| 49 | 851.5 | 264.0 | 0.0 | 195.8 | 119.2 | 1.28 | 0.15 | 90 | HTC | P.O 42.5 | 19.5 | ||
| 50 | 590.7 | 183.1 | 0.0 | 135.9 | 165.4 | 1.28 | 0.15 | 90 | HTC | P.O 42.5 | 18.6 | ||
| 51 | 688.6 | 213.5 | 0.0 | 158.4 | 296.1 | 1.28 | 0.15 | 80 | HTC | P.O 42.5 | 18.7 | ||
| 52 | 735.5 | 228.0 | 0.0 | 169.2 | 419.2 | 1.28 | 0.15 | 70 | HTC | P.O 42.5 | 19.3 | ||
| 53 | 652.5 | 202.3 | 0.0 | 150.1 | 463.3 | 1.28 | 0.15 | 70 | HTC | P.O 42.5 | 18.1 | ||
| 54 | [36] | China | 521.2 | 260.6 | 0.0 | 260.6 | 0.0 | 0 | 0.19 | 100 | HTC | P.O 42.5 | 10.5 |
| 55 | 521.2 | 260.6 | 0.0 | 260.6 | 0.0 | 1 | 0.19 | 100 | HTC | P.O 42.5 | 16.7 | ||
| 56 | 521.2 | 260.6 | 0.0 | 260.6 | 0.0 | 1.5 | 0.19 | 100 | HTC | P.O 42.5 | 23.1 | ||
| 57 | 521.2 | 260.6 | 0.0 | 260.6 | 0.0 | 2 | 0.19 | 100 | HTC | P.O 42.5 | 23.8 | ||
| 58 | [37] | China | 769.5 | 123.1 | 0.0 | 0.0 | 977.3 | 0 | 0.2 | 40 | SC | P.O 52.5 | 23 |
| 59 | 816.0 | 130.6 | 0.0 | 0.0 | 938.4 | 1 | 0.2 | 40 | SC | P.O 52.5 | 24 | ||
| 60 | 868.5 | 139.0 | 0.0 | 0.0 | 894.6 | 2 | 0.2 | 40 | SC | P.O 52.5 | 37 | ||
| 61 | 916.3 | 137.4 | 0.0 | 0.0 | 861.3 | 3 | 0.2 | 40 | SC | P.O 52.5 | 42 | ||
| 62 | 969.6 | 135.7 | 0.0 | 0.0 | 824.2 | 4 | 0.2 | 40 | SC | P.O 52.5 | 35 | ||
| 63 | 871.9 | 130.8 | 0.0 | 0.0 | 898.1 | 2 | 0.2 | 40 | SC | P.O 52.5 | 40 | ||
| 64 | 871.9 | 130.8 | 0.0 | 0.0 | 898.1 | 2 | 0.2 | 40 | SC | P.O 52.5 | 40 | ||
| 65 | 871.9 | 130.8 | 0.0 | 0.0 | 898.1 | 2 | 0.2 | 40 | SC | P.O 52.5 | 43 | ||
| 66 | 871.9 | 130.8 | 0.0 | 0.0 | 898.1 | 2 | 0.2 | 40 | SC | P.O 52.5 | 40 | ||
| 67 | 871.9 | 130.8 | 0.0 | 0.0 | 898.1 | 2 | 0.2 | 40 | SC | P.O 52.5 | 42 | ||
| 68 | [38] | China | 1000.7 | 250.2 | 200.1 | 100.1 | 0.0 | 2 | 0.16 | 100 | HTC | P.O 42.5 | 36.25 |
| 69 | 931.7 | 232.9 | 186.3 | 93.2 | 205.0 | 2 | 0.16 | 80 | HTC | P.O 42.5 | 36.45 | ||
| 70 | 818.7 | 204.7 | 163.7 | 81.9 | 368.4 | 2 | 0.16 | 70 | HTC | P.O 42.5 | 36.34 | ||
| 71 | 777.4 | 194.4 | 155.5 | 77.7 | 520.9 | 2 | 0.16 | 60 | HTC | P.O 42.5 | 32.22 | ||
| 72 | 750.4 | 187.6 | 150.1 | 75.0 | 675.4 | 2 | 0.16 | 50 | HTC | P.O 42.5 | 29.7 | ||
| 73 | 818.7 | 204.7 | 163.7 | 81.9 | 491.2 | 2 | 0.16 | 60 | HTC | P.O 42.5 | 22.75 | ||
| 74 | 862.3 | 215.6 | 172.5 | 86.2 | 344.9 | 2 | 0.16 | 70 | HTC | P.O 42.5 | 25.7 | ||
| 75 | 862.3 | 215.6 | 172.5 | 86.2 | 344.9 | 2 | 0.16 | 70 | HTC | P.O 42.5 | 27.8 | ||
| 76 | 862.3 | 215.6 | 172.5 | 86.2 | 344.9 | 2 | 0.16 | 70 | HTC | P.O 42.5 | 31.4 | ||
| 77 | 862.3 | 215.6 | 172.5 | 86.2 | 344.9 | 2 | 0.16 | 70 | HTC | P.O 42.5 | 34.1 | ||
| 78 | 965.0 | 241.2 | 193.0 | 96.5 | 193.0 | 2 | 0.16 | 80 | HTC | P.O 42.5 | 28.7 | ||
| 79 | 1000.7 | 250.2 | 200.1 | 100.1 | 0.0 | 2 | 0.16 | 100 | HTC | P.O 42.5 | 32.2 | ||
| 80 | [39] | China | 998.3 | 219.6 | 429.3 | 0.0 | 0.0 | 2 | 0.13 | 100 | SC | P.O 52.5 | 20.8 |
| 81 | 871.6 | 191.7 | 374.8 | 0.0 | 322.5 | 2 | 0.13 | 70 | SC | P.O 52.5 | 18 | ||
| 82 | 833.5 | 183.4 | 358.4 | 0.0 | 458.4 | 2 | 0.13 | 60 | SC | P.O 52.5 | 17.8 | ||
| 83 | 757.5 | 166.6 | 325.7 | 0.0 | 515.1 | 2 | 0.13 | 60 | SC | P.O 52.5 | 17.1 | ||
| 84 | 757.5 | 166.6 | 325.7 | 0.0 | 515.1 | 2.5 | 0.13 | 60 | SC | P.O 52.5 | 17.5 | ||
| 85 | 757.5 | 166.6 | 325.7 | 0.0 | 515.1 | 1 | 0.13 | 60 | SC | P.O 52.5 | 19.5 | ||
| 86 | 770.4 | 169.5 | 331.3 | 0.0 | 631.8 | 2 | 0.13 | 50 | SC | P.O 52.5 | 16.4 | ||
| 87 | [41] | China | 671.4 | 214.9 | 214.9 | 120.9 | 0.0 | 0.15 | 0.16 | 100 | SC | P.O 42.5 | 29.42 |
| 88 | 671.4 | 214.9 | 214.9 | 120.9 | 0.0 | 0.15 | 0.16 | 100 | SC | P.O 42.5 | 26.36 | ||
| 89 | 671.9 | 215.0 | 215.0 | 121.0 | 551.0 | 0.15 | 0.16 | 57 | SC | P.O 42.5 | 22.37 | ||
| 90 | 471.9 | 151.0 | 151.0 | 84.9 | 901.4 | 0.15 | 0.2 | 46 | SC | P.O 42.5 | 16.86 |
References
- Yin, H.; Shirai, K.; Teo, W. Finite element modelling to predict the flexural behaviour of ultra-high performance concrete members. Eng. Struct. 2019, 183, 741–755. [Google Scholar] [CrossRef]
- Wu, F.; Xu, L.; Chi, Y.; Zeng, Y.; Deng, F.; Chen, Q. Compressive and flexural properties of ultra-high performance fiber-reinforced cementitious composite: The effect of coarse aggregate. Compos. Struct. 2020, 236, 111810. [Google Scholar] [CrossRef]
- Dong, E.; Fu, S.; Wu, C.; Lv, W.; Liu, X.; Zhang, L.; Feng, Y.; Shui, Z.; Yu, R. Value-added utilization of phosphogypsum industrial by-products in producing green Ultra-High performance Concrete: Detailed reaction kinetics and microstructure evolution mechanism. Constr. Build. Mater 2023, 389, 131726. [Google Scholar] [CrossRef]
- Feng, T.; Jia, M.; Xu, W.; Wang, F.; Li, P.; Wang, X.; Tan, Y.; Jiang, J. Three-dimensional mesoscopic investigation of the compression mechanical properties of ultra-high performance concrete containing coarse aggregates. Cem. Concr. Compos. 2022, 133, 104678. [Google Scholar] [CrossRef]
- Yan, P.; Chen, B.; Afgan, S.; Haque, M.A.; Wu, M.; Han, J. Experimental research on ductility enhancement of ultra-high performance concrete incorporation with basalt fibre, polypropylene fibre and glass fibre. Constr. Build. Mater. 2021, 279, 122489. [Google Scholar] [CrossRef]
- Pyo, S.; Kim, H.-K.; Lee, B.Y. Effects of coarser fine aggregate on tensile properties of ultra high performance concrete. Cem. Concr. Compos. 2017, 84, 28–35. [Google Scholar] [CrossRef]
- Li, S.; Jensen, O.M.; Yu, Q. Influence of steel fiber content on the rate-dependent flexural performance of ultra-high performance concrete with coarse aggregates. Constr. Build. Mater. 2022, 318, 125935. [Google Scholar] [CrossRef]
- Liu, J.; Han, F.; Cui, G.; Zhang, Q.; Lv, J.; Zhang, L.; Yang, Z. Combined effect of coarse aggregate and fiber on tensile behavior of ultra-high performance concrete. Constr. Build. Mater. 2016, 121, 310–318. [Google Scholar] [CrossRef]
- Ma, J.; Orgass, M.; Dehn, F.; Schmidt, D.; Tue, N.V. Comparative Investigations on UltraHigh Performance Concrete with and without Coarse Aggregates. In Proceedings of the International Symposium on Ultra High Performance Concrete (UHPC), Kassel, Germany, 13–15 September 2004. [Google Scholar]
- Aghayan, I.; Khafajeh, R.; Shamsaei, M. Life cycle assessment, mechanical properties, and durability of roller compacted concrete pavement containing recycled waste materials. Int. J. Pavement Res. Technol. 2021, 14, 595–606. [Google Scholar] [CrossRef]
- Yoo, D.; Banthia, N. Mechanical properties of ultra-high-performance fiber-reinforced concrete: A review. Cem. Concr. Compos. 2016, 73, 267–280. [Google Scholar] [CrossRef]
- Zhang, Y.; Sun, W.; Liu, S.; Jiao, C.; Lai, J. Preparation of C200 green reactive powder concrete and its static–dynamic behaviors. Cem. Concr. Compos. 2008, 30, 831–838. [Google Scholar]
- Xu, L.; Dong, Y.; Chen, S. Research on the mixture ratio design of ultra-high performance concrete. Chin. Concr. 2015, 1, 72–74+84. [Google Scholar]
- Savino, V.; Lanzoni, L.; Tarantino, A.; Viviani, M. Simple and effective models to predict the compressive and tensile strength of HPFRC as the steel fiber content and type changes. Compos. Part B Eng. 2017, 137, 153–162. [Google Scholar] [CrossRef]
- Teng, L.; Meng, W.; Khayat, K.H. Rheology control of ultra-high-performance concrete made with different fiber contents. Cem. Concr. Res. 2020, 138, 106222. [Google Scholar] [CrossRef]
- Ashkezari, G.D.; Fotouhi, F.; Razmara, M. Experimental relationships between steel fiber volume fraction and mechanical properties of ultra-high performance fiber-reinforced concrete. J. Build. Eng. 2020, 32, 10613. [Google Scholar] [CrossRef]
- Yang, Y.; Huang, W.; Geng, J.; Cui, T.; Yan, M. UHPC mix design method based on semi-quantitative. Chin. Mater. Rep. 2021, 352, 188–193. [Google Scholar]
- Solhmirzaei, R.; Salehi, H.; Kodur, V.; Naser, M. Machine learning framework for predicting failure mode and shear capacity of ultra high performance concrete beams. Eng. Struct. 2020, 224, 111221. [Google Scholar] [CrossRef]
- Huang, L.; Chen, J.; Tan, X. BP-ANN based bond strength prediction for FRP reinforced concrete at high temperature. Eng. Struct. 2022, 257, 114026. [Google Scholar] [CrossRef]
- Yan, G.; Li, J.; Ali, A.H.; Alkhalifah, T.; Alturise, F.; Ali, H.E. Innovative ANN hysteresis to predict hysteretic performance of composite reinforced concrete beam. Adv. Eng. Softw. 2023, 176, 103373. [Google Scholar]
- Fan, D.; Yu, R.; Fu, S.; Yue, L.; Wu, C.; Shui, Z.; Liu, K.; Song, Q.; Sun, M.; Jiang, C. Precise design and characteristics prediction of Ultra-High Performance Concrete (UHPC) based on artificial intelligence techniques. Cem. Concr. Compos. 2021, 122, 104171. [Google Scholar] [CrossRef]
- Khafajeh, R.; Shamsaei, M.; Tehrani, H.G.; Easa, S.M. Proposing load transfer efficiency as criterion for repairing longitudinal and transverse cracks of asphalt pavements. J. Transp. Eng. Part B Pavements 2021, 147, 06021002. [Google Scholar] [CrossRef]
- Owusu-Danquah, J.S.; Bseiso, A.; Allena, S.; Duffy, S.F. Artificial neural network algorithms to predict the bond strength of reinforced concrete: Coupled effect of corrosion, concrete cover, and compressive strength. Constr. Build. Mater. 2022, 350, 128896. [Google Scholar] [CrossRef]
- Prasad, B.K.R.; Eskandari, H.; Reddy, B.V.V. Prediction of compressive strength of SCC and HPC with high volume fly ash using ANN. Constr. Build. Mater. 2009, 23, 117–128. [Google Scholar] [CrossRef]
- Chi, L.; Wang, M.; Liu, K.; Lu, S.; Kan, L.; Xia, X.; Huang, C. Machine learning prediction of compressive strength of concrete with resistivity modification. Mater. Today Commun. 2023, 36, 106470. [Google Scholar] [CrossRef]
- Liu, K.; Zheng, J.; Dong, S.; Xie, W.; Zhang, X. Mixture optimization of mechanical, economical, and environmental objectives for sustainable recycled aggregate concrete based on machine learning and metaheuristic algorithms. J. Build. Eng. 2023, 63, 105570. [Google Scholar] [CrossRef]
- Wei, Y.; Chen, P.; Cao, S.; Wang, H.; Liu, Y.; Wang, Z.; Zhao, W. Prediction of Carbonation Depth for Concrete Containing Mineral Admixtures Based on Machine Learning. Arab. J. Sci. Eng. 2023, 48, 13211–13225. [Google Scholar] [CrossRef]
- Bilim, C.; Atiş, C.D.; Tanyildizi, H.; Karahan, O. Predicting the compressive strength of ground granulated blast furnace slag concrete using artificial neural network. Adv. Eng. Softw. 2009, 40, 334–340. [Google Scholar] [CrossRef]
- Sarıdemir, M.; Topçu, İ.B.; Özcan, F.; Severcan, M.H. Prediction of long-term effects of GGBFS on compressive strength of concrete by artificial neural networks and fuzzy logic. Constr. Build. Mater. 2009, 23, 1279–1286. [Google Scholar] [CrossRef]
- Khan, M.I. Predicting properties of High Performance Concrete containing composite cementitious materials using Artificial Neural Networks. Autom. Constr. 2012, 22, 516–524. [Google Scholar] [CrossRef]
- Kandiri, A.; Golafshani, E.M.; Behnood, A. Estimation of the compressive strength of concretes containing ground granulated blast furnace slag using hybridized multi-objective ANN and salp swarm algorithm. Constr. Build. Mater. 2020, 248, 118676. [Google Scholar] [CrossRef]
- Congro, M.; Monteiro, V.M.d.A.; Brandão, A.L.; dos Santos, B.F.; Roehl, D.; Silva, F.d.A. Prediction of the residual flexural strength of fiber reinforced concrete using artificial neural networks. Constr. Build. Mater. 2021, 303, 124502. [Google Scholar] [CrossRef]
- Moradi, M.J.; Khaleghi, M.; Salimi, J.; Farhangi, V.; Ramezanianpour, A. Predicting the compressive strength of concrete containing metakaolin with different properties using ANN. Measurement 2021, 183, 109790. [Google Scholar] [CrossRef]
- Li, P.P.; Yu, Q.L.; Brouwers, H.J.H. Effect of coarse basalt aggregates on the properties of Ultra-high Performance Concrete (UHPC). Constr. Build. Mater. 2018, 170, 649–659. [Google Scholar] [CrossRef]
- Wu, Z.M.; Shi, C.J.; He, W.; Wu, L. Effects of steel fiber content and shape on mechanical properties of ultra high performance concrete. Constr. Build. Mater. 2016, 103, 8–14. [Google Scholar] [CrossRef]
- Hassan, A.M.T.; Jones, S.W.; Mahmud, G.H. Experimental test methods to determine the uniaxial tensile and compressive behaviour of ultra high performance fibre reinforced concrete (UHPFRC). Constr. Build. Mater. 2012, 37, 874–882. [Google Scholar] [CrossRef]
- Chen, J.M. Study on mix proportion and mechanical properties of ultra-high performance concrete with coarse aggregate. Chin. J. Munic Technol. 2020, 38, 70–273. [Google Scholar]
- Shen, C.Q.; Li, B.X. Effect of coarse aggregate on mechanical properties of ultra-high performance concrete and fitting analysis. Chin. J Mater. Sci. Eng. 2021, 39, 35–40. [Google Scholar]
- Zheng, Q.; Wang, T.Q. Study on the effect of coarse aggregate and basalt fiber on the performance of ultra-high performance concrete. China Concr. 2021, 11, 68–71. [Google Scholar]
- Wang, X.F.; Chen, B.; Zhang, F.; He, Y.; Xu, J. Influence of steel fiber content on mechanical properties of ultra-high performance concrete. Chin. J. W. Res. Archit. Eng. 2022, 20, 61–66. [Google Scholar]
- Sun, Y. Study on the effect of steel fiber on the construction and mechanical properties of ultra-high performance concrete. Chin. Highw. Eng. 2021, 46, 195–199. [Google Scholar]
- Huang, W.R.; Yang, Y.; Liu, Y.; Cui, T. Mechanical properties of ultra-high performance concrete containing coarse aggregate. J. Chin. Ceram. Soc. 2020, 48, 1747–1755. [Google Scholar]
- Cheng, J.; Liu, J.; Liu, J.; Zhang, Q.; Zhang, L.; Lin, W.; Han, F. An experimental study and a mechanism analysis on mechanical properties of ultra-high performance concrete with coarse aggregate. Chin. Mater. Rep. 2017, 31, 115–119+131. [Google Scholar]
- Shi, J.H. Compressive Strength and Elastic Modulus of Ultra-High Performance Concrete with Basalt Coarse Aggregate. Master’s Thesis, Hunan University, Changsha, China, 2021. (In Chinese). [Google Scholar]
- Li, B.X.; Shen, C.; Li, Q. Effect of aggregate particle size on mechanical properties and dry shrinkage of ultra-high performance concrete. Concrete 2020, 7, 55–58. (In Chinese) [Google Scholar]
- Liu, K.; Alam, M.S.; Zhu, J.; Zheng, J.; Chi, L. Prediction of carbonation depth for recycled aggregate concrete using ANN hybridized with swarm intelligence algorithms. Constr. Build. Mater. 2021, 301, 124382. [Google Scholar] [CrossRef]
- Hastie, T.; Tibshirani, R.; Friedman, J.H.; Friedman, J.H. The Elements of Statistical Learning: Data Mining, Inference, and Prediction; Springer: Berlin/Heidelberg, Germany, 2009. [Google Scholar]
- Li, B.; Wu, C.; Wang, S.; Li, Y.; Wu, F.; Xia, D.; Hu, J. Monotonic and cyclic compressive behavior of ultra-high performance concrete with coarse aggregate: Experimental investigation and constitutive model. J. Build. Eng. 2023, 68, 106002. [Google Scholar] [CrossRef]
- Arora, A.; Yao, Y.; Mobasher, B.; Neithalath, N. Fundamental insights into the compressive and flexural response of binder- and aggregate-optimized ultra-high performance concrete (UHPC). Cem. Concr. Compos. 2019, 98, 1–13. [Google Scholar] [CrossRef]
- Yang, J.; Chen, B.; Su, J.; Xu, G.; Zhang, D.; Zhou, J. Effects of fibers on the mechanical properties of UHPC: A review. J. Traffic Transp. Eng. 2022, 9, 363–387. [Google Scholar] [CrossRef]
- Sharma, R.; Jang, J.G.; Bansal, P.P. A comprehensive review on effects of mineral admixtures and fibers on engineering properties of ultra-high-performance concrete. J. Build. Eng. 2021, 45, 103314. [Google Scholar] [CrossRef]
- Liu, Z.; El-Tawil, S.; Hansen, W.; Wang, F. Effect of slag cement on the properties of ultra-high performance concrete. Constr. Build. Mater. 2018, 190, 830–837. [Google Scholar] [CrossRef]
- Zhang, X.T.; Yang, D.Y.; Zhu, C.X. Study on sand ratio of ultra high performance concrete. Concrete 2021, 17–19. (In Chinese) [Google Scholar]


| Author | Empirical Formula | Type of UHPC | Year |
|---|---|---|---|
| Xu et al. [13] | UHPC (without steel fiber) | 2015 | |
| Savino et al. [14] | UHPC (with steel fiber) | 2018 | |
| Teng et al. [15] | UHPC (with steel fiber) | 2020 | |
| Ashkezari et al. [16] | UHPC (with steel fiber) | 2020 | |
| Yang et al. [17] | UHPC (with steel fiber) | 2021 |
| Year | Author | Database | No. of Input Neurons | No. of Hidden Layers | Concrete Type | Performance Metrics |
|---|---|---|---|---|---|---|
| 2009 | Prasad et al. [24] | 300 | 10 | 2 | HPC | R2 = 0.84~0.91 |
| 2009 | Bilim et al. [28] | 45 | 6 | 1 | OPC | R2 = 0.92~0.95 |
| 2009 | Sandemir et al. [29] | 284 | 5 | 2 | OPC | R2 = 0.996 RMSE = 1.036 MAPE = 2.433 |
| 2012 | Khan et al. [30] | 128 | 8 | 1 | HPC | R2 = 0.93~0.95 |
| 2020 | Kandiri et al. [31] | 624 | 7 | 2 | OPC | RMSE = 2.12~3.7 MAPE = 6.2~11.1 R = 0.93~0.98 |
| 2021 | Congro et al. [32] | 400 | 3 | 1 | FRC | R2 = 0.92~0.94 |
| 2021 | Moradi et al. [33] | 134 | 8 | 1 | CCM | MSE = 0.0067 MAPE = 20.3 R = 0.91 |
| Attribute | Unit | Min | Max | Average | Standard Deviation | Q1 | Q2 | Q3 | Mode |
|---|---|---|---|---|---|---|---|---|---|
| Cement | kg/m3 | 418.6 | 1058.8 | 773.7 | 174.7 | 638.52 | 805.28 | 894.63 | 894.63 |
| Silica fume | kg/m3 | 37 | 308.7 | 173.53 | 72.1 | 125.25 | 166.64 | 220.89 | 125.25 |
| Slag | kg/m3 | 0 | 467.9 | 100.95 | 128.24 | 0 | 0 | 163.74 | 0 |
| Fly ash | kg/m3 | 0 | 260.6 | 73.14 | 76.69 | 0 | 53.68 | 133.14 | 0 |
| Coarse aggregate | kg/m3 | 0 | 1348.8 | 398.6 | 433.8 | 0 | 309.29 | 837.07 | 0 |
| Steel fiber | % | 0 | 4 | 1.12 | 0.97 | 0.165 | 1 | 2 | 2 |
| W/B | -- | 0.13 | 0.23 | 0.17 | 0.03 | 0.16 | 0.17 | 0.2 | 0.2 |
| Sand rate | -- | 0.17 | 1 | 0.73 | 0.27 | 0.5 | 0.7 | 1 | 1 |
| Compressive Strength | MPa | 100 | 190 | 141 | 22.71 | 123.18 | 135 | 159.48 | 120 |
| Attribute | Unit | Min | Max | Average | Standard Deviation | Q1 | Q2 | Q3 | Mode |
|---|---|---|---|---|---|---|---|---|---|
| Cement | kg/m3 | 436.6 | 1000.7 | 764.8 | 148.9 | 671.44 | 805.28 | 894.63 | 894.63 |
| Silica fume | kg/m3 | 37 | 264 | 157.4 | 61.26 | 125.25 | 158.23 | 204.67 | 125.25 |
| Slag | kg/m3 | 0 | 467.9 | 141.2 | 134.8 | 0 | 125.25 | 198.36 | 0 |
| Fly ash | kg/m3 | 0 | 260.6 | 81.6 | 73.56 | 0 | 78.17 | 121.09 | 0 |
| Coarse aggregate | kg/m3 | 0 | 1252.7 | 393.4 | 391.4 | 0 | 344.9 | 664.47 | 0 |
| Steel fiber | % | 0 | 4 | 1.26 | 0.94 | 0.24 | 1.5 | 2 | 2 |
| W/B | -- | 0.13 | 0.23 | 0.17 | 0.03 | 0.15 | 0.16 | 0.2 | 0.2 |
| Sand rate | -- | 0.17 | 1 | 0.72 | 0.25 | 0.5 | 0.7 | 1 | 1 |
| Flexural Strength | MPa | 5.36 | 43 | 23.01 | 9.26 | 18.18 | 23.3 | 28.18 | 23 |
Disclaimer/Publisher’s Note: The statements, opinions and data contained in all publications are solely those of the individual author(s) and contributor(s) and not of MDPI and/or the editor(s). MDPI and/or the editor(s) disclaim responsibility for any injury to people or property resulting from any ideas, methods, instructions or products referred to in the content. |
© 2024 by the authors. Licensee MDPI, Basel, Switzerland. This article is an open access article distributed under the terms and conditions of the Creative Commons Attribution (CC BY) license (https://creativecommons.org/licenses/by/4.0/).
Share and Cite
Li, L.; Gao, Y.; Dong, X.; Han, Y. Artificial Neural Network Model for Predicting Mechanical Strengths of Economical Ultra-High-Performance Concrete Containing Coarse Aggregates: Development and Parametric Analysis. Materials 2024, 17, 3908. https://doi.org/10.3390/ma17163908
Li L, Gao Y, Dong X, Han Y. Artificial Neural Network Model for Predicting Mechanical Strengths of Economical Ultra-High-Performance Concrete Containing Coarse Aggregates: Development and Parametric Analysis. Materials. 2024; 17(16):3908. https://doi.org/10.3390/ma17163908
Chicago/Turabian StyleLi, Ling, Yufei Gao, Xuan Dong, and Yongping Han. 2024. "Artificial Neural Network Model for Predicting Mechanical Strengths of Economical Ultra-High-Performance Concrete Containing Coarse Aggregates: Development and Parametric Analysis" Materials 17, no. 16: 3908. https://doi.org/10.3390/ma17163908
APA StyleLi, L., Gao, Y., Dong, X., & Han, Y. (2024). Artificial Neural Network Model for Predicting Mechanical Strengths of Economical Ultra-High-Performance Concrete Containing Coarse Aggregates: Development and Parametric Analysis. Materials, 17(16), 3908. https://doi.org/10.3390/ma17163908