
Numerical Analysis of the Dynamic Properties of Bionic Raster Ceilings

Abstract
:1. Introduction
2. Problem Analysis
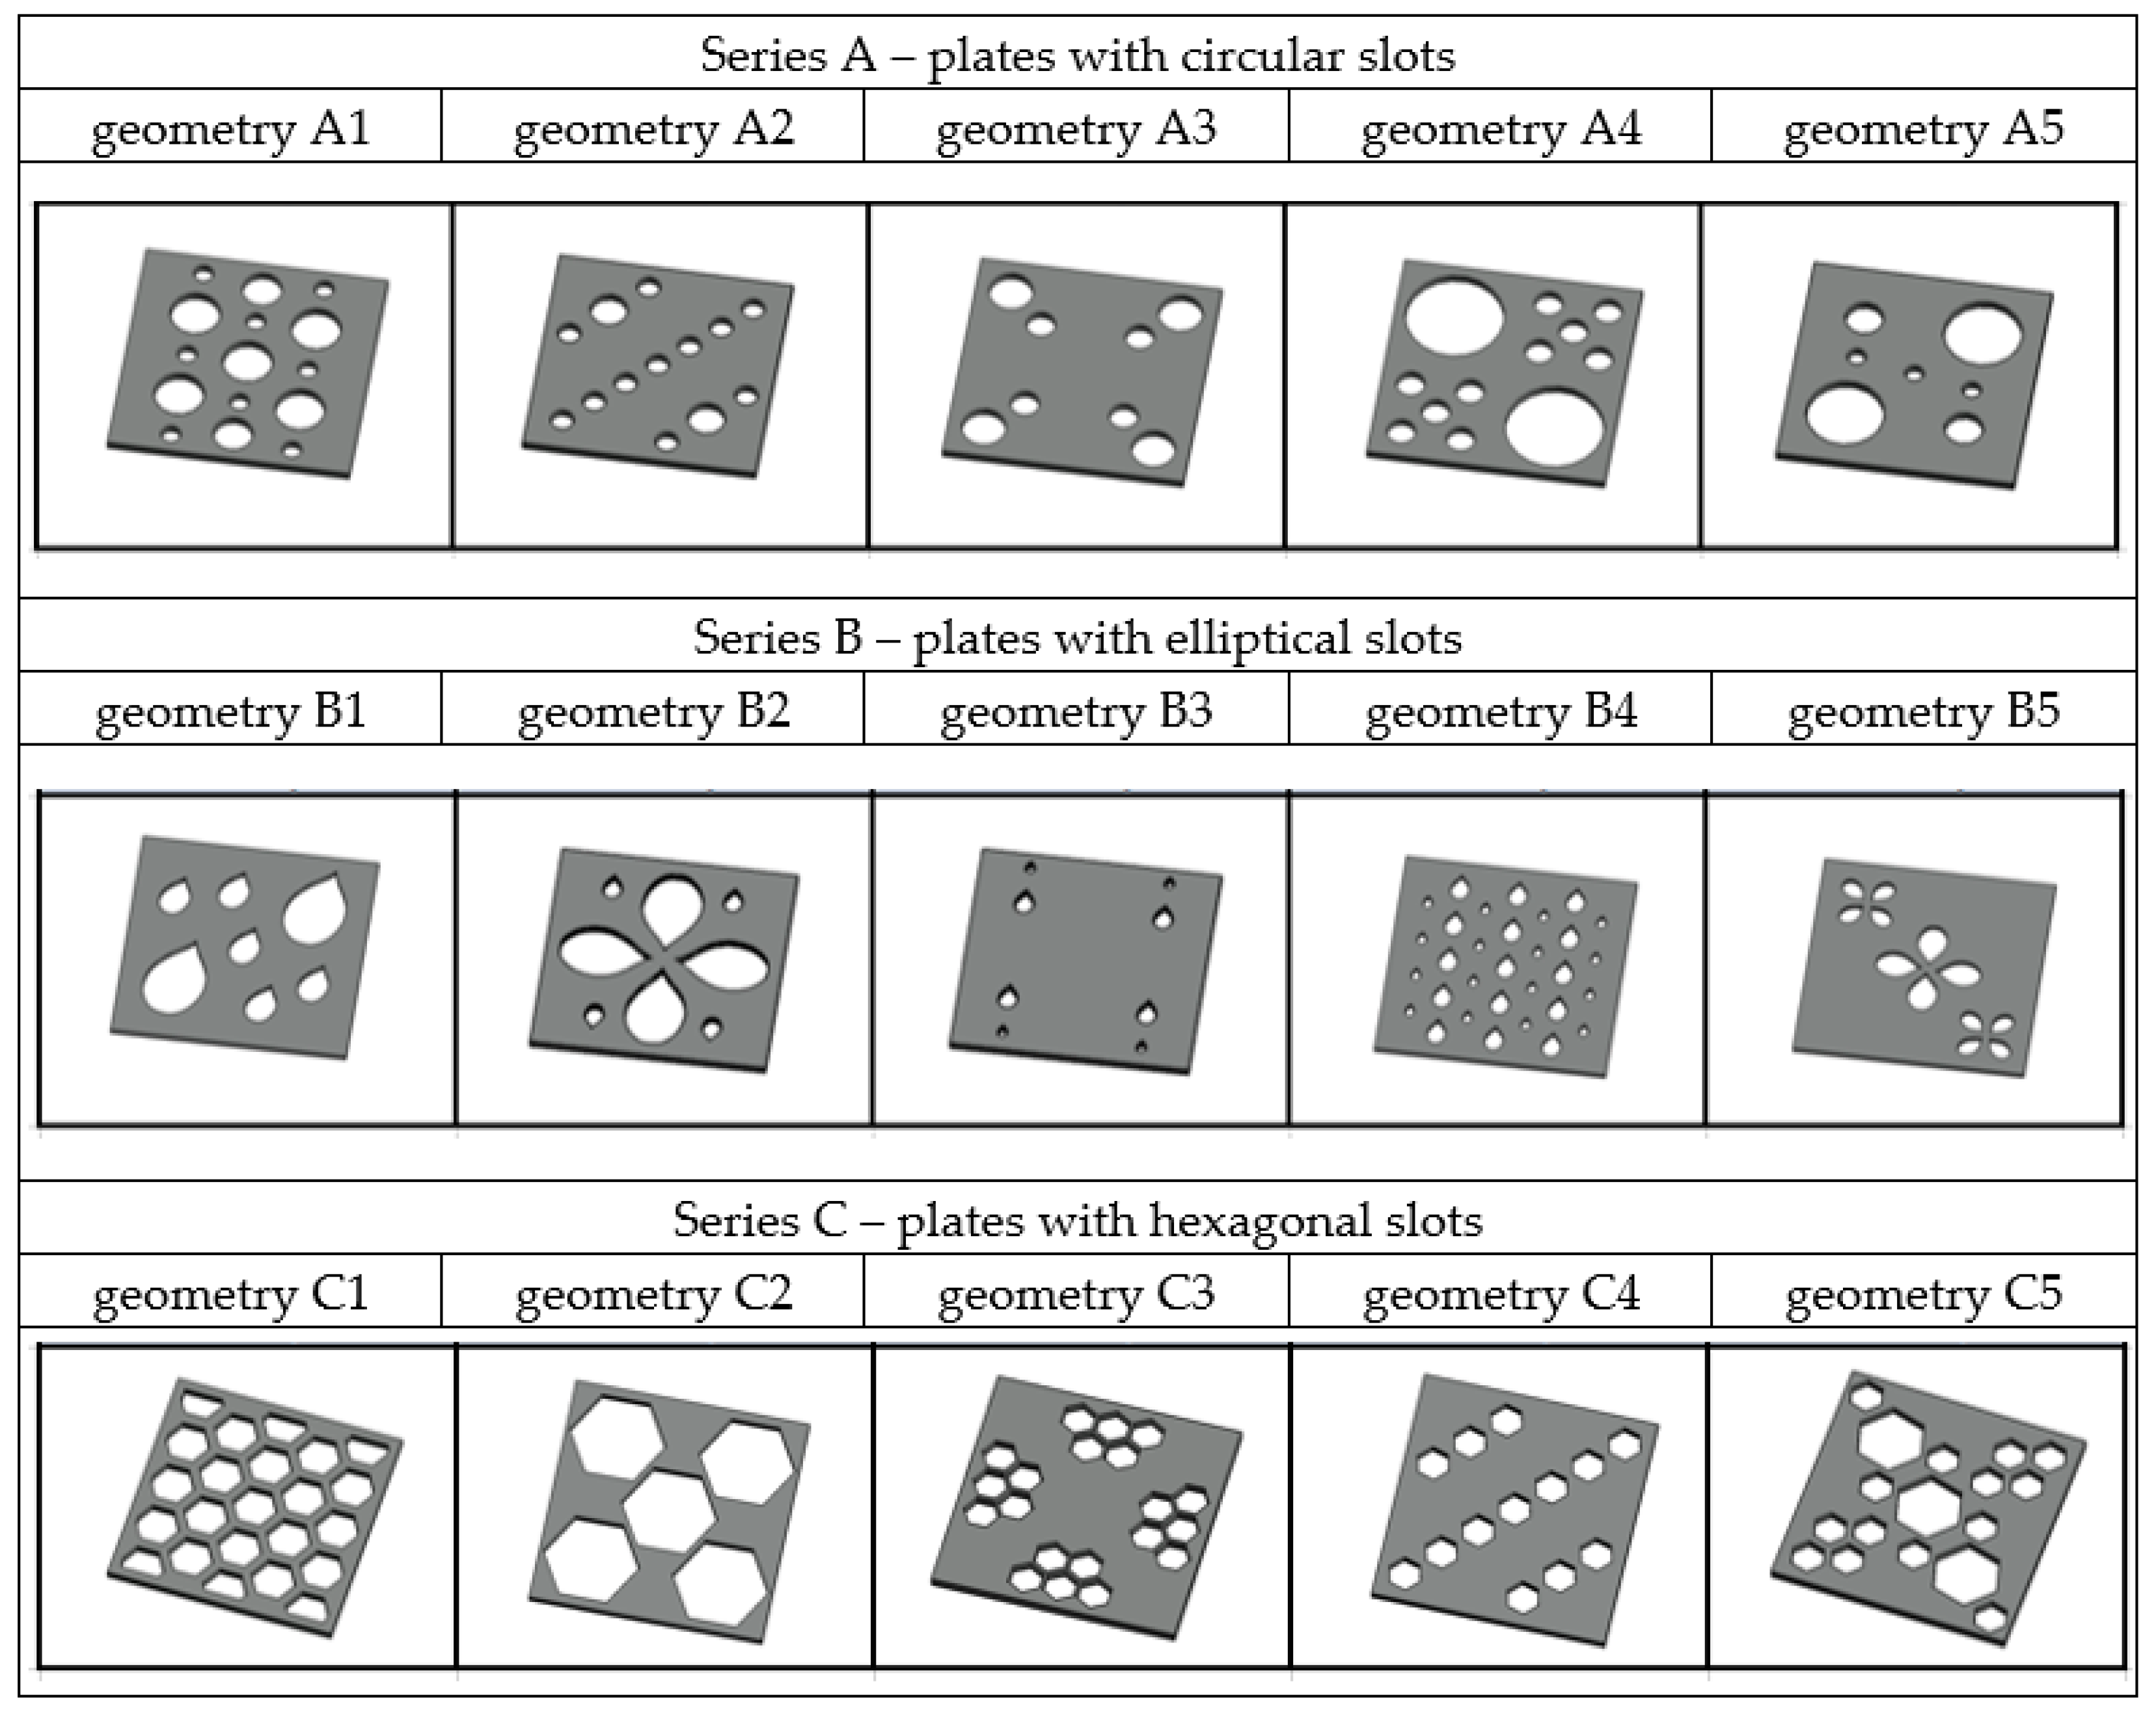
2.1. Geometry and Materials of Analysed Plates
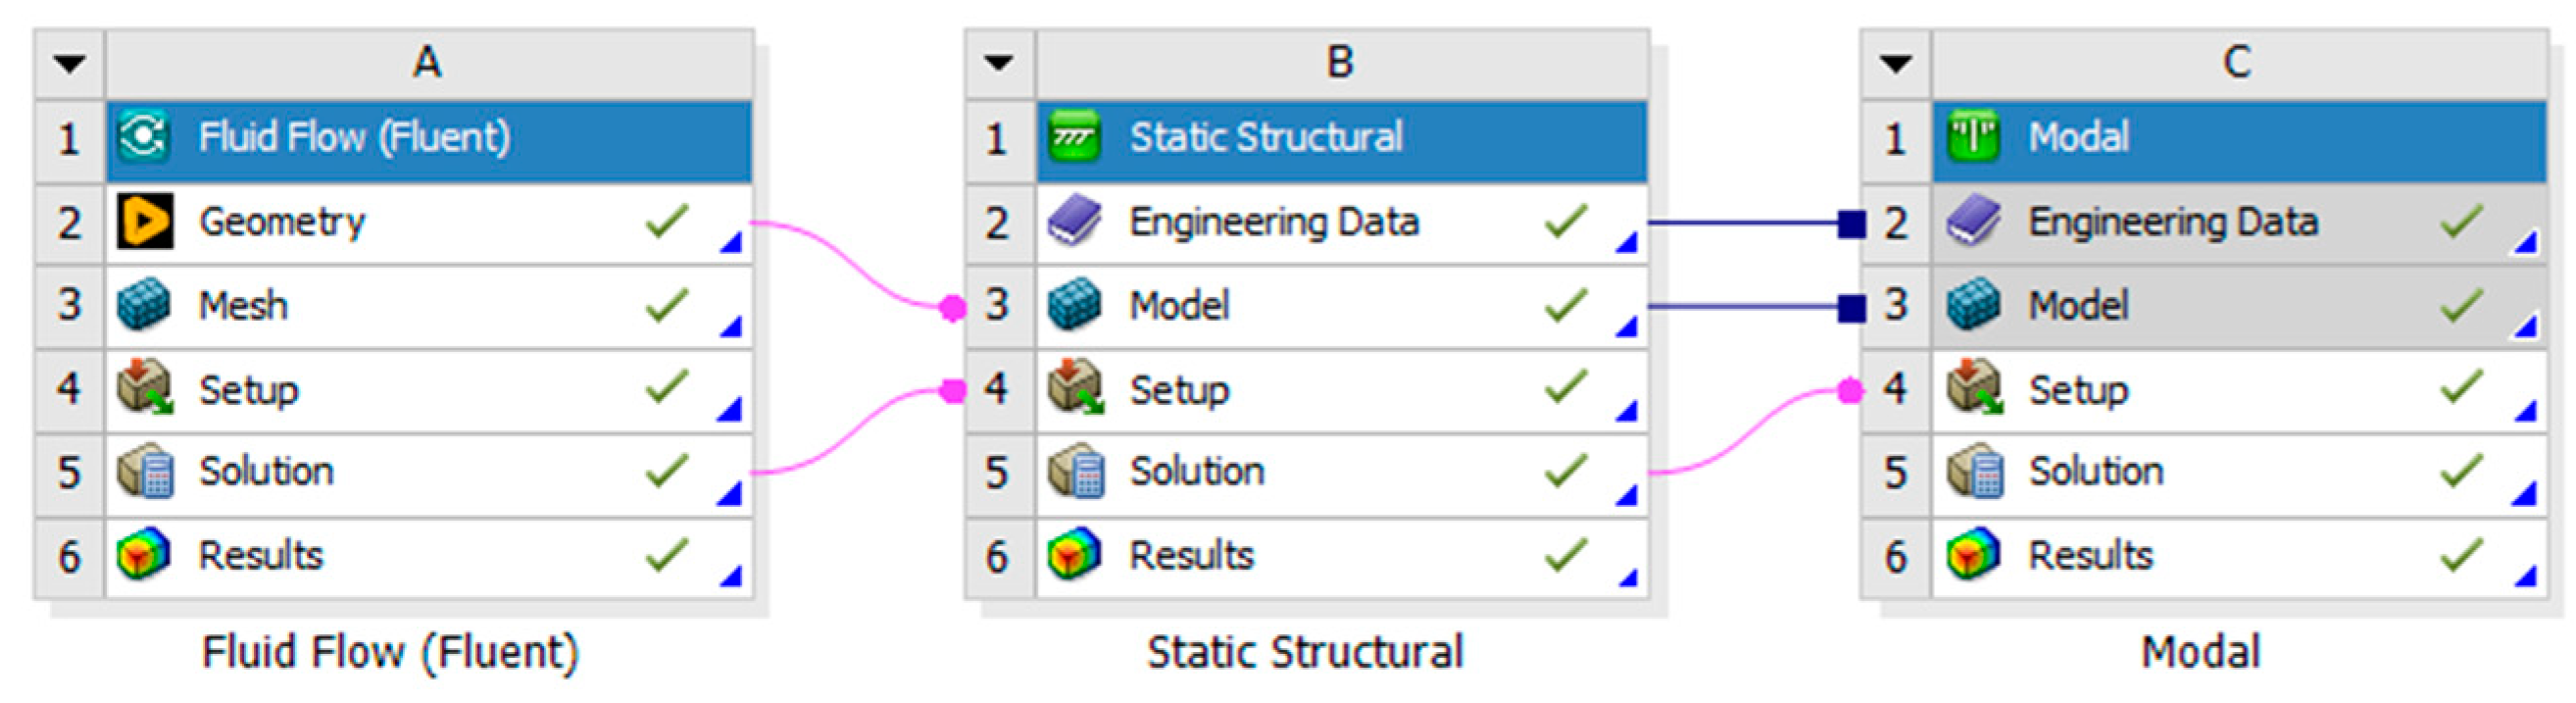
2.2. Research Methods Used
3. Results
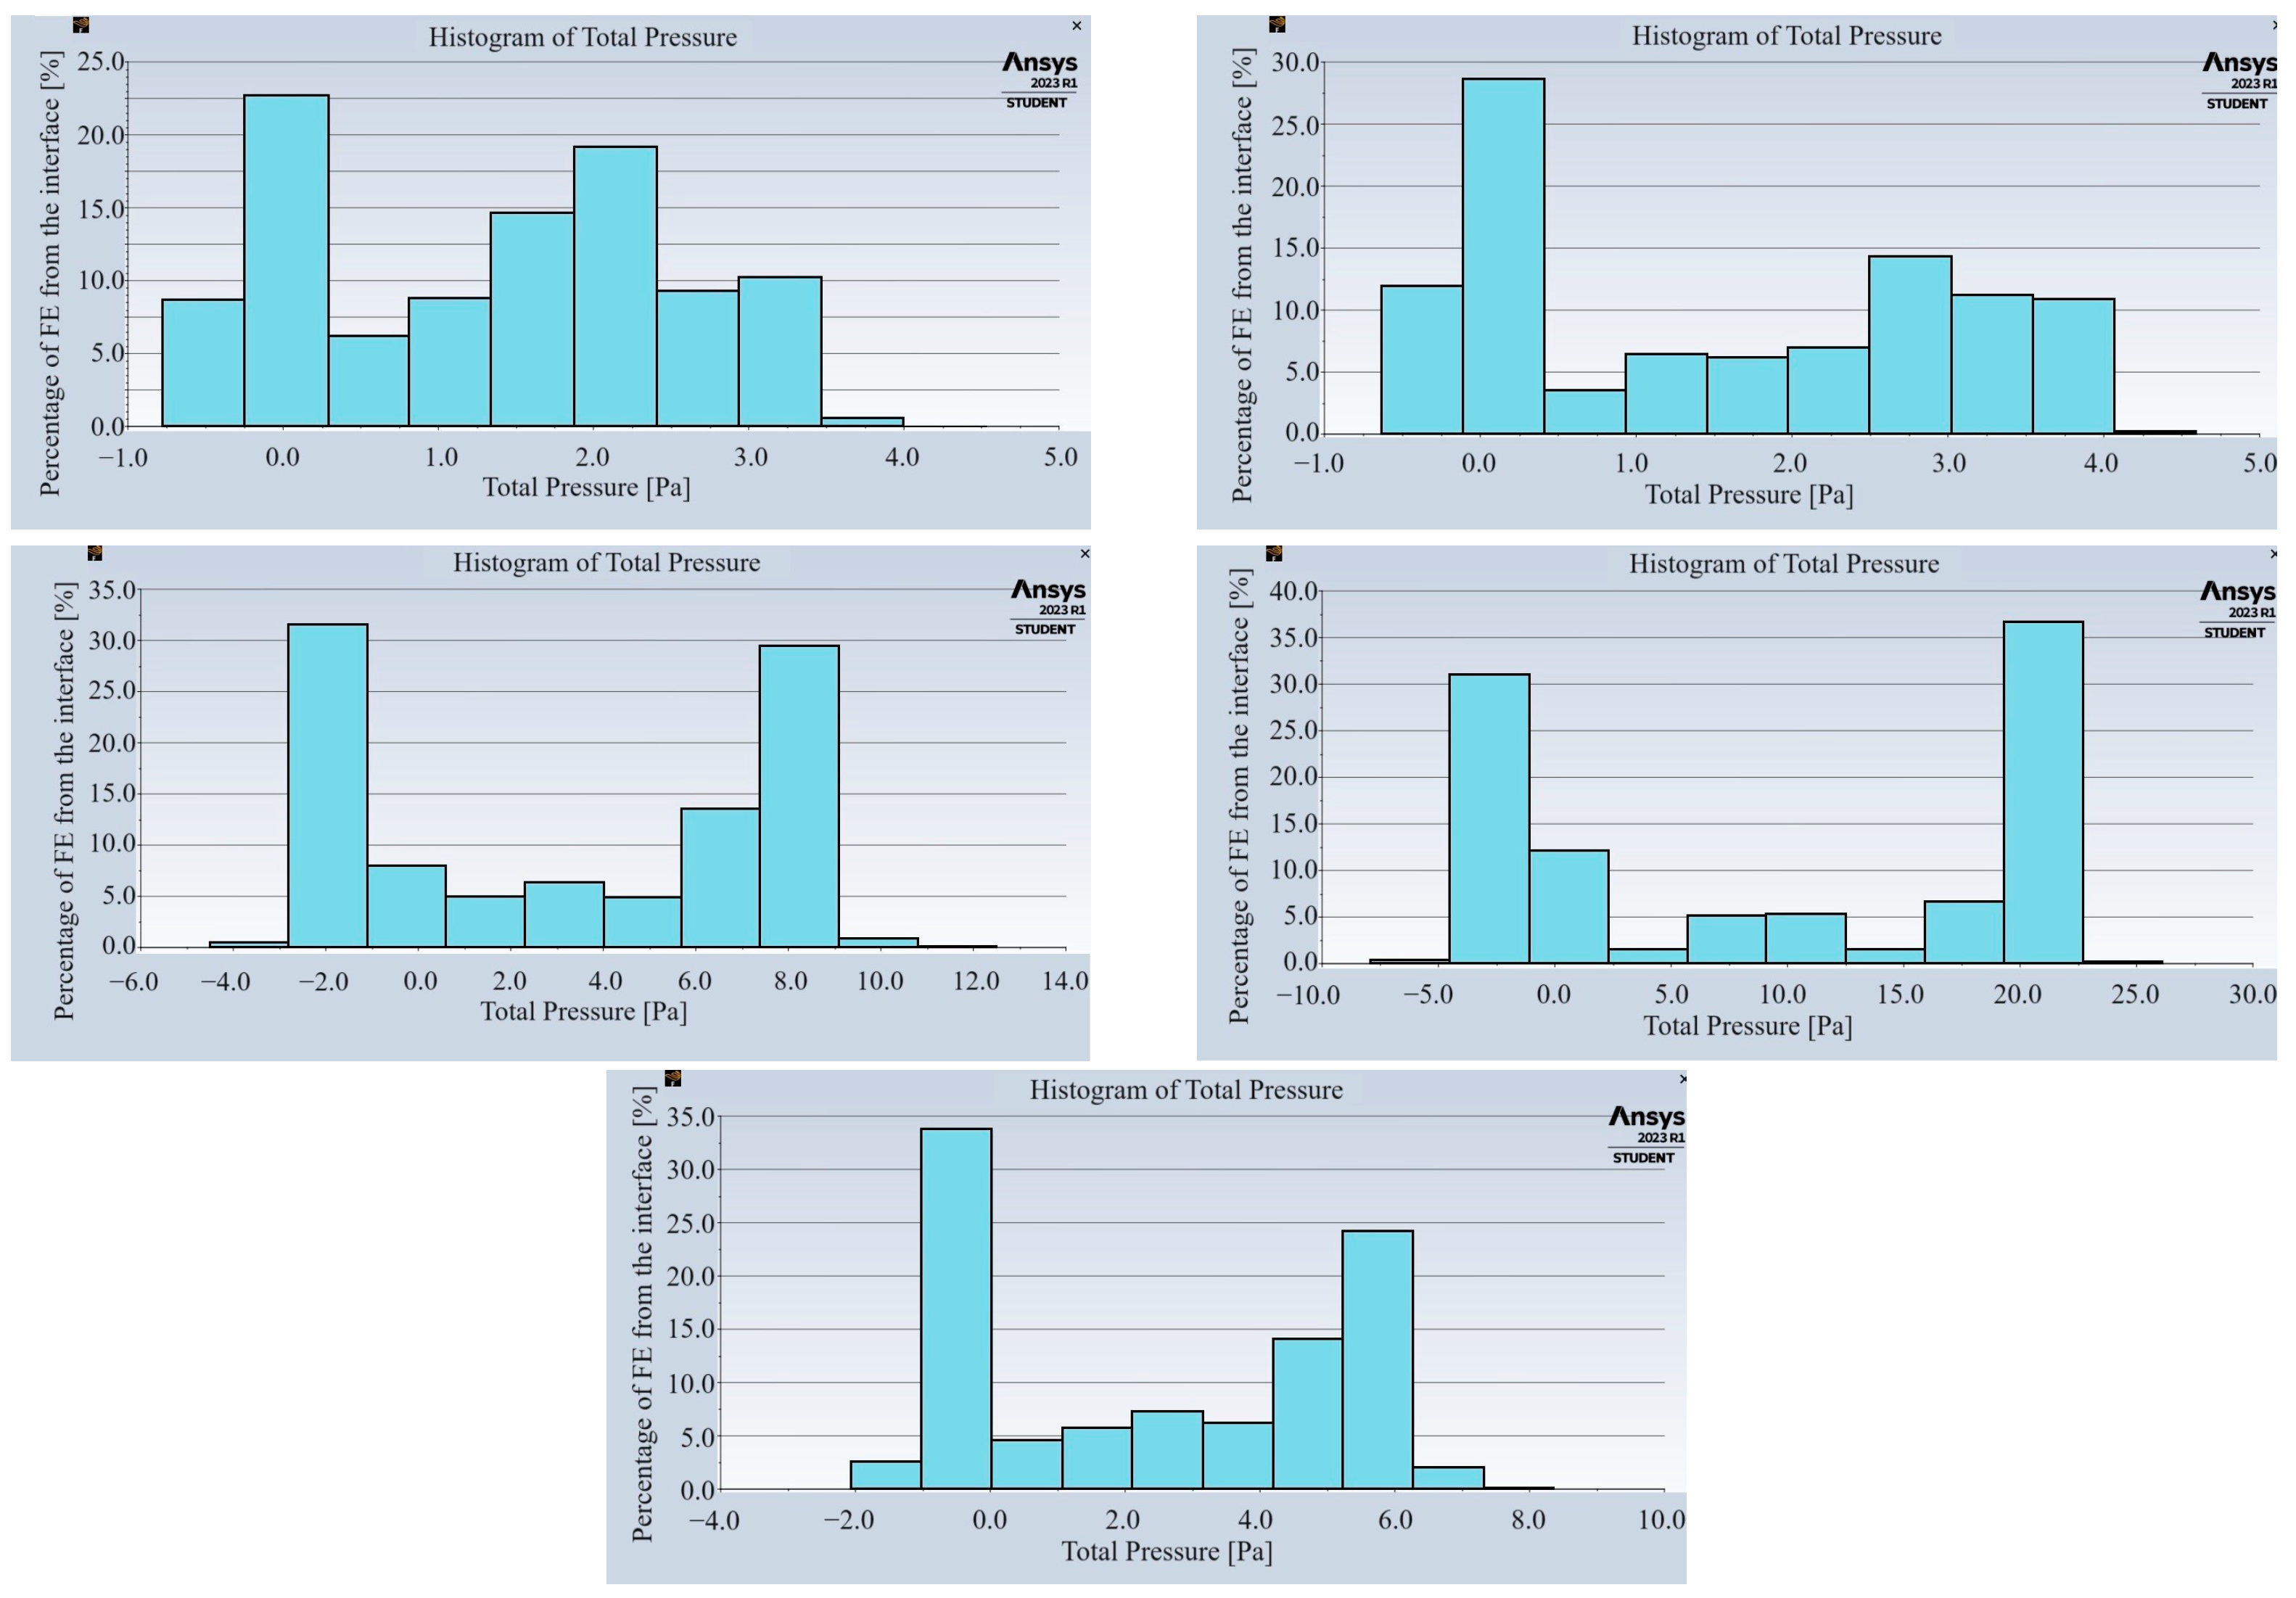
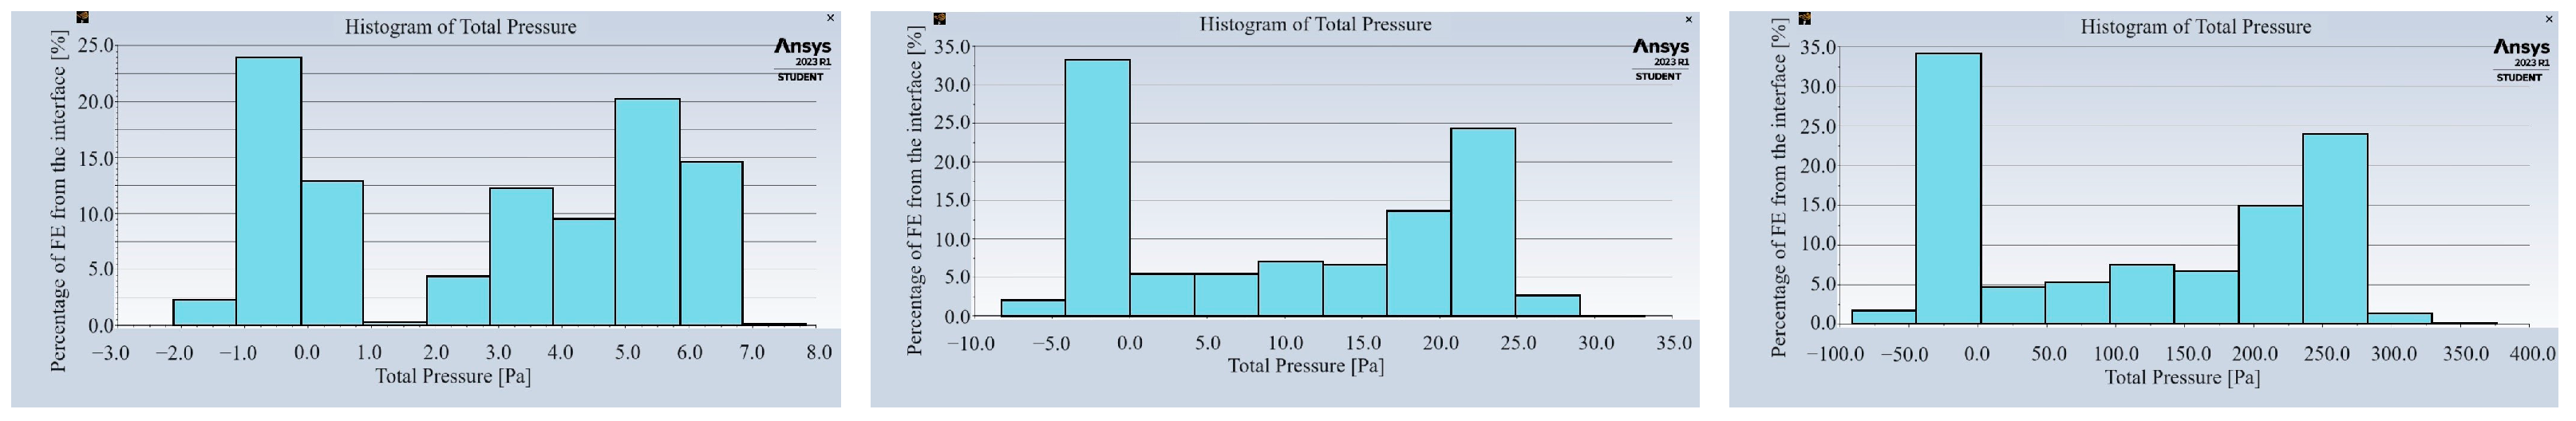
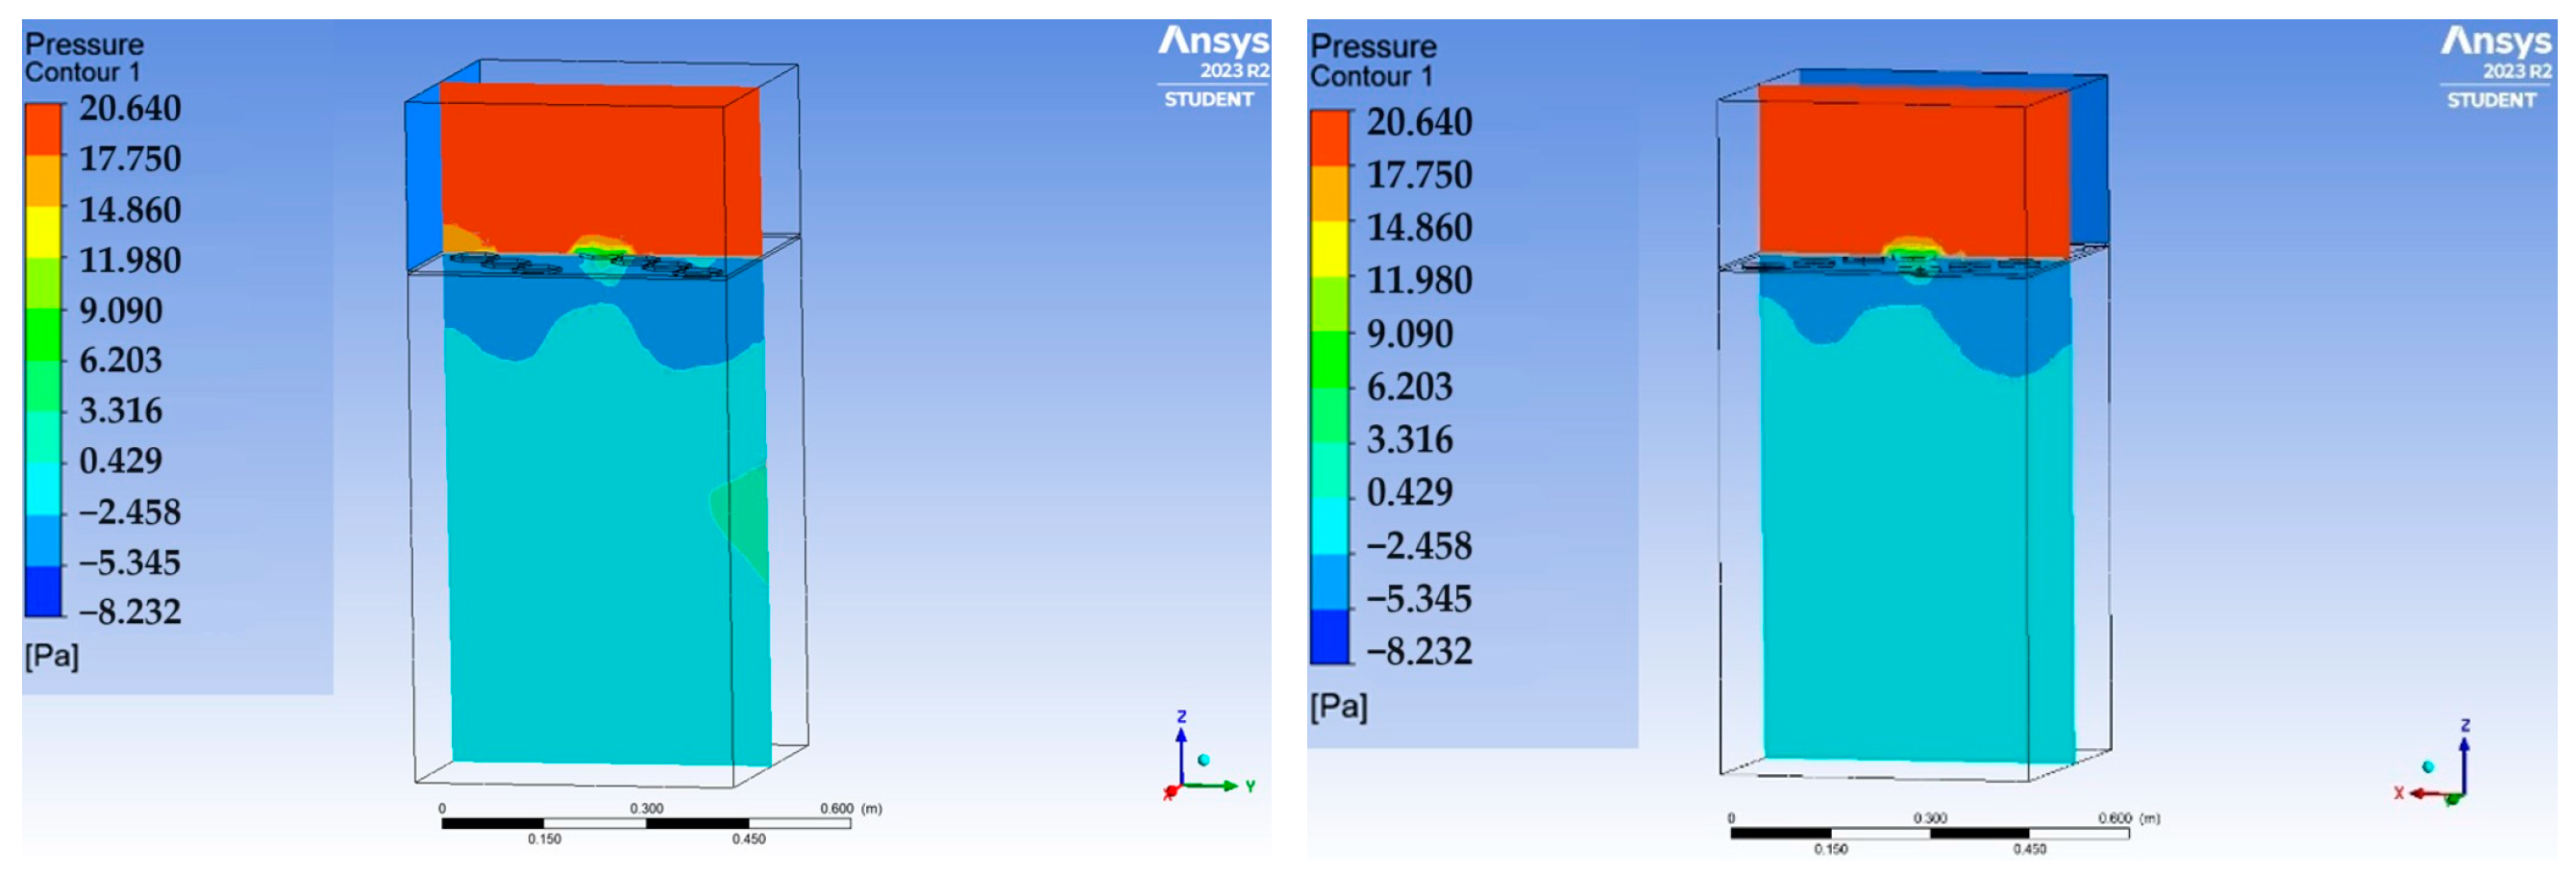
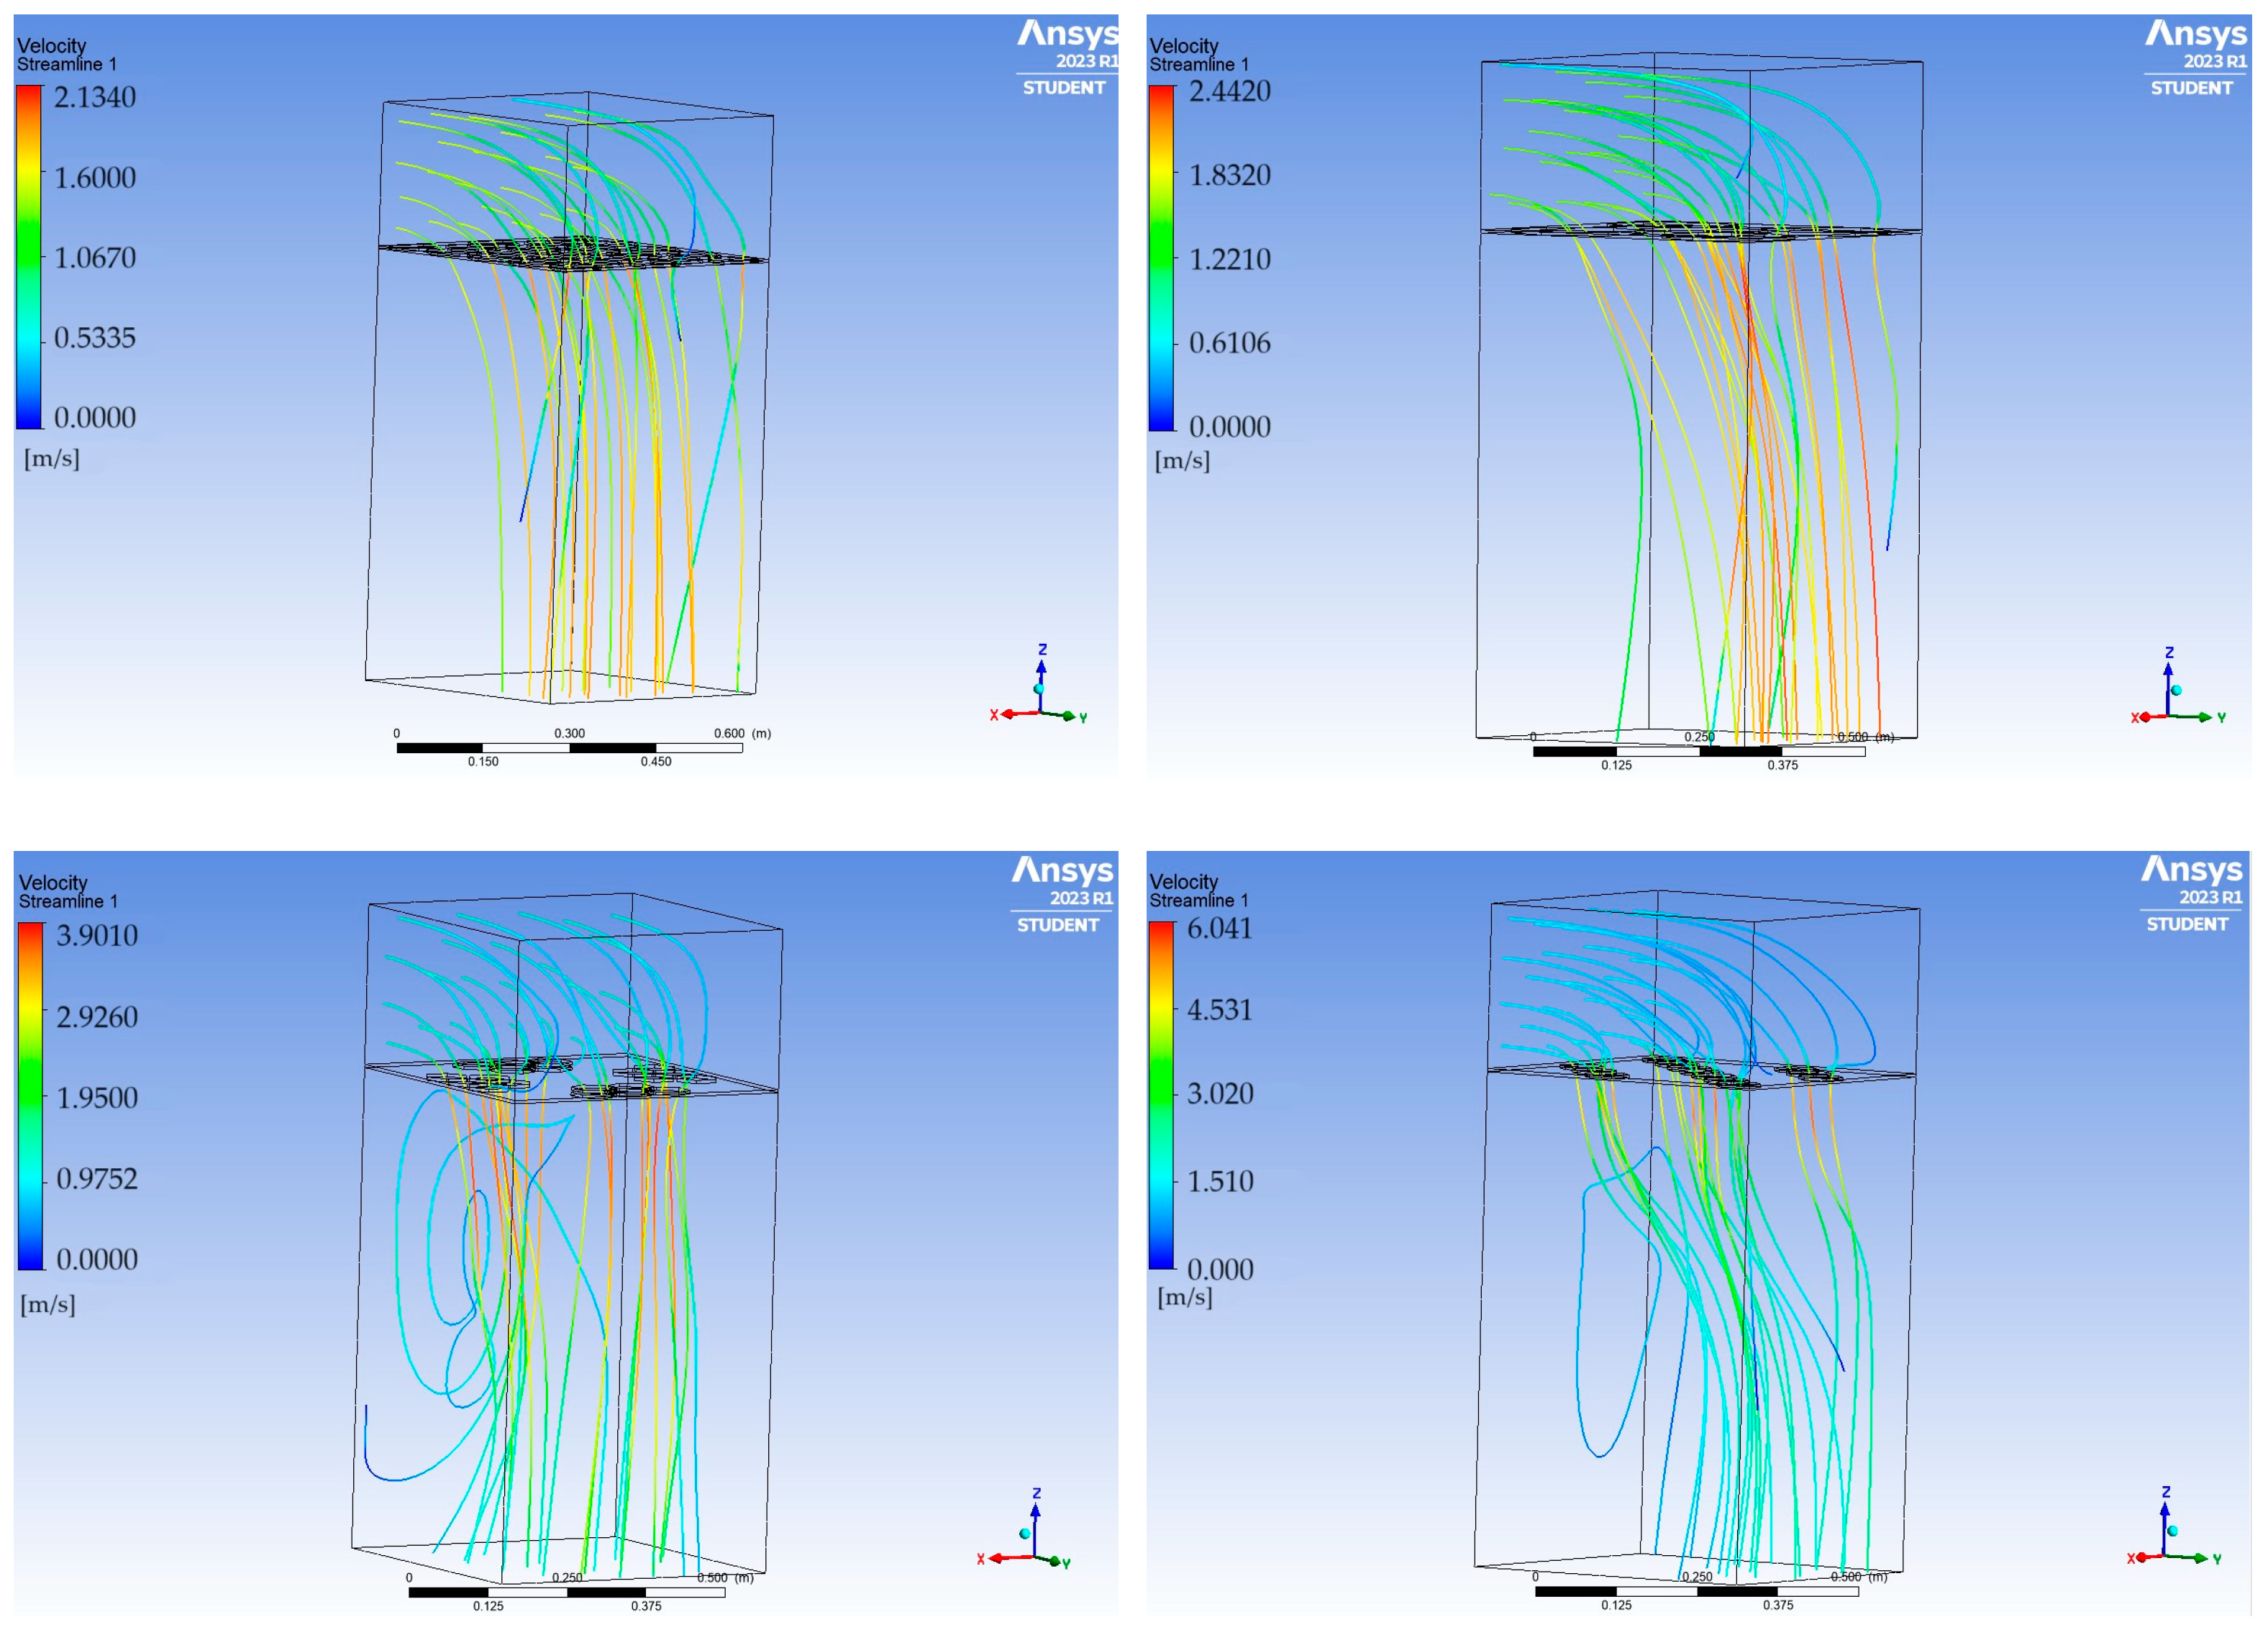
3.1. Flow Analysis
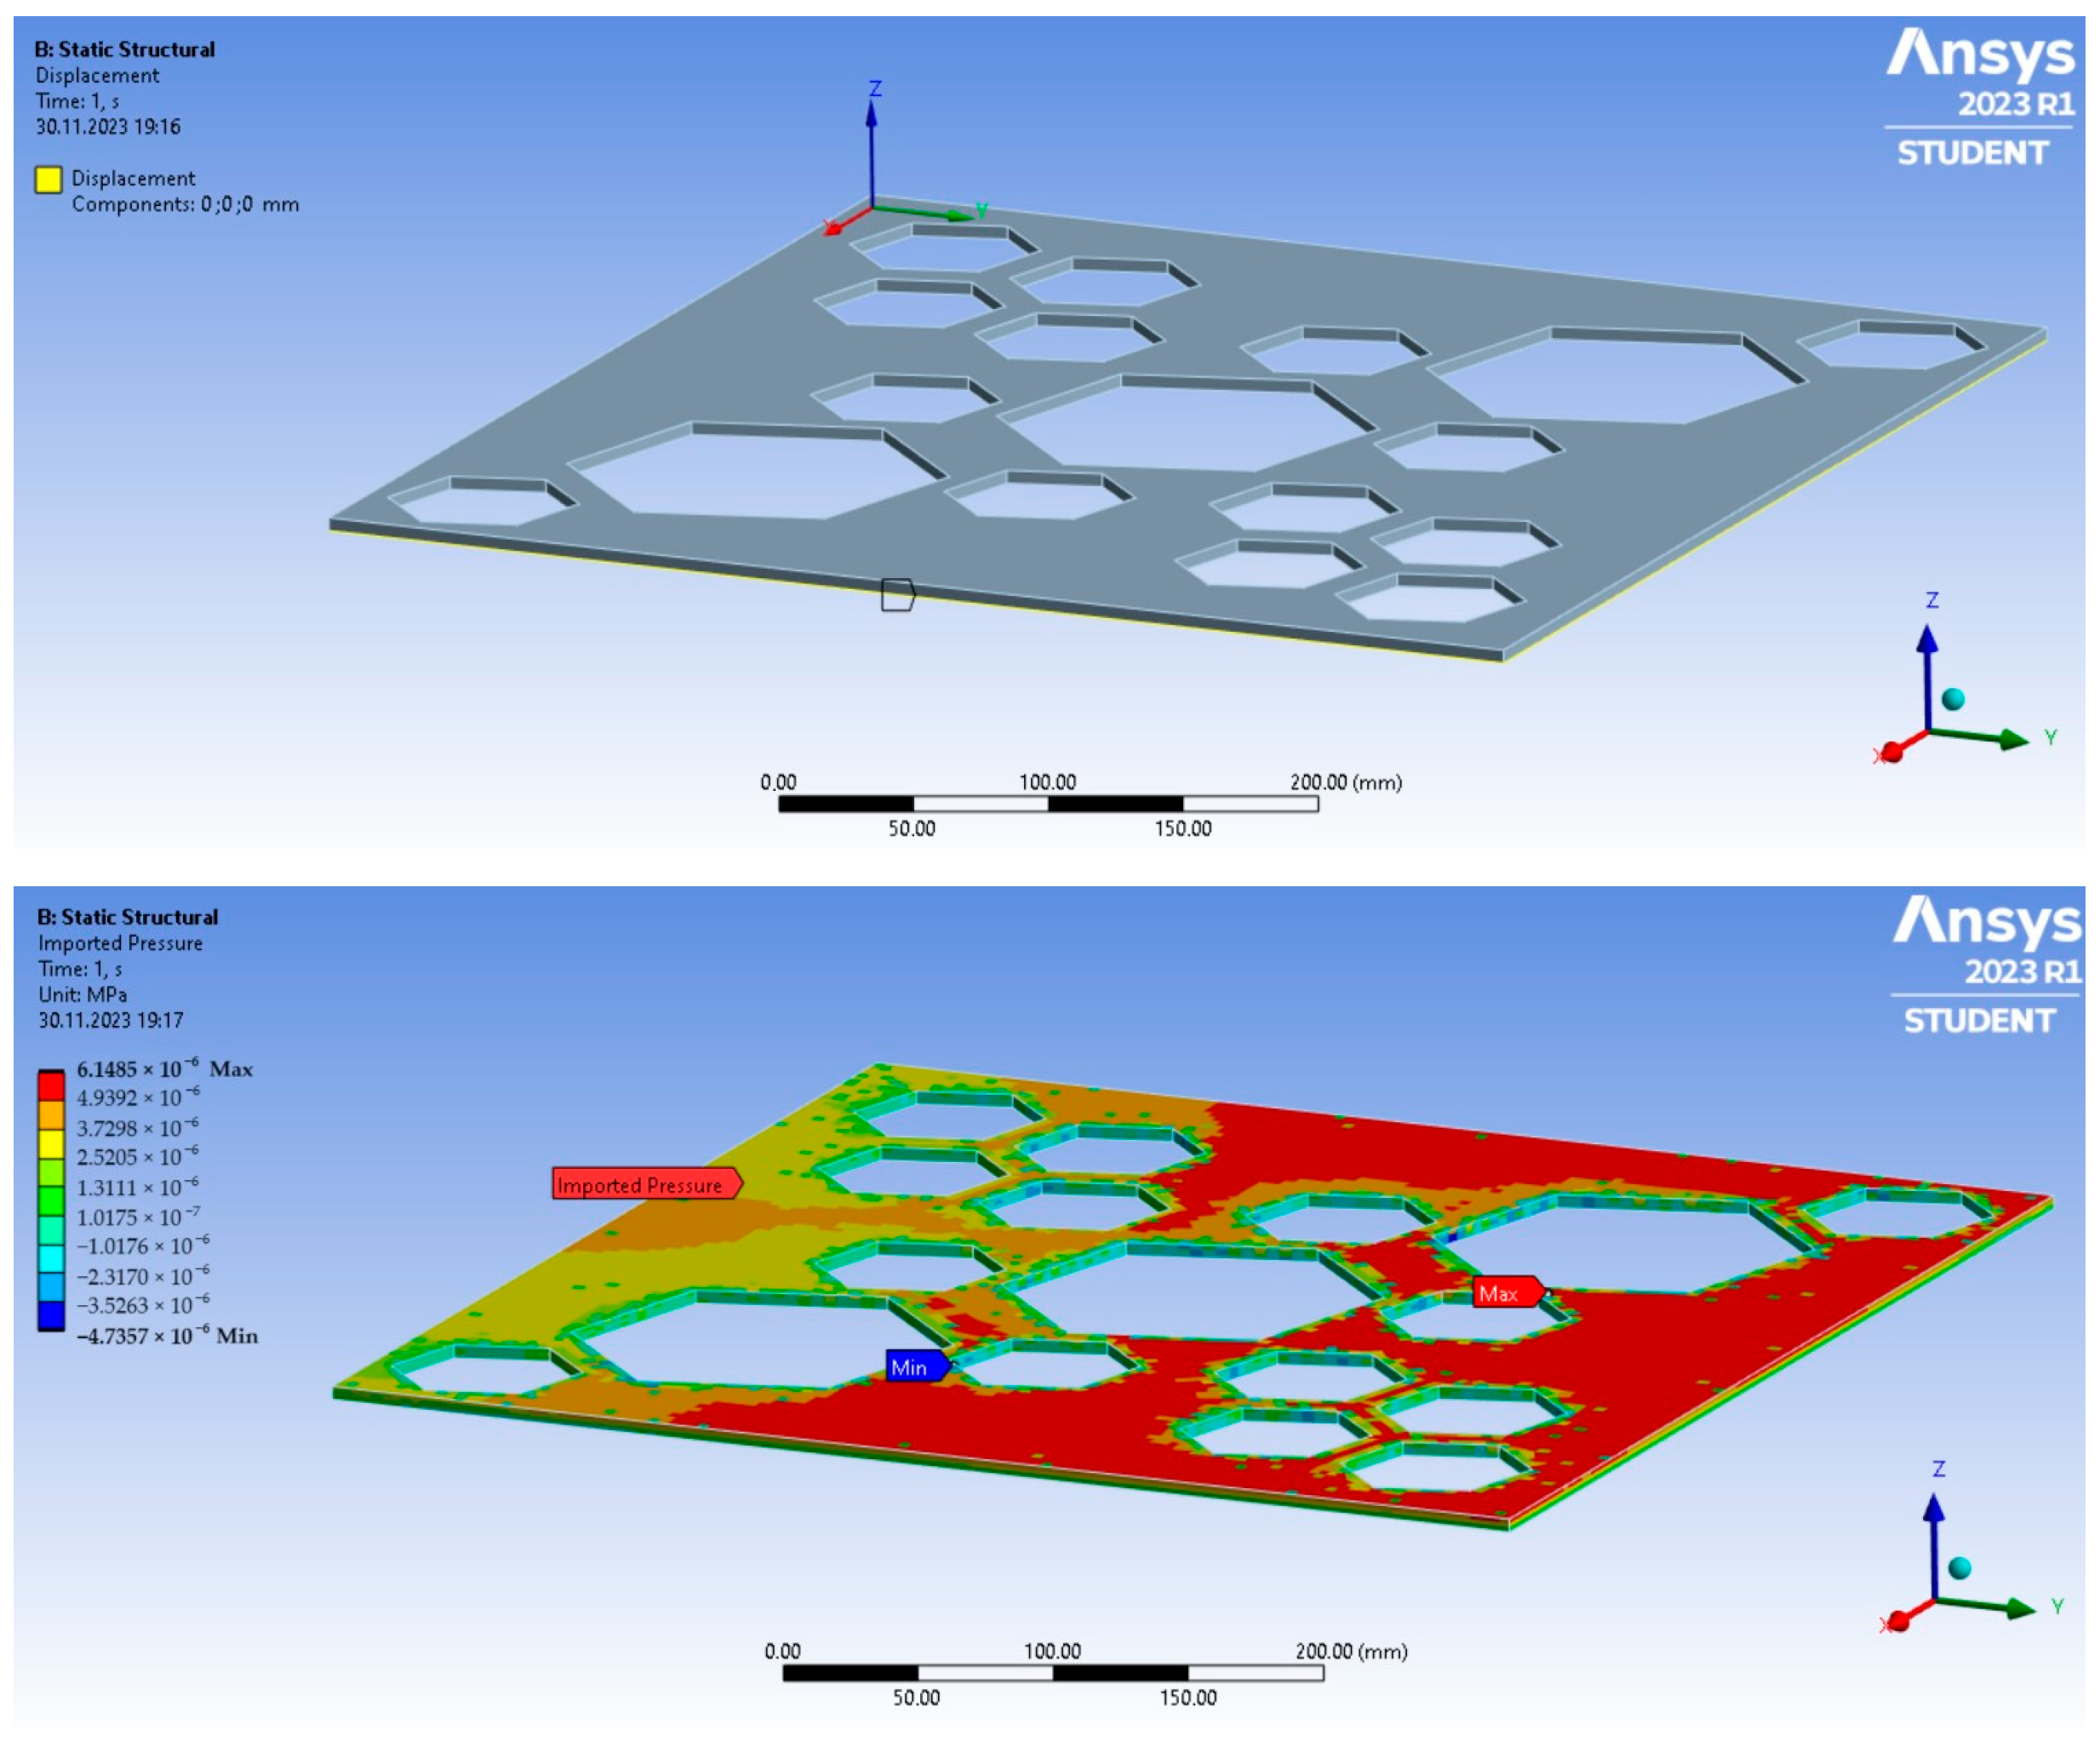
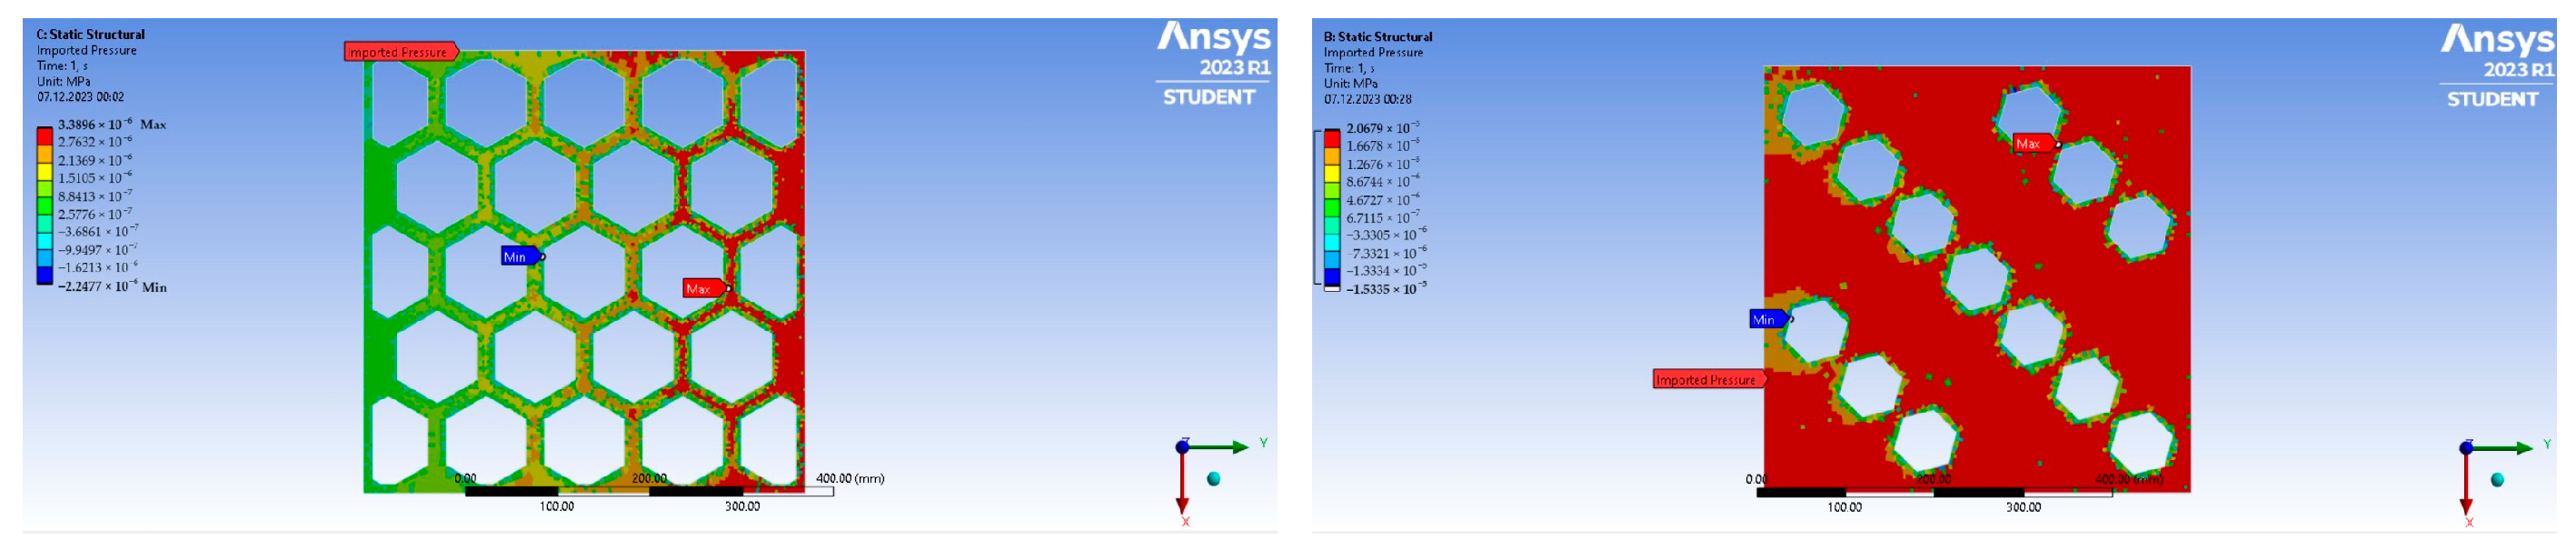
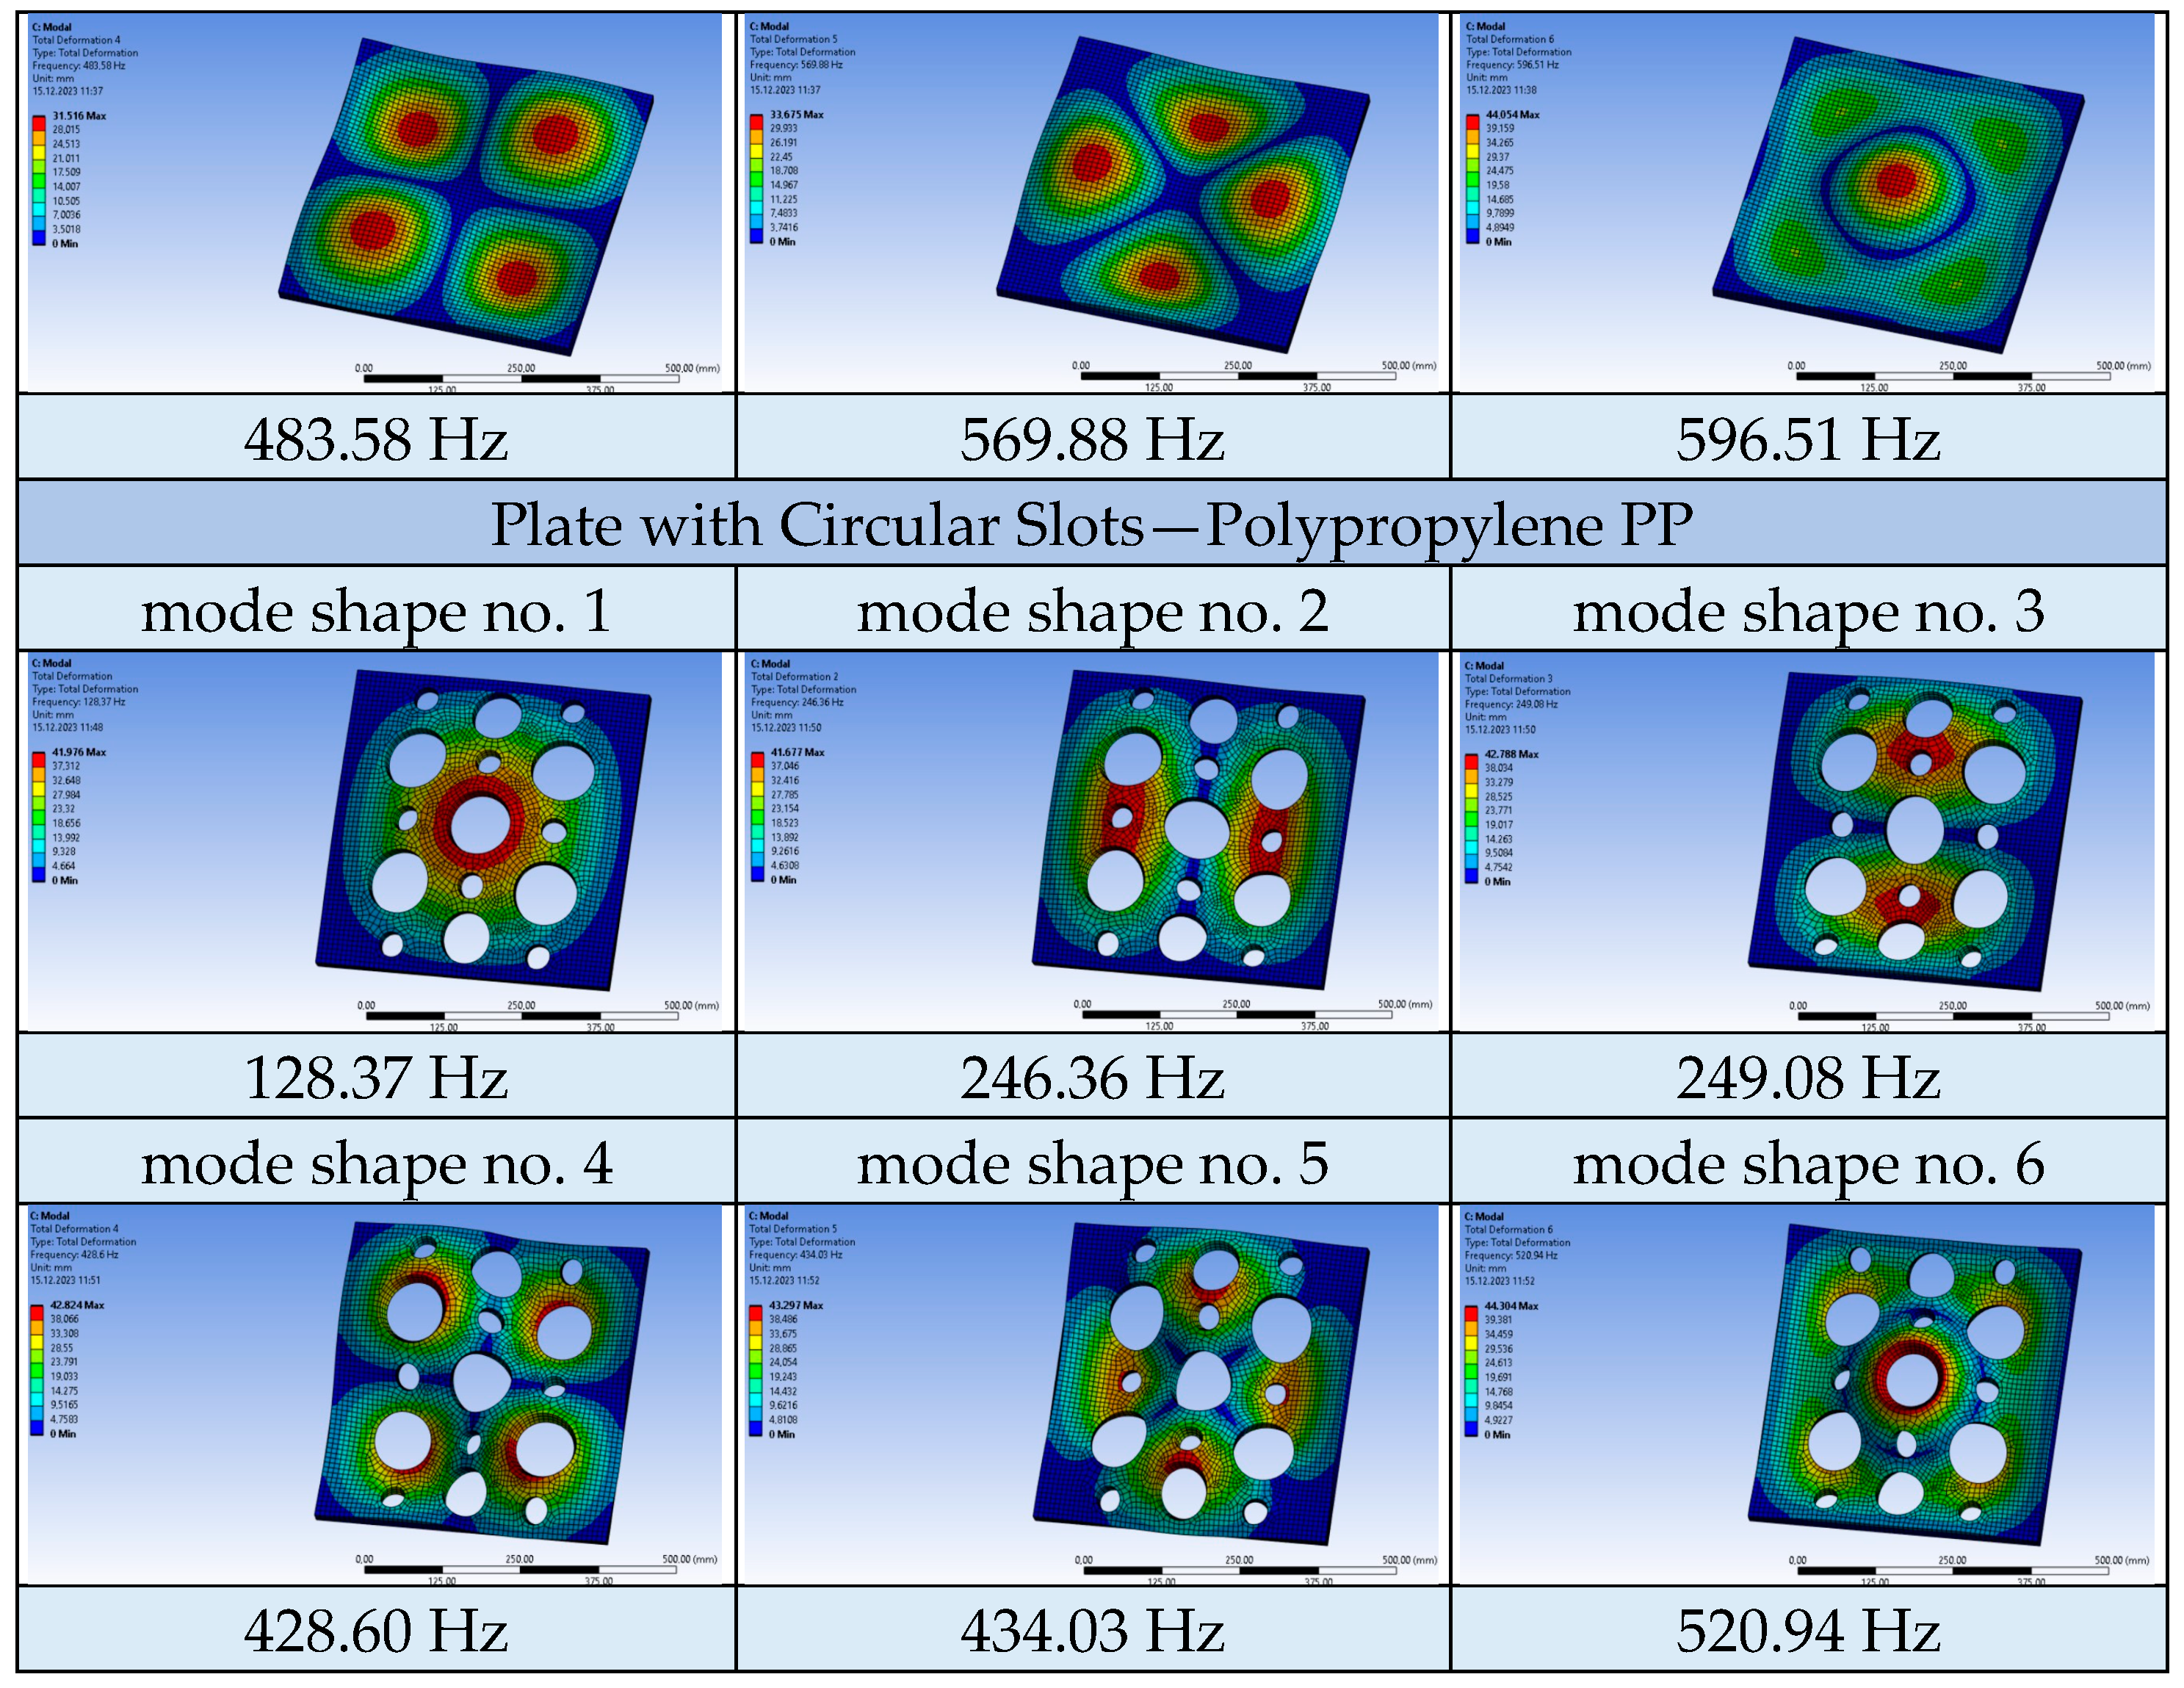
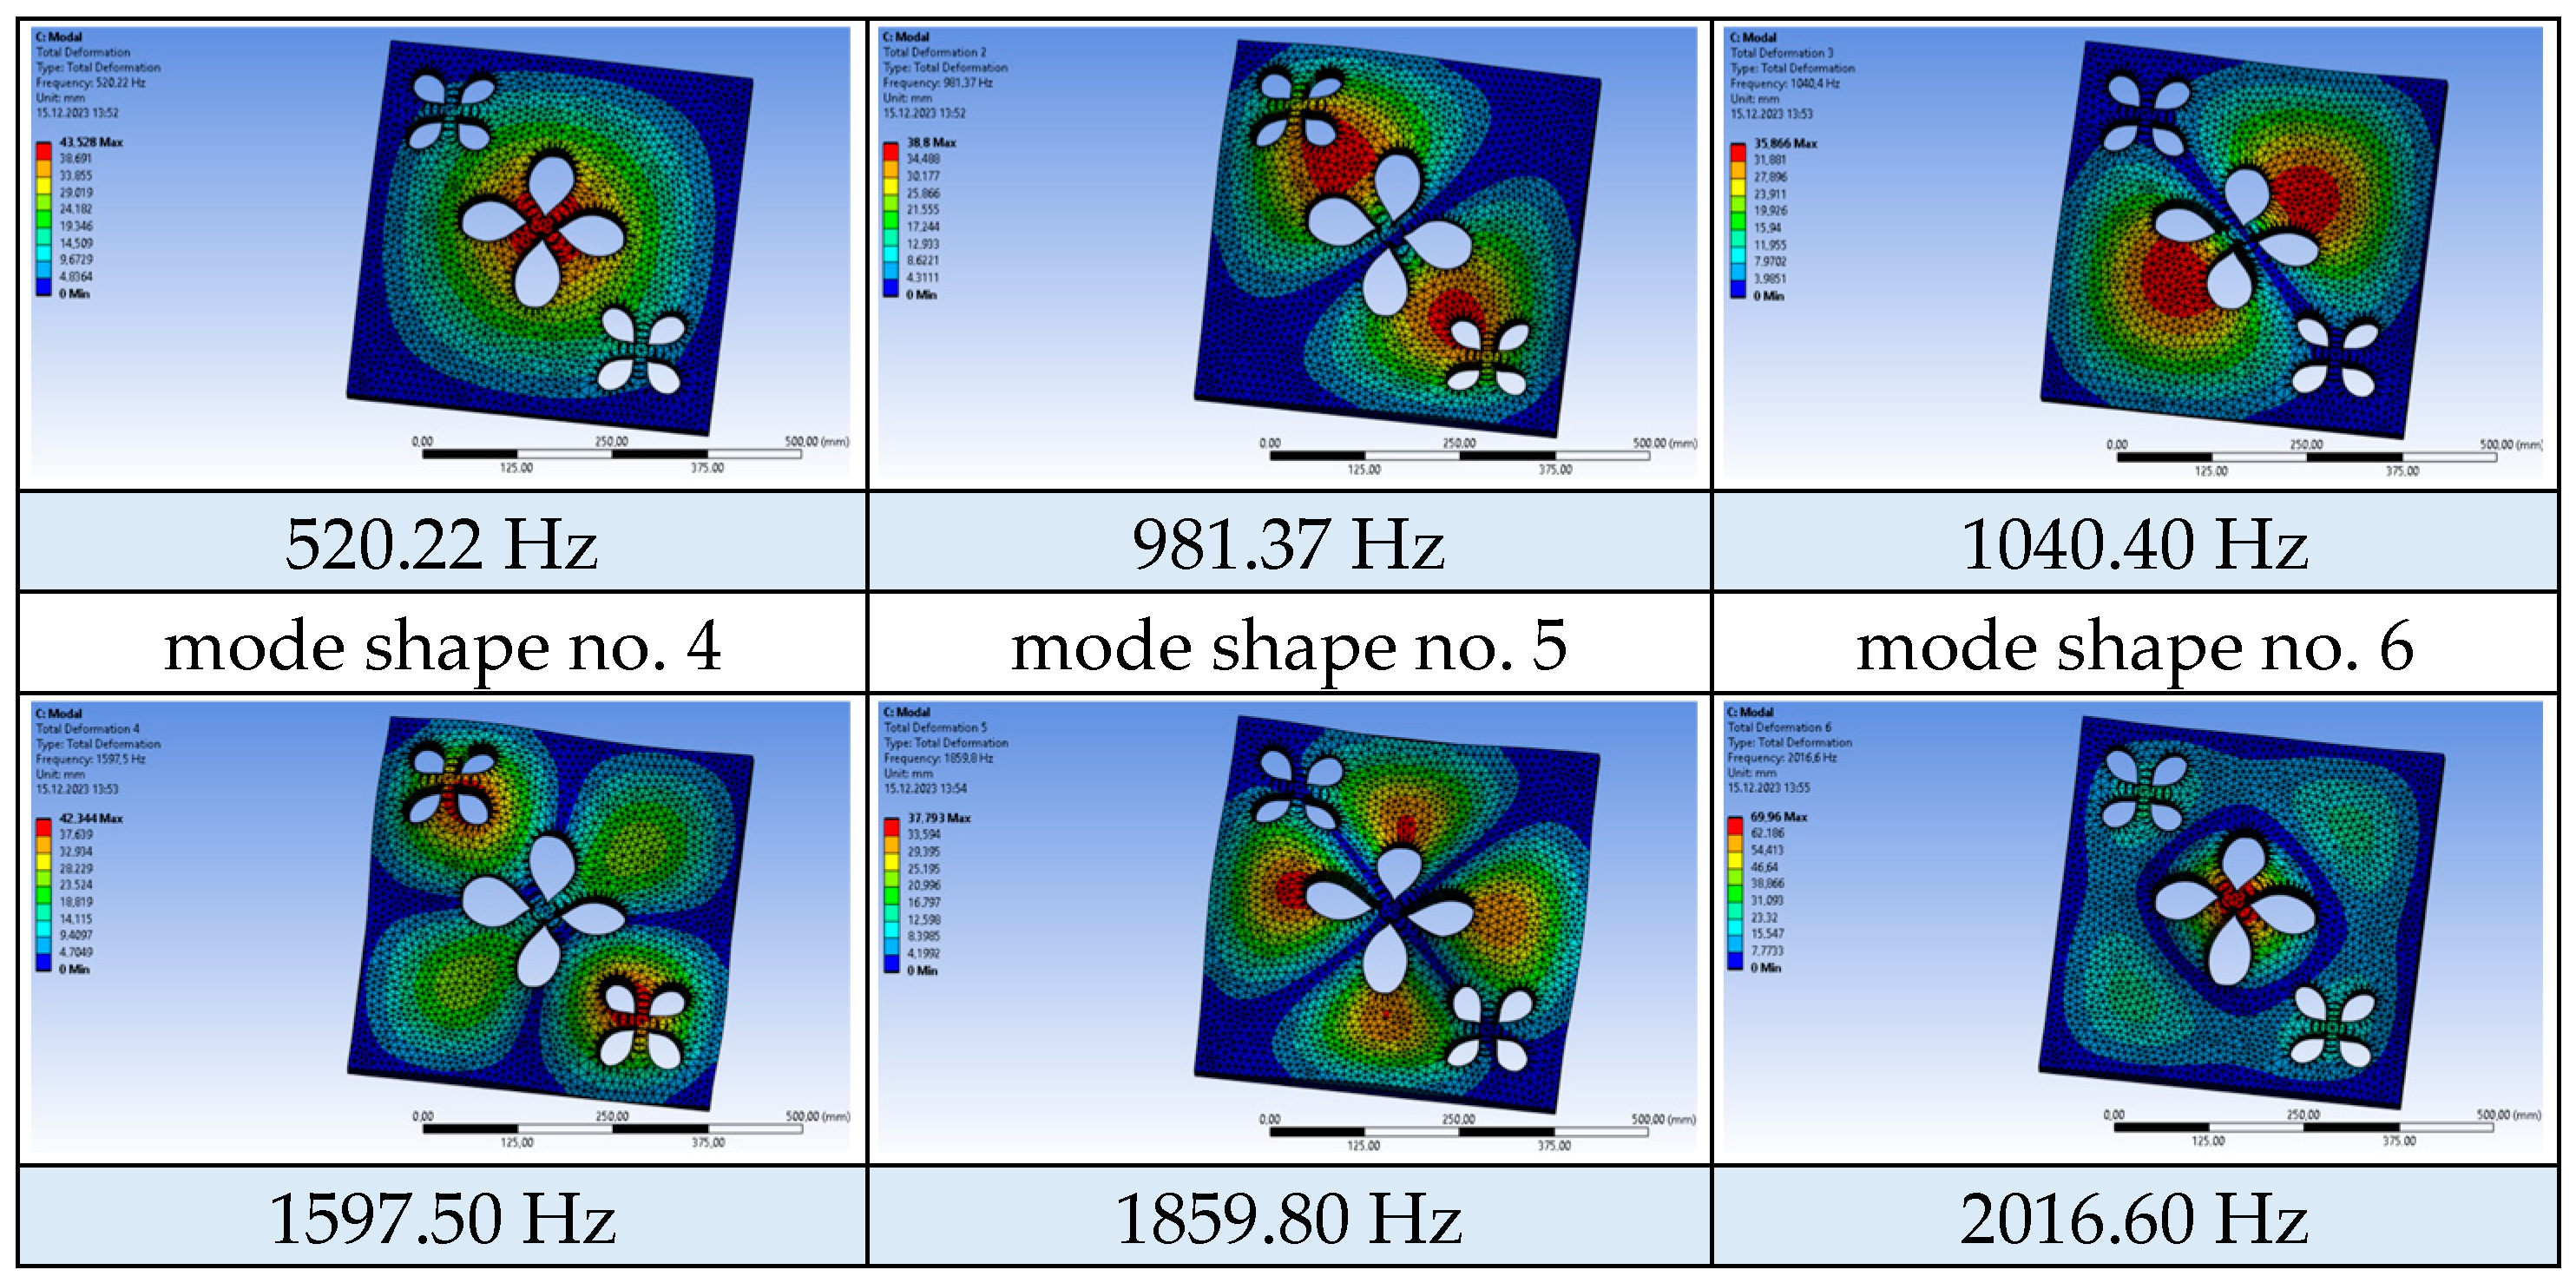
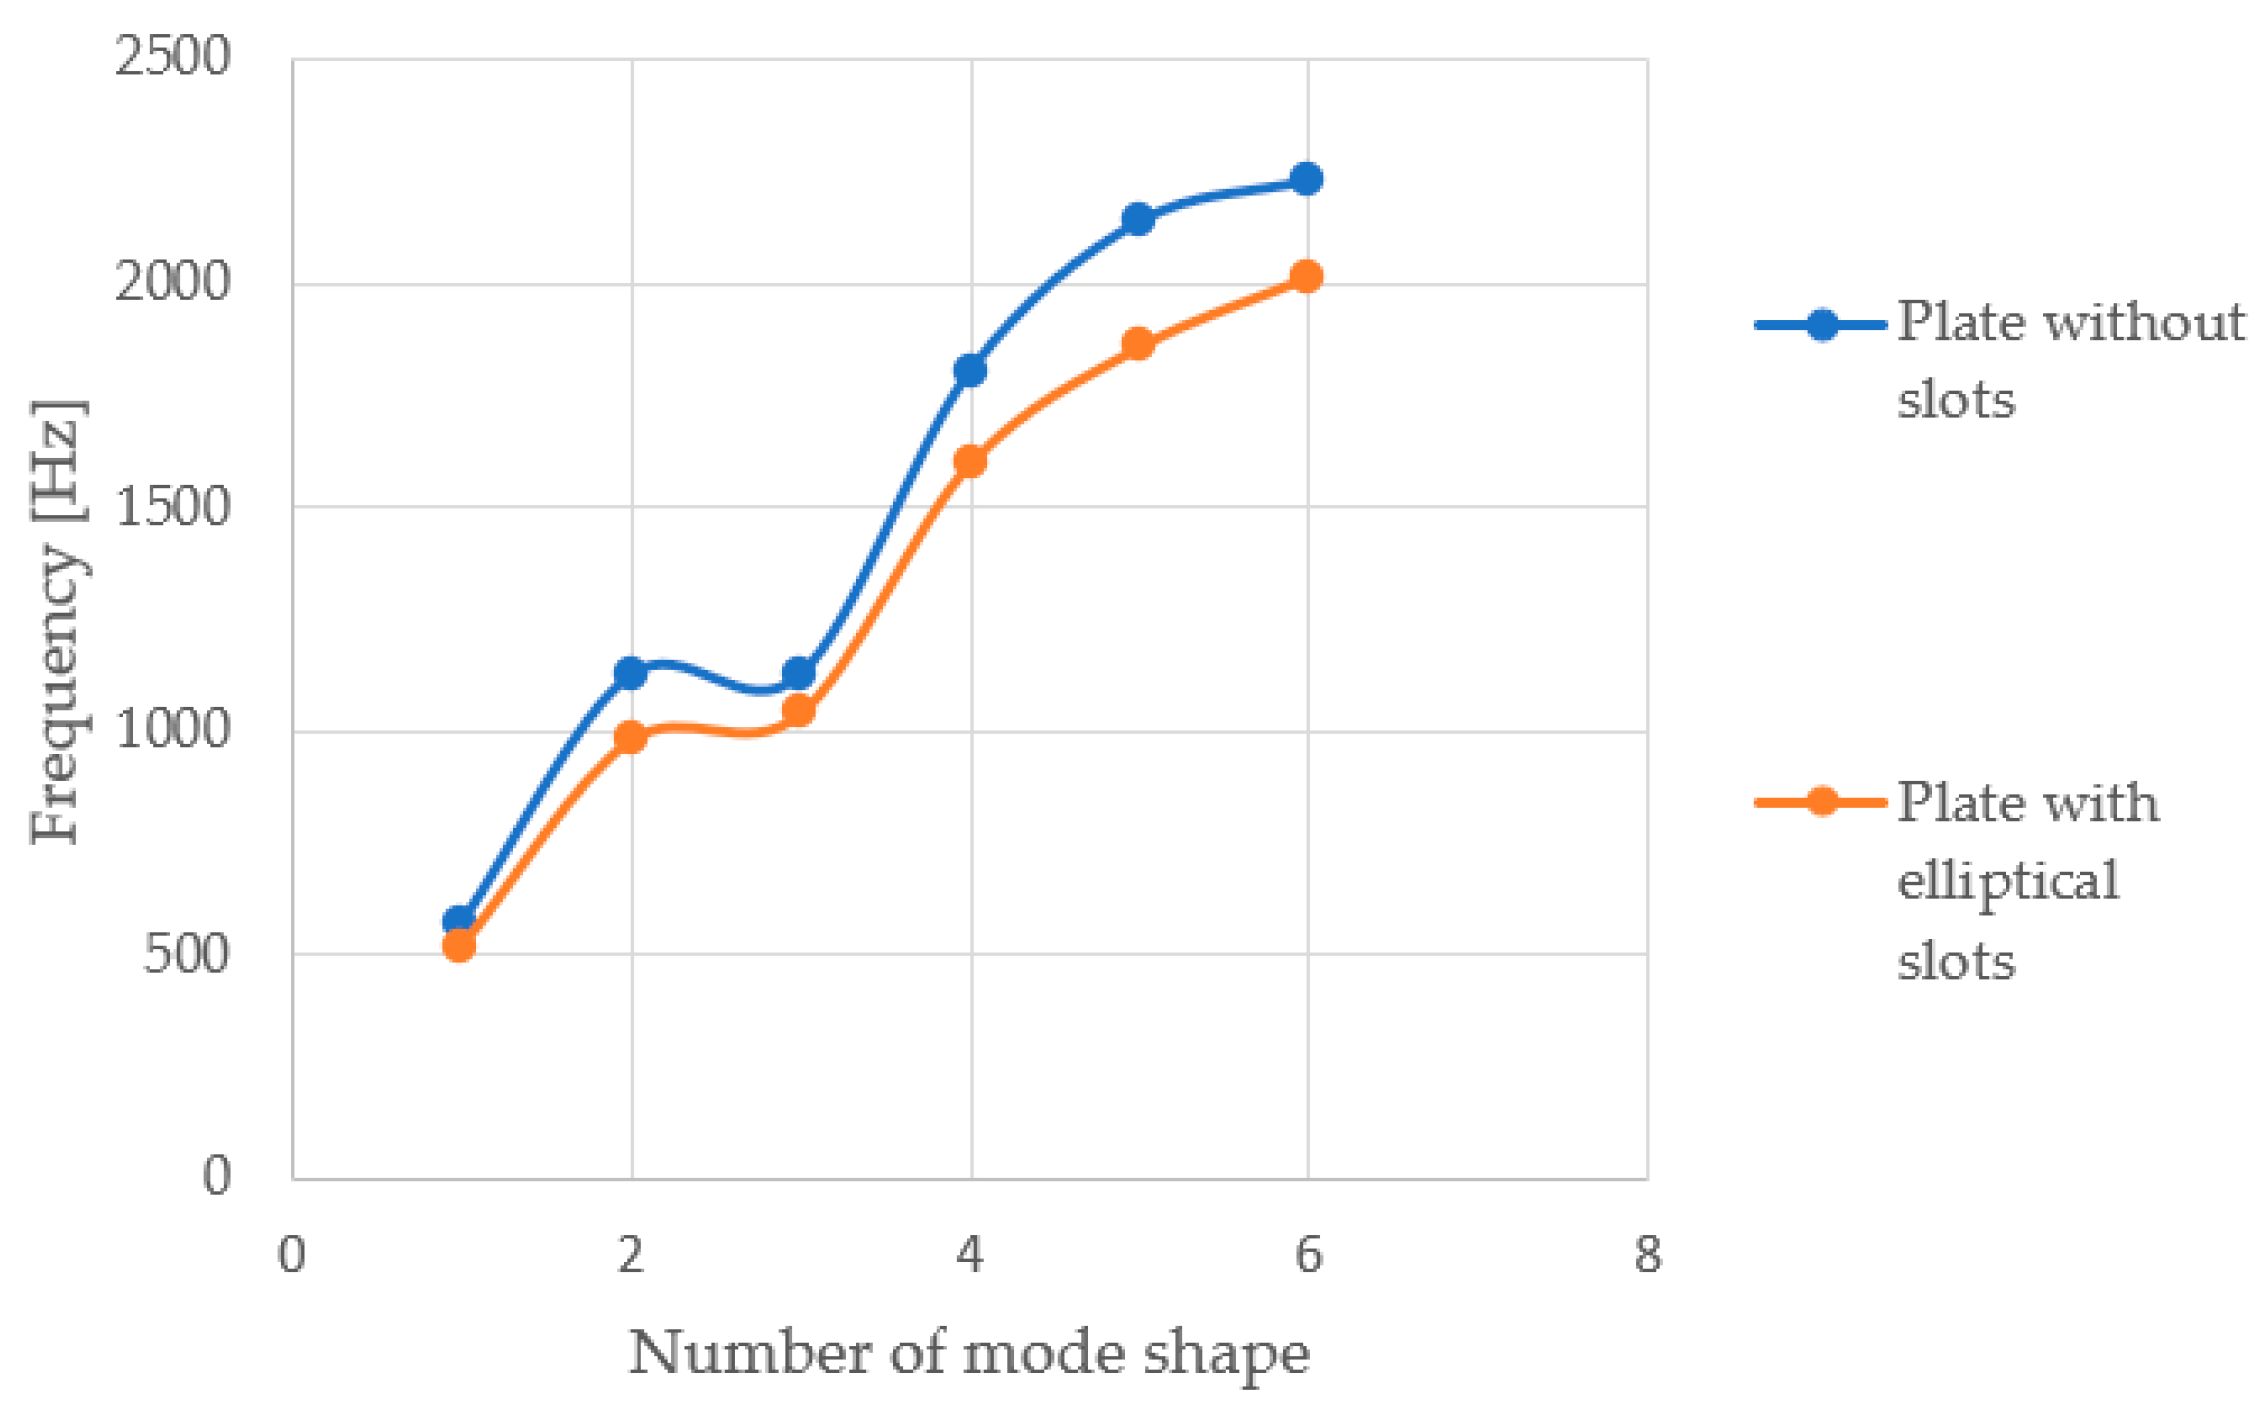
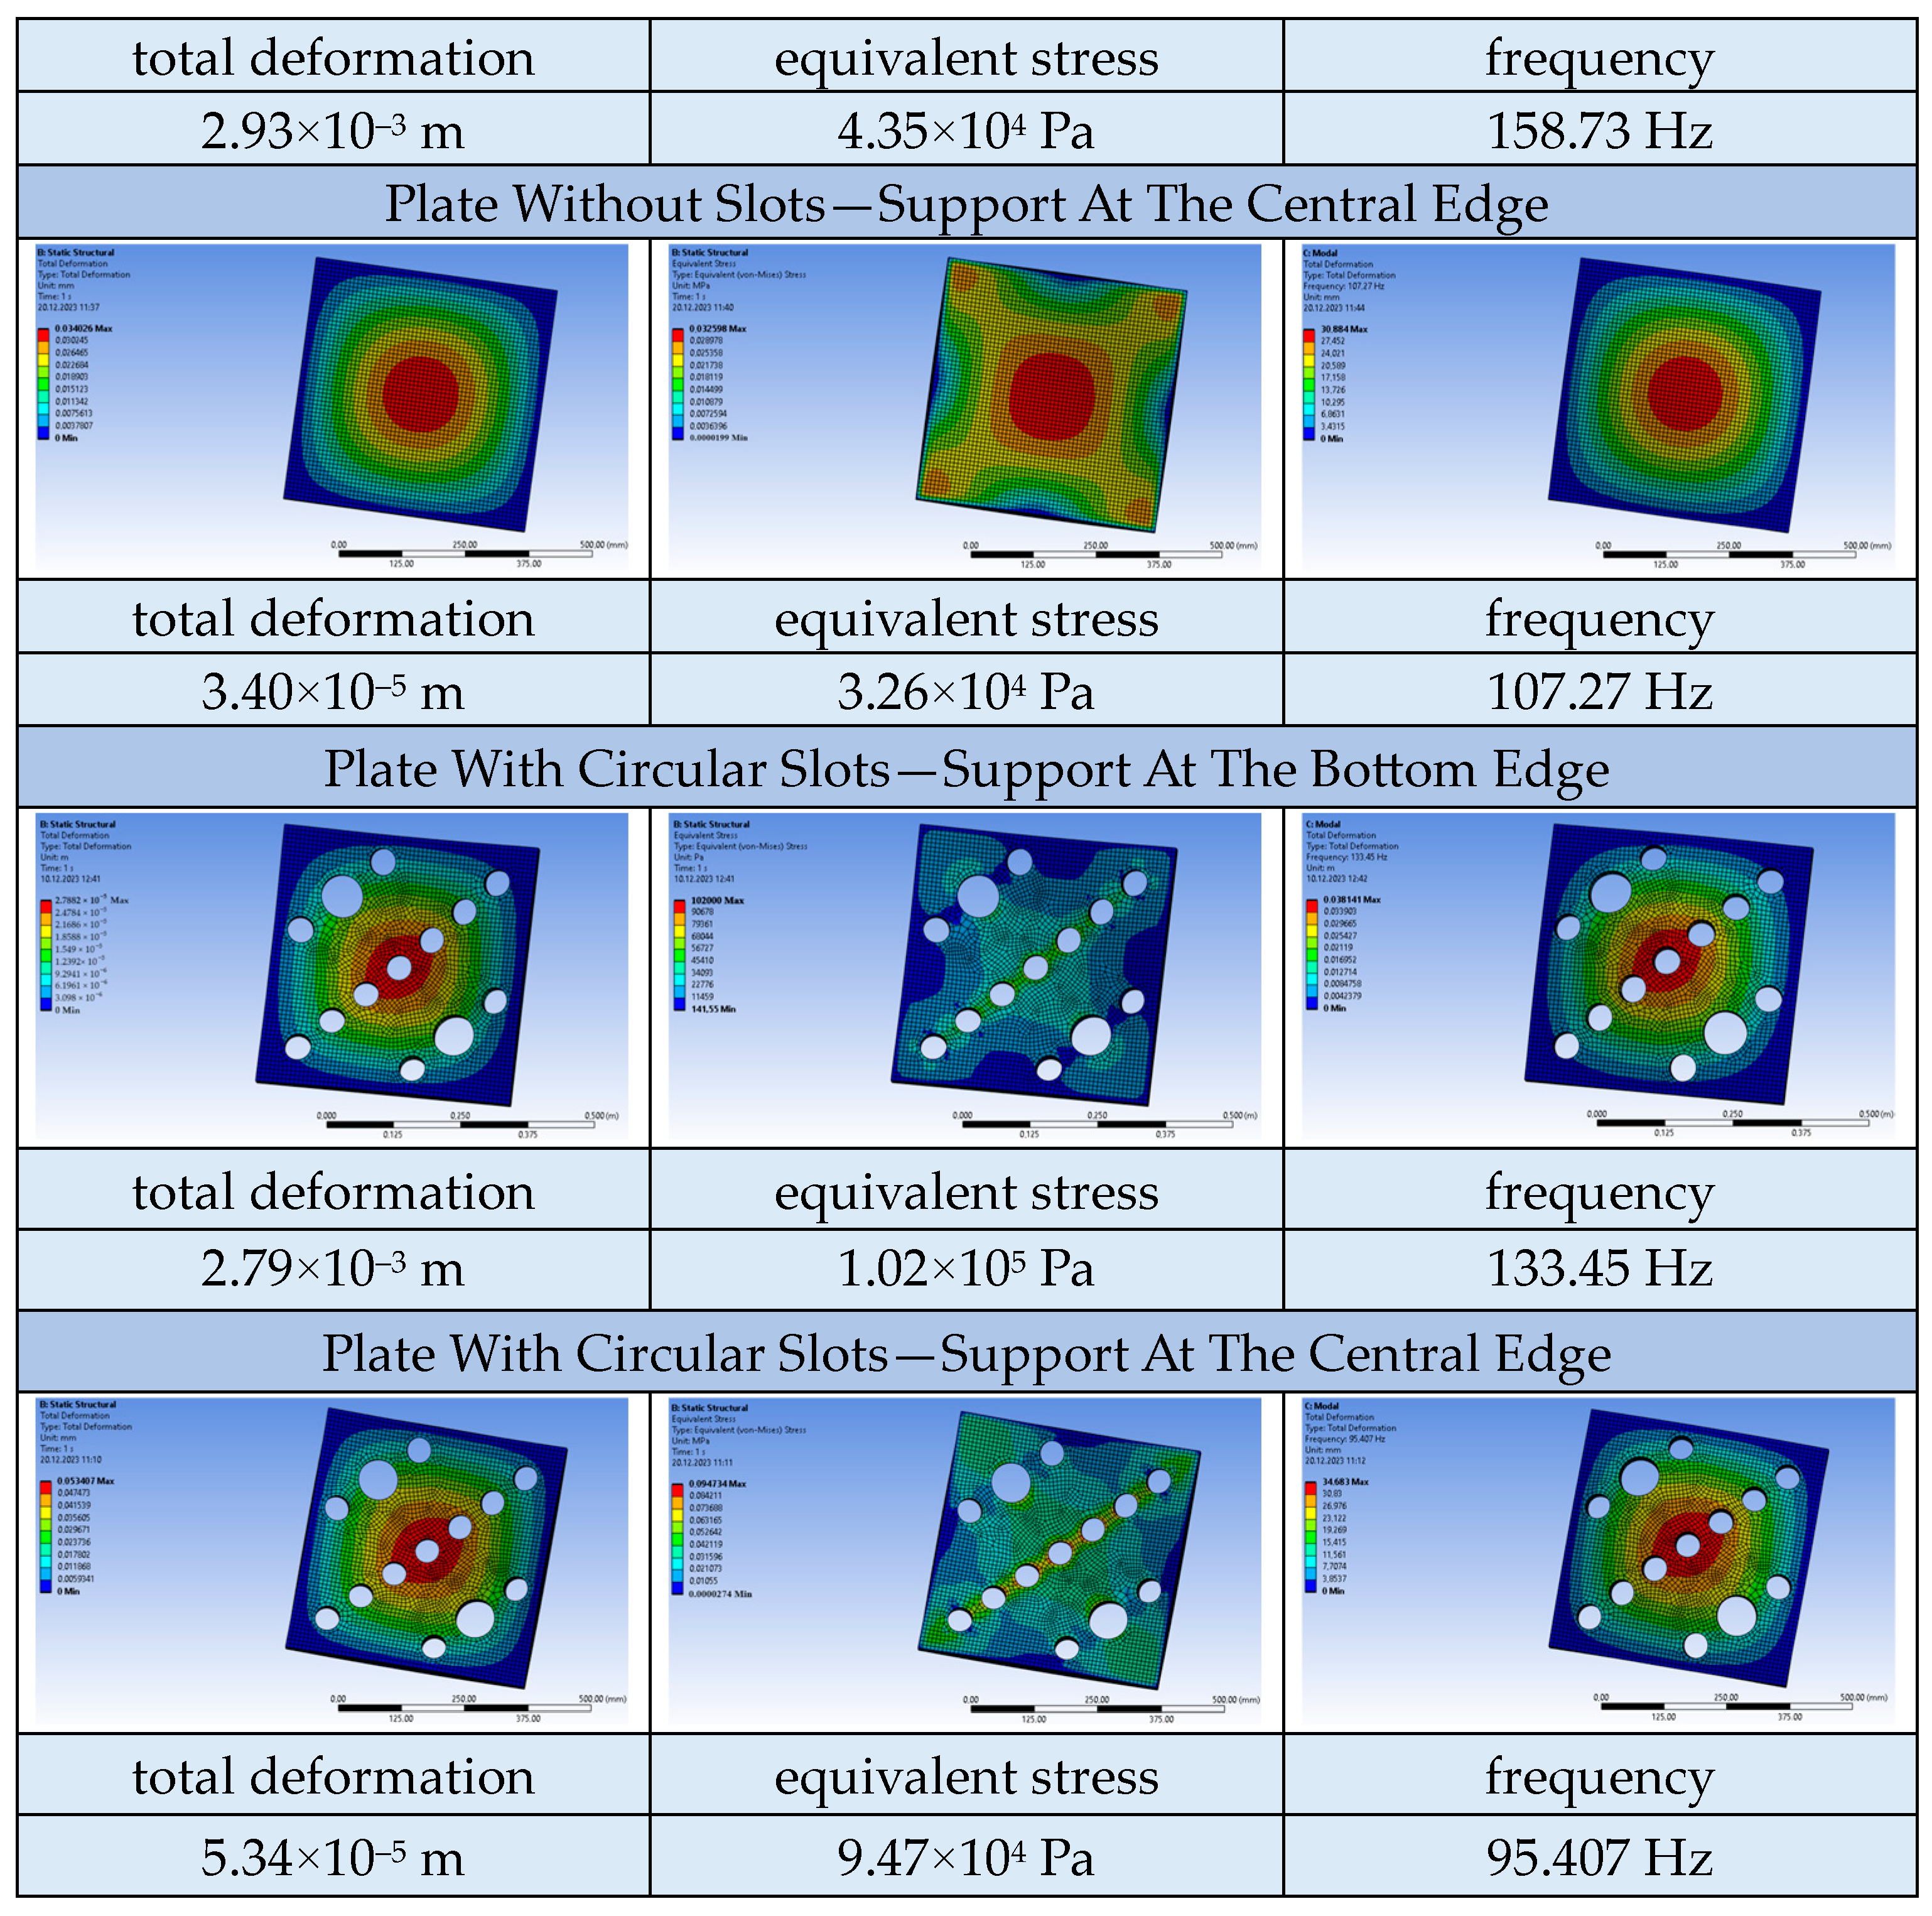
3.2. Dynamic and Static Analysis of the Plates
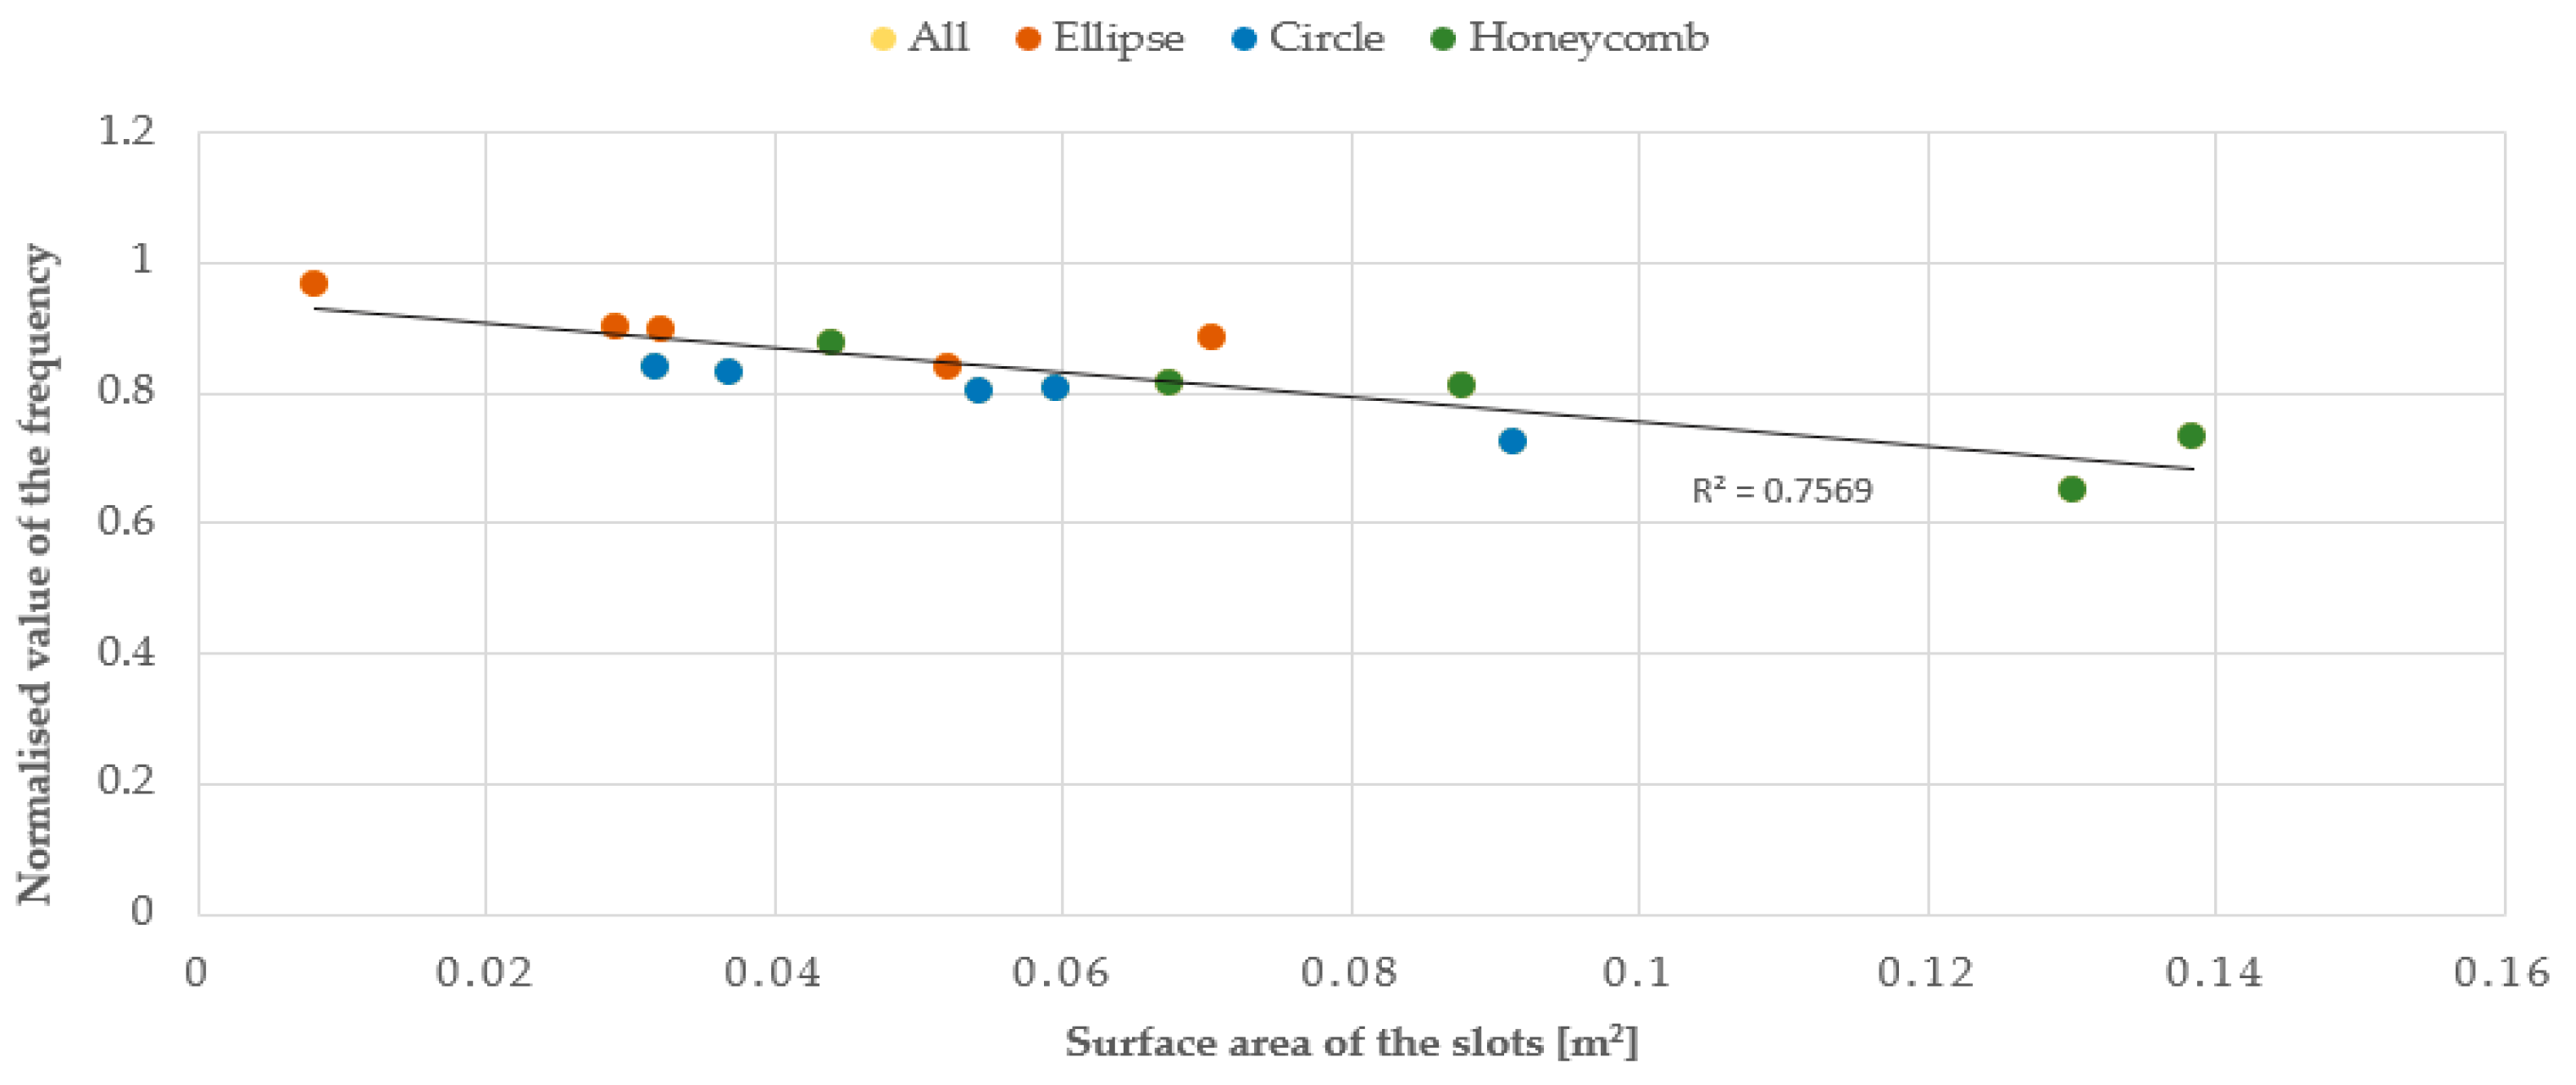
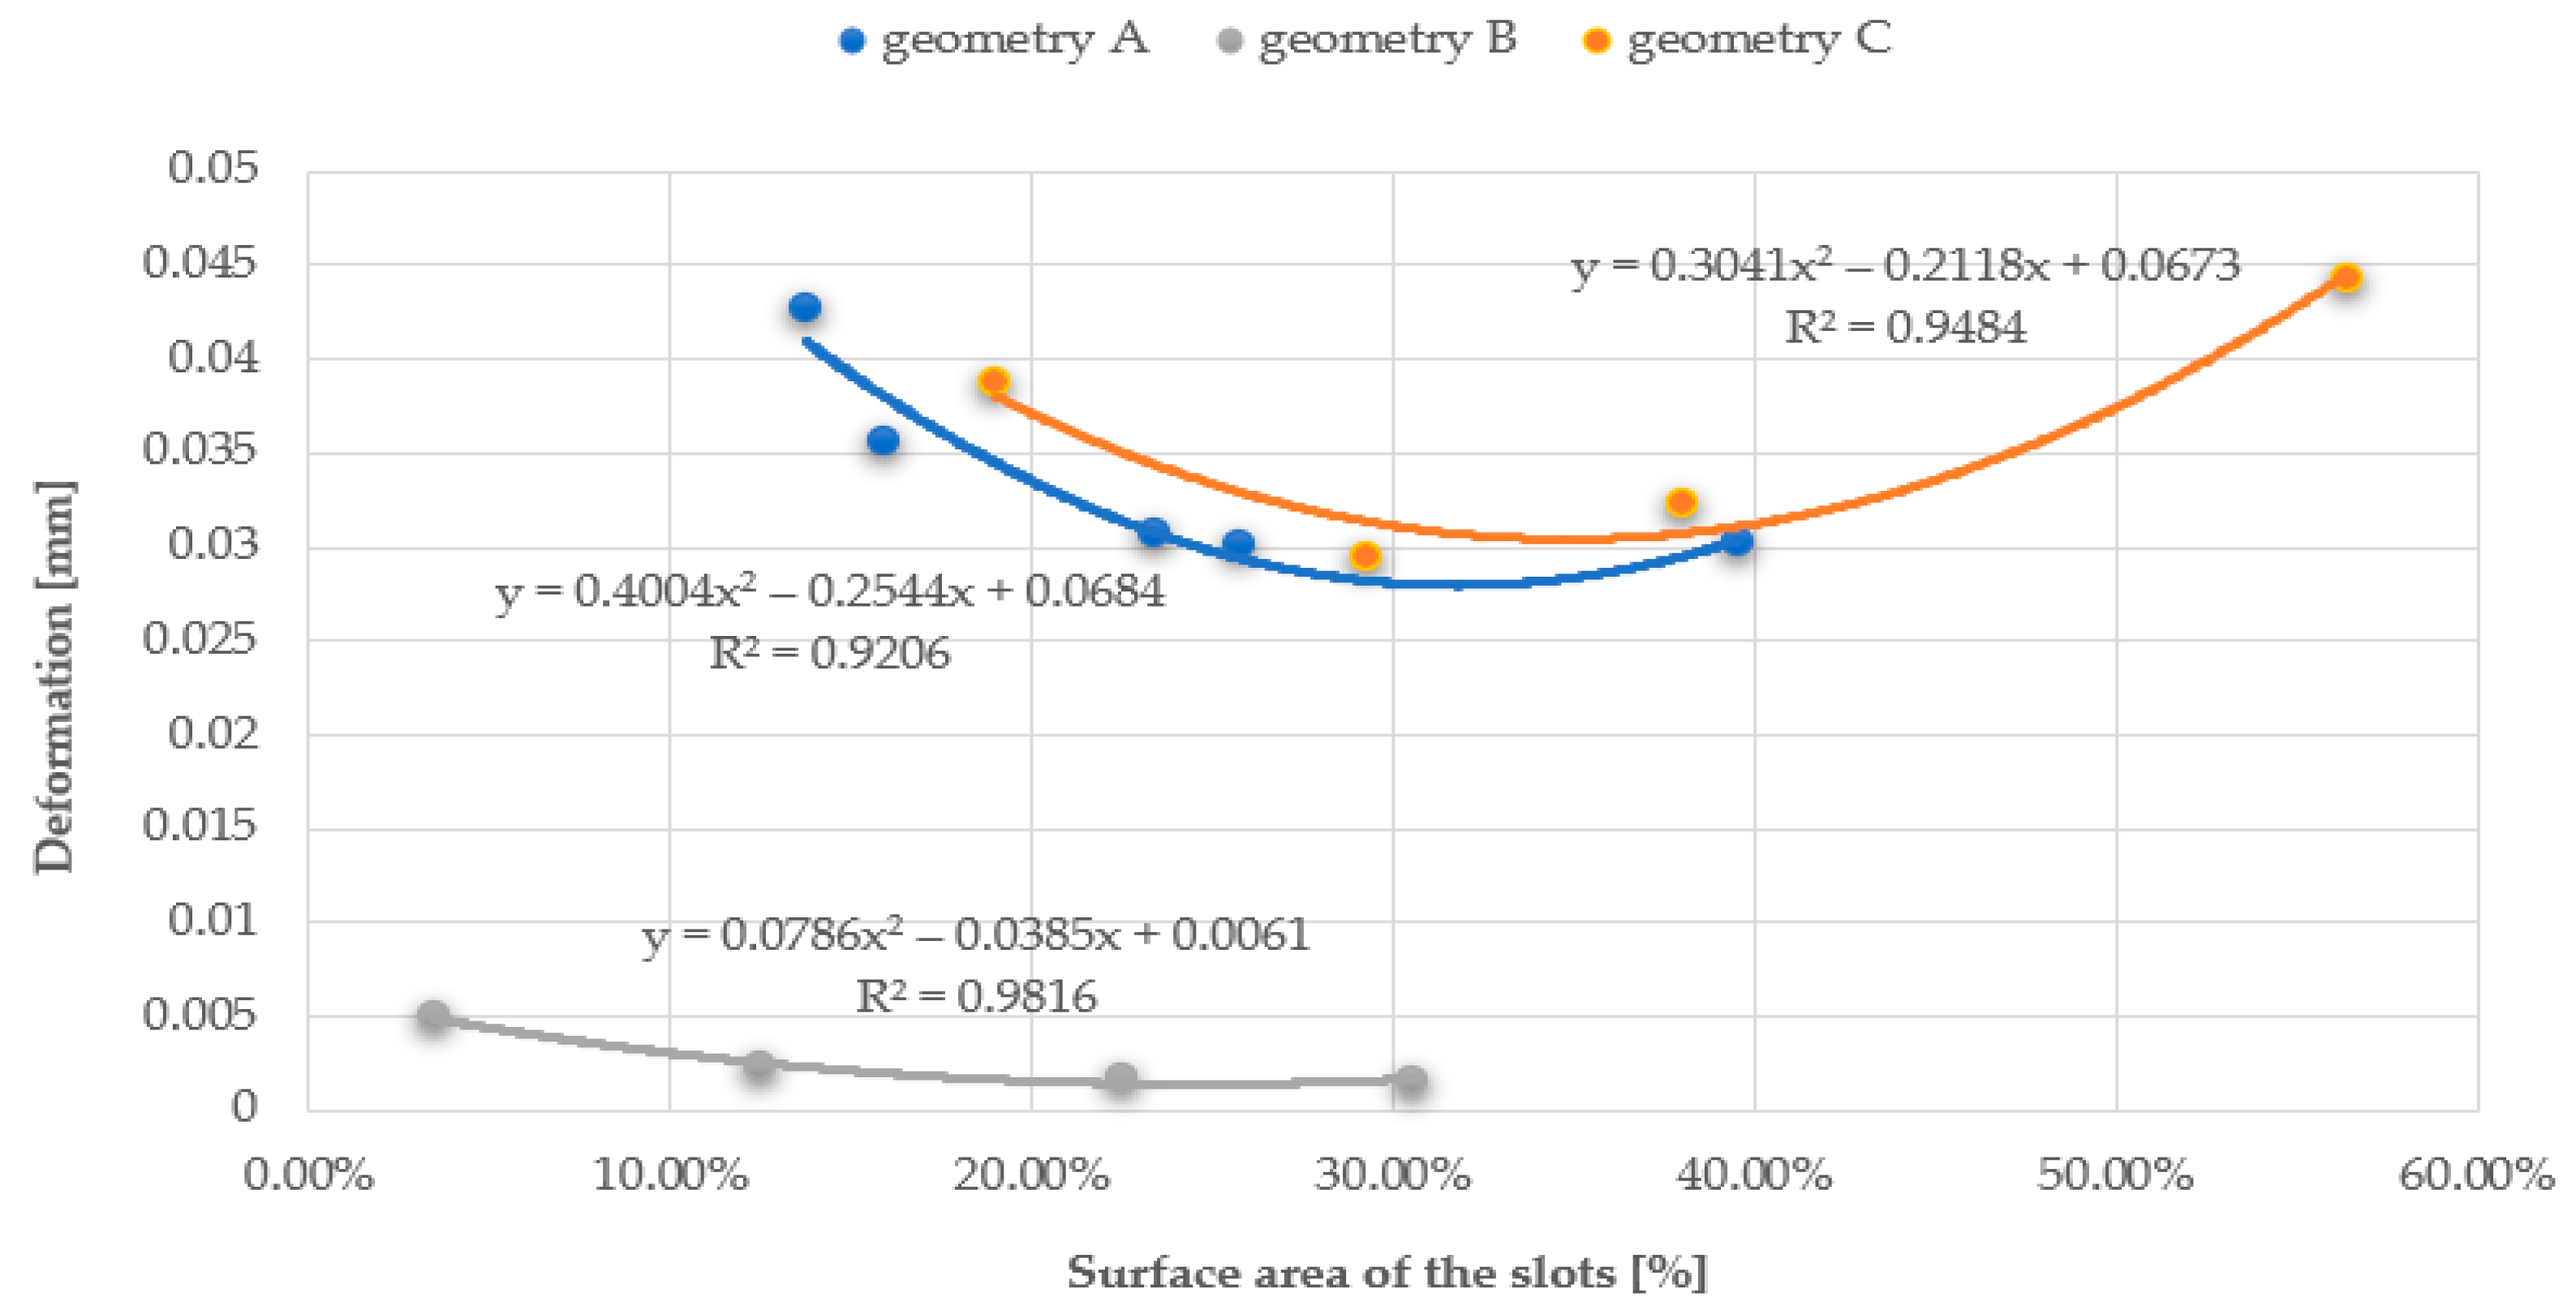
- From the total surface area of their openings (Figure 22);
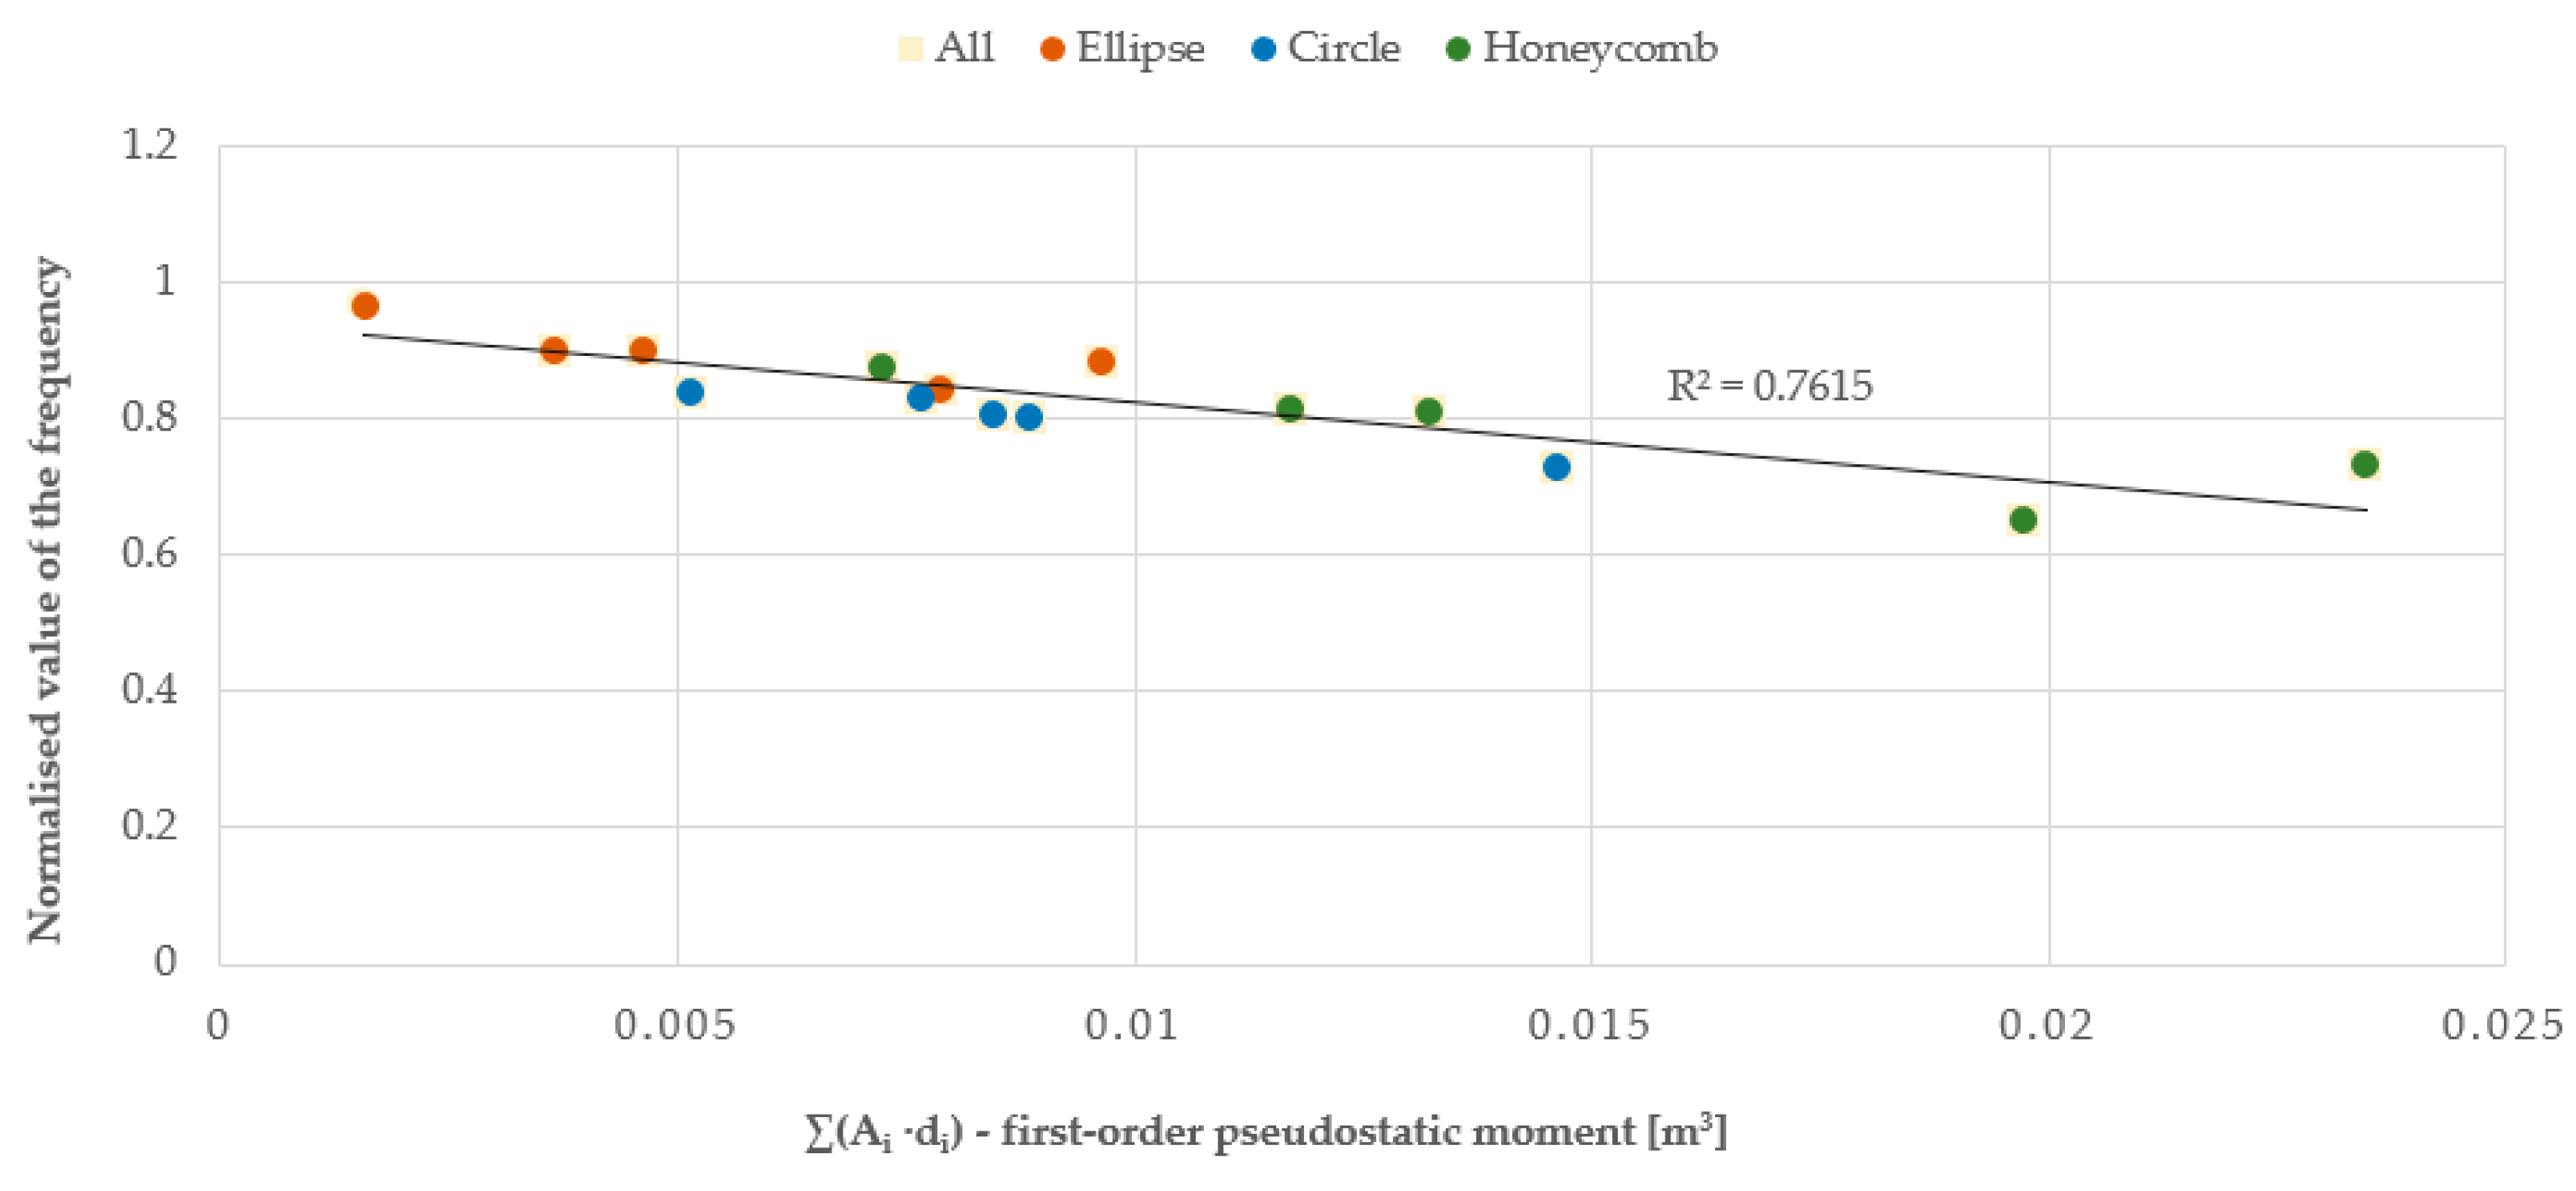
- From the ‘pseudostatic’ first-order moment (Figure 23), i.e., the product of the total surface area of the individual openings (Ai) and their distance from the centre of gravity of the plate (di), expressed by formula:
- From the ‘pseudostatic’ second-order moment (Figure 24), i.e., the product of the total surface area of the individual openings (Ai) and the square of their distance from the centre of gravity of the plate (di), expressed by formula:
4. Summary and Conclusions
Author Contributions
Funding
Institutional Review Board Statement
Informed Consent Statement
Data Availability Statement
Conflicts of Interest
References
- Taleghani, M.; Tenpierik, M.; Kurvers, S.; Dobbelsteen, A. A review into thermal comfort in buildings. Renew. Sustain. Energy Rev. 2013, 26, 201–215. [Google Scholar] [CrossRef]
- Youngson, O.; Badruddin, I.A.; Zainal, Z.A.; Aswatha Narayana, P.A. Airflow analysis in an air conditioning room. Build. Environ. 2007, 42, 1531–1537. [Google Scholar] [CrossRef]
- Akiahmadipour, M.; Abdolzadeh, M.; Lari, K. Air flow simulation of HVAC system in compartment of a passenger coach. Appl. Therm. Eng. 2017, 123, 973–990. [Google Scholar] [CrossRef]
- Zhang, C.; Heiselberg, P.; Nielsen, P. Diffuse Ceiling Ventilation. Int. J. Vent. 2014, 56, 49–64. [Google Scholar]
- Zhang, W.; Li, A.; Zhou, M.; Gao, R.; Yin, Y. Flow characteristics and structural parametric optimisation design of rectangular plenum chambers for HVAC systems. Energy Build. 2021, 246, 111112. [Google Scholar] [CrossRef]
- Rahnama, S.; Sadeghian, P.; Nielsen, P.V.; Zhang, C.; Sadrizadeh, S.; Afshari, A. Cooling capacity of diffuse ceiling ventilation system and the impact of heat load and diffuse panel distribution. Build. Environ. 2020, 185, 107290. [Google Scholar] [CrossRef]
- Aziz, M.; El Sherif, A. Biomimicry as an approach for bio-inspired structure with the aid of computation. Alex. Eng. J. 2015, 55, 707–7014. [Google Scholar] [CrossRef]
- Rocca, M.; Di Puccio, F.; Forte, P.; Leccese, F. Acoustic comfort requirements and classifications: Buildings vs. yachts. Ocean Eng. 2022, 255, 111374. [Google Scholar] [CrossRef]
- Surprenant, A.M. The Effect of Noise on Memory for Spoken Syllables. Int. J. Psychol. 2010, 34, 328–333. [Google Scholar] [CrossRef]
- Pellegatti, M.; Torresin, S.; Visentin, C.; Babich, F.; Prodi, P. Indoor soundscape, speech perception, and cognition in classrooms: A systematic review on the effects of ventilation-related sounds on students. Build. Environ. 2023, 236, 110194. [Google Scholar] [CrossRef]
- Ma, Y.; Ye, W. Biomimetic Coupling Structure Increases the Noise Friction and Sound Absorption Effect. Materials 2023, 16, 7148. [Google Scholar] [CrossRef] [PubMed]
- Tutek, K.; Masek, A. Hemp and Its Derivatives as a Universal Industrial Raw Material (with Particular Emphasis on the Polymer Industry)—A Review. Materials 2022, 15, 2565. [Google Scholar] [CrossRef] [PubMed]
- Bauchau, O.A.; Craig, J. I Kirchoff plate theory. Struct. Anal. 2009, 163, 819–914. [Google Scholar]
- Khan, R.; Wieczorowski, M.; Damjanowić, D.; Karim, M.R.; Alnaser, I.A. Erosion–Corrosion Failure Analysis of a Mild Steel Nozzle Pipe in Water–Sand Flow. Materials 2023, 16, 7084. [Google Scholar] [CrossRef] [PubMed]
- Wellinger, P.; Uhl, P.; Weigand, B.; Rodriguez, J. Analysis of turbulence structures and the validity of the linear Boussinesq hypothesis for an infinite tube bundle. Int. J. Heat Fluid Flow 2021, 91, 108779. [Google Scholar] [CrossRef]
- Jones, W.P.; Launder, B.E. The predictions of laminarization with a two-equation model of turbulence. Int. J. Heat Mass Transf. 1972, 15, 301–314. [Google Scholar] [CrossRef]
- Che Sidik, N.A.; Akmal Yusof, S.N.; Asako, Y.; Mohamed, S.B. A Short Review on RANS Turbulence Models. CFD Lett. 2020, 12, 83–96. [Google Scholar] [CrossRef]
- Launder, B.E.; Sharma, D.B. Application of the energy-dissipation model of turbulence to the calculation of flow near a spinning disc. Lett. Heat Mass Transf. 1974, 1, 131–137. [Google Scholar] [CrossRef]
- Błazik-Borowa, E. Problems Related to the Use of the k-ε Turbulence Model to Determine Building Flow Parameters; Lublin University of Technology Publishing House: Lublin, Poland, 2008; pp. 173–195. [Google Scholar]
- Konoval, V.; Prytula, R. Participation factor in modal analysis of power systems stability. Pozn. Univ. Technol. Acad. J. Electr. Eng. 2016, 86, 97–104. [Google Scholar]


| A1 | A2 | A3 | A4 | A5 | |
| Total slots area A [m2] | 0.05938 | 0.031647 | 0.03676 | 0.091102 | 0.054039 |
| First pseudostatic moment ∑Aidi [m3] | 0.00843522 | 0.005140504 | 0.007669144 | 0.014613606 | 0.008837521 |
| Second pseudostatic moment ∑Aidi2 [m4] | 0.001424596 | 0.000947058 | 0.001678304 | 0.002582505 | 0.001485135 |
| B1 | B2 | B3 | B4 | B5 | |
| Total slots area A [m2] | 0.051954722 | 0.070359903 | 0.00801954 | 0.032078151 | 0.028817328 |
| First pseudostatic moment ∑Aidi [m3] | 0.007881531 | 0.009649025 | 0.001570867 | 0.004622463 | 0.00365624 |
| Second pseudostatic moment ∑Aidi2 [m4] | 0.001296856 | 0.001354151 | 0.000312921 | 0.000801851 | 0.000605092 |
| C1 | C2 | C3 | C4 | C5 | |
| Total slots area A [m2] | 0.138251 | 0.129905 | 0.06734 | 0.043771 | 0.087542 |
| First pseudostatic moment ∑Aidi [m3] | 0.02345967 | 0.019714383 | 0.011703692 | 0.007226255 | 0.013220189 |
| Second pseudostatic moment ∑Aidi2 [m4] | 0.004615813 | 0.003739818 | 0.002102095 | 0.001397285 | 0.002557995 |
| Series A—Plates with Circular Slots | ||||
| Material | Plate thickness [mm] | Density [kg/m3] | Young’s modulus [MPa] | Poisson’s ratio [-] |
| Polypropylene PP | 20 | 903.4 | 1461 | 0.408 |
| Polypropylene PP | 50 | 903.4 | 1461 | 0.408 |
| Polypropylene PP | 80 | 903.4 | 1461 | 0.408 |
| Series B—Plates with Elliptical Slots | ||||
| Material | Plate thickness [mm] | Density [kg/m3] | Young’s modulus [MPa] | Poisson’s ratio [-] |
| Wood | 20 | 935.7 | 22,780 | 0.3742 |
| Wood | 50 | 935.7 | 22,780 | 0.3742 |
| Wood | 80 | 935.7 | 22,780 | 0.3742 |
| Series C—Plates with Hexagonal Slots | ||||
| Material | Plate thickness [mm] | Density [kg/m3] | Young’s modulus [MPa] | Poisson’s ratio [-] |
| Aluminium | 2 | 2770 | 71,000 | 0.33 |
| Aluminium | 5 | 2770 | 71,000 | 0.33 |
| Aluminium | 8 | 2770 | 71,000 | 0.33 |
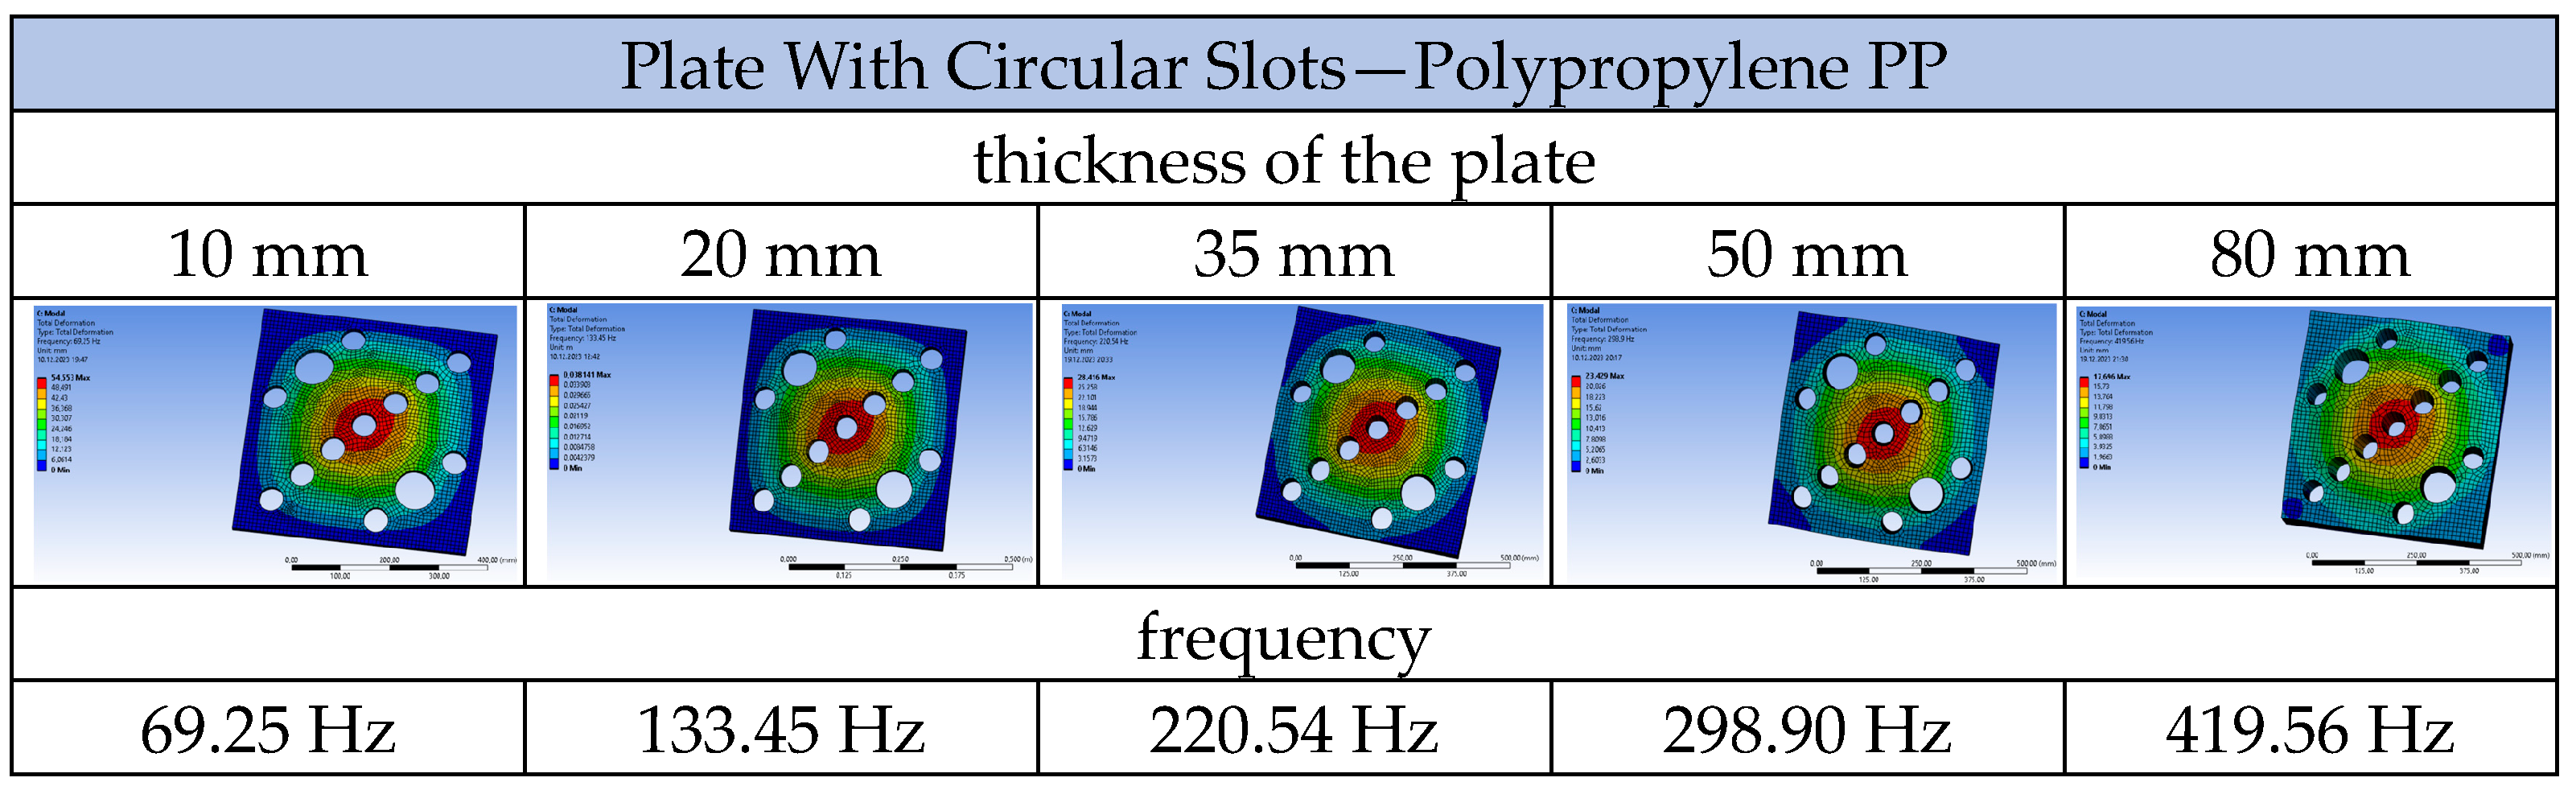
| Plate with Circular Slots—Polypropylene PP—Geometry A2 | |||
|---|---|---|---|
| Velocity of Airflow | 1.5 m/s | 3.0 m/s | 10.0 m/s |
| Frequency for 1st mode shape: | 133.45 Hz | 133.42 Hz | 133.05 Hz |
| Frequency for 2nd mode shape: | 263.40 Hz | 263.36 Hz | 262.90 Hz |
| Frequency for 3rd mode shape: | 269.43 Hz | 269.40 Hz | 269.00 Hz |
| Frequency for 4th mode shape: | 430.87 Hz | 430.84 Hz | 430.43 Hz |
| Frequency for 5th mode shape: | 496.17 Hz | 496.14 Hz | 495.67 Hz |
| Frequency for 6th mode shape: | 534.24 Hz | 534.21 Hz | 533.77 Hz |
Disclaimer/Publisher’s Note: The statements, opinions and data contained in all publications are solely those of the individual author(s) and contributor(s) and not of MDPI and/or the editor(s). MDPI and/or the editor(s) disclaim responsibility for any injury to people or property resulting from any ideas, methods, instructions or products referred to in the content. |
© 2024 by the authors. Licensee MDPI, Basel, Switzerland. This article is an open access article distributed under the terms and conditions of the Creative Commons Attribution (CC BY) license (https://creativecommons.org/licenses/by/4.0/).
Share and Cite
Wirowski, A.; Kubacka, E.; Kaszubska, P.; Walisiak, W. Numerical Analysis of the Dynamic Properties of Bionic Raster Ceilings. Materials 2024, 17, 3925. https://doi.org/10.3390/ma17163925
Wirowski A, Kubacka E, Kaszubska P, Walisiak W. Numerical Analysis of the Dynamic Properties of Bionic Raster Ceilings. Materials. 2024; 17(16):3925. https://doi.org/10.3390/ma17163925
Chicago/Turabian StyleWirowski, Artur, Ewelina Kubacka, Paulina Kaszubska, and Weronika Walisiak. 2024. "Numerical Analysis of the Dynamic Properties of Bionic Raster Ceilings" Materials 17, no. 16: 3925. https://doi.org/10.3390/ma17163925