
Design and Microwave Absorption Performance Study of SiC-Fe3O4 Emulsified Asphalt Mixture


Abstract
:1. Introduction
2. Materials and Methods
2.1. Materials and Preparation
2.1.1. Modified Emulsified Asphalt
2.1.2. Mineral Materials
2.1.3. Mineral Powder and Cement
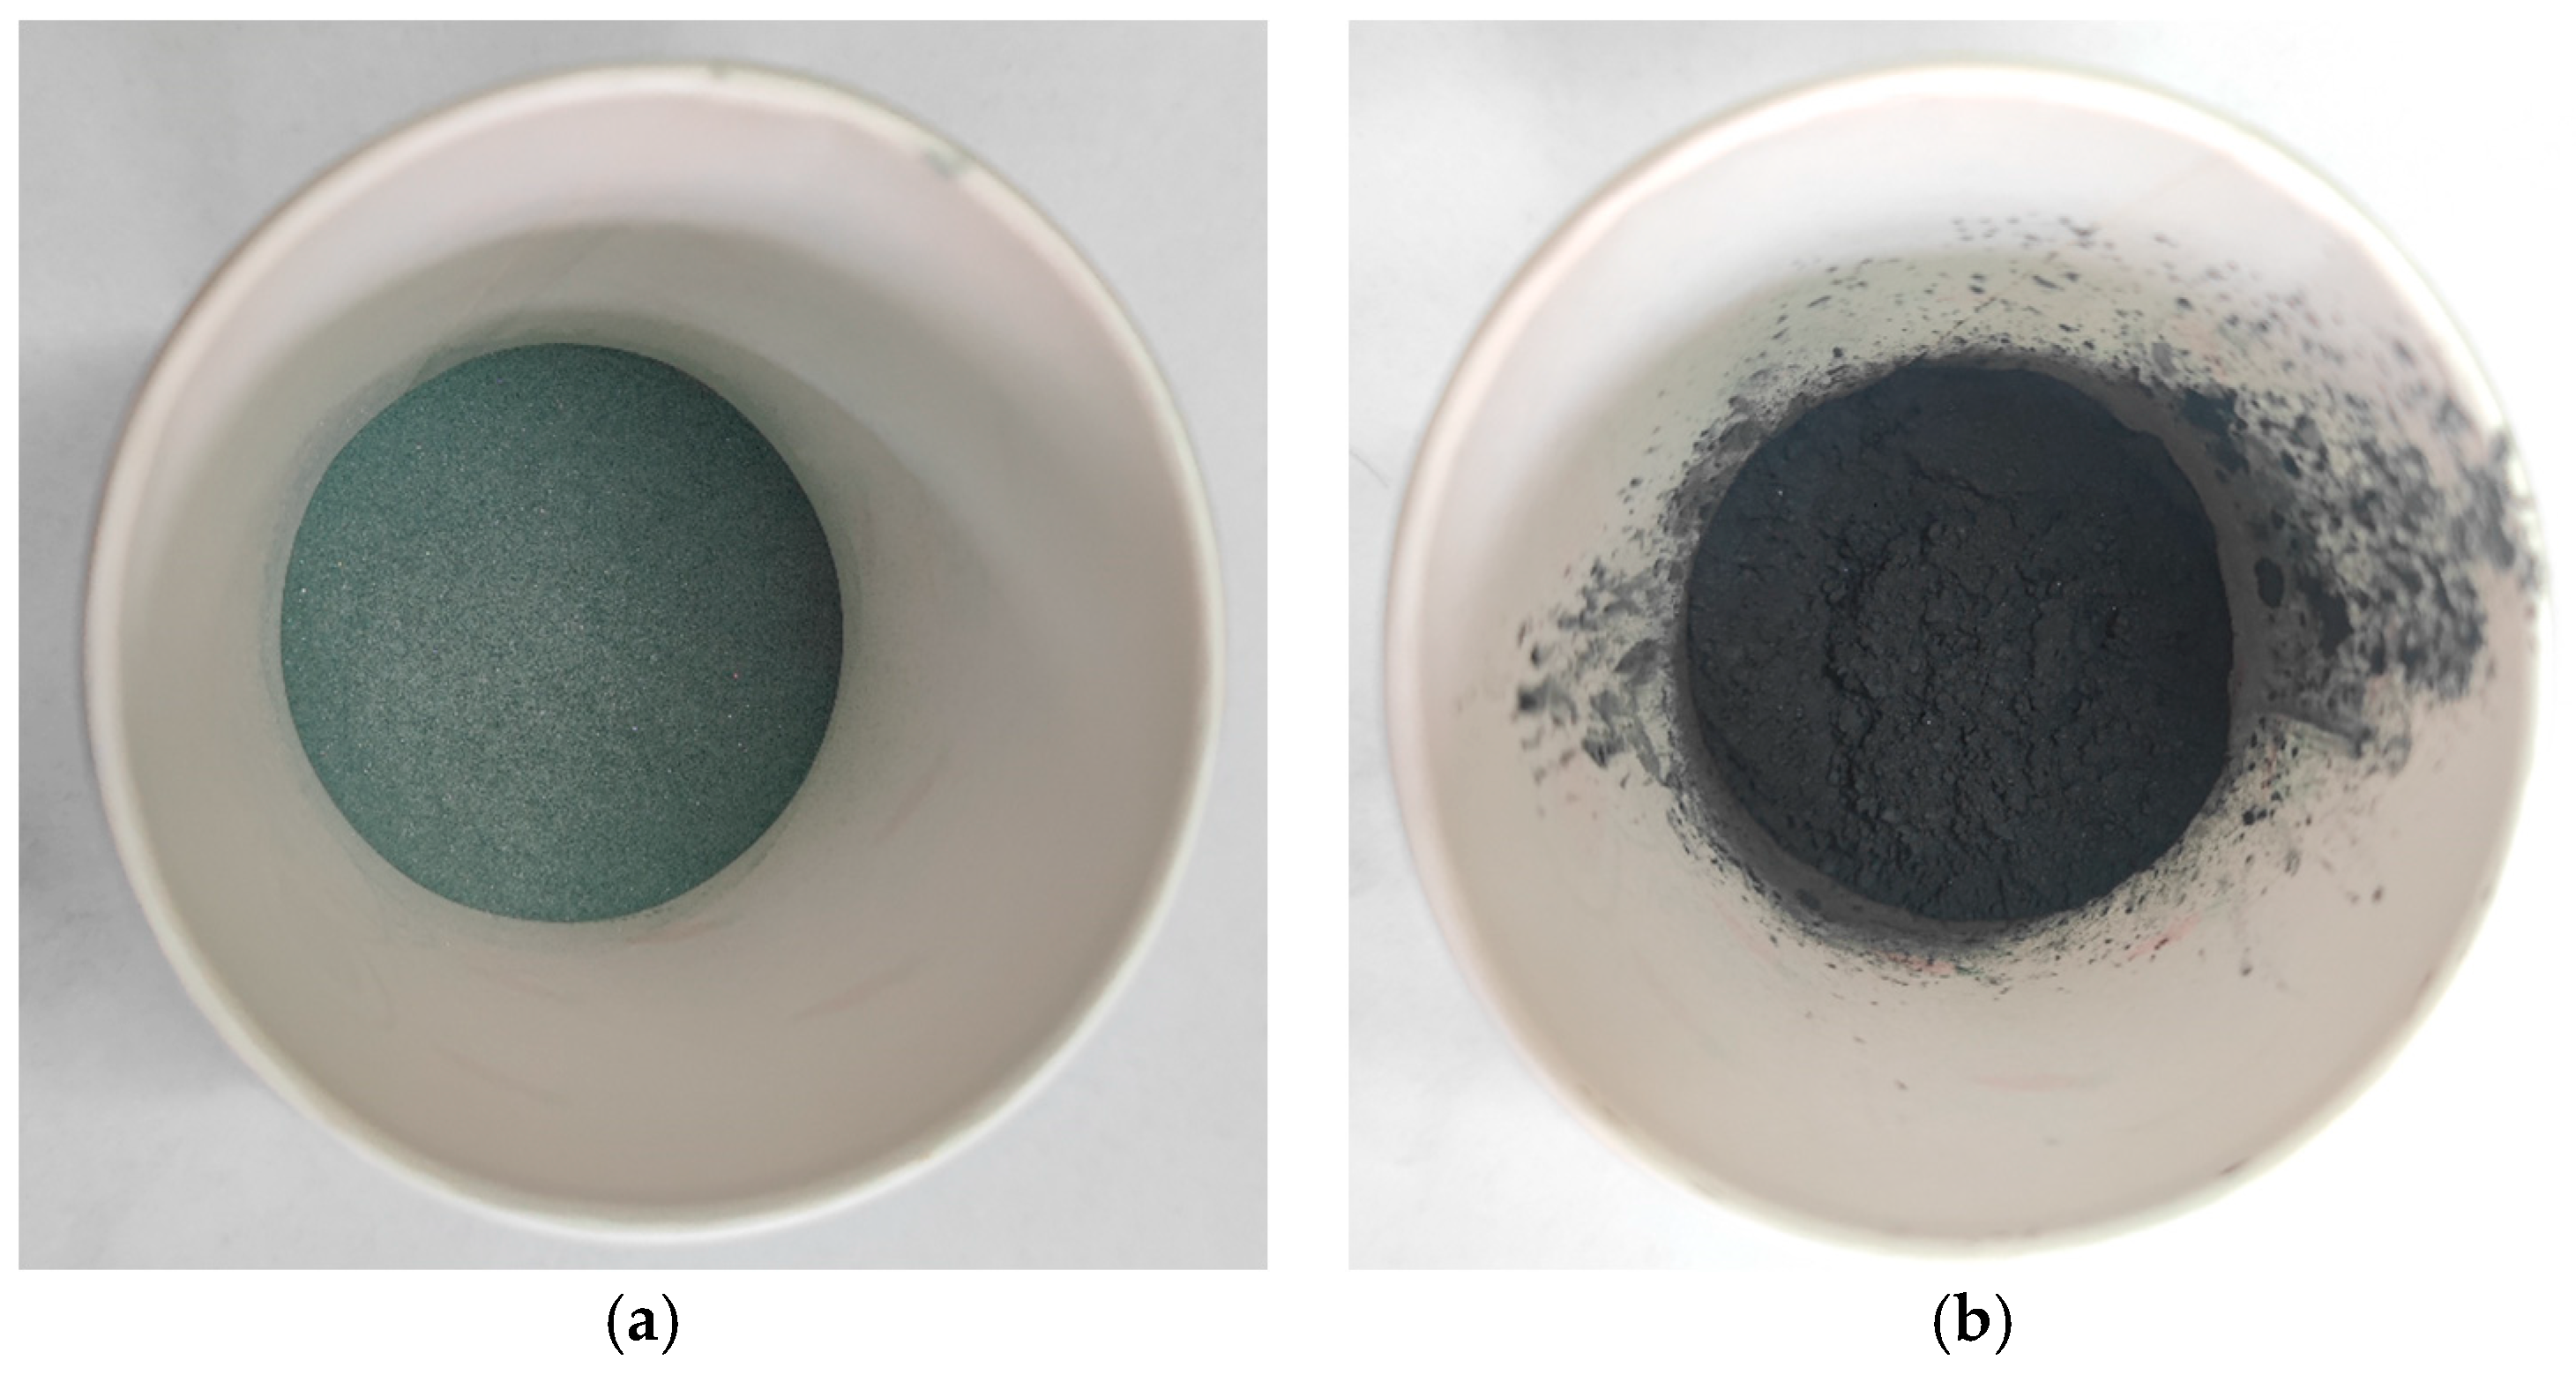
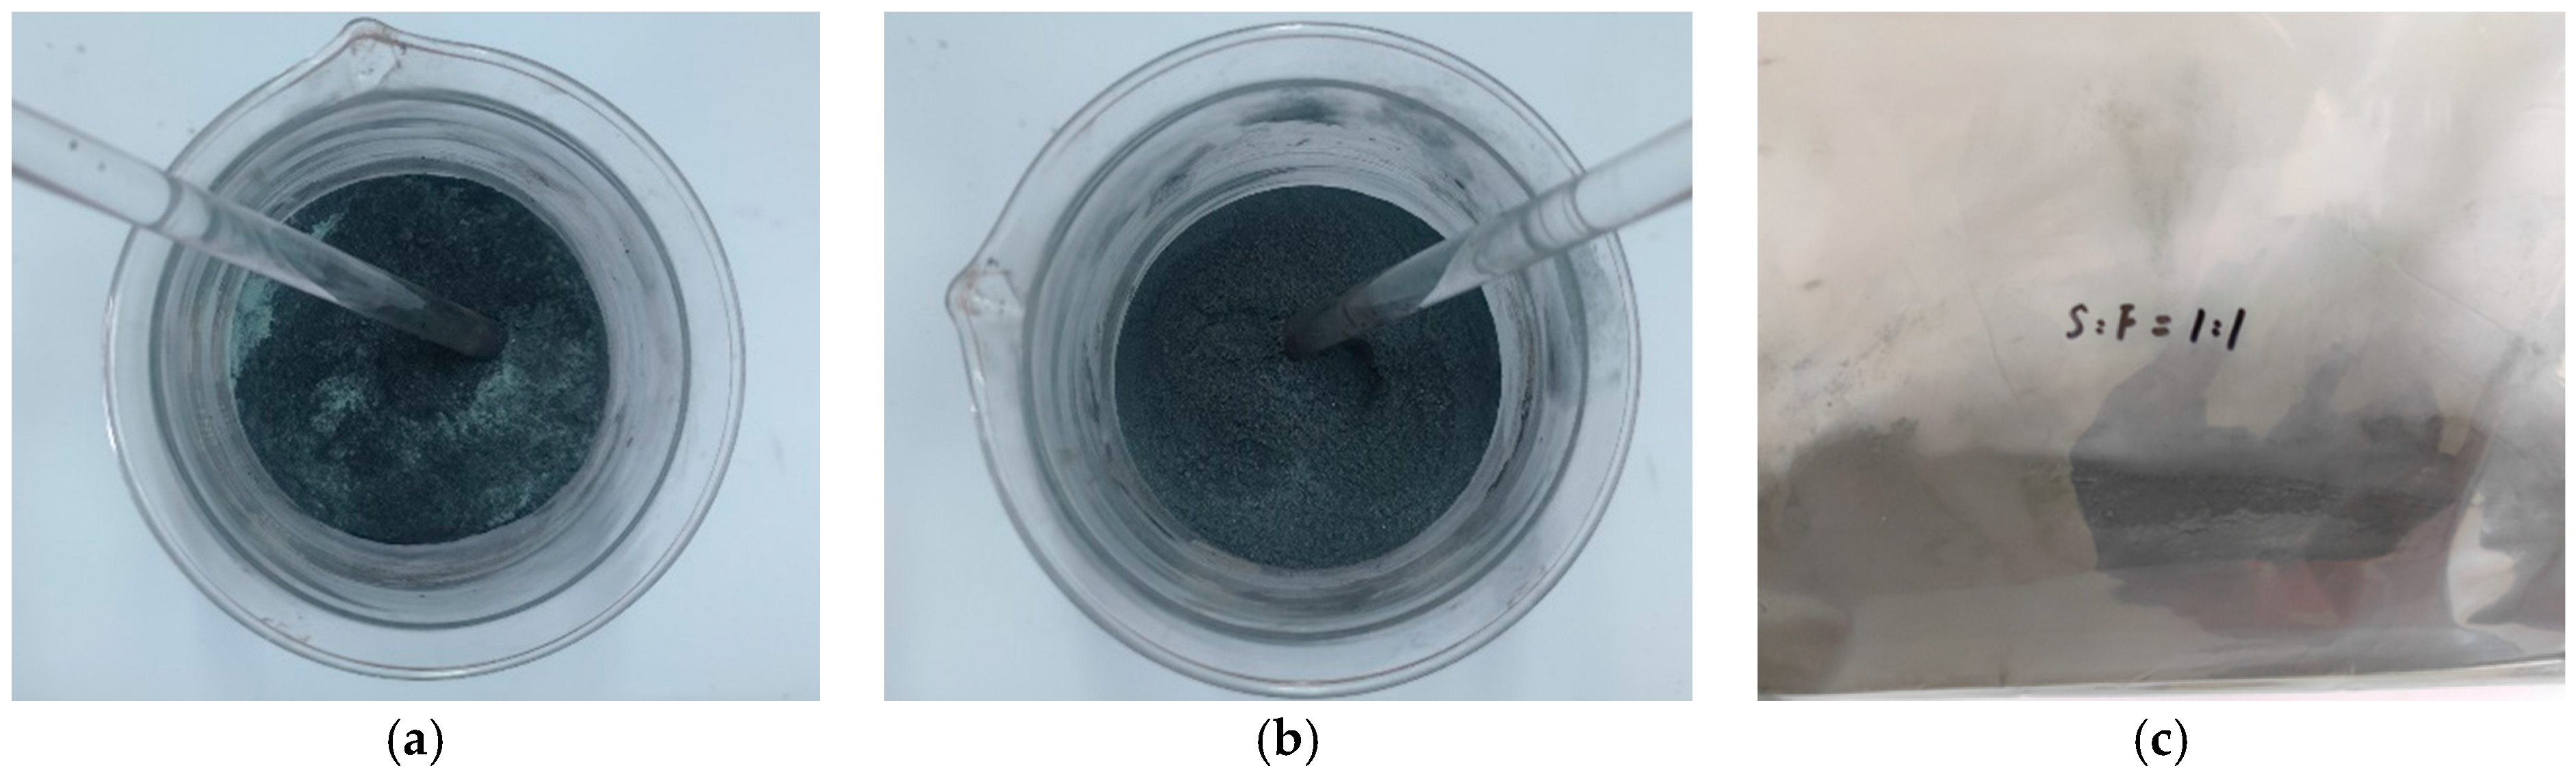
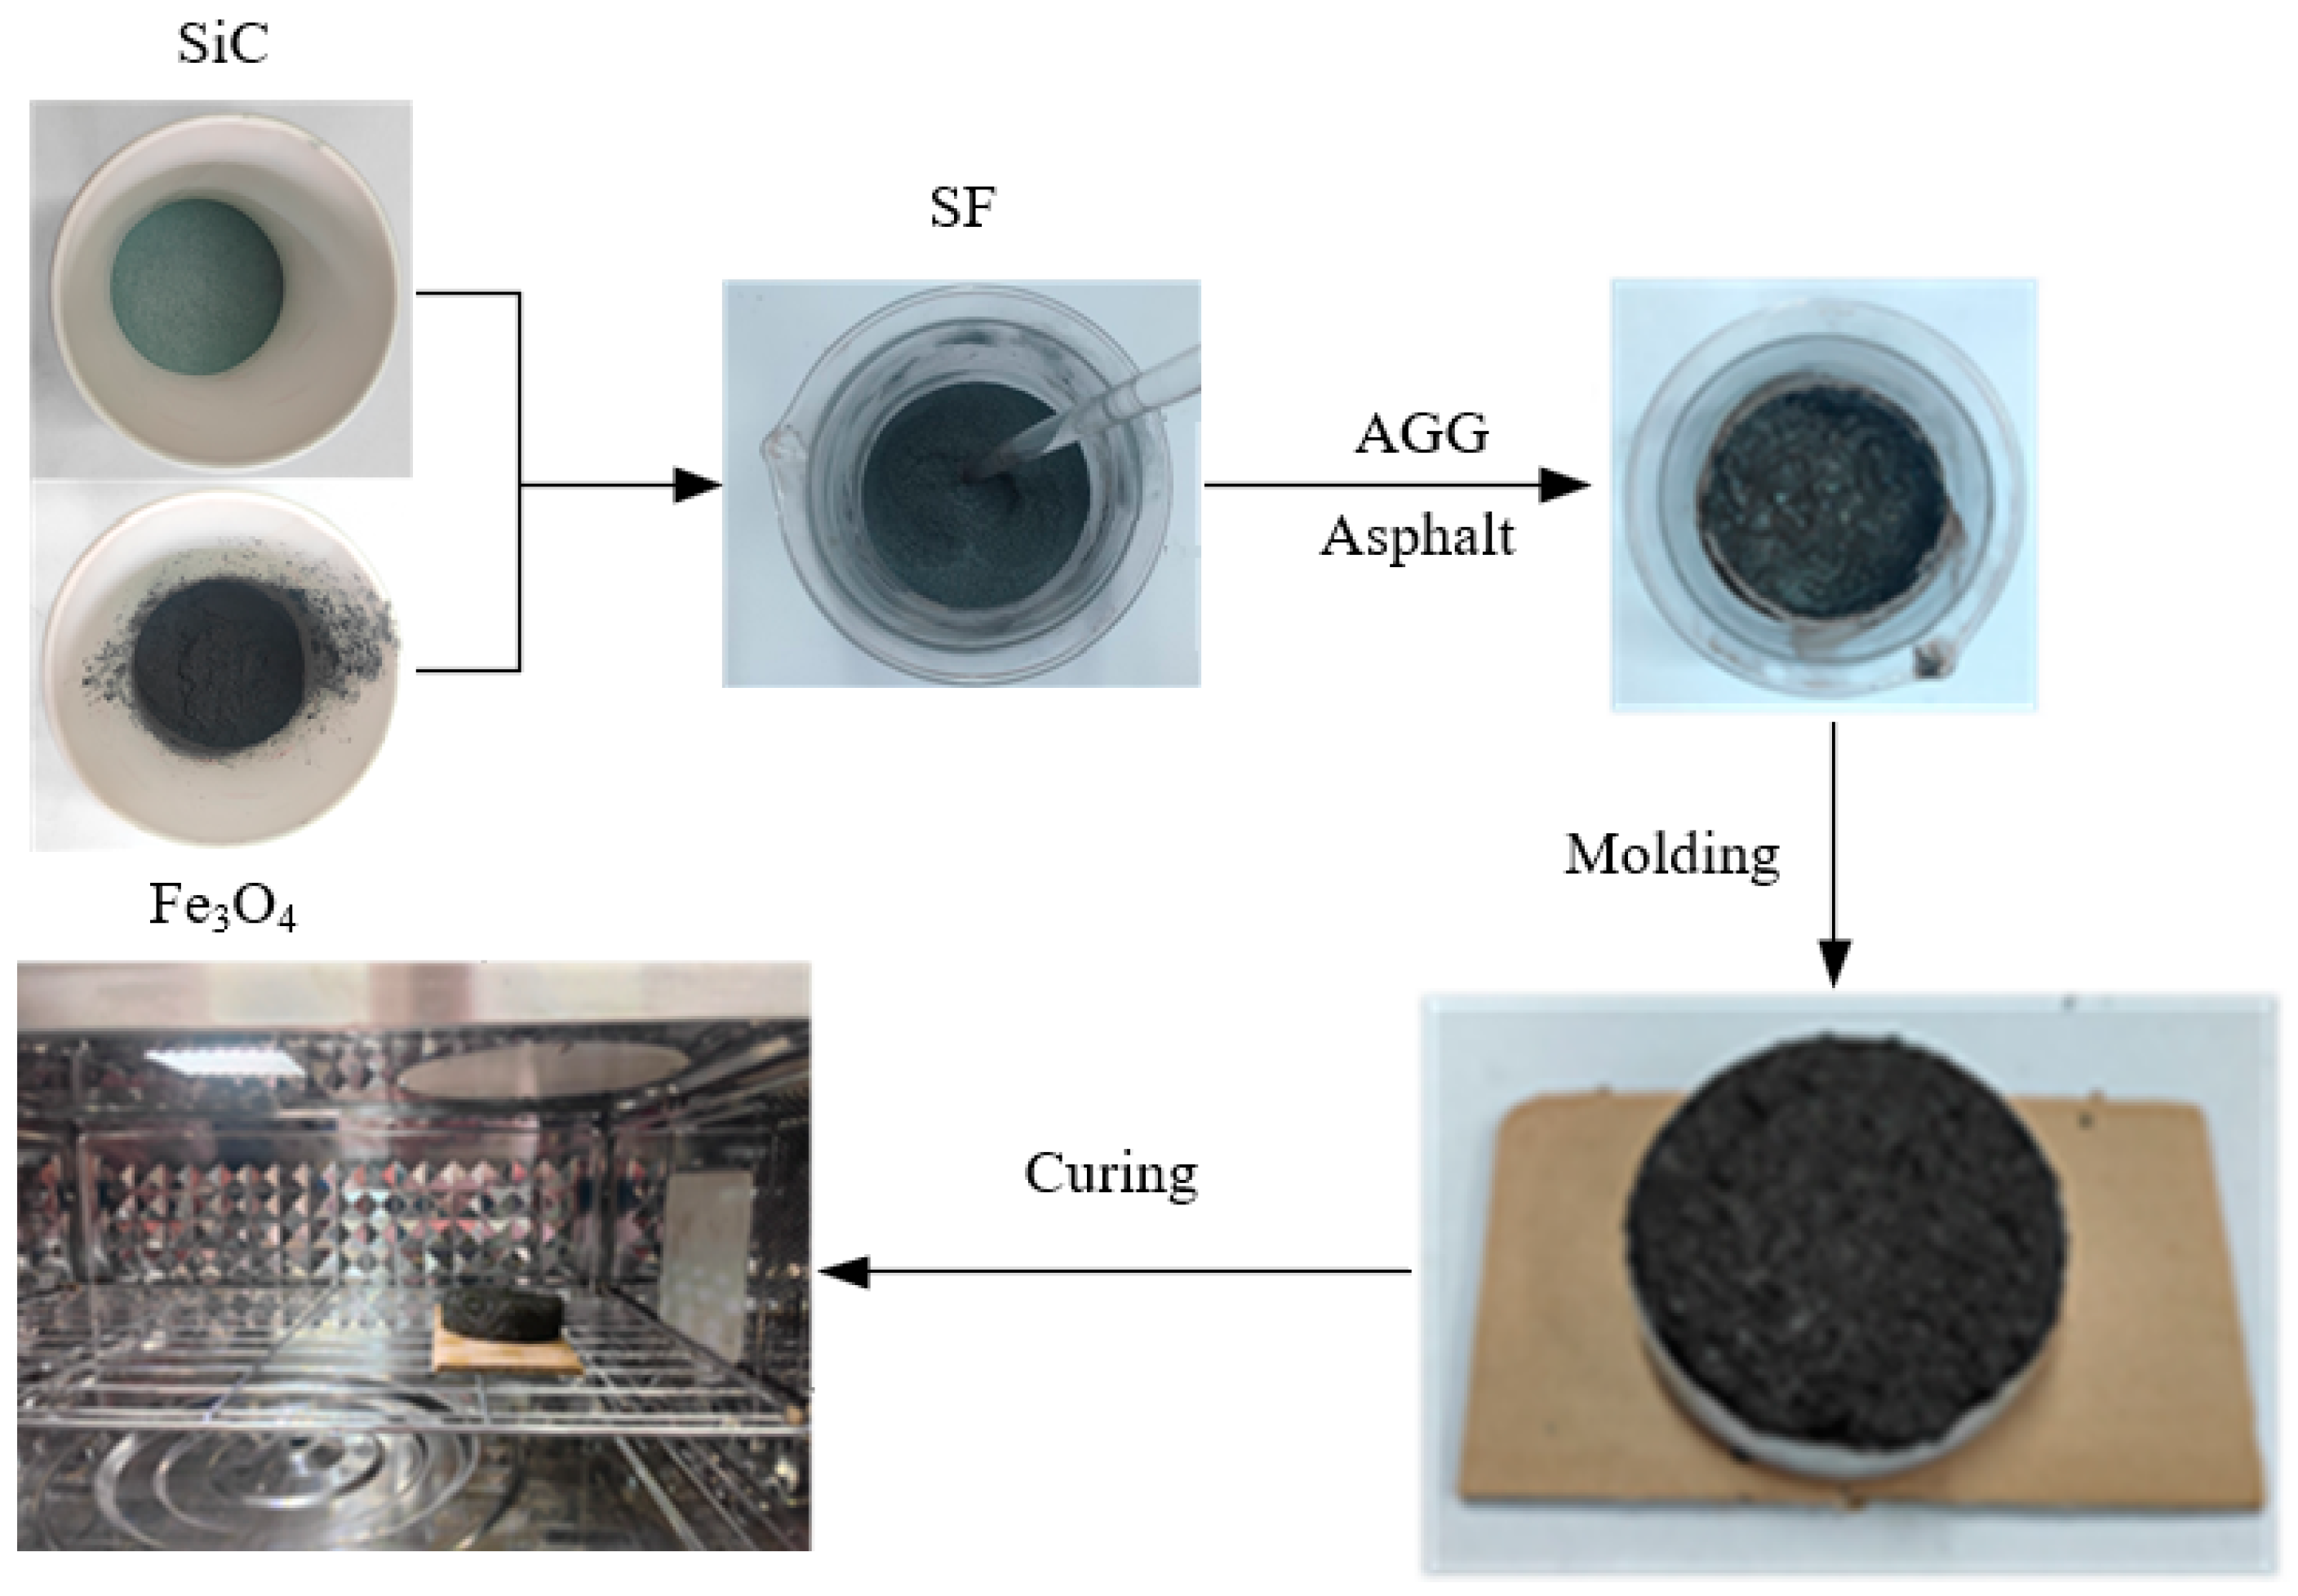
2.1.4. Preparation of SiC and Fe3O4 Composite Materials
2.2. Test Methods
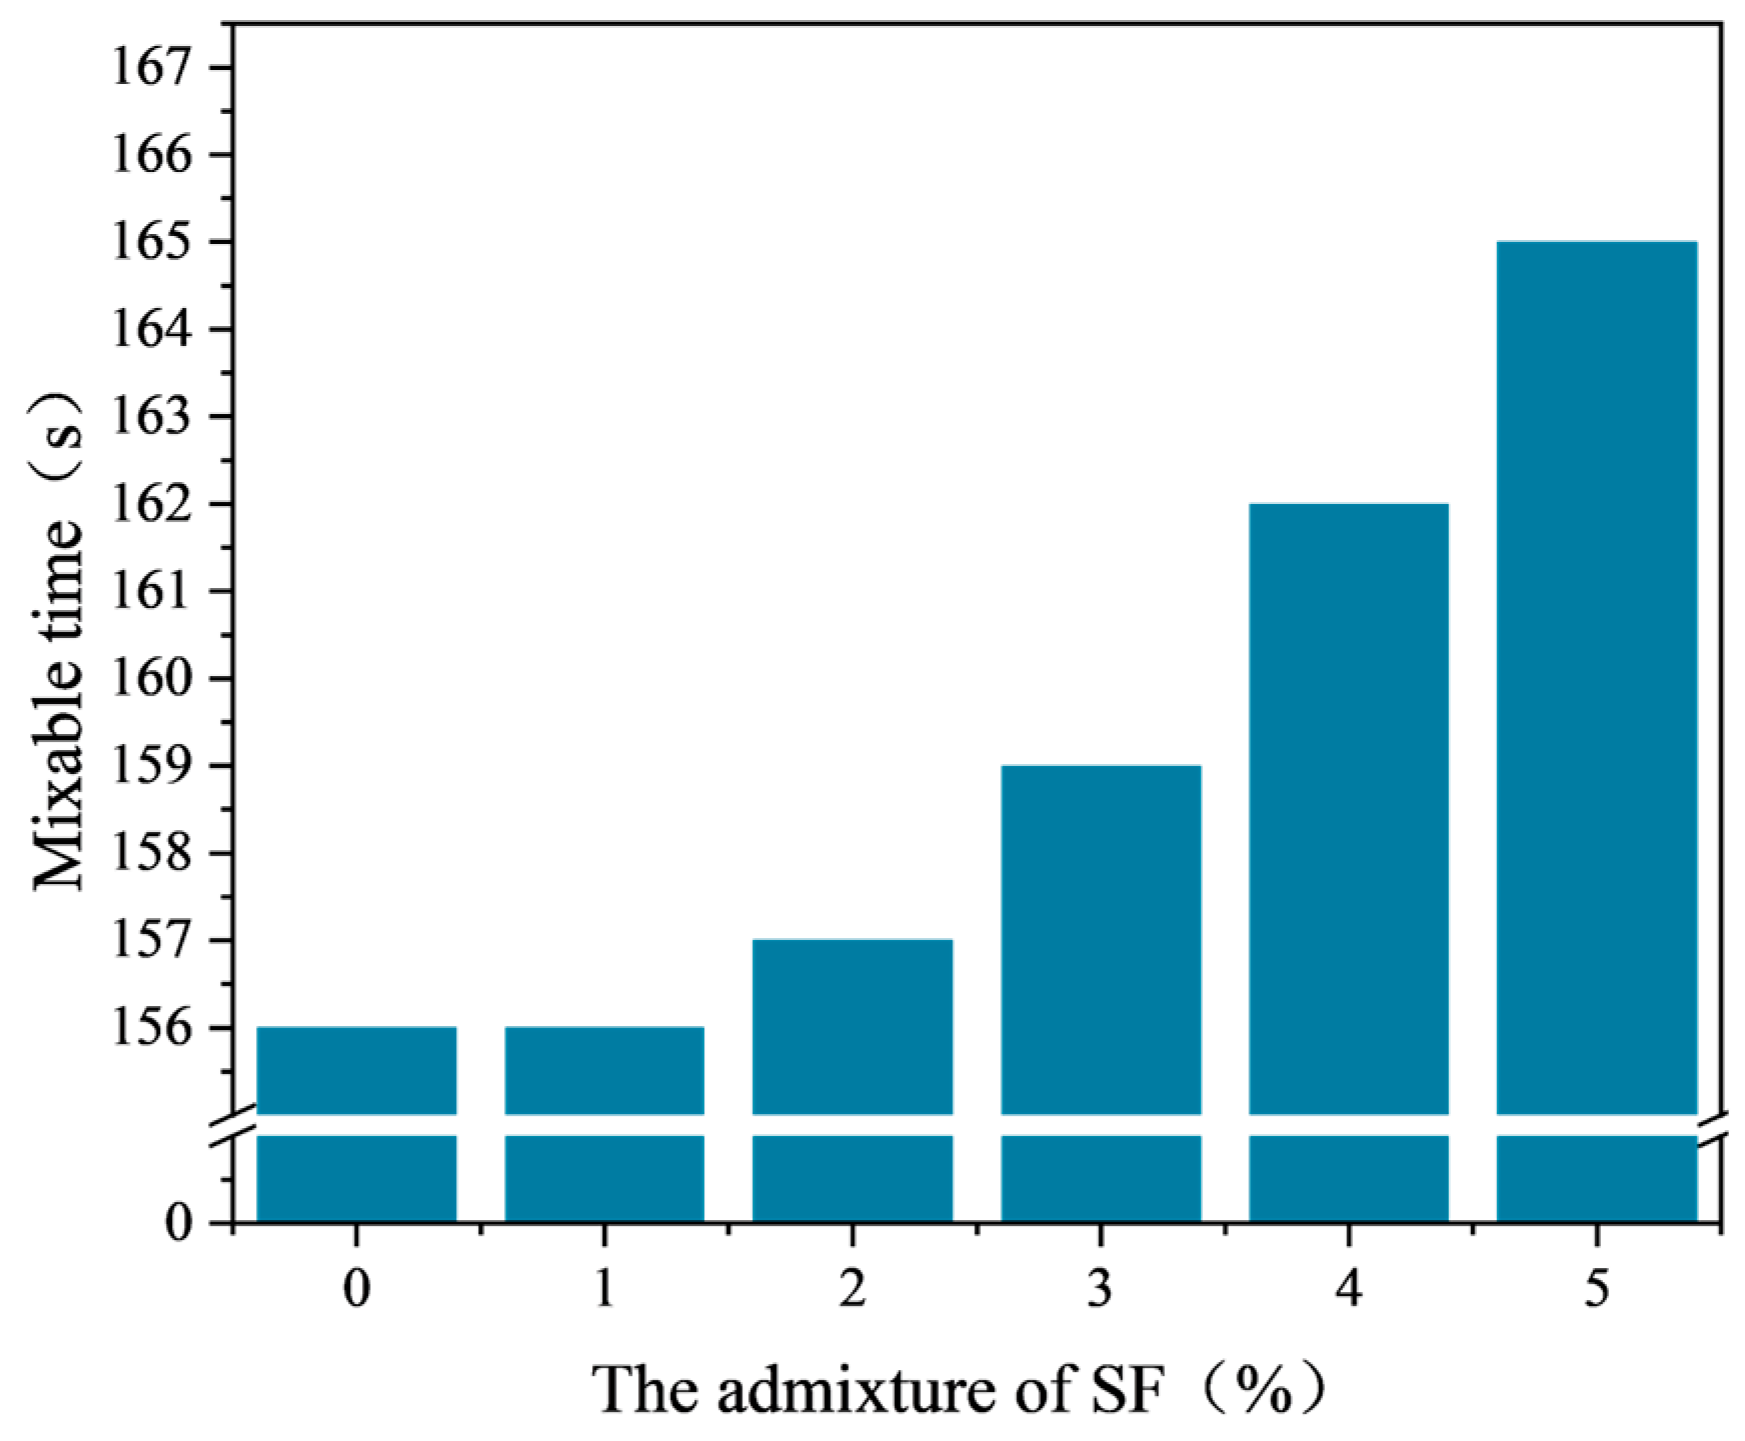
2.2.1. Mixing Test
- Prepare a certain quantity of mineral materials, modified emulsified asphalt, cement, water, and other materials. Divide the test materials into 5 groups, pour the materials into the mixing cup one by one, and start timing.
- Mix the mixture evenly. During the mixing test, when the mixture begins to thicken and feels strong in the hands, record the time at this moment. This time is the mixable time of the mixture. Record the mixing time for the 5 groups of emulsified asphalt mixtures in sequence, accurate to 1 s.
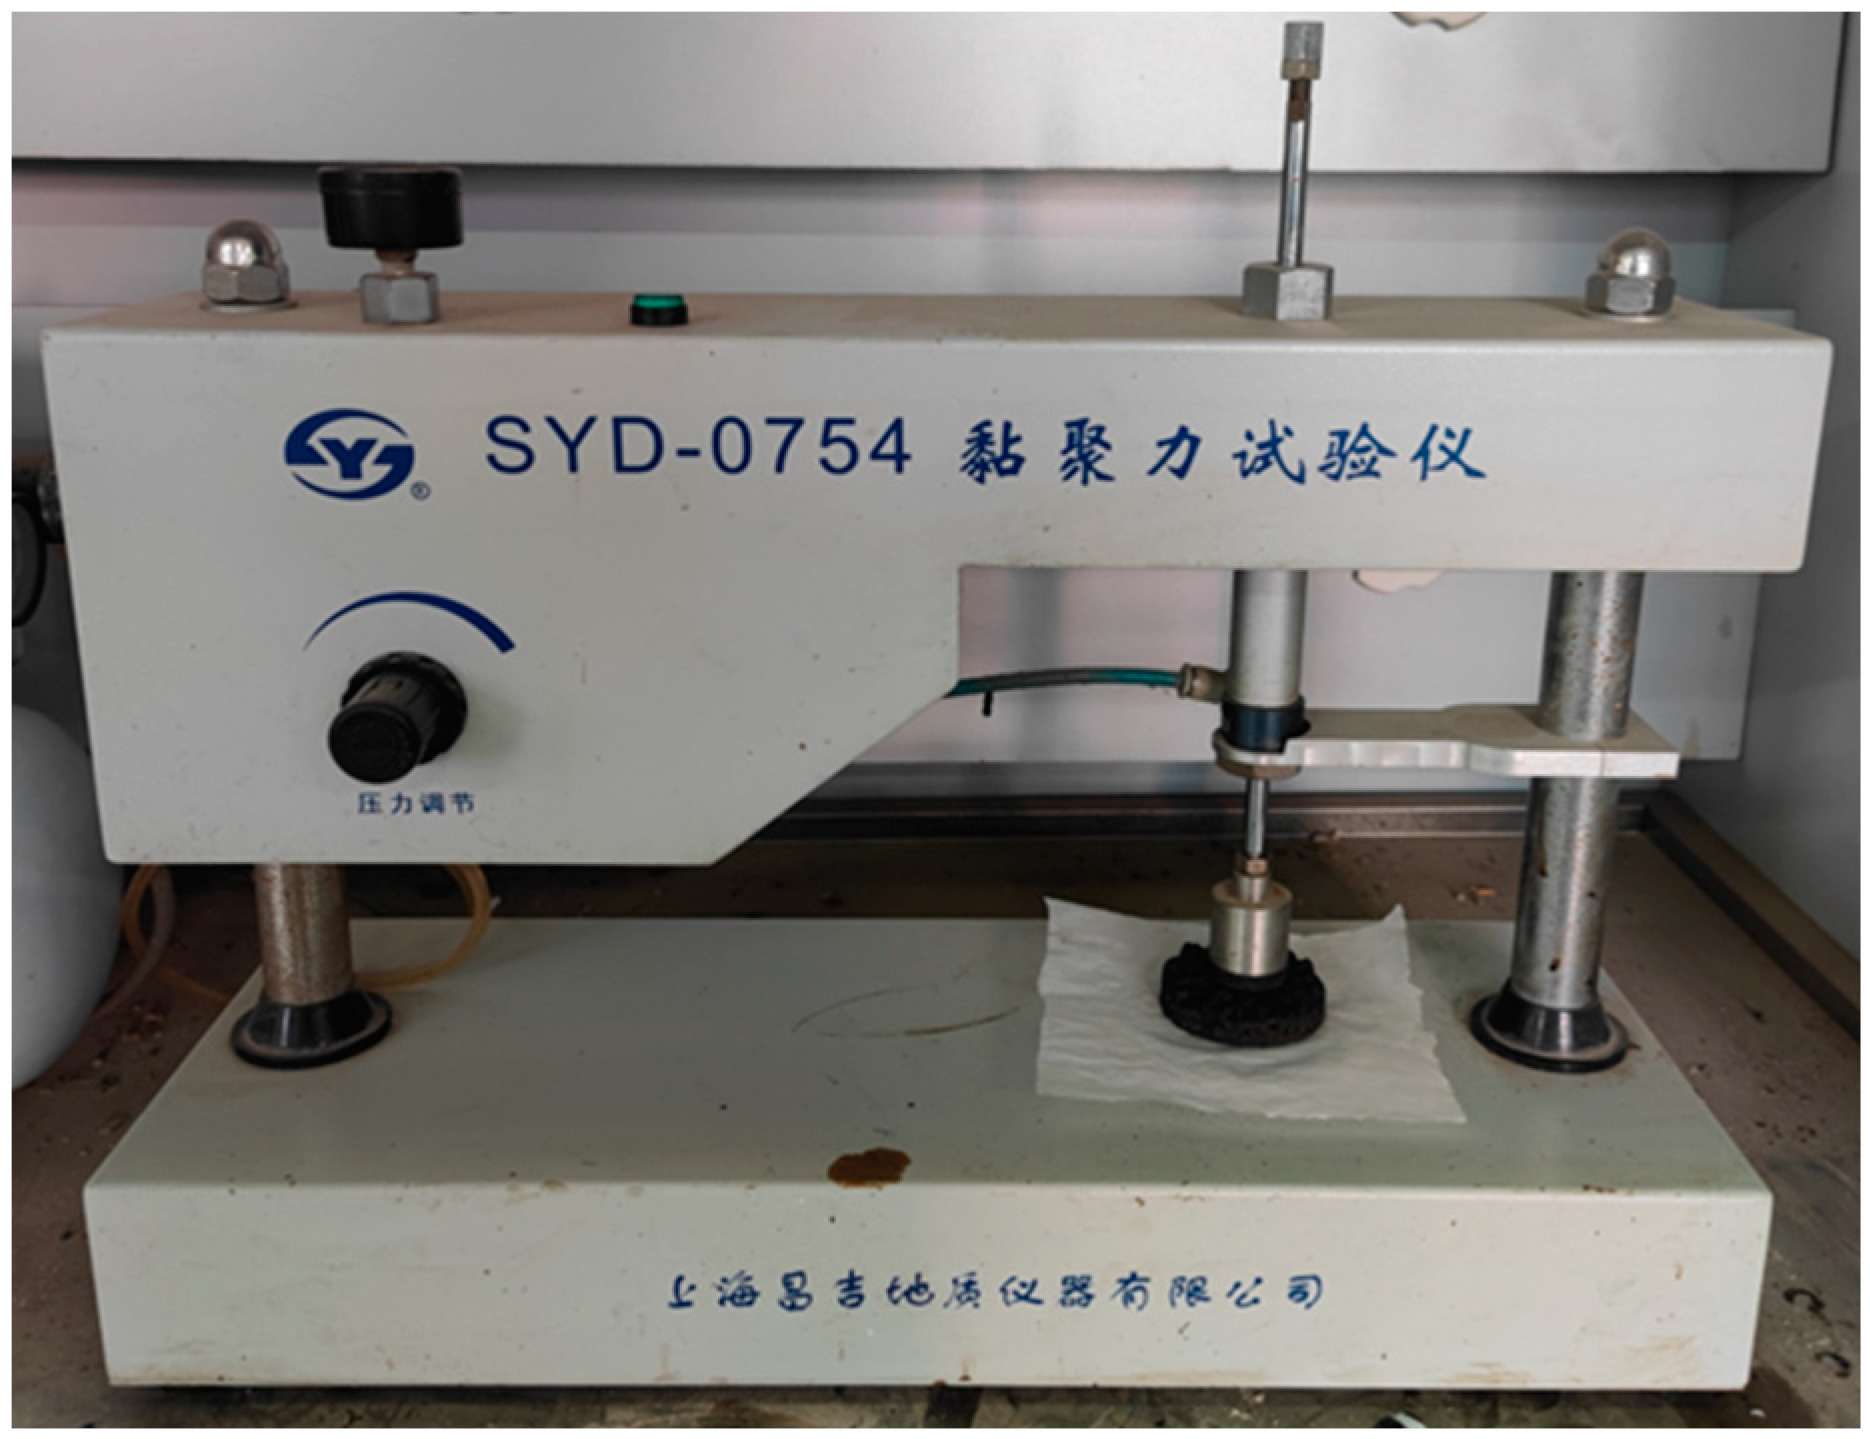
2.2.2. Cohesion Test
- Prepare a certain quantity of mineral materials, modified emulsified asphalt, cement, water, and other materials. Group the test materials.
- Mix the materials and prepare the test specimens, then demold and start timing. Measure the cohesion of the specimens after 30 min and 60 min of curing for the 5 groups, respectively, and record the failure state of the specimens.
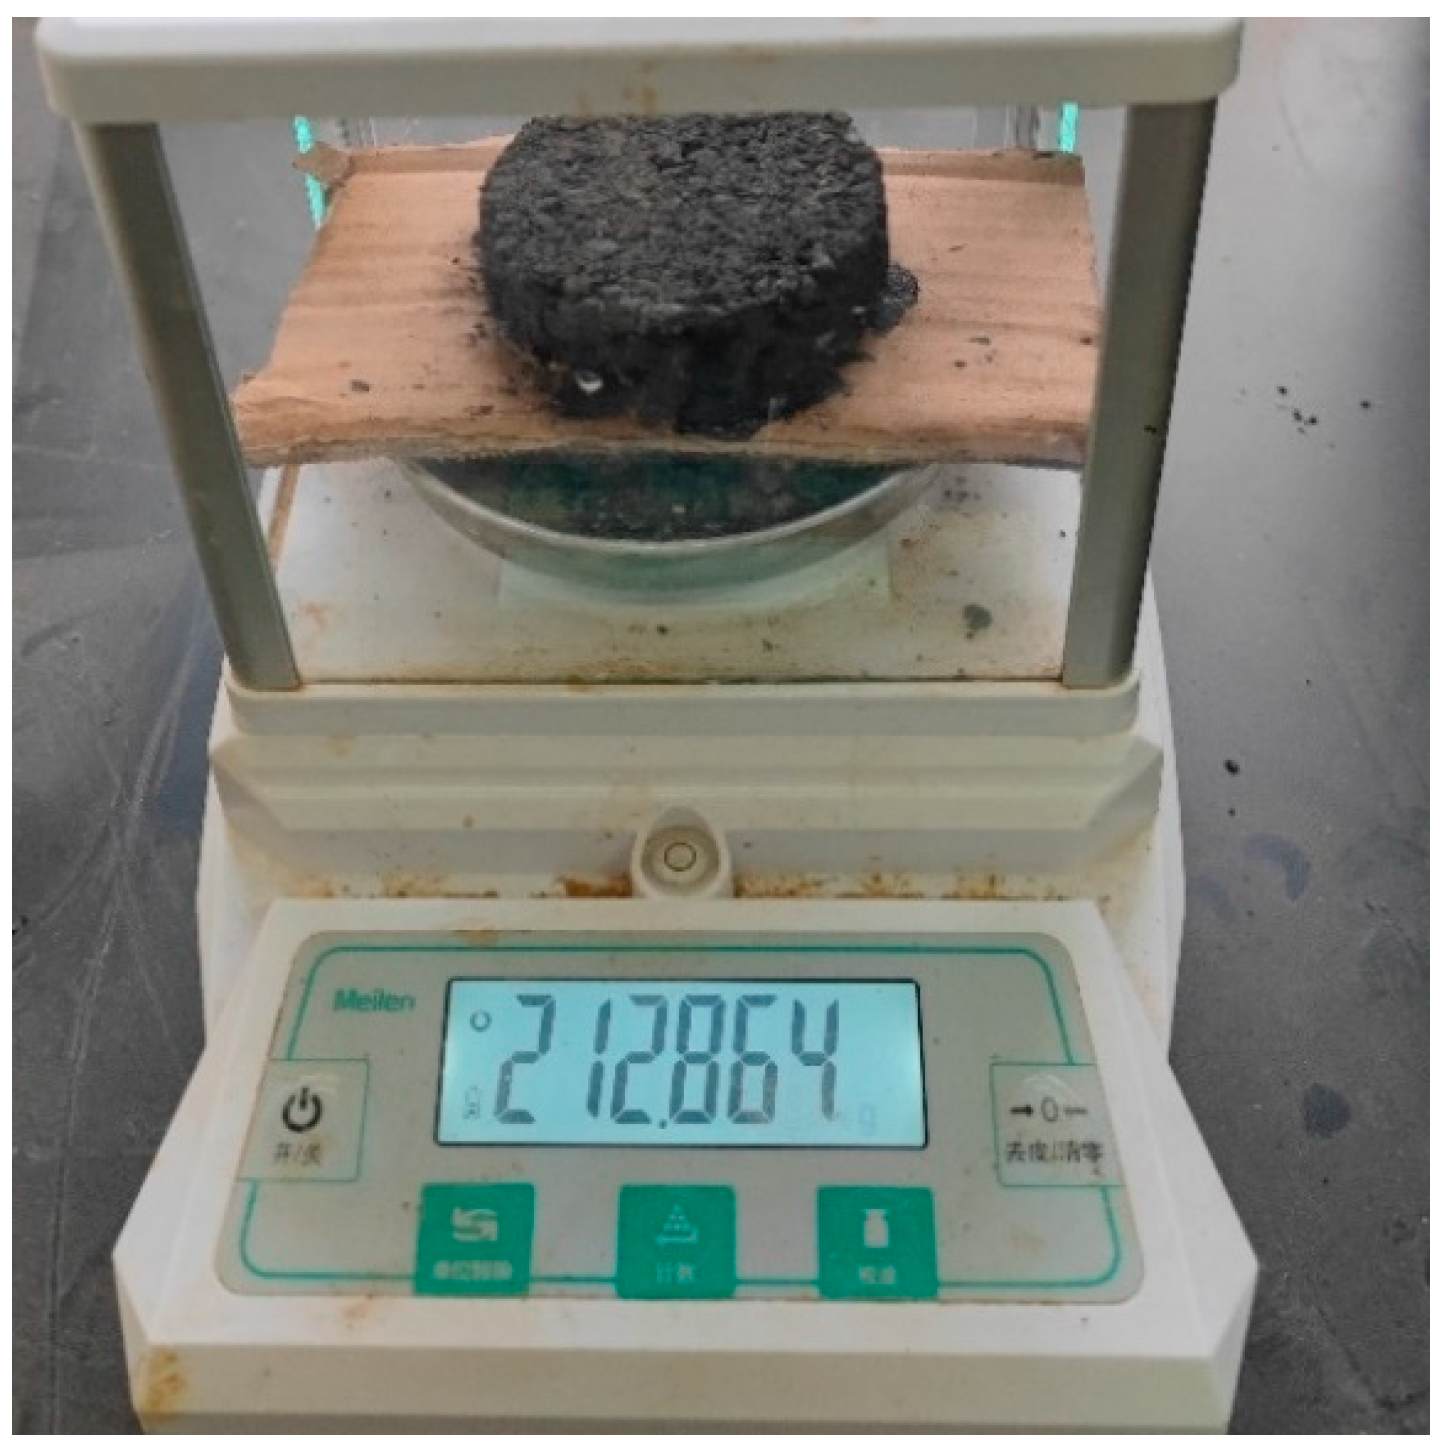
2.2.3. Wet Wheel Wear Test
- Weigh the total mass of the oil felt and the test piece.
- Place the prepared test piece and oil felt in a water bath at 25 °C for 1 h.
- Install the sample in the tester and start the instrument.
- After the test is completed, dry the oil felt and test piece to a constant weight and then weigh the total mass.
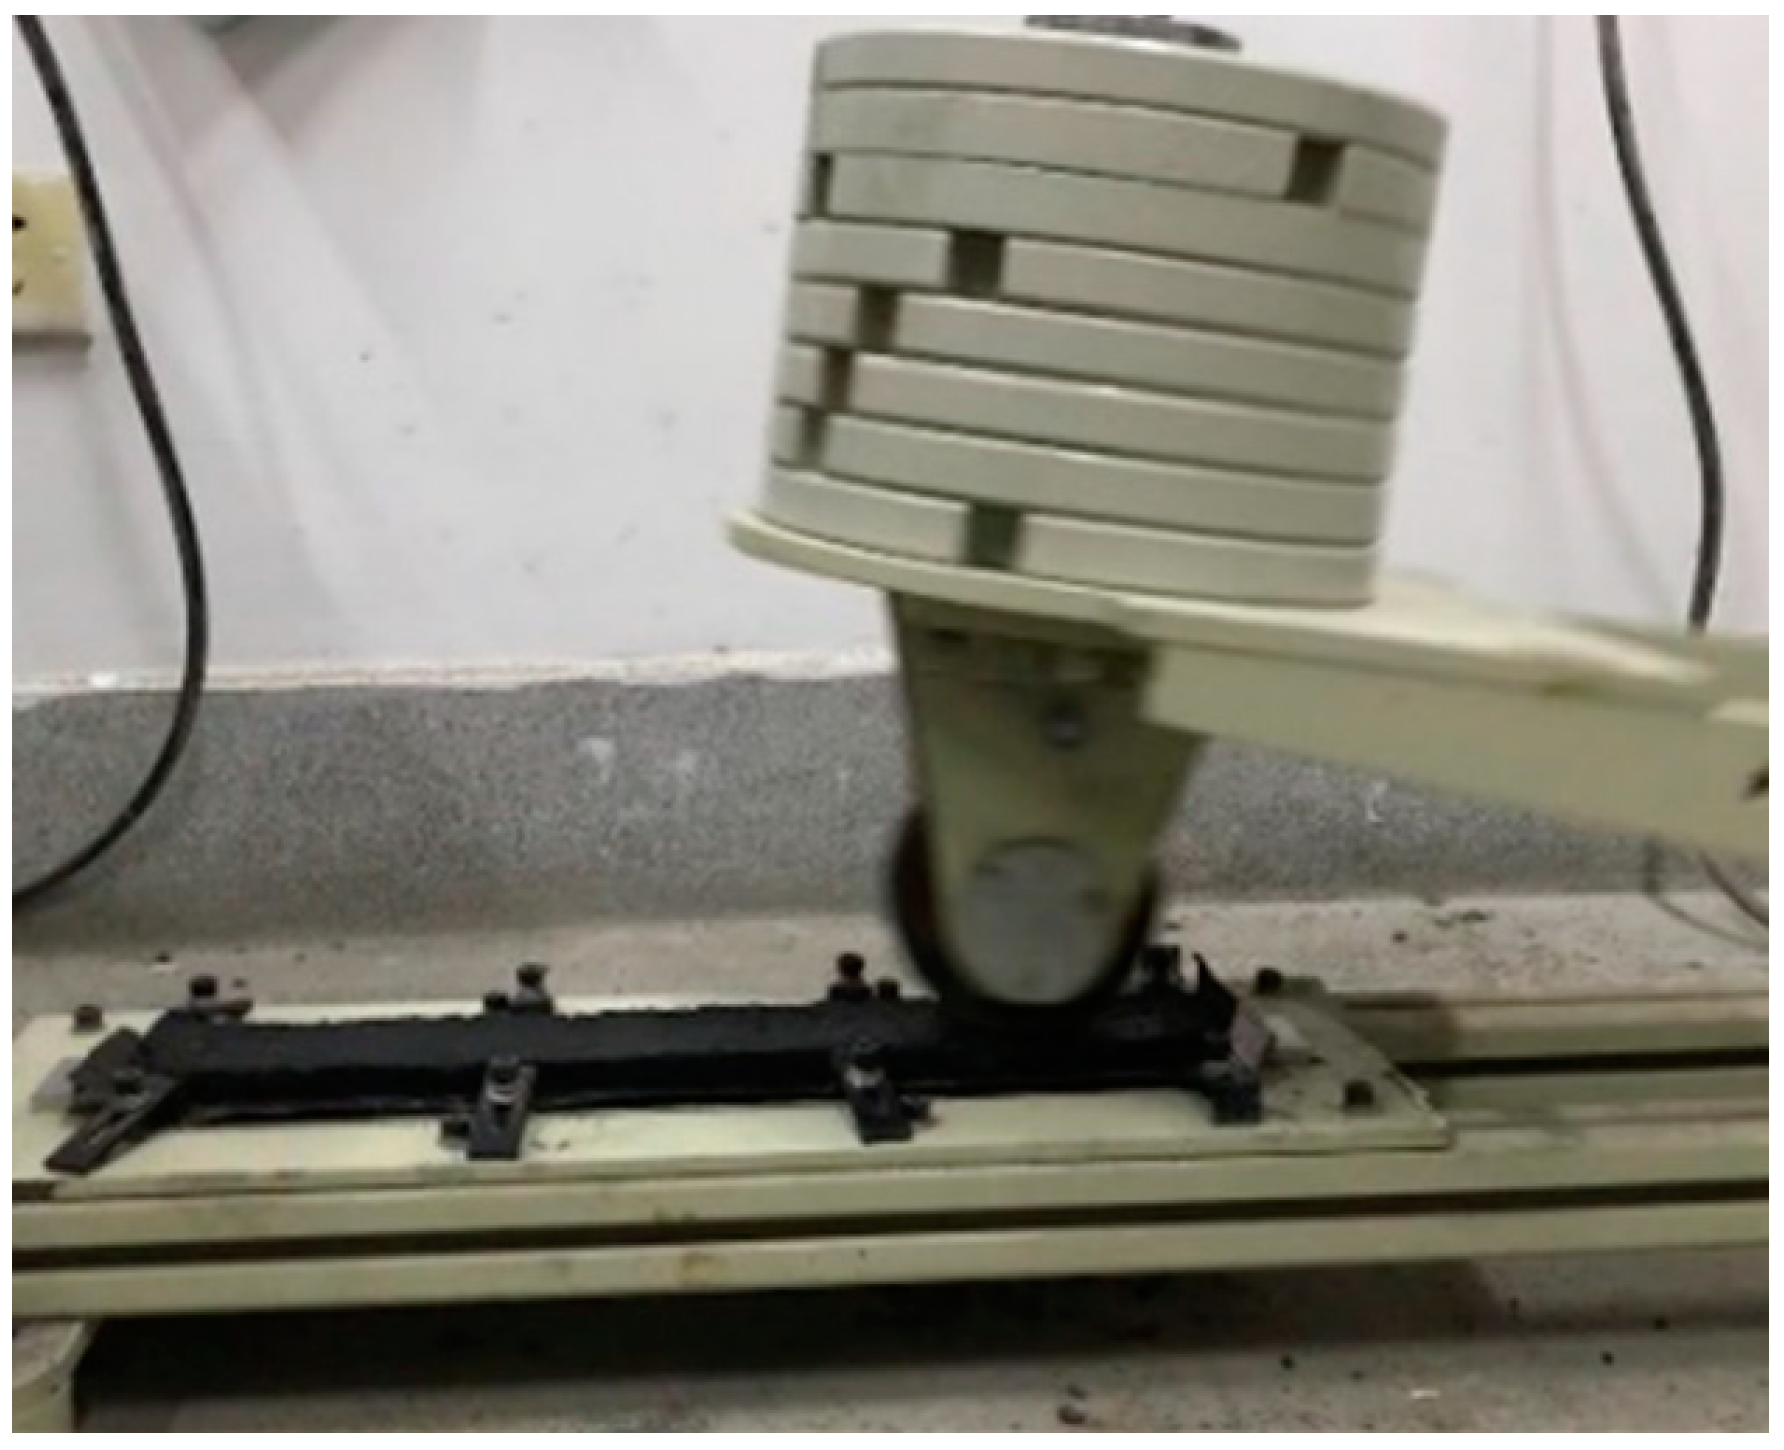
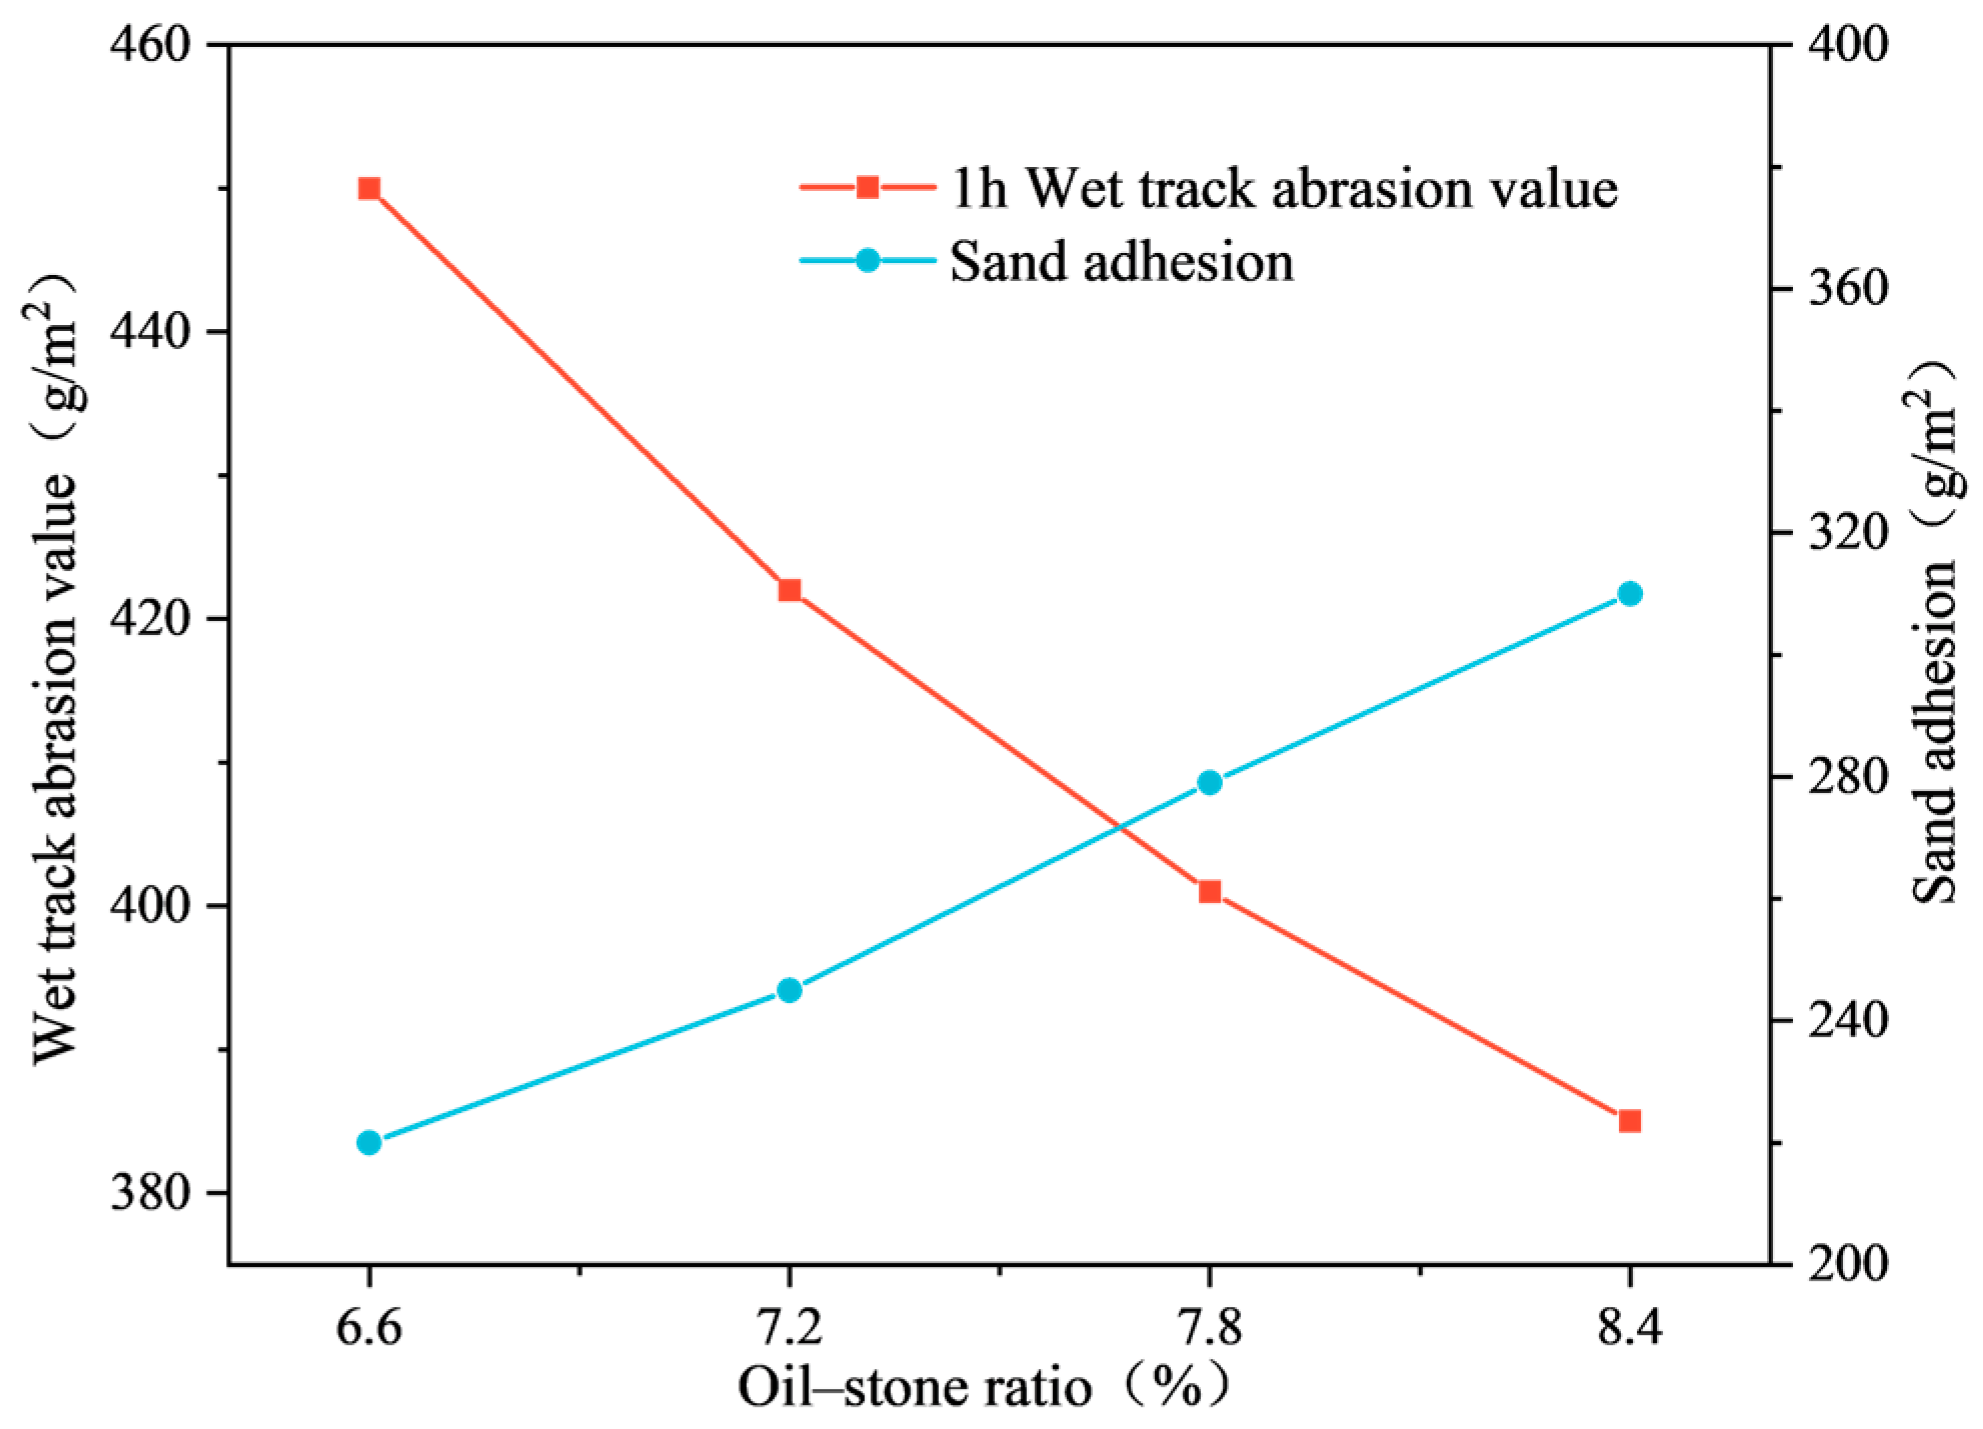
2.2.4. Load Wheel Sand Adhesion Test
- Install the sample in the tester and start the instrument.
- Roll the sample 1000 times at a frequency of 44 times per minute.
- Dry and cool the sample, then weigh the mass (Ga).
- Reinstall the sample, lay the preheated sand flat on the sample, and place the cover plate.
- Roll the machine an additional 100 times, brush off the floating sand, and weigh the mass (Gb).
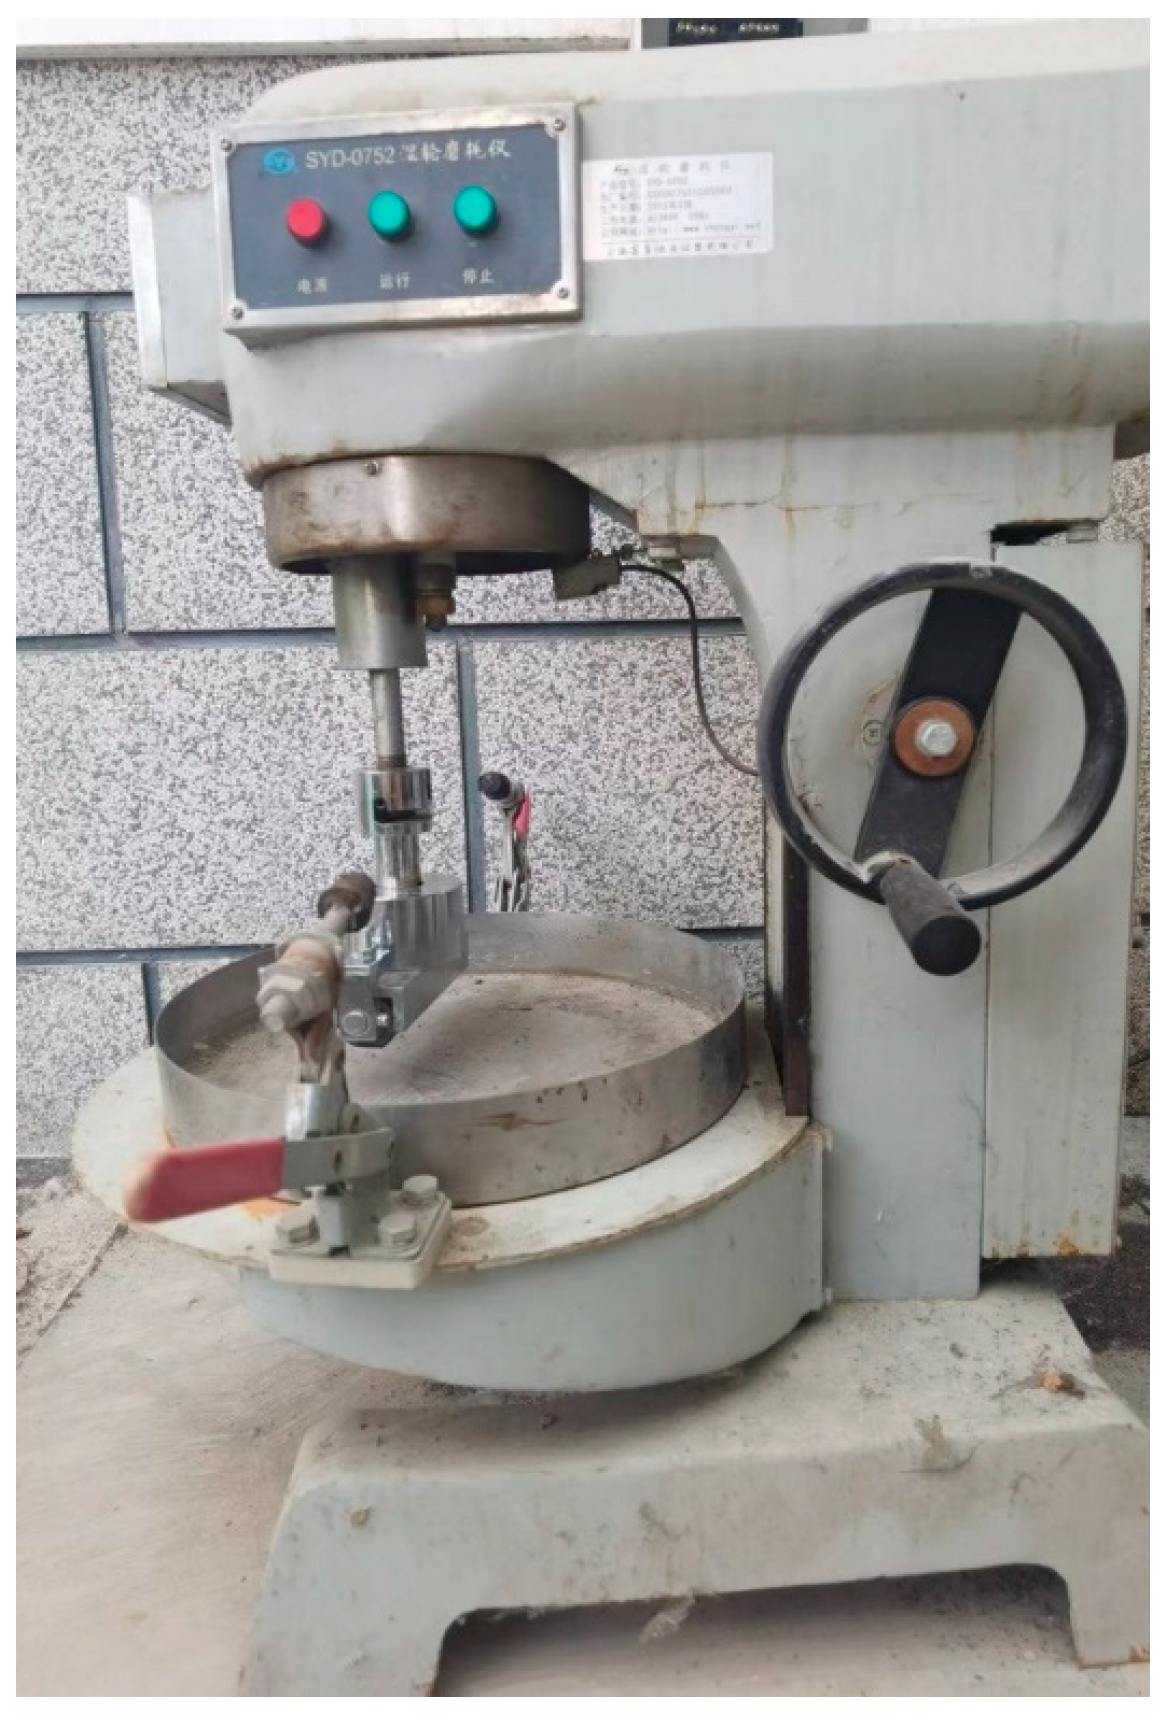
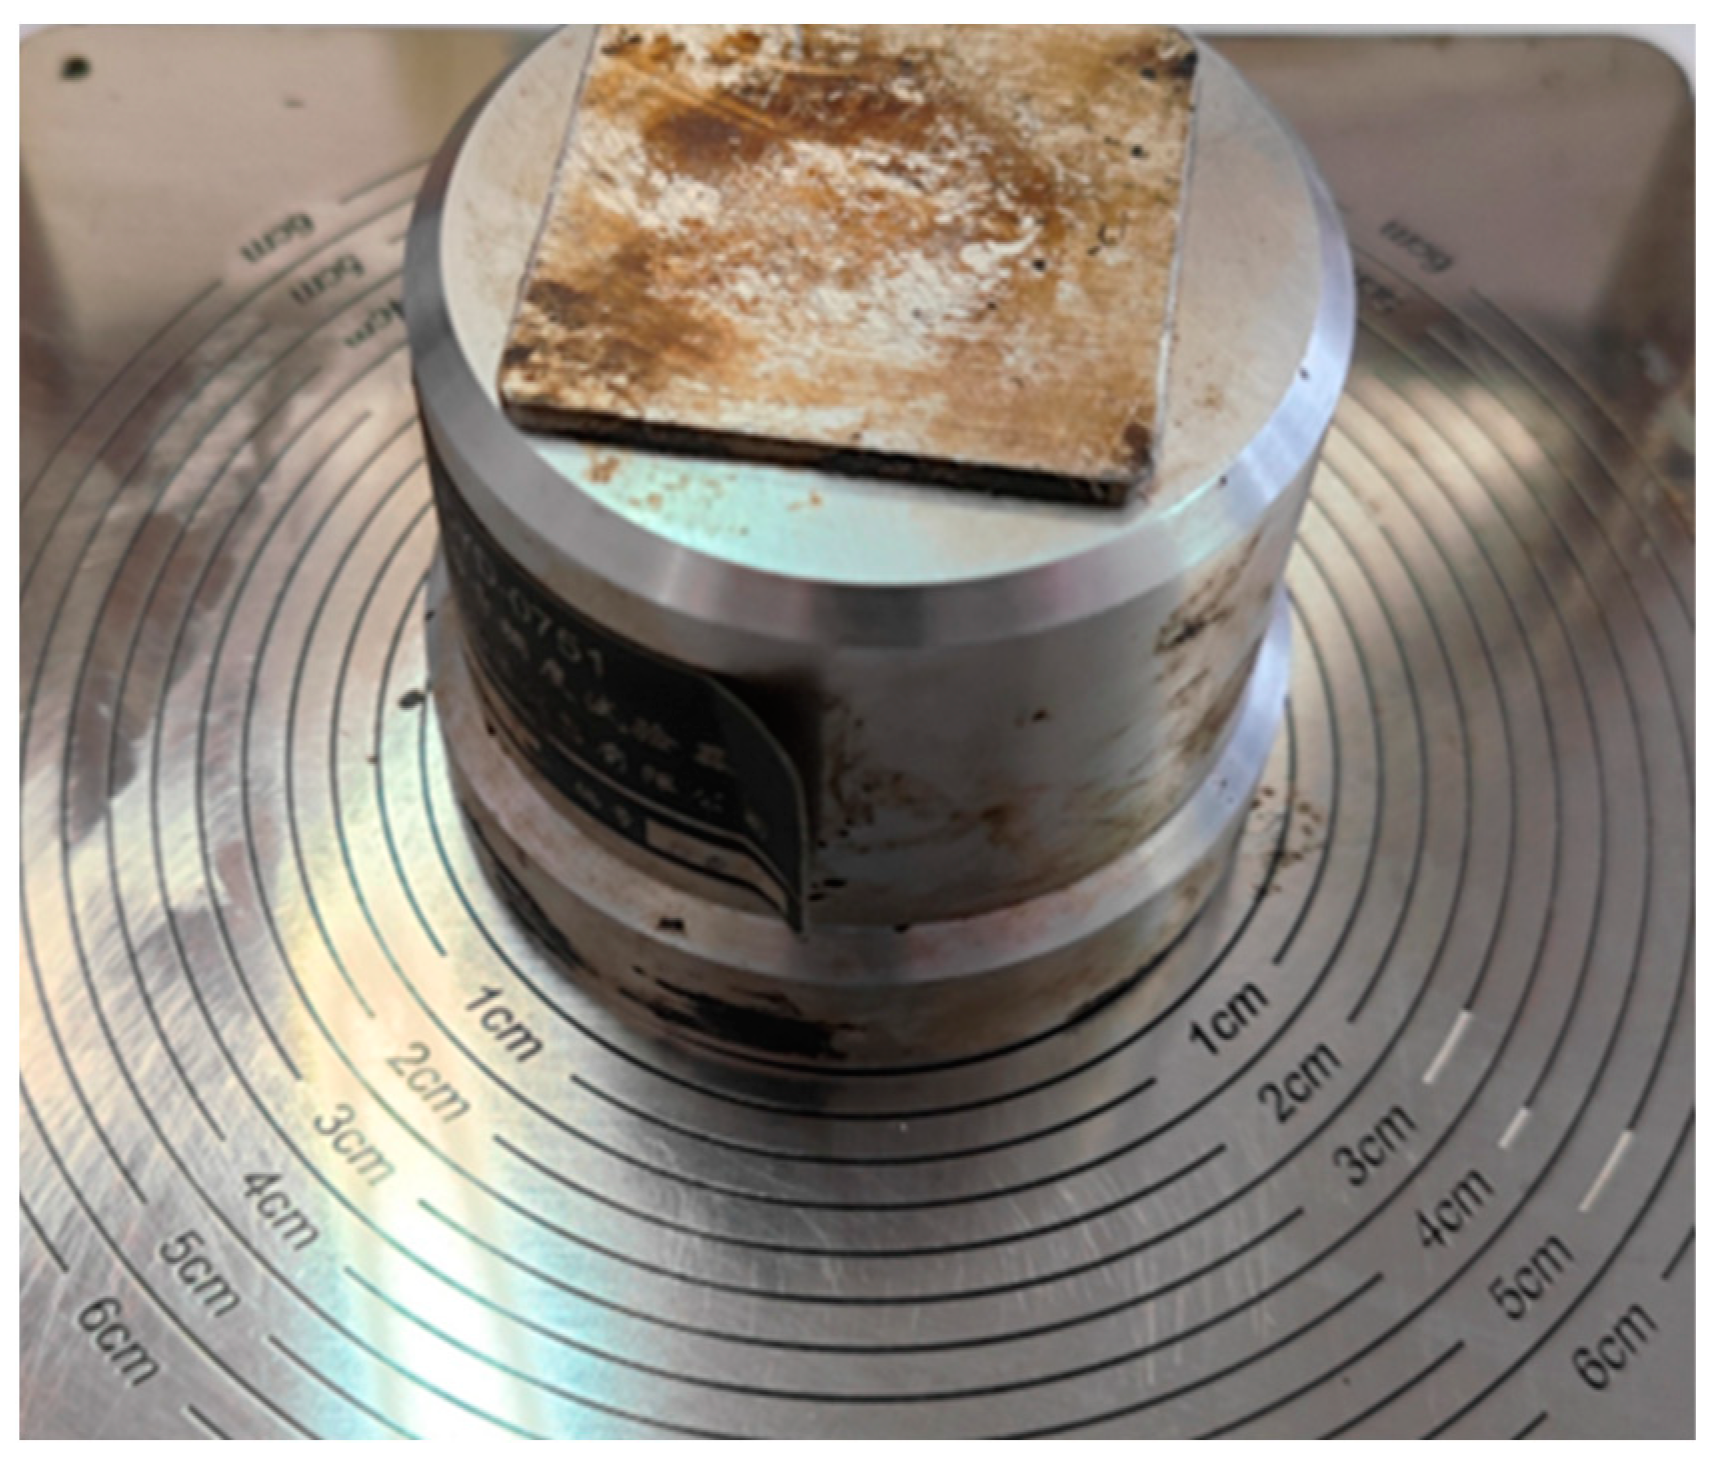
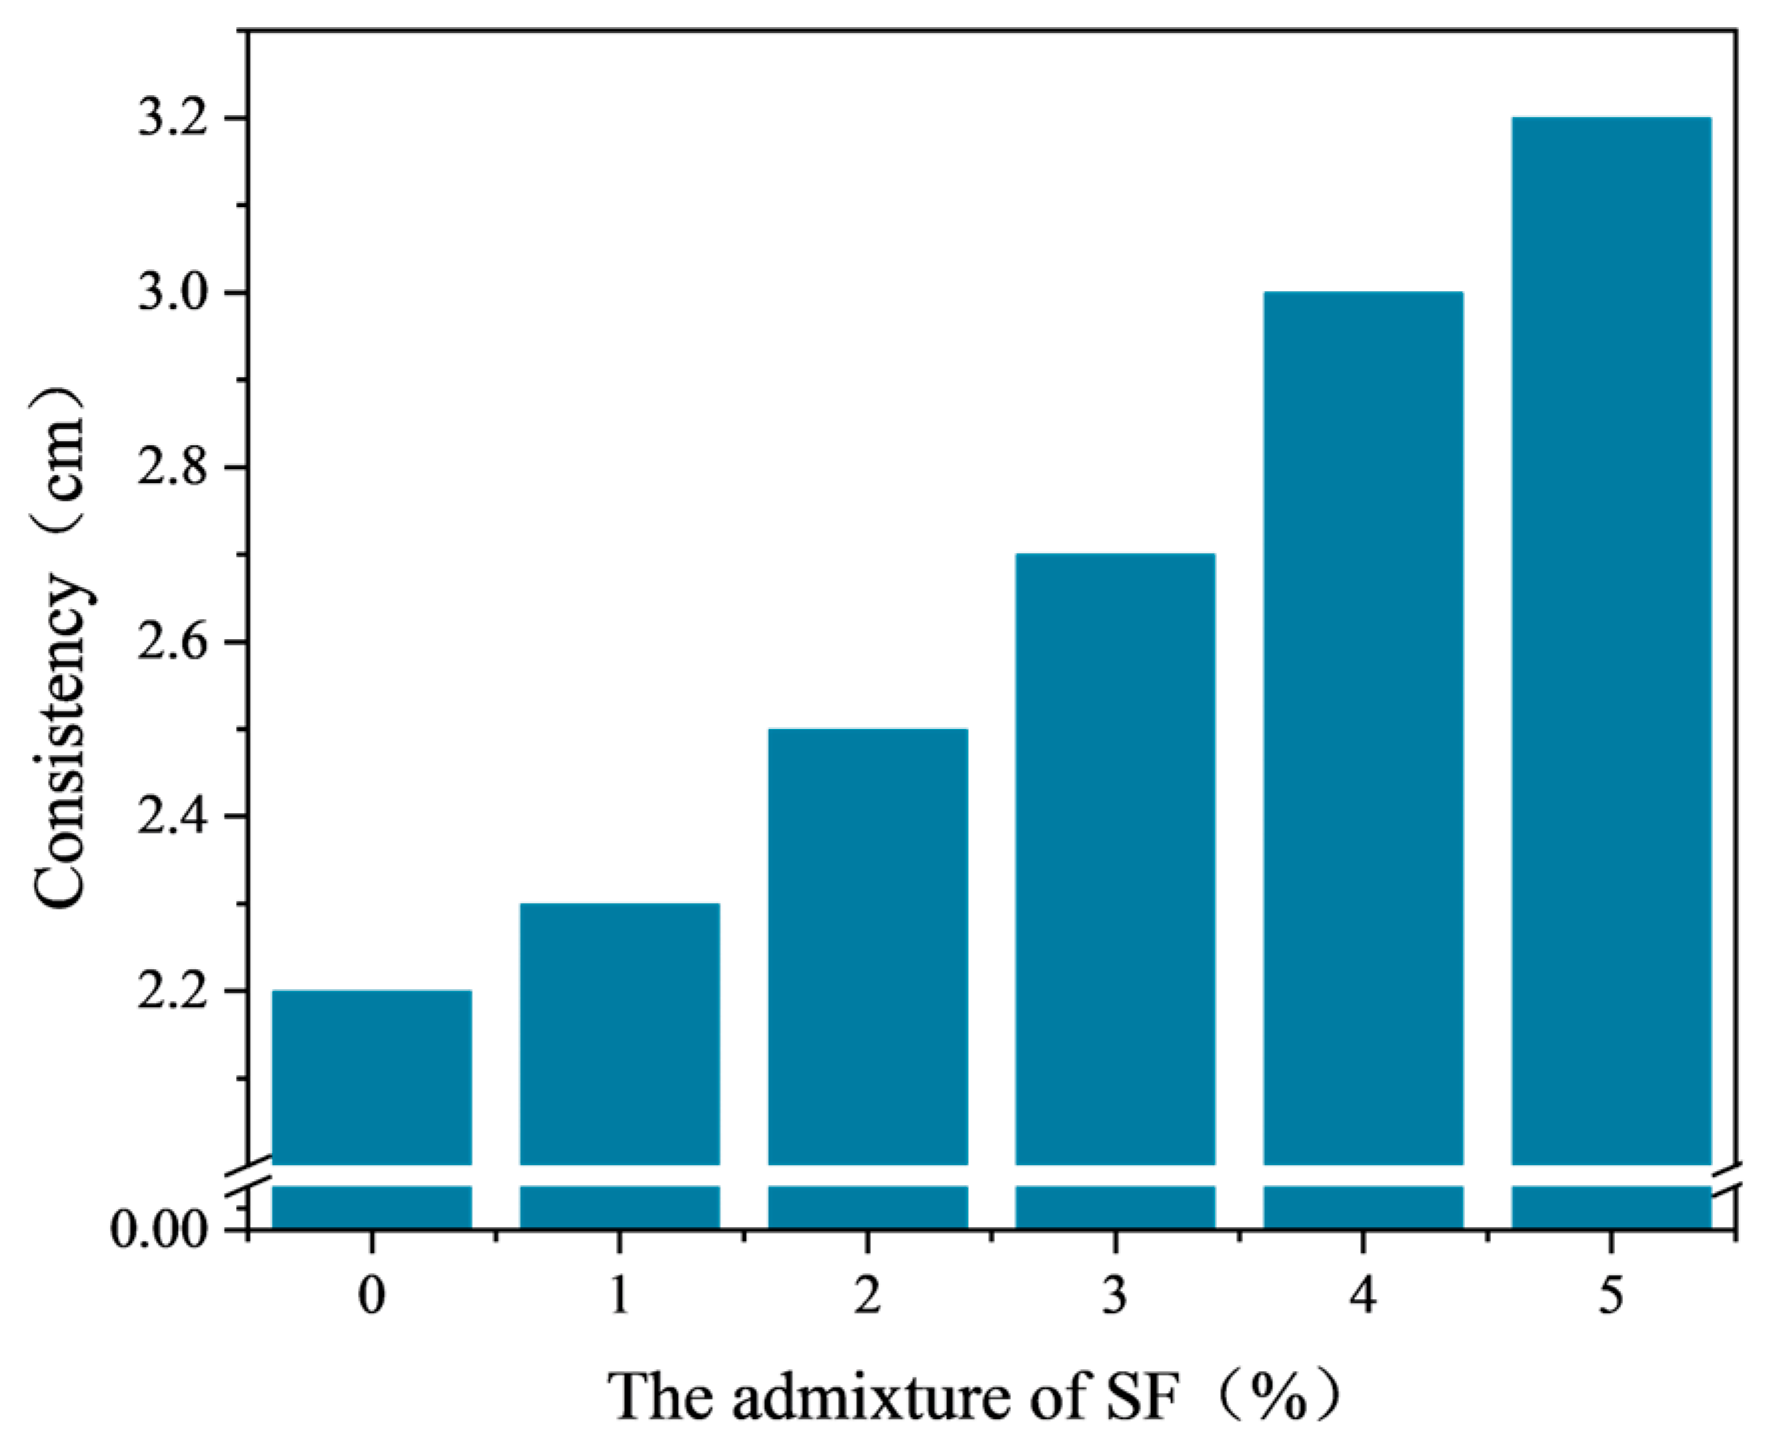
2.2.5. Consistency Test
- The material preparation process is the same as in the mixing test. Pour the raw materials into the mixing pot in sequence and mix well. Then, pour the emulsified asphalt mixture into the cone of the consistency meter and cover it with a bottom plate with a scale.
- Invert the cone and base plate together, then immediately lift the cone upwards to allow the mixture to collapse naturally.
- Measure the distance between the edge and the central circular edge of the collapsed emulsified asphalt mixture, which is the consistency of the mixture. Measure the consistency of 6 sets of emulsified asphalt mixtures in sequence, accurate to 0.1 cm.
2.2.6. SF-EAM Microwave Absorption Performance Test
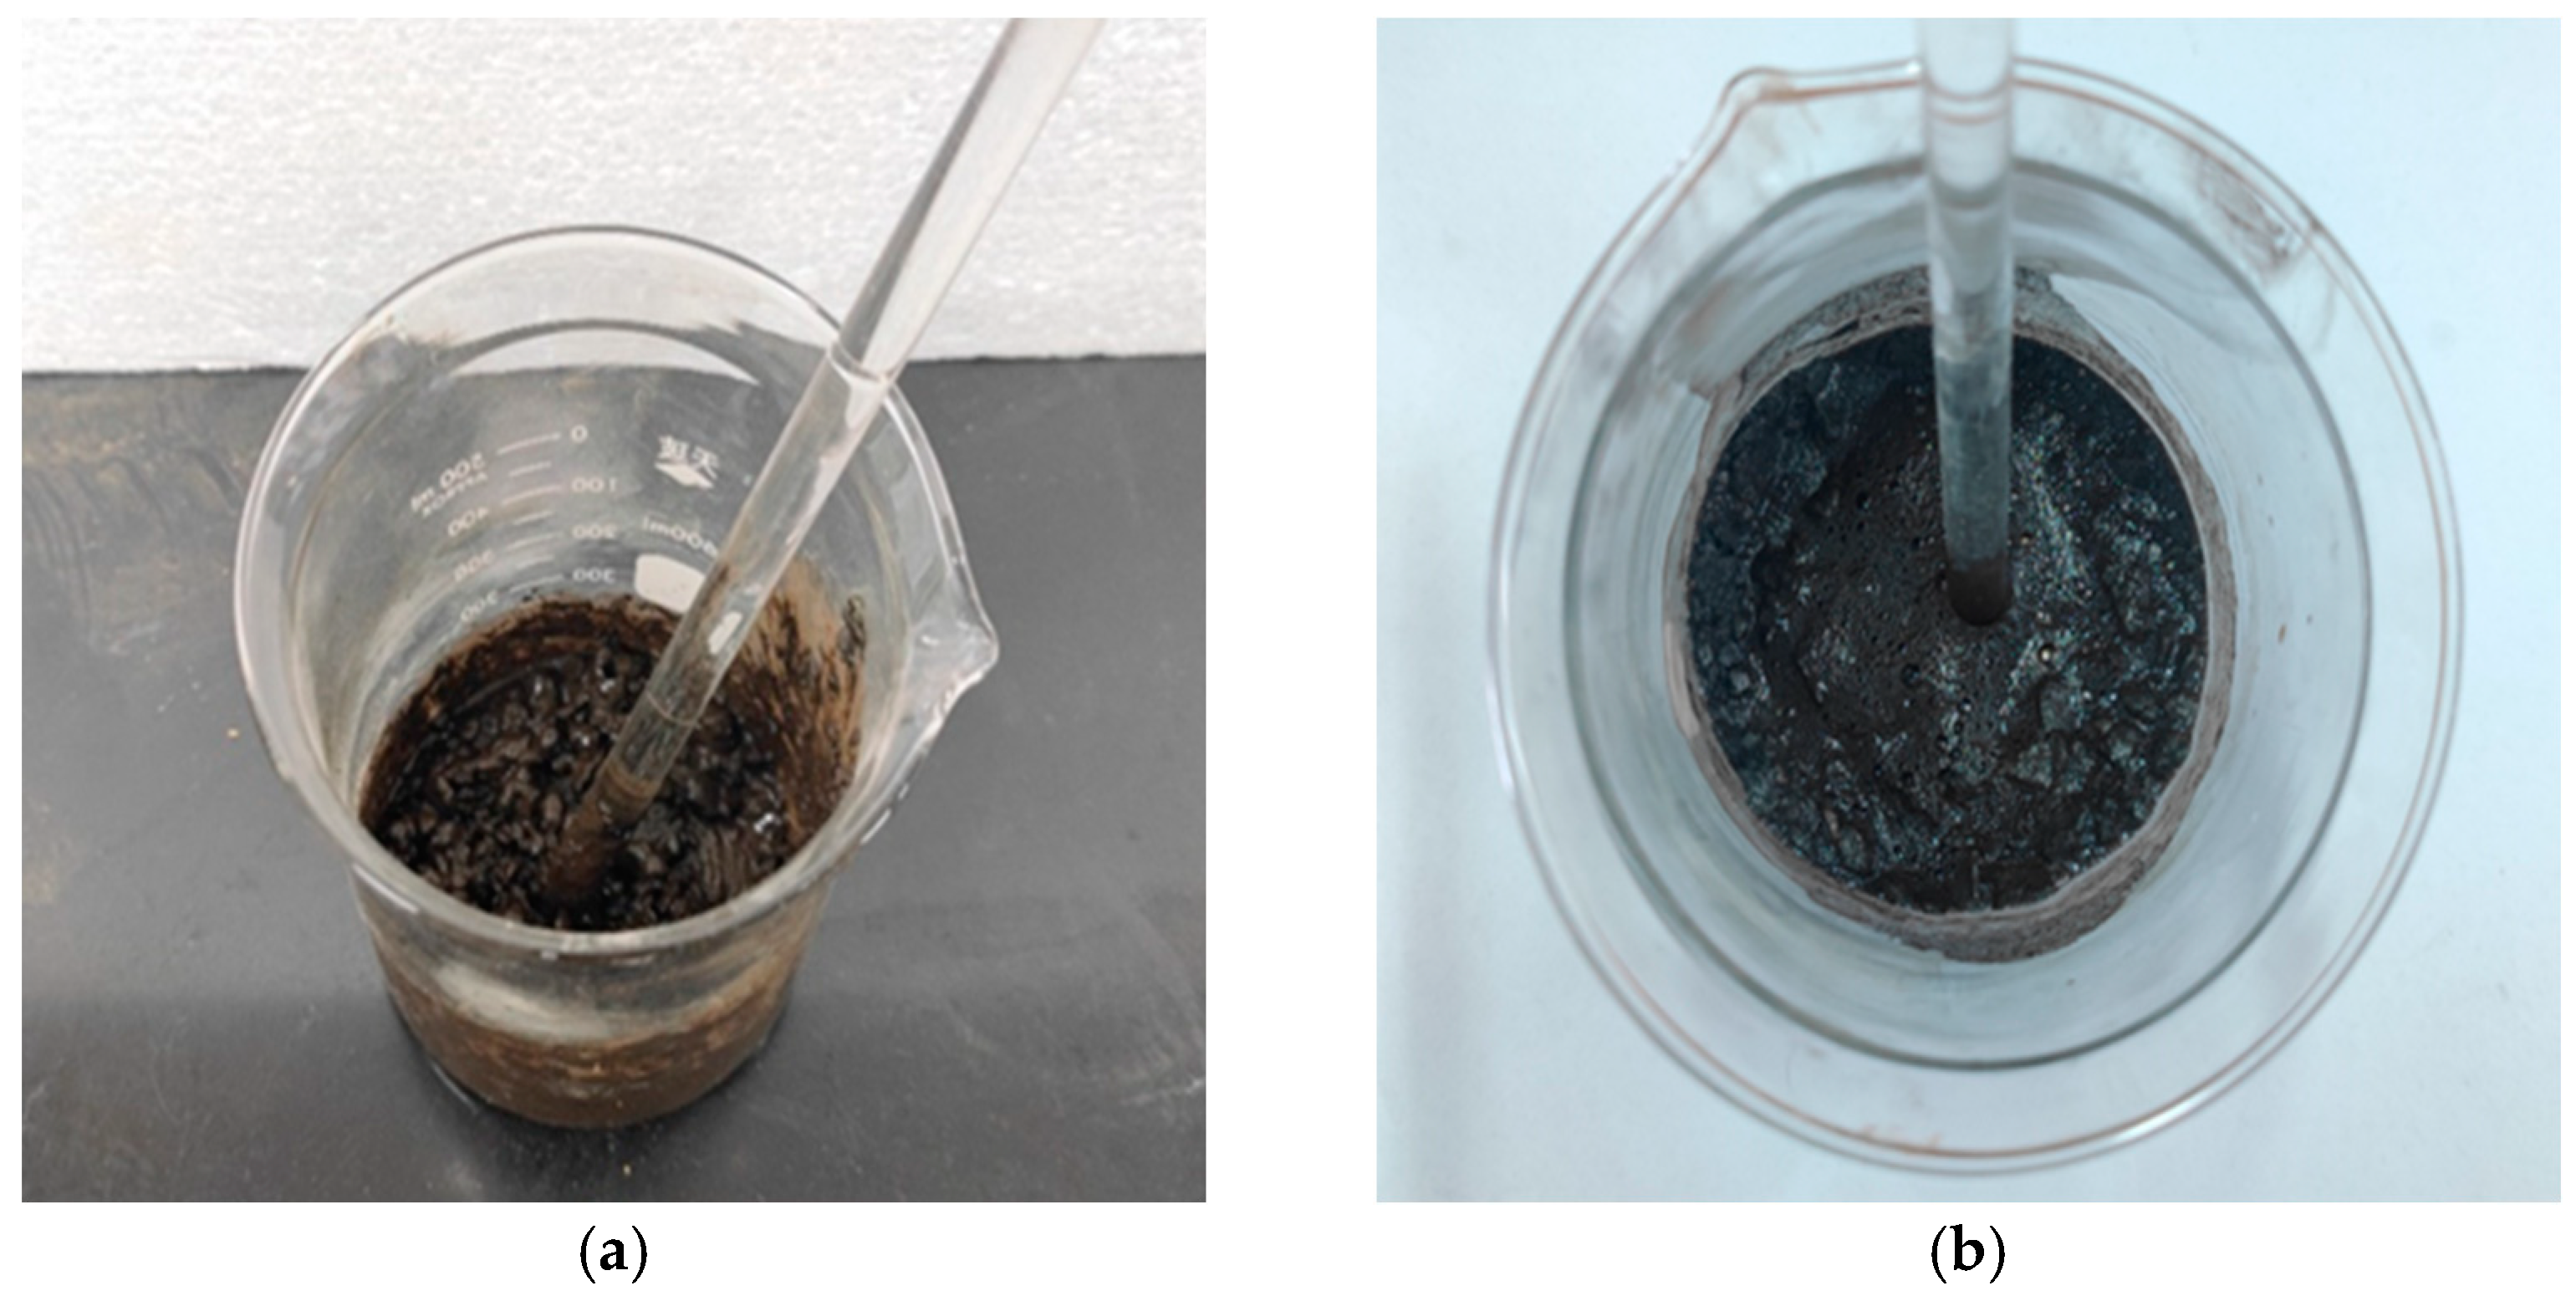
- First, mix the minerals, cement, and SF in each mixture and stir evenly. Then, add water to the mixture and mix well. Finally, add modified emulsified asphalt and stir for 30 s.
- Divide the mixed emulsified asphalt mixture into two equal parts and pour them into two identical circular test molds to make two types of identical specimens. The inner diameter of the test mold is 80 mm, and the height is 20 mm. The two types of specimens are used for temperature testing and quality testing, respectively.
- Compact and scrape the mixture to ensure a mass of 225 g for each specimen, then demold the specimen and place it in a 25 °C curing box for 10 min. Prepare 5 sets of specimens in sequence according to the above method, as shown in Figure 10.
3. Results and Discussion
3.1. Mix Proportion Design of SiC-Fe3O4 Emulsified Asphalt Mixture
3.1.1. Mix Proportion Design of Emulsified Asphalt Mixture
- When the particle size range of the mixture is 4.75~9.5 mm, the pass rate of the median in the MS-3 grading is lower than that obtained by the Taibo formula at n = 0.4, indicating that the proportion of large-sized coarse aggregates in the median of the MS-3 grading is relatively small.
- When the particle size range of the mixture is 0.6~4.75 mm, the pass rate of the median in the MS-3 grading is greater than that obtained by the Taibo formula at n = 0.4 with accounting for a large proportion. Specifically, in the range of 1.18~2.36 mm, the difference accounts for 33%, indicating that the proportion of medium and small-sized coarse aggregates and large-sized fine aggregates in the median of the MS-3 grading is relatively high.
- When the particle size range of the mixture is 0.075–0.6 mm, the pass rate of the median in the MS-3 grading is lower than that obtained by the Taibo formula at n = 0.4. Although the absolute difference is not significant, it accounts for a large proportion, especially in the range of 0.075–0.15 mm, where the difference accounts for as much as 46%, indicating that the proportion of small particle-sized fine aggregates in the median of the MS-3 grading is relatively small.
- When the external water content is less than 4%, the mixing time of the emulsified asphalt mixture under both gradations is less than 120 s, which does not meet the specification requirements.
- When the external water content is greater than 5%, the mixing time exceeds 120 s, meeting the specification requirements.
- When the external water content reaches 7%, the surface of the emulsified asphalt mixture becomes relatively moist, with some flowing water, making it difficult to form a cohesive mixture.
- Under the same moisture content conditions, the mixing time for gradation A is higher than for gradation B, with an average increase of about 5%.
3.1.2. Content Range of SiC-Fe3O4 Composite Materials
3.2. Microwave Absorption Performance Test of Emulsified Asphalt Mixture
3.2.1. Evaluation Indicators for Microwave Absorption Performance
- Temperature change ()
- 2.
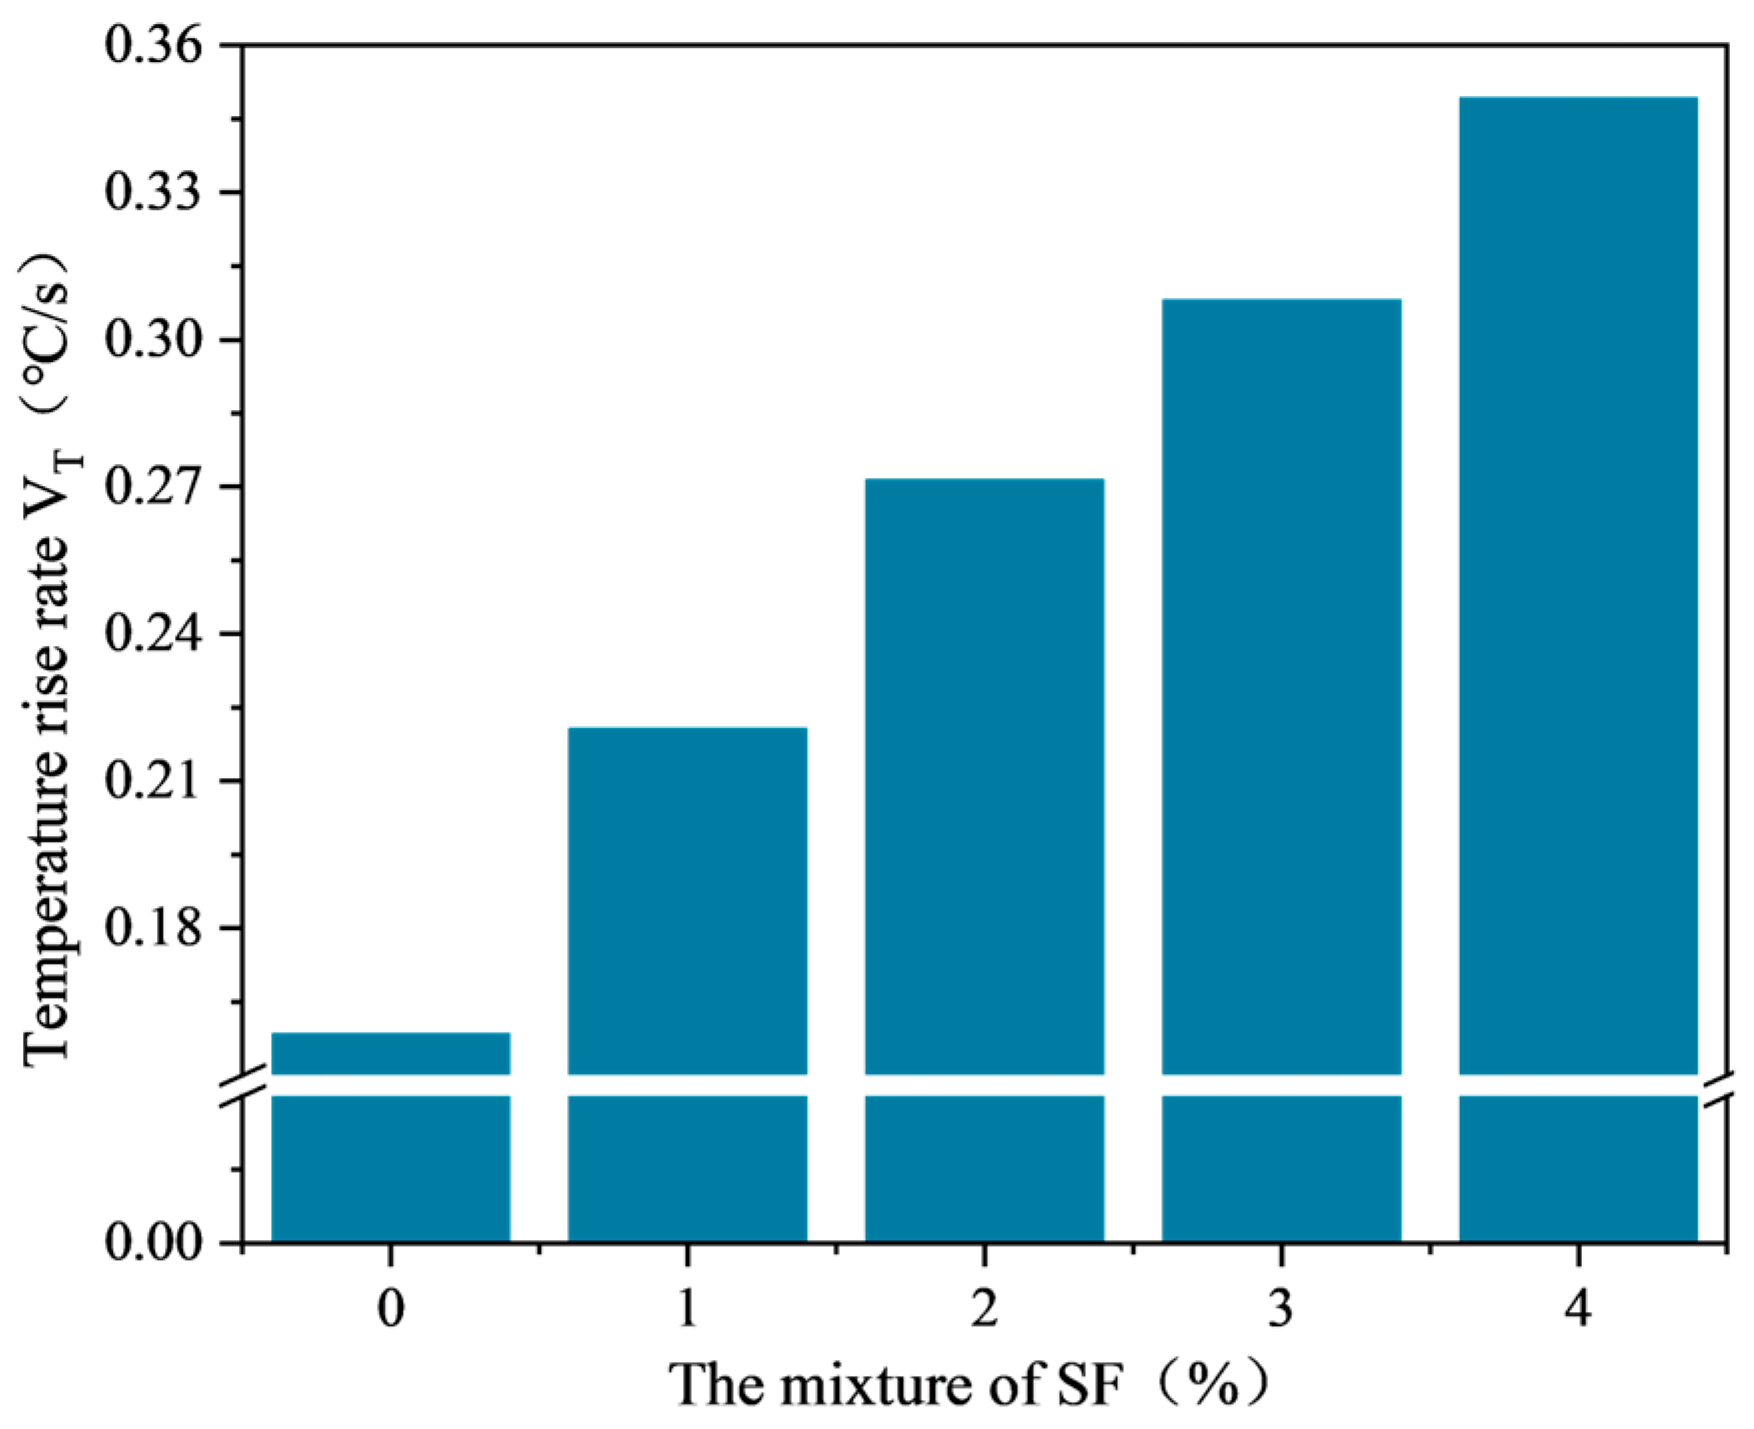
- Temperature rise rate (VT)
- 3.
- The rate of increase in temperature rise rate (ω)
- 4.
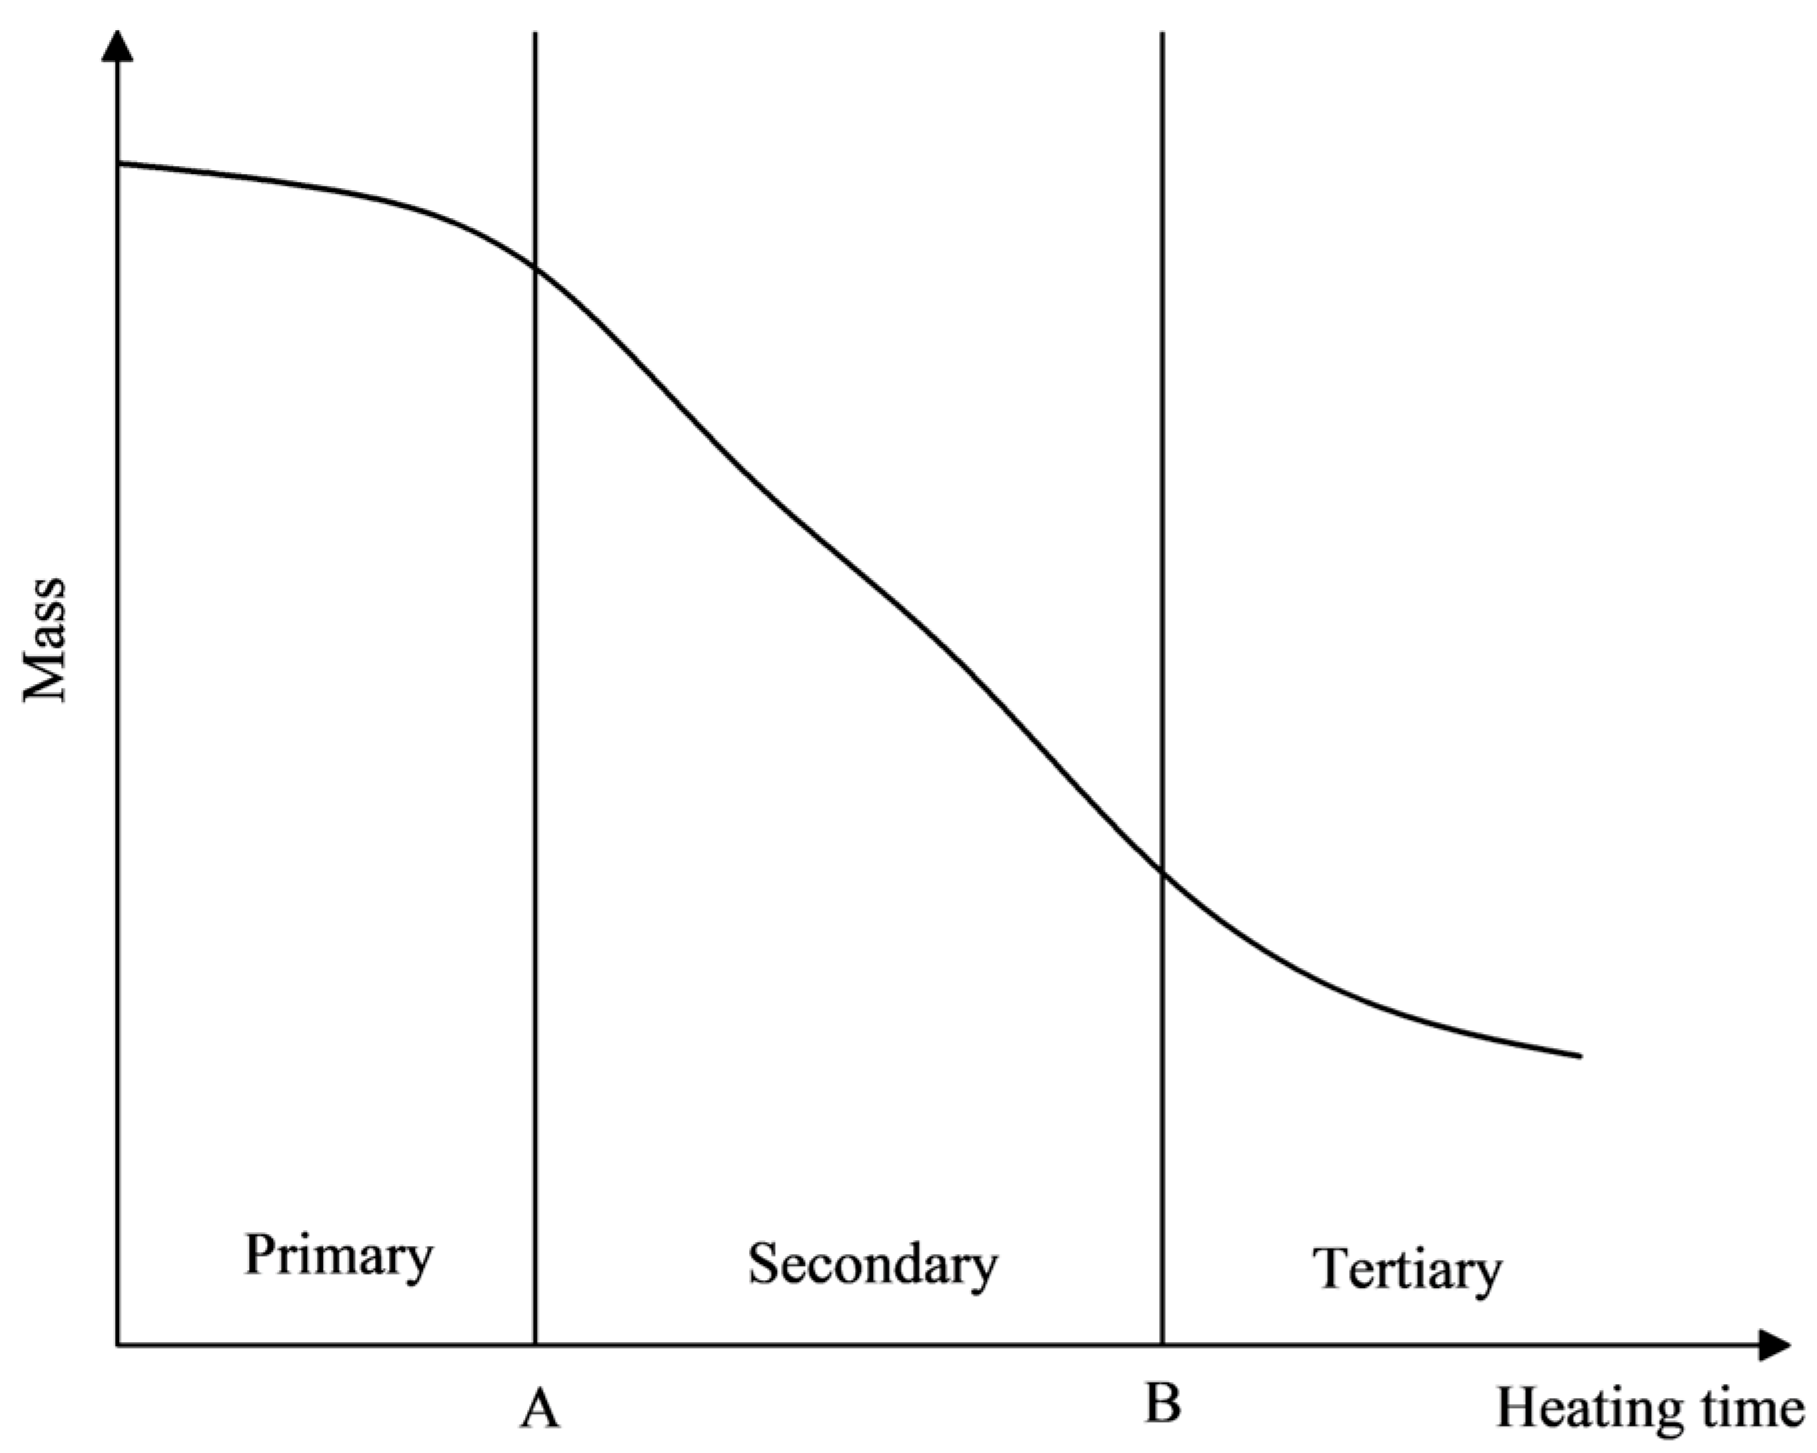
- Quality change ()
- 5.
- Quality reduction rate ()
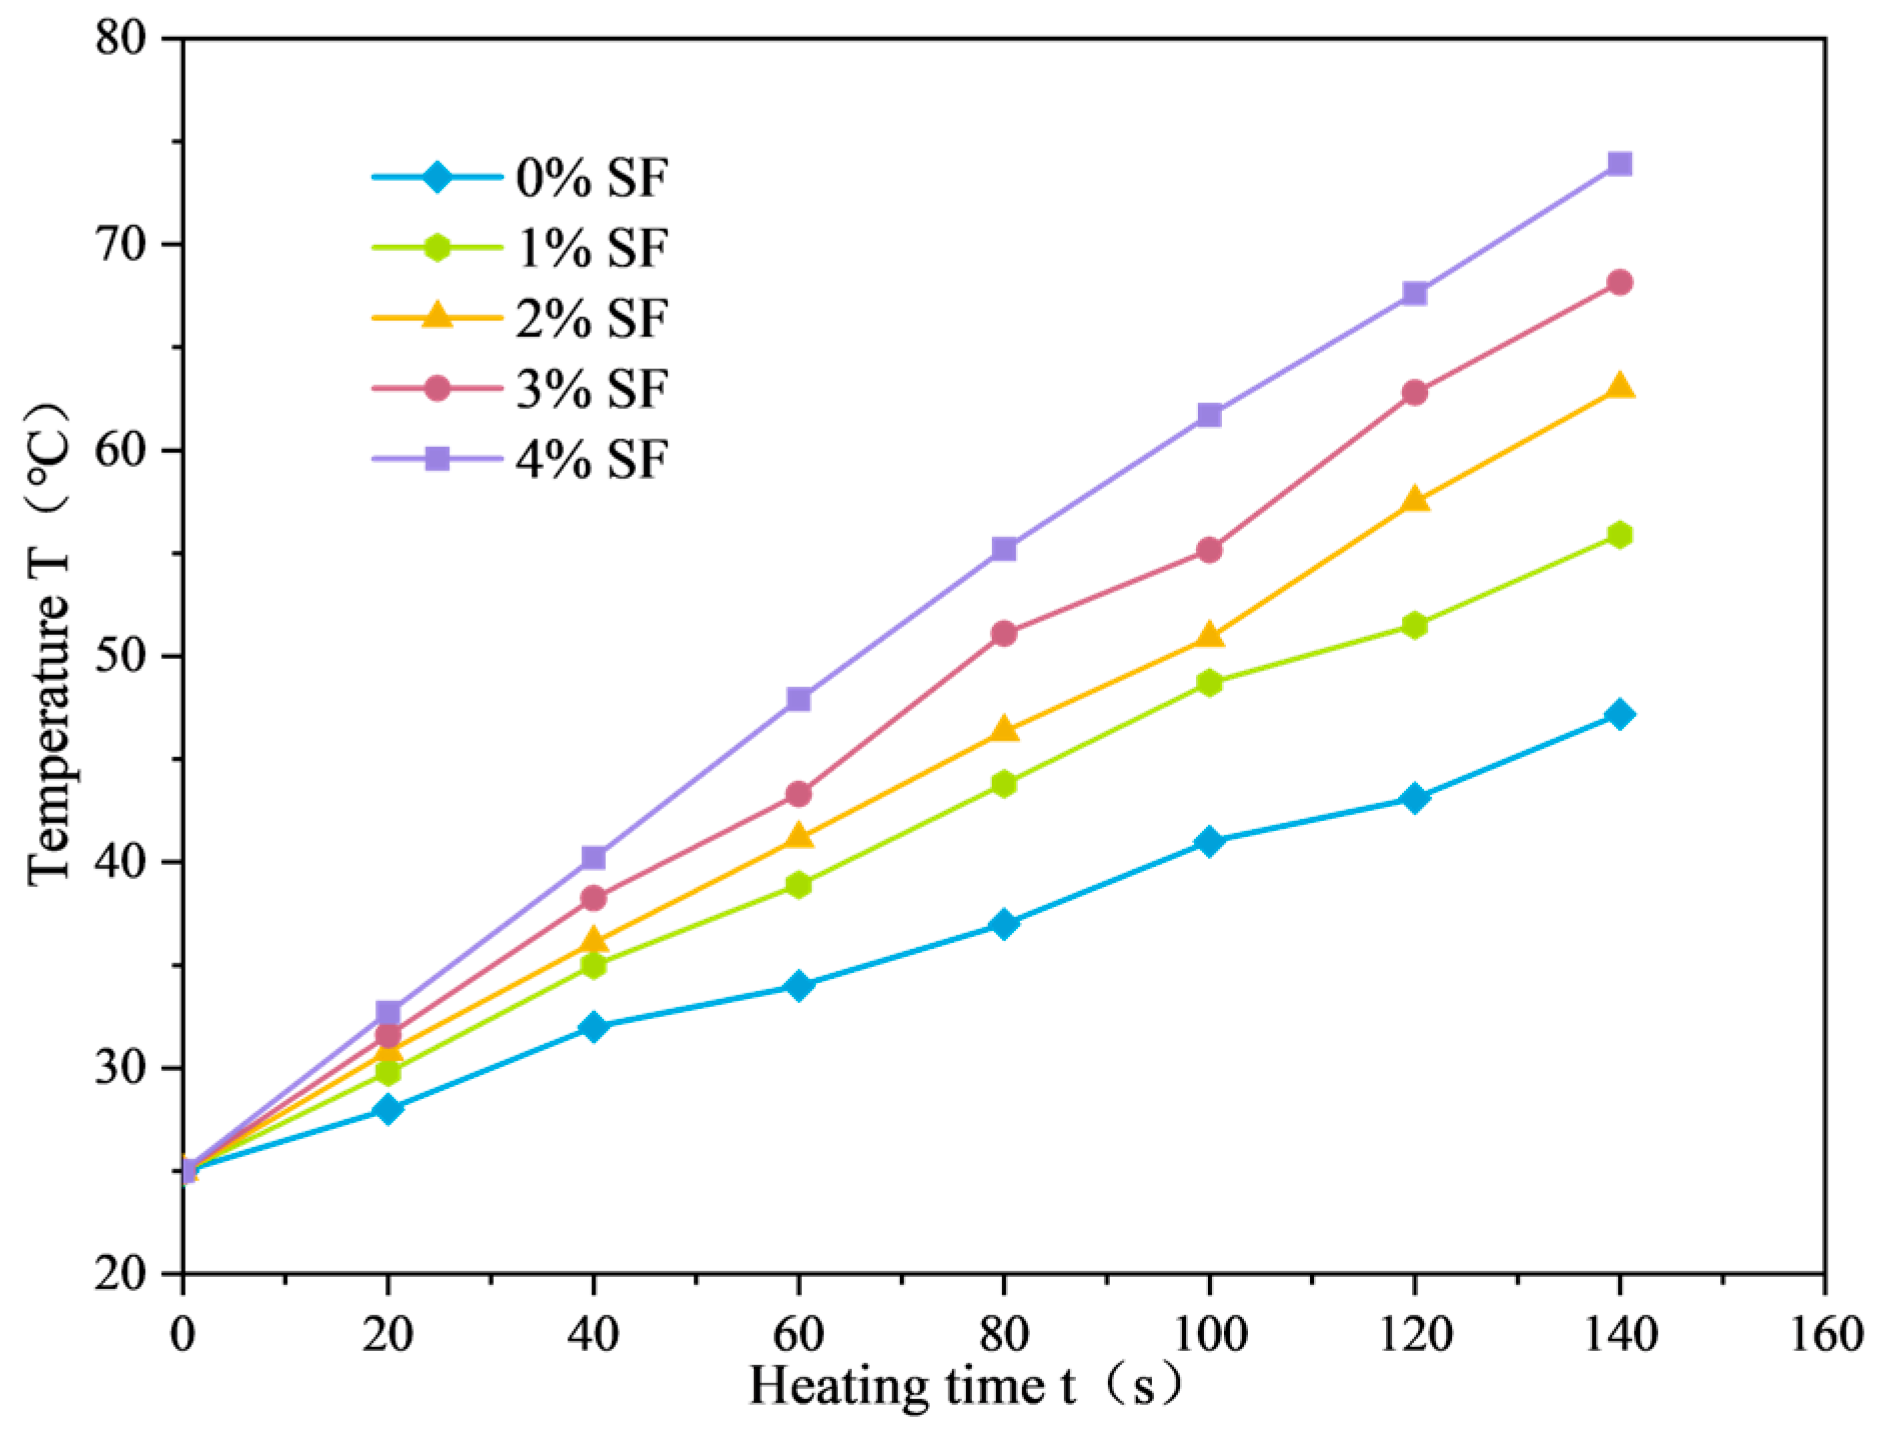
3.2.2. Analysis of the Effect of SF Content on the Microwave Absorption Performance of SF-EAM
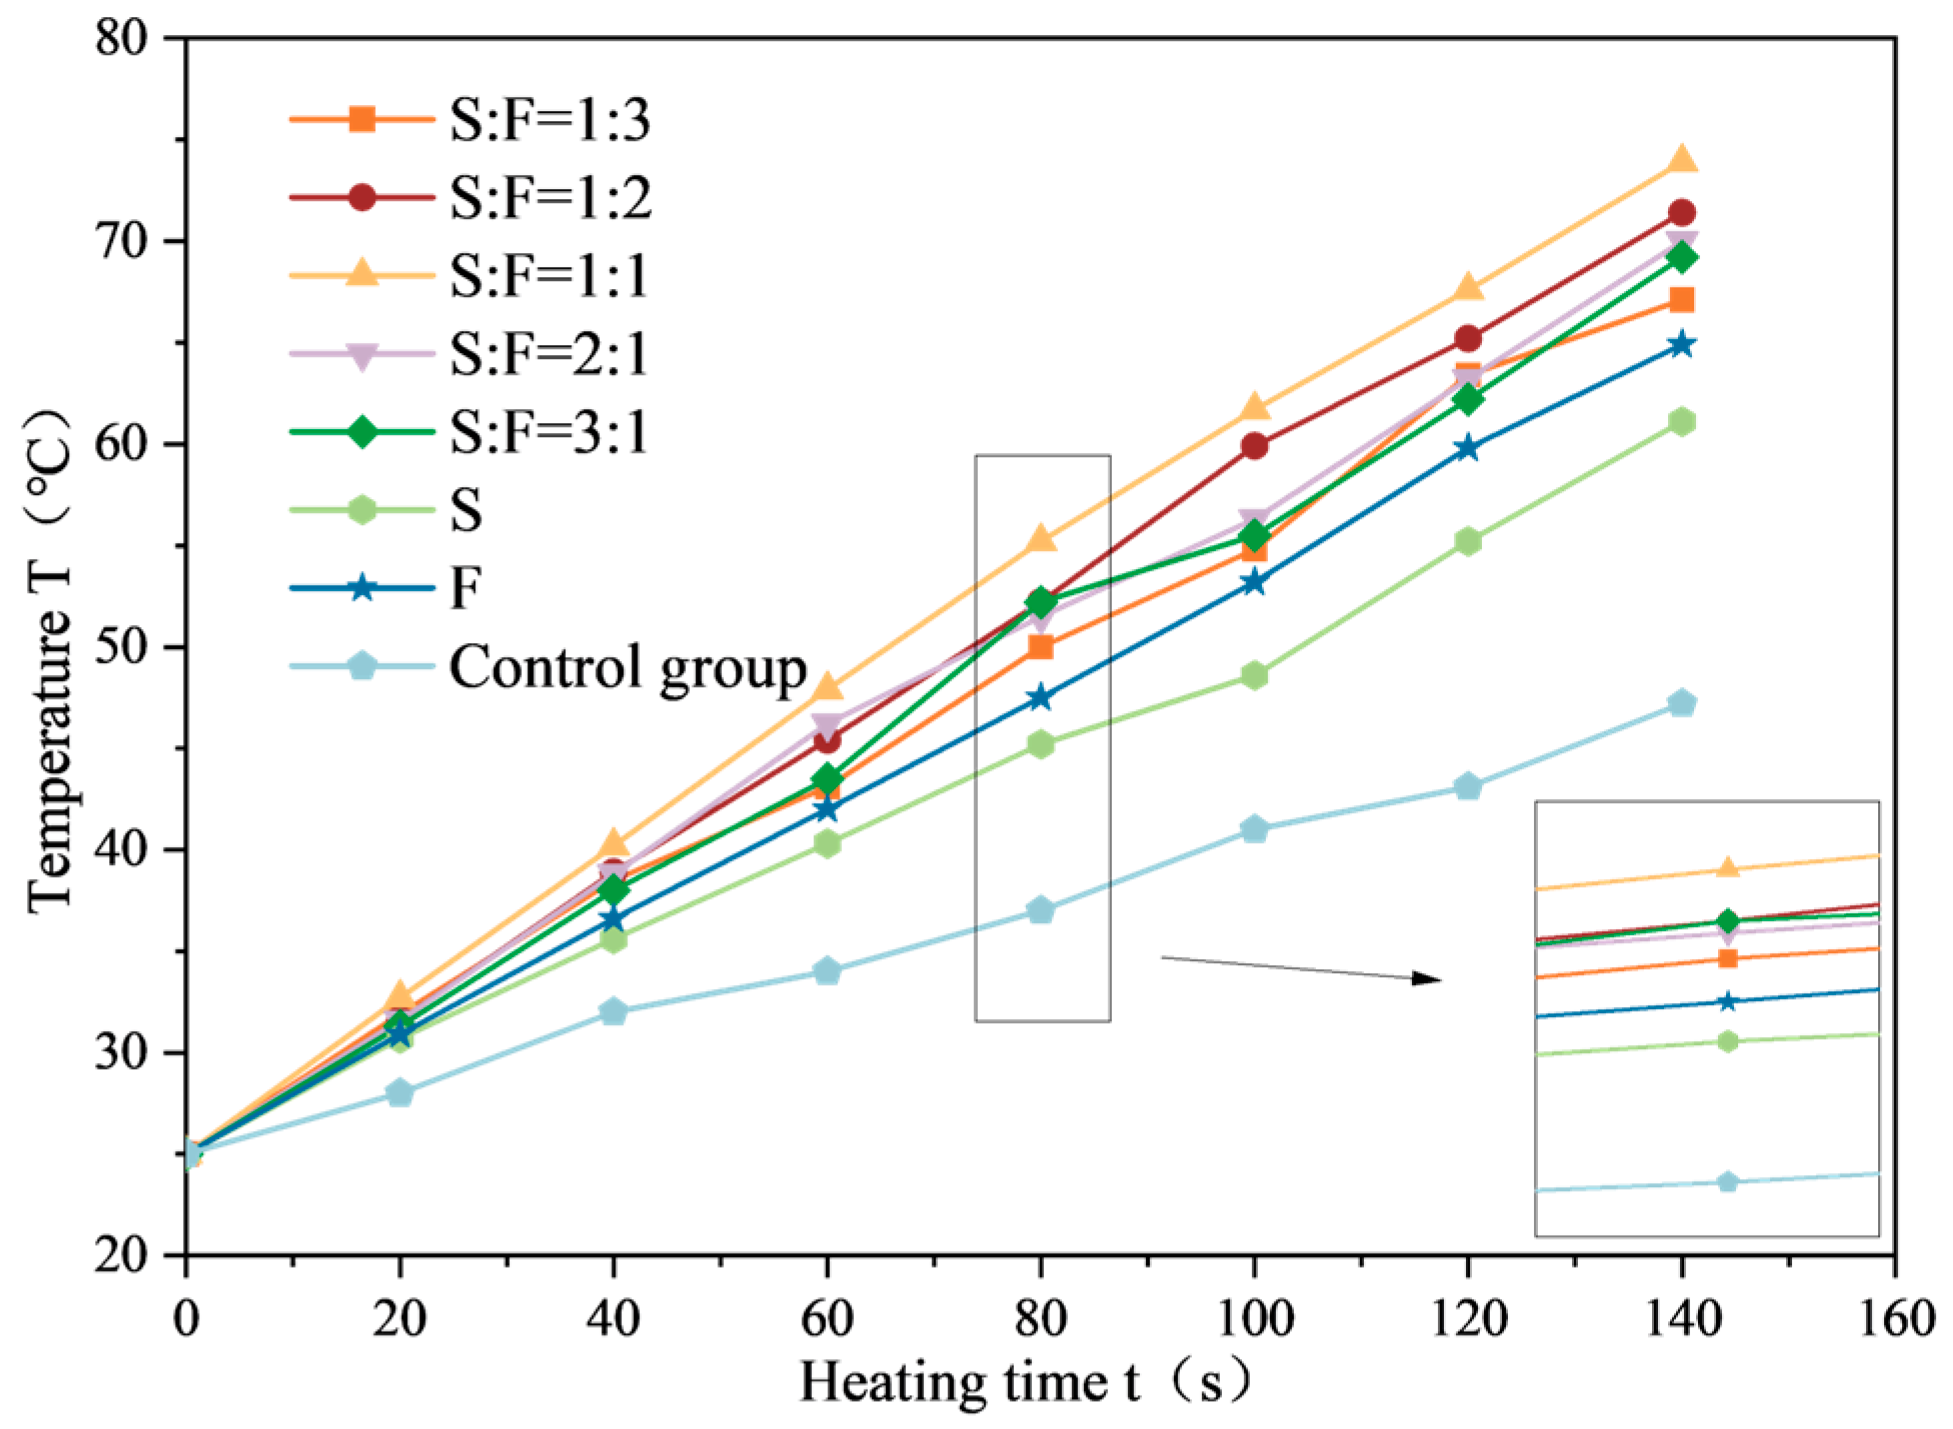
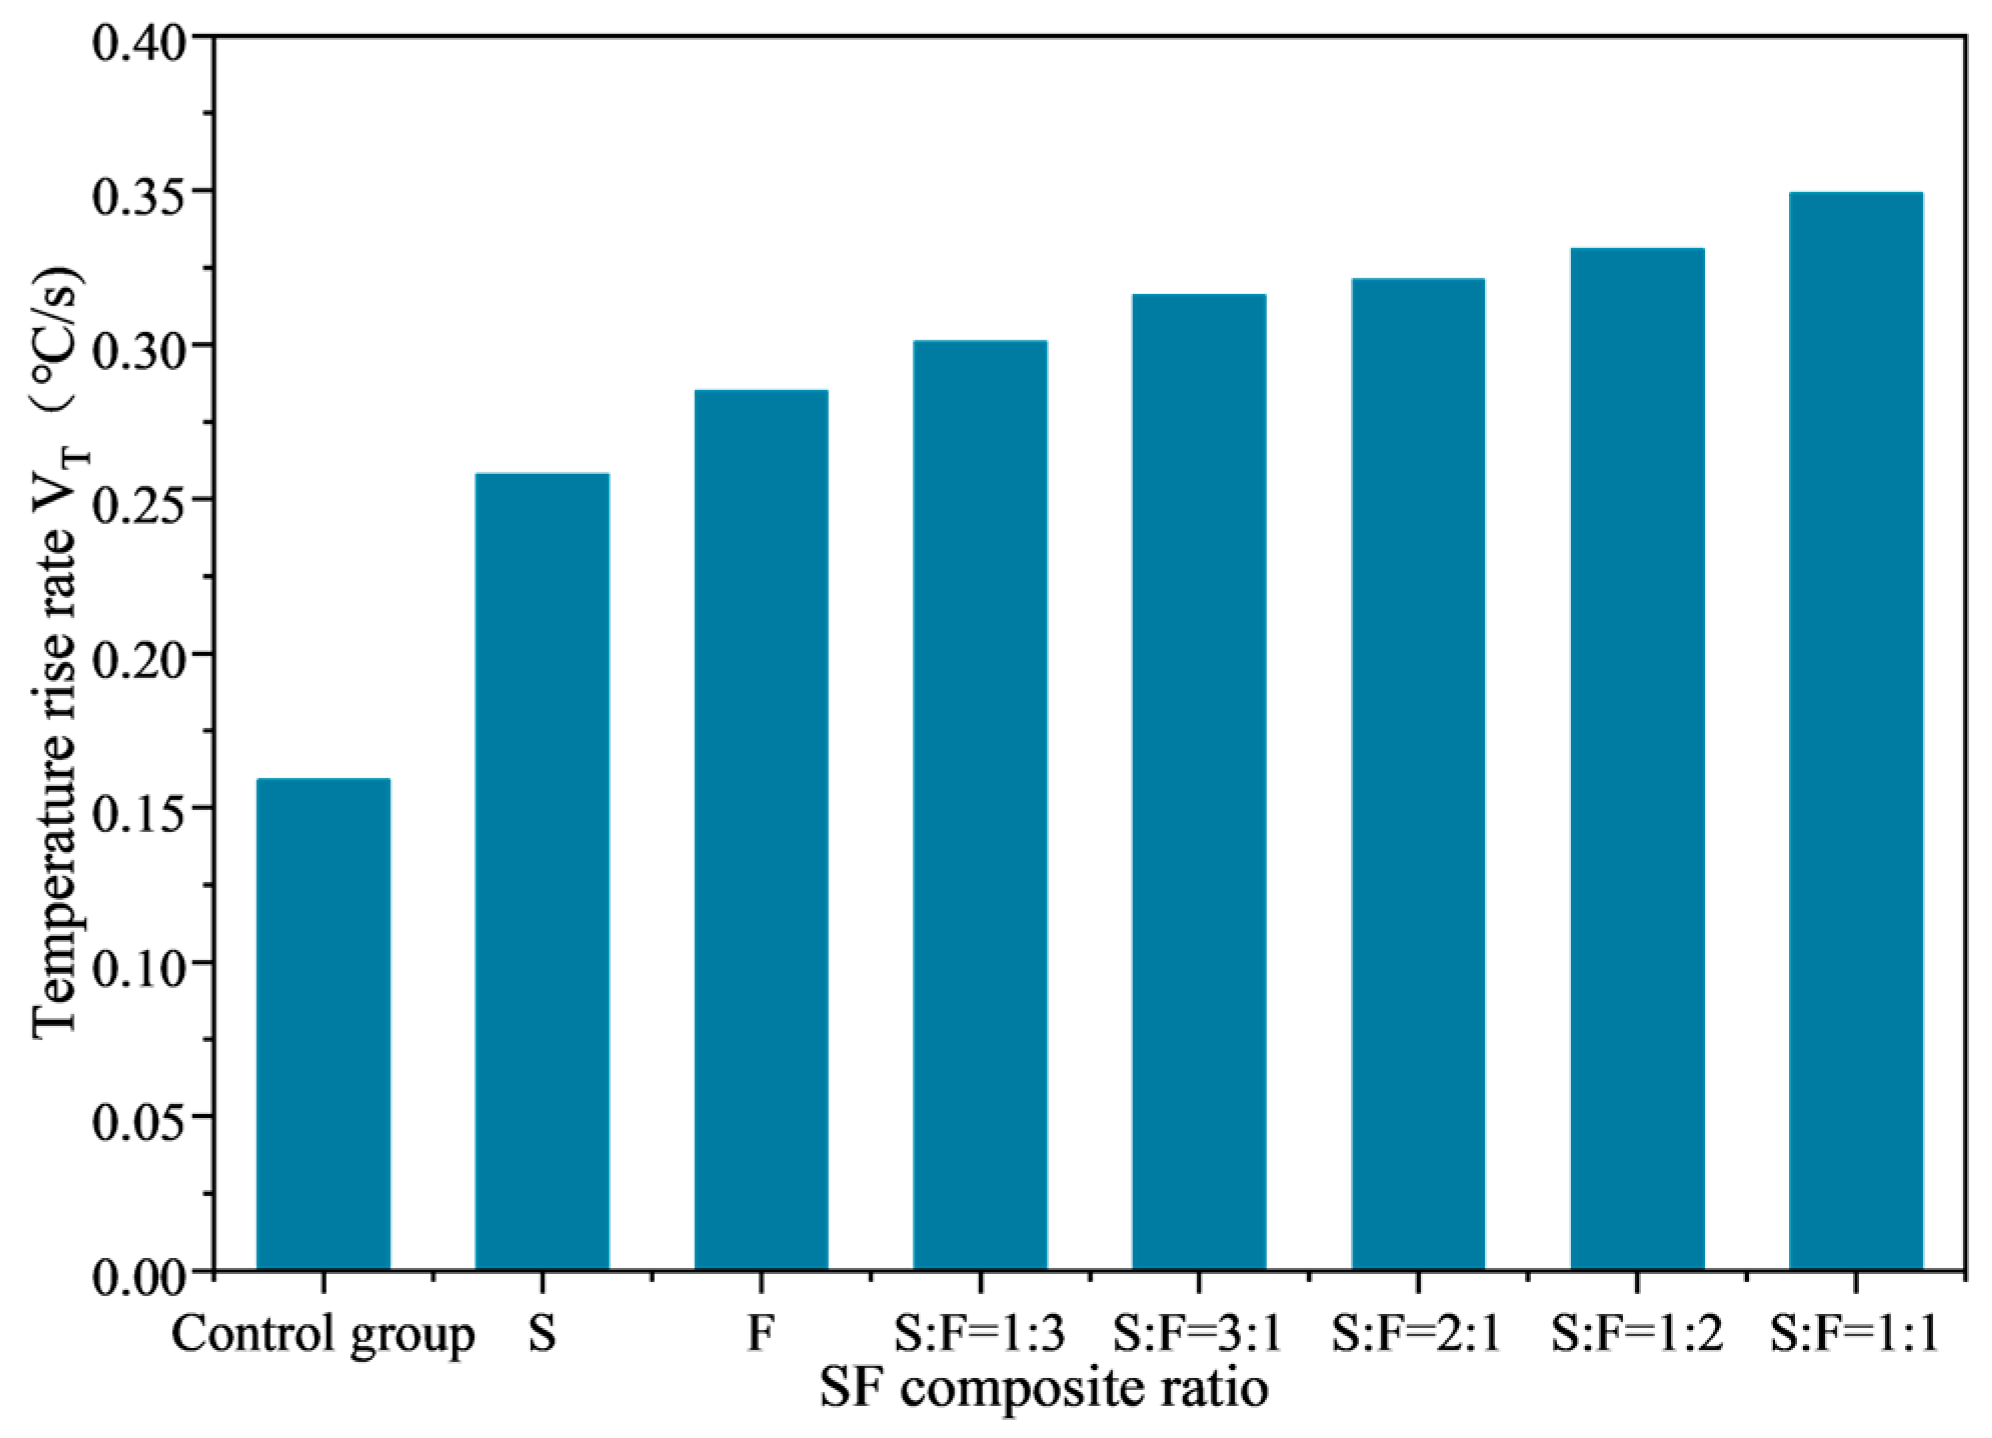
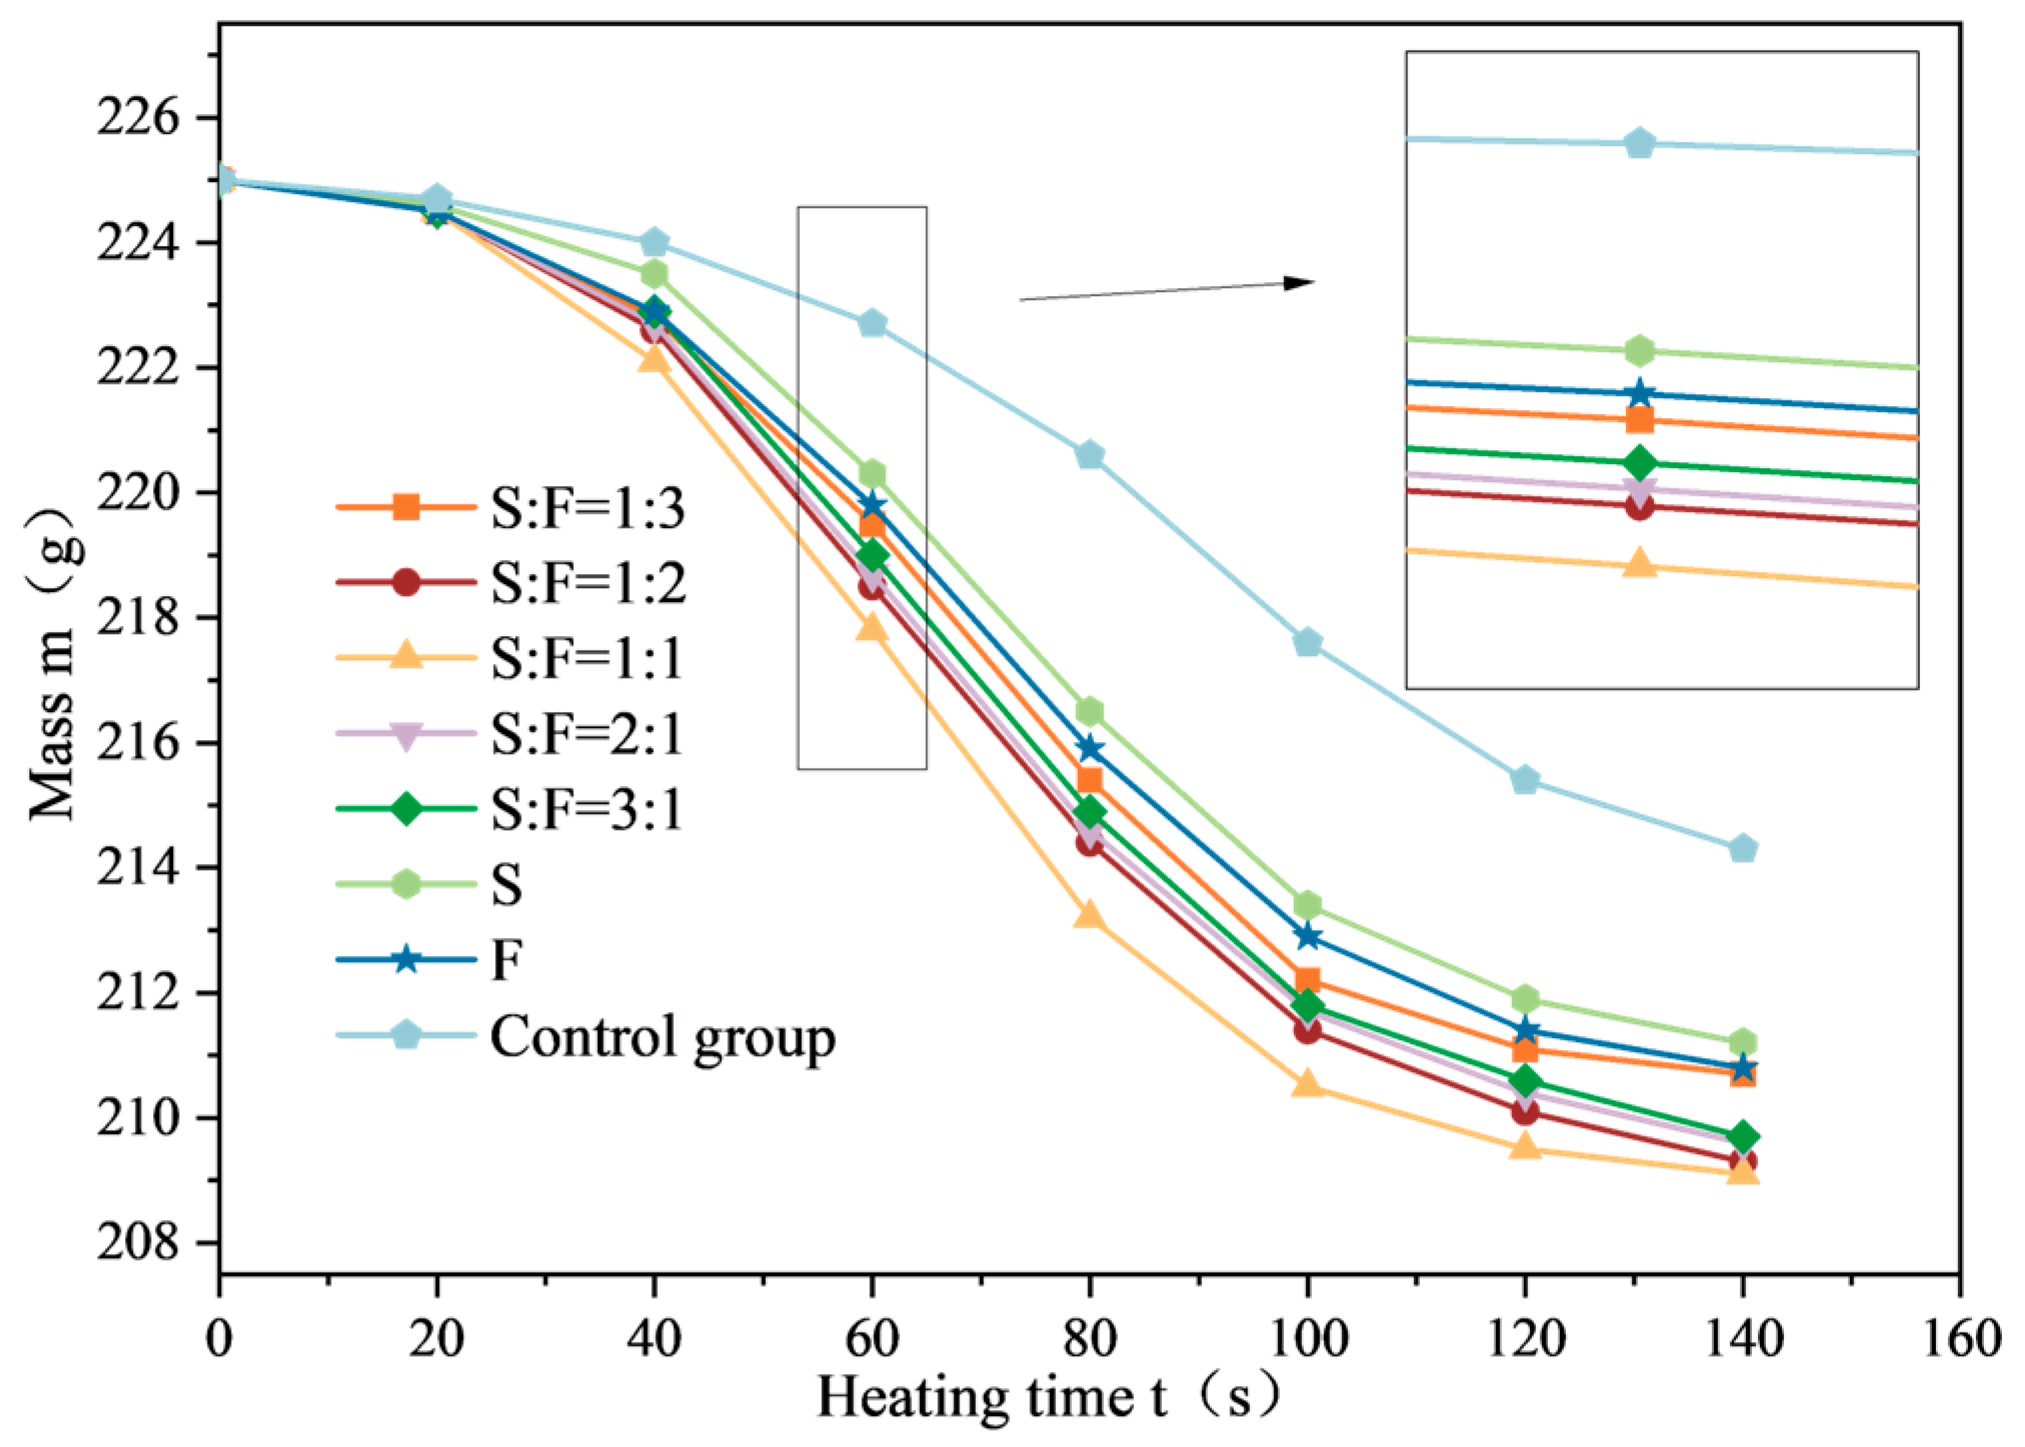
3.2.3. Analysis of the Influence of SF Composite Ratio on the Microwave Absorption Performance of SF-EAM
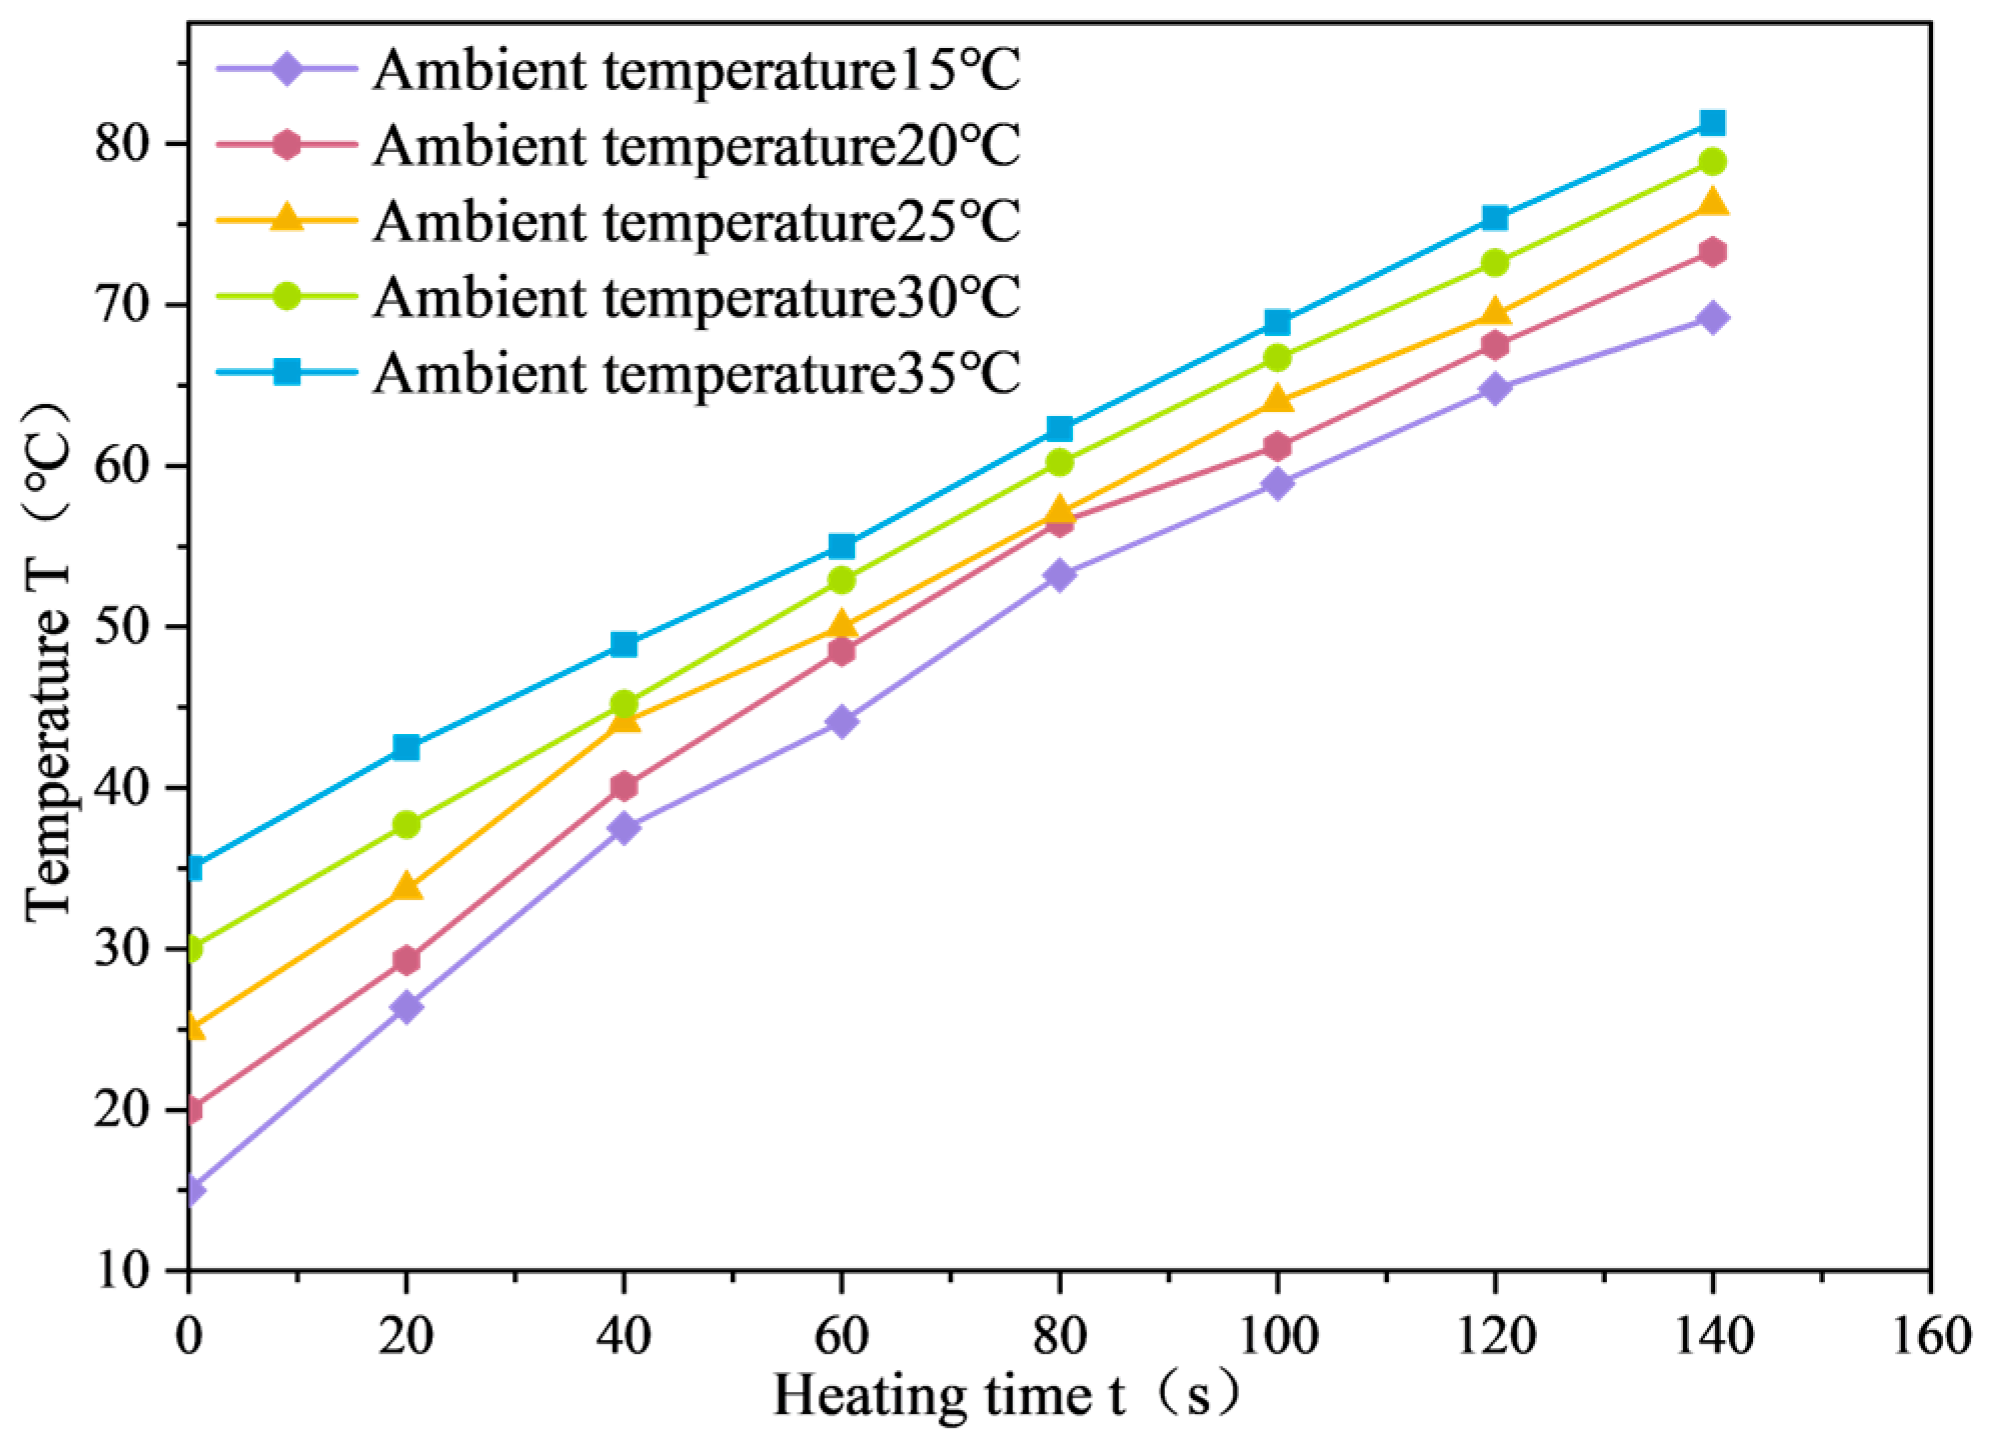
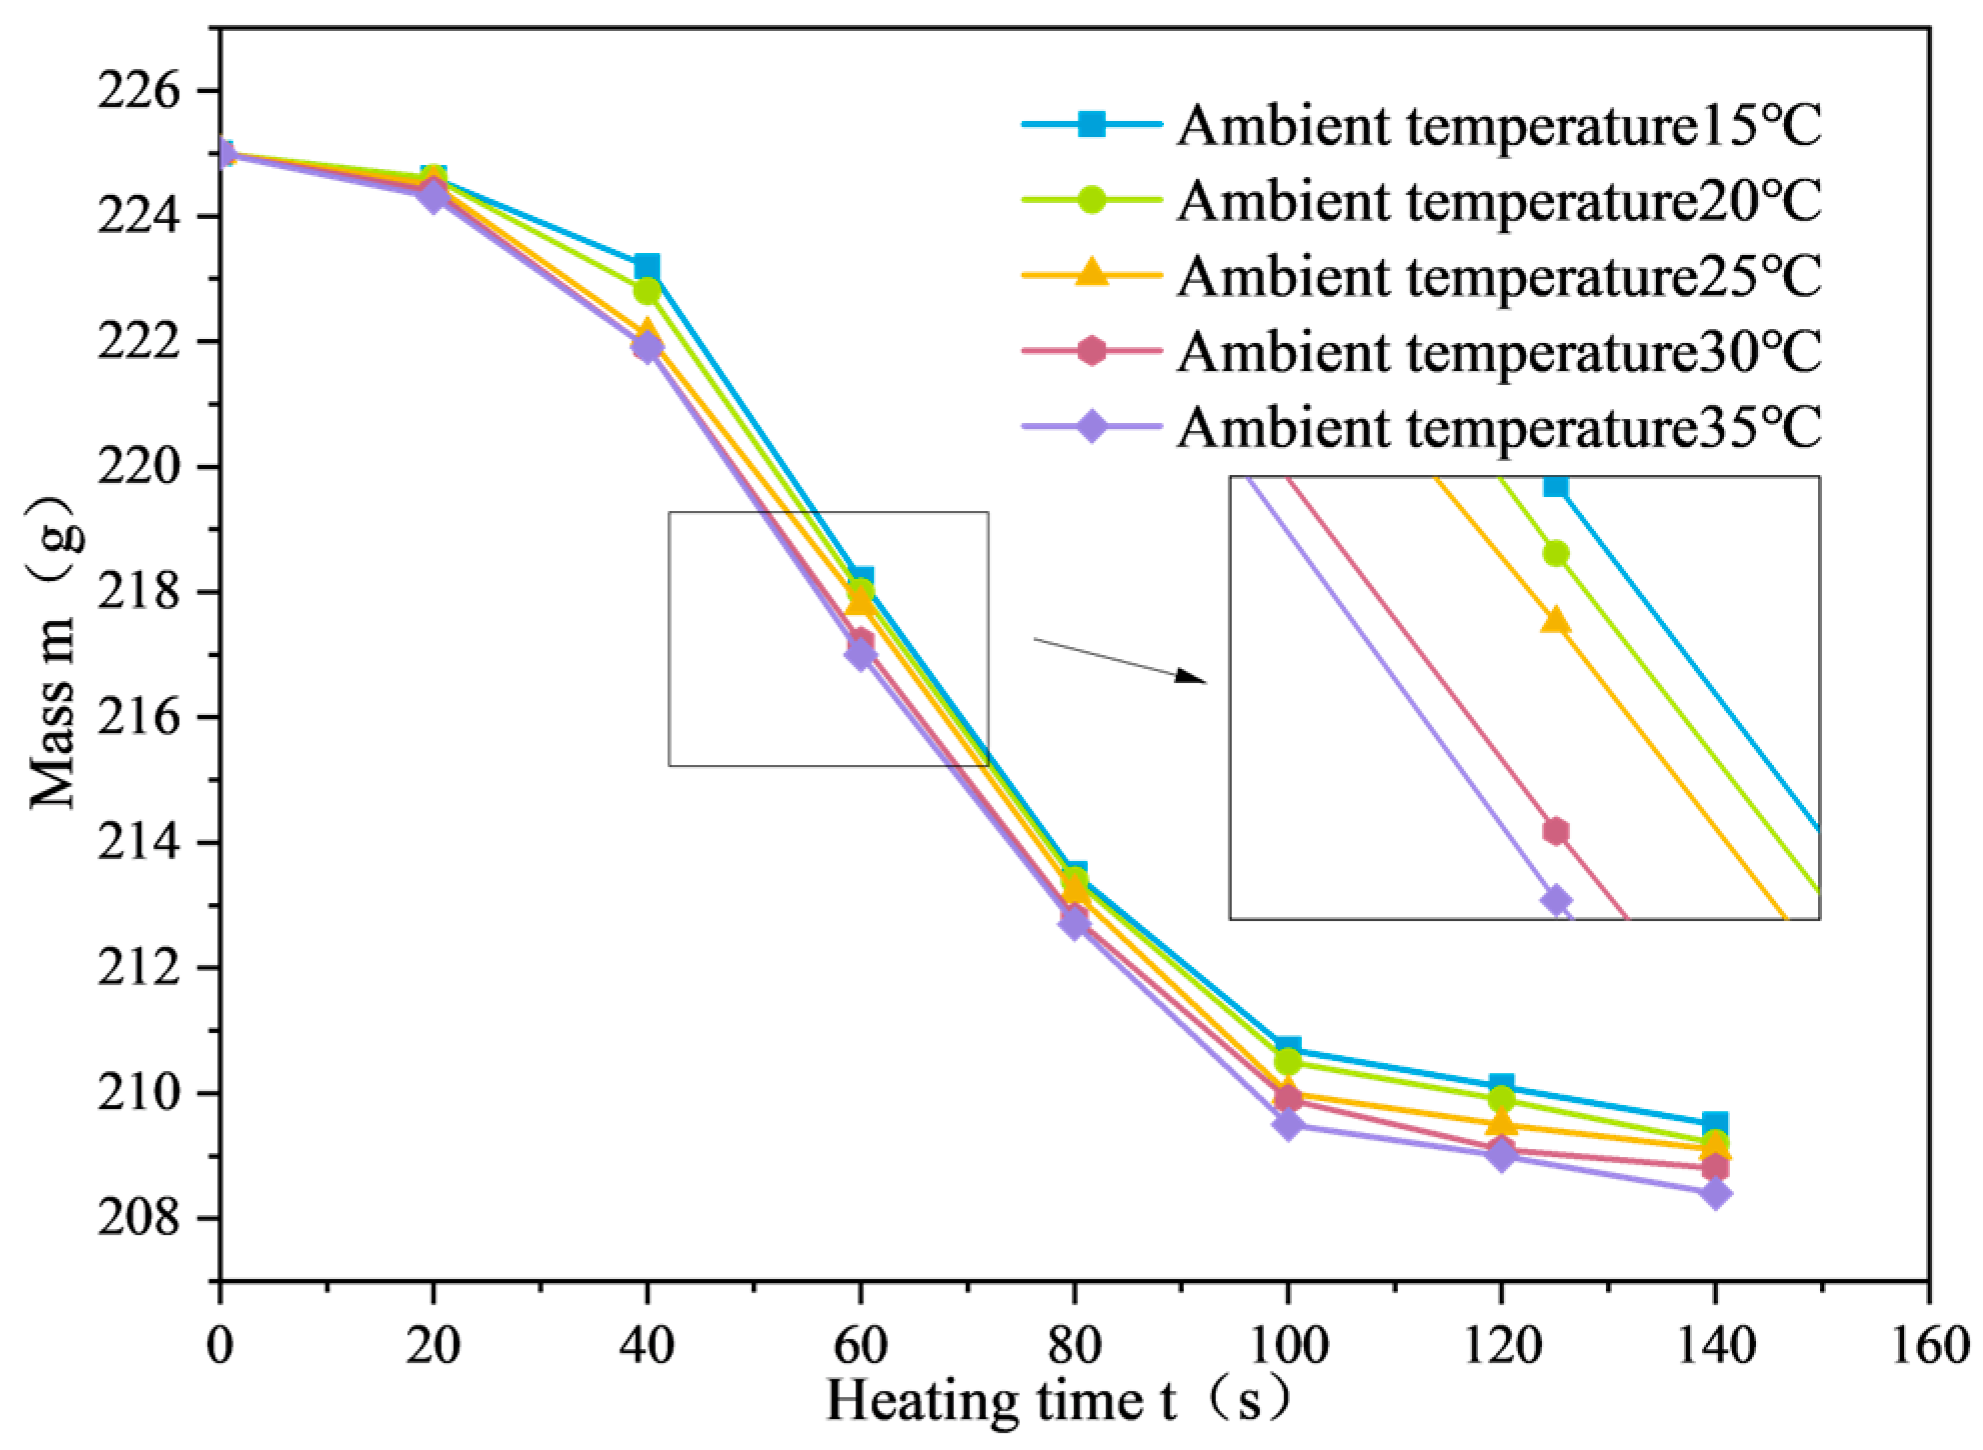
3.2.4. Analysis of the Influence of Environmental Temperature on the Microwave Absorption Performance of SF-EAM
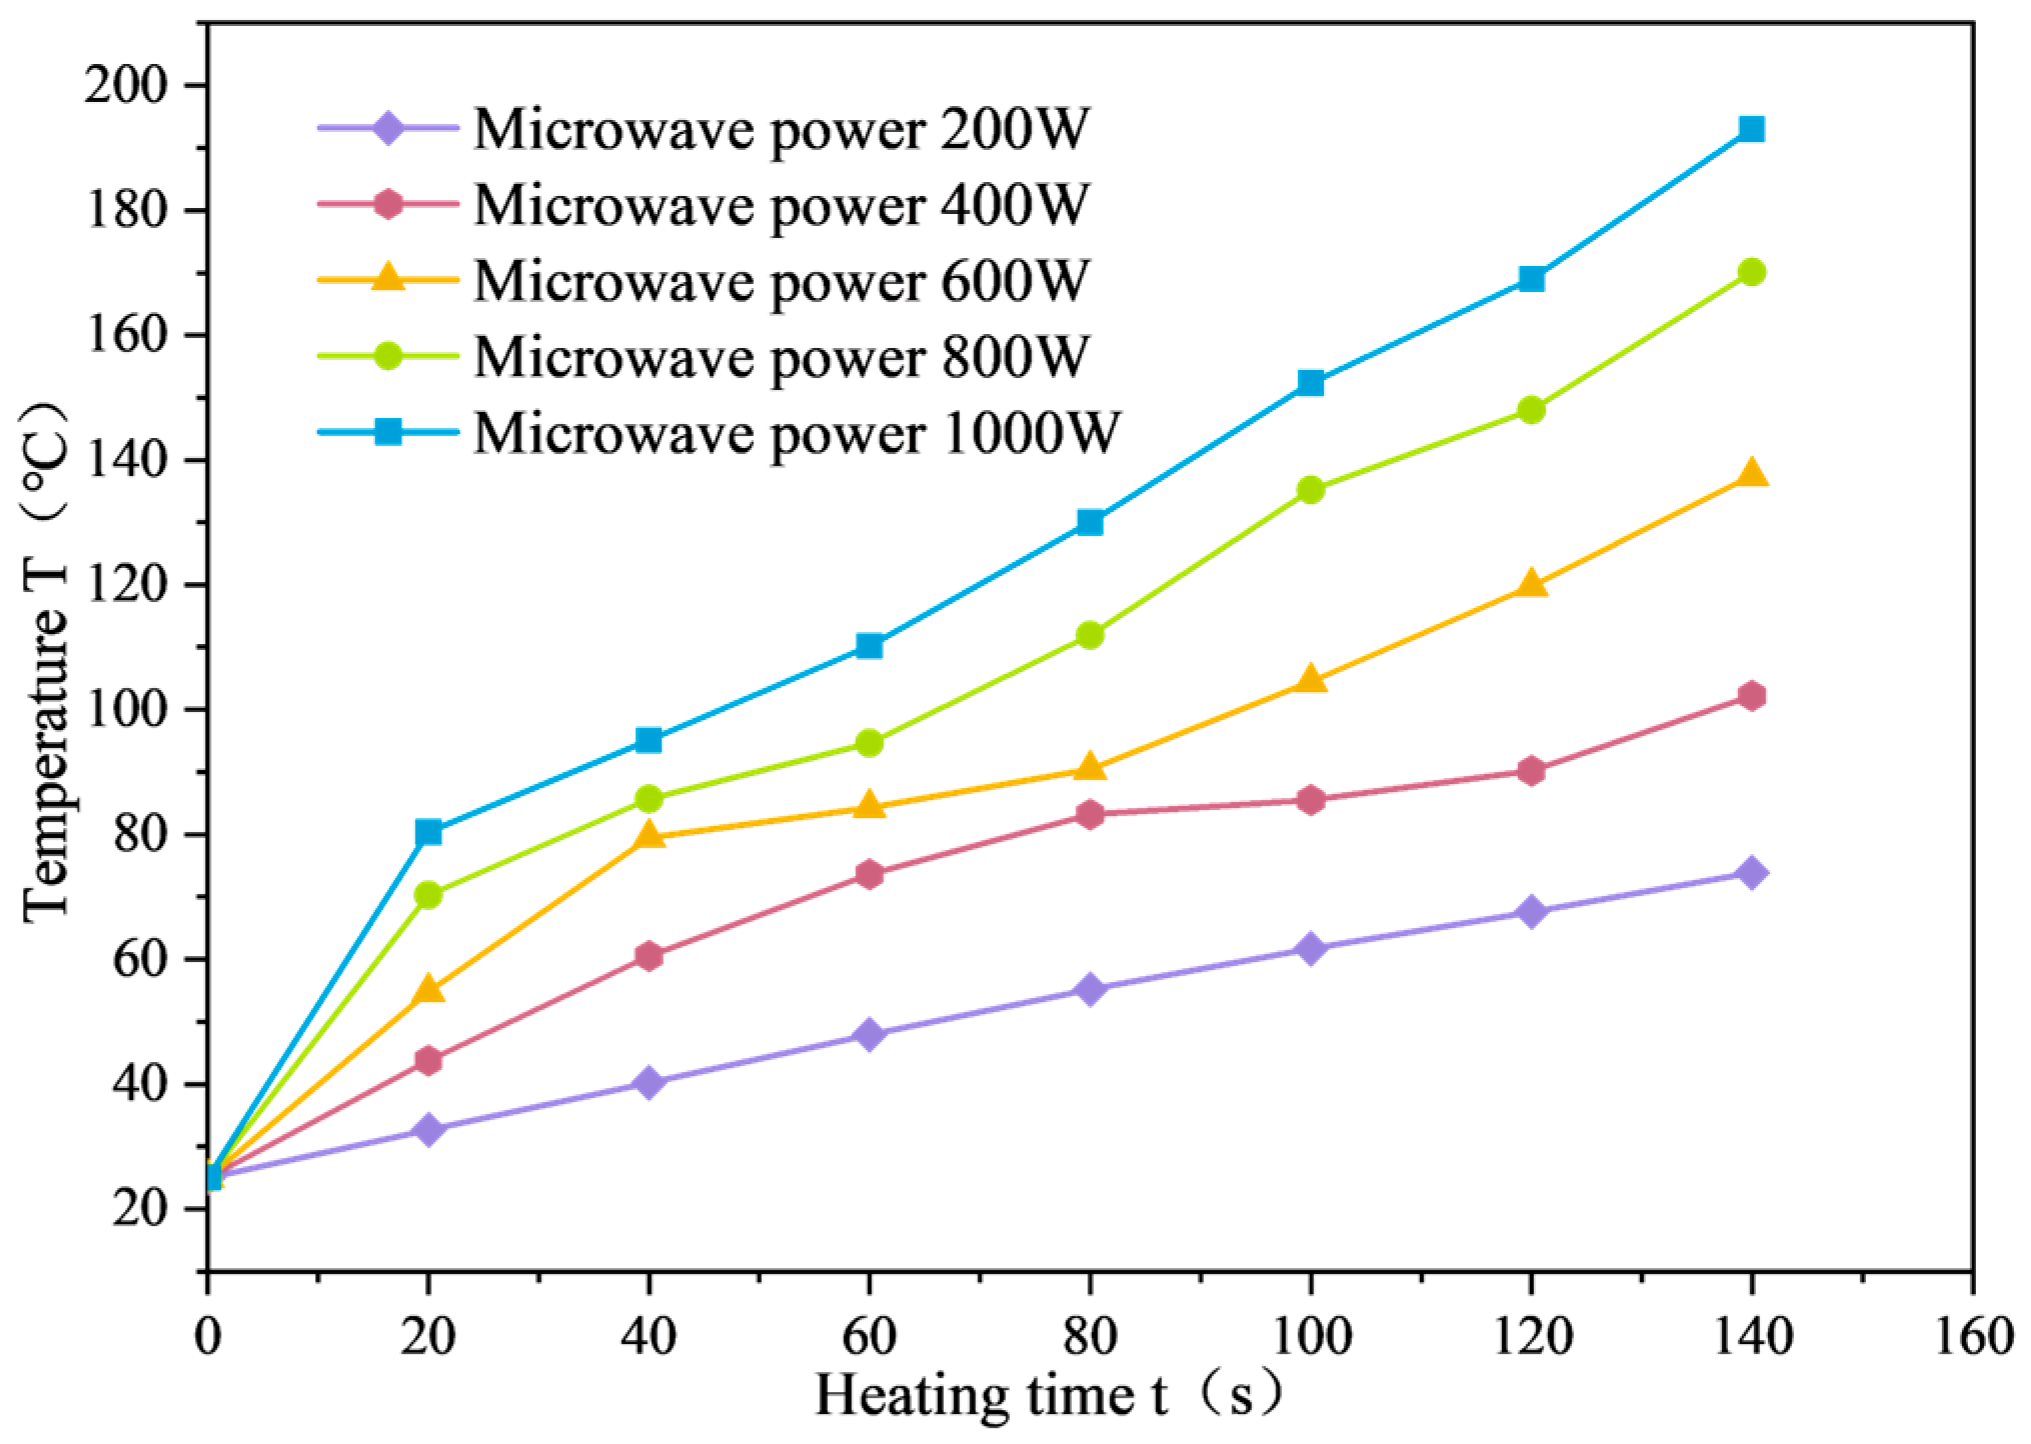
3.2.5. Analysis of the Influence of Microwave Power on the Microwave Absorption Performance of SF-EAM
4. Conclusions
- (1)
- Gradation and Ratio Design: Based on the median value of MS-3 gradation, Gradation A was designed using the theory of the maximum density curve. Based on performance tests at the micro-surface, the ratio of each component of the emulsified asphalt mixture was determined as follows: mineral aggregate:modified emulsified asphalt:water:cement = 100:12.8:6:1.
- (2)
- Effect of SF Addition on Mixing Performance: The addition of SF affects the mixing performance of the emulsified asphalt mixture. As the SF content increases, the mixing time and viscosity of the emulsified asphalt mixture also increase. The optimal dosage range of SF, obtained through mixing performance tests, is 0% to 4%.
- (3)
- Microwave Absorption Performance: When the SF content is in the range of 0% to 4%, higher content results in better microwave absorption performance of SF-EAM. The optimal dosage of SF is 4%. When the composite ratio of SF is S:F = 1:1, the microwave absorption performance of SF-EAM is best.
- (4)
- Influence of Environmental Temperature and Microwave Power: The environmental temperature has a minimal effect on the microwave absorption performance of the emulsified asphalt mixture. In contrast, microwave power has a significant impact. The higher the microwave power, the better the microwave absorption performance of SF-EAM. Considering both heating efficiency and economic factors, the recommended range of microwave power in this study is 600–1000 W.
Author Contributions
Funding
Institutional Review Board Statement
Informed Consent Statement
Data Availability Statement
Conflicts of Interest
References
- Xu, W.; Luo, R. Evaluation of interaction between emulsified asphalt and mineral powder using rheology. Constr. Build. Mater. 2022, 318, 125990. [Google Scholar] [CrossRef]
- Xiao, Q.; Huang, K.M.; Shi, H.X. Microwave Hyperpolarization Effect—An Orthogonal Incoherent Microwave Field Heating Study. J. Phys. Chem. B. 2024, 128, 1963–1974. [Google Scholar] [CrossRef] [PubMed]
- Wei, Y.F.; Huo, J.Y.; Wang, Z.J.; Guo, J.T. Microwave Heating Characteristics of Emulsified Asphalt Repair Materials Incorporated with Steel Slag. Adv. Mater. 2020, 1, 1–12. [Google Scholar] [CrossRef]
- Xu, W.; Guan, Y.H.; Shah, Y.I.; Luo, R.; Xu, Z.Q. Study on curing characteristics of cold-mixed and cold-laid asphalt mixture based on electrical properties. Constr. Build. Mater. 2022, 330, 127223. [Google Scholar] [CrossRef]
- Samuel, D.; Cinzia, B.; Vasiliki, T.; Fausto, F. Magnetic Losses in Soft Ferrites. Magnetochemistry 2022, 8, 60. [Google Scholar] [CrossRef]
- Wan, J.M.; Wu, S.P.; Xiao, Y.Y.; Chen, Z.W.; Zhang, D. Study on the effective composition of steel slag for asphalt mixture induction heating purpose. Constr. Build. Mater. 2018, 178, 542–550. [Google Scholar] [CrossRef]
- Chen, J.H.; Liu, M.; Yang, T.; Zhai, F.M.; Hou, X.M.; Chou, K.C. Improved microwave absorption performance of modified SiC in the 2–18 GHz frequency range. Crystengcomm 2017, 19, 519–527. [Google Scholar] [CrossRef]
- Liu, X.M.; Zhao, Y.; Wei, Z.Q. Microwave absorption enhancement of asphalt concrete with SiC-Fe3O4 mixtures modifier. Constr. Build. Mater. 2020, 254, 119209. [Google Scholar] [CrossRef]
- Liu, X.M.; Wei, Z.Q.; Zhao, Y.; Yan, D.X. Improving the Electromagnetic Properties of Bitumen Using SiC-Fe3O4 Composites. J. Mate. Civ. Eng. 2021, 33, 04021326. [Google Scholar] [CrossRef]
- Liu, X.M.; Zhao, Y.; Yan, D.X.; Feng, Y. An Environmentally Friendly Asphalt Concrete Containing SiC Aggregate for Microwave Heating Deicing. J. Mater. Civ. Eng. 2023, 35, 1–13. [Google Scholar] [CrossRef]
- Zhao, Y.; Liu, X.M.; Zhang, X.H. Experimental and Analytical Study on Heating and Road Performance of Asphalt Mixture with Silicon Carbide and Ferroferric Oxide Composite Structure Layer. Case Stud. Constr. Mater. 2023, 19, 2214–5095. [Google Scholar] [CrossRef]
- Zhao, Y.; Liu, X.M.; Wei, D.M. Asphalt mixture with nucleus-shell structural microwave enhanced aggregate: Structure design, preparation and performance. Case Stud. Constr. Mater. 2023, 19, 2214–5095. [Google Scholar] [CrossRef]
- Li, C.; Wu, S.P.; Chen, Z.W.; Shu, B.A.; Li, Y.Y.; Xiao, Y.; Liu, Q.T. Synthesis of Fe3O4-decorated Mg-Al layered double hydroxides magnetic nanosheets to improve anti-ultraviolet aging and microwave absorption properties used in asphalt materials. Constr. Build. Mater. 2019, 220, 320–328. [Google Scholar] [CrossRef]
- Liu, X.M.; Zhao, Y.; Liu, W.Z.; Yan, D.X. Microwave heating and deicing efficiency for asphalt concrete with SiC-Fe3O4 microwave enhanced functional layer. J. Cleaner Prod. 2022, 332, 130111. [Google Scholar] [CrossRef]
- Yang, F.; Li, K.H.; Xiong, R.; Guan, B.W.; Zhao, H. Investigation on Deicing Property of Steel Wool Fiber-Reinforced Asphalt Mixture by Induction Heating. Adv. Mater. 2020, 1, 5250628. [Google Scholar] [CrossRef]
- Zhang, J.F.; Yan, Y.; Hu, Z.H.; Fan, X.Z.; Zheng, Y. Utilization of low-grade pyrite cinder for synthesis of microwave heating ceramics and their microwave deicing performance in dense-graded asphalt mixtures. J. Cleaner Prod. 2018, 170, 486–495. [Google Scholar] [CrossRef]
- Wang, Z.J.; Gao, J.; Ai, T.; Zhao, P. Laboratory Investigation on Microwave Deicing Function of Micro Surfacing Asphalt Mixtures Reinforced by Carbon Fiber. J. Test. Eval. 2014, 42, 498–507. [Google Scholar] [CrossRef]
- Wang, H.P.; Zhang, Y.; Zhang, Y.; Feng, S.F.; Lu, G.Y.; Cao, L.T. Laboratory and Numerical Investigation of Microwave Heating Properties of Asphalt Mixture. Materials 2019, 12, 146. [Google Scholar] [CrossRef] [PubMed]
- Guan, B.W.; Yang, T.; Xiong, R.; Wang, Y.W. Electromagnetic Wave Absorbing Properties of Asphalt Mixture with Natural Magnetite Powder. J. Build. Mater. 2016, 19, 6. [Google Scholar] [CrossRef]
- Guo, H.Y.; Wang, Z.J.; Huo, J.Y.; Wang, X.F.; Liu, Z.R.; Li, G. Microwave heating improvement of asphalt mixtures through optimizing layer thickness of magnetite and limestone aggregates. J. Clean. Prod. 2020, 273, 123090. [Google Scholar] [CrossRef]
- Liu, X.M.; Wei, Z.Q.; Zhao, Y. Simulation and experimental study on heating efficiency of microwave-enhanced asphalt concrete with binary composites. Civ. Eng. 2021, 54, 116–123. [Google Scholar]
- JTG.T F40-02-2005; Technical Guidelines for Micro-Surfacing and Slurry Seal. China Communications Press: Beijing, China, 2006.
- JTG F40–2004; Technical Specification for Construction of Highway Asphalt Pavements. China Communications Press: Beijing, China, 2004.
- JTG/T F30-2014; Technical Guidelines for Construction of Highway Cement Concrete Pavements. China Communications Press: Beijing, China, 2014.
- Chen, R.Y.; Zhu, H.P.; Li, S.S. Fabrication of SiC reticulated porous ceramics with dense struts by in-situ generation of SiC. J. Eur. Ceram. Soc. 2024, 44, 635–642. [Google Scholar] [CrossRef]
- Liu, R.S.; Wu, D.A.; Yu, X.; Zhou, N.F.; Liu, D.; Wang, L.C.; Xu, Z.Y.; Gong, H.Y.; Zhao, T.Y.; Sun, J.R.; et al. Improved magnetic properties of self-composite SrFe12O19 powder prepared by Fe3O4 nanoparticles. Arab. J. Chem. 2022, 15, 104071. [Google Scholar] [CrossRef]
- Xu, W.; Shah, Y.I.; Cheng, Z.; Li, Y.C.; Zhang, K.; Yu, X.Q. Laboratory design and evaluation of a functional color micro-surfacing with synthetic resin-based binder. Road Mater. Pavement Des. 2022, 24, 2343–2362. [Google Scholar] [CrossRef]


| Specimen | Characteristics of Absorbing Materials | Deficiency | Reference |
|---|---|---|---|
| Steel fiber | Electric Loss Type, Magnetic Loss Type | High costs and technical requirements | Yang et al. [15] |
| Sulfurous iron ore slag | Magnetic Loss Type | High technical requirements | Zhang et al. [16] |
| Carbon fiber | Electric Loss Type | High costs | Wang et al. [17] |
| Steel slag | Magnetic Loss Type | Complex composition of steel slag | Wang [18] |
| Natural magnetite | Magnetic Loss Type | Thermal efficiency is related to the grade of Fe3O4 | Guan et al. [19] |
| Fe3O4 | Magnetic Loss Type | Easy to reunite, high technical requirements | Guo et al. [20] |
| Boron-doped SiC | Electric Loss Type | High technical requirements | Chen et al. [7] |
| SiC-Fe3O4 | Electric Loss Type, Magnetic Loss Type | High costs | Liu Xiaoming [21] |
| Test Item | Unit | Standard Specifications [22] | Test Result | Test Method | |
|---|---|---|---|---|---|
| Remainder on sieve (1.18 mm sieve) | % | ≤0.1 | 0.05 | T0652 | |
| Electric charge | / | Positively charged cation | Positively charged cation | T0653 | |
| Engler viscosity E25 | / | 3~30 | 18 | T0622 | |
| Asphalt standard viscosity C25 | s | 12~60 | 35 | T0621 | |
| Evaporation residue content | % | ≥60 | 65 | T0651 | |
| Nature of evaporation residues | Penetration degree | 0.1 mm | 40~100 | 80 | T0604 |
| Softening point | °C | ≥53 | 66 | T0606 | |
| Ductility (5 °C) | cm | ≥20 | 30 | T0605 | |
| Solubility | % | ≥97.5 | 98 | T0607 | |
| Storage stability | 1 d | % | ≤1 | 0.5 | T0655 |
| 5 d | % | ≤5 | 2.5 | ||
| Specimen | Test Item | Unit | Standard Specifications [16] | Test Result | Test Method |
|---|---|---|---|---|---|
| Coarse aggregate | Crushing value | % | ≤26 | 15 | T0316 |
| LLA | % | ≤28 | 20 | T0317 | |
| Polished stone value | BPN | ≥42 | 50 | T0321 | |
| Sturdiness | % | ≤12 | 7 | T0314 | |
| Flat and elongated particles | % | ≤15 | 10 | T0312 | |
| Fine aggregate | Sturdiness | % | ≤12 | 6 | T0340 |
| Mineral | Sand equivalent | % | ≥65 | 78 | T0334 |
| Test Item | Unit | Standard Specifications [23] | Test Result | Test Method |
|---|---|---|---|---|
| Apparent relative density | t/m3 | ≥2.50 | 2.8 | T0352 |
| Water content | % | ≤1 | 0.8 | T0103 |
| Particle size range < 0.6 mm <0.15 mm <0.075 mm | % % % | 100 90~100 75~100 | 100 98 92 | T0351 |
| Hydrophilicity | / | <1 | 0.8 | T0353 |
| Plasticity index | / | <4 | 3 | T0354 |
| Test Item | Unit | Standard Specifications [24] | Test Result | Test Method | |
|---|---|---|---|---|---|
| Setting time | Initial setting | min | ≥45 | 132 | T0505 |
| Final setting | min | ≤600 | 270 | ||
| Compressive strength | 3 d | MPa | ≥17.0 | 20.4 | T0553 |
| 28 d | MPa | ≥42.5 | 47.6 | ||
| Rupture strength | 3 d | MPa | ≥4.0 | 5.3 | T0558 |
| 28 d | MPa | ≥7.0 | 8.2 | ||
| Thermal stability | / | Measurement records | Pass | T0505 | |
| Test Item | Unit | Standard Specifications [23] | Test Result | Test Method |
|---|---|---|---|---|
| Apparent relative density | t/m3 | ≥2.50 | 3.1 | T0352 |
| Water content | % | ≤1 | 0.01 | T0103 |
| Particle size range < 0.6 mm <0.15 mm <0.075 mm | % % % | 100 90~100 75~100 | 100 100 95 | T0351 |
| Hydrophilicity | / | <1 | 0.4 | T0353 |
| Plasticity index | / | <4 | 3 | T0354 |
| Test Item | Unit | Standard Specifications [23] | Test Result | Test Method |
|---|---|---|---|---|
| Apparent relative density | t/m3 | ≥2.50 | 4.7 | T0352 |
| Water content | % | ≤1 | 0.05 | T0103 |
| Particle size range < 0.6 mm <0.15 mm <0.075 mm | % % % | 100 90~100 75~100 | 100 100 95 | T0351 |
| Hydrophilicity | / | <1 | 0.6 | T0353 |
| Plasticity index | / | <4 | 2.5 | T0354 |
| Specimen | Minerals | Water | Cement | Modified Emulsified Asphalt |
|---|---|---|---|---|
| Percentage of mineral mass | 100% | 1% | 6% | 10%, 11%, 12%, 13%, 14% |
| Particle Size (mm) | 9.5 | 4.75 | 2.36 | 1.18 | 0.6 | 0.3 | 0.15 | 0.075 |
|---|---|---|---|---|---|---|---|---|
| Tebow equation n = 0.4 | 100 | 75.79 | 57.29 | 43.42 | 33.13 | 25.10 | 19.03 | 14.42 |
| Median value of MS-3 grade | 100 | 80 | 57.5 | 39 | 26.5 | 18.5 | 12.5 | 10 |
| Particle Size Range (mm) | Passage Rate between Sieve Holes (%) | Difference (%) | Percentage of Difference (%) | |
|---|---|---|---|---|
| Tebow Equation n = 0.4 | Median Value of MS-3 Grade | |||
| 4.75~9.5 | 24.21 | 20 | −4.21 | 4.75~9.5 |
| 2.36~4.75 | 18.50 | 22.5 | 4.00 | 2.36~4.75 |
| 1.18~2.36 | 13.87 | 18.5 | 4.63 | 1.18~2.36 |
| 0.6~1.18 | 10.29 | 12.5 | 2.21 | 0.6~1.18 |
| 0.3~0.6 | 8.03 | 8 | −0.03 | 0.3~0.6 |
| 0.15~0.3 | 6.07 | 6 | −0.07 | 0.15~0.3 |
| 0.075~0.15 | 4.61 | 2.5 | −2.11 | 0.075~0.15 |
| Under 0.075 | 14.42 | 10 | −4.42 | Under 0.075 |
| Test Item | Unit | MS-3 |
|---|---|---|
| Thickness after regimen | mm | 8~10 |
| Mineral dosage | kg/m2 | 10.0~22.0 |
| Oil–stone ratio | % | 6.0~8.5 |
| Amount of cement, slaked lime (percentage of mineral mass) | % | 0~3 |
| Amount of water added (percentage of dry mineral mass) | % | Determined by the consistency of the mix |
| Test Item | Standard Specifications [22] | Test Method | |
|---|---|---|---|
| Mixable time (25 °C) | ≥120 s | T0757 | |
| Adhesion test | 30 min (Initial setting) | ≥1.2 N·m | Adhesion test |
| 60 min (Open to traffic) | ≥2.0 N·m | ||
| Specimen | Minerals | Water | Cement | Modified Emulsified Asphalt |
|---|---|---|---|---|
| Percentage of mineral mass | 100% | 6% | 1% | 11%, 12%, 13%, 14% |
| Item | Standard Specifications [22] | Test Method | |
|---|---|---|---|
| Sand adhesion | ≤450 g/m2 | T0755 | |
| Wet track abrasion value | Immersion in water for 1 h | ≤540 g/m2 | Wet track abrasion value |
| Immersion in water for 6 d | ≤800 g/m2 | ||
| Test Item | Standard Specifications [22] | Test Method |
|---|---|---|
| Mixable time | ≥120 s | T0757 |
| Consistency | 2~3 cm | T0751 |
Disclaimer/Publisher’s Note: The statements, opinions and data contained in all publications are solely those of the individual author(s) and contributor(s) and not of MDPI and/or the editor(s). MDPI and/or the editor(s) disclaim responsibility for any injury to people or property resulting from any ideas, methods, instructions or products referred to in the content. |
© 2024 by the authors. Licensee MDPI, Basel, Switzerland. This article is an open access article distributed under the terms and conditions of the Creative Commons Attribution (CC BY) license (https://creativecommons.org/licenses/by/4.0/).
Share and Cite
Jiang, X.; Xu, W.; Chen, Y.; Li, J. Design and Microwave Absorption Performance Study of SiC-Fe3O4 Emulsified Asphalt Mixture. Materials 2024, 17, 3935. https://doi.org/10.3390/ma17163935
Jiang X, Xu W, Chen Y, Li J. Design and Microwave Absorption Performance Study of SiC-Fe3O4 Emulsified Asphalt Mixture. Materials. 2024; 17(16):3935. https://doi.org/10.3390/ma17163935
Chicago/Turabian StyleJiang, Xiangyu, Wen Xu, Yixing Chen, and Jiaqi Li. 2024. "Design and Microwave Absorption Performance Study of SiC-Fe3O4 Emulsified Asphalt Mixture" Materials 17, no. 16: 3935. https://doi.org/10.3390/ma17163935