
Modeling of the Particle Abrasion Process and a Discrete Element Method Study of Its Shape Effect


Abstract
:1. Introduction
2. Materials and Methods
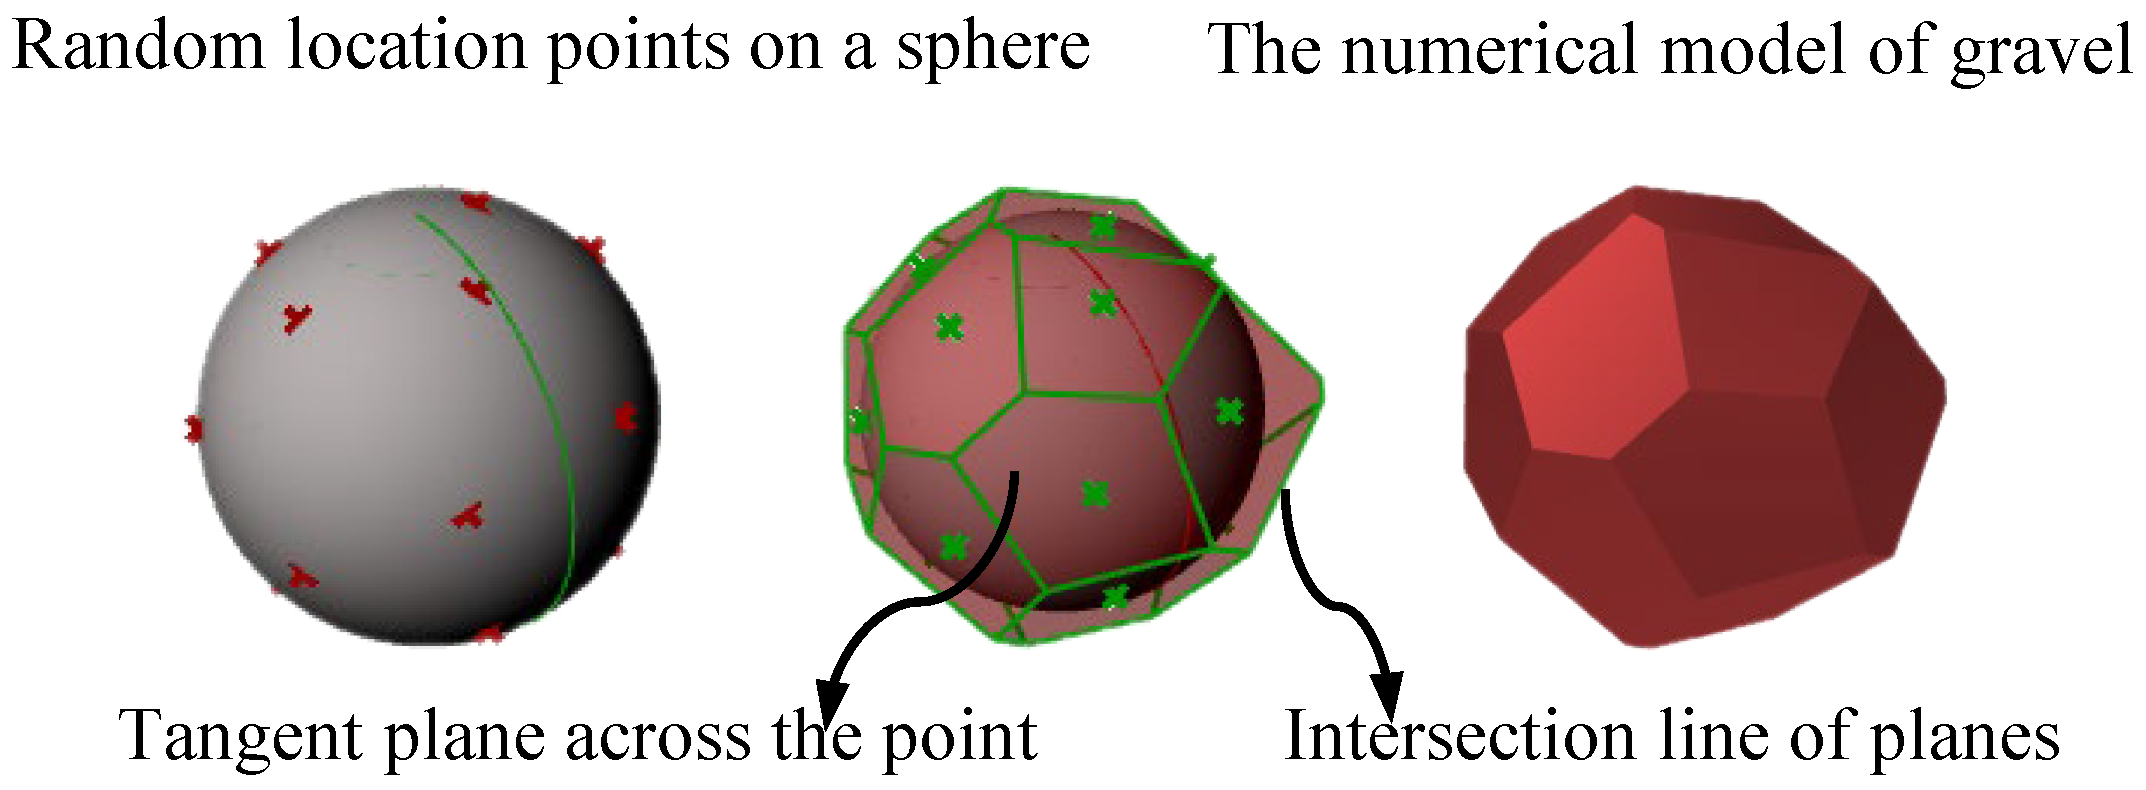
2.1. Polyhedron Particle Generation Algorithm
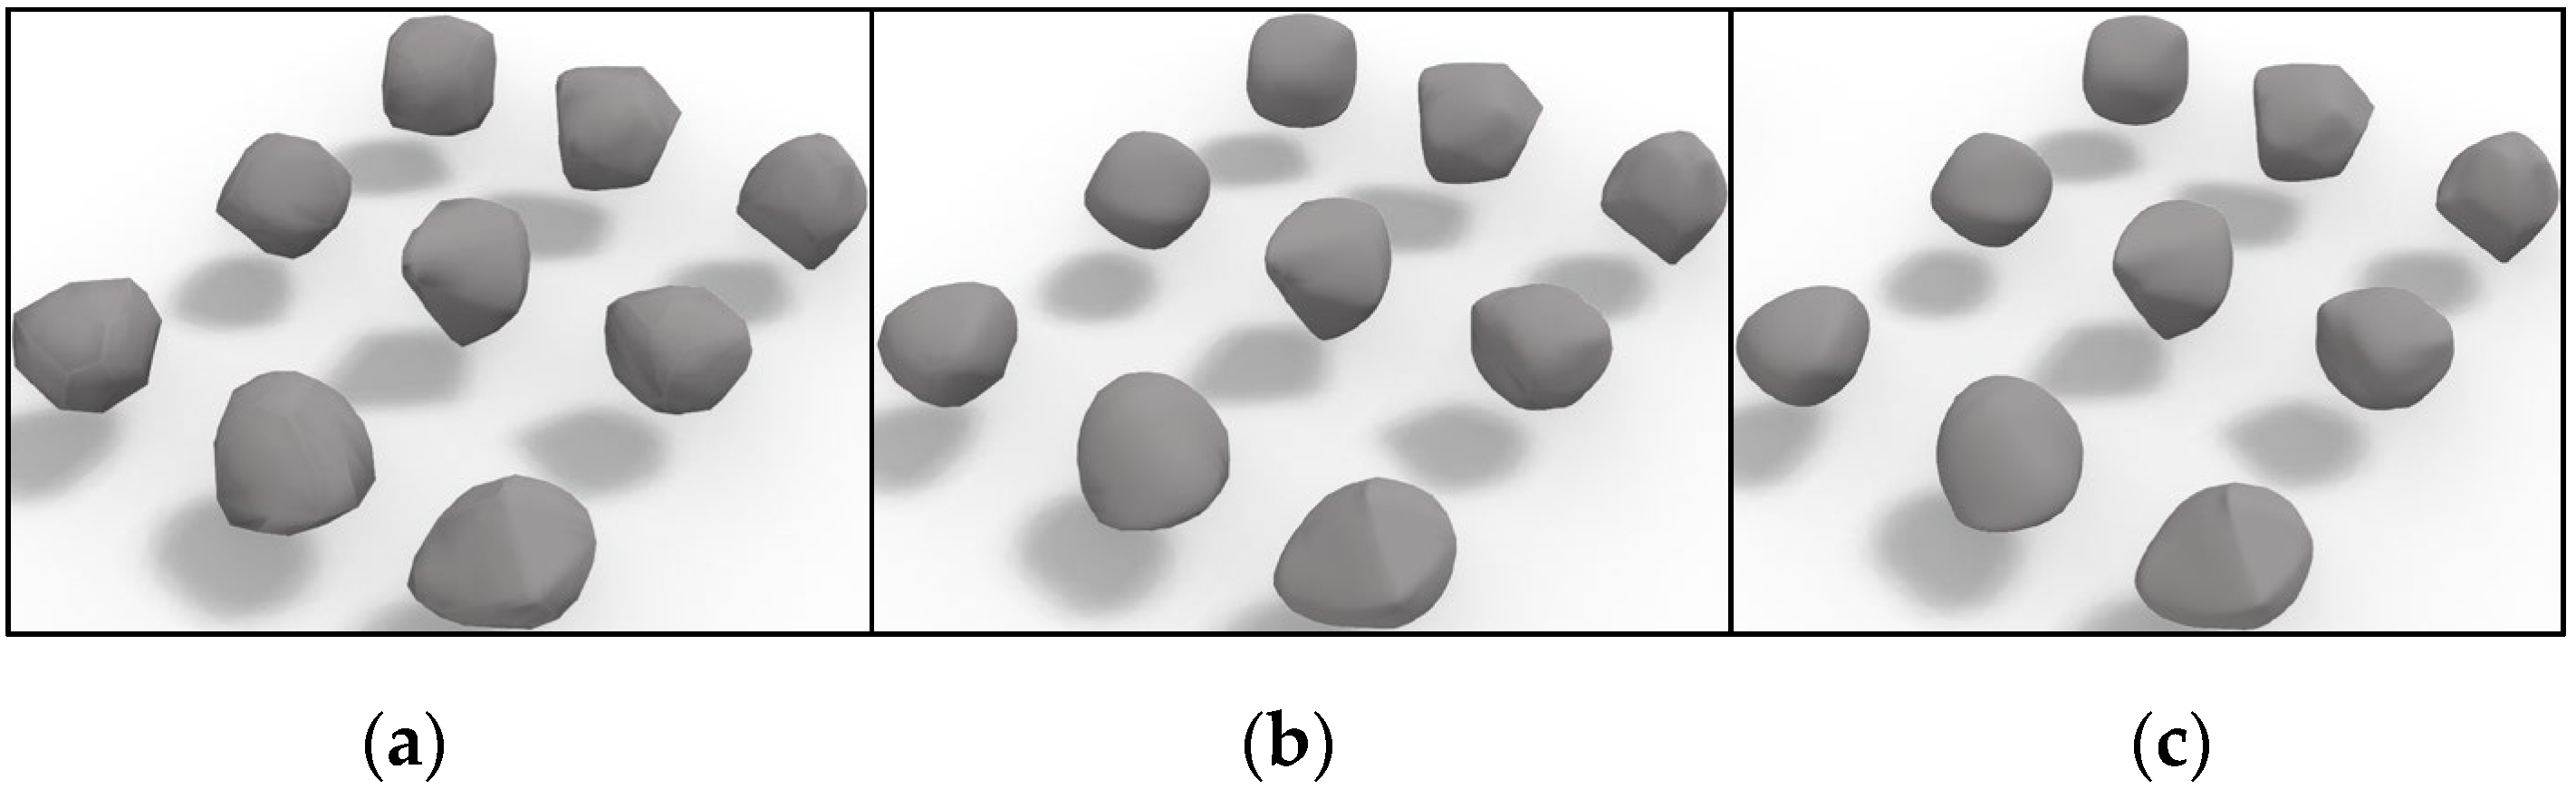
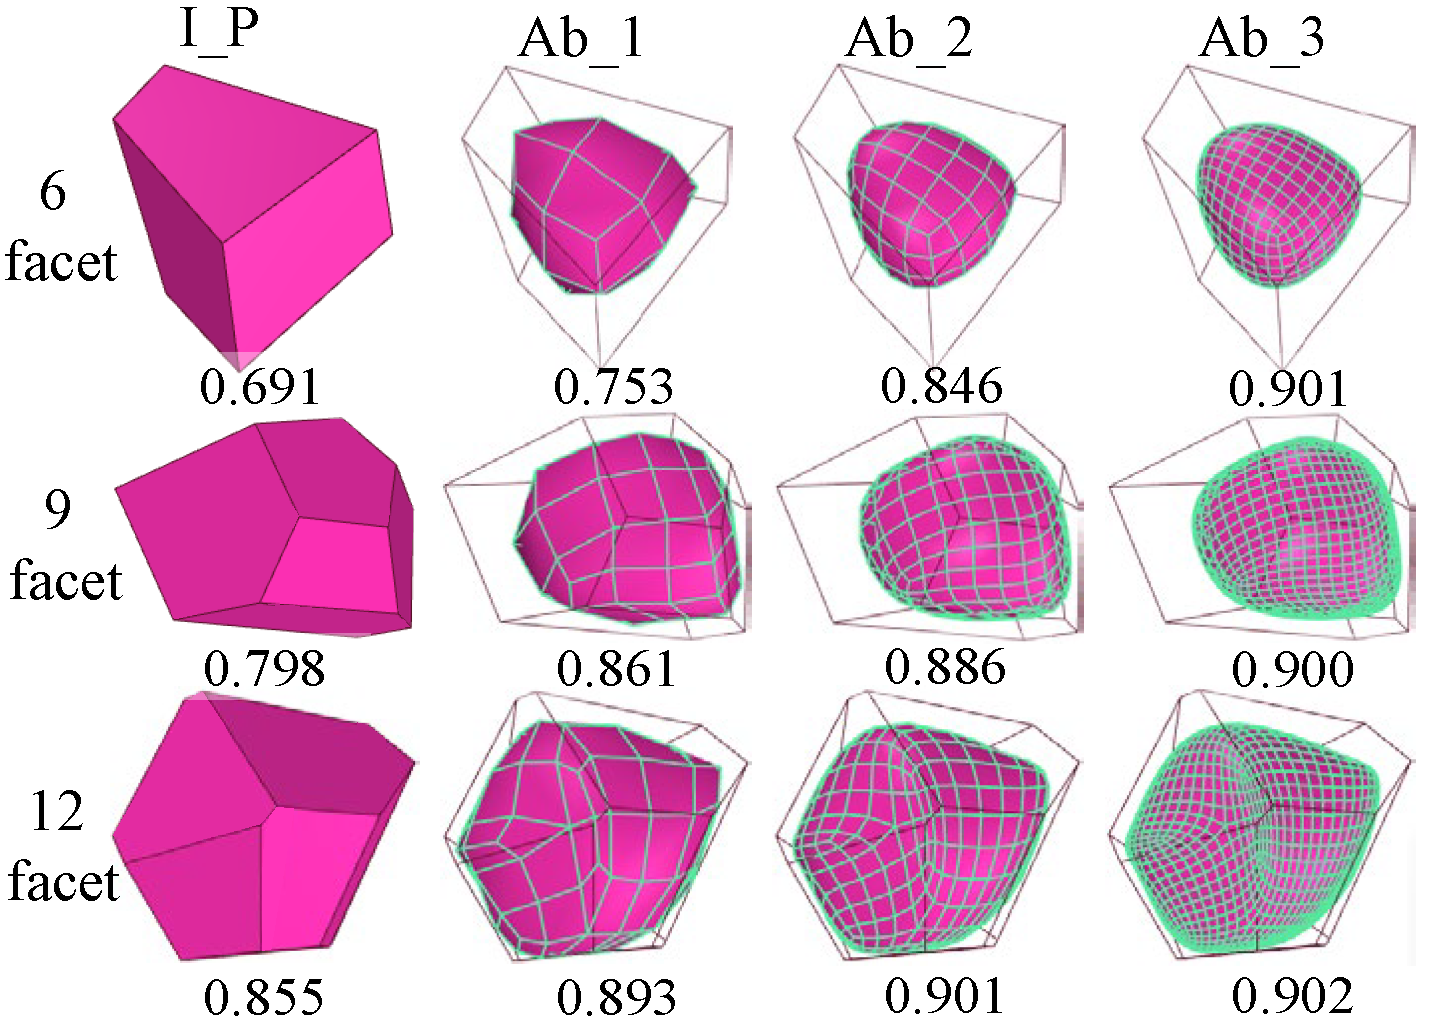
2.2. Particle Abrasion Method
- 1.
- Calculate the new face point, noted as f-point, which is the average of all vertex positions of the defined face, according to Equation (4).
- 2.
- Calculate the new edge point, denoted as e-point, defined as the average of the two endpoints of the edge and the two f-points of the face sharing the edge, according to Equation (5).
- 3.
- Calculate the new vertex point, denoted as v1 point, defined as the vertex generated for each interior vertex of a given mesh; the new vertex is a linear combination of adjacent face points, adjacent edge midpoints, and vertices, calculated according to the equation:
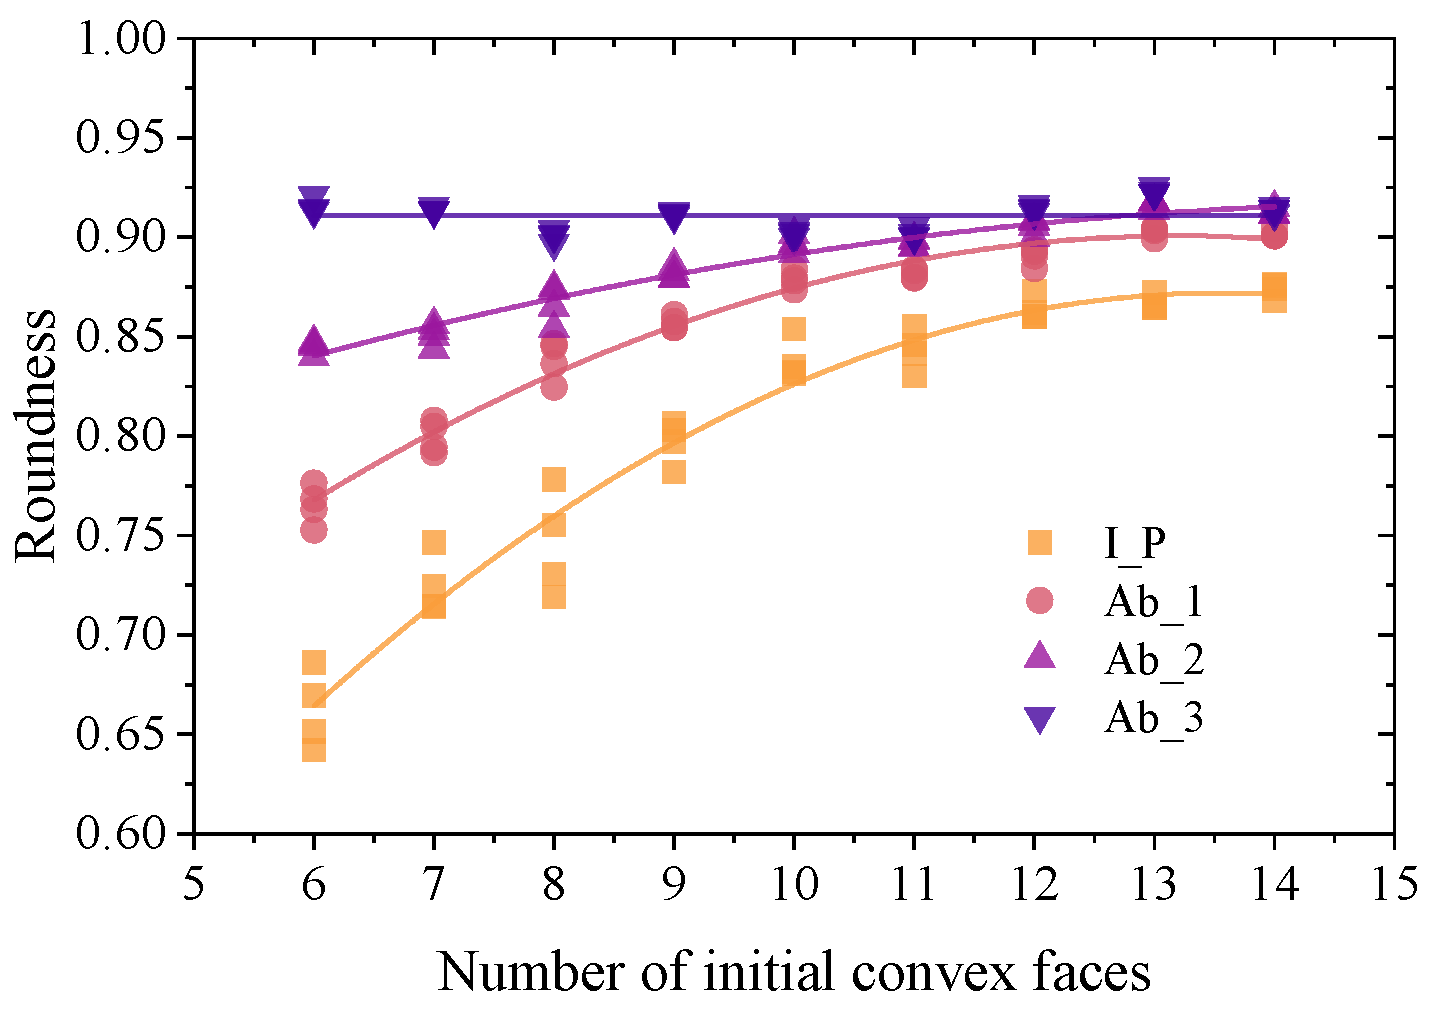
2.3. Particle Shape Quantification
3. Numerical Simulations
3.1. Sample Preparation
3.2. Conventional Triaxial Test
4. Macroscopic Mechanical Response
4.1. Deviatoric Stress and Strain
4.2. Strength and Deformation
5. Meso Shear Properties
5.1. Coordination Number
5.2. Internal Sliding and Rotation
5.3. Fabric Anisotropy
- (1)
- Anisotropy evaluation method
- (2)
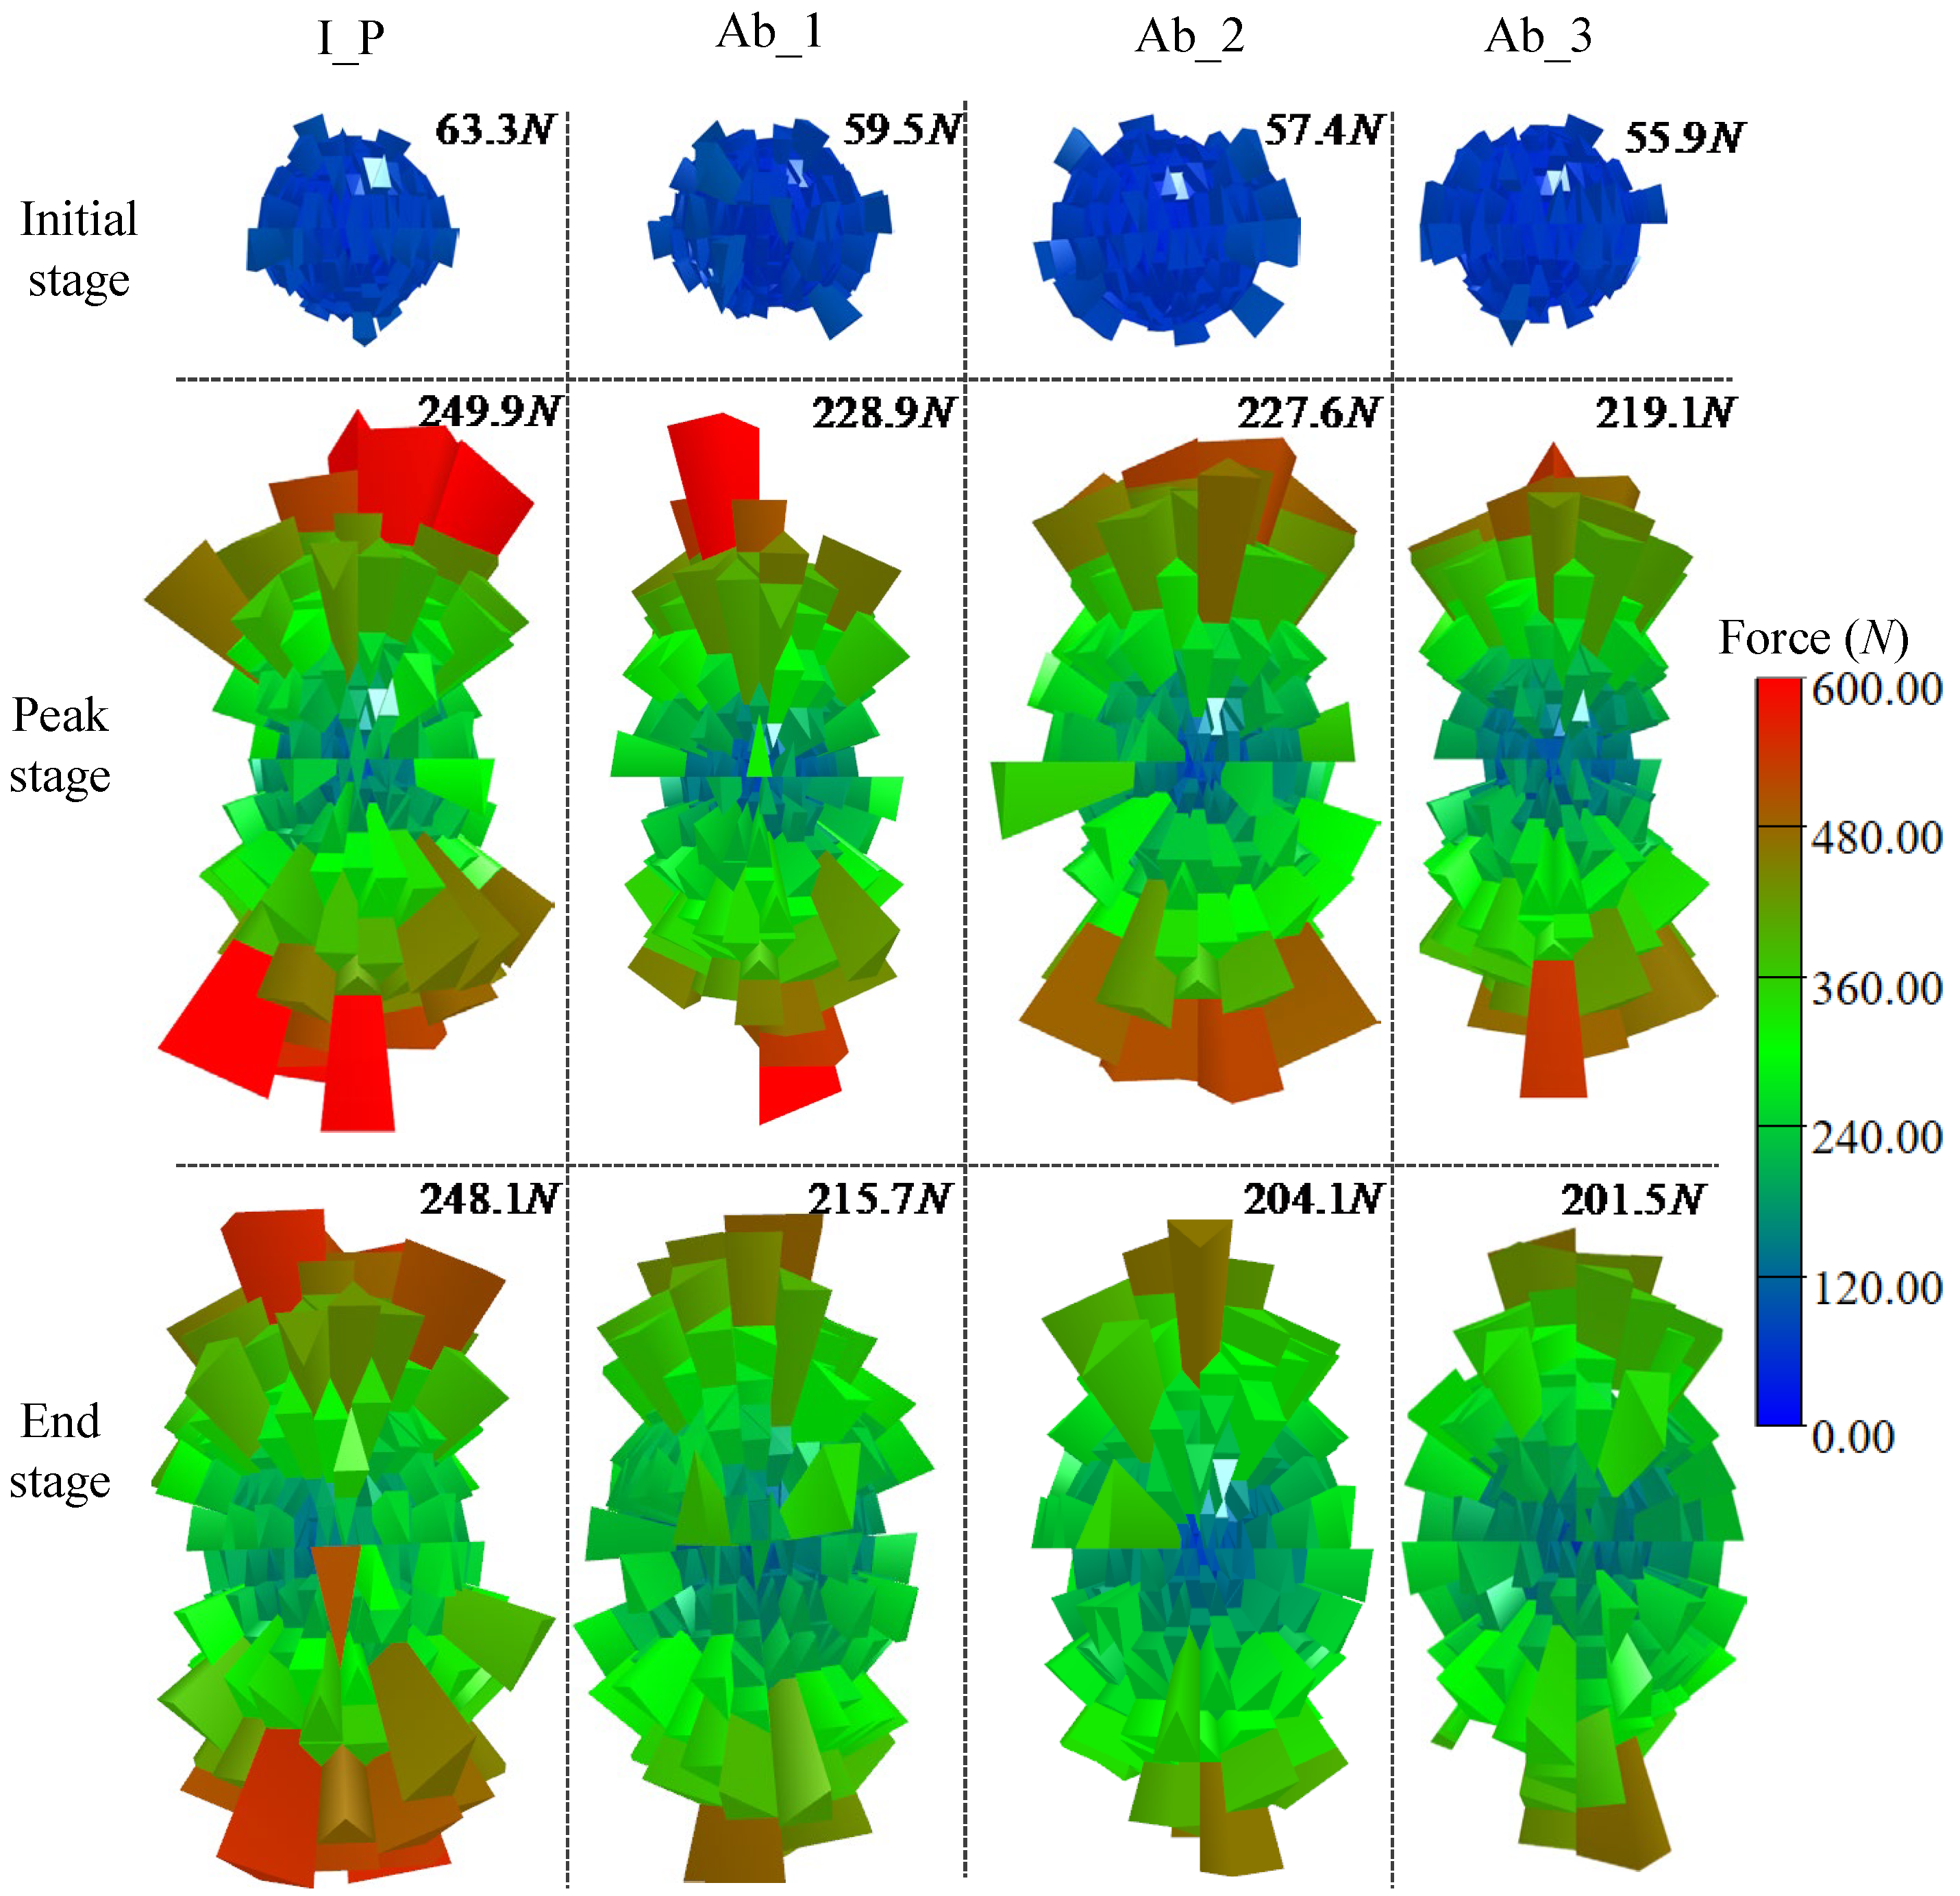
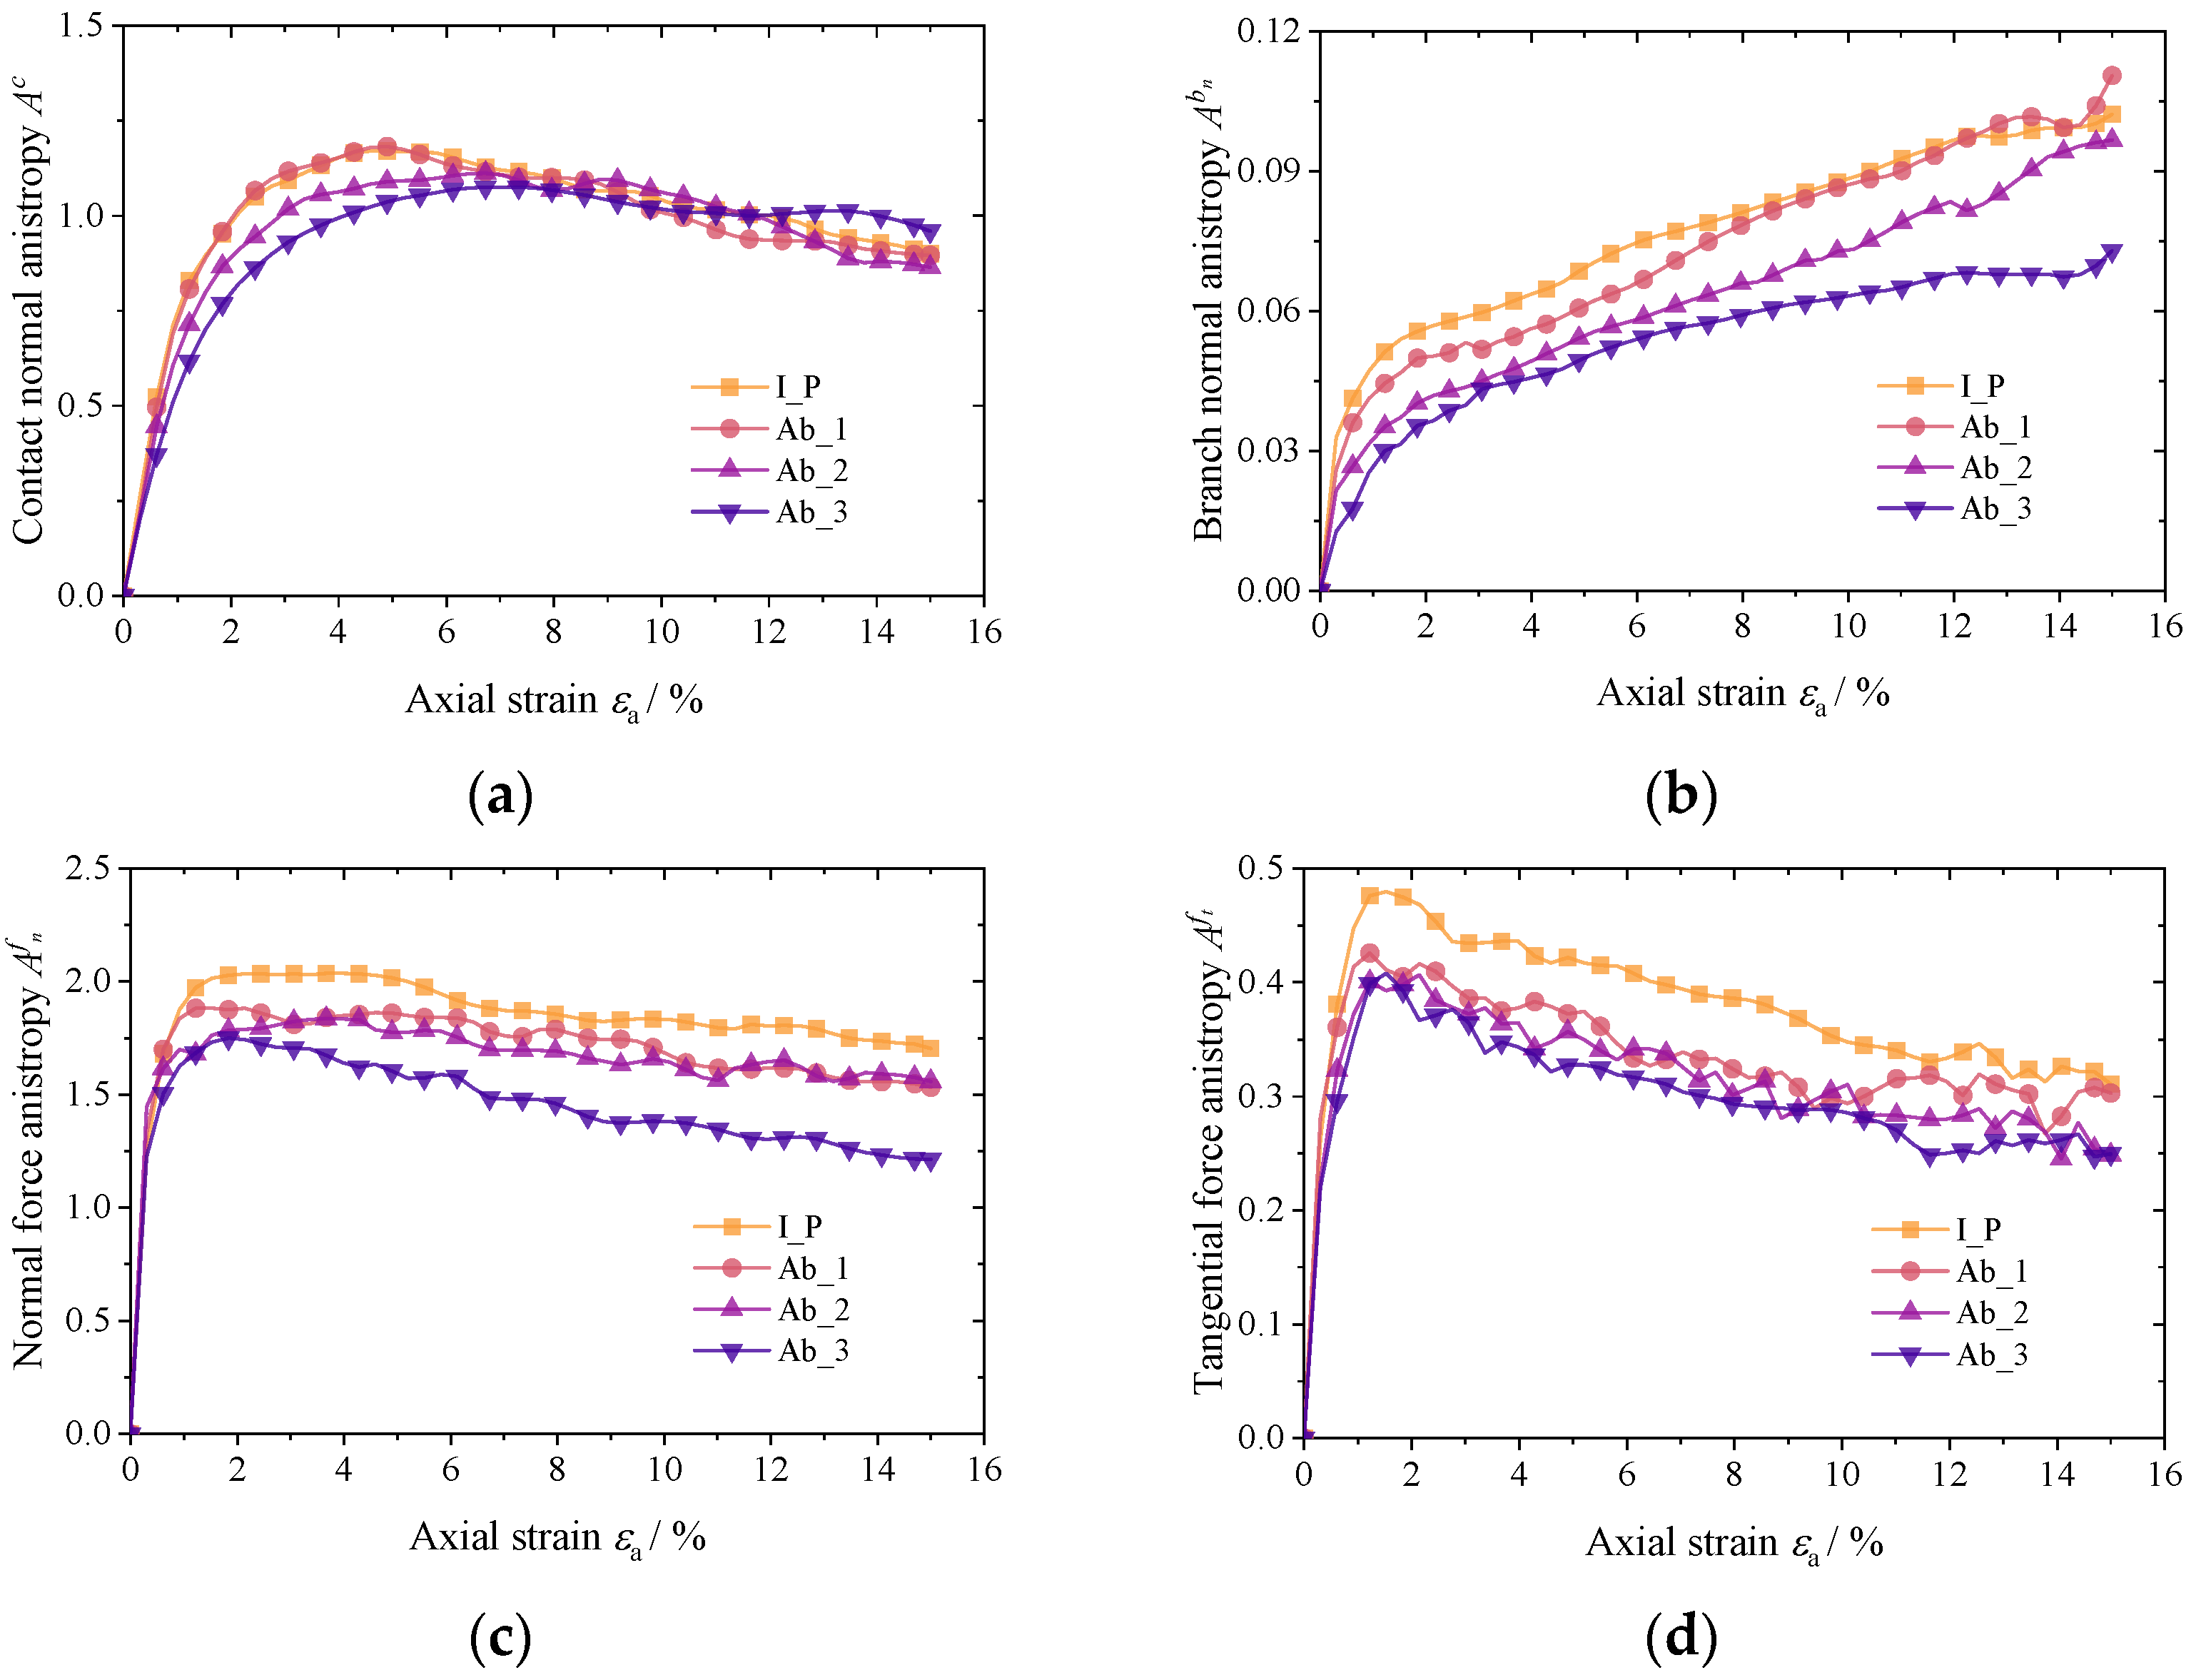
- Evolution of anisotropy
- (3)
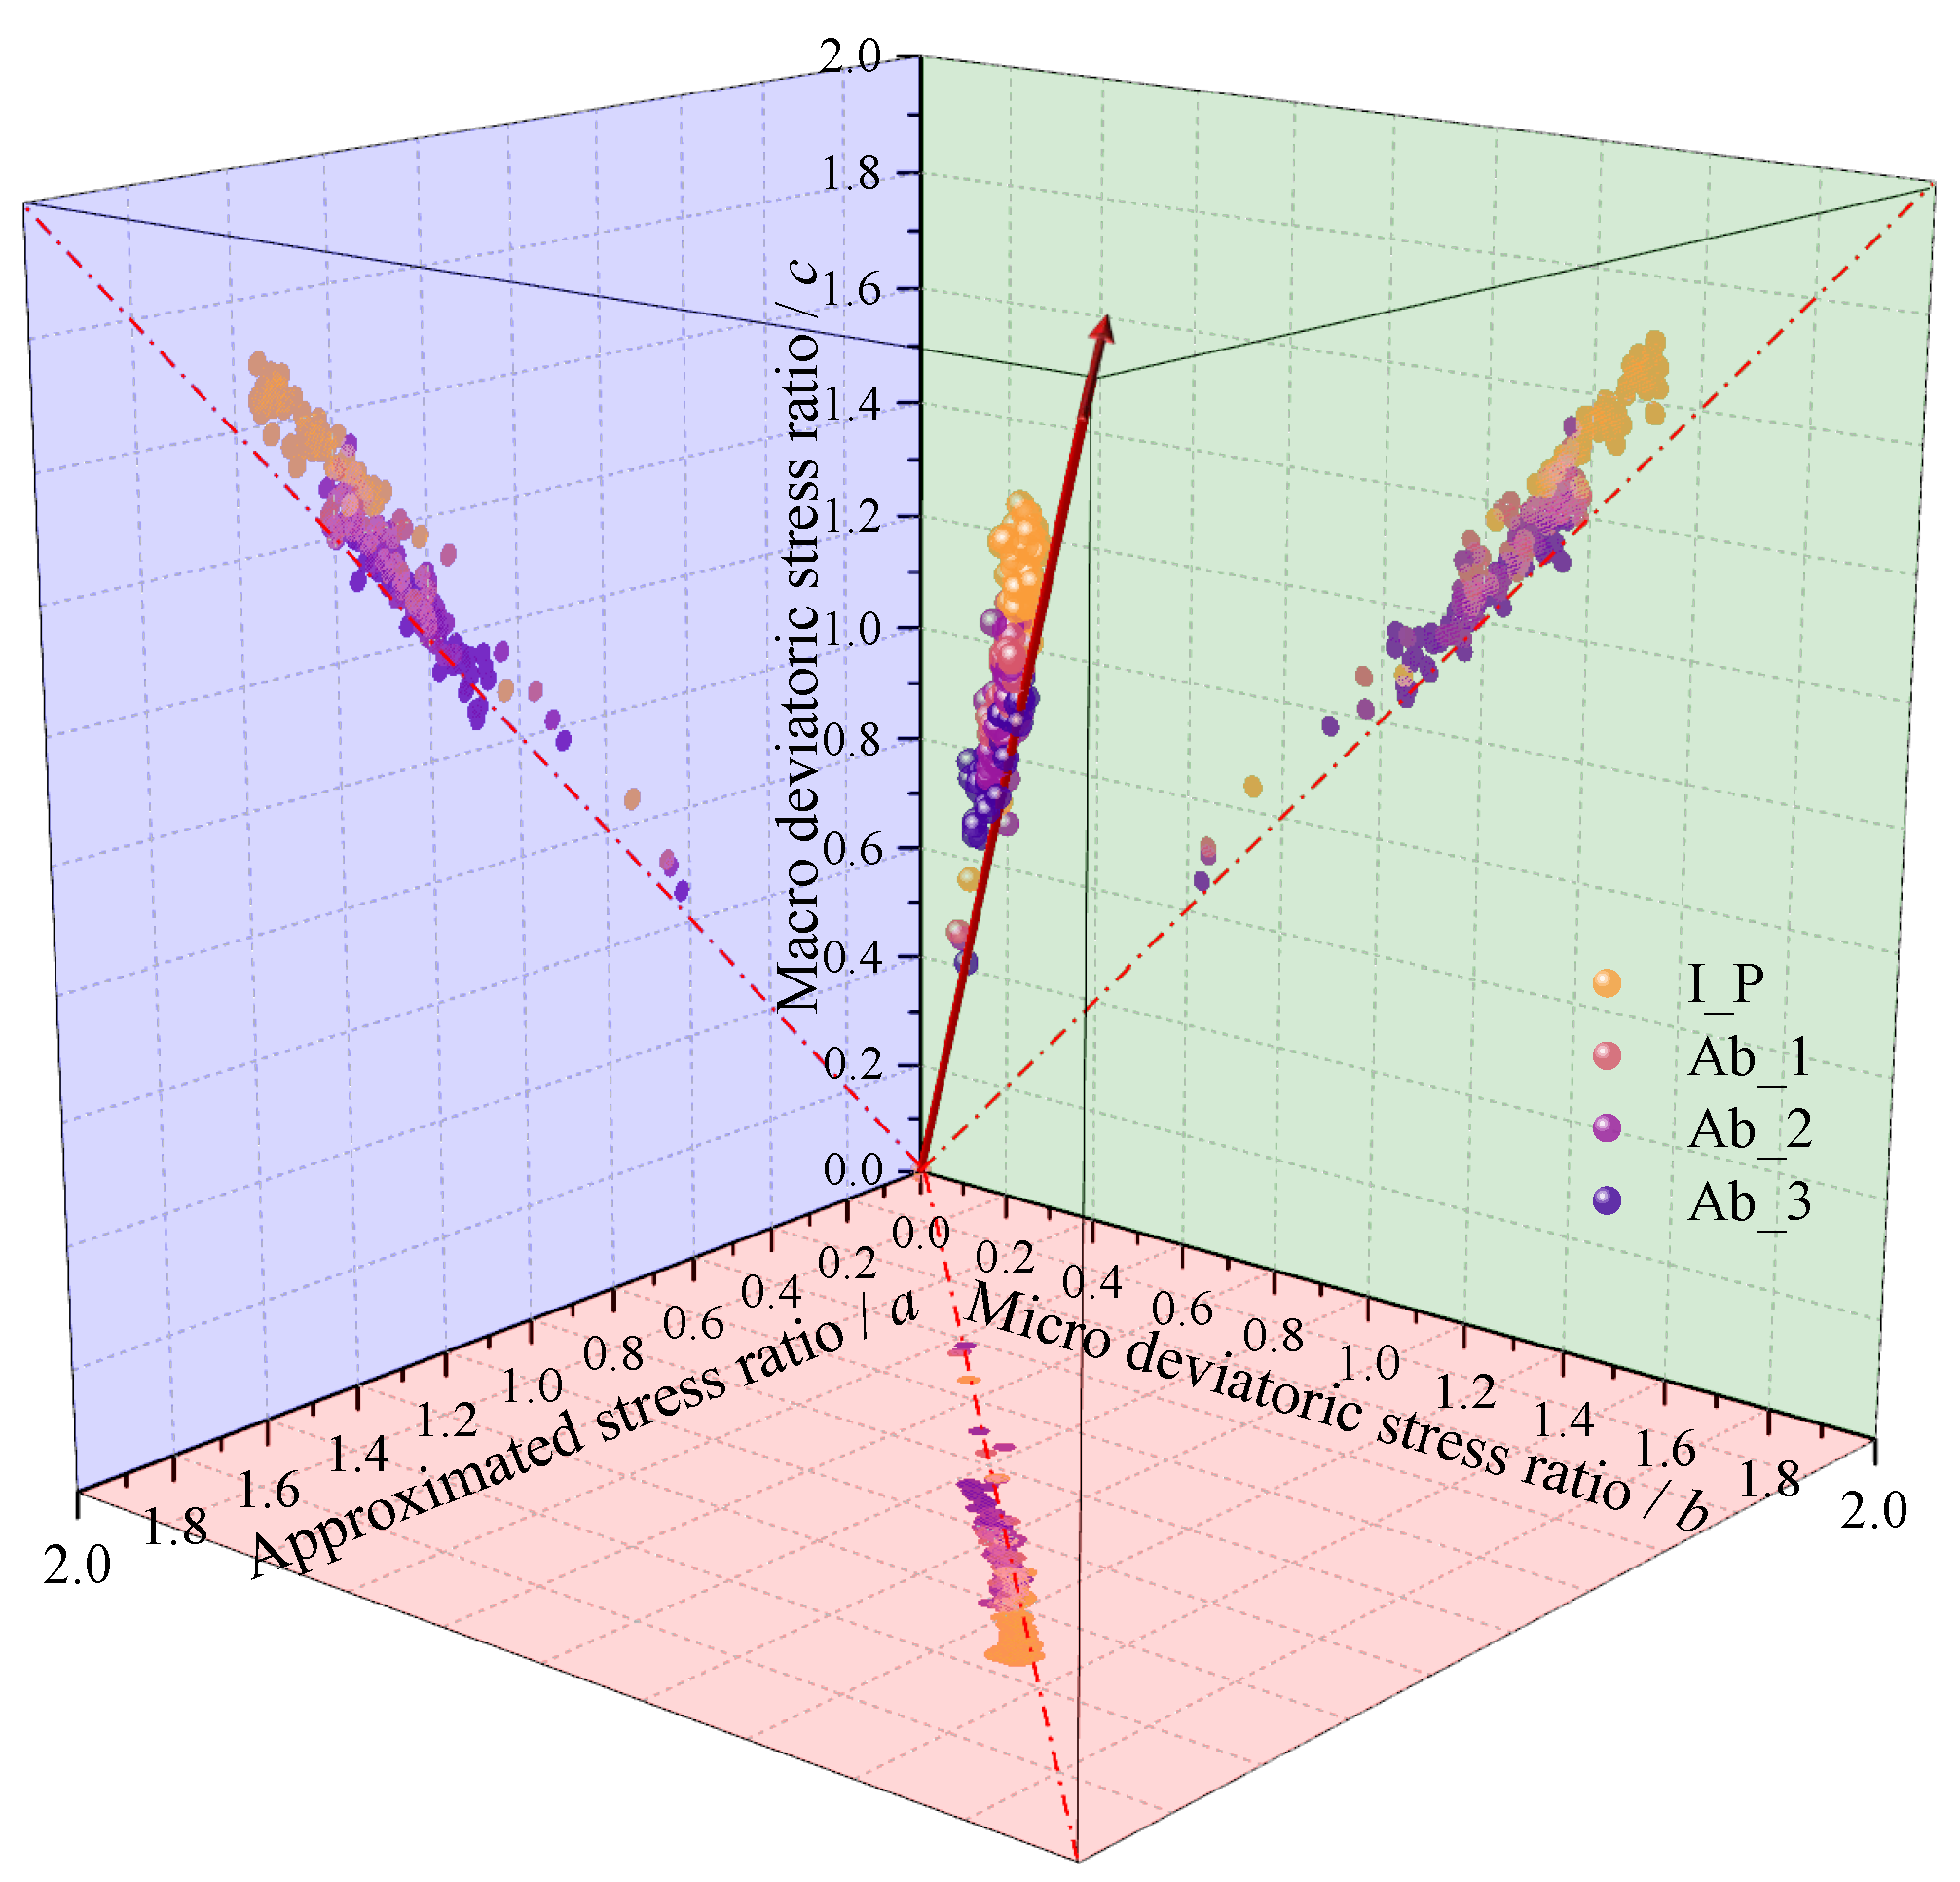
- Stress–Force–Fabric relationship
6. Results
- A modeling method of randomly convex polyhedron particles was established. In addition, a method of generating different degrees of abrasion of the particles based on the corners and edges of the particles and the relative positions of the surfaces was established, which better reflects the abrasion process of the particles in their natural state. According to the results of the roundness index S3d, the particles have higher sphericity after abrasion. The particle abrasion function is derived from graphical and fundamental mechanical principles. However, it is necessary to couple it with the flow field to obtain a more detailed understanding of the particle abrasion mechanics.
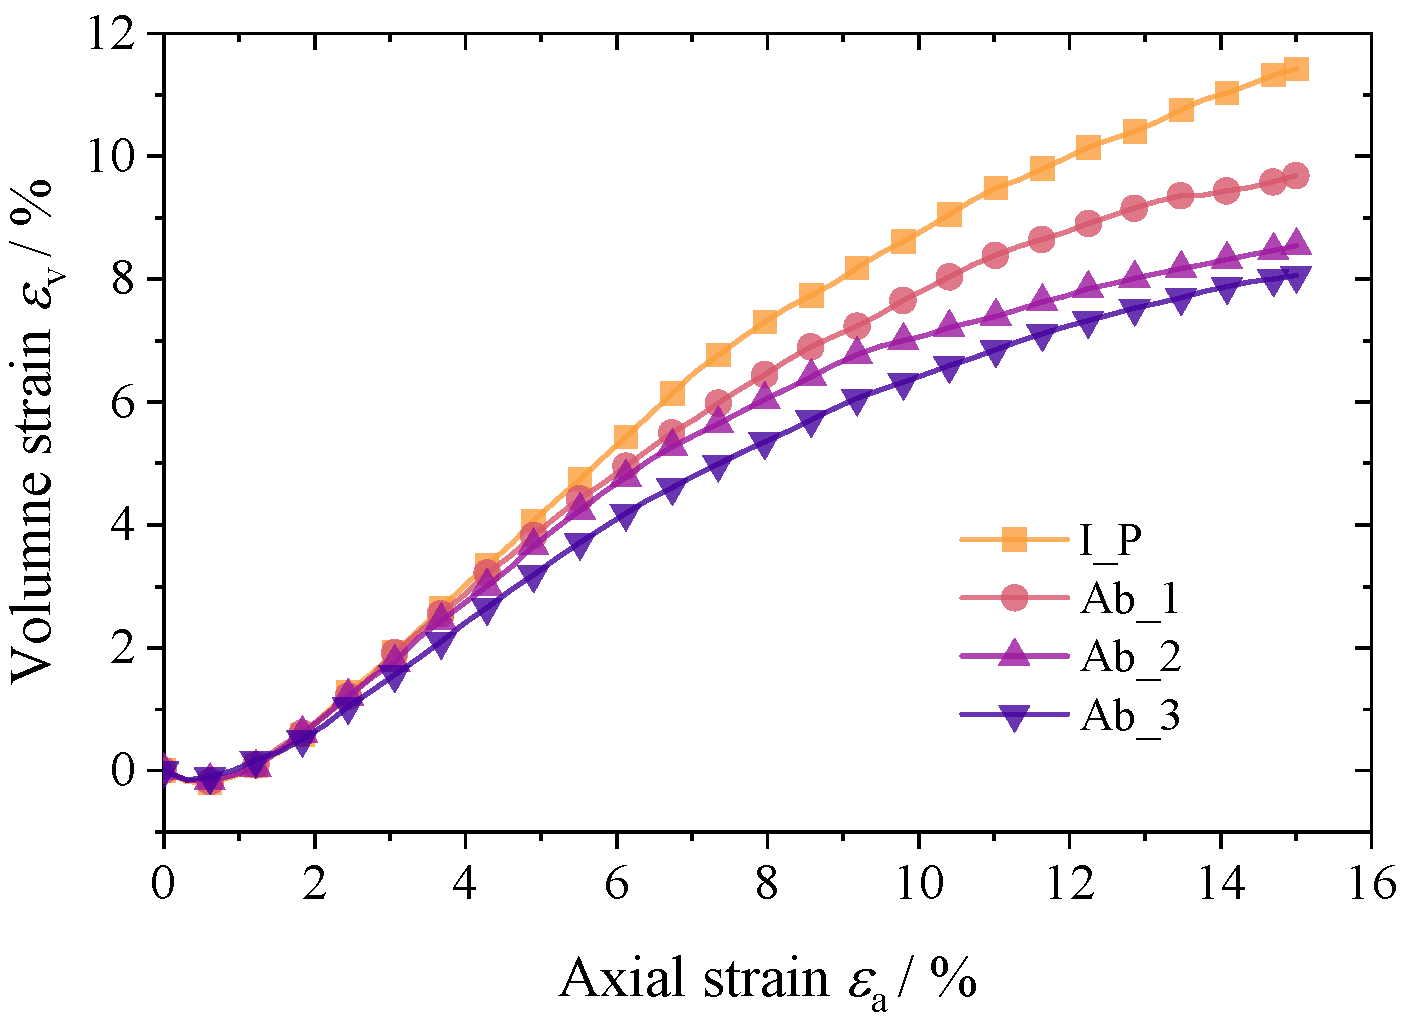
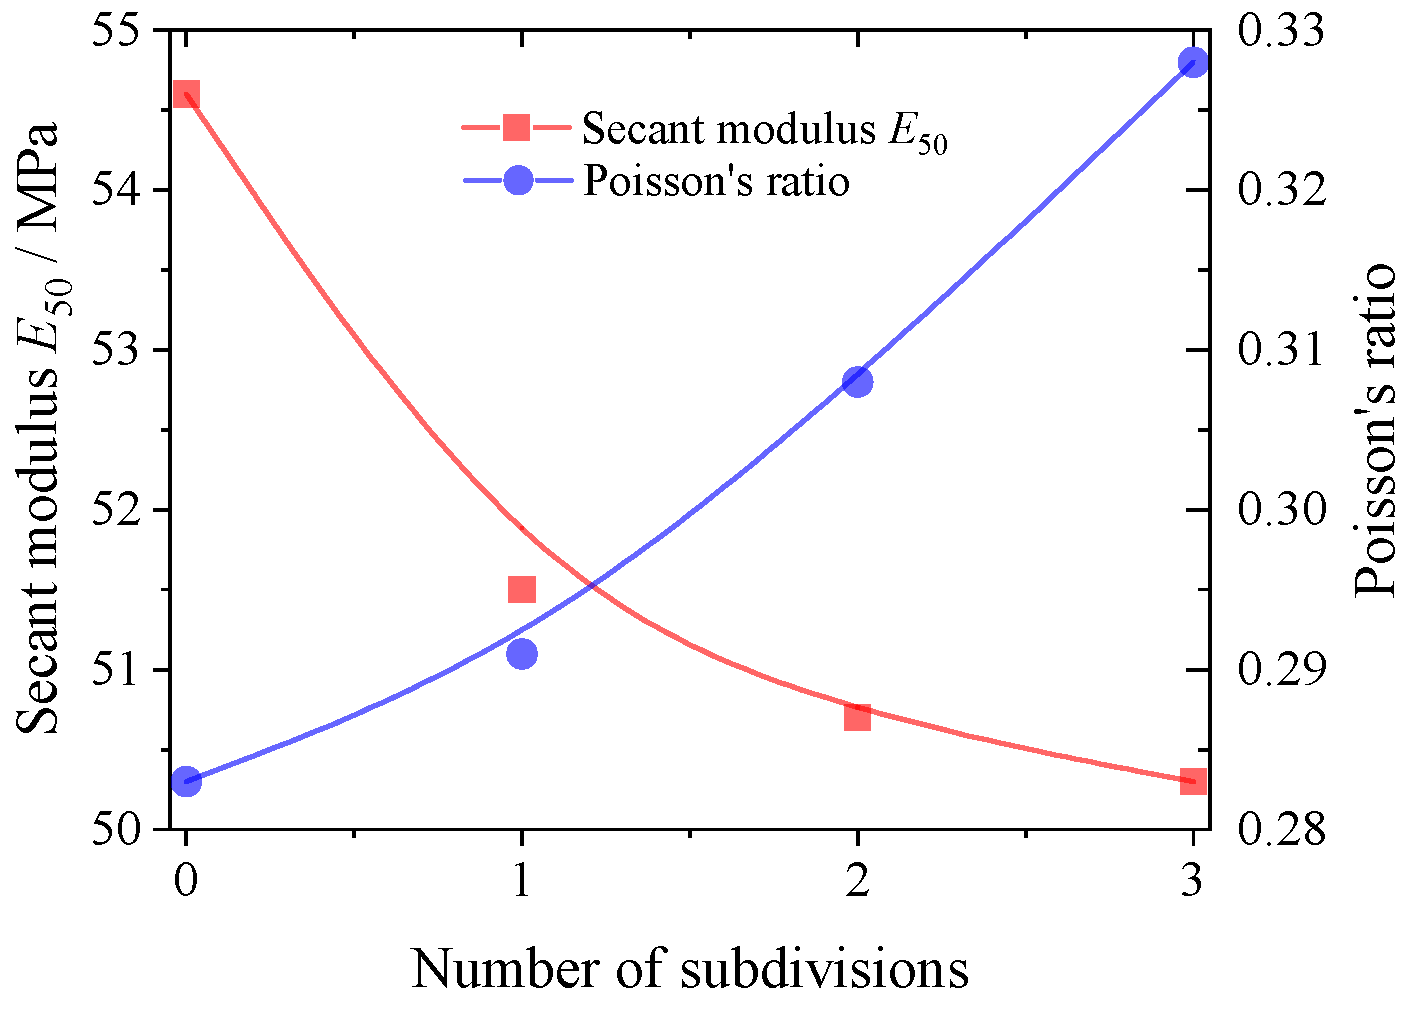
- The macroscopic mechanical behavior of cohesionless granular materials is reproduced using traditional triaxial tests, including the nonlinear stress–strain relationship and dilatancy. With an increase in the degree of particle abrasion, the stiffness and macro shear strength of the material decrease, and the bulging deformation of the material is also restrained.
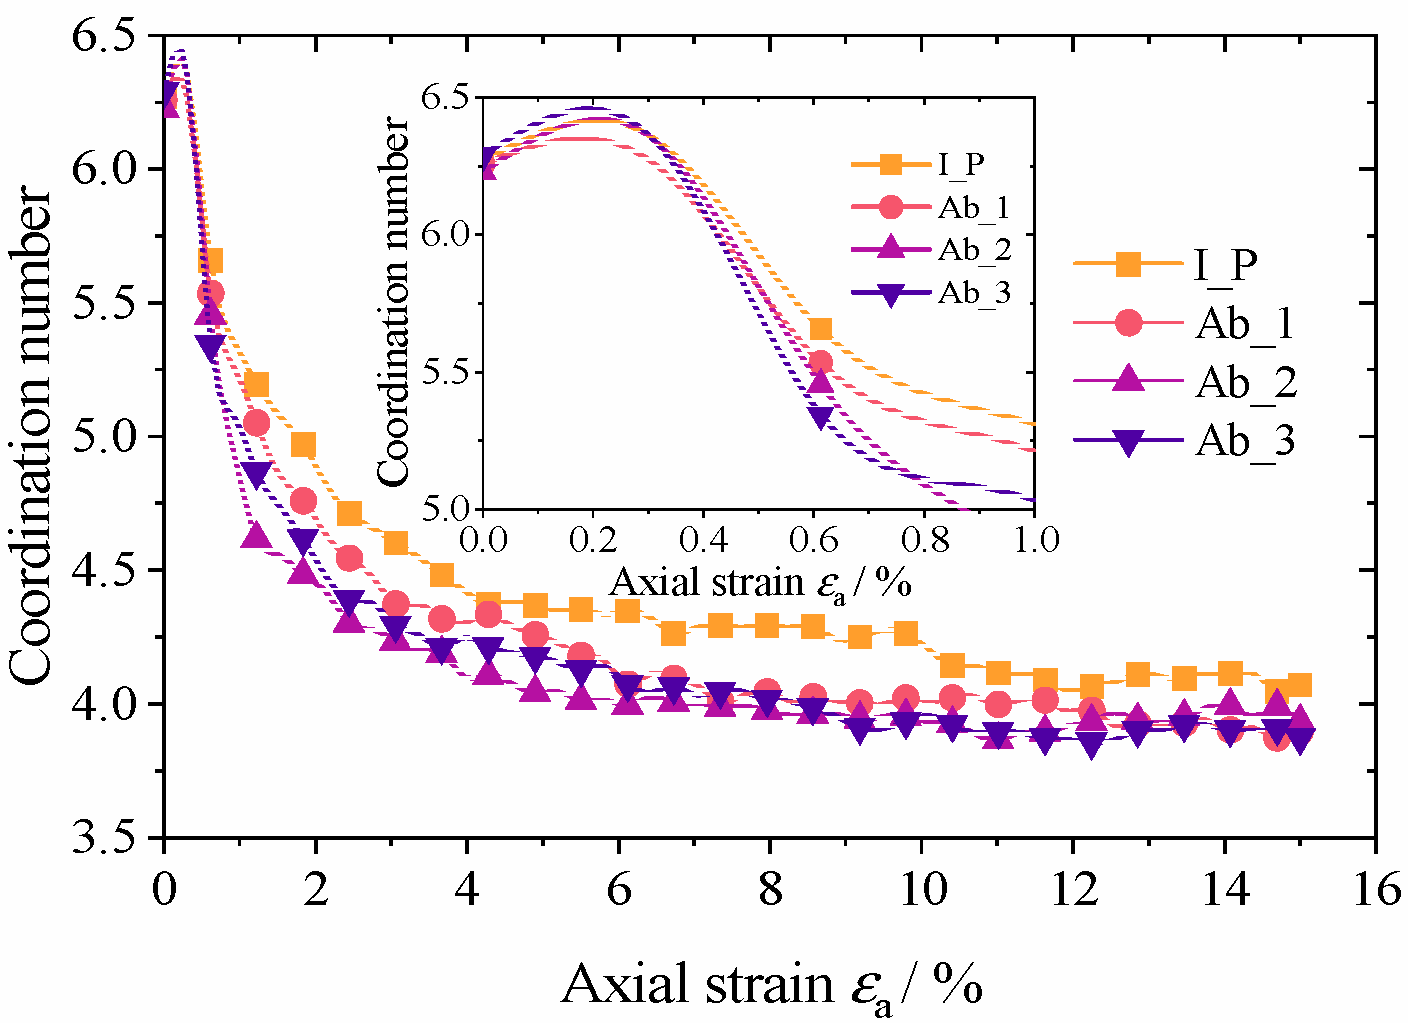
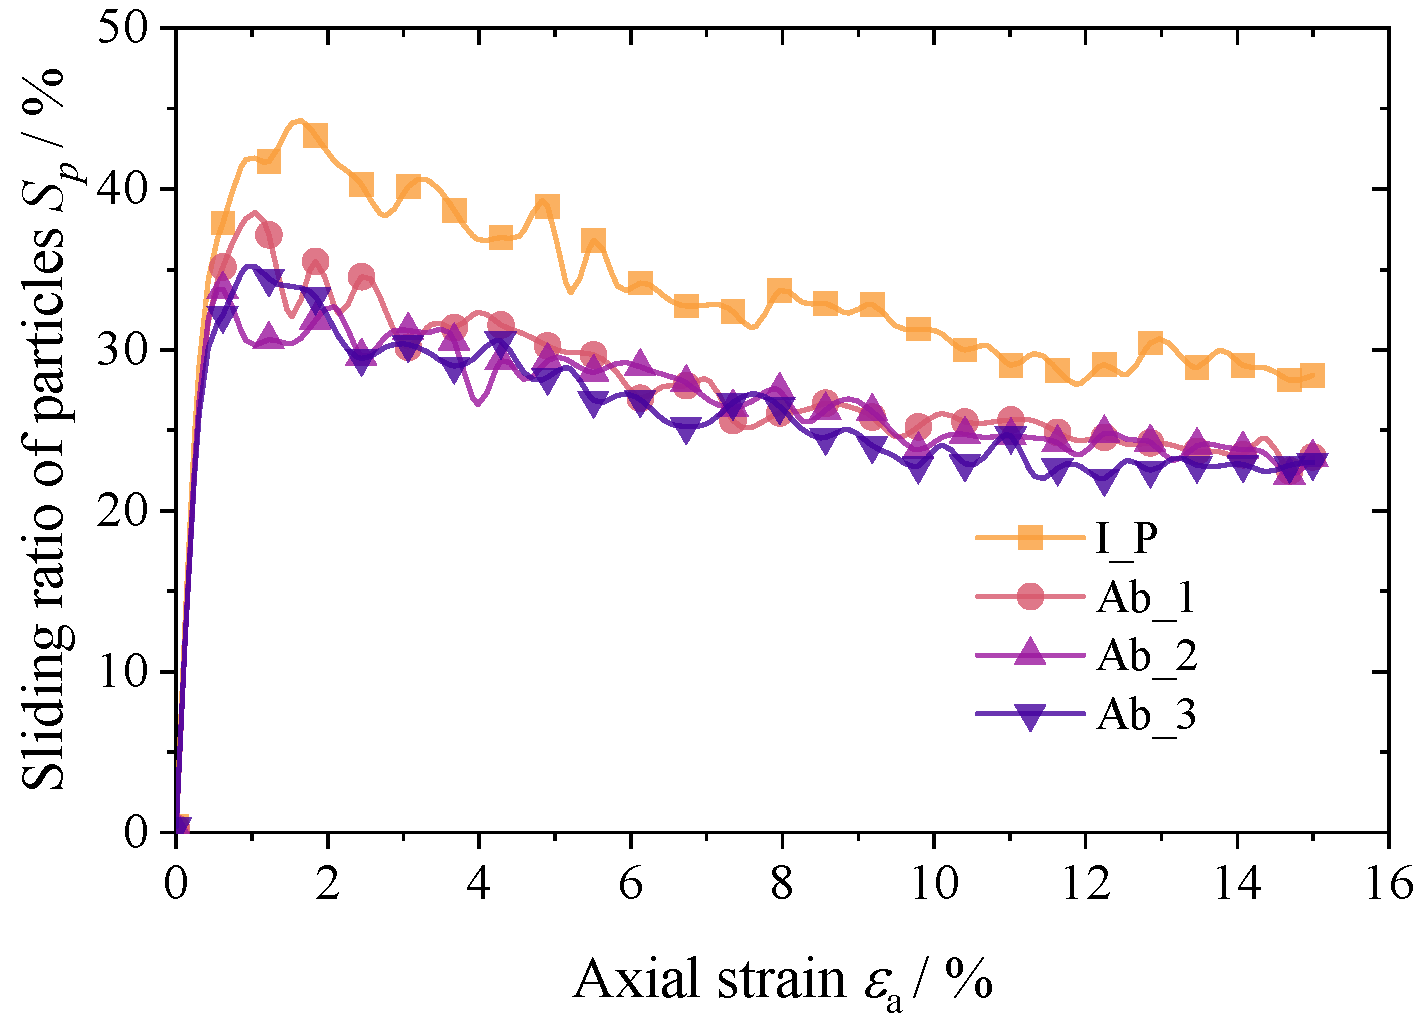
- The granular aggregate with a higher degree of abrasion has lower structural stability, a quicker decline in coordination number, and a lower average coordination number when achieving stability, according to microscopic analysis. At the initial loading stage, the granular material with a higher abrasion degree is more susceptible to relative rotation, while the granular aggregate with a lower abrasion degree is more susceptible to relative sliding. These micro mechanical phenomena can, to a certain extent, reveal the macro mechanical characteristics of granular materials.
- The major contribution to fabric anisotropy comes from normal contact force anisotropy, which is followed by contact normal anisotropy. The results of the S-F-F relationship for the four materials demonstrate that there is a good correspondence between the macro mechanical properties and the micro fabric of the materials and that this correspondence is independent of the particle abrasion level. The abrasion level has an inverse relationship with each fabric’s parameters. The additional constraint of the rubber mold will cause the internal friction angle of granular materials obtained from conventional triaxial tests to be overestimated even if the friction constraint between the particles and boundary is not taken into consideration.
Author Contributions
Funding
Institutional Review Board Statement
Informed Consent Statement
Data Availability Statement
Conflicts of Interest
References
- Vepraskas, M.J.; Cassel, D.K. Sphericity and roundness of sand in coastal plain soils and relationships with soil physical properties. Soil Sci. Soc. Am. J. 1987, 51, 1108–1112. [Google Scholar] [CrossRef]
- Santamarina, J.C.; Cho, G.C. Soil behaviour: The role of particle shape. In Advances in Geotechnical Engineering: The Skempton Conference, Proceedings of the Three Day Conference on Advances in Geotechnical Engineering, Organised by the Institution of Civil Engineers and Held at the Royal Geographical Society, London, UK, 29–31 March 2004; Thomas Telford Publishing: London, UK, 2004; pp. 604–617. [Google Scholar]
- Altuhafi, F.N.; Coop, M.R. Changes to particle characteristics associated with the compression of sands. Géotechnique 2011, 61, 459–471. [Google Scholar] [CrossRef]
- Altuhafi, F.N.; Coop, M.R.; Georgiannou, V.N. Effect of particle shape on the mechanical behavior of natural sands. J. Geotech. Geoenviron. Eng. 2016, 142, 04016071. [Google Scholar] [CrossRef]
- Ding, L.; Zhang, J.; Zhou, C.; Han, S.; Du, Q. Particle breakage investigation of construction waste recycled aggregates in subgrade application scenario. Powder Technol. 2022, 404, 117448. [Google Scholar] [CrossRef]
- Li, J.; Zhang, J.; Yang, X.; Zhang, A.; Yu, M. Monte Carlo simulations of deformation behaviour of unbound granular materials based on a real aggregate library. Int. J. Pavement Eng. 2023, 24, 2165650. [Google Scholar] [CrossRef]
- Tutumluer, E.; Huang, H.; Hashash, Y.M.; Ghaboussi, J. Imaging based discrete element modeling of granular assemblies. In AIP Conference Proceedings; American Institute of Physics: College Park, MD, USA, 2008; Volume 973, pp. 544–549. [Google Scholar]
- Tong, L.; Wang, Y.H. DEM simulations of shear modulus and dam ratio of sand with emphasis on the effects of particle number, particle shape, and aging. Acta Geotech. 2015, 10, 117–130. [Google Scholar] [CrossRef]
- Coetzee, C.J. Calibration of the discrete element method and the effect of particle shape. Powder Technol. 2016, 297, 50–70. [Google Scholar] [CrossRef]
- Gong, F.; Zhou, X.; You, Z.; Liu, Y.; Chen, S. Using discrete element models to track movement of coarse aggregates during compaction of asphalt mixture. Constr. Build. Mater. 2018, 189, 338–351. [Google Scholar] [CrossRef]
- Tillemans, H.J.; Herrmann, H.J. Simulating deformations of granular solids under shear. Phys. A Stat. Mech. Its Appl. 1995, 217, 261–288. [Google Scholar] [CrossRef]
- Seyedi Hosseininia, E. Investigating the micromechanical evolutions within inherently anisotropic granular materials using discrete element method. Granul. Matter 2012, 14, 483–503. [Google Scholar] [CrossRef]
- Mack, S.; Langston, P.; Webb, C.; York, T. Experimental validation of polyhedral discrete element model. Powder Technol. 2011, 214, 431–442. [Google Scholar] [CrossRef]
- Zhao, S.; Zhou, X.; Liu, W. Discrete element simulations of direct shear tests with particle angularity effect. Granul. Matter 2015, 17, 793–806. [Google Scholar] [CrossRef]
- Shodja, H.M.; Rad, I.Z.; Soheilifard, R. Interacting cracks and ellipsoidal inhomogeneities by the equivalent inclusion method. J. Mech. Phys. Solids 2003, 51, 945–960. [Google Scholar] [CrossRef]
- Nouguier-Lehon, C.; Cambou, B.; Vincens, E. Influence of particle shape and angularity on the behaviour of granular materials: A numerical analysis. Int. J. Numer. Anal. Methods Geomech. 2003, 27, 1207–1226. [Google Scholar] [CrossRef]
- Ng, T.T. Shear strength of assemblies of ellipsoidal particles. Geotechnique 2004, 54, 659–669. [Google Scholar] [CrossRef]
- Zhou, Z.Y.; Zou, R.P.; Pinson, D.; Yu, A.B. Dynamic simulation of the packing of ellipsoidal particles. Ind. Eng. Chem. Res. 2011, 50, 9787–9798. [Google Scholar] [CrossRef]
- Zhou, W.; Huang, Y.; Ng, T.T.; Ma, G. A geometric potential-based contact detection algorithm for egg-shaped particles in discrete element modeling. Powder Technol. 2018, 327, 152–162. [Google Scholar] [CrossRef]
- Lim, K.W.; Andrade, J.E. Granular element method for three-dimensional discrete element calculations. Int. J. Numer. Anal. Methods Geomech. 2014, 38, 167–188. [Google Scholar] [CrossRef]
- Zhao, S.; Zhou, X. Effects of particle asphericity on the macro-and micro-mechanical behaviors of granular assemblies. Granul. Matter 2017, 19, 38. [Google Scholar] [CrossRef]
- Wang, X.; Yin, Z.Y.; Su, D.; Wu, X.; Zhao, J. A novel approach of random packing generation of complex-shaped 3D particles with controllable sizes and shapes. Acta Geotech. 2022, 17, 355–376. [Google Scholar] [CrossRef]
- Qian, Z.; Garboczi, E.J.; Ye, G.; Schlangen, E. Anm: A geometrical model for the composite structure of mortar and concrete using real-shape particles. Mater. Struct. 2016, 49, 149–158. [Google Scholar] [CrossRef]
- Zhu, Z.; Chen, H.; Xu, W.; Liu, L. Parking simulation of three-dimensional multi-sized star-shaped particles. Model. Simul. Mater. Sci. Eng. 2014, 22, 035008. [Google Scholar] [CrossRef]
- Garboczi, E.J.; Bullard, J.W. 3D analytical mathematical models of random star-shape particles via a combination of X-ray computed microtomography and spherical harmonic analysis. Adv. Powder Technol. 2017, 28, 325–339. [Google Scholar] [CrossRef]
- Wang, X.; Nie, Z.; Gong, J.; Liang, Z. Random generation of convex aggregates for DEM study of particle shape effect. Constr. Build. Mater. 2021, 268, 121468. [Google Scholar] [CrossRef]
- Ferellec, J.F.; McDowell, G.R. A method to model realistic particle shape and inertia in DEM. Granul. Matter 2010, 12, 459–467. [Google Scholar] [CrossRef]
- Zhou, Y.; Wang, H.; Zhou, B.; Li, J. DEM-aided direct shear testing of granular sands incorporating realistic particle shape. Granul. Matter 2018, 20, 55. [Google Scholar] [CrossRef]
- Xu, D.; Tang, Z.; Zhang, L. Interpretation of coarse effect in simple shear behavior of binary sand-gravel mixture by DEM with authentic particle shape. Constr. Build. Mater. 2019, 195, 292–304. [Google Scholar] [CrossRef]
- Ma, G.; Zhou, W.; Chang, X.L.; Yuan, W. Combined FEM/DEM modeling of triaxial compression tests for rockfills with polyhedral particles. Int. J. Geomech. 2014, 14, 04014014. [Google Scholar] [CrossRef]
- Halstead, M.; Kass, M.; DeRose, T. Efficient, fair interpolation using Catmull-Clark surfaces. In Proceedings of the 20th Annual Conference on Computer Graphics and Interactive Techniques, Anaheim, CA, USA, 2–6 August 1993; pp. 35–44. [Google Scholar]
- Stam, J. Exact evaluation of Catmull-Clark subdivision surfaces at arbitrary parameter values. In Seminal Graphics Papers: Pushing the Boundaries; Association for Computing Machinery: New York, NY, USA, 2023; Volume 2, pp. 139–148. [Google Scholar]
- Barrett, P.J. The shape of rock particles, a critical review. Sedimentology 1980, 27, 291–303. [Google Scholar] [CrossRef]
- PFC 6.0 Documentation; Itasca Consulting Group, Inc.: Minneapolis, MN, USA, 2017.
- Yu, A.B.; Standish, N. An analytical—Parametric theory of the random packing of particles. Powder Technol. 1988, 55, 171–186. [Google Scholar] [CrossRef]
- Szwajka, K.; Szewczyk, M.; Trzepieciński, T. Experimental Compaction of a High-Silica Sand in Quasi-Static Conditions. Materials 2022, 16, 28. [Google Scholar] [CrossRef] [PubMed]
- Tan, X.; Hu, Z.; Cao, M.; Chen, C. 3D discrete element simulation of a geotextile-encased stone column under uniaxial compression testing. Comput. Geotech. 2020, 126, 103769. [Google Scholar] [CrossRef]
- Rowe, P.W. The stress-dilatancy relations for static equilibrium of an assembly of particles in contact. Proc. R. Soc. Lond. Ser. A. Math. Phys. Sci. 1962, 269, 117–141. [Google Scholar]
- Terzaghi, K.; Peck, R.B.; Mesri, G. Soil Mechanics in Engineering Practice; John Wiley & Sons: Hoboken, NJ, USA, 1996. [Google Scholar]
- Thornton, C.; Sun, G. Axisymmetric compression of 3D polydisperse systems of spheres. Powders Grains 1993, 93, 129–134. [Google Scholar]
- Rothenburg, L.; Kruyt, N.P. Critical state and evolution of coordination number in simulated granular materials. Int. J. Solids Struct. 2004, 41, 5763–5774. [Google Scholar] [CrossRef]
- Estrada, N.; Azéma, E.; Radjai, F.; Taboada, A. Identification of rolling resistance as a shape parameter in sheared granular media. Phys. Rev. E 2011, 84, 011306. [Google Scholar] [CrossRef]
- Azéma, E.; Radjai, F.; Dubois, F. Packings of irregular polyhedral particles: Strength, structure, and effects of angularity. Phys. Rev. E 2013, 87, 062203. [Google Scholar] [CrossRef] [PubMed]
- Satake, M. Fabric tensor in granular materials. In Proceedings of the IUTAM-Conference on Deformation and Failure of Granular Materials, Delft, The Netherlands, 31 August–3 September 1982; pp. 63–68. [Google Scholar]
- Guo, N.; Zhao, J. The signature of shear-induced anisotropy in granular media. Comput. Geotech. 2013, 47, 1–15. [Google Scholar] [CrossRef]
- Zhao, S.; Evans, T.M.; Zhou, X. Effects of curvature-related DEM contact model on the macro-and micro-mechanical behaviours of granular soils. Géotechnique 2018, 68, 1085–1098. [Google Scholar] [CrossRef]


| Parameter | Value |
|---|---|
| Particle density, ρ (kg/m3) | 2600 |
| Particle coefficient of friction, μc | 0.5 |
| Boundary–particle friction μb | 0.0 |
| Particle normal stiffness, kn (N/m) | 1 × 10⁸ |
| Particle tangential stiffness, ks (N/m) | 5 × 10⁷ |
| Damping coefficient, dp | 0.3 |
Disclaimer/Publisher’s Note: The statements, opinions and data contained in all publications are solely those of the individual author(s) and contributor(s) and not of MDPI and/or the editor(s). MDPI and/or the editor(s) disclaim responsibility for any injury to people or property resulting from any ideas, methods, instructions or products referred to in the content. |
© 2024 by the authors. Licensee MDPI, Basel, Switzerland. This article is an open access article distributed under the terms and conditions of the Creative Commons Attribution (CC BY) license (https://creativecommons.org/licenses/by/4.0/).
Share and Cite
Hu, Z.; Zhang, J.; Tan, X.; Yang, H. Modeling of the Particle Abrasion Process and a Discrete Element Method Study of Its Shape Effect. Materials 2024, 17, 3947. https://doi.org/10.3390/ma17163947
Hu Z, Zhang J, Tan X, Yang H. Modeling of the Particle Abrasion Process and a Discrete Element Method Study of Its Shape Effect. Materials. 2024; 17(16):3947. https://doi.org/10.3390/ma17163947
Chicago/Turabian StyleHu, Zhengbo, Junhui Zhang, Xin Tan, and Hao Yang. 2024. "Modeling of the Particle Abrasion Process and a Discrete Element Method Study of Its Shape Effect" Materials 17, no. 16: 3947. https://doi.org/10.3390/ma17163947