
Relationship between Texture, Hydrogen Content, Residual Stress and Corrosion Resistance of Electrodeposited Chromium Coating: Influence of Heat Treatment
 ,
,
Abstract
:1. Introduction
2. Experimental
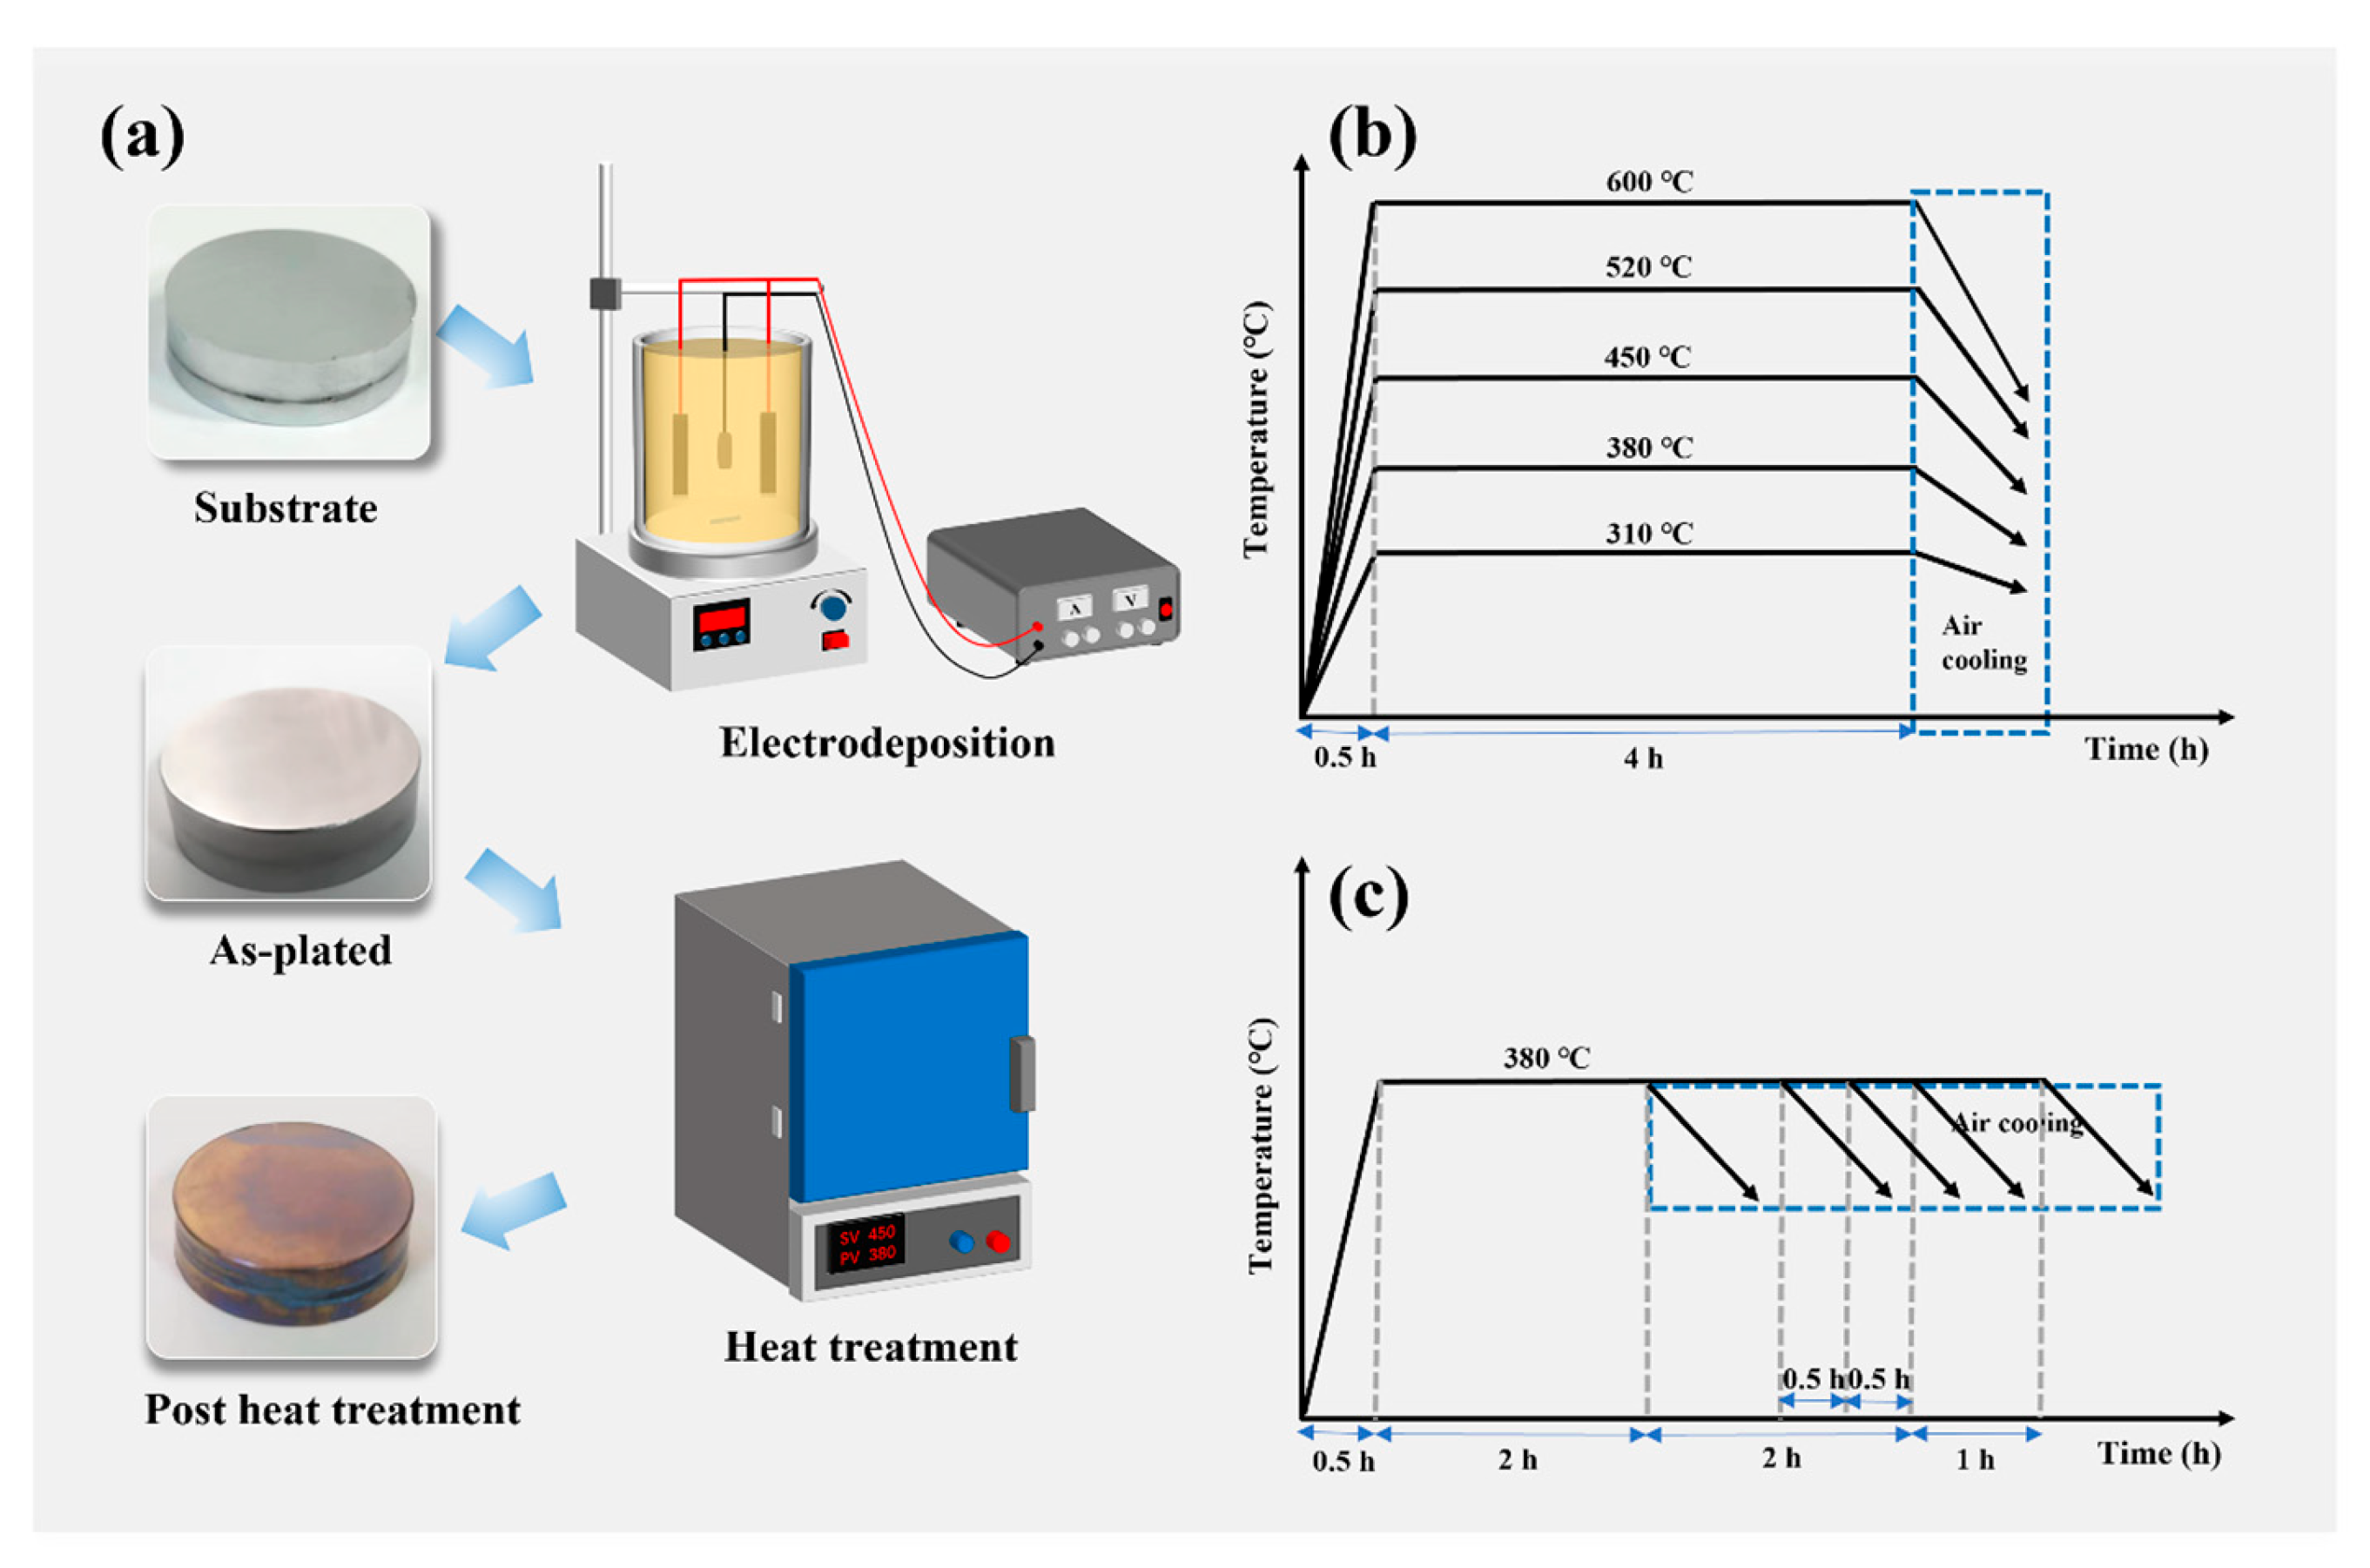
2.1. Coating Preparation and Post Heat Treatment
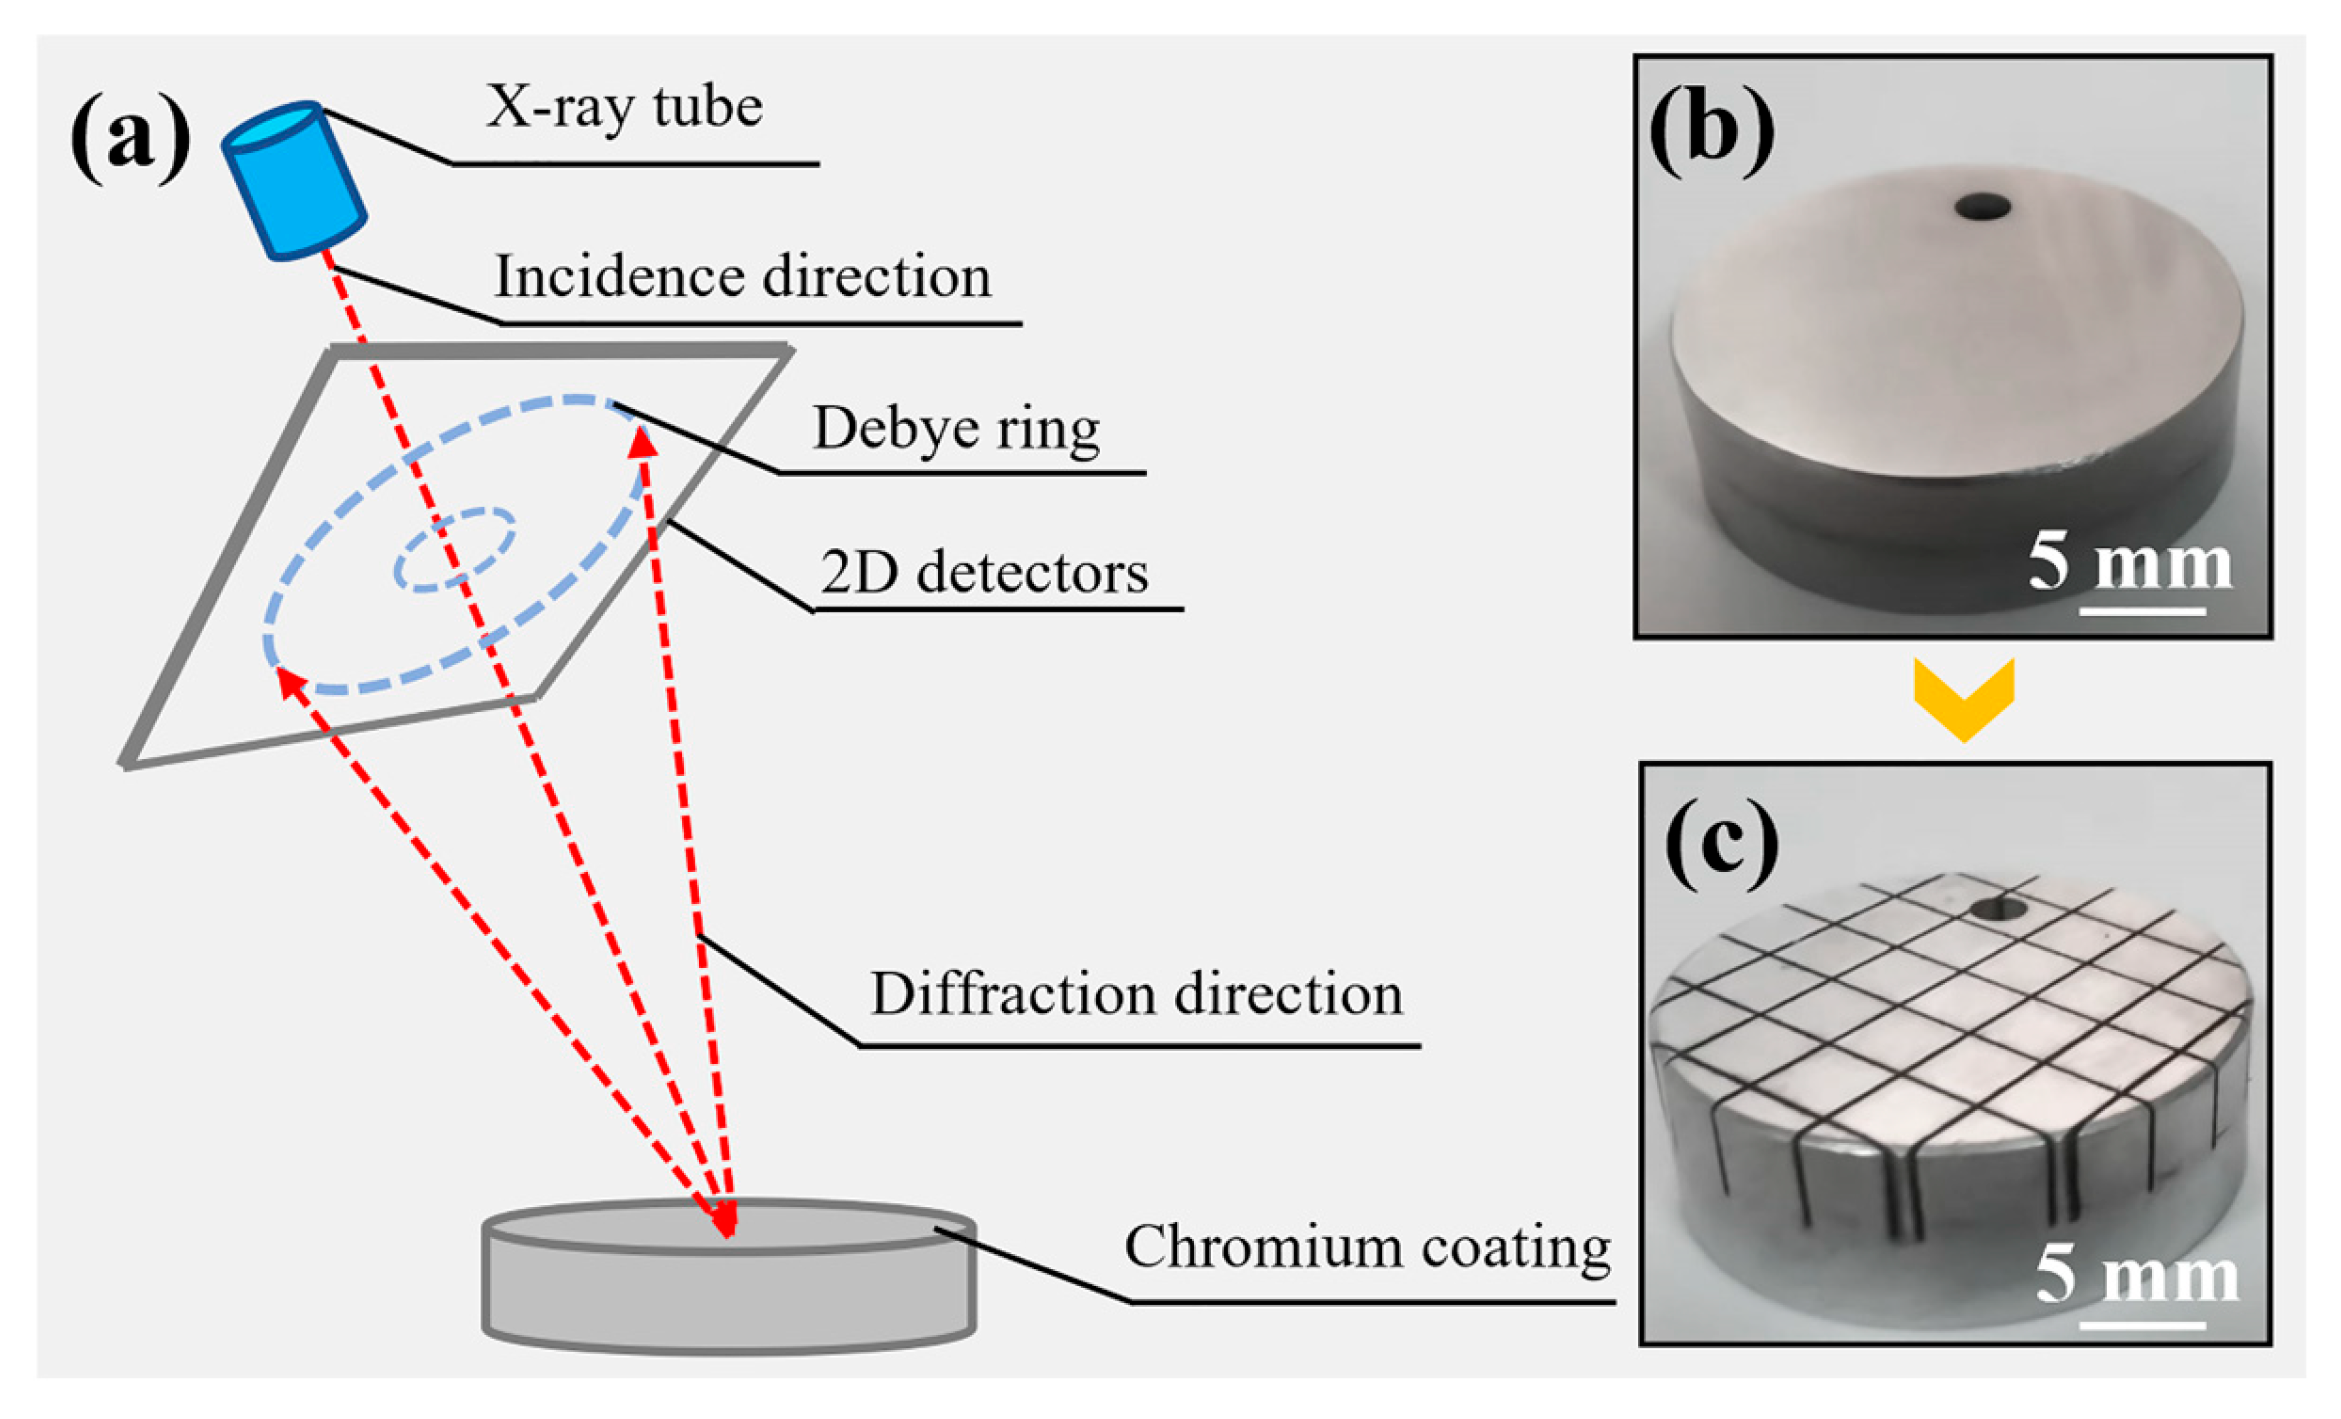
2.2. Morphology and Microstructure Analysis
2.3. Hydrogen Content, Residual Stress, Microhardness and Corrosion Resistance Analysis
3. Results
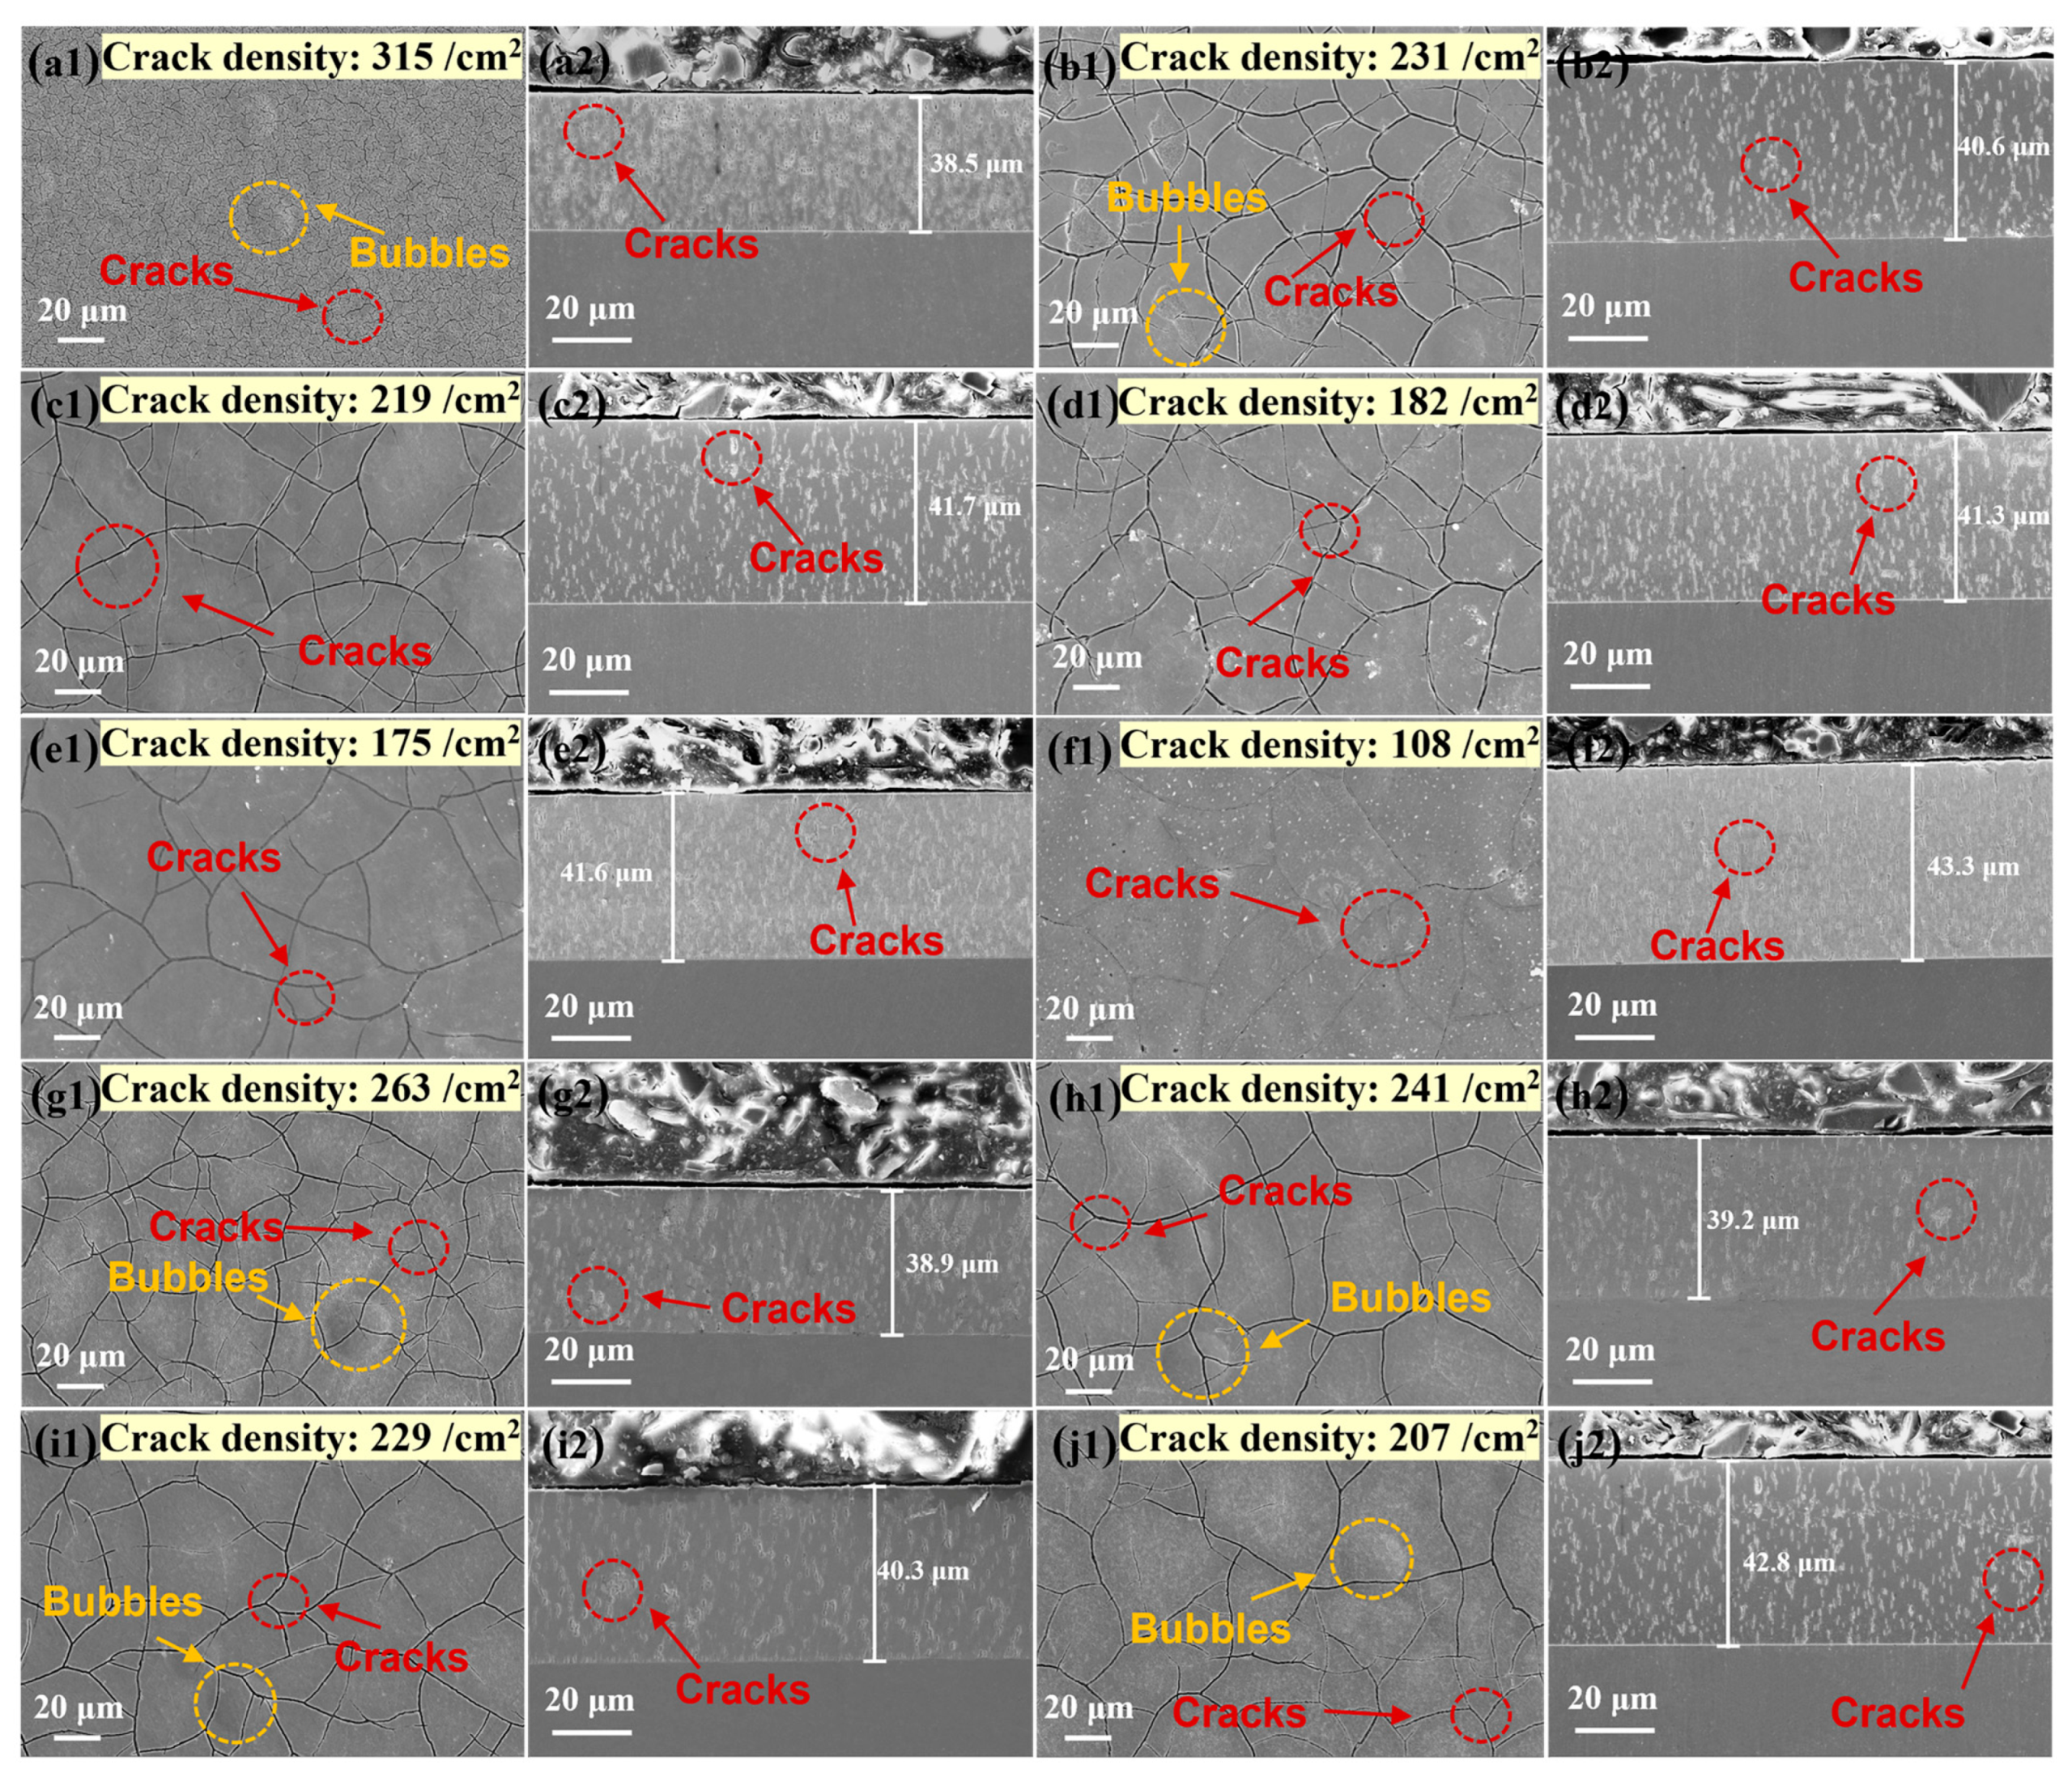
3.1. Morphology
3.2. Texture
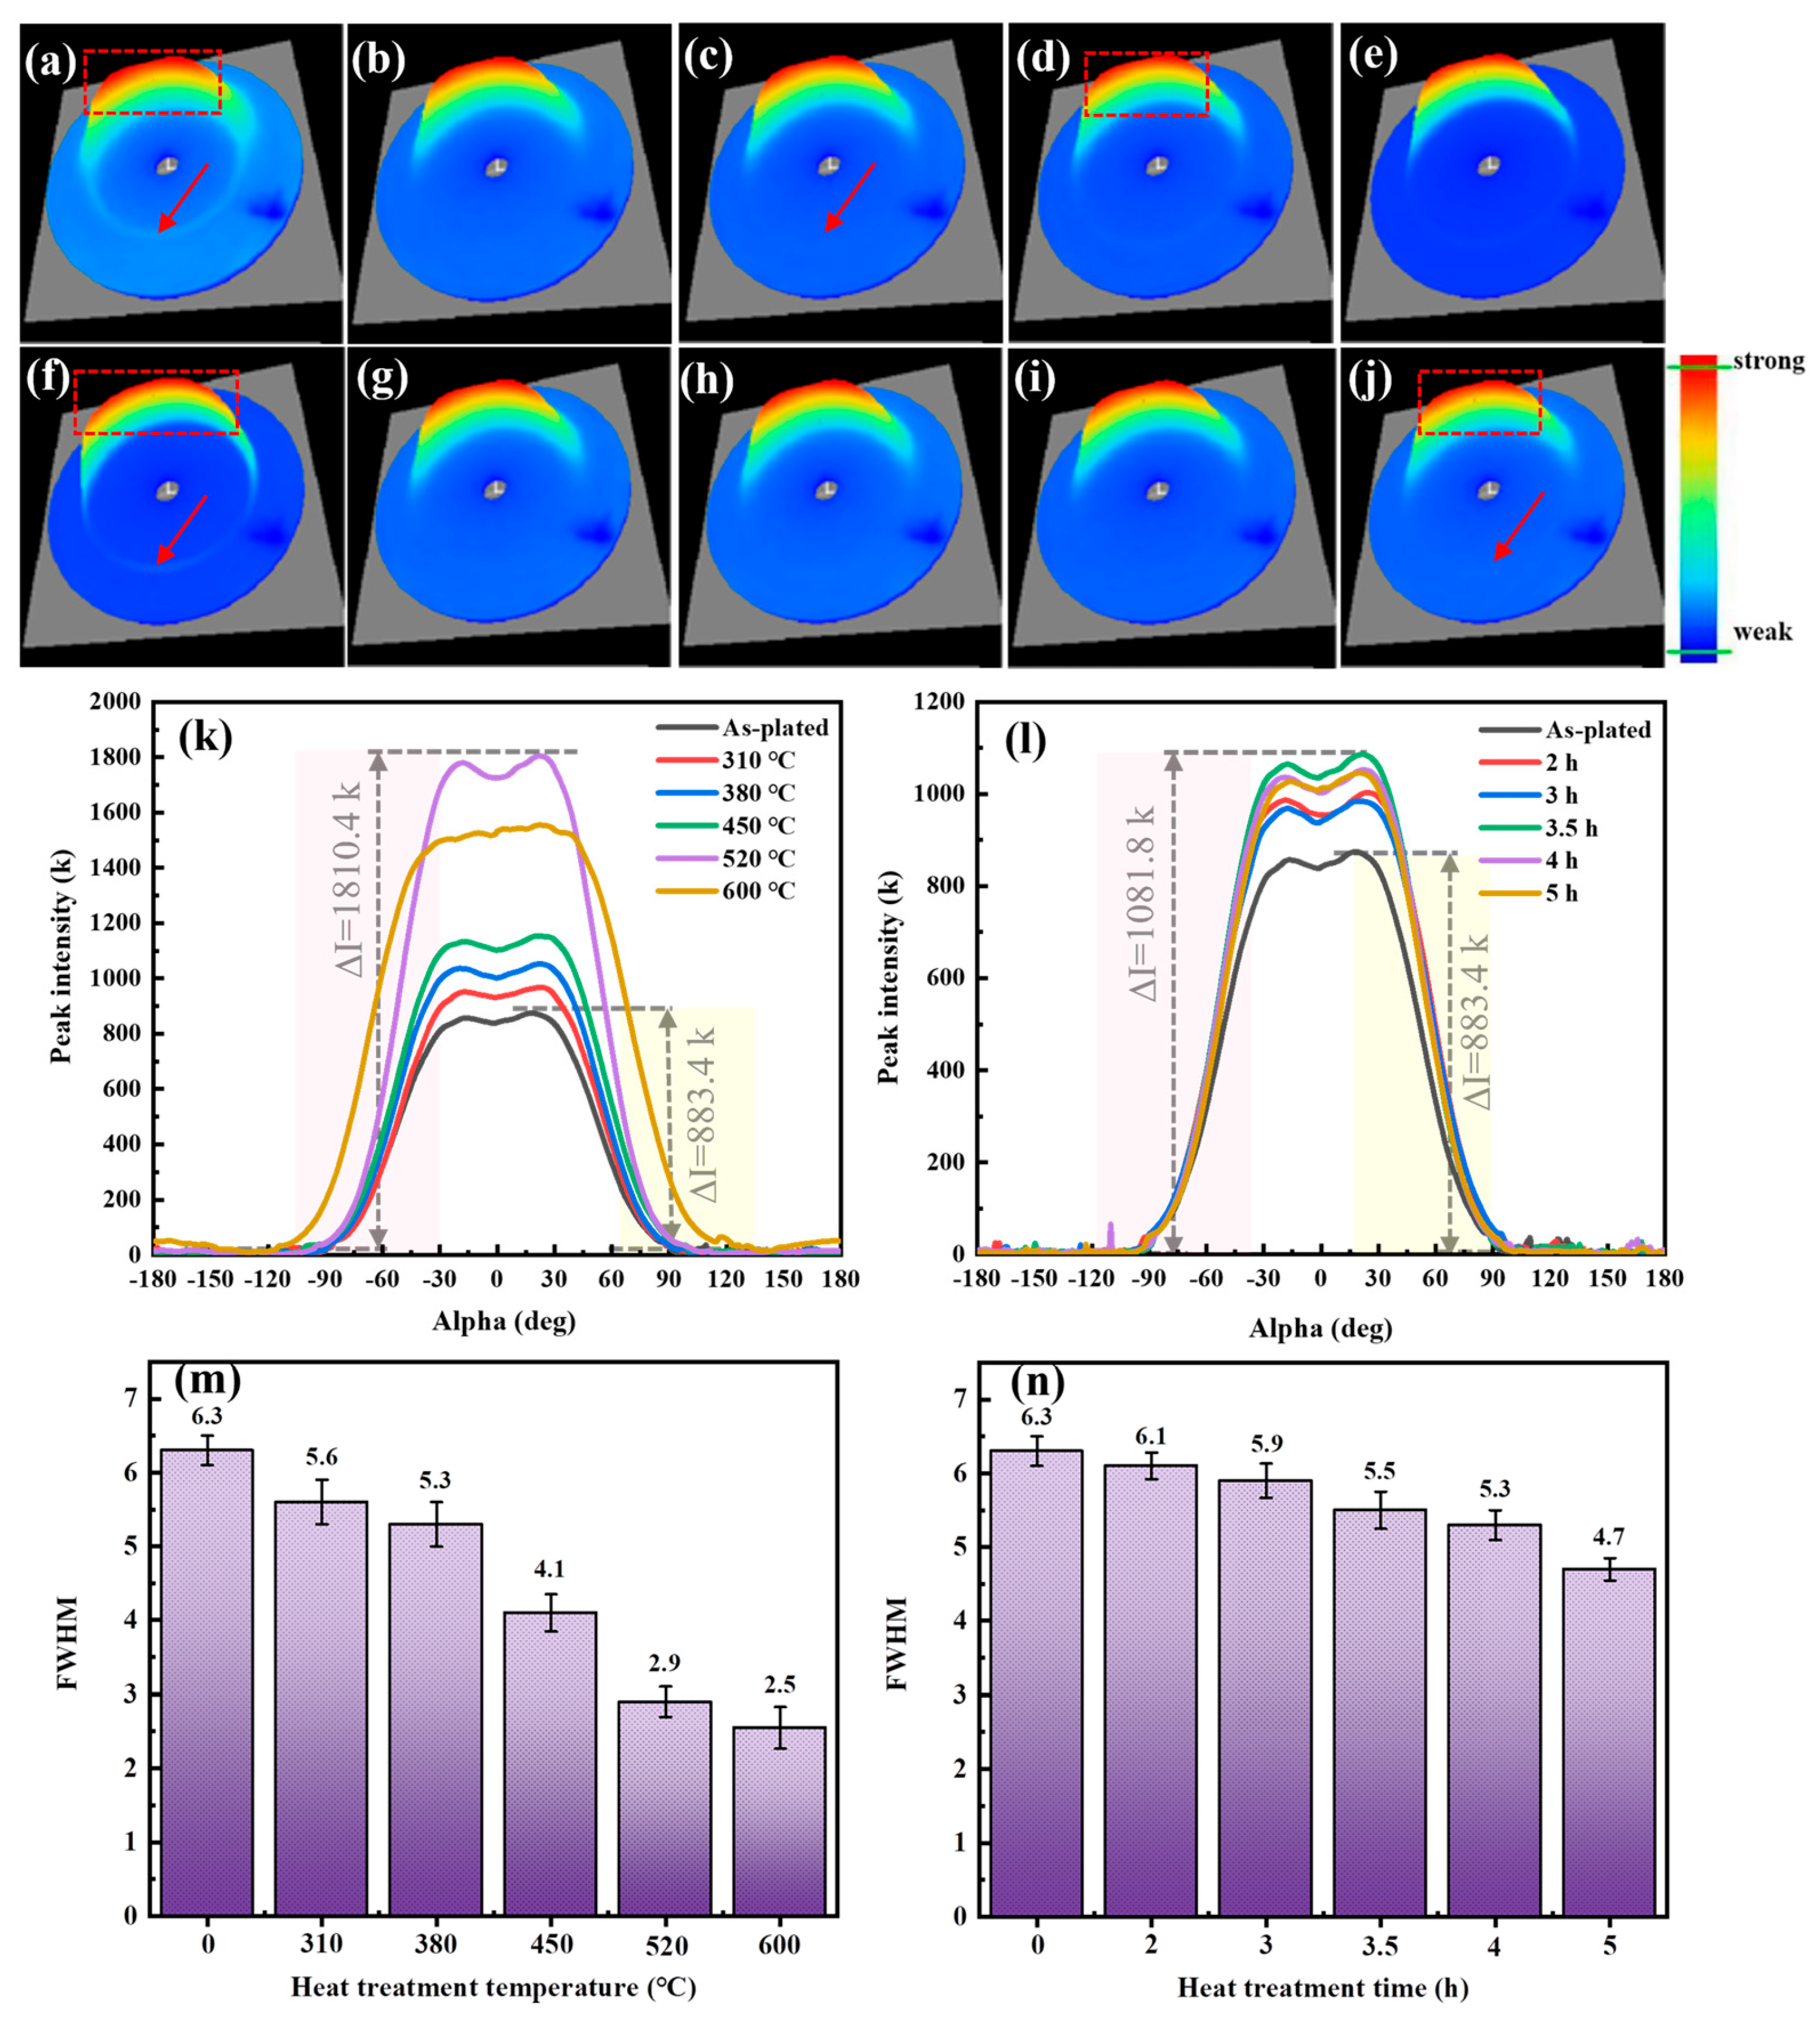
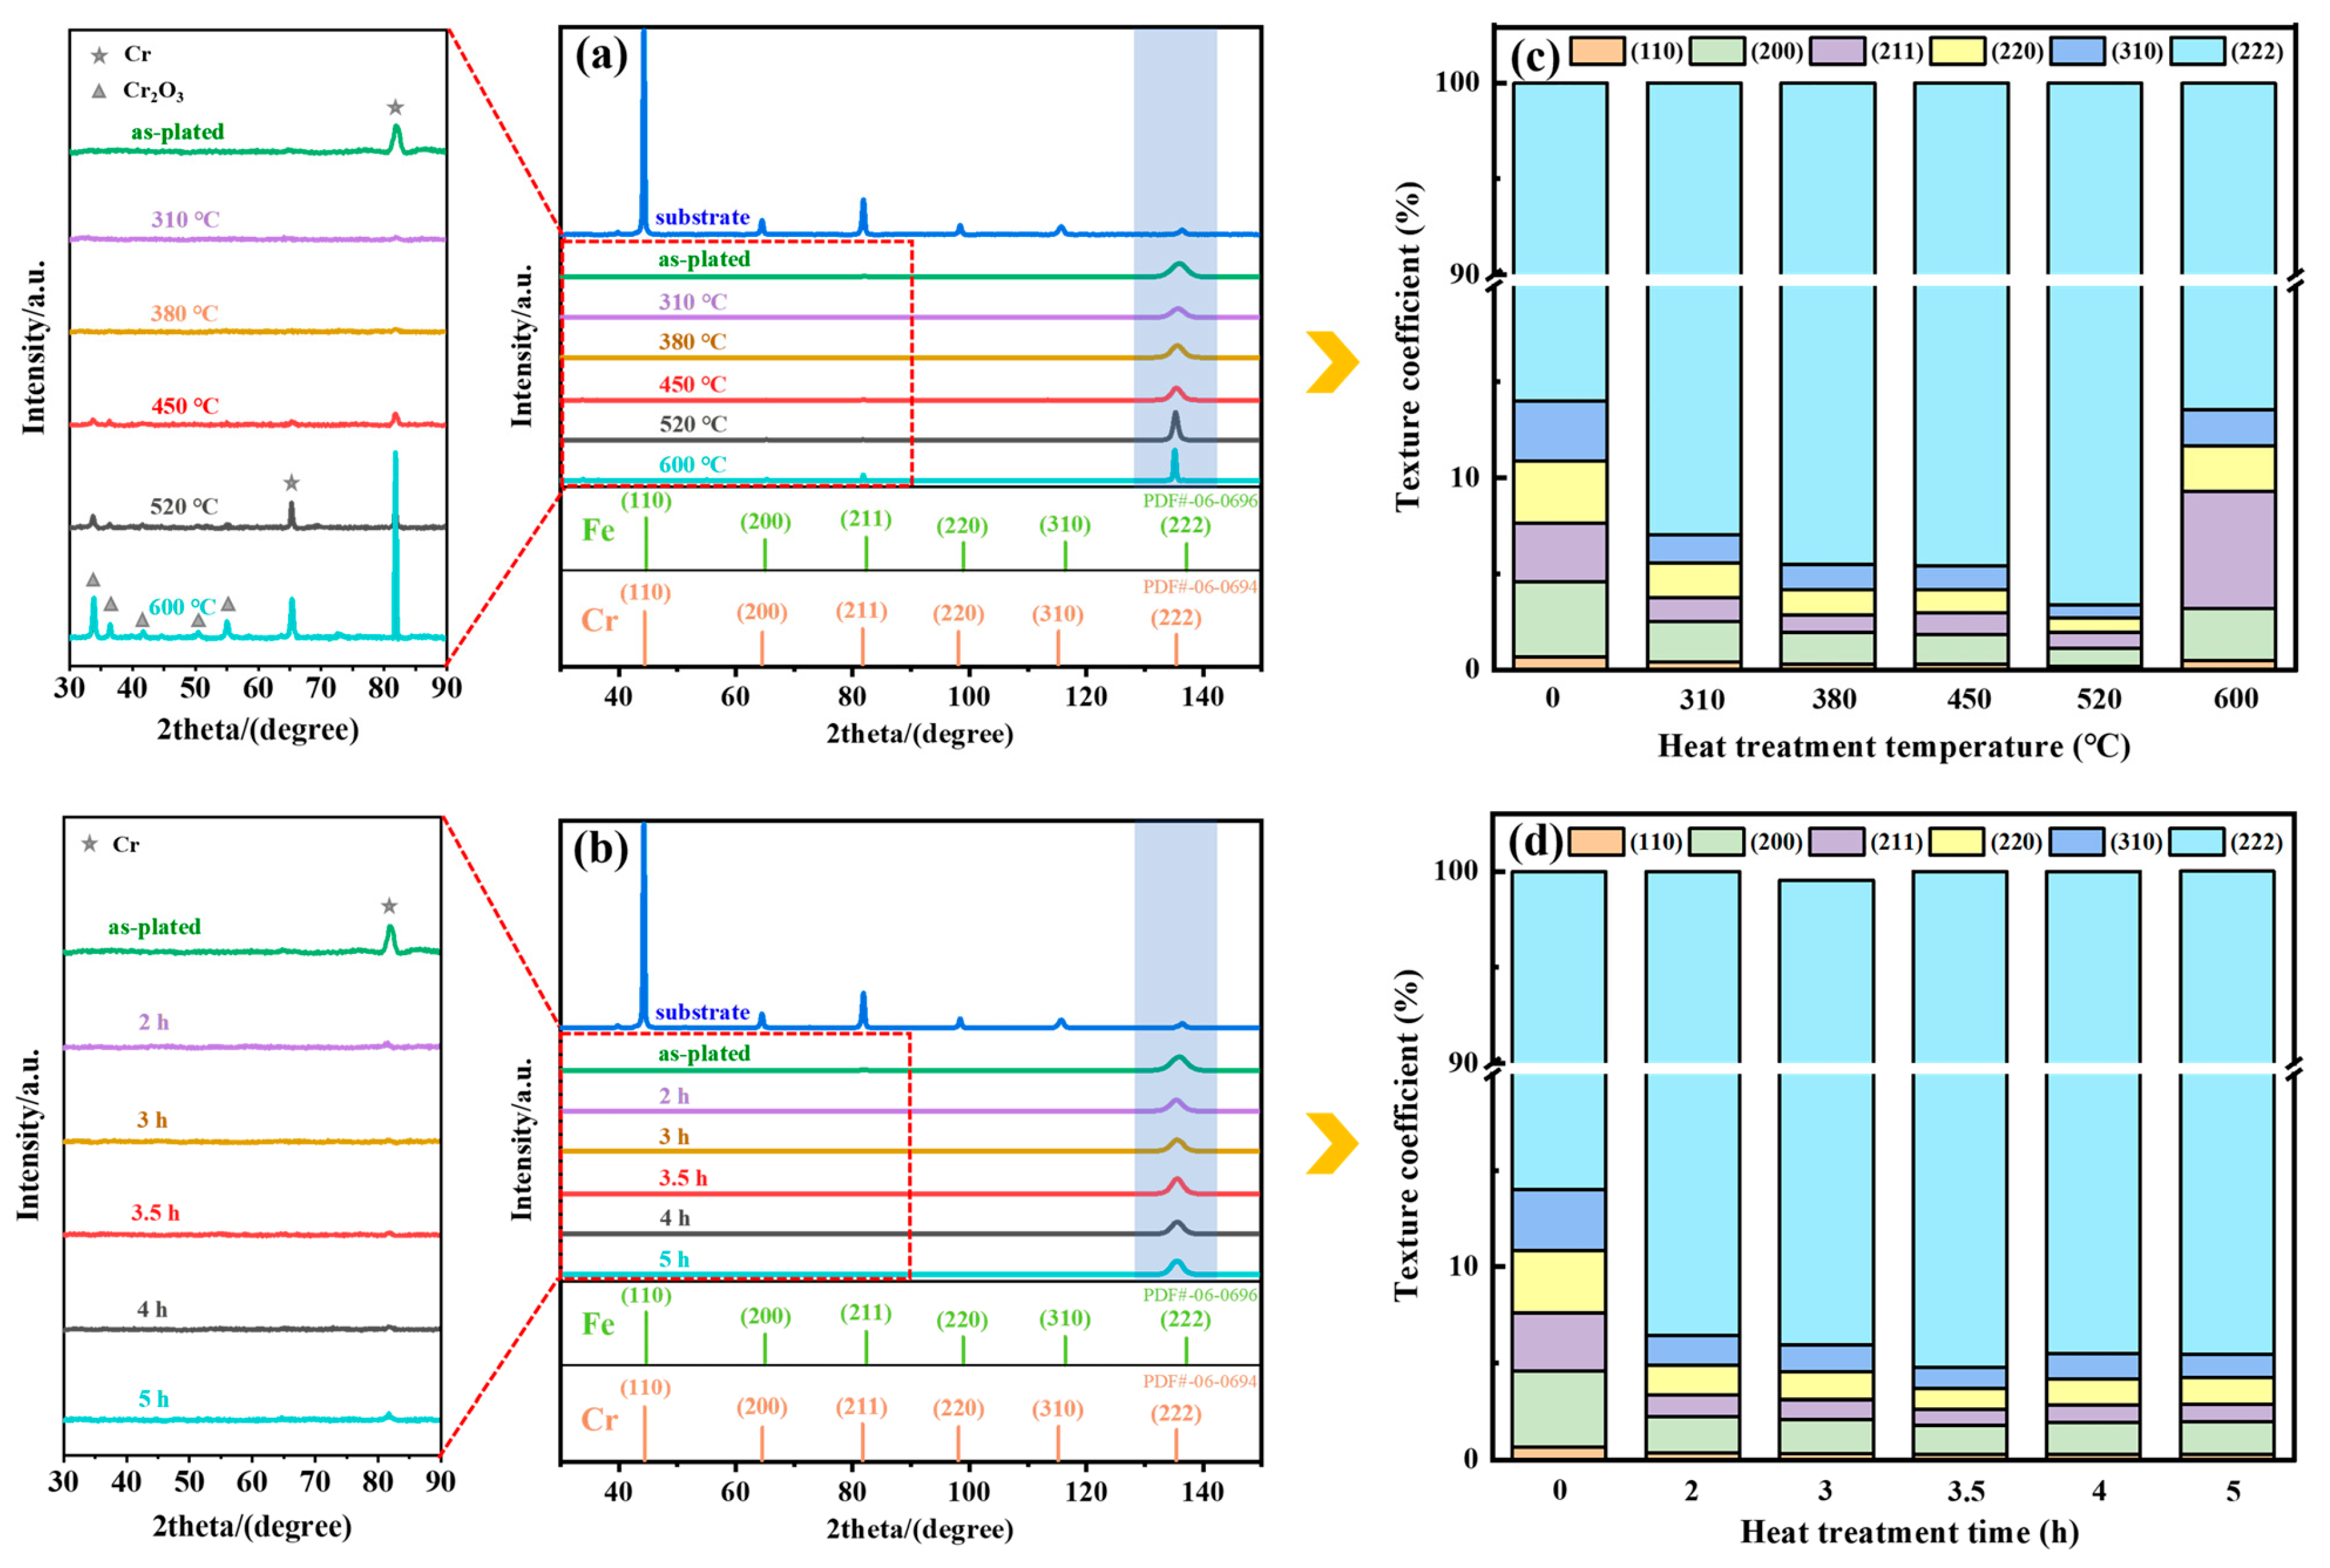
3.2.1. Macrotexture
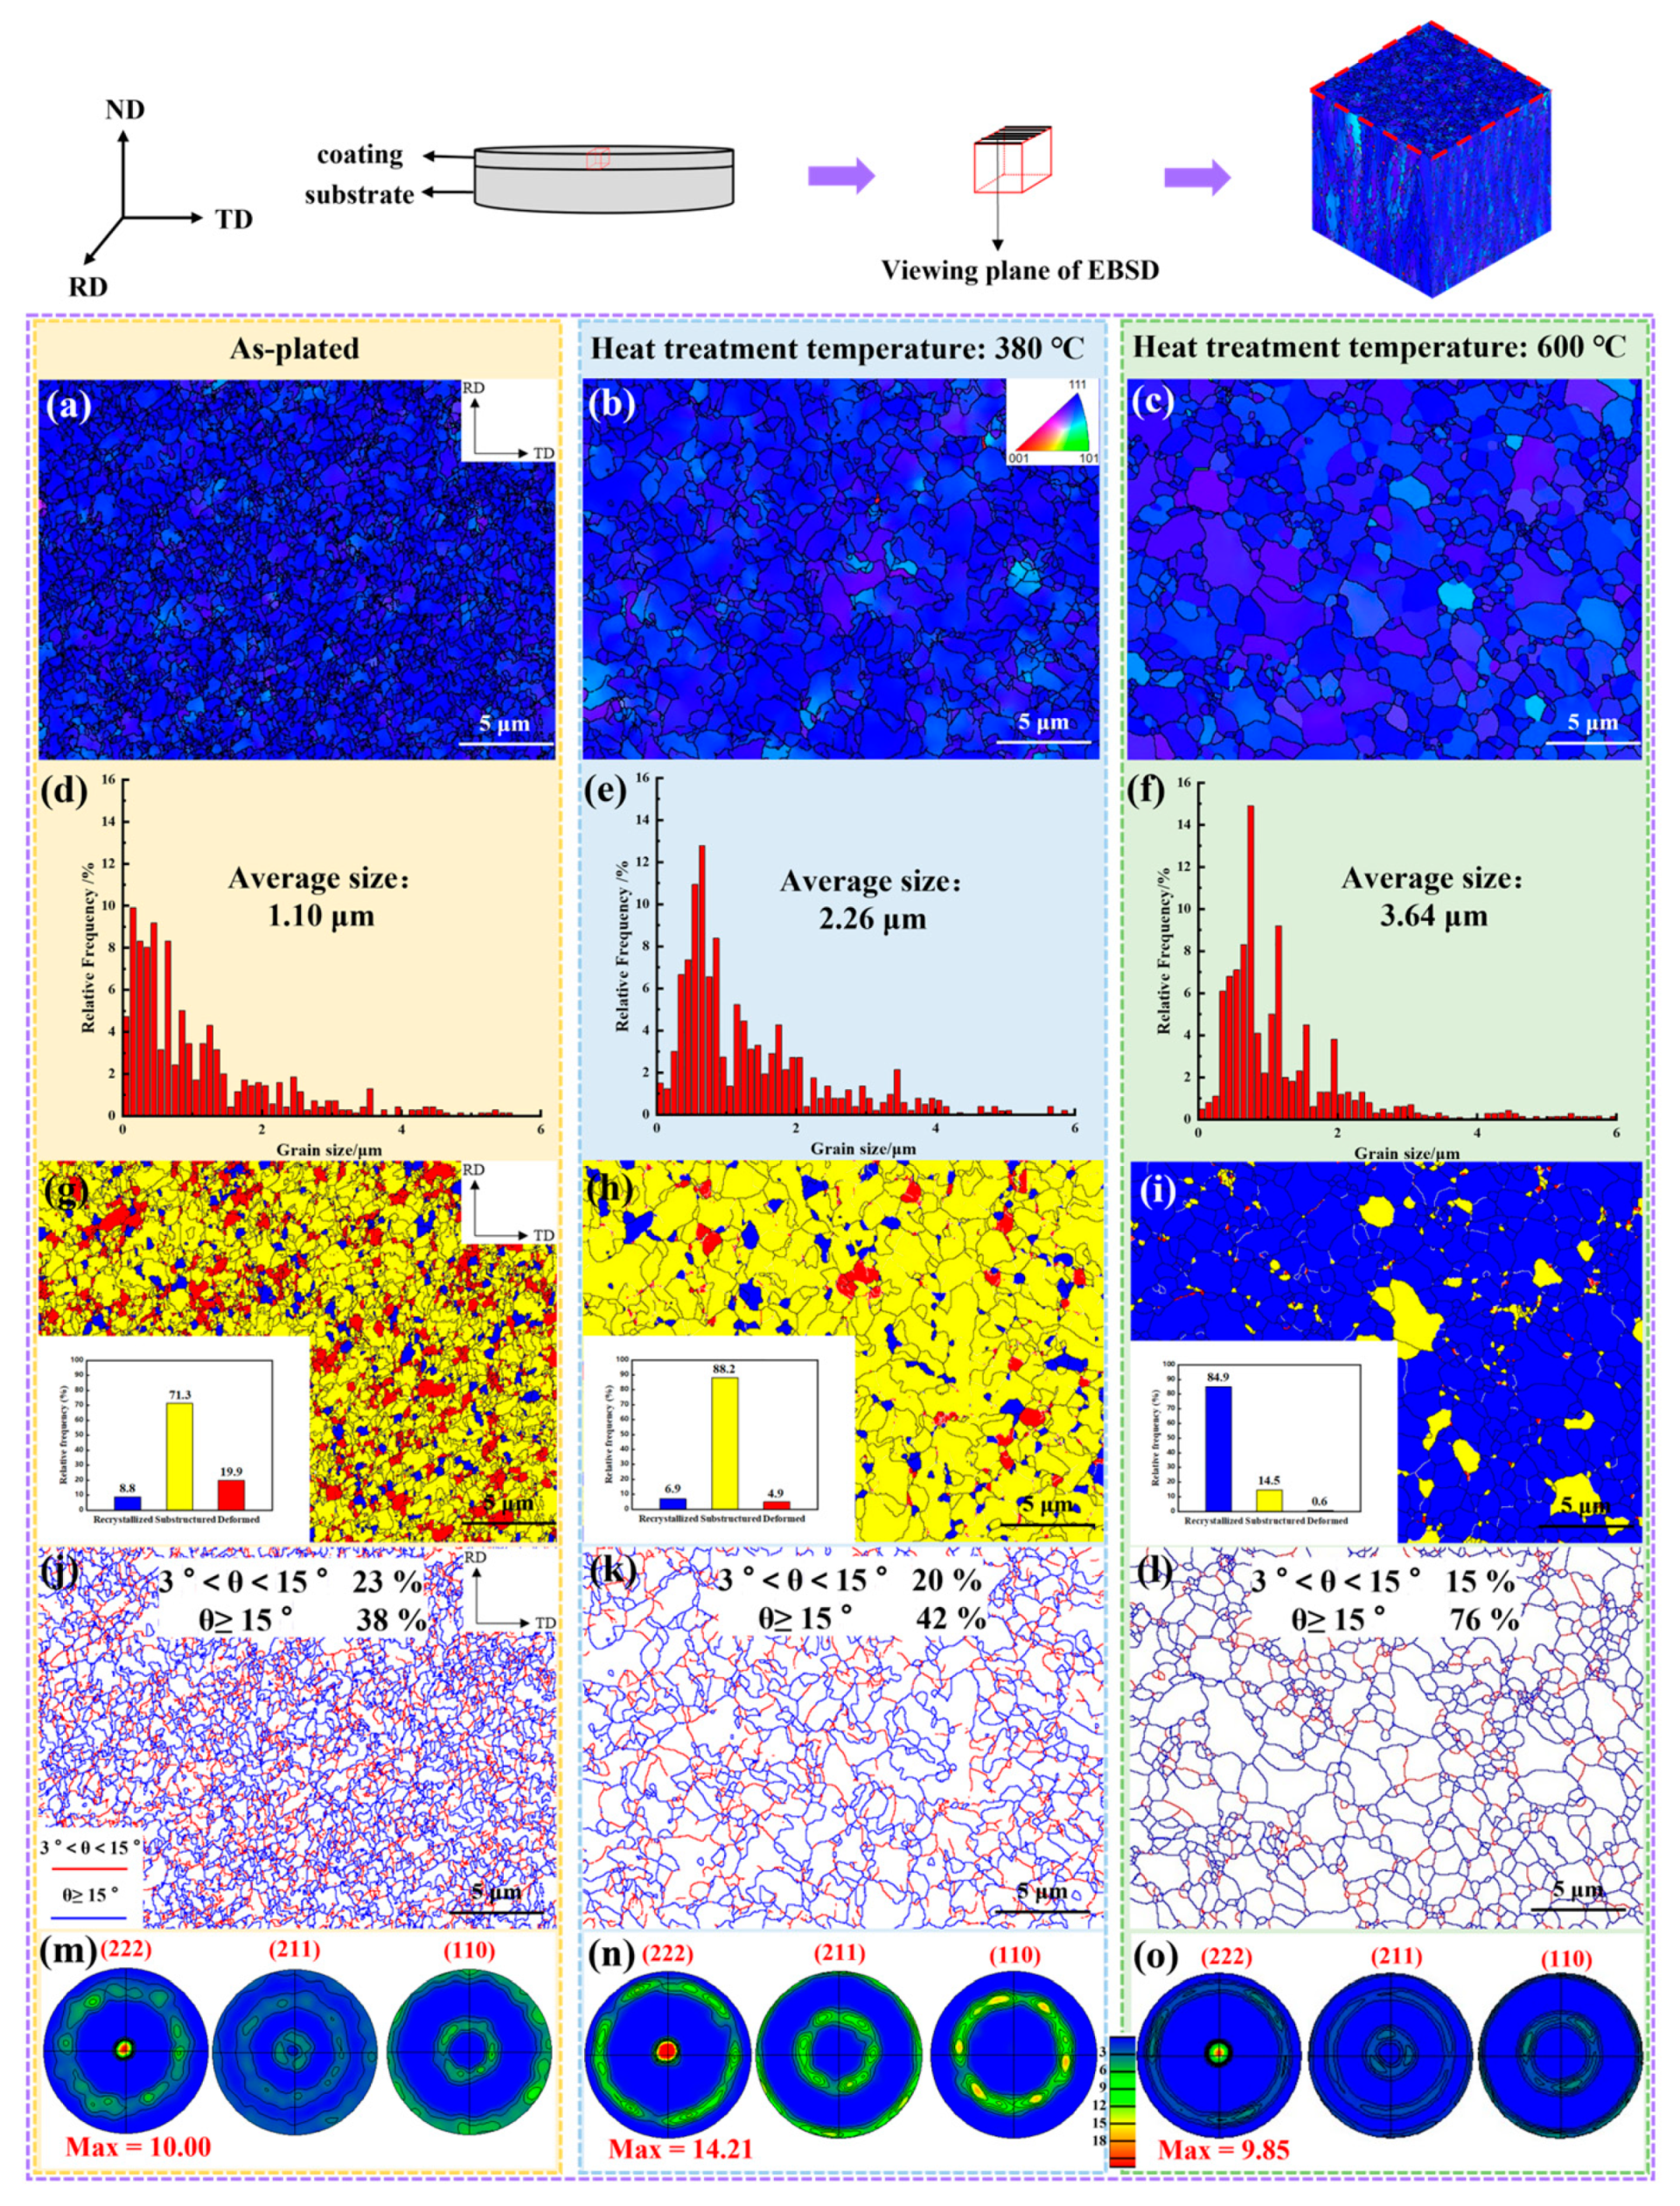
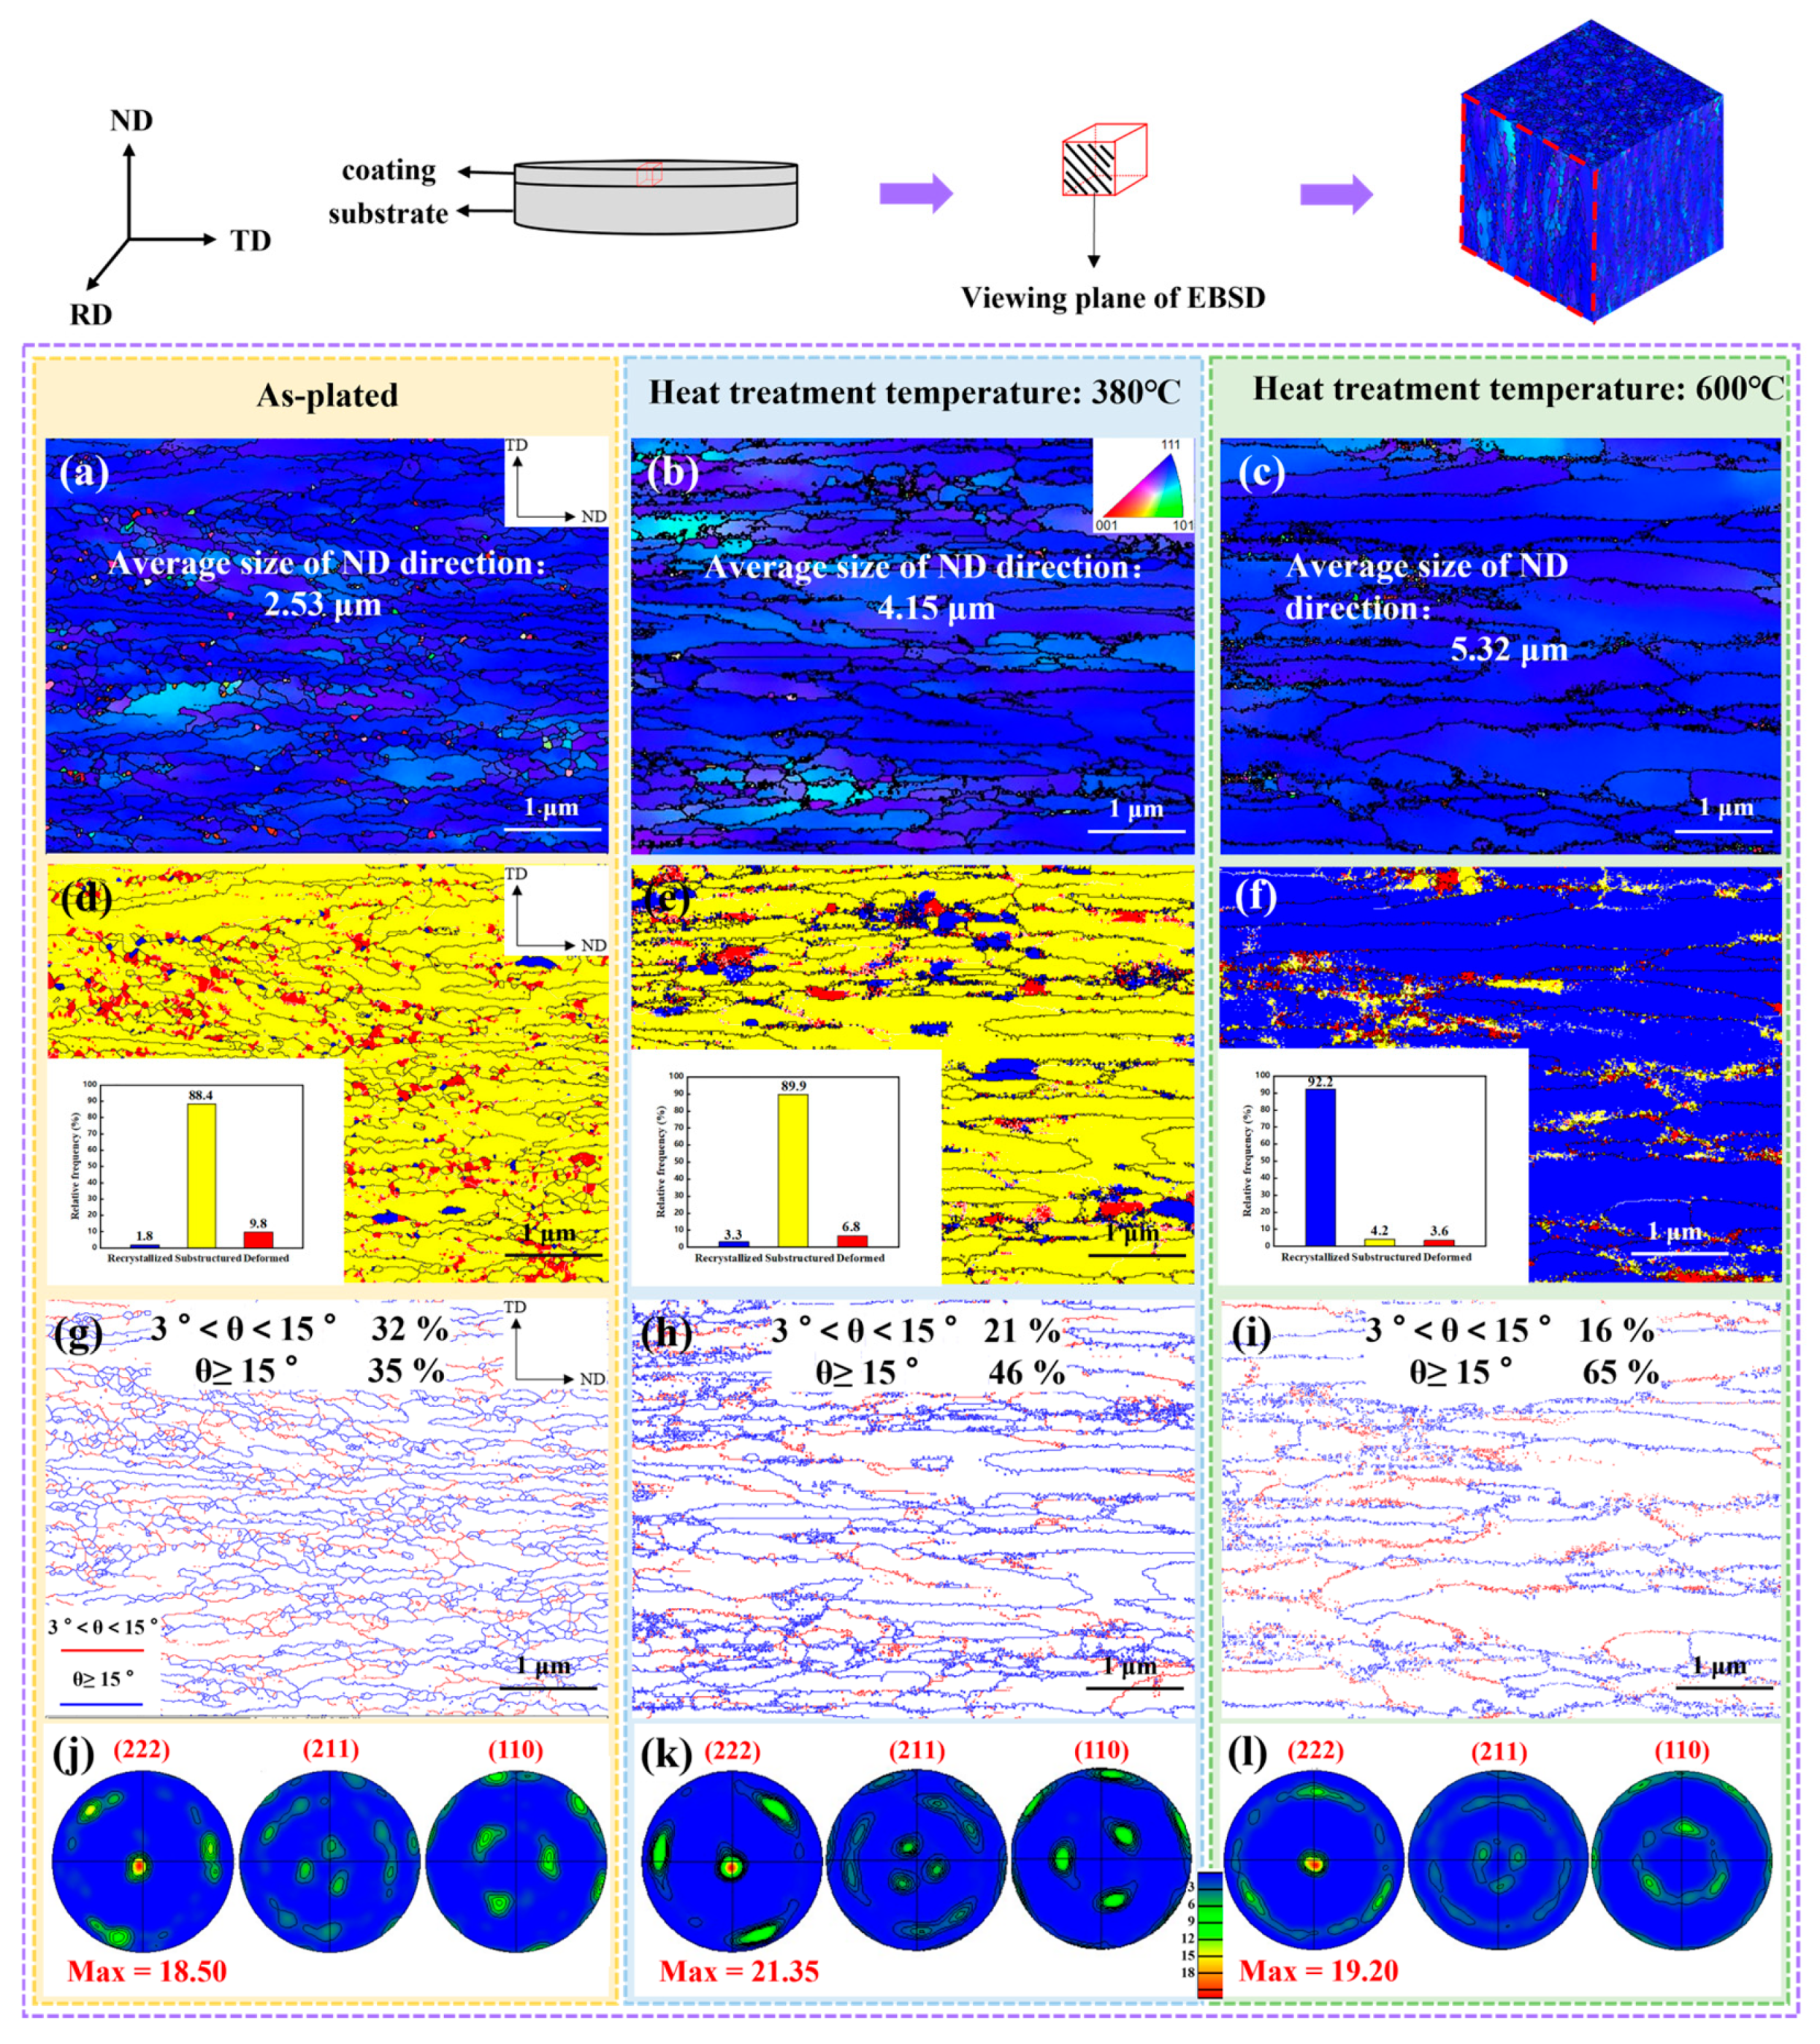
3.2.2. Microtexture
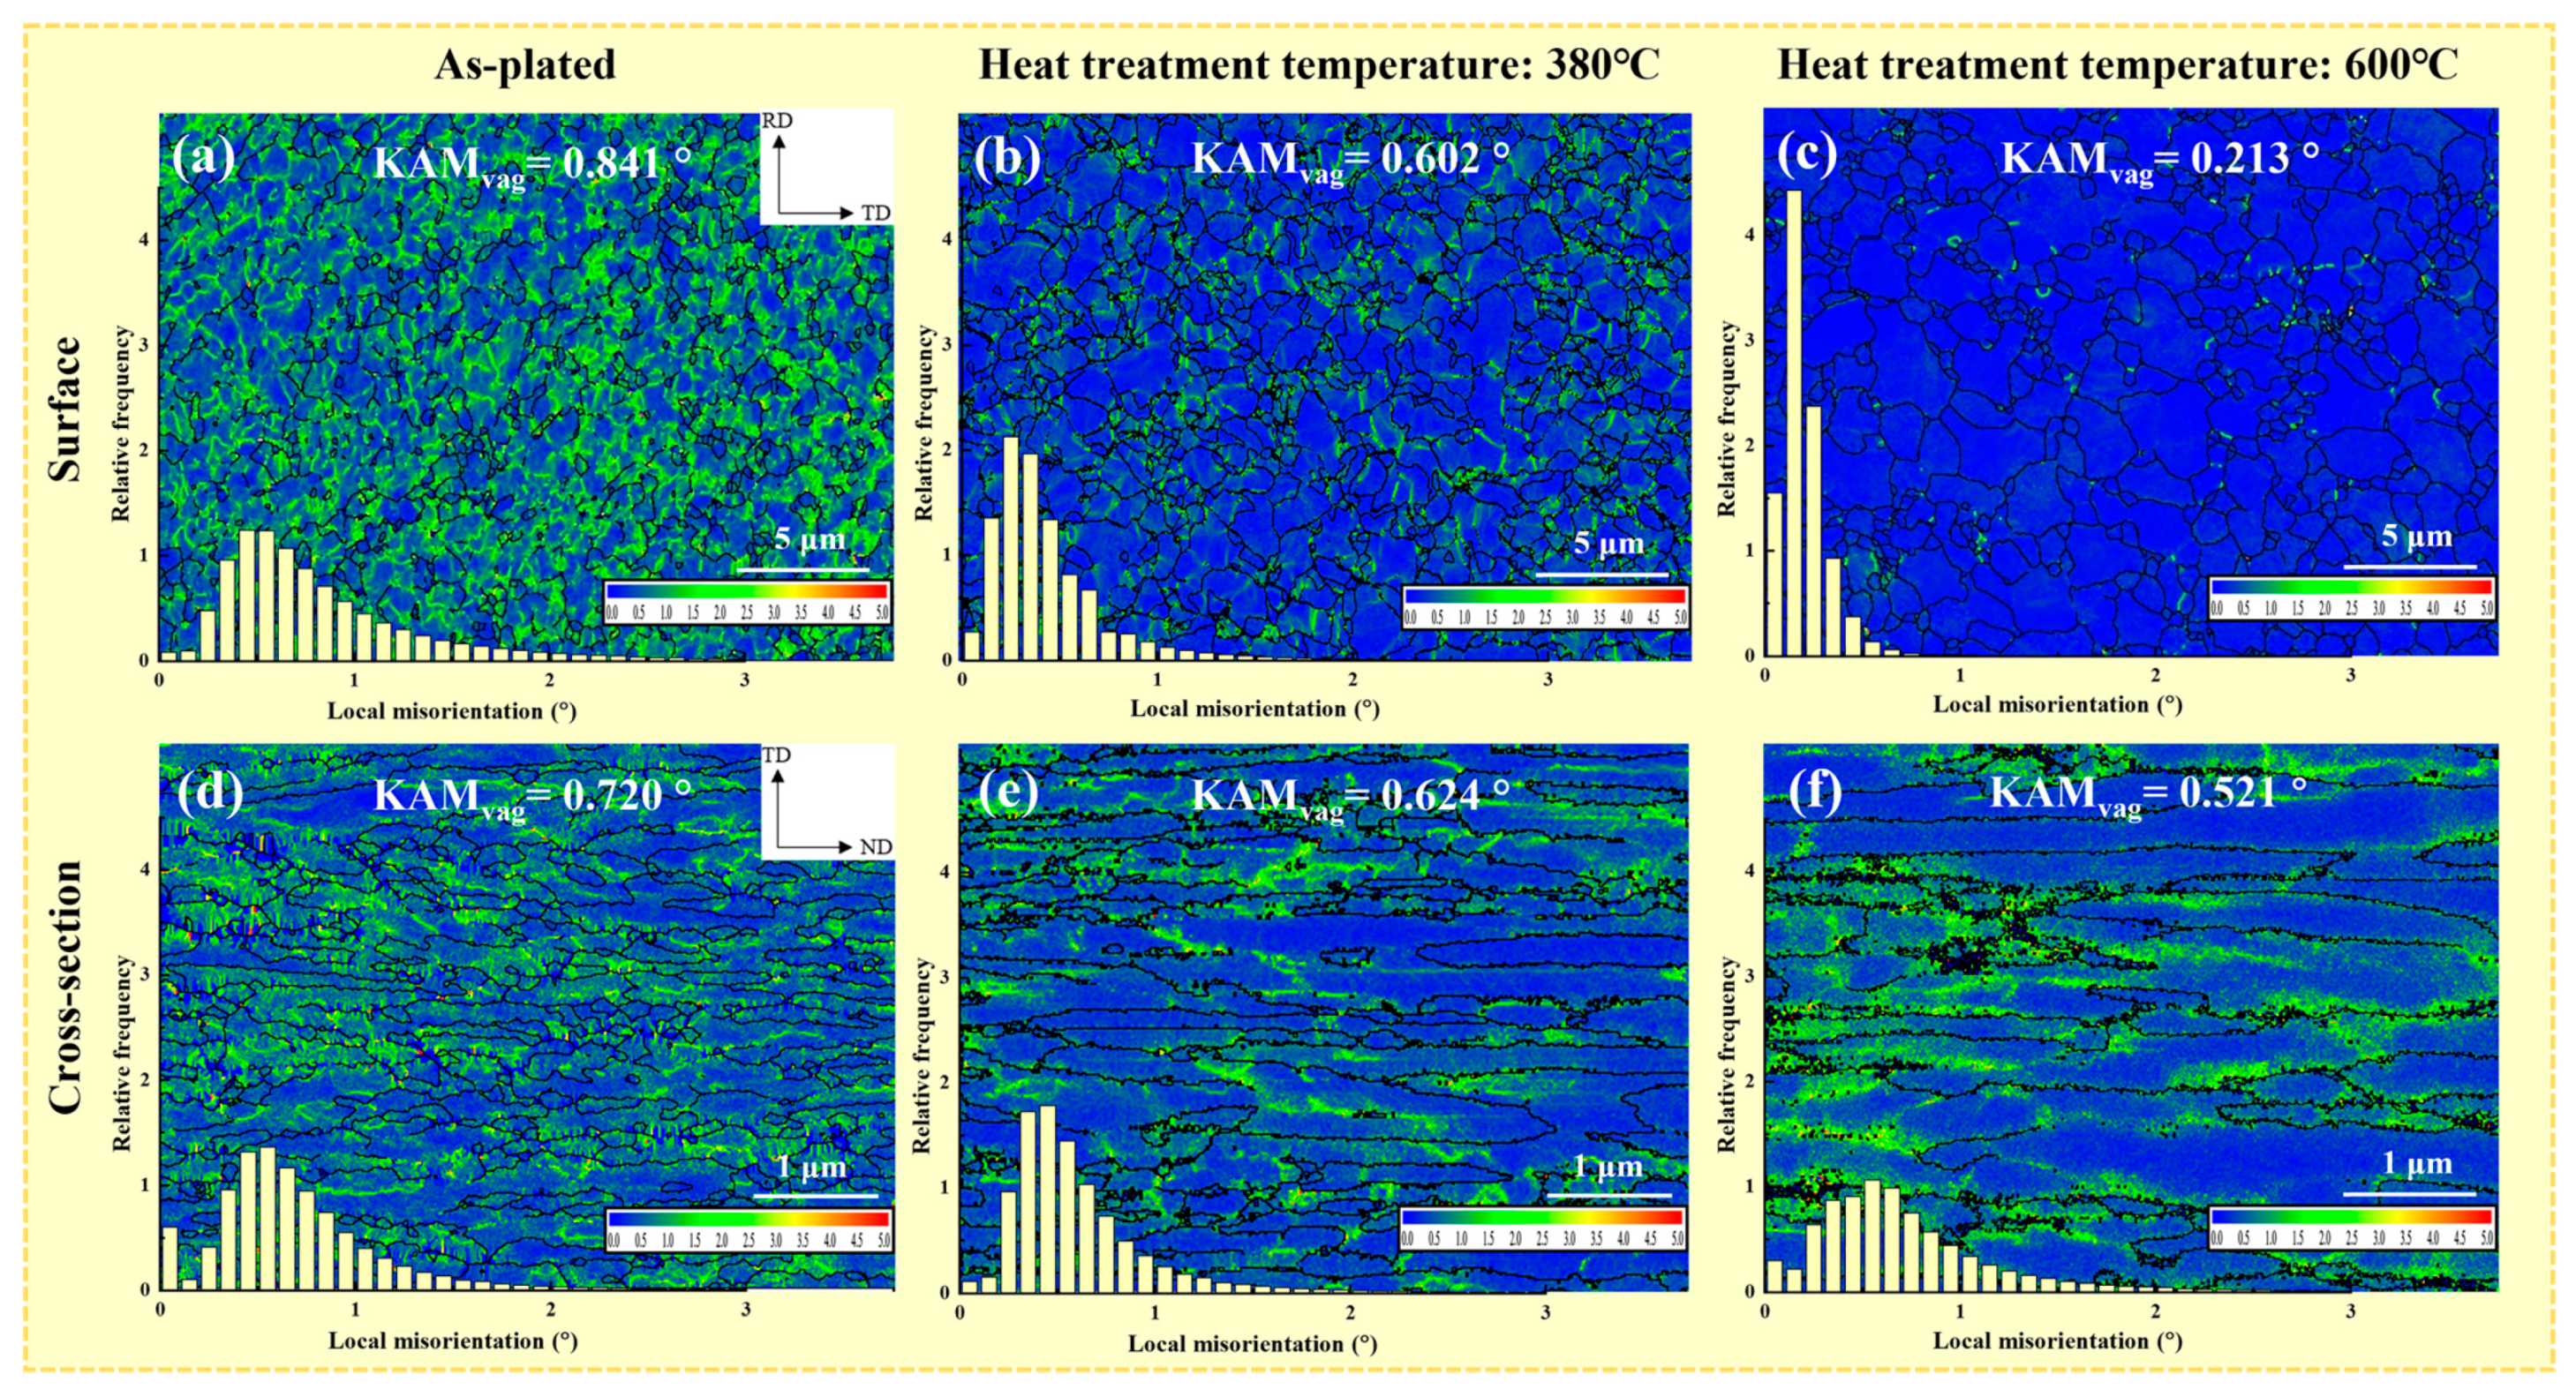
3.3. Microstructure
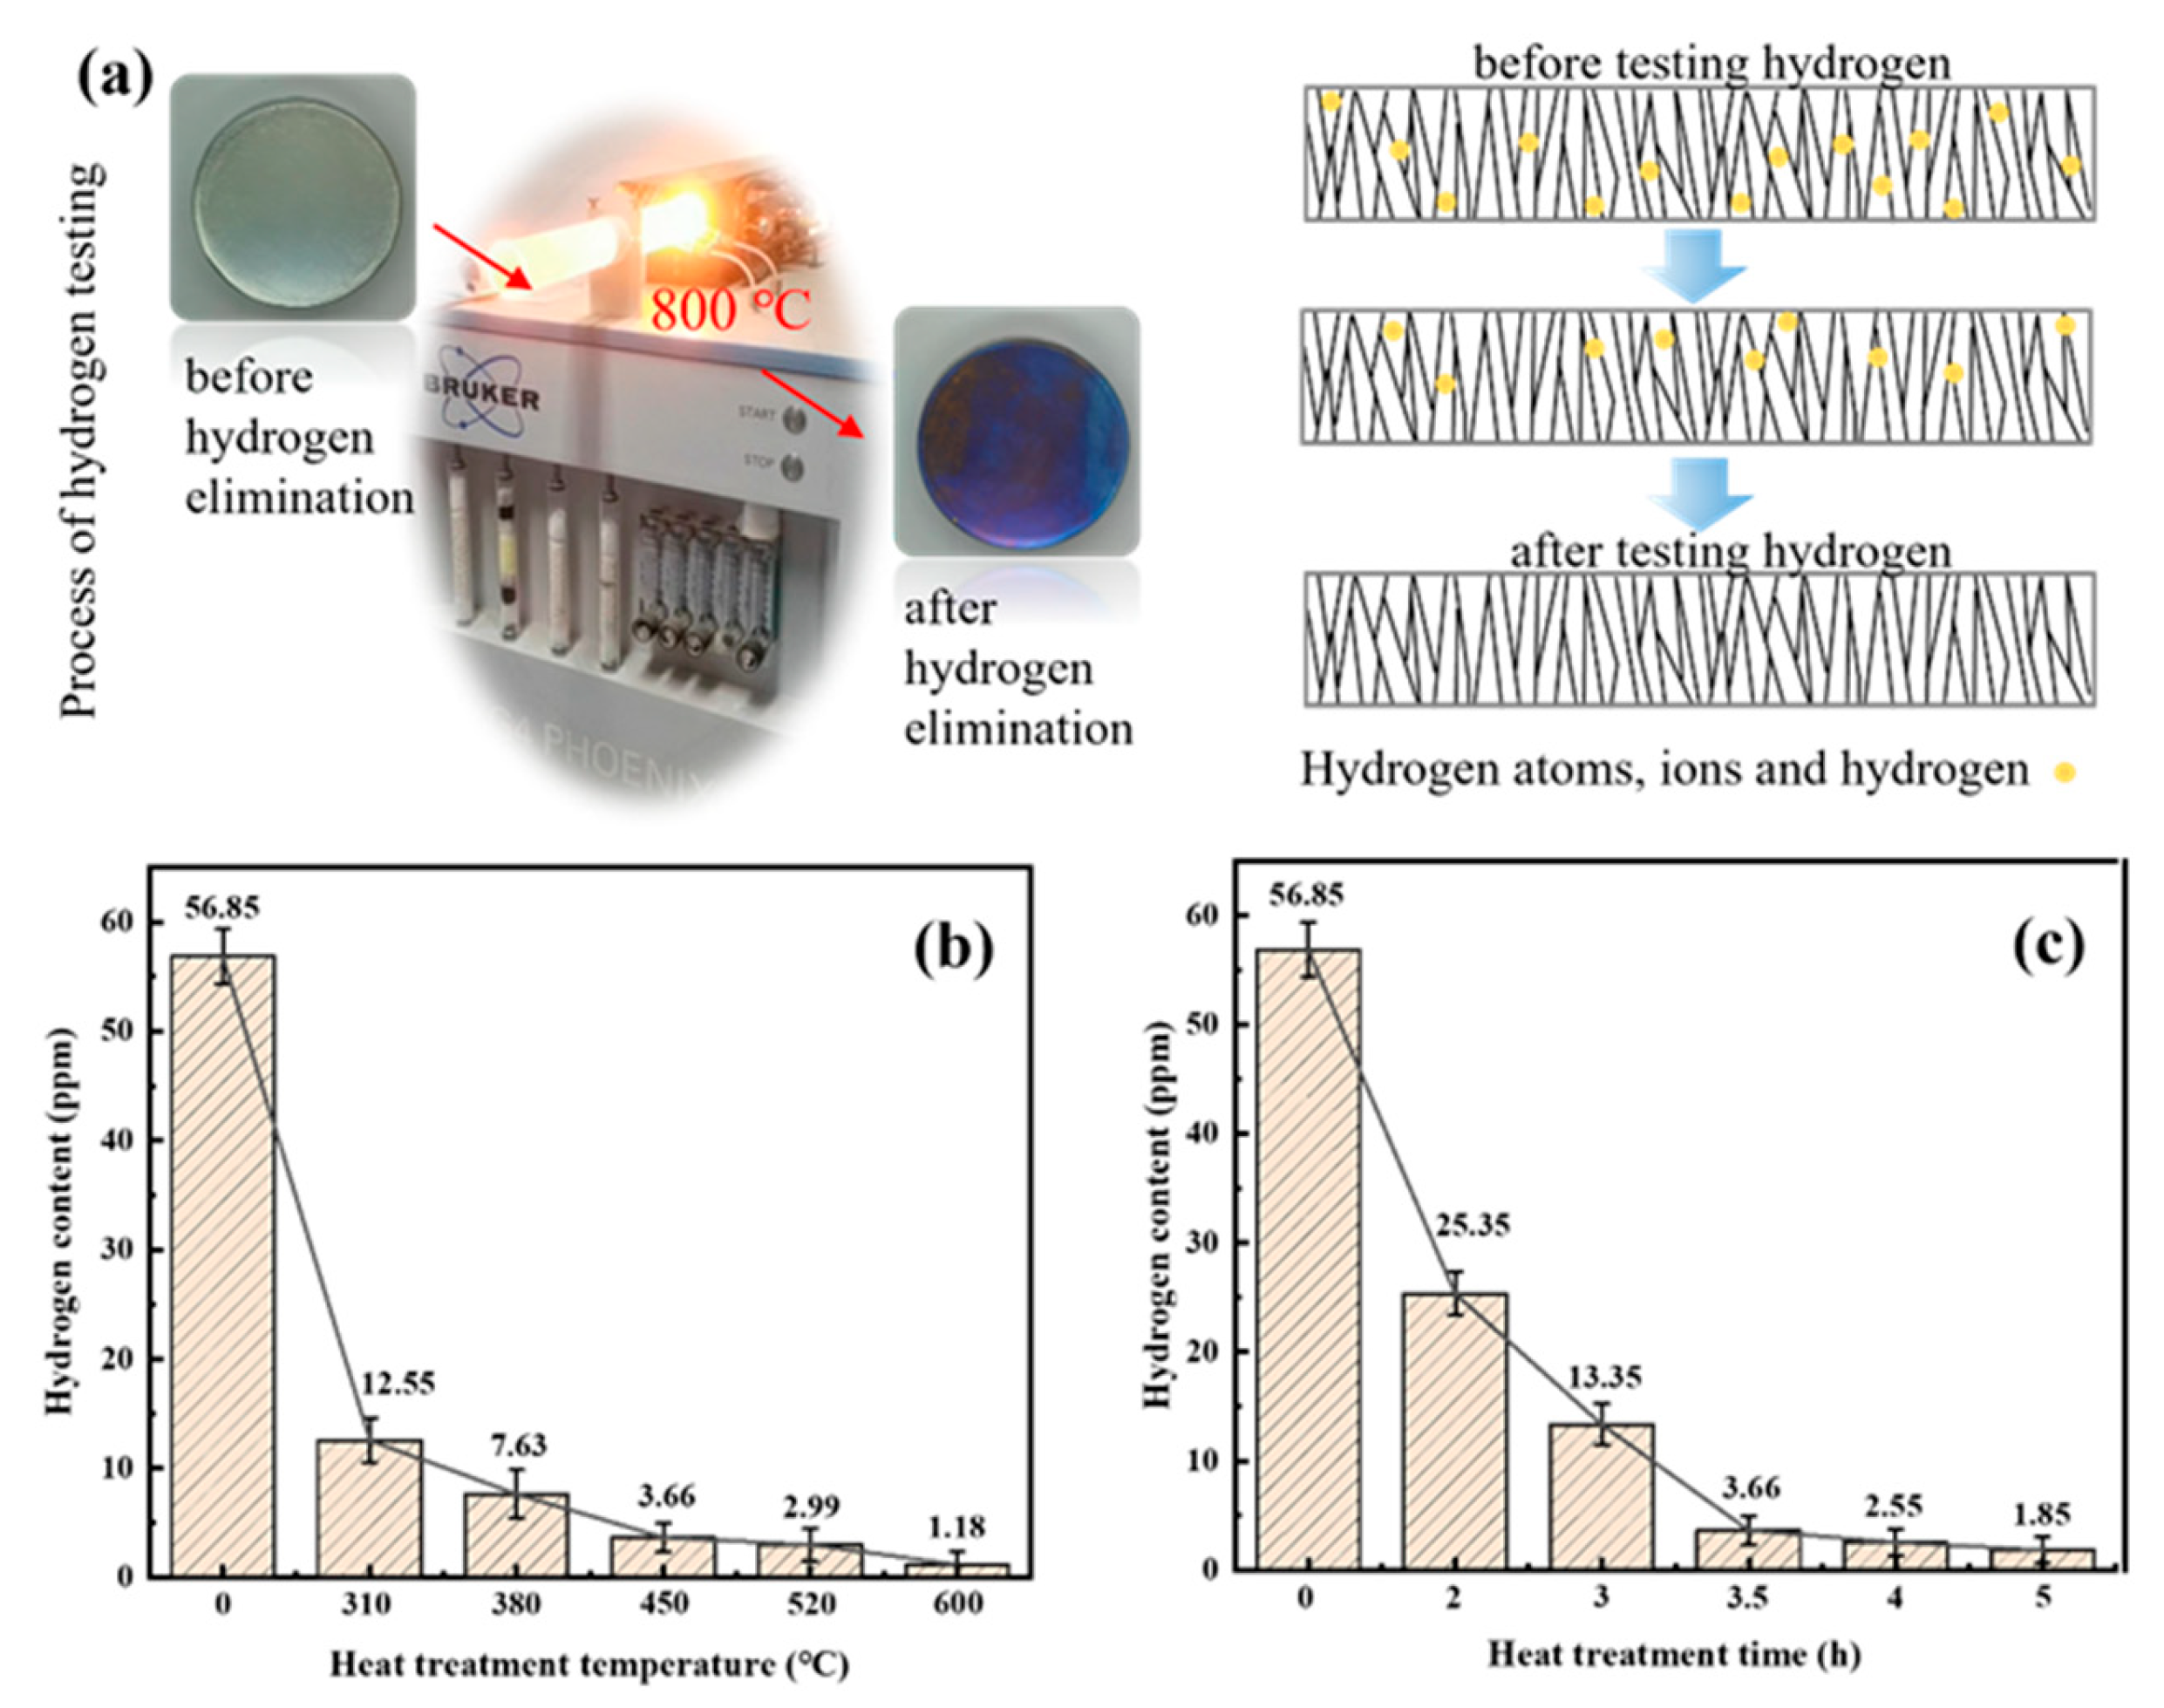
3.4. Hydrogen Content
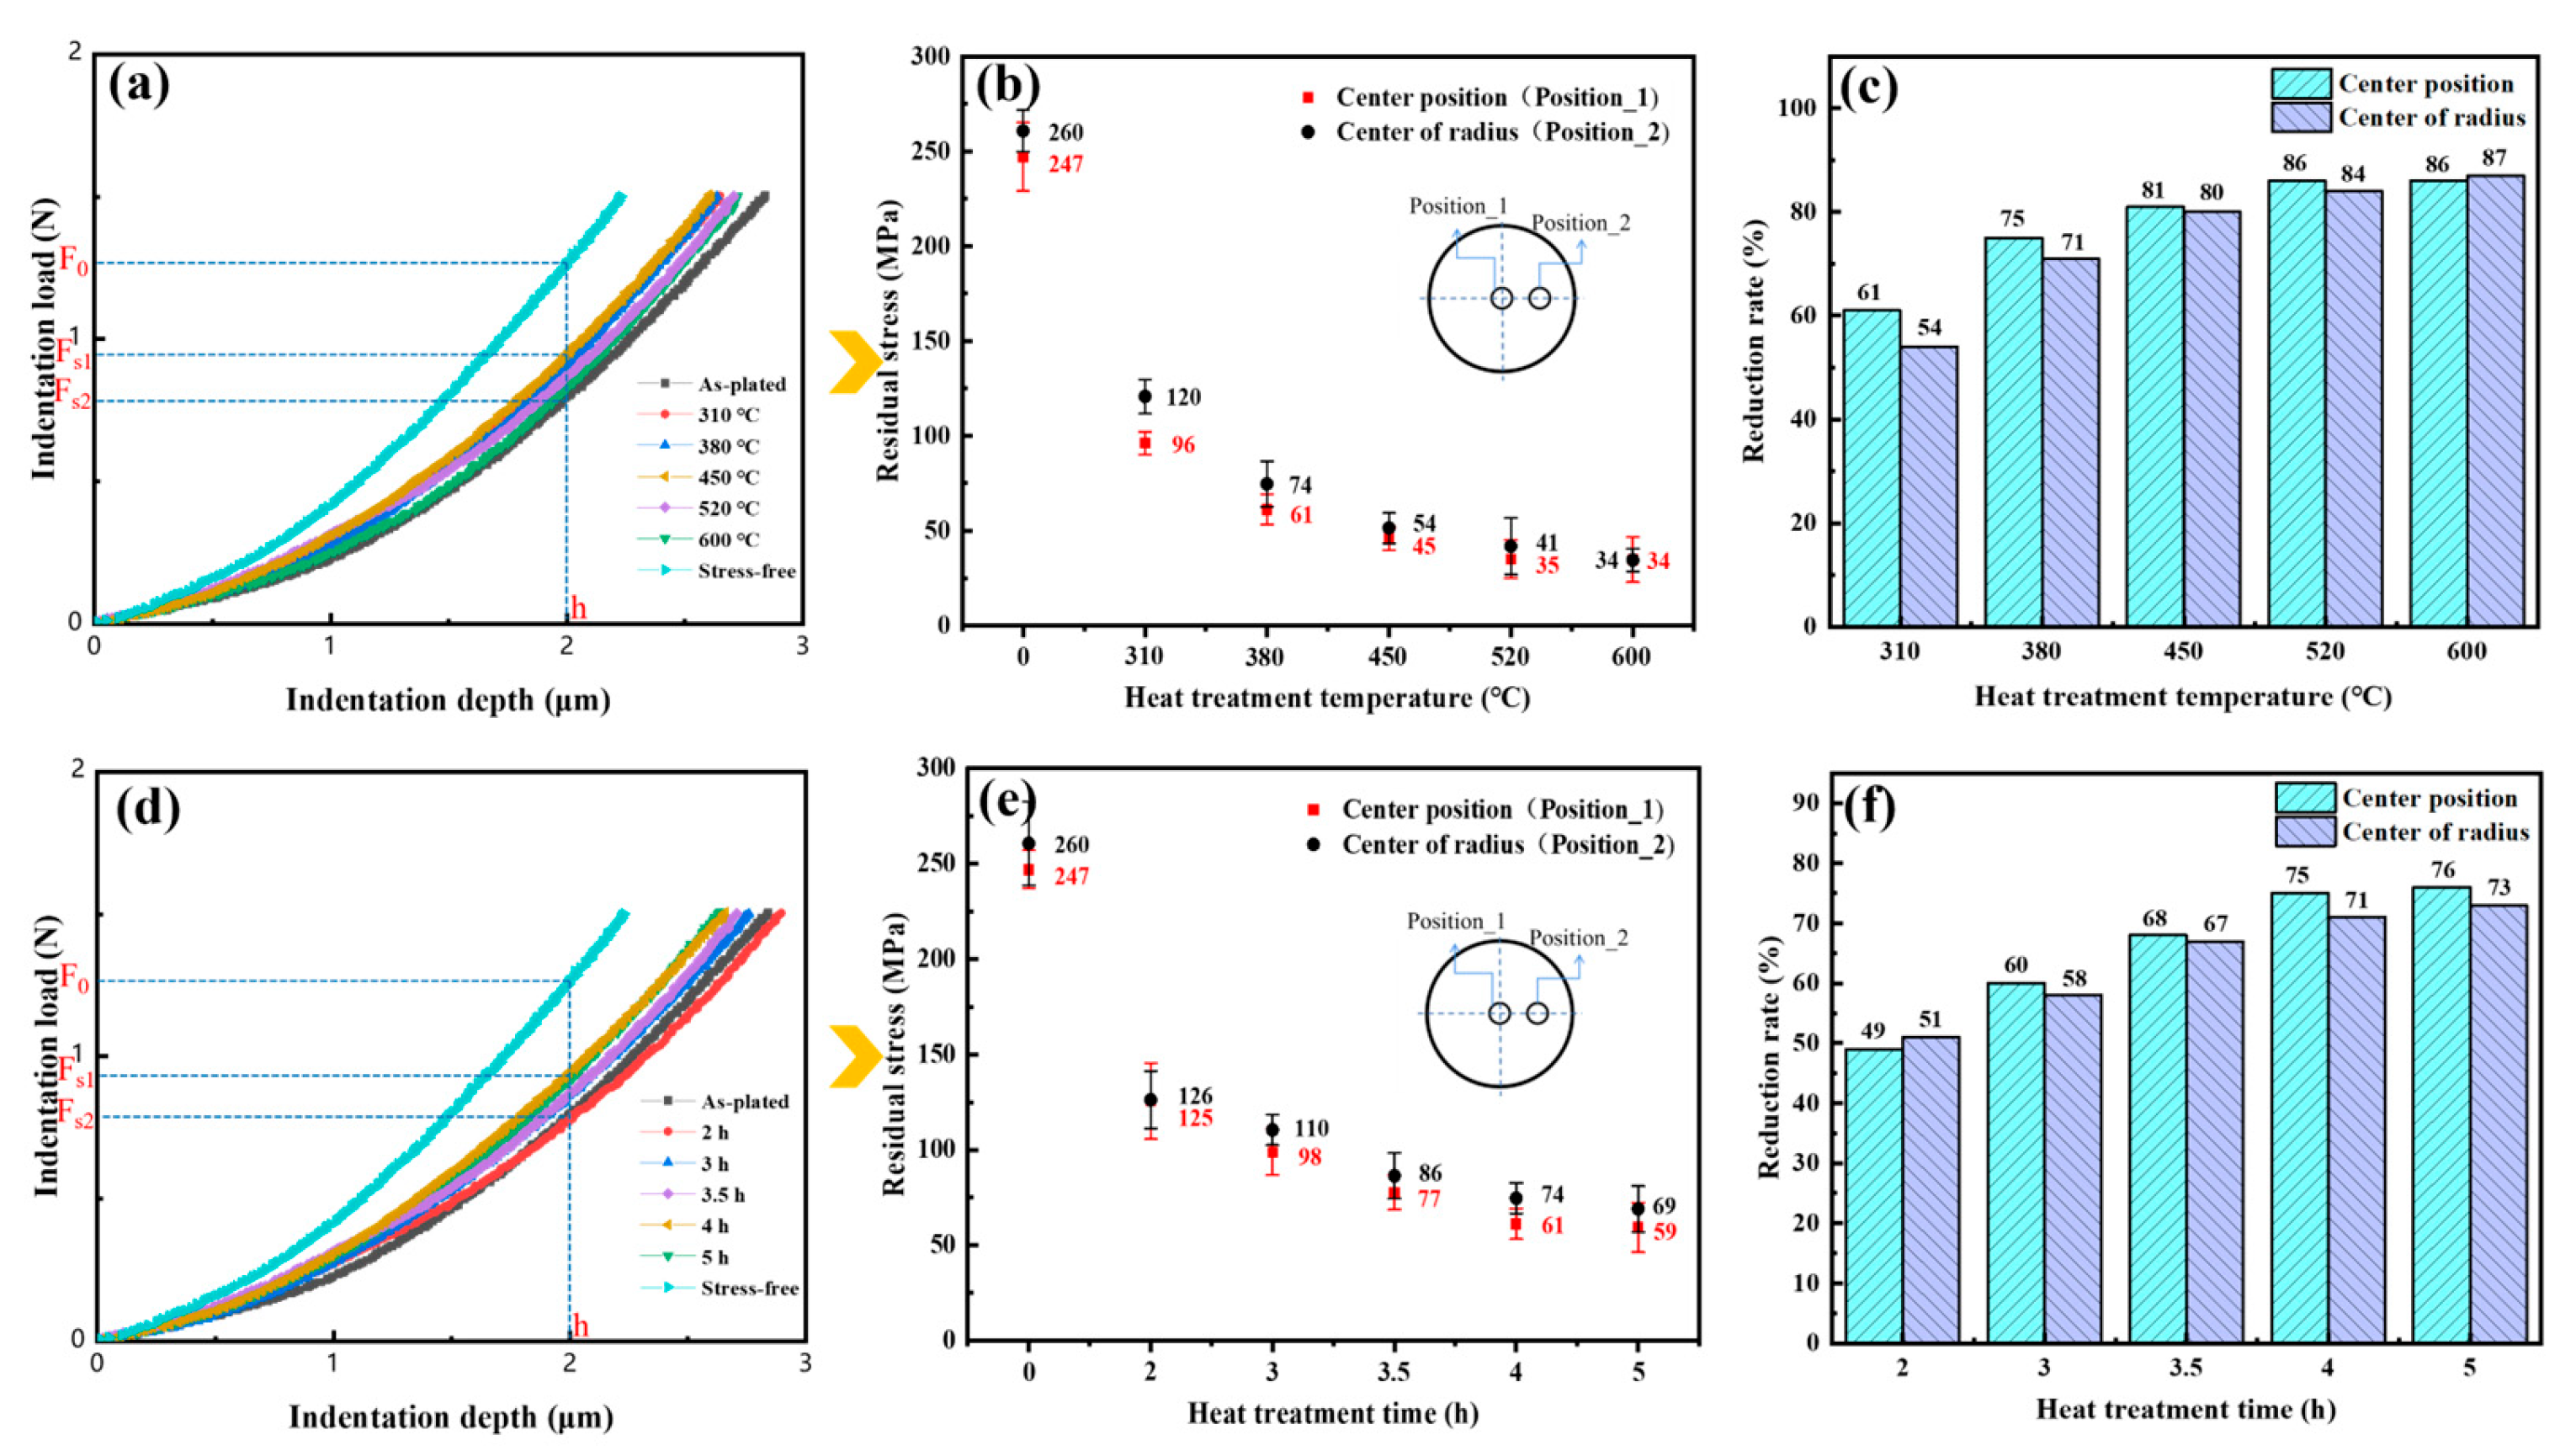
3.5. Residual Stress
3.6. Microhardness
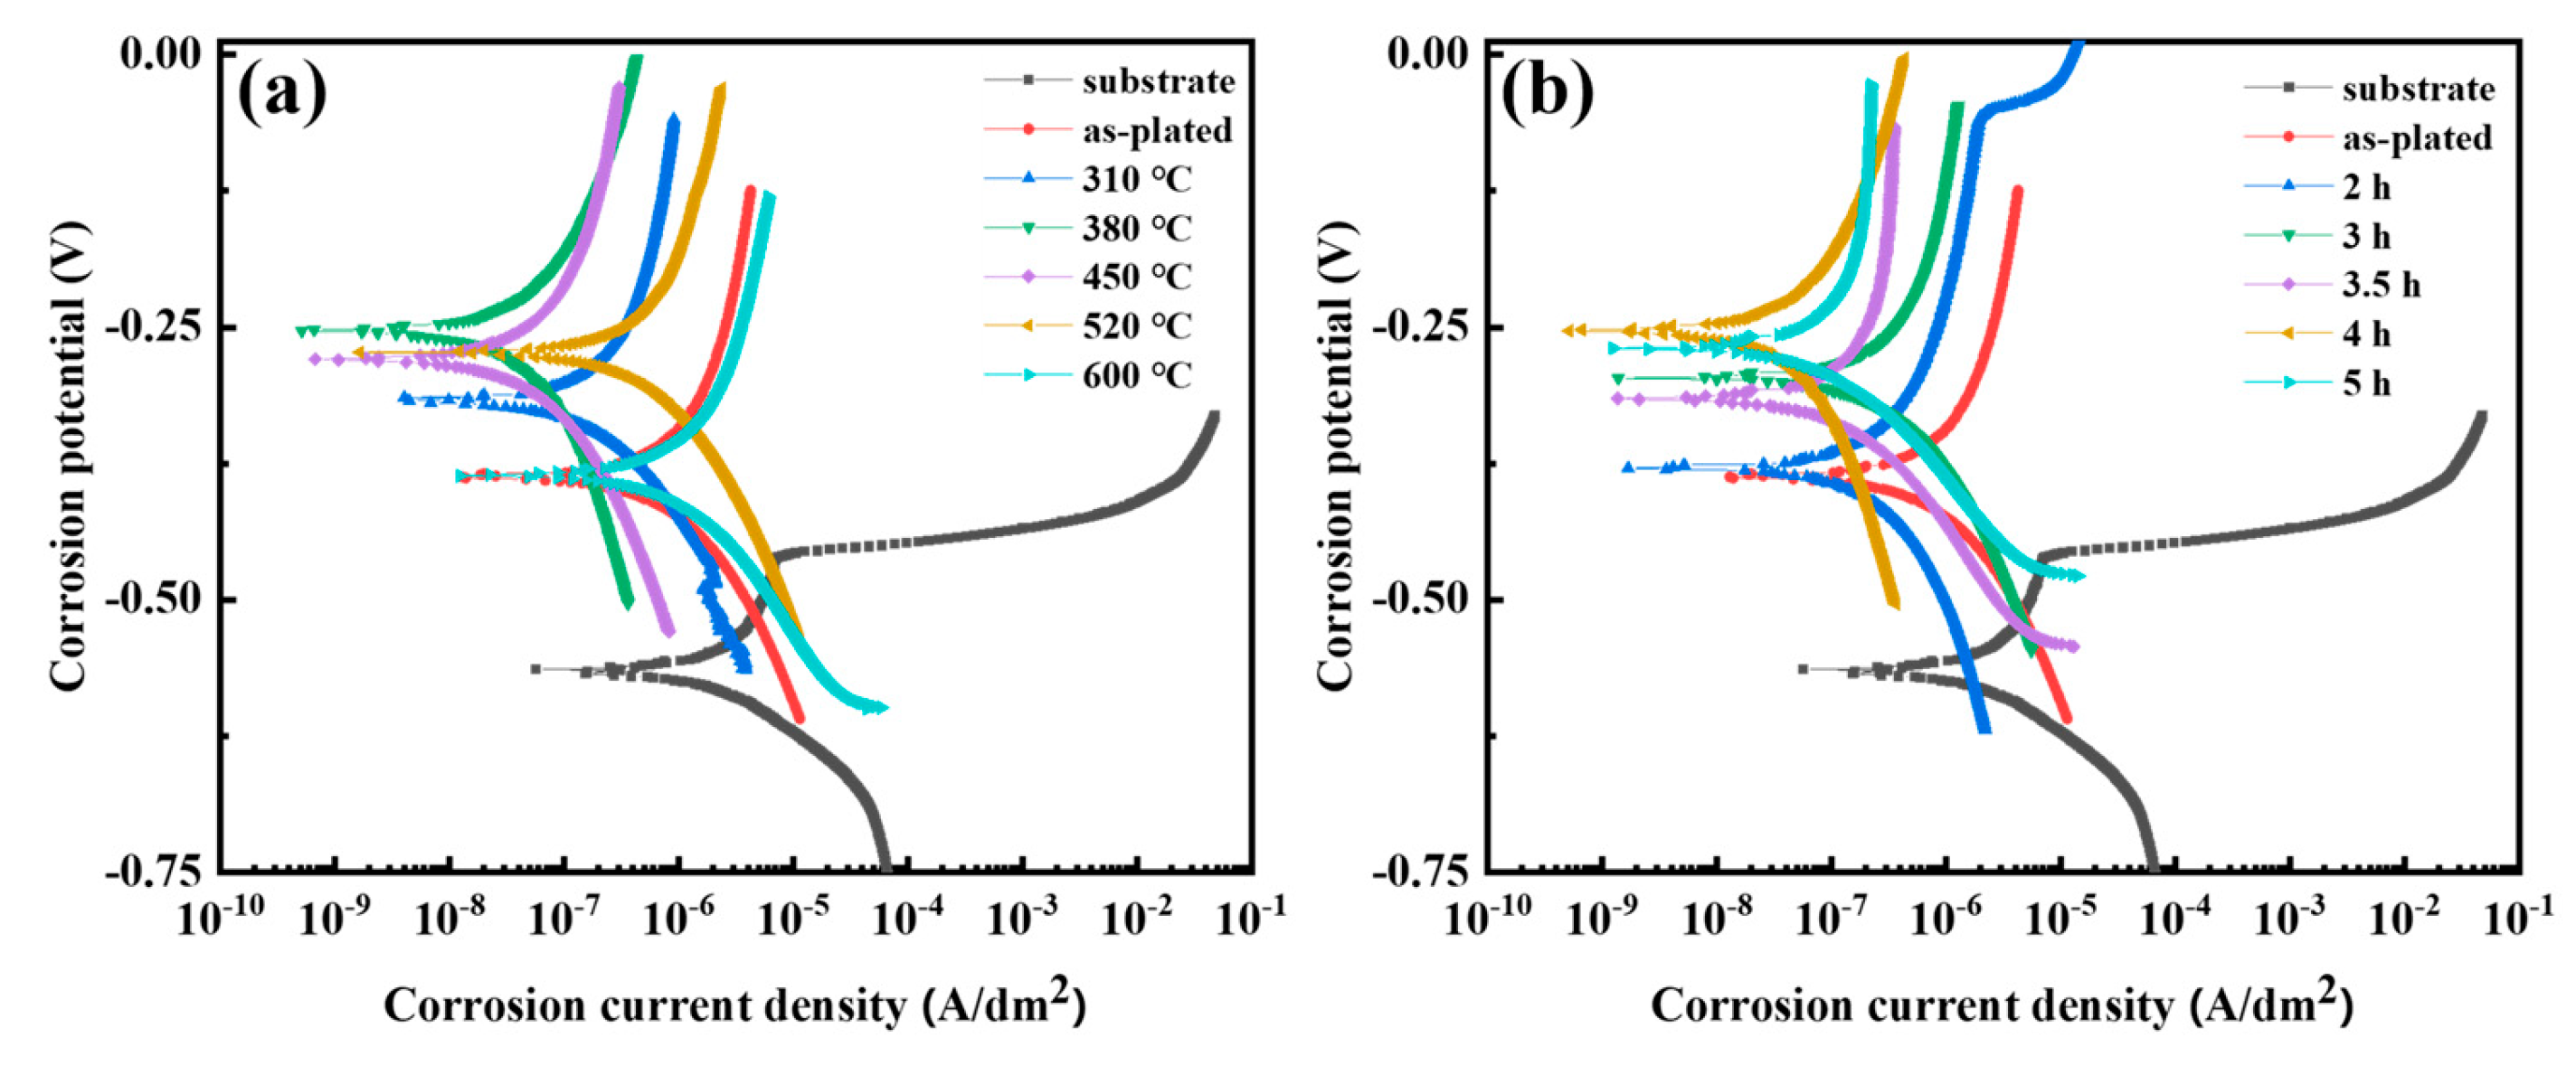
3.7. Corrosion Resistance
4. Discussion
4.1. Evolution of Texture
4.2. Influence of Microstructure on Hydrogen Content
4.3. Influence of Microstructure on Residual Stress
4.4. Influence of Microstructure on Corrosion Resistance
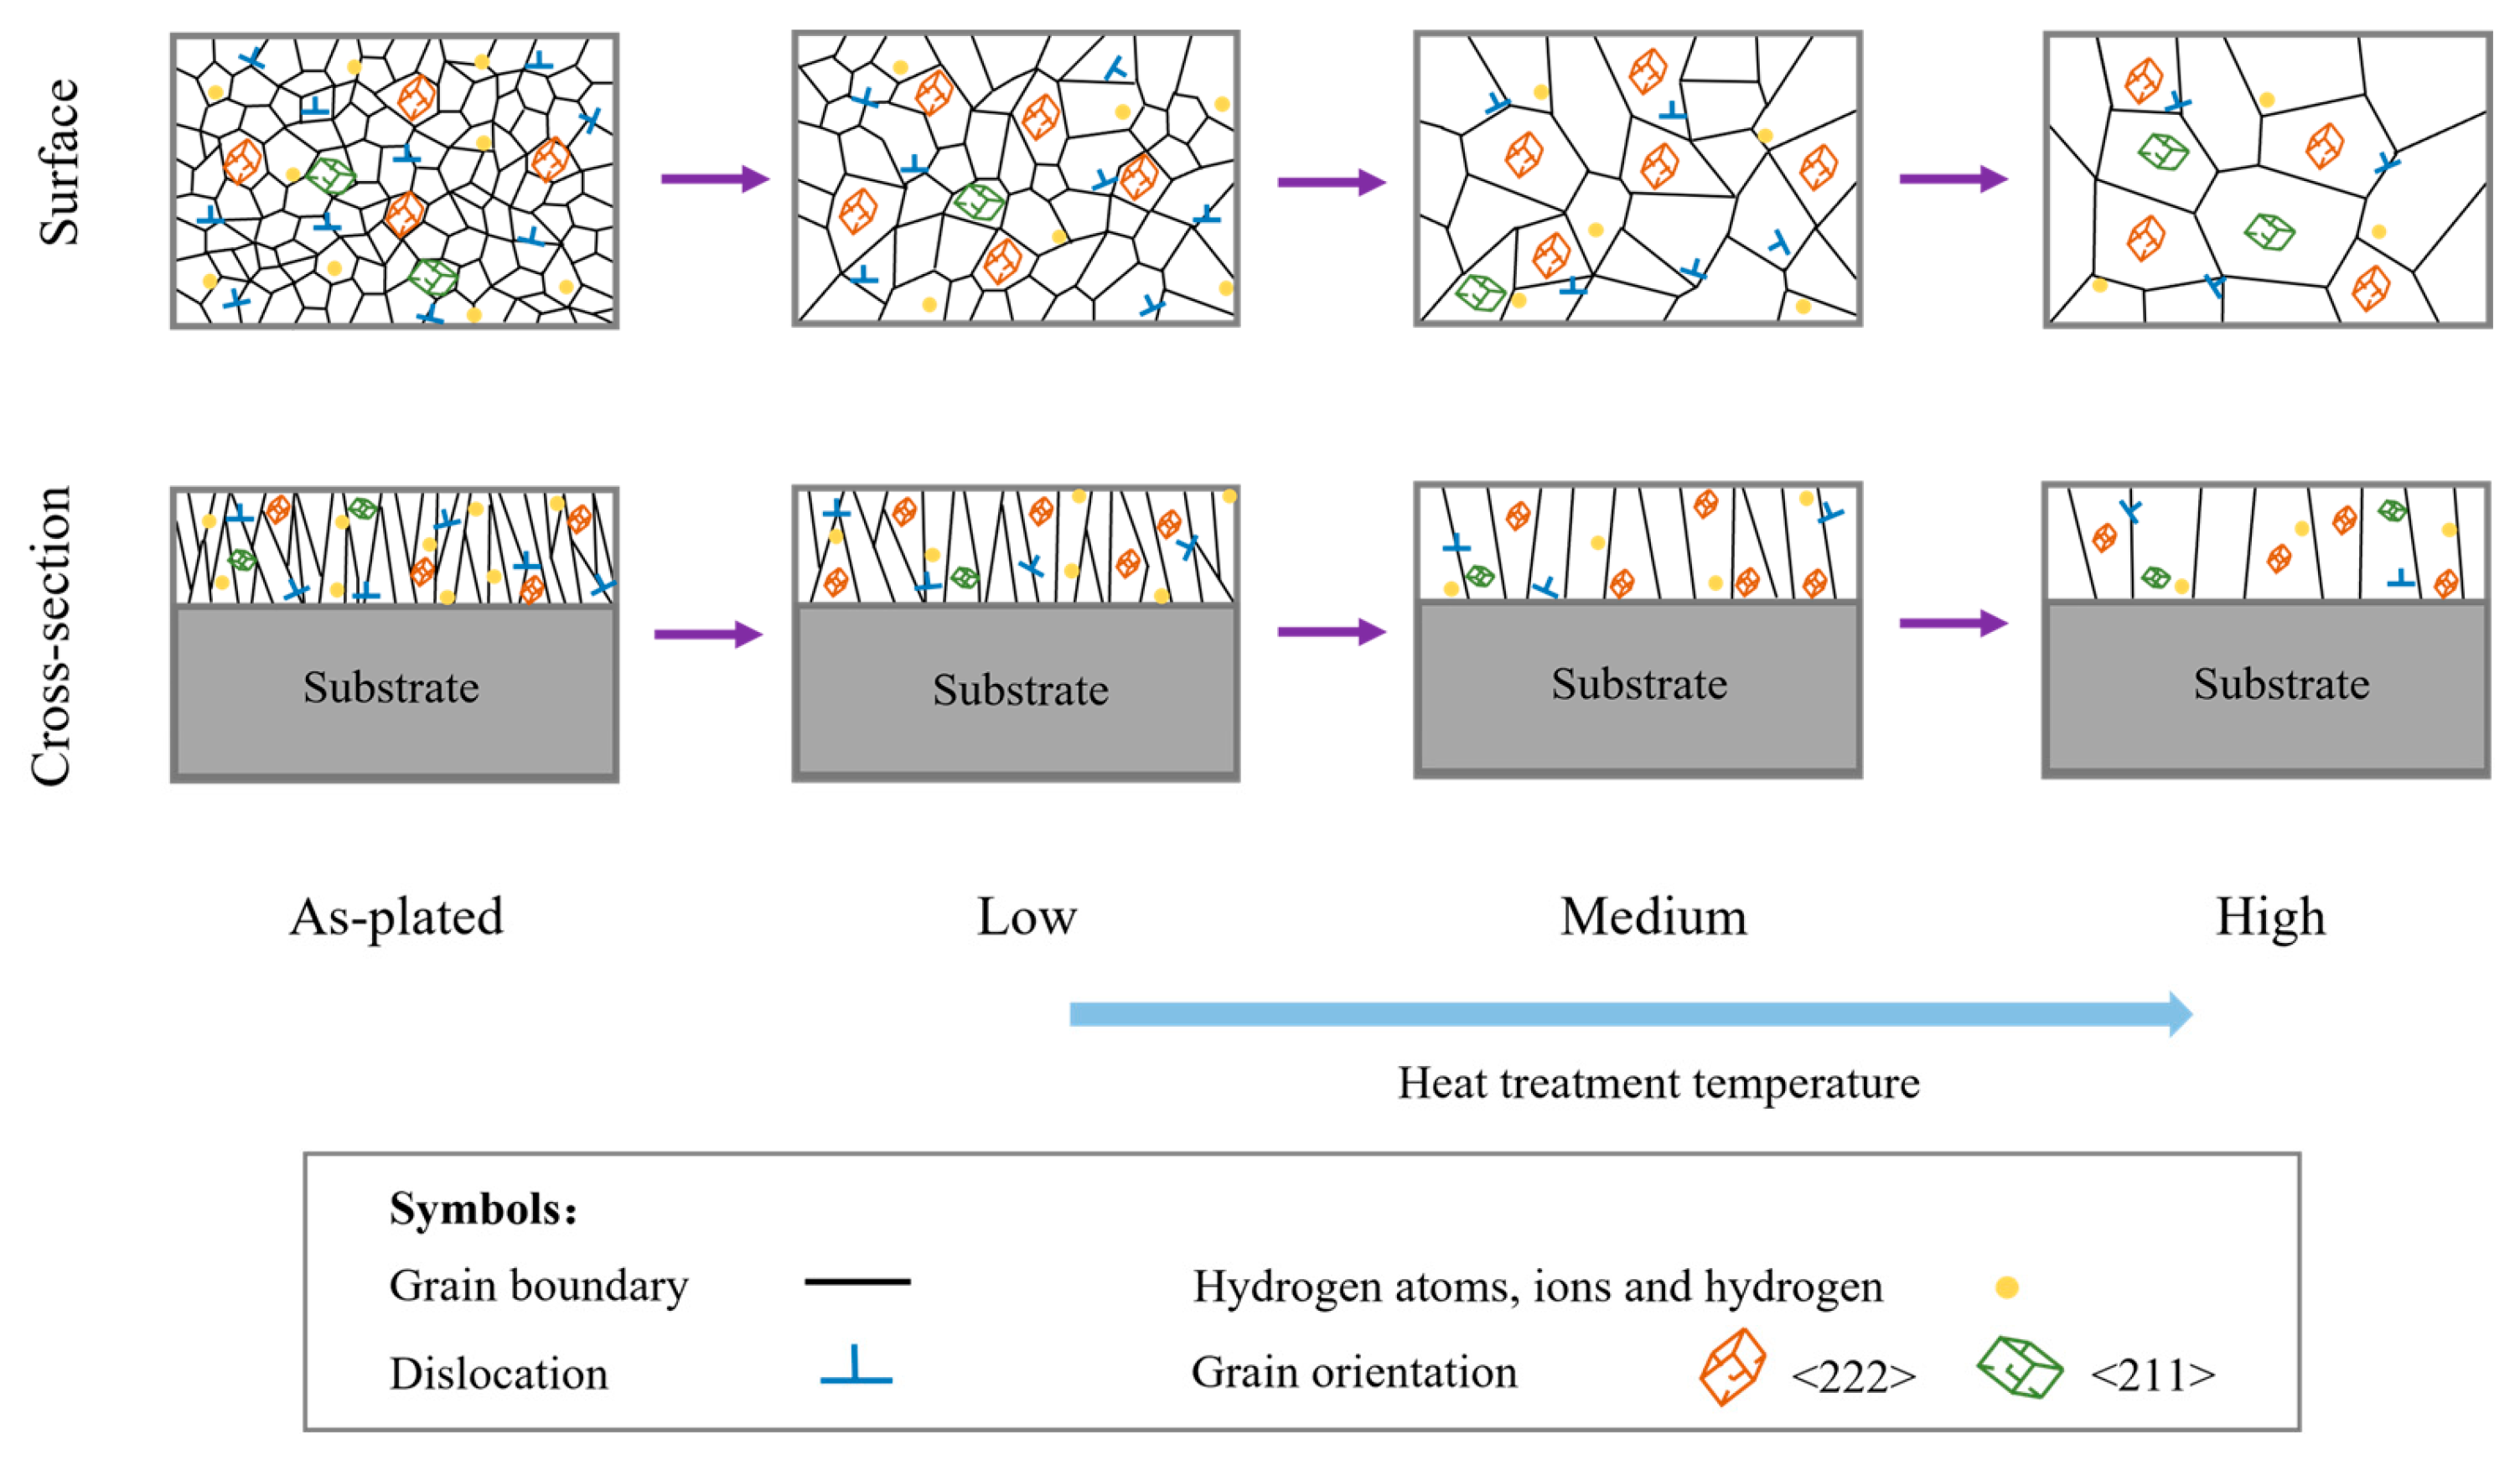
4.5. The Microstructure–Property Relationship
5. Conclusions
- (1)
- As the heat treatment temperature increased from 310 °C to 600 °C, the crack density decreased from 231/cm2 to 108/cm2. The grain size and the number of large angle boundaries subsequently increased and the dislocation density decreased.
- (2)
- The hydrogen adsorption in the as-plated state caused the coating to form a strong fiber texture on the (222) plane, and its texture strength increased and then decreased with increasing heat treatment temperature. When the heat treatment temperature was below 600 °C, the increase in the strength of the (222) texture promoted a decrease in the hydrogen content, residual stress and microhardness and an increase in the corrosion resistance. The heat treatment time had less effect on the crack density and texture strength.
- (3)
- The preferable heat treatment temperature and time were 380 °C and 4 h, respectively. In this process, the crack density, dislocation density, grain size and pole density value of the (222) plane were 219/cm2, 1.68 × 10¹⁵ m−2, 2.26 μm and 14.21, and the proportion of large angle boundaries and recovery microstructure were 42% and 88.2%, respectively. The hydrogen content, residual stress, microhardness and corrosion current density were found to be 7.63 ppm, 61 MPa, 865 HV and 1.798 × 10⁻⁶ A/dm2, respectively. The reduction rates of the residual stress and hydrogen content compared to the as-plated state were 86% and 75%.
- (4)
- In our future research on the changing laws of coating properties caused by heat treatment, we can judge to a certain extent whether the heat treatment process is reasonable or not by only measuring the macrotexture.
Author Contributions
Funding
Institutional Review Board Statement
Informed Consent Statement
Data Availability Statement
Conflicts of Interest
References
- Liu, Y.; Wu, M.; Zhang, Z.; Wang, Y.; Meng, L.; Cai, K.; Zhu, H.; Xu, K.; Lu, J. Preparation of Multifunctional Protective Coating on Alloy Surface by Laser-Electrodeposition Additive-Subtractive Hybrid Manufacturing. J. Mater. Process. Technol. 2024, 326, 118340. [Google Scholar] [CrossRef]
- Wu, W.; Huang, J.; Näther, J.; Omar, N.A.B.; Köster, F.; Lampke, T.; Liu, Y.; Pan, H.; Zhang, Y. Texture Orientation, Morphology and Performance of Nanocrystalline Nickel Coatings Electrodeposited from a Watts-Type Bath: Effects of H3BO3 Concentration and Plating Time. Surf. Coat. Technol. 2021, 424, 127648. [Google Scholar] [CrossRef]
- Arévalo-Cid, P.; Vaz, M.F.; Montemor, M.F. Highly Porous FeNi 3D Foams Produced by One-Step Electrodeposition: Electrochemical Stability and Mechanical Properties. Mater. Charact. 2022, 193, 112311. [Google Scholar] [CrossRef]
- Mukhtar, A.; Wu, K. Coupled Electrodeposition and Magnetic Properties of Ternary CoFeW Alloys. Mater. Charact. 2022, 192, 112246. [Google Scholar] [CrossRef]
- Mohsenifar, F.; Ebrahimifar, H.; Irannejad, A. Applying the Protective Mn–Co–La2O3 Coating on Crofer 22 APU Ferritic Stainless Steel Used as Solid Oxide Fuel Cell Interconnects. Acta Metall. Sin. Engl. Lett. 2024, 37, 872–888. [Google Scholar] [CrossRef]
- Yin, Z.-Z.; Zhang, Z.-Q.; Tian, X.-J.; Wang, Z.-L.; Zeng, R.-C. Corrosion Resistance and Durability of Superhydrophobic Coating on AZ31 Mg Alloy via One-Step Electrodeposition. Acta Metall. Sin. Engl. Lett. 2021, 34, 25–38. [Google Scholar] [CrossRef]
- Gu, W.; Yang, S.; Zhang, S.; Pei, Z.; Xue, W.; Duan, D.; Gong, J.; Sun, C. High-Speed Rubbing Behavior of Abrasive Coating Coated on Titanium Alloy Blade Tips. Acta Metall. Sin. Engl. Lett. 2024, 37, 749–762. [Google Scholar] [CrossRef]
- Imaz, N.; Ostra, M.; Vidal, M.; Díez, J.A.; Sarret, M.; García-Lecina, E. Corrosion Behaviour of Chromium Coatings Obtained by Direct and Reverse Pulse Plating Electrodeposition in NaCl Aqueous Solution. Corros. Sci. 2014, 78, 251–259. [Google Scholar] [CrossRef]
- Imanieh, I.; Yousefi, E.; Dolati, A.; Mohammadi, M.R. Experiments Design for Hardness Optimization of the Ni-Cr Alloy Electrodeposited by Pulse Plating. Acta Metall. Sin. Engl. Lett. 2013, 26, 558–564. [Google Scholar] [CrossRef]
- Bin Humam, S.; Gyawali, G.; Dhakal, D.R.; Choi, J.-H.; Lee, S.W. Effect of Pulse and Direct Current Electrodeposition on Microstructure, Surface, and Scratch Resistance Properties of Ni–W Alloy and Ni–W–SiC Composite Coatings. Acta Metall. Sin. Engl. Lett. 2020, 33, 1321–1330. [Google Scholar] [CrossRef]
- Liu, H.; Liu, J.; Li, X.; Chen, P.; Yang, H.; Hao, J. Effect of Heat Treatment on Phase Stability and Wear Behavior of Laser Clad AlCoCrFeNiTi0.8 High-Entropy Alloy Coatings. Surf. Coat. Technol. 2020, 392, 125758. [Google Scholar] [CrossRef]
- Bhowmik, A.; Wei-Yee Tan, A.; Sun, W.; Wei, Z.; Marinescu, I.; Liu, E. On the Heat-Treatment Induced Evolution of Residual Stress and Remarkable Enhancement of Adhesion Strength of Cold Sprayed Ti–6Al–4V Coatings. Results Mater. 2020, 7, 100119. [Google Scholar] [CrossRef]
- Bigos, A.; Janusz-Skuza, M.; Szczerba, M.J.; Kot, M.; Zimowski, S.; Dębski, A.; Beltowska-Lehman, E. The Effect of Heat Treatment on the Microstructural Changes in Electrodeposited Ni-Mo Coatings. J. Mater. Process. Technol. 2020, 276, 116397. [Google Scholar] [CrossRef]
- Sun, G.F.; Wang, K.; Zhou, R.; Tong, Z.P.; Fang, X.Y. Effect of Annealing on Microstructure and Mechanical Properties of Laser Deposited Co-285+WC Coatings. Opt. Laser Technol. 2015, 66, 98–105. [Google Scholar] [CrossRef]
- Yang, H.; Liu, Y.; Jin, J.; Li, K.; Yang, J.; Meng, L.; Li, C.; Zhang, W.; Zhou, S. Effect of Heat Treatment on Microstructure and Mechanical Behavior of Cu-Bearing 316L Stainless Steel Produced by Selective Laser Melting. Acta Metall. Sin. Engl. Lett. 2024, 37, 169–180. [Google Scholar] [CrossRef]
- Huanyu, Z.; Jiahui, S.; Minhua, Y.; Xulong, A.; Jing, H. Mechanism Analysis for the Enhancement of Low-Temperature Impact Toughness of Nodular Cast Iron by Heat Treatment. Materials 2024, 17, 513. [Google Scholar] [CrossRef]
- Hu, J.; Jiang, J.; Li, H.; Yang, X.; Xu, H.; Jin, Y.; Ma, C.; Dong, Q.; Guo, N. Effect of Annealing Treatment on Microstructure and Properties of Cr-Coatings Deposited on AISI 5140 Steel by Brush-Plating. Coatings 2018, 8, 193. [Google Scholar] [CrossRef]
- Zhang, Q.; Guan, S.; Hu, R. Effects of heat treatment temperature on properties of hard chromium coating. J. Beijing Univ. Aeronaut. Astronaut. 2002, 28, 399–401. [Google Scholar] [CrossRef]
- Wang, X.; Wang, J.; Gao, Z.; Xia, D.; Hu, W. Effect of heat treatment on microstructure and corrosion resistance of electrodeposited nanocrystalline chromium coating. Surf. Technol. 2019, 48, 59–67. [Google Scholar] [CrossRef]
- Xiang, Y.; Zhao, S.; Liu, C.; Yang, H.; Zhang, W.; Wang, H.; Zhang, R.; He, H.; Liu, S. Effect of Long-Term Aging Treatment on the Structure and Oxidation Resistance of Cr Coatings under High-Temperature Steam. Corros. Sci. 2023, 212, 110923. [Google Scholar] [CrossRef]
- Suresh, S.; Giannakopoulos, A.E. A New Method for Estimating Residual Stresses by Instrumented Sharp Indentation. Acta Mater. 1998, 46, 5755–5767. [Google Scholar] [CrossRef]
- Mardanifar, A.; Mohseni, A.; Mahdavi, S. Wear and Corrosion of Co-Cr Coatings Electrodeposited from a Trivalent Chromium Solution: Effect of Heat Treatment Temperature. Surf. Coat. Technol. 2021, 422, 127535. [Google Scholar] [CrossRef]
- Bergant, Z.; Trdan, U.; Grum, J. Effect of High-Temperature Furnace Treatment on the Microstructure and Corrosion Behavior of NiCrBSi Flame-Sprayed Coatings. Corros. Sci. 2014, 88, 372–386. [Google Scholar] [CrossRef]
- Wang, F.; Zhang, F.; Zheng, L.; Zhang, H. Structure and Corrosion Properties of Cr Coating Deposited on Aerospace Bearing Steel. Appl. Surf. Sci. 2017, 423, 695–703. [Google Scholar] [CrossRef]
- Chen, T.; Li, W.; Liu, D.; Xiong, Y.; Zhu, X. Effects of Heat Treatment on Microstructure and Mechanical Properties of TiC/TiB Composite Bioinert Ceramic Coatings in-Situ Synthesized by Laser Cladding on Ti6Al4V. Ceram. Int. 2021, 47, 755–768. [Google Scholar] [CrossRef]
- Choi, J.H.; Kang, S.Y.; Lee, D.N. Relationship between Deposition and Recrystallization Textures of Copper and Chromium Electrodeposits. J. Mater. Sci. 2000, 35, 4055–4066. [Google Scholar] [CrossRef]
- Yar-Mukhamedova, G.S. Investigation of the Texture of Composite Electrodeposited Chromium–Carbon Coatings. Mater. Sci. 2000, 36, 752–754. [Google Scholar] [CrossRef]
- Martyak, N.M.; Weil, R. Structure Studies of Chromium Electrodeposits. Mater. Charact. 1992, 28, 113–120. [Google Scholar] [CrossRef]
- Yang, J.; Ji, P.; Zhang, J.; Xu, W.; Jiao, J.; Lian, Y.; Jiang, L.; Zhang, B. Effect of Current Density on the Texture, Residual Stress, Microhardness and Corrosion Resistance of Electrodeposited Chromium Coating. Surf. Coat. Technol. 2023, 471, 129868. [Google Scholar] [CrossRef]
- Huang, J.; Zou, S.; Xiao, W.; Yang, C.; Tang, D.; Yu, H.; Zhang, L.; Zhang, K. Influences of Arc Current on Microstructure of Cr Coating for Zr-4 Alloy Prepared by Multi-Arc Ion Plating via EBSD. Mater. Charact. 2021, 178, 111211. [Google Scholar] [CrossRef]
- Bingyuan, H.; Shaoyi, B.; Wenbo, D.; Weixing, H.; Xue, Y.; Fangfang, C.; Jiajie, C.; Xianghan, G.; Sheng, Z. Laser-Irradiation-Induced Dynamically Recrystallized Microstructure and Properties of Supersonic-Particle-Deposited Ni-Fe-Cr-Nb-Ti-Al High-Entropy Alloy Coating. Mater. Charact. 2022, 183, 111600. [Google Scholar] [CrossRef]
- Hao, E.; An, Y.; Zhao, X.; Zhou, H.; Chen, J. NiCoCrAlYTa Coatings on Nickel-Base Superalloy Substrate: Deposition by High Velocity Oxy-Fuel Spraying as Well as Investigation of Mechanical Properties and Wear Resistance in Relation to Heat-Treatment Duration. Appl. Surf. Sci. 2018, 462, 194–206. [Google Scholar] [CrossRef]
- Shamsujjoha, M.D.; Agnew, S.R.; Fitz-Gerald, J.M.; Moore, W.R.; Newman, T.A. High Strength and Ductility of Additively Manufactured 316L Stainless Steel Explained. Metall. Mater. Trans. A 2018, 49, 3011–3027. [Google Scholar] [CrossRef]
- Tjong, S.C.; Chen, H. Nanocrystalline Materials and Coatings. Mater. Sci. Eng. R Rep. 2004, 45, 1–88. [Google Scholar] [CrossRef]
- Lv, B.; Hu, Z.; Wang, X.; Xu, B. Effect of current density on the microstructure and properties of plated nickel coating. China Surf. Eng. 2013, 26, 66–71. [Google Scholar] [CrossRef]
- Cymboliste, M. The Structure and Hardness of Electrolytic Chromium. Trans. Electrochem. Soc. 1938, 73, 353. [Google Scholar] [CrossRef]
- Bu, T.; Jia, R.; Ying, T.; Atrens, A.; Chen, P.; Zheng, D.; Cao, F. A Green Conversion Coating on a Magnesium Alloy for Corrosion Protection. Acta Metall. Sin. Engl. Lett. 2023, 36, 1630–1648. [Google Scholar] [CrossRef]
- Maharana, H.S.; Bishoyi, B.; Basu, A. Current Density Dependent Microstructure and Texture Evolution and Related Effects on Properties of Electrodeposited Ni-Al Coating. J. Alloys Compd. 2019, 787, 483–494. [Google Scholar] [CrossRef]
- Nielsen, C.B.; Leisner, P.; Horsewell, A. On Texture Formation of Chromium Electrodeposits. J. Appl. Electrochem. 1998, 28, 141–150. [Google Scholar] [CrossRef]
- Sonnweberribic, P.; Gruber, P.; Dehm, G.; Arzt, E. Texture Transition in Cu Thin Films: Electron Backscatter Diffraction vs. X-ray Diffraction. Acta Mater. 2006, 54, 3863–3870. [Google Scholar] [CrossRef]
- Han, L.; Jeurgens, L.P.H.; Cancellieri, C.; Wang, J.; Xu, Y.; Huang, Y.; Liu, Y.; Wang, Z. Anomalous Texture Development Induced by Grain Yielding Anisotropy in Ni and Ni-Mo Alloys. Acta Mater. 2020, 200, 857–868. [Google Scholar] [CrossRef]
- Ellis, E.A.; Chmielus, M.; Lin, M.-T.; Joress, H.; Visser, K.; Woll, A.; Vinci, R.P.; Brown, W.L.; Baker, S.P. Driving Forces for Texture Transformation in Thin Ag Films. Acta Mater. 2016, 105, 495–504. [Google Scholar] [CrossRef]
- Cai, F.; Jiang, C.; Wu, X. X-Ray Diffraction Characterization of Electrodeposited Ni–Al Composite Coatings Prepared at Different Current Densities. J. Alloys Compd. 2014, 604, 292–297. [Google Scholar] [CrossRef]
- Deng, D.; Murakawa, H. Influence of Transformation Induced Plasticity on Simulated Results of Welding Residual Stress in Low Temperature Transformation Steel. Comput. Mater. Sci. 2013, 78, 55–62. [Google Scholar] [CrossRef]
- Cai, F.; Jiang, C. Influences of Al Particles on the Microstructure and Property of Electrodeposited Ni–Al Composite Coatings. Appl. Surf. Sci. 2014, 292, 620–625. [Google Scholar] [CrossRef]
- Nasirpouri, F.; Sanaeian, M.R.; Samardak, A.S.; Sukovatitsina, E.V.; Ognev, A.V.; Chebotkevich, L.A.; Hosseini, M.-G.; Abdolmaleki, M. An Investigation on the Effect of Surface Morphology and Crystalline Texture on Corrosion Behavior, Structural and Magnetic Properties of Electrodeposited Nanocrystalline Nickel Films. Appl. Surf. Sci. 2014, 292, 795–805. [Google Scholar] [CrossRef]


| Element | Fe | C | Si | Cr | Ni | Mo | V | W | Nb |
|---|---|---|---|---|---|---|---|---|---|
| Content | Bal. | 0.27~0.31 | ≤0.40 | 2.75~3.05 | 1.15~1.30 | 1.70~1.85 | 0.40~0.55 | 0.45~0.65 | 0.01~0.04 |
| Temperature (°C) | Time | RTC(hkl)/% | |||||
|---|---|---|---|---|---|---|---|
| (h) | (110) | (200) | (211) | (220) | (310) | (222) | |
| 0 | 0 | 0.7 | 3.9 | 3.0 | 3.2 | 3.2 | 86.0 |
| 310 | 4 | 0.4 | 2.1 | 1.2 | 1.8 | 1.5 | 93.0 |
| 380 | 4 | 0.5 | 1.9 | 1.1 | 1.5 | 1.5 | 94.5 |
| 450 | 4 | 0.3 | 1.5 | 1.2 | 1.2 | 1.2 | 94.6 |
| 520 | 4 | 0.2 | 0.8 | 0.7 | 0.6 | 0.7 | 97.0 |
| 600 | 4 | 0.5 | 2.7 | 6.1 | 2.4 | 1.9 | 86.4 |
| 380 | 2 | 0.4 | 1.9 | 1.1 | 1.5 | 1.6 | 93.5 |
| 380 | 3 | 0.2 | 1.8 | 1.2 | 1.5 | 1.4 | 93.6 |
| 380 | 3.5 | 0.3 | 1.5 | 0.8 | 1.1 | 1.1 | 95.2 |
| 380 | 5 | 0.3 | 1.7 | 0.9 | 1.3 | 1.2 | 94.6 |
| Temperature (°C) | Time (h) | Grain Direction | ρGND (1015 m−2) |
|---|---|---|---|
| 0 | 0 | surface | 2.35 |
| 380 | 4 | surface | 1.68 |
| 600 | 4 | surface | 0.59 |
| 0 | 0 | cross-section | 2.01 |
| 380 | 4 | cross-section | 1.74 |
| 600 | 4 | cross-section | 1.45 |
| Temperature (°C) | Time (h) | Ecorr (mV) | icorr (A/dm2) | Temperature (°C) | Time (h) | Ecorr (mV) | icorr (A/dm2) |
|---|---|---|---|---|---|---|---|
| 0 | 0 | −389.2 ± 11.6 | 1.895 × 10⁻⁵ ± 0.112 × 10⁻⁵ | 380 | 2 | −379.2 ± 13.6 | 2.052 × 10⁻⁶ ± 0.162 × 10⁻⁶ |
| 310 | 4 | −314.3 ± 9.8 | 1.634 × 10⁻⁵ ± 0.101 × 10⁻⁵ | 380 | 3 | −296.5 ± 12.3 | 1.936 × 10⁻⁶ ± 0.161× 10⁻⁶ |
| 380 | 4 | −253.2 ± 12.1 | 1.798 × 10⁻⁶ ± 0.125 × 10⁻⁶ | 380 | 3.5 | −314.9 ± 9.9 | 1.855 × 10⁻⁶ ± 0.108 × 10⁻⁶ |
| 450 | 4 | −279.1 ± 10.2 | 1.835 × 10⁻⁶ ± 0.124 × 10⁻⁶ | 380 | 5 | −269.2 ± 11.8 | 1.837 × 10⁻⁶ ± 0.121 × 10⁻⁶ |
| 520 | 4 | −272.9 ± 10.2 | 1.756 × 10⁻⁵ ± 0.135 × 10⁻⁵ | substrate | substrate | −571.6 ± 13.5 | 3.654 × 10⁻³ ± 0.106 × 10⁻³ |
| 600 | 4 | −386.2 ± 11.9 | 1.982 × 10⁻⁵ ± 0.215 × 10⁻⁵ |
| Temperature (°C) | Time (h) | Crack Density (/cm2) | Residual Stress (MPa) | Hydrogen Content (ppm) | Microhardness (HV0.1) | icorr (A/dm2) |
|---|---|---|---|---|---|---|
| 0 | 0 | 315 | 247 | 56.85 | 950 | 1.895 × 10⁻⁵ |
| 310 | 4 | 231 | 96 | 12.55 | 891 | 1.634 × 10⁻⁵ |
| 380 | 4 | 219 | 61 | 7.63 | 865 | 1.798 × 10⁻⁶ |
| 450 | 4 | 182 | 45 | 3.66 | 810 | 1.835 × 10⁻⁶ |
| 520 | 4 | 175 | 35 | 2.99 | 741 | 1.756 × 10⁻⁵ |
| 600 | 4 | 108 | 34 | 1.18 | 695 | 1.982 × 10⁻⁵ |
| 380 | 2 | 263 | 125 | 25.35 | 908 | 2.052 × 10⁻⁶ |
| 380 | 3 | 241 | 98 | 13.35 | 888 | 1.936 × 10⁻⁶ |
| 380 | 3.5 | 229 | 77 | 3.66 | 872 | 1.855 × 10⁻⁶ |
| 380 | 5 | 207 | 59 | 1.85 | 831 | 1.837 × 10⁻⁶ |
Disclaimer/Publisher’s Note: The statements, opinions and data contained in all publications are solely those of the individual author(s) and contributor(s) and not of MDPI and/or the editor(s). MDPI and/or the editor(s) disclaim responsibility for any injury to people or property resulting from any ideas, methods, instructions or products referred to in the content. |
© 2024 by the authors. Licensee MDPI, Basel, Switzerland. This article is an open access article distributed under the terms and conditions of the Creative Commons Attribution (CC BY) license (https://creativecommons.org/licenses/by/4.0/).
Share and Cite
Yang, J.; Ji, P.; Yang, X.; Wu, L.; Ding, X.; Zhang, J.; Lian, Y.; Dou, S.; Jiang, L.; Zhang, B. Relationship between Texture, Hydrogen Content, Residual Stress and Corrosion Resistance of Electrodeposited Chromium Coating: Influence of Heat Treatment. Materials 2024, 17, 4142. https://doi.org/10.3390/ma17164142
Yang J, Ji P, Yang X, Wu L, Ding X, Zhang J, Lian Y, Dou S, Jiang L, Zhang B. Relationship between Texture, Hydrogen Content, Residual Stress and Corrosion Resistance of Electrodeposited Chromium Coating: Influence of Heat Treatment. Materials. 2024; 17(16):4142. https://doi.org/10.3390/ma17164142
Chicago/Turabian StyleYang, Jinghan, Pengfei Ji, Xuemei Yang, Linyang Wu, Xiaoyun Ding, Jin Zhang, Yong Lian, Shitao Dou, Liming Jiang, and Biliang Zhang. 2024. "Relationship between Texture, Hydrogen Content, Residual Stress and Corrosion Resistance of Electrodeposited Chromium Coating: Influence of Heat Treatment" Materials 17, no. 16: 4142. https://doi.org/10.3390/ma17164142