

Marginal Aggregates: The Role of Clays

Abstract
1. Introduction
2. Materials and Methods
2.1. Overview of the Research Plan and Testing Program
- Micro-fines recovered from quarries by-products were obtained by either taking material from clay rich lenses in quarries or fine waste materials in quarries and separating the micro-fines from them by a process that involved water washing and sieving through a 75 microns mesh, followed by drying to remove the water.
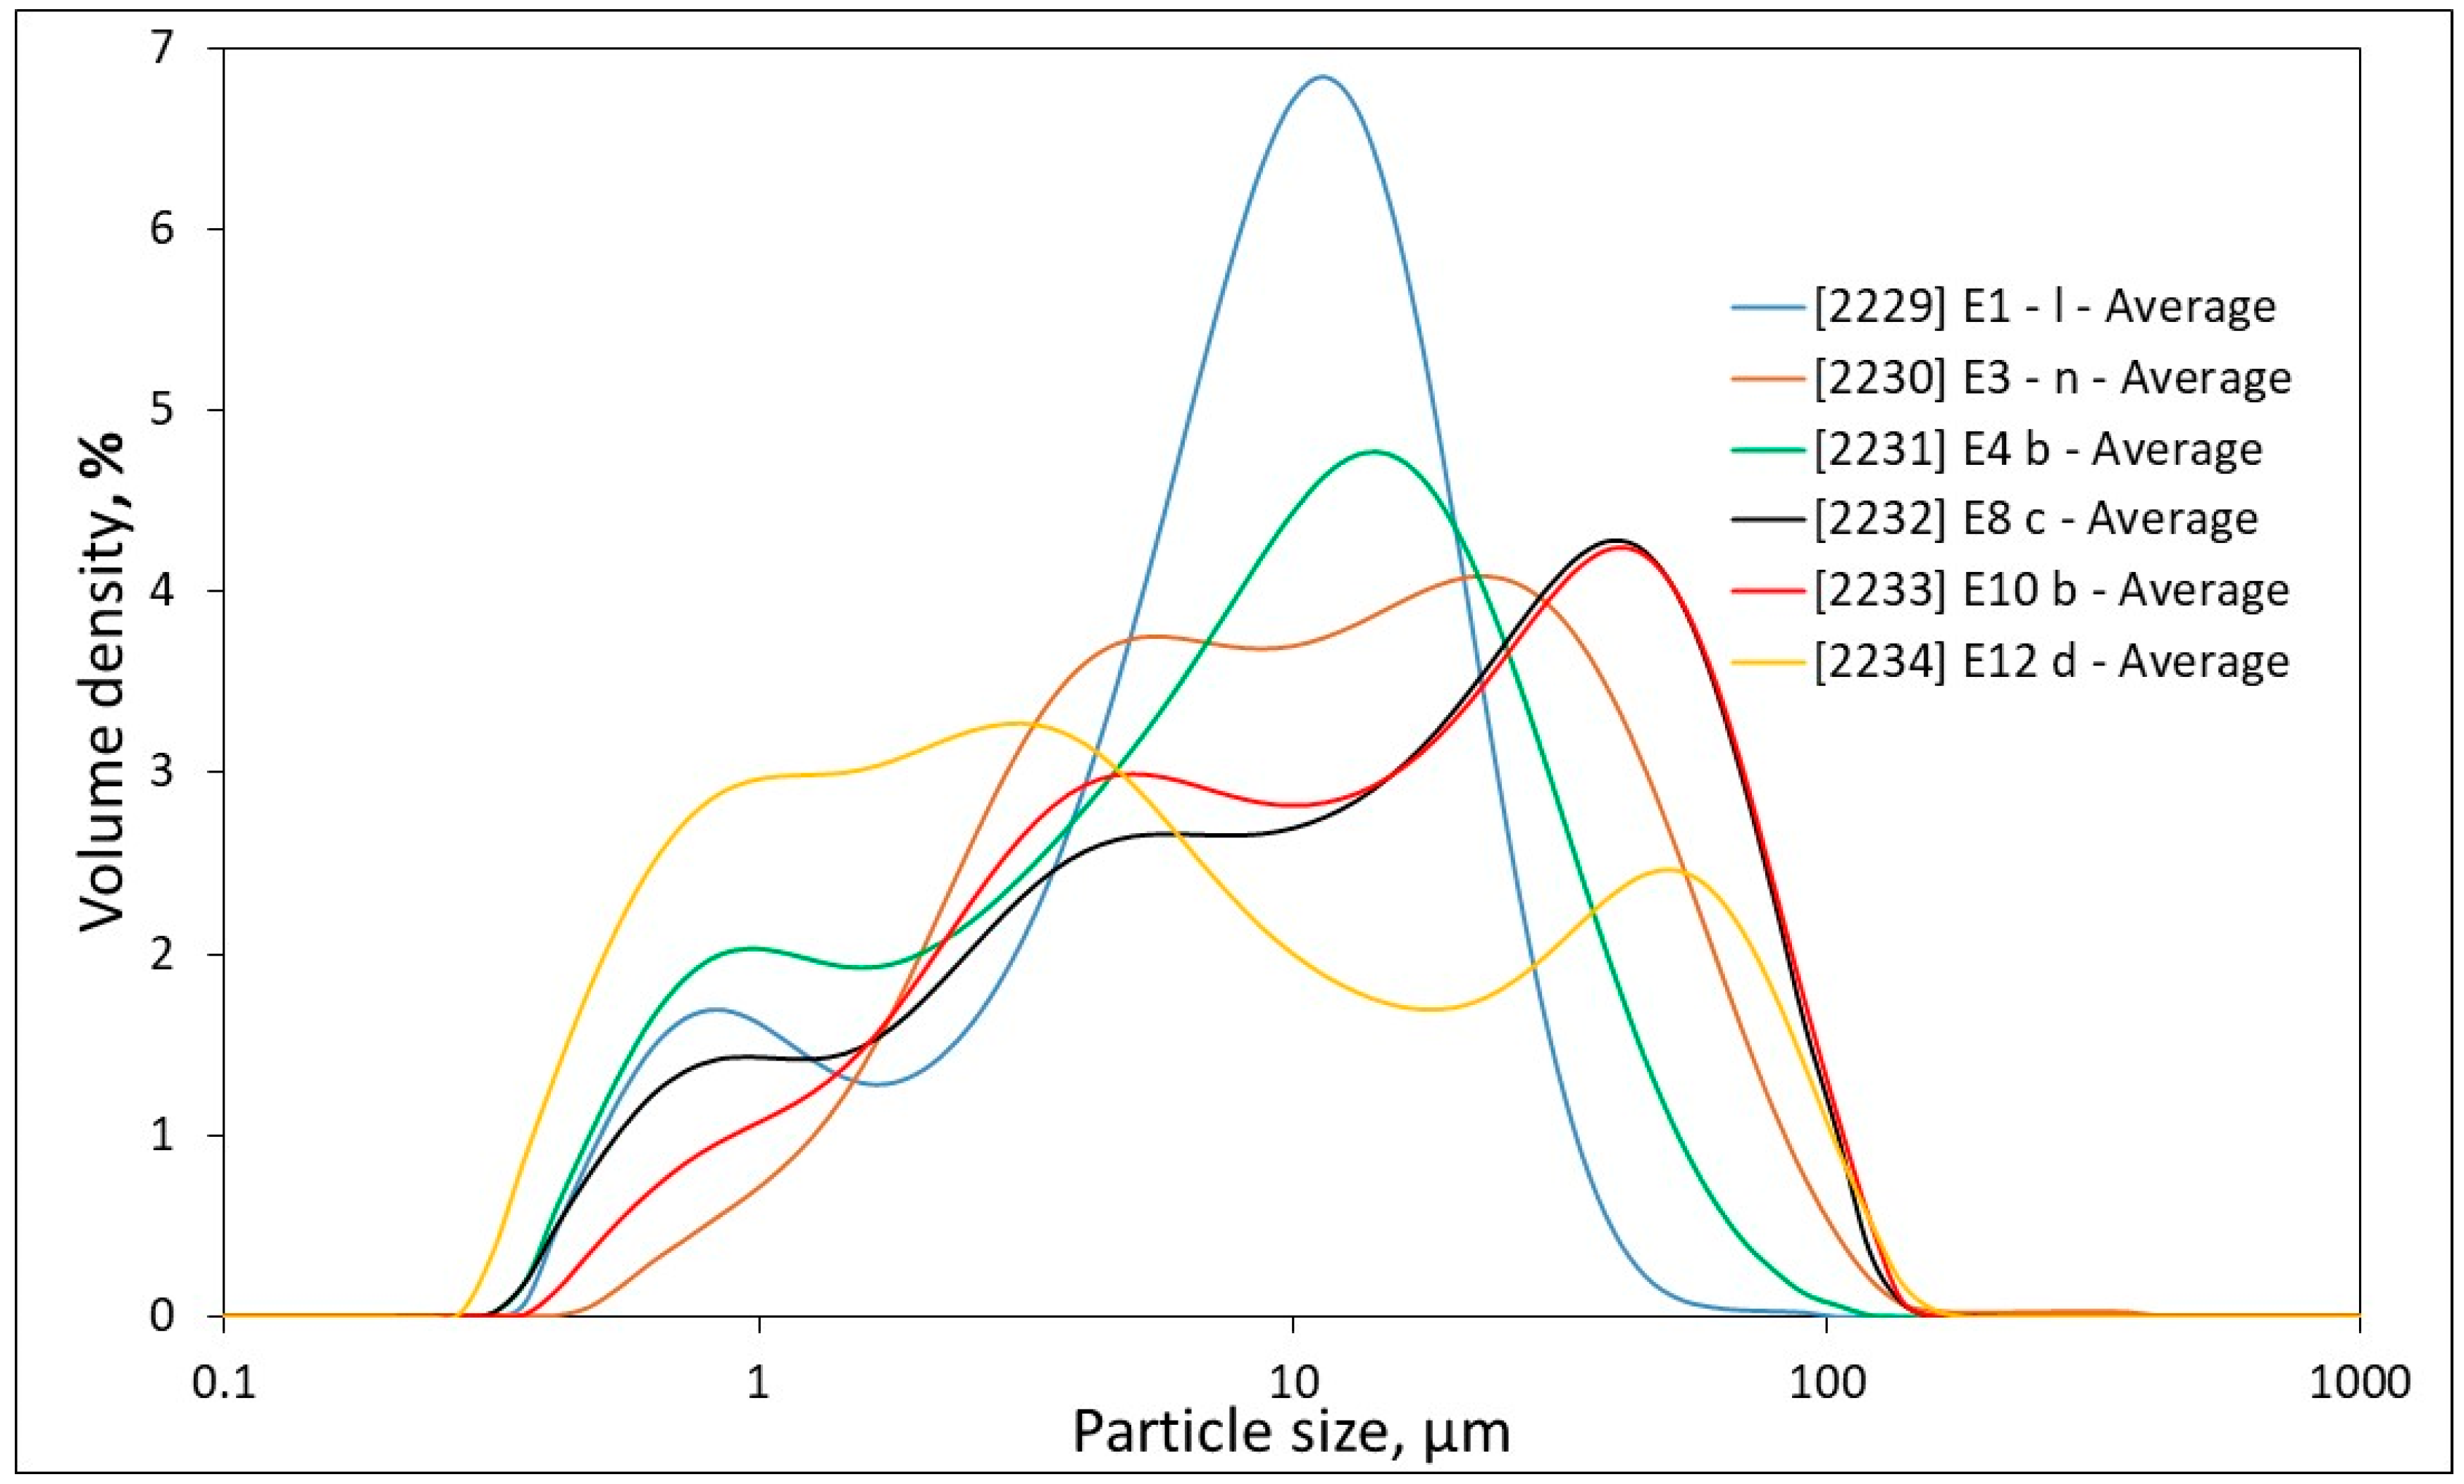
- The micro-fines obtained were characterized for their mineralogical composition by quantitative XRD and particle size distribution tests.
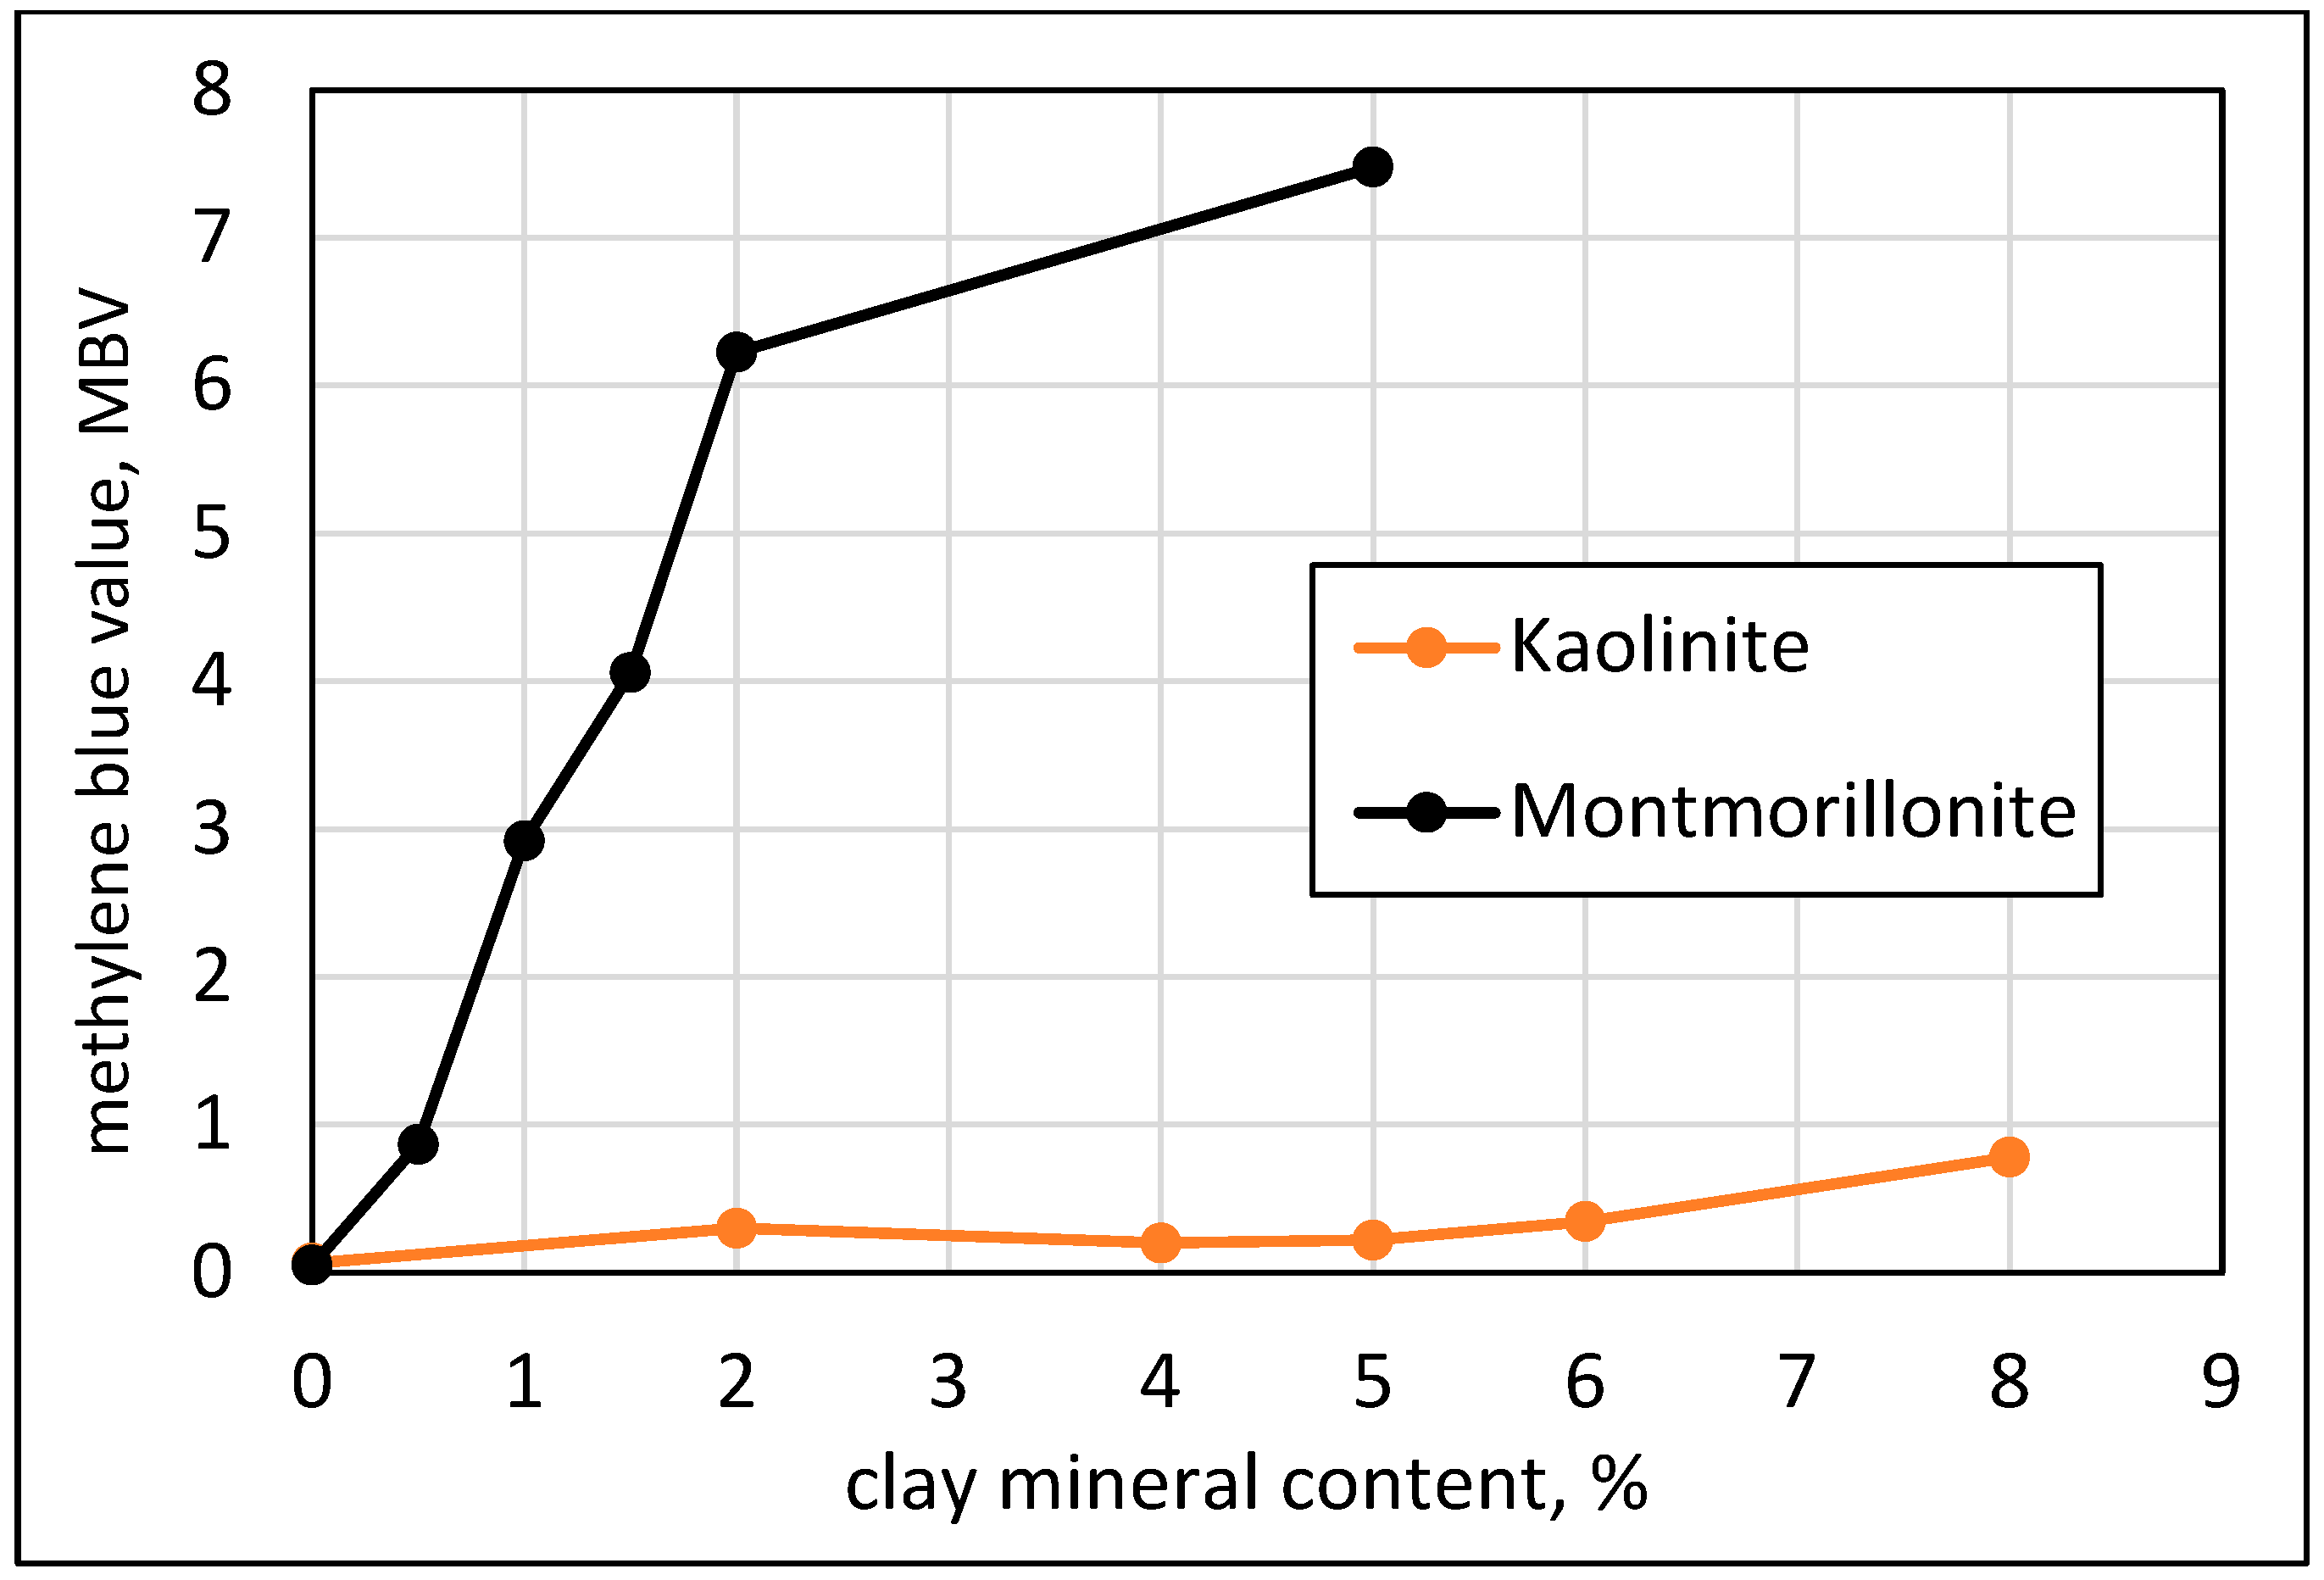
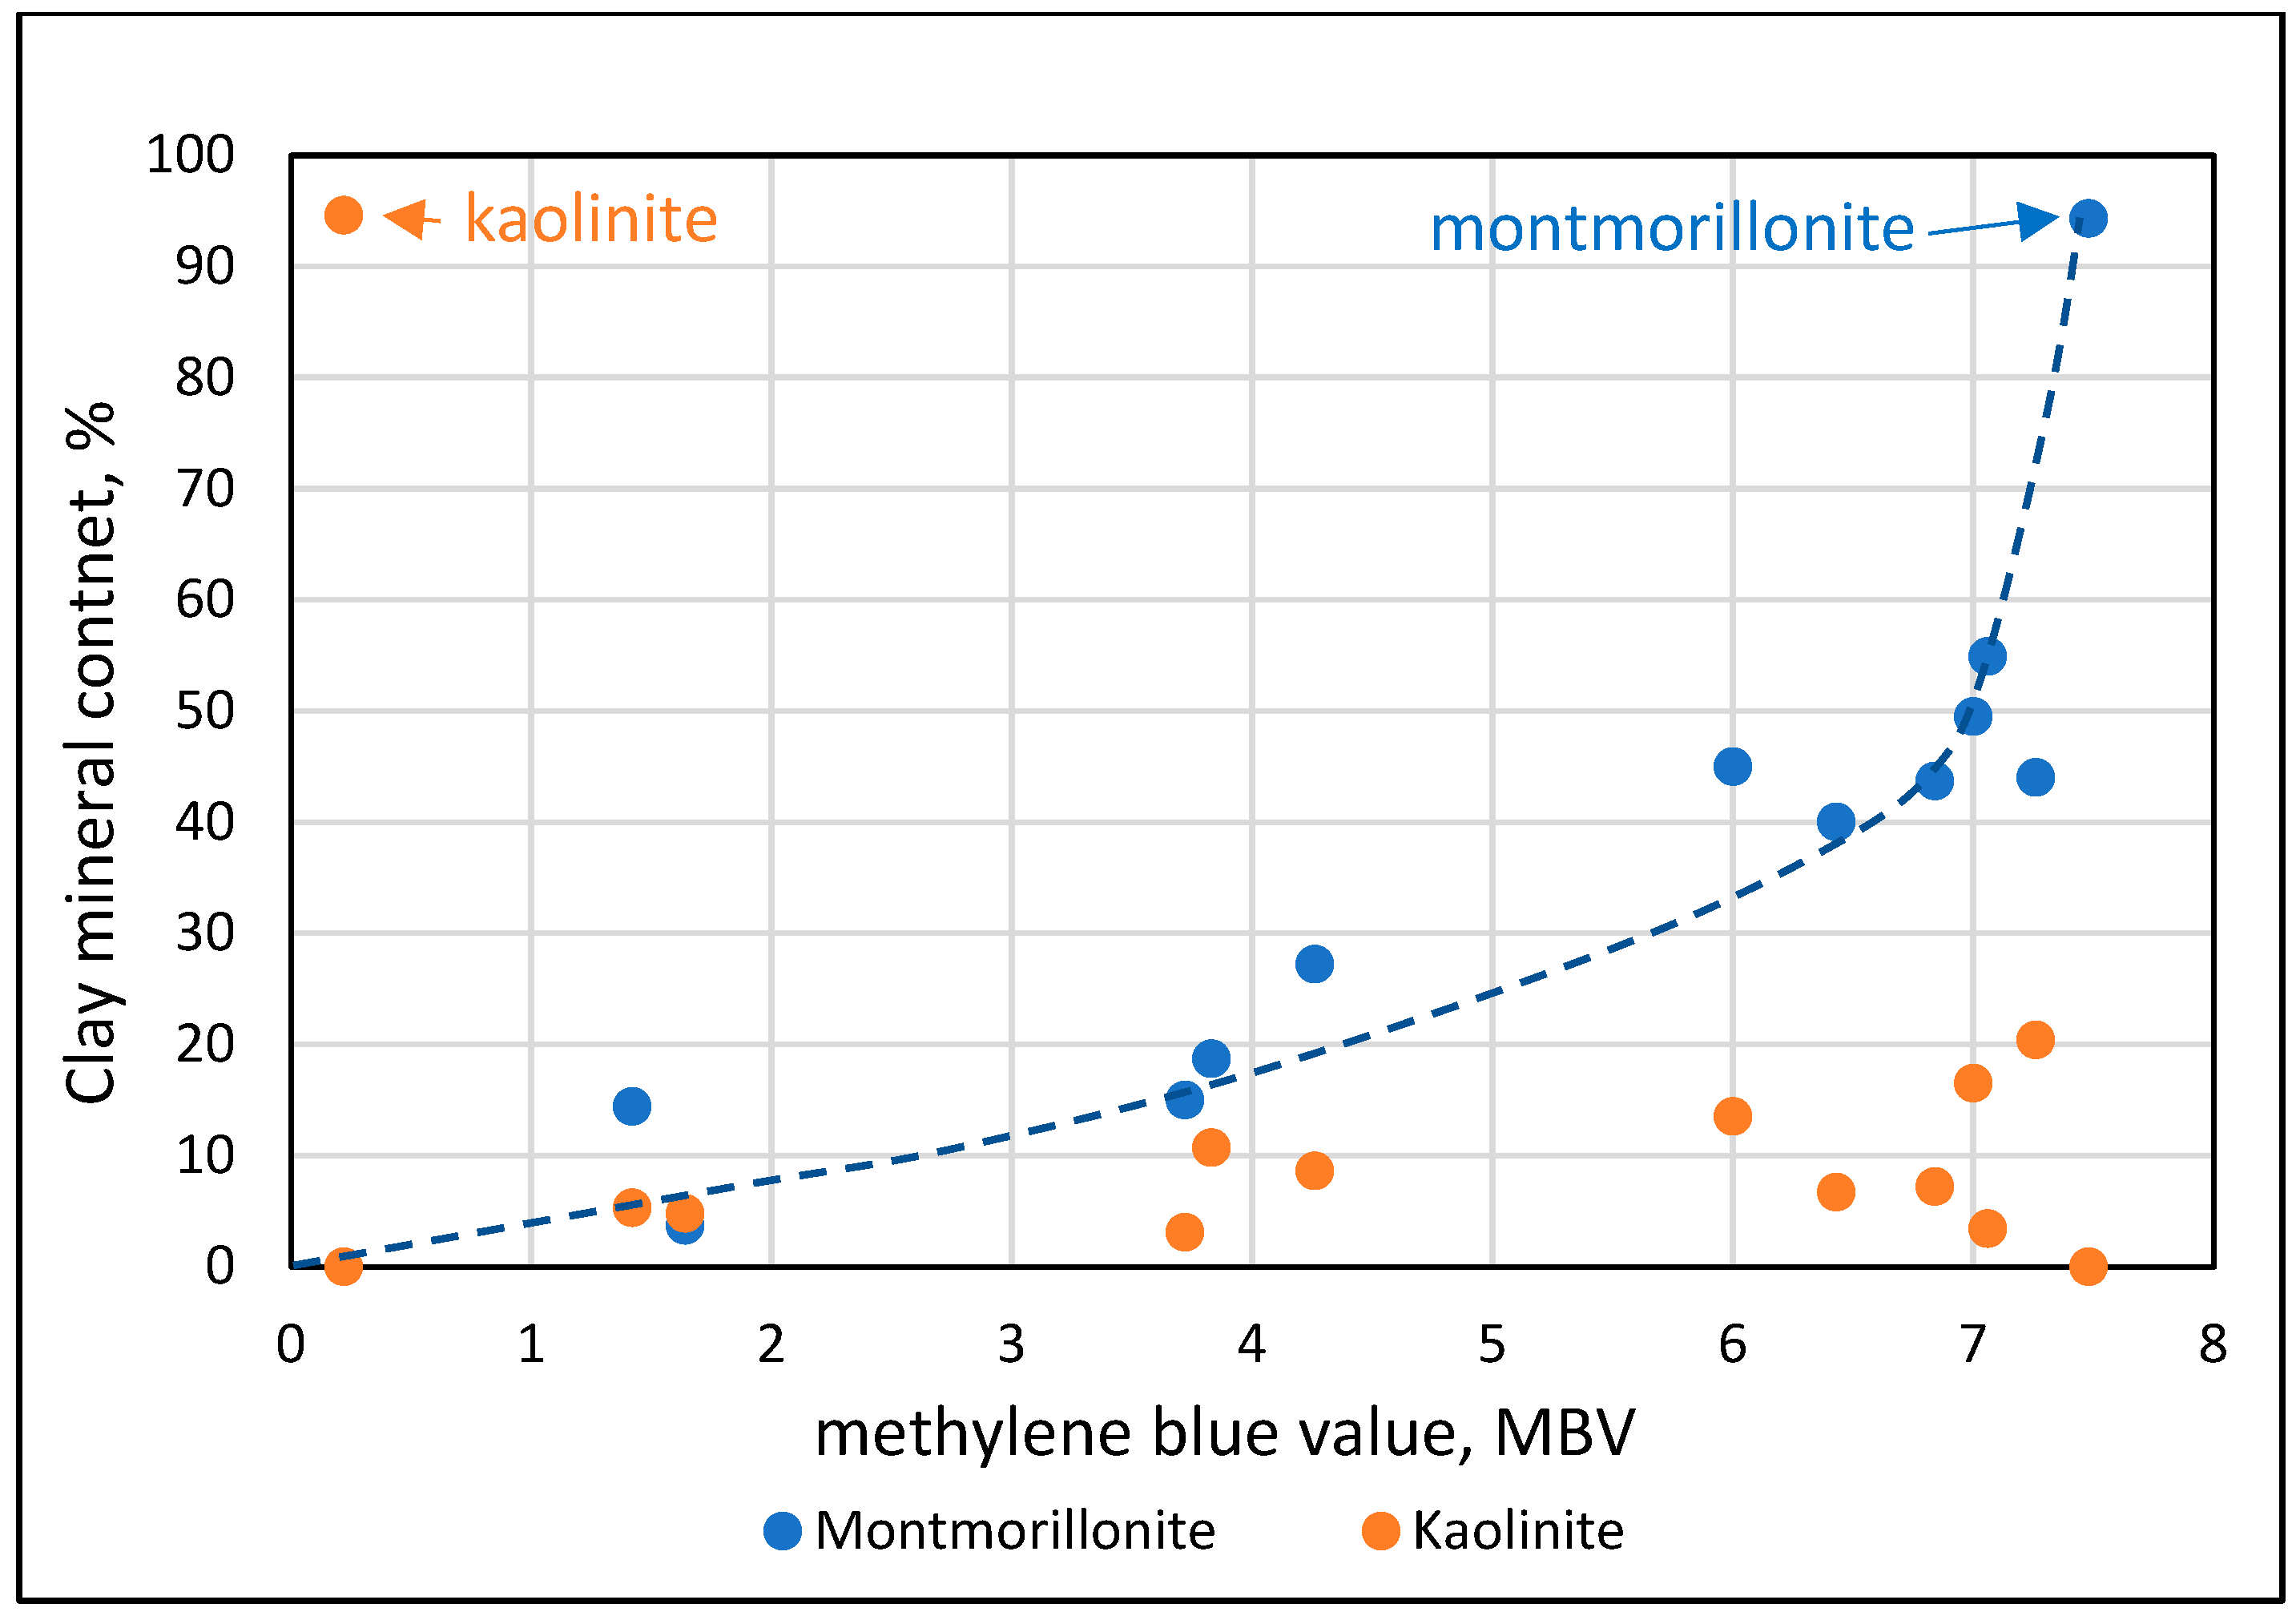
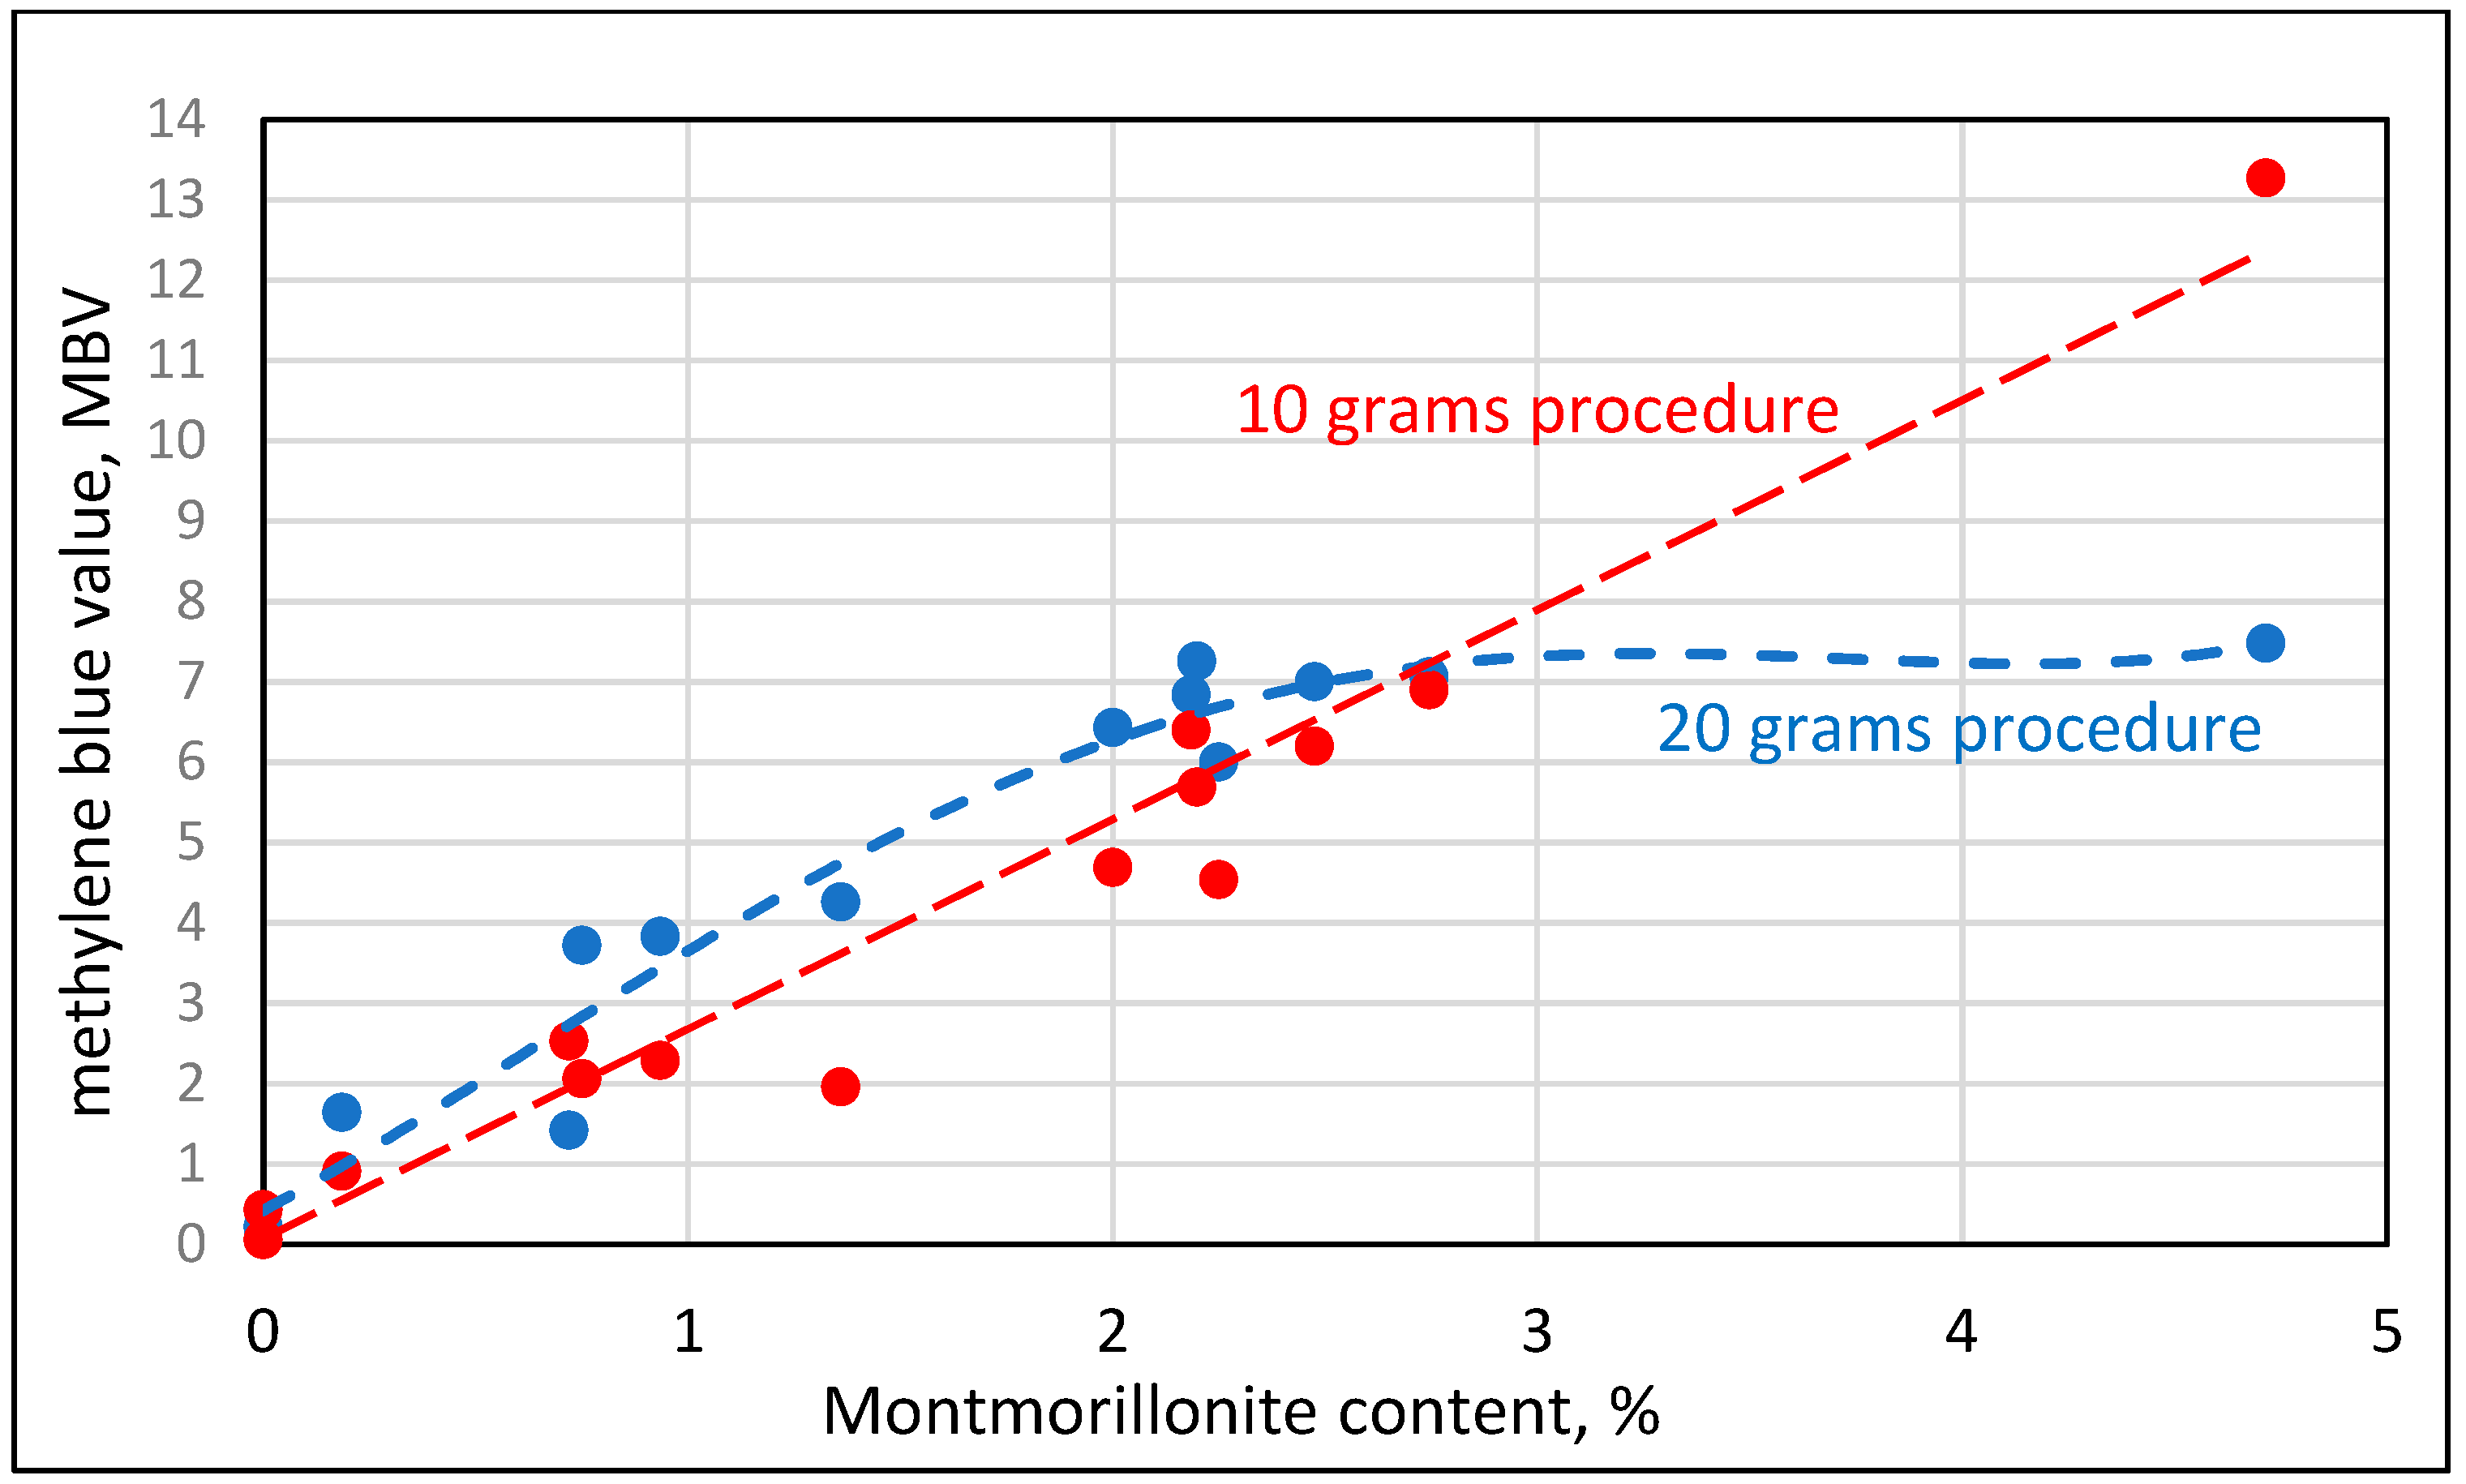
- For the characterization of the clay nature using the standard methylene blue test, which is adequate for aggregates containing clays, “engineered sand” was prepared. It consisted of 5% of the micro-fines mixed with 95% of high-quality siliceous sand, with particles smaller than 1 mm having a fineness modulus of 1. Thus, the Methylene Blue Value (MBV) for this engineered sand was used to characterize the clay nature of the micro-fines, which contained, in addition to clay, some other minerals, mainly Calcite, Dolomite and Quartz. The calibration curves of the MBV value against swelling clay, e.g., Montmorillonite, served as a way to provide the “equivalent Montmorillonite” content in the micro-fines.
- The mortars prepared and evaluated consisted of 1:3 cement:sand mixes. The cement was CEM I 52.5. The sand was “engineered” to contain the high-quality siliceous sand described above, in which portions were replaced by different micro-fine contents in the range of 0 to 30%.
- The concrete prepared consisted of washed aggregates containing no micro-fines. The micro-fines were added in controlled amounts, up to 300 kg/m3 in the concrete mix. To compare with the presence of micro-fines, which are “pure” fillers, high-quality calcium carbonate filler was used.
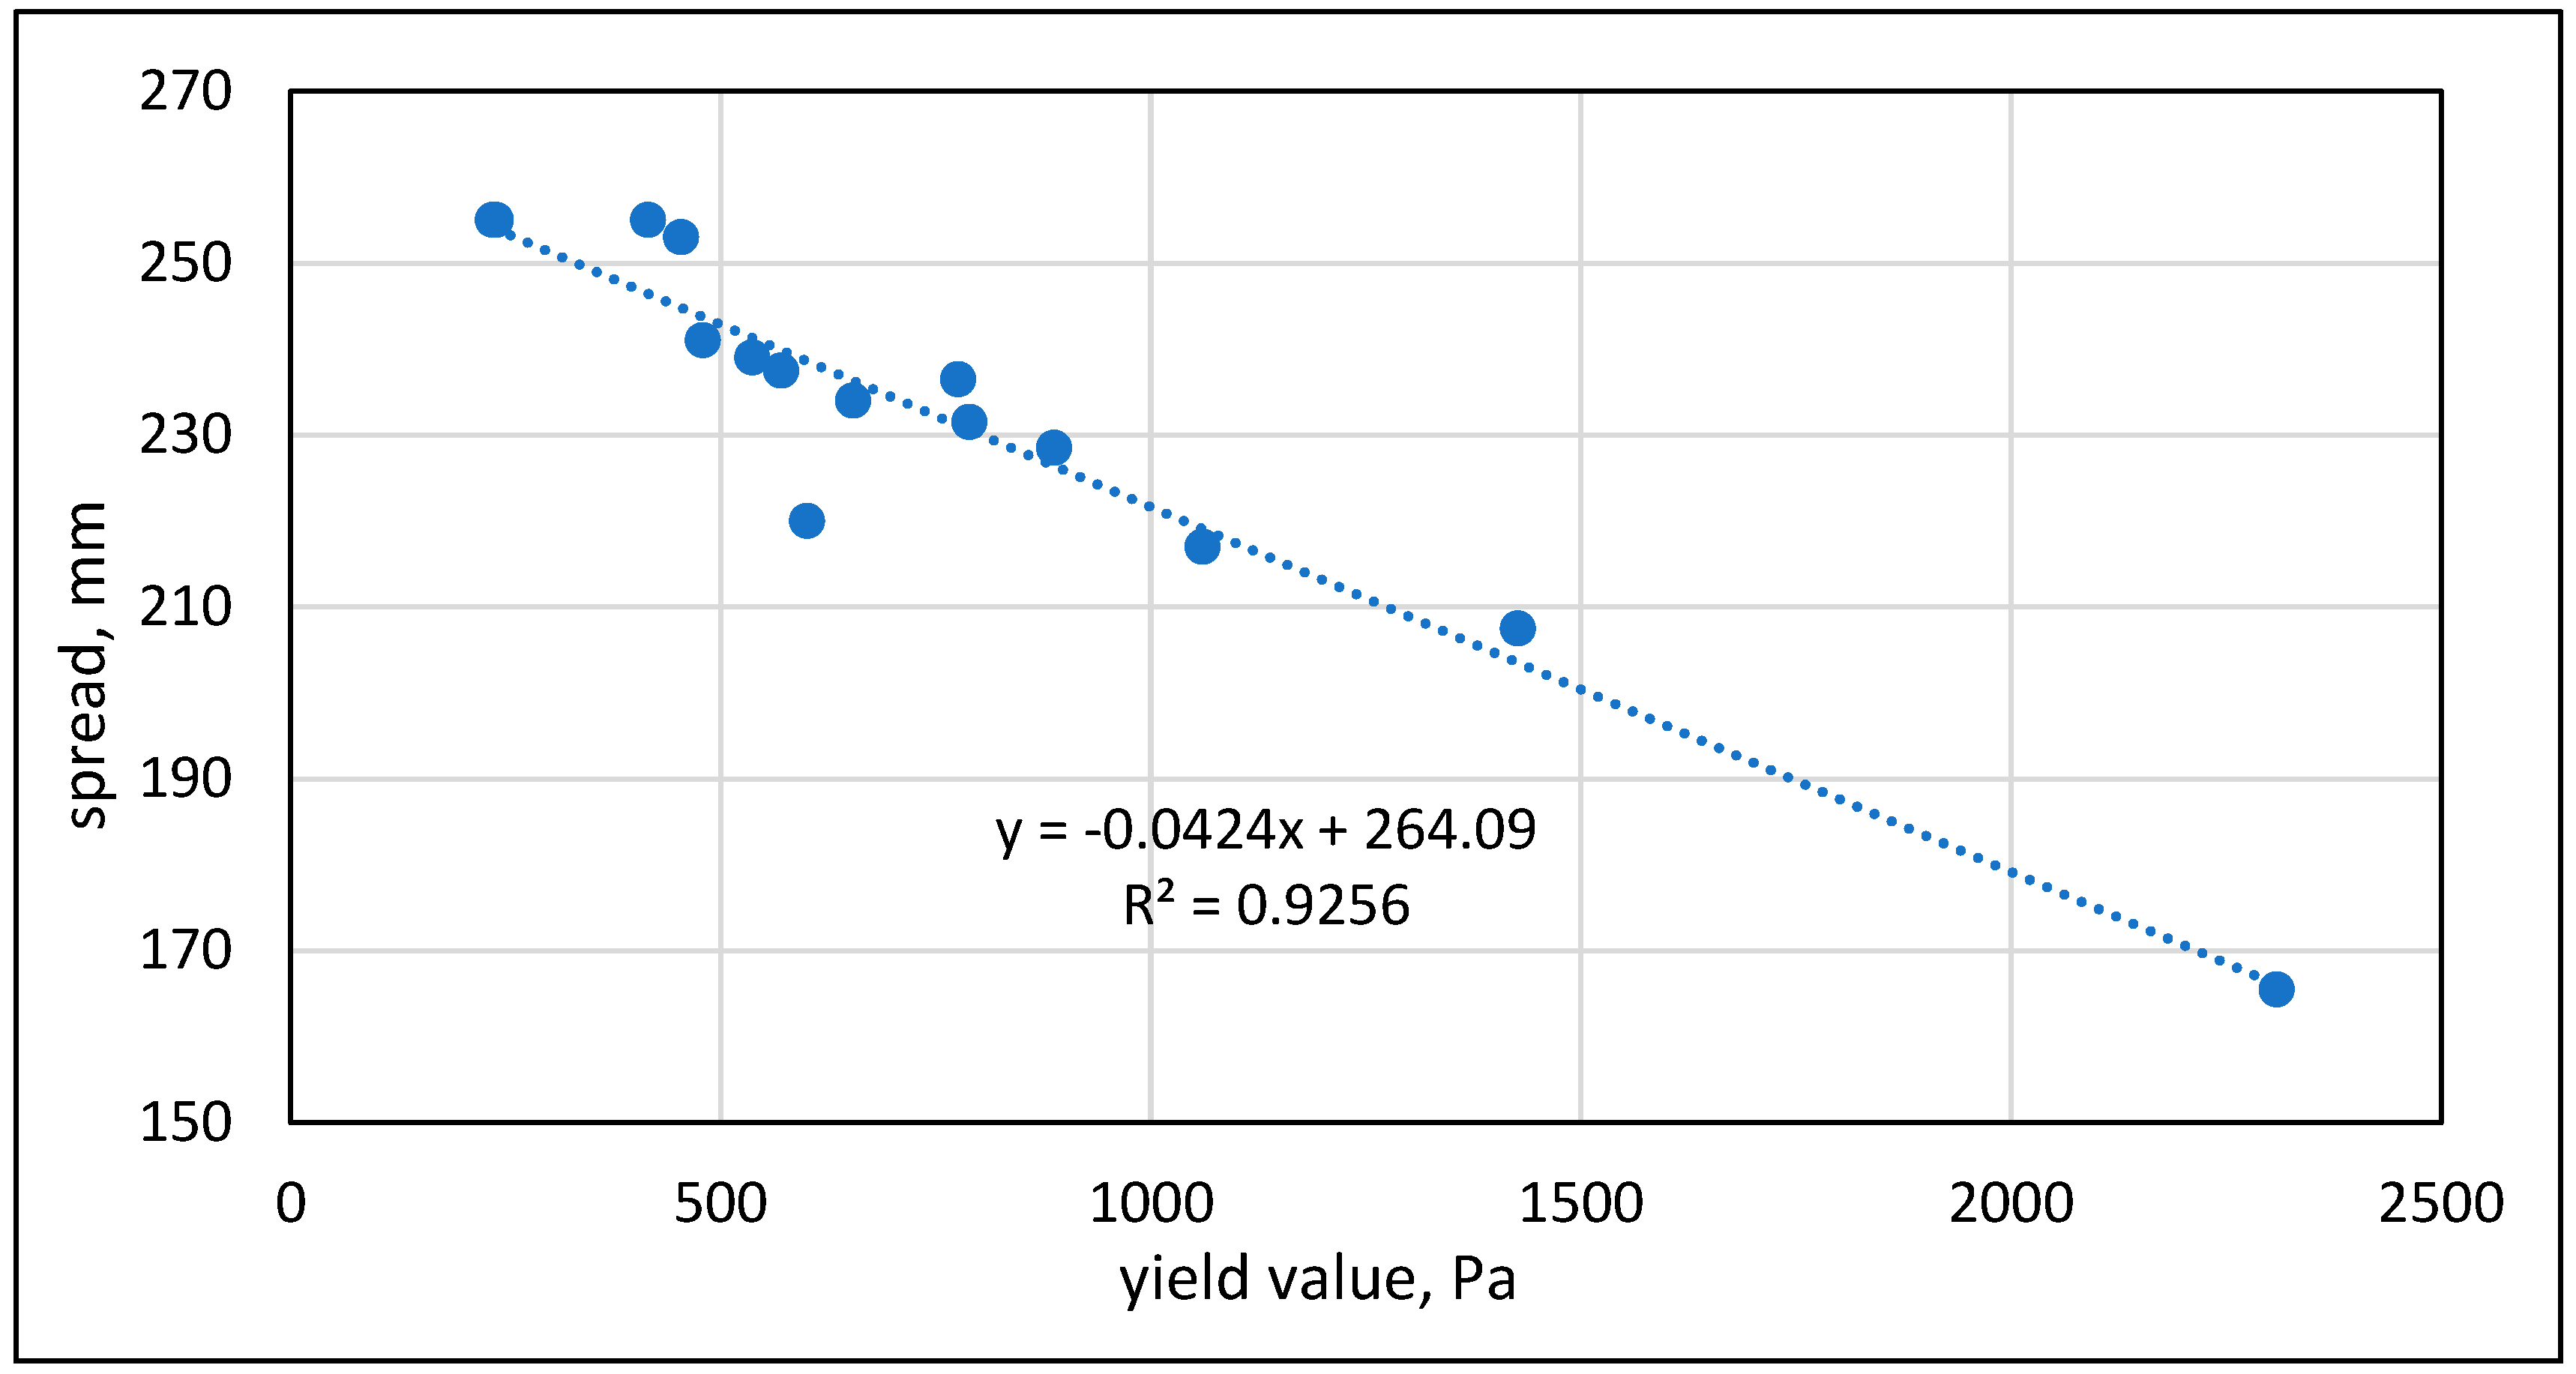
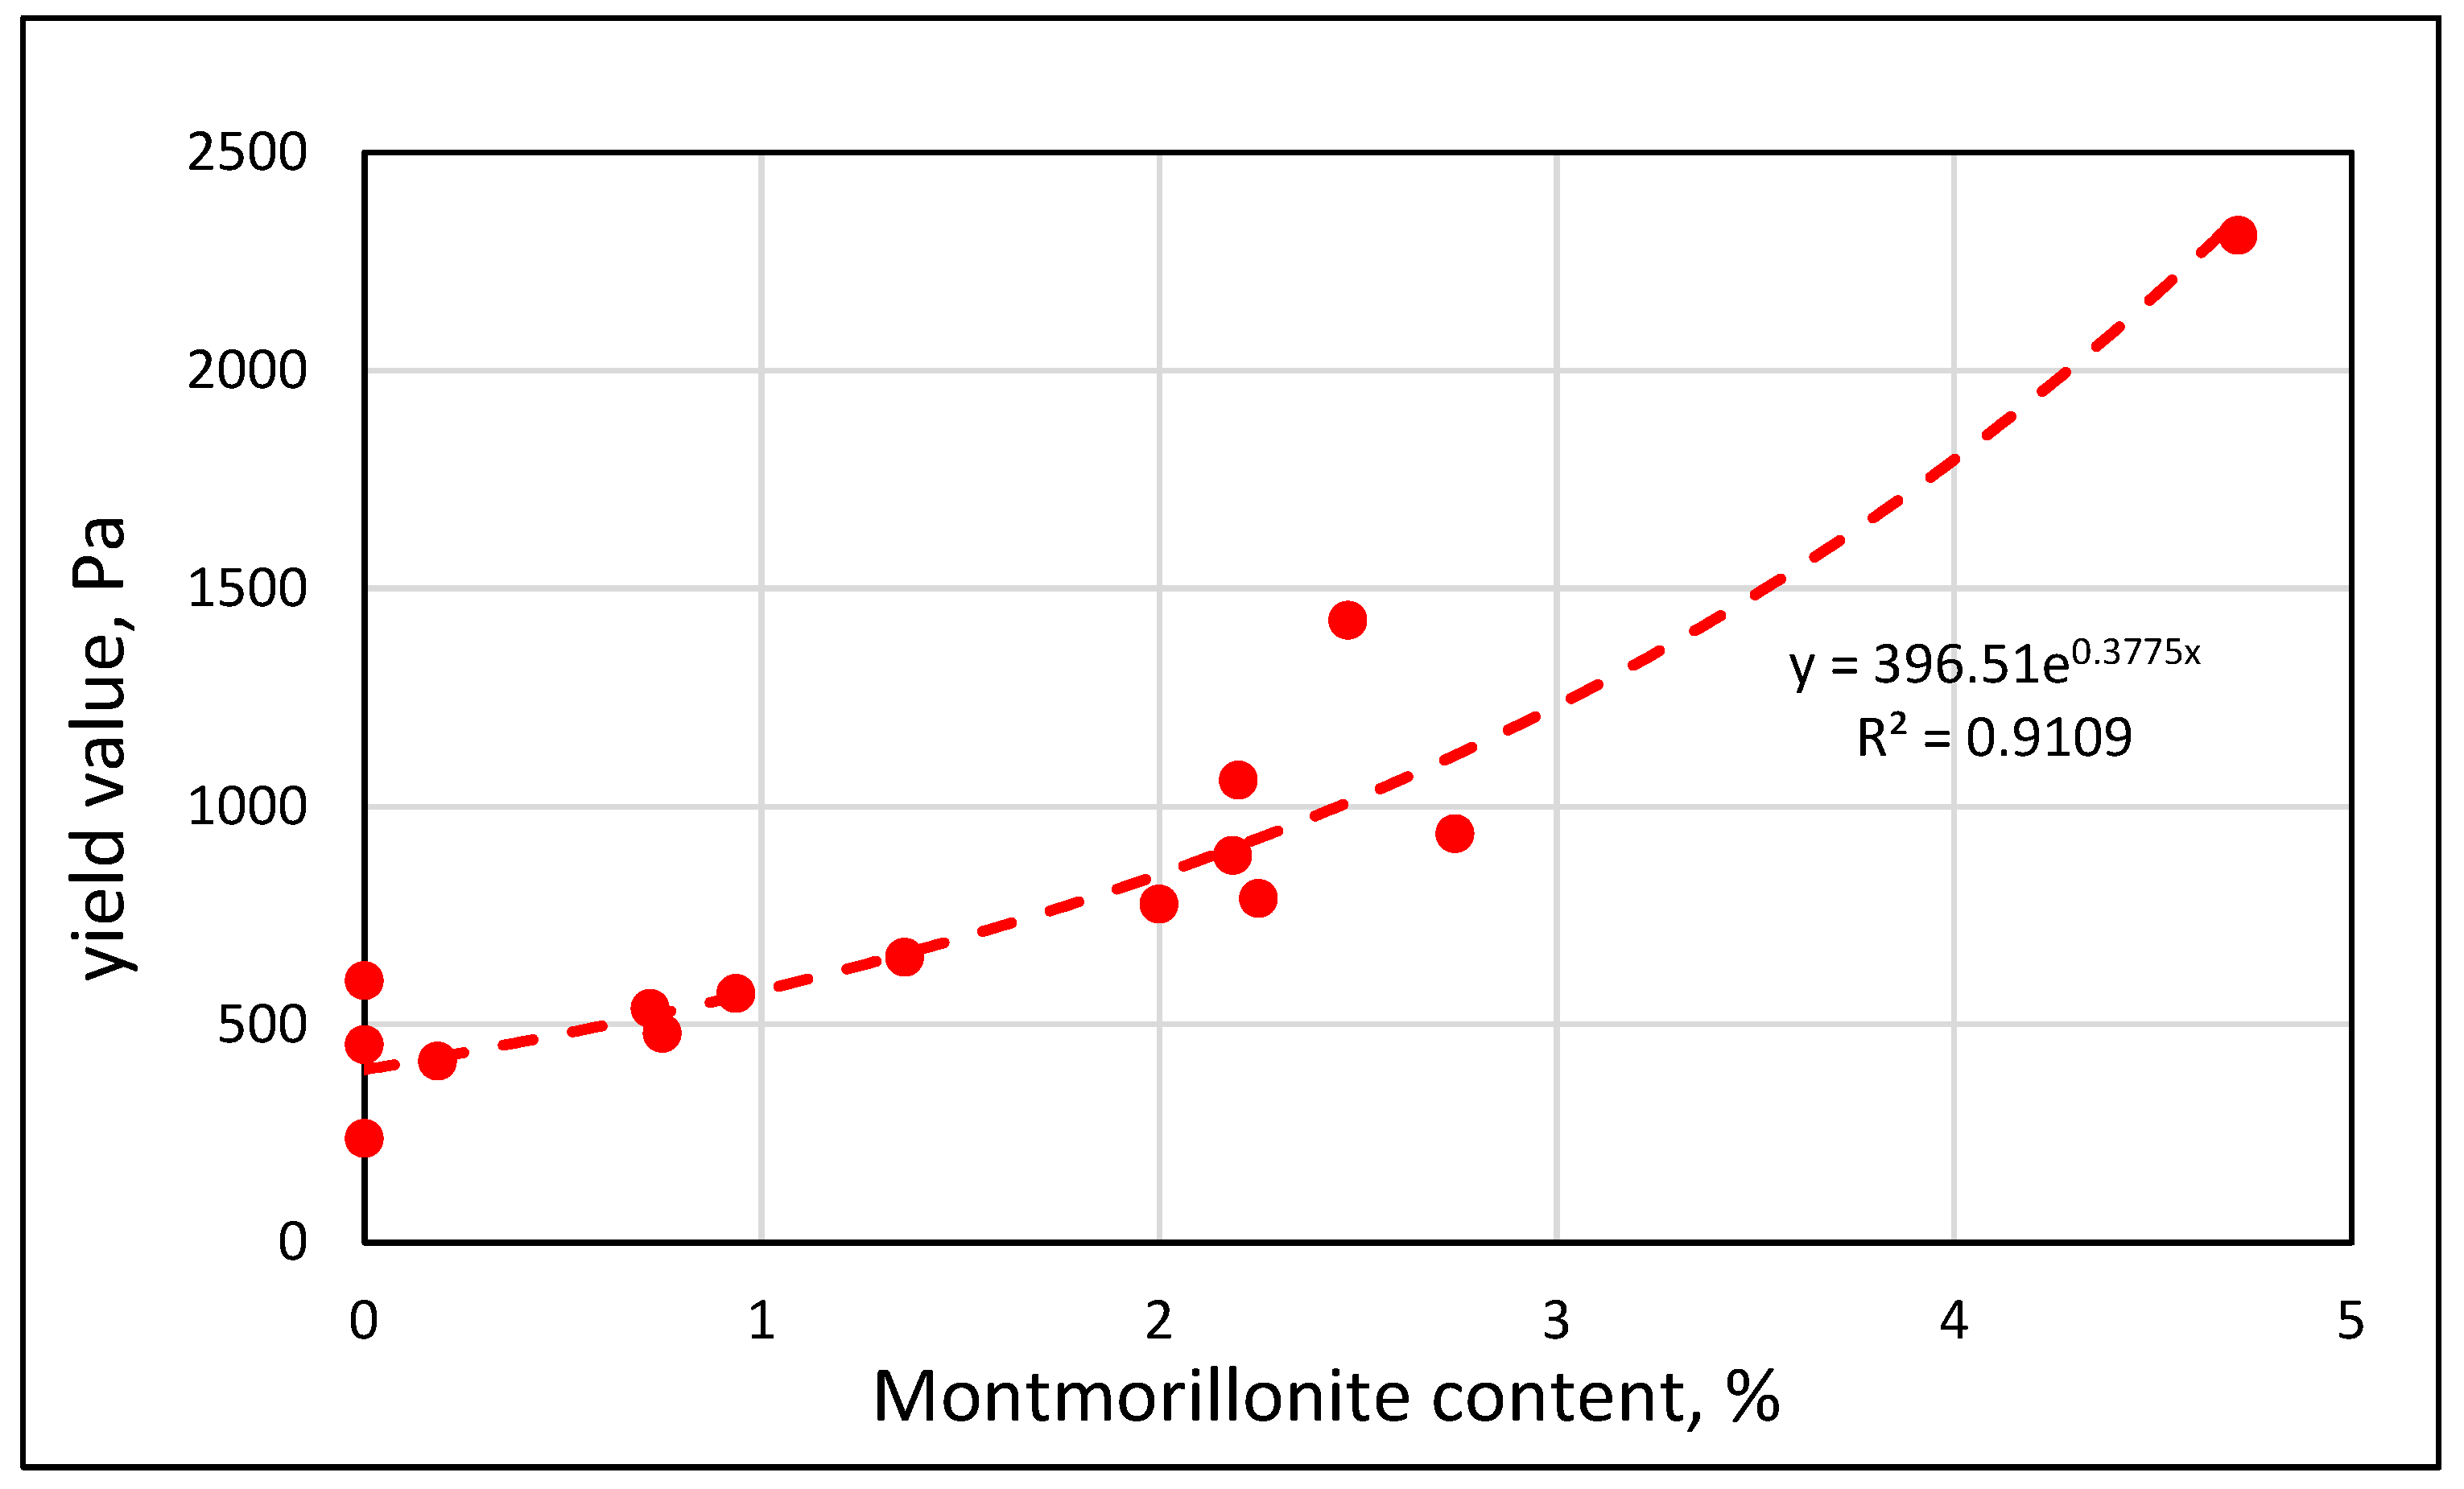
- The properties of the fresh mortars and concretes were characterized by rheological tests using a rotational ICAR viscometer for concrete and a ConTec rheometer for mortars. The characteristic value used in these tests was the yield value, which was shown to linearly correlate with the standard flow table test for mortars and the slump test for concrete.
- The properties of the mature mixes evaluated were strength and drying shrinkage.
2.2. Characterization of Micro-Fines
2.3. Micro-Fines Mineralogical Composition and Particle Size Distribution
2.4. The Methylene Blue Test
3. Results
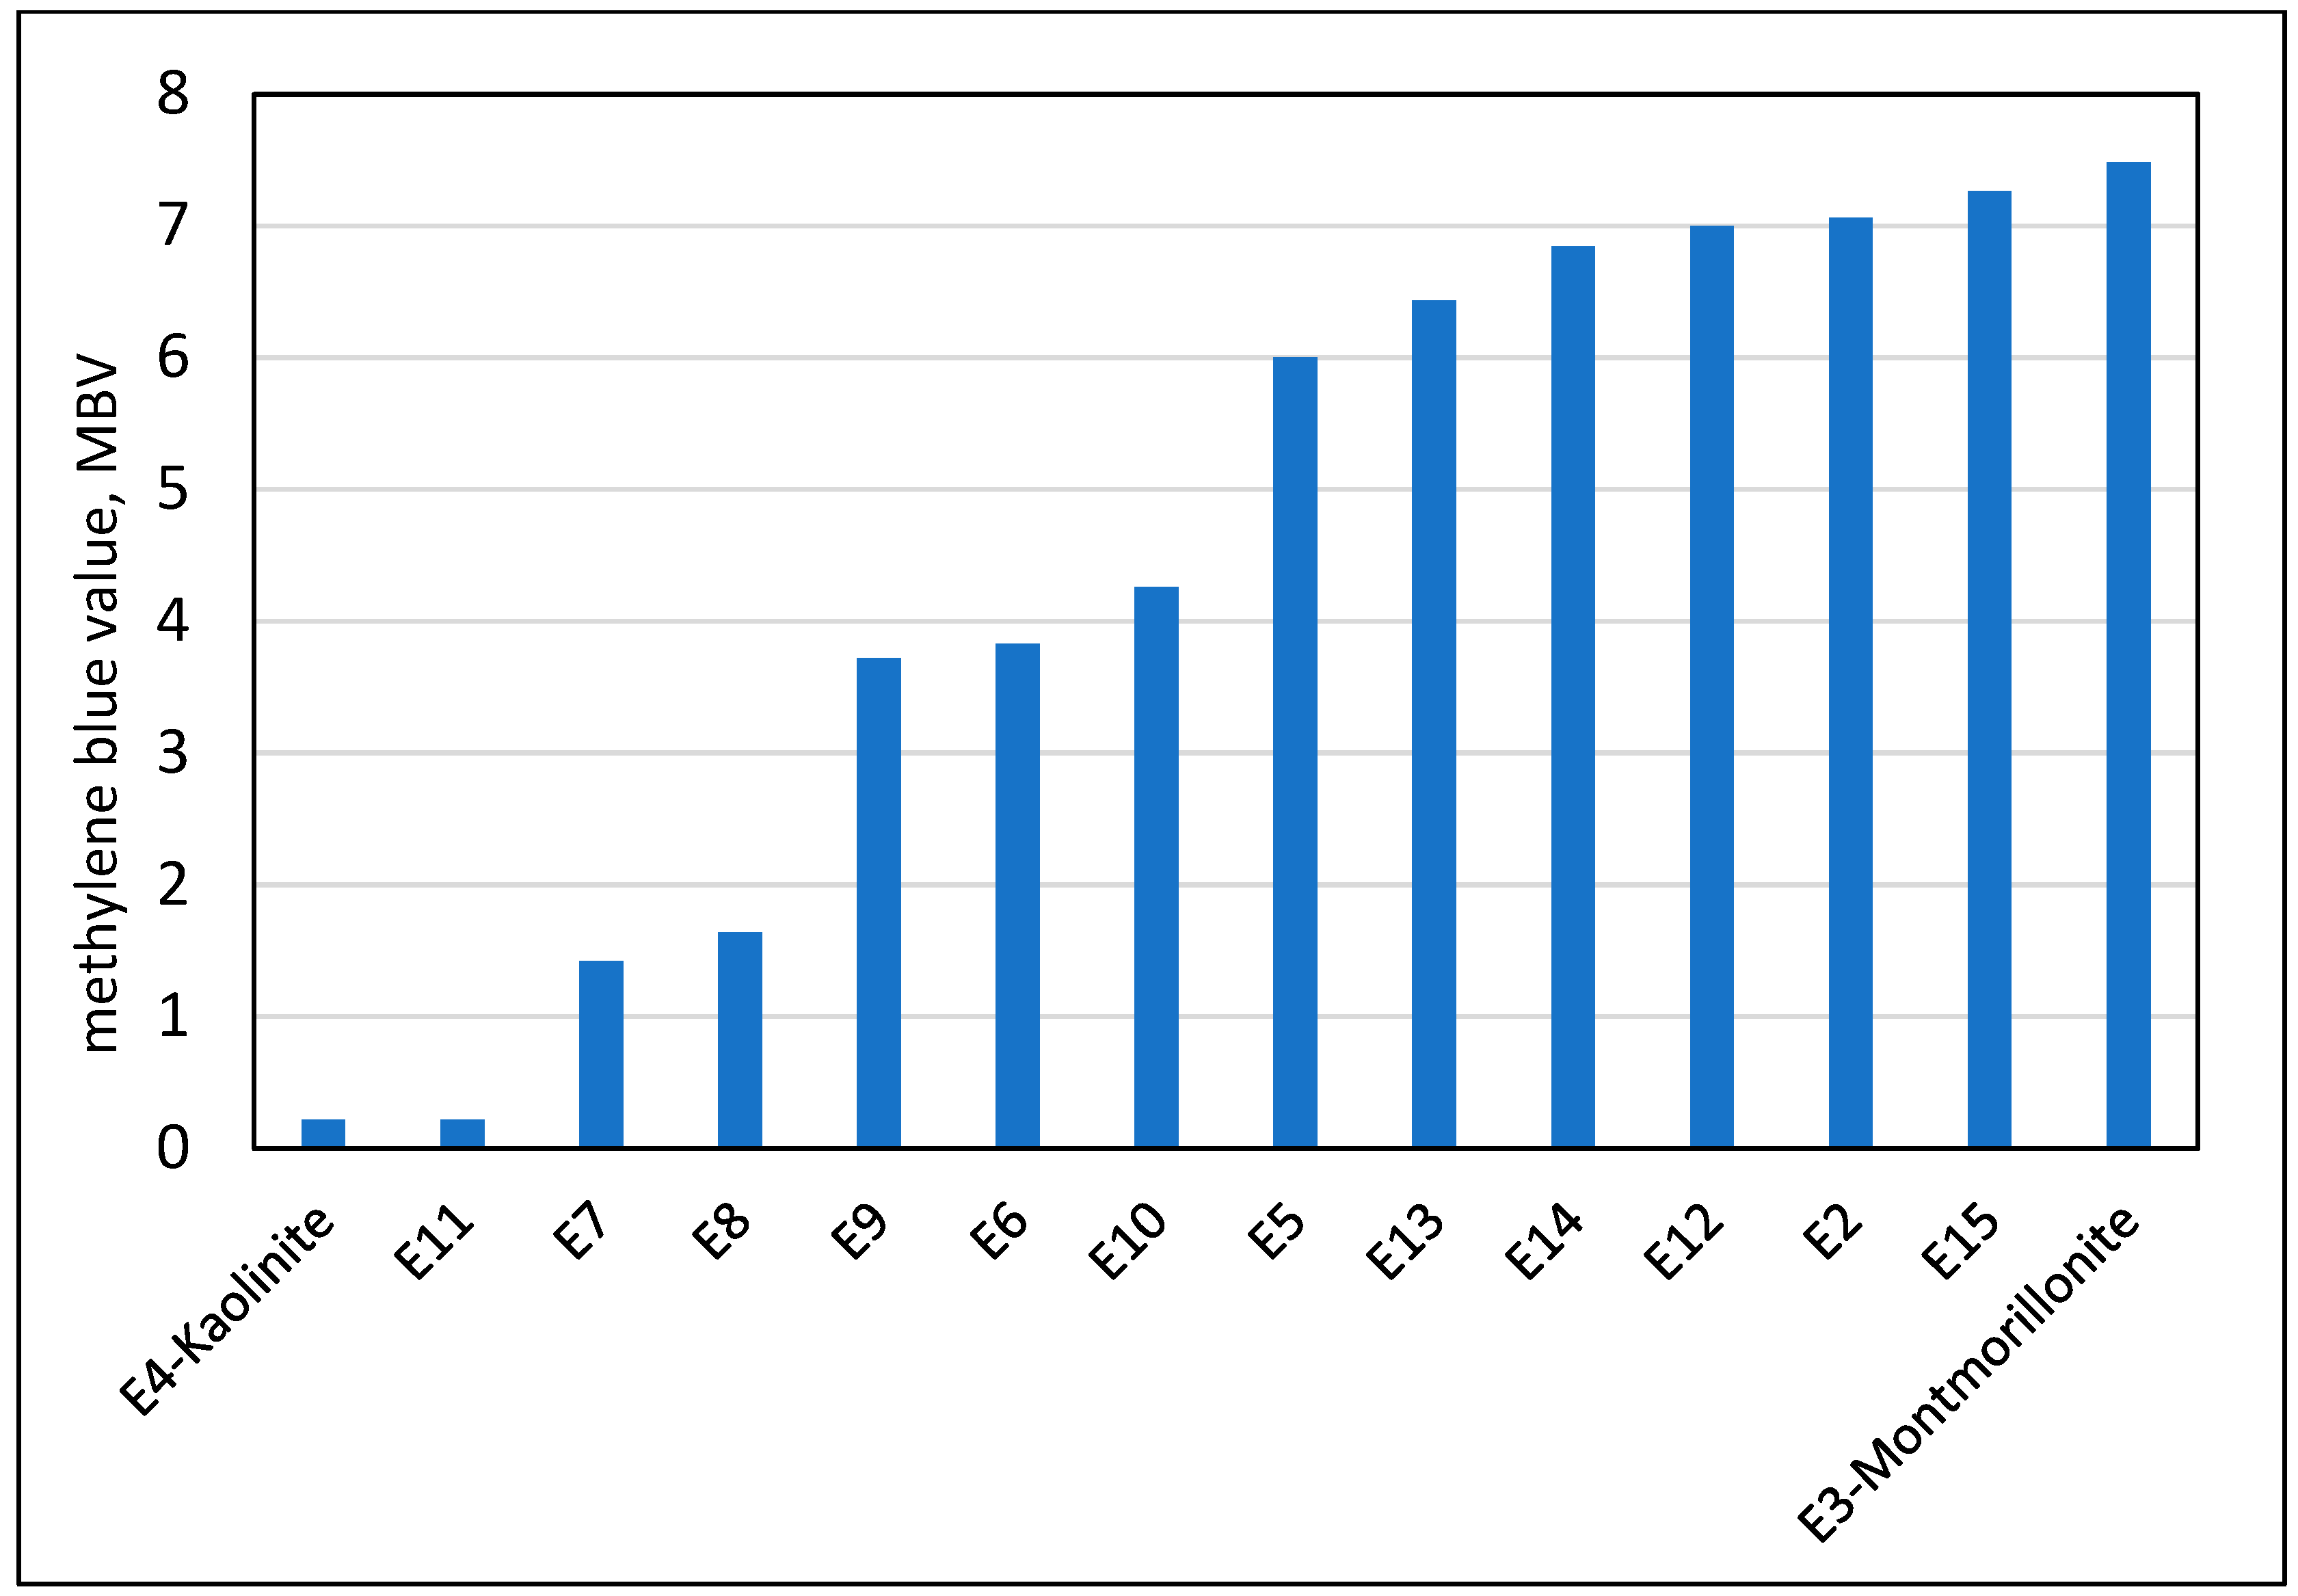
3.1. Methylene Blue Values
3.2. Mineralogical Composition
3.3. Rheological Behavior Characterization
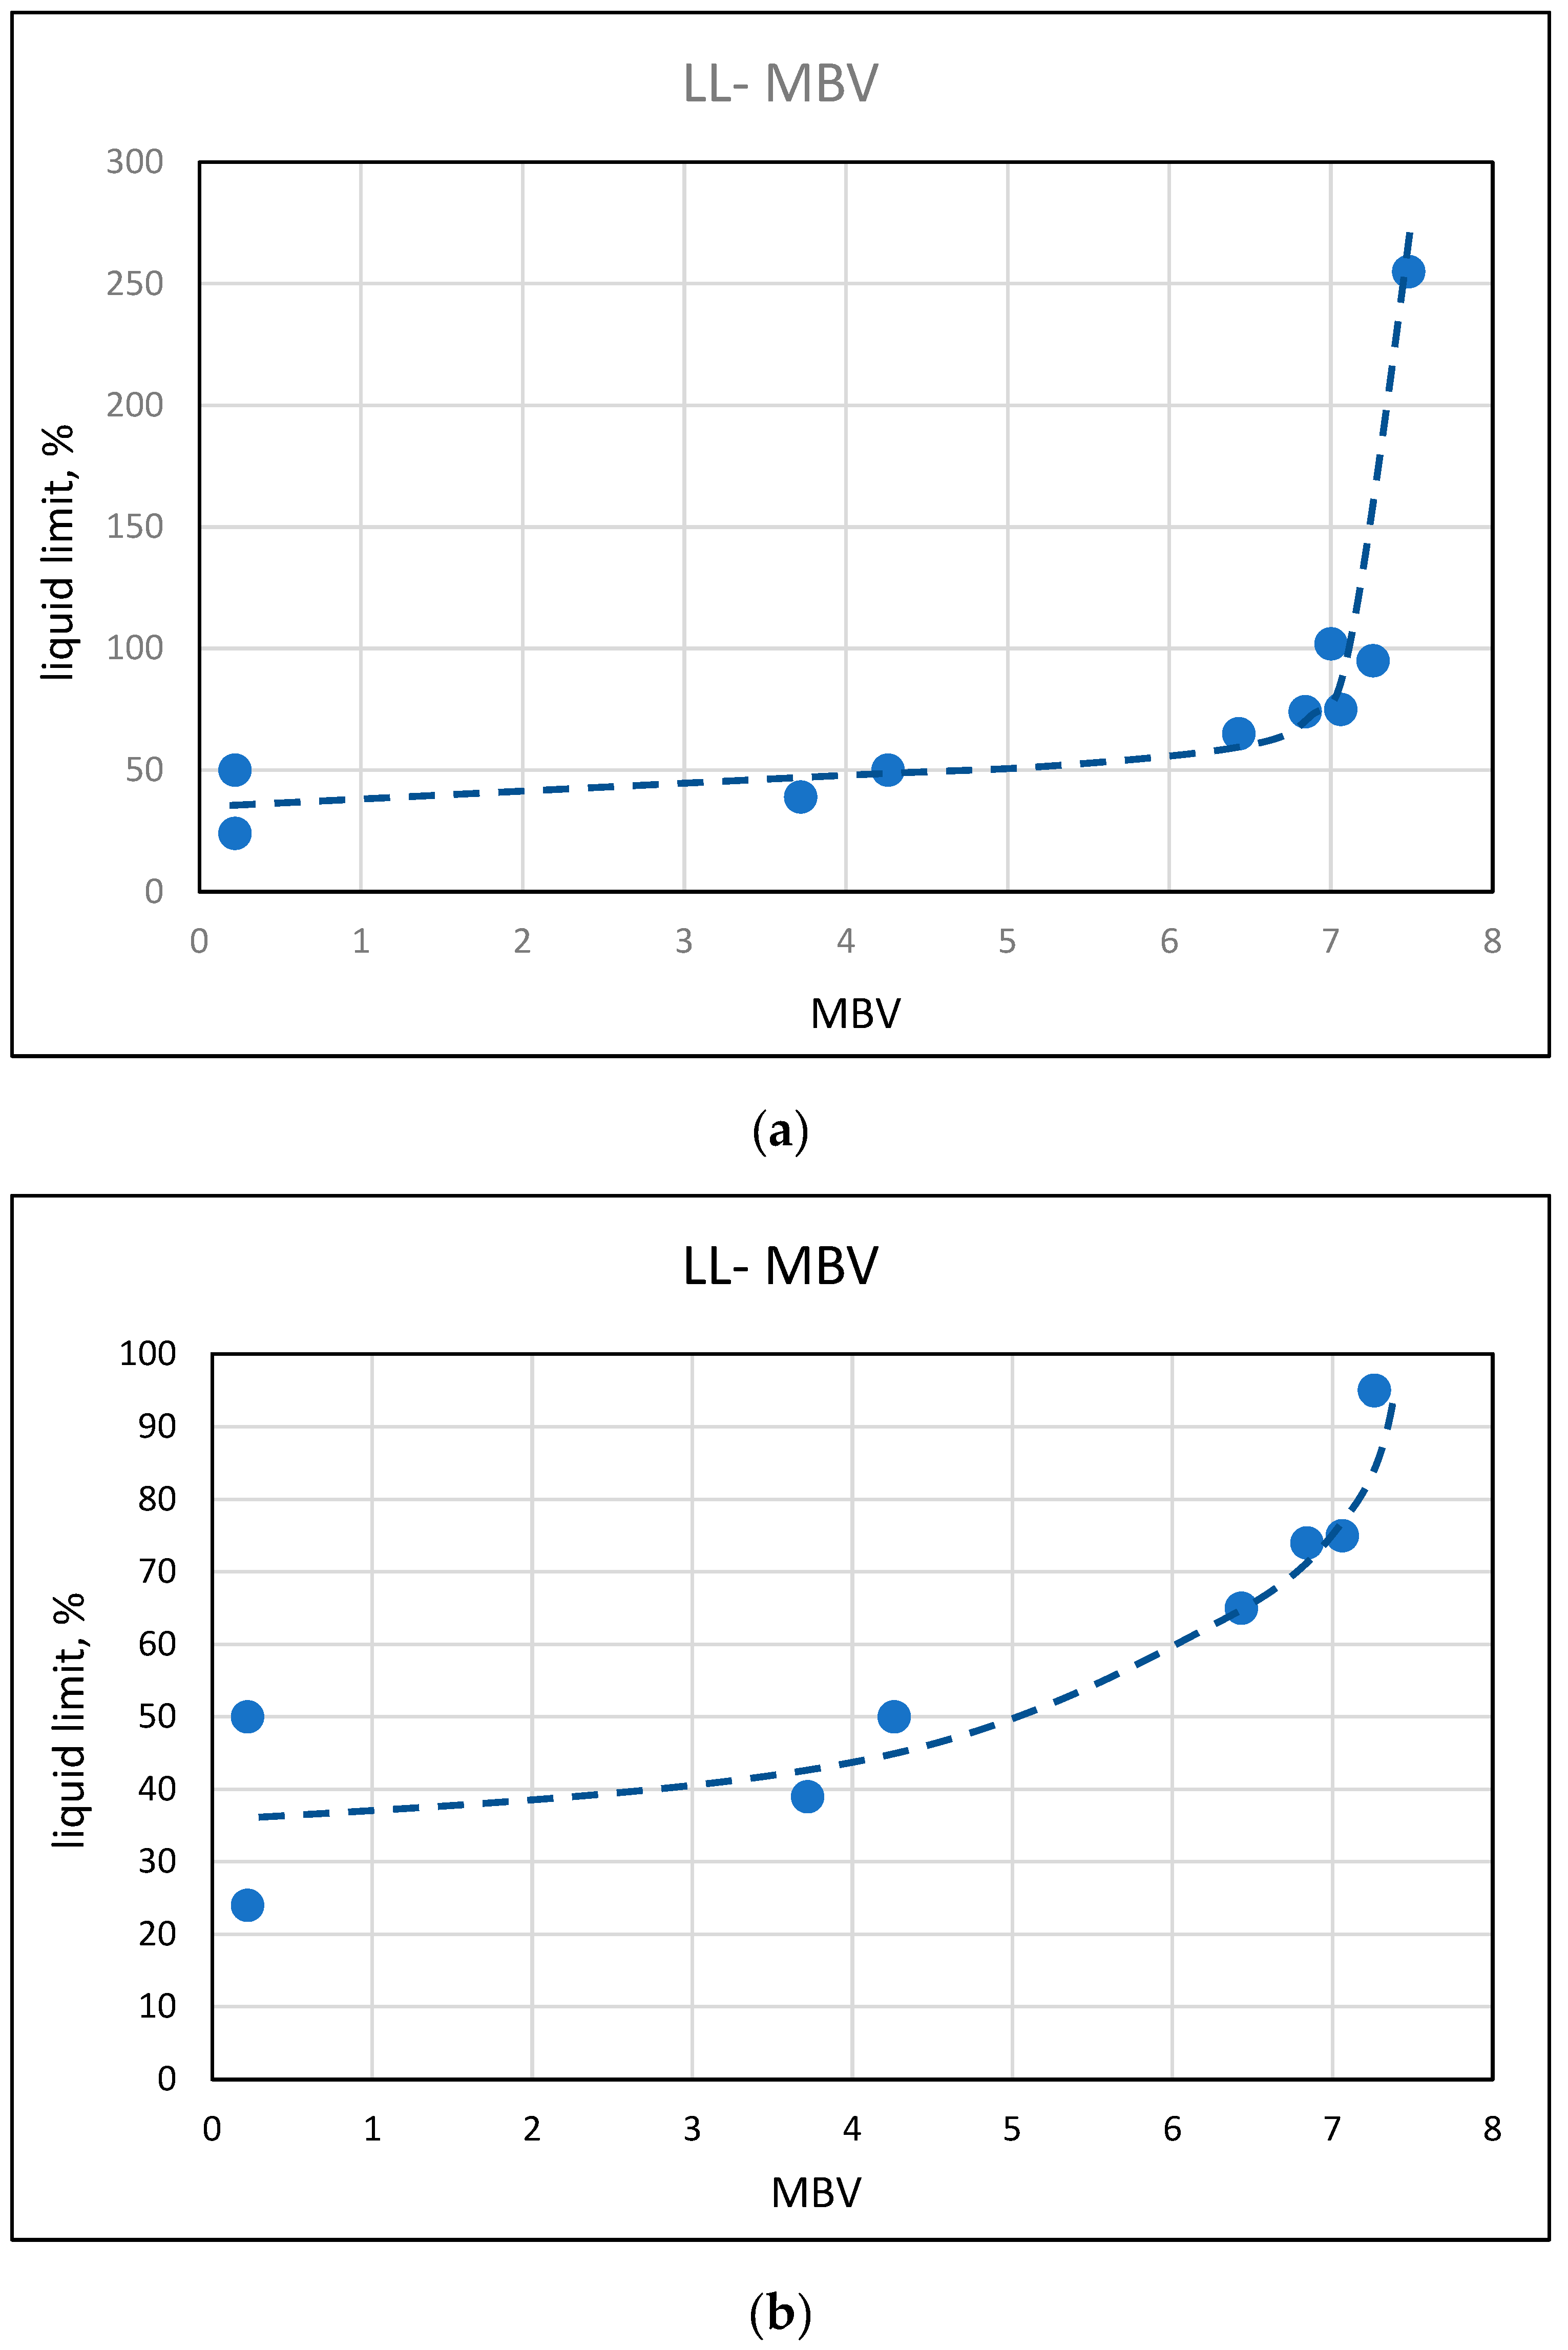
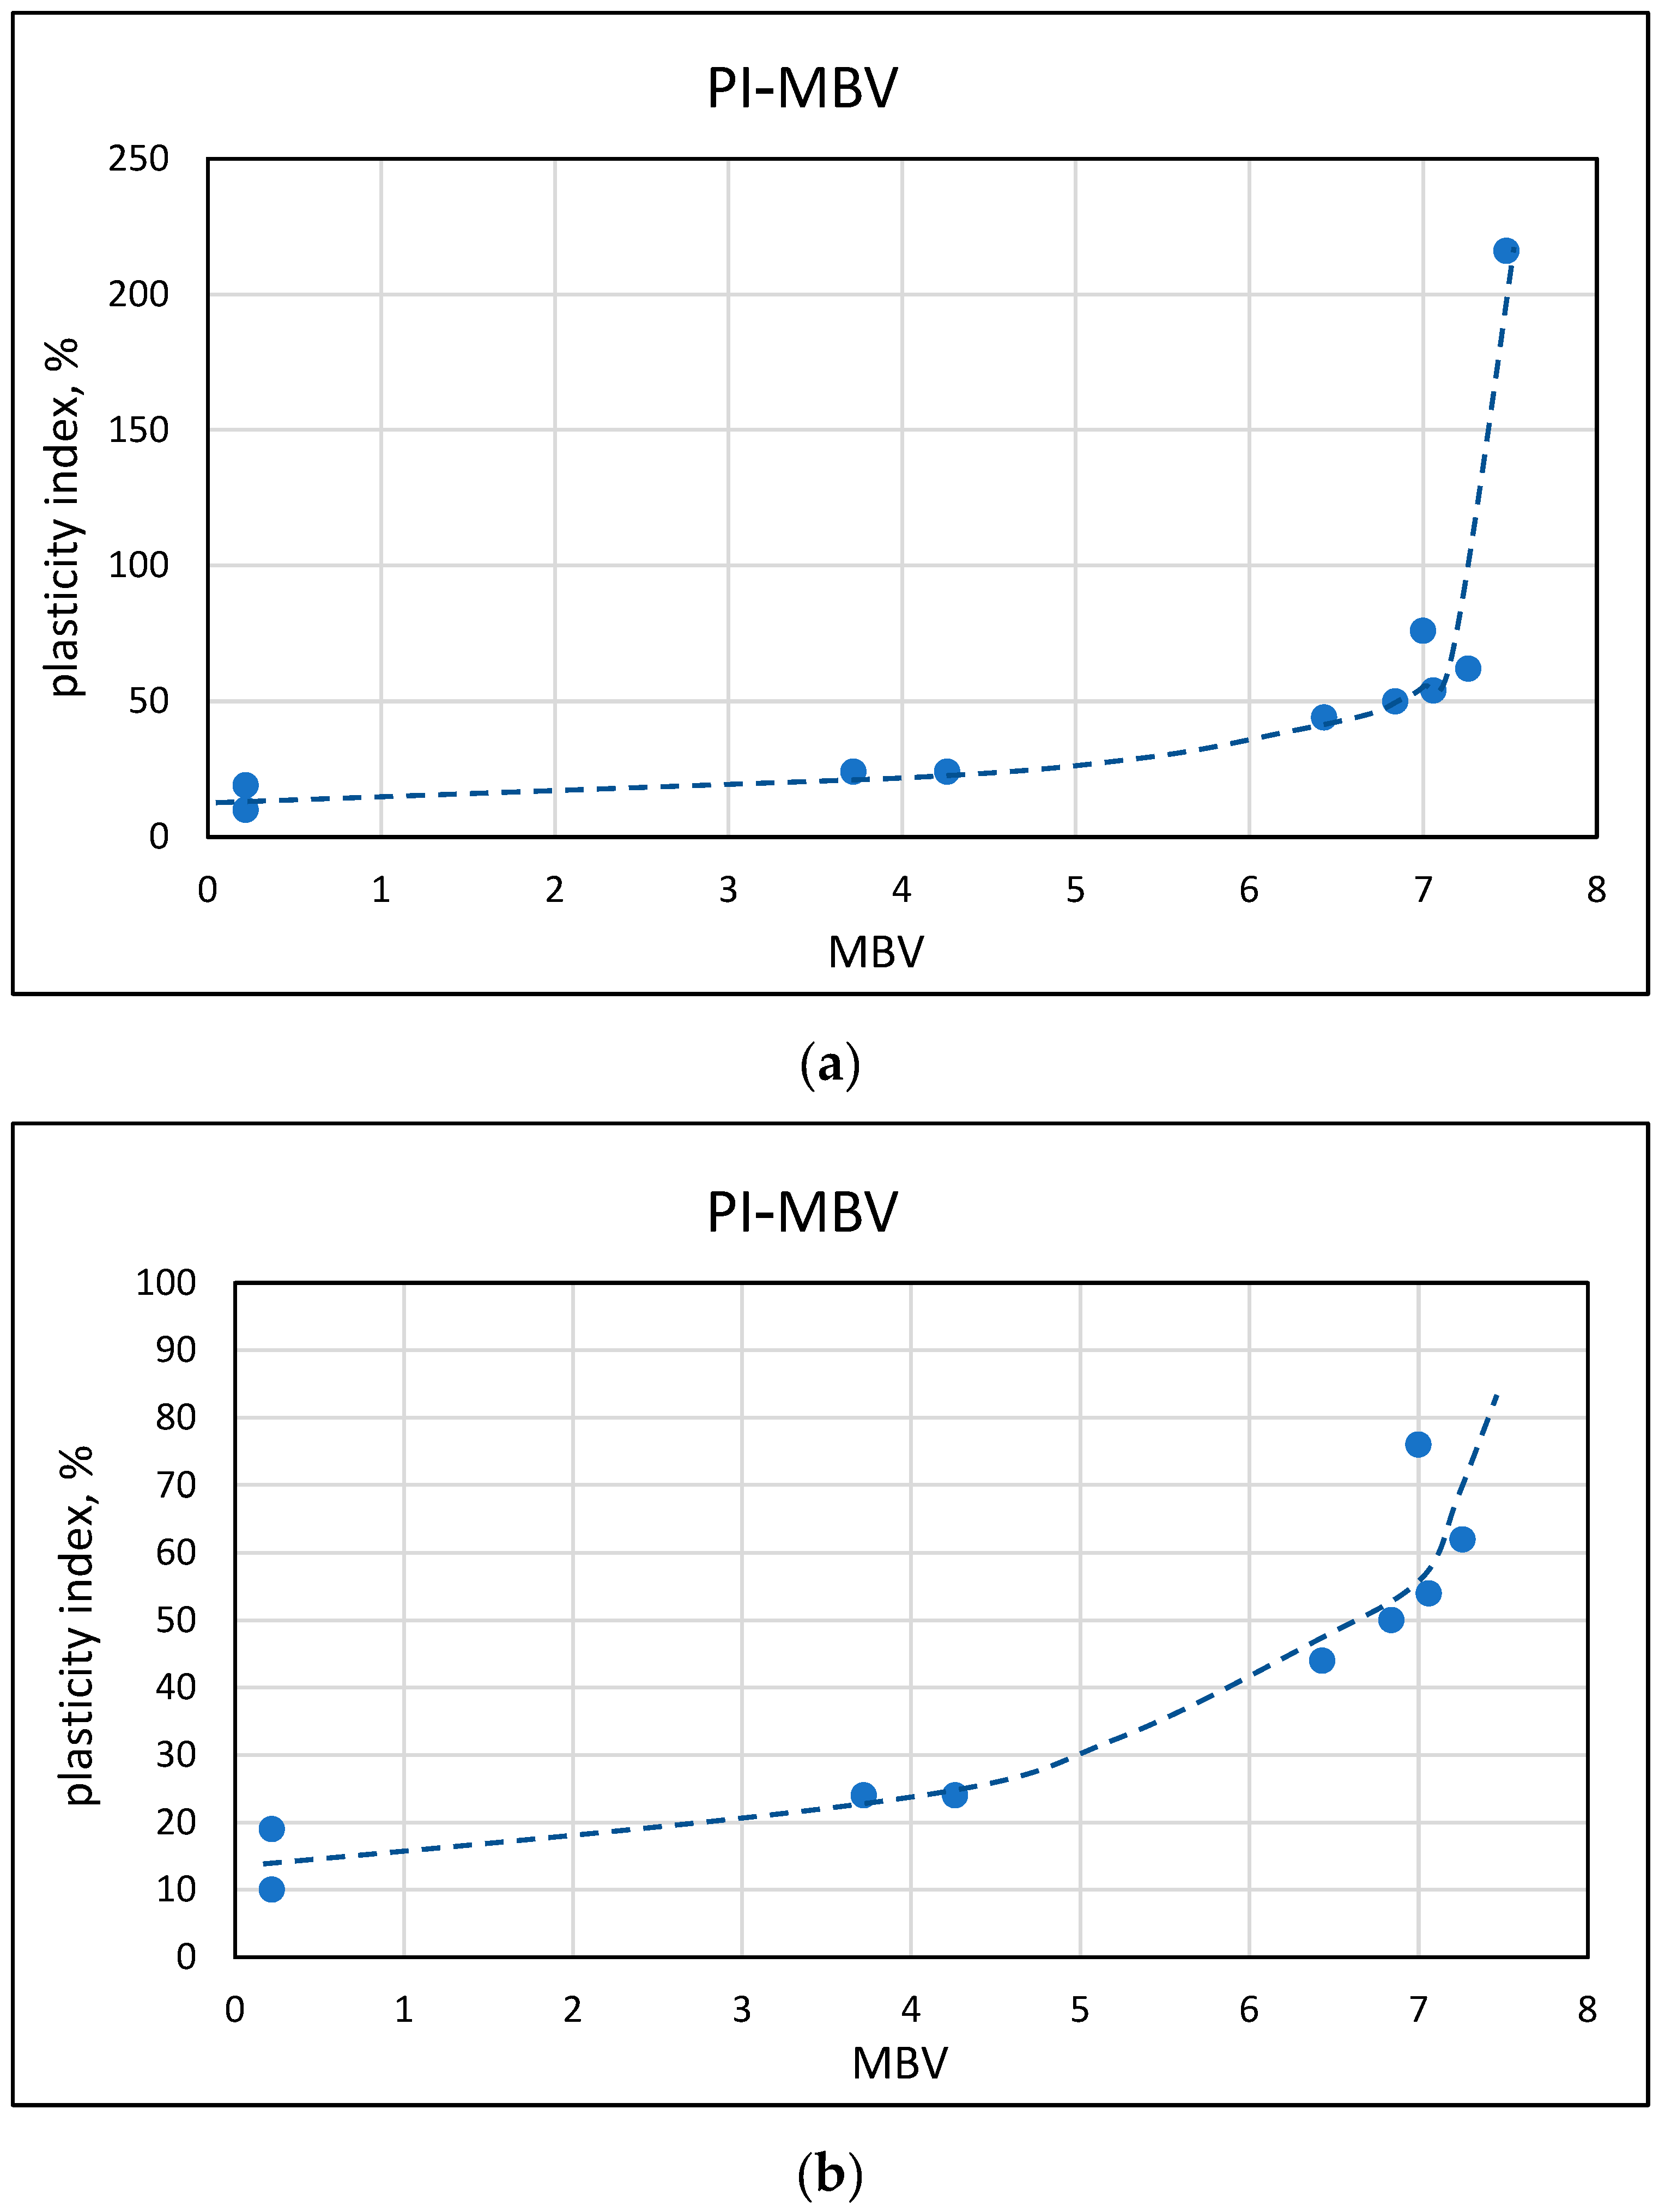
3.4. Characterization of Micro-Fines by Plasticity Tests
4. Discussion
4.1. Effects of Admixtures
4.2. Mortar Rheological Behavior
4.3. Concrete Workability Control
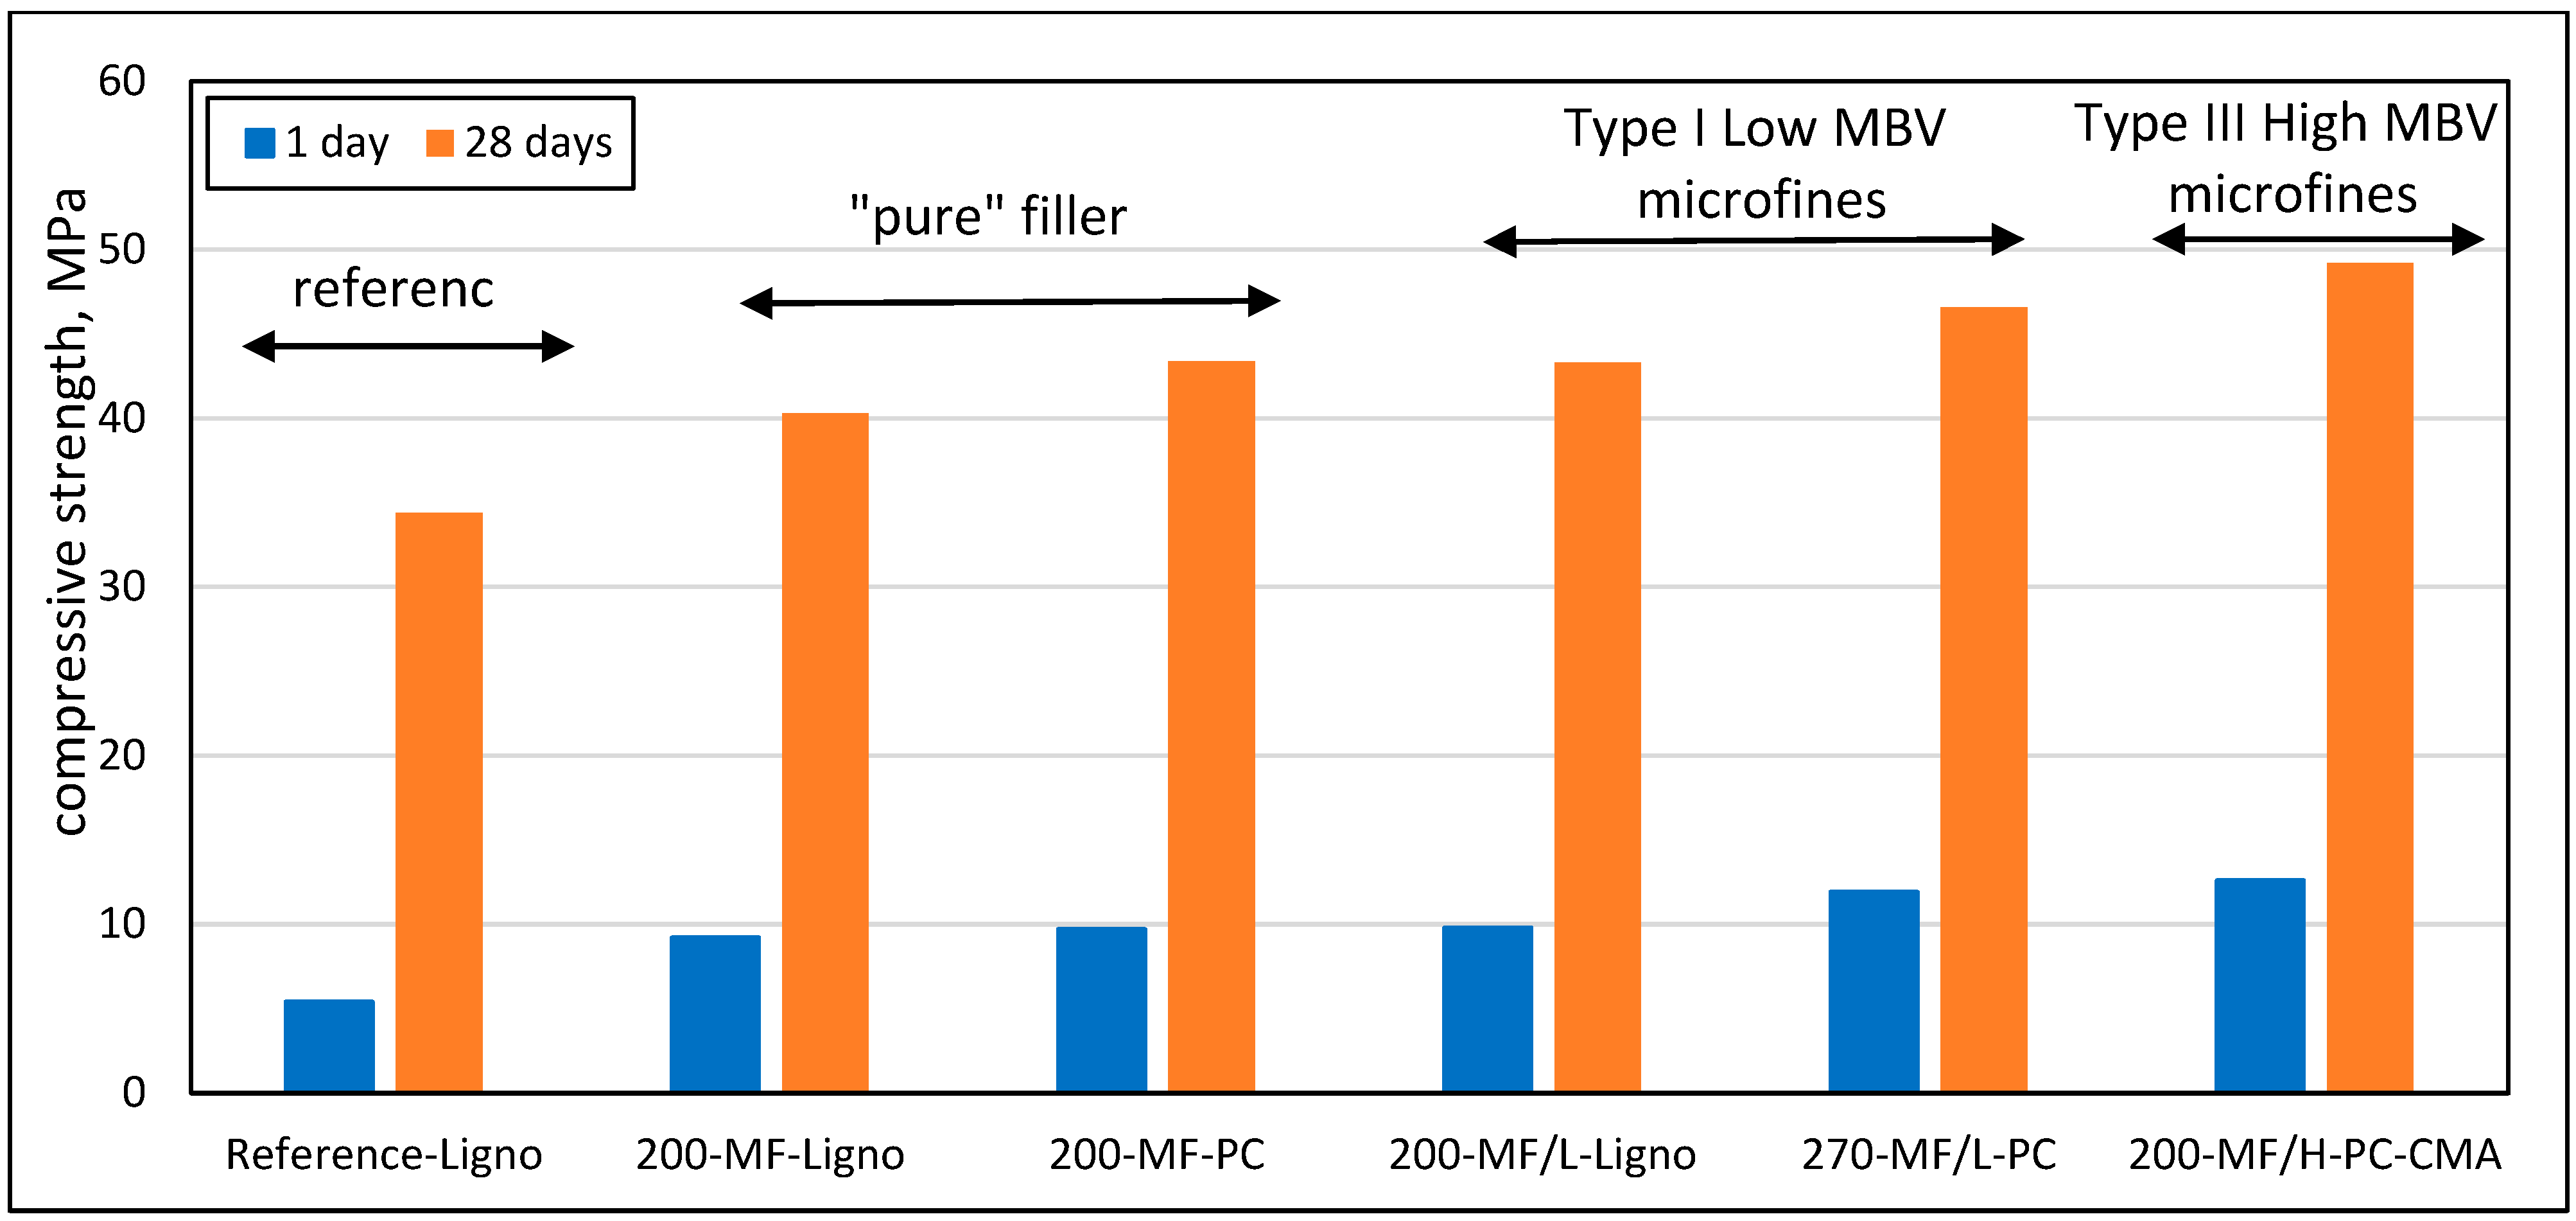
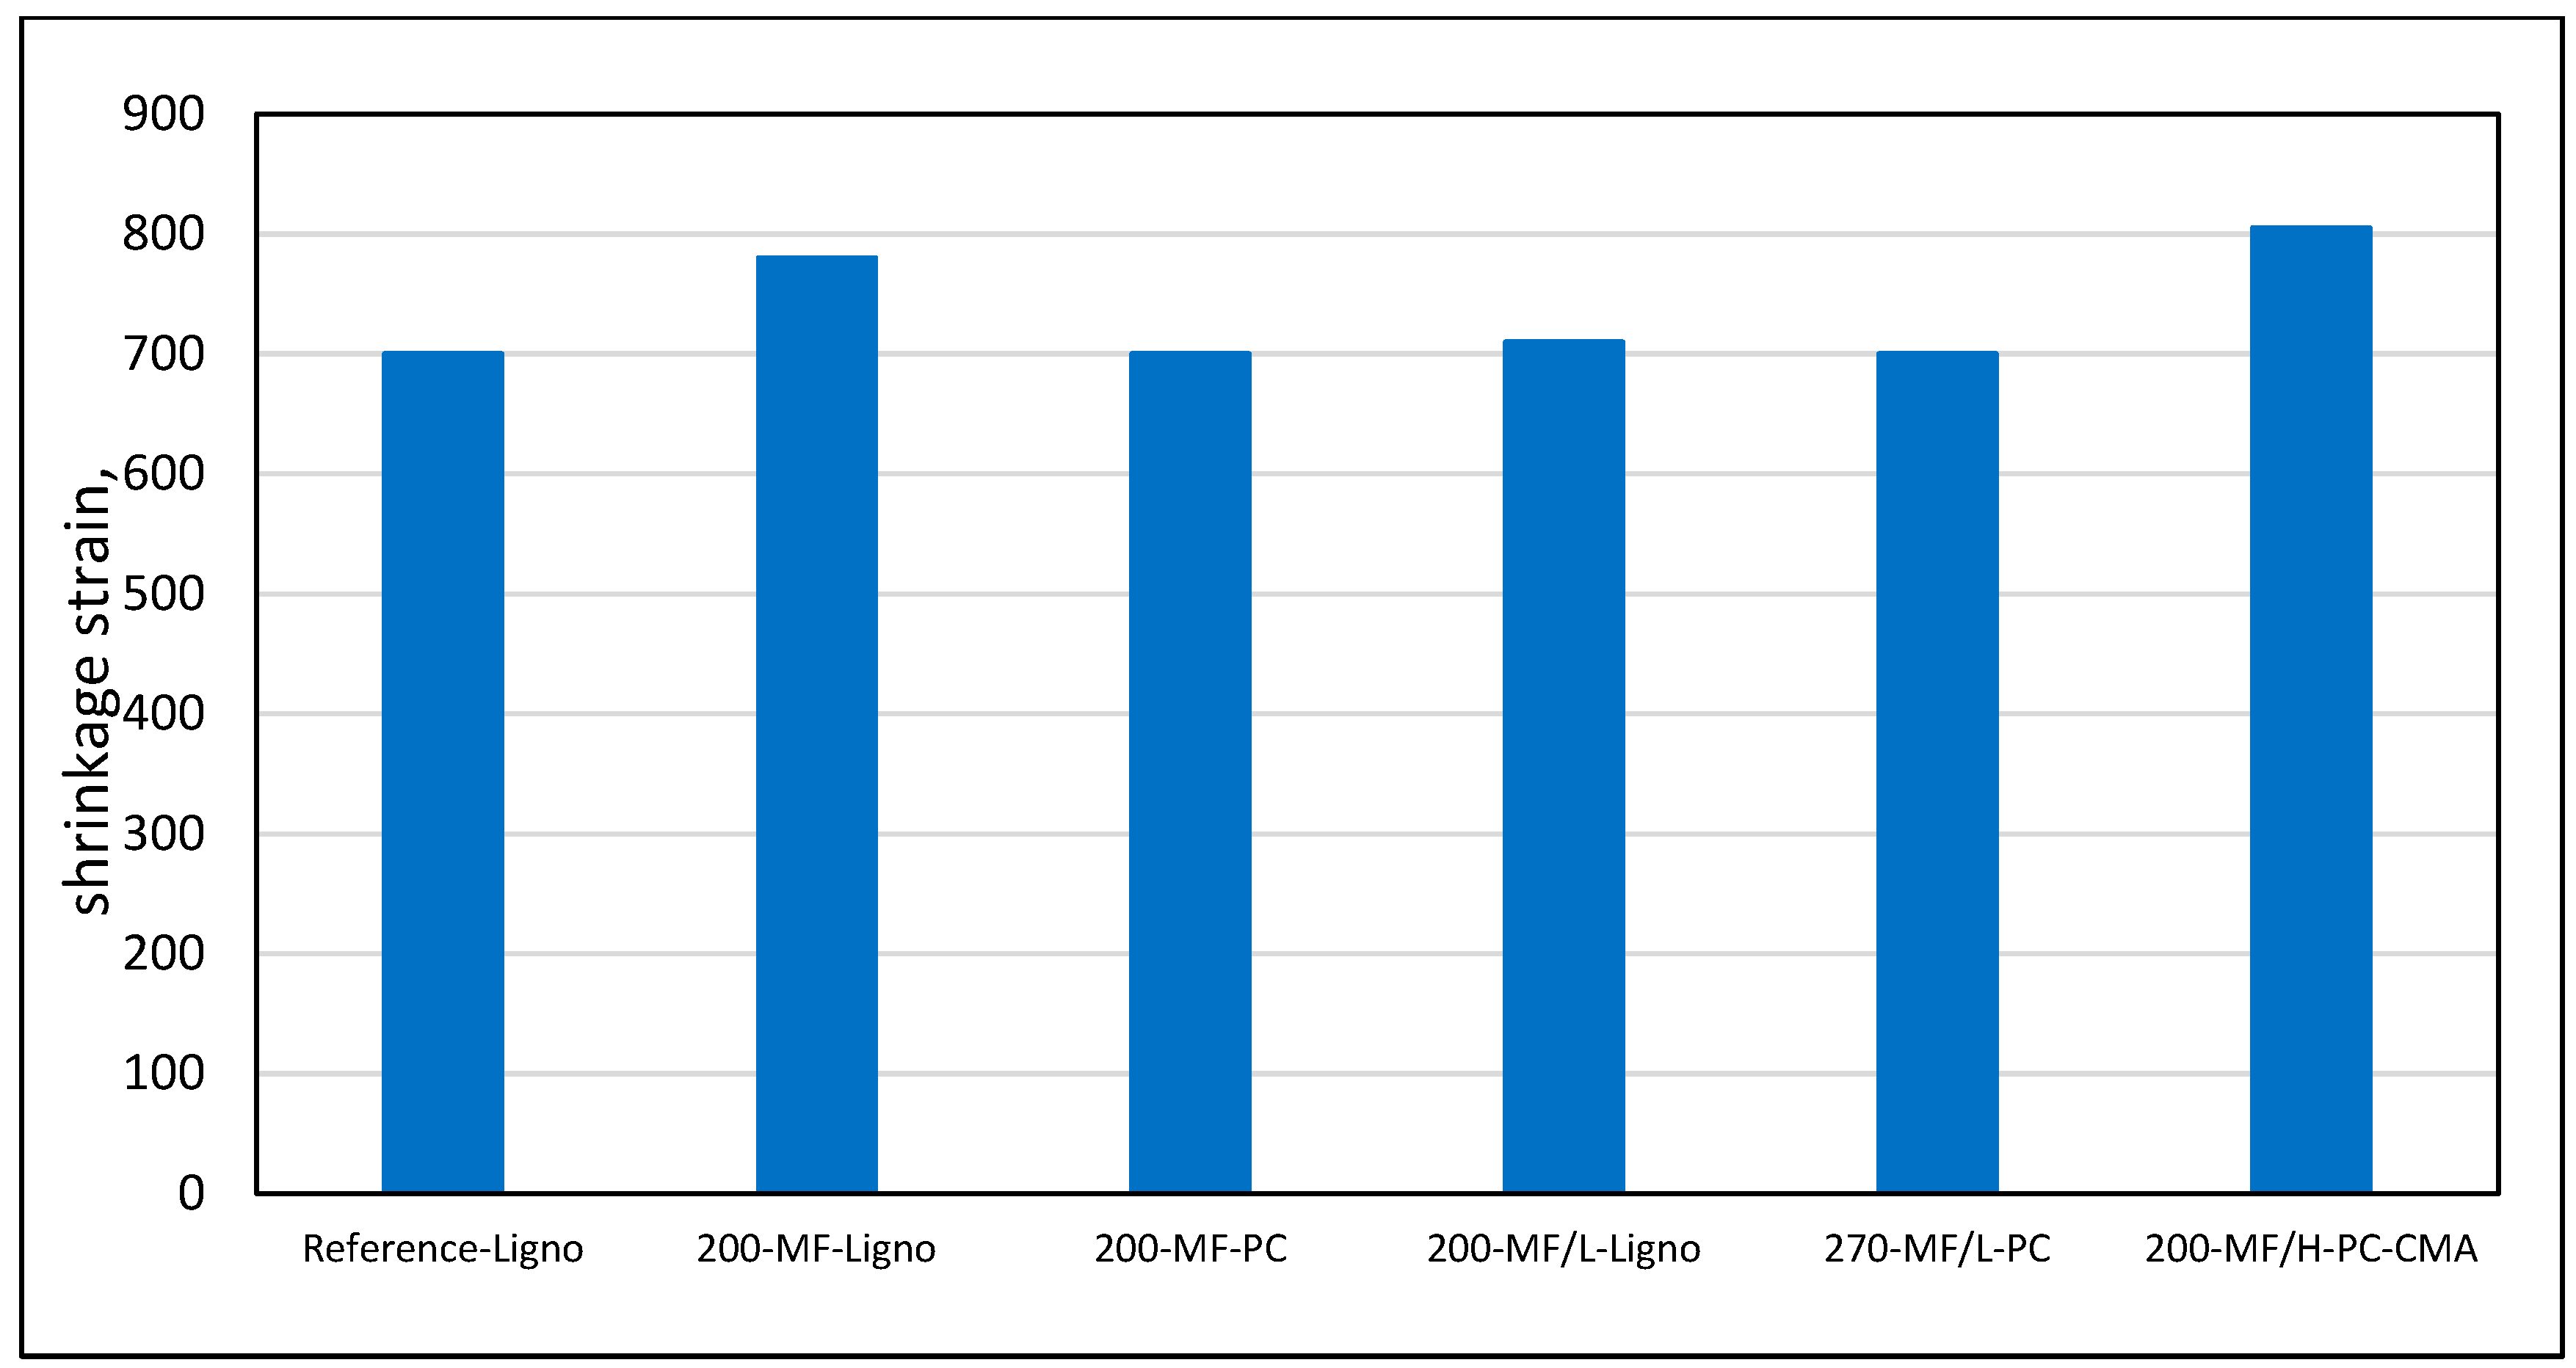
4.4. Concrete Mature Properties: Strength and Shrinkage
5. Summary and Conclusions
- The deleterious influence of clays on their rheological properties is largely due to the presence of swelling clays like Montmorillonite, whereas Kaolinite has only a small effect. This difference in behavior can be attributed to the swelling and water uptake characteristic of Montmorillonite. The methylene blue test is indicative of this influence.
- The current study indicates that when the clay content, and in particular the Montmorillonite component in it, is above about 2%, the MBV value obtained by the standard 20 g procedure, which is about 6, is not sufficiently sensitive to quantify the presence and influence of the clay. There is thus a need to resort to the 10 g procedure.
- There is potential for using high clay content aggregates based on a strategy of utilizing admixtures. Yet, for that to be effective, there is a need to develop formulations of blends of admixtures that should be adjusted for the composition and content of the clay.
- These concepts were mobilized for providing guidance on the use of high contents of micro-fines containing clays in concrete, as summarized below:
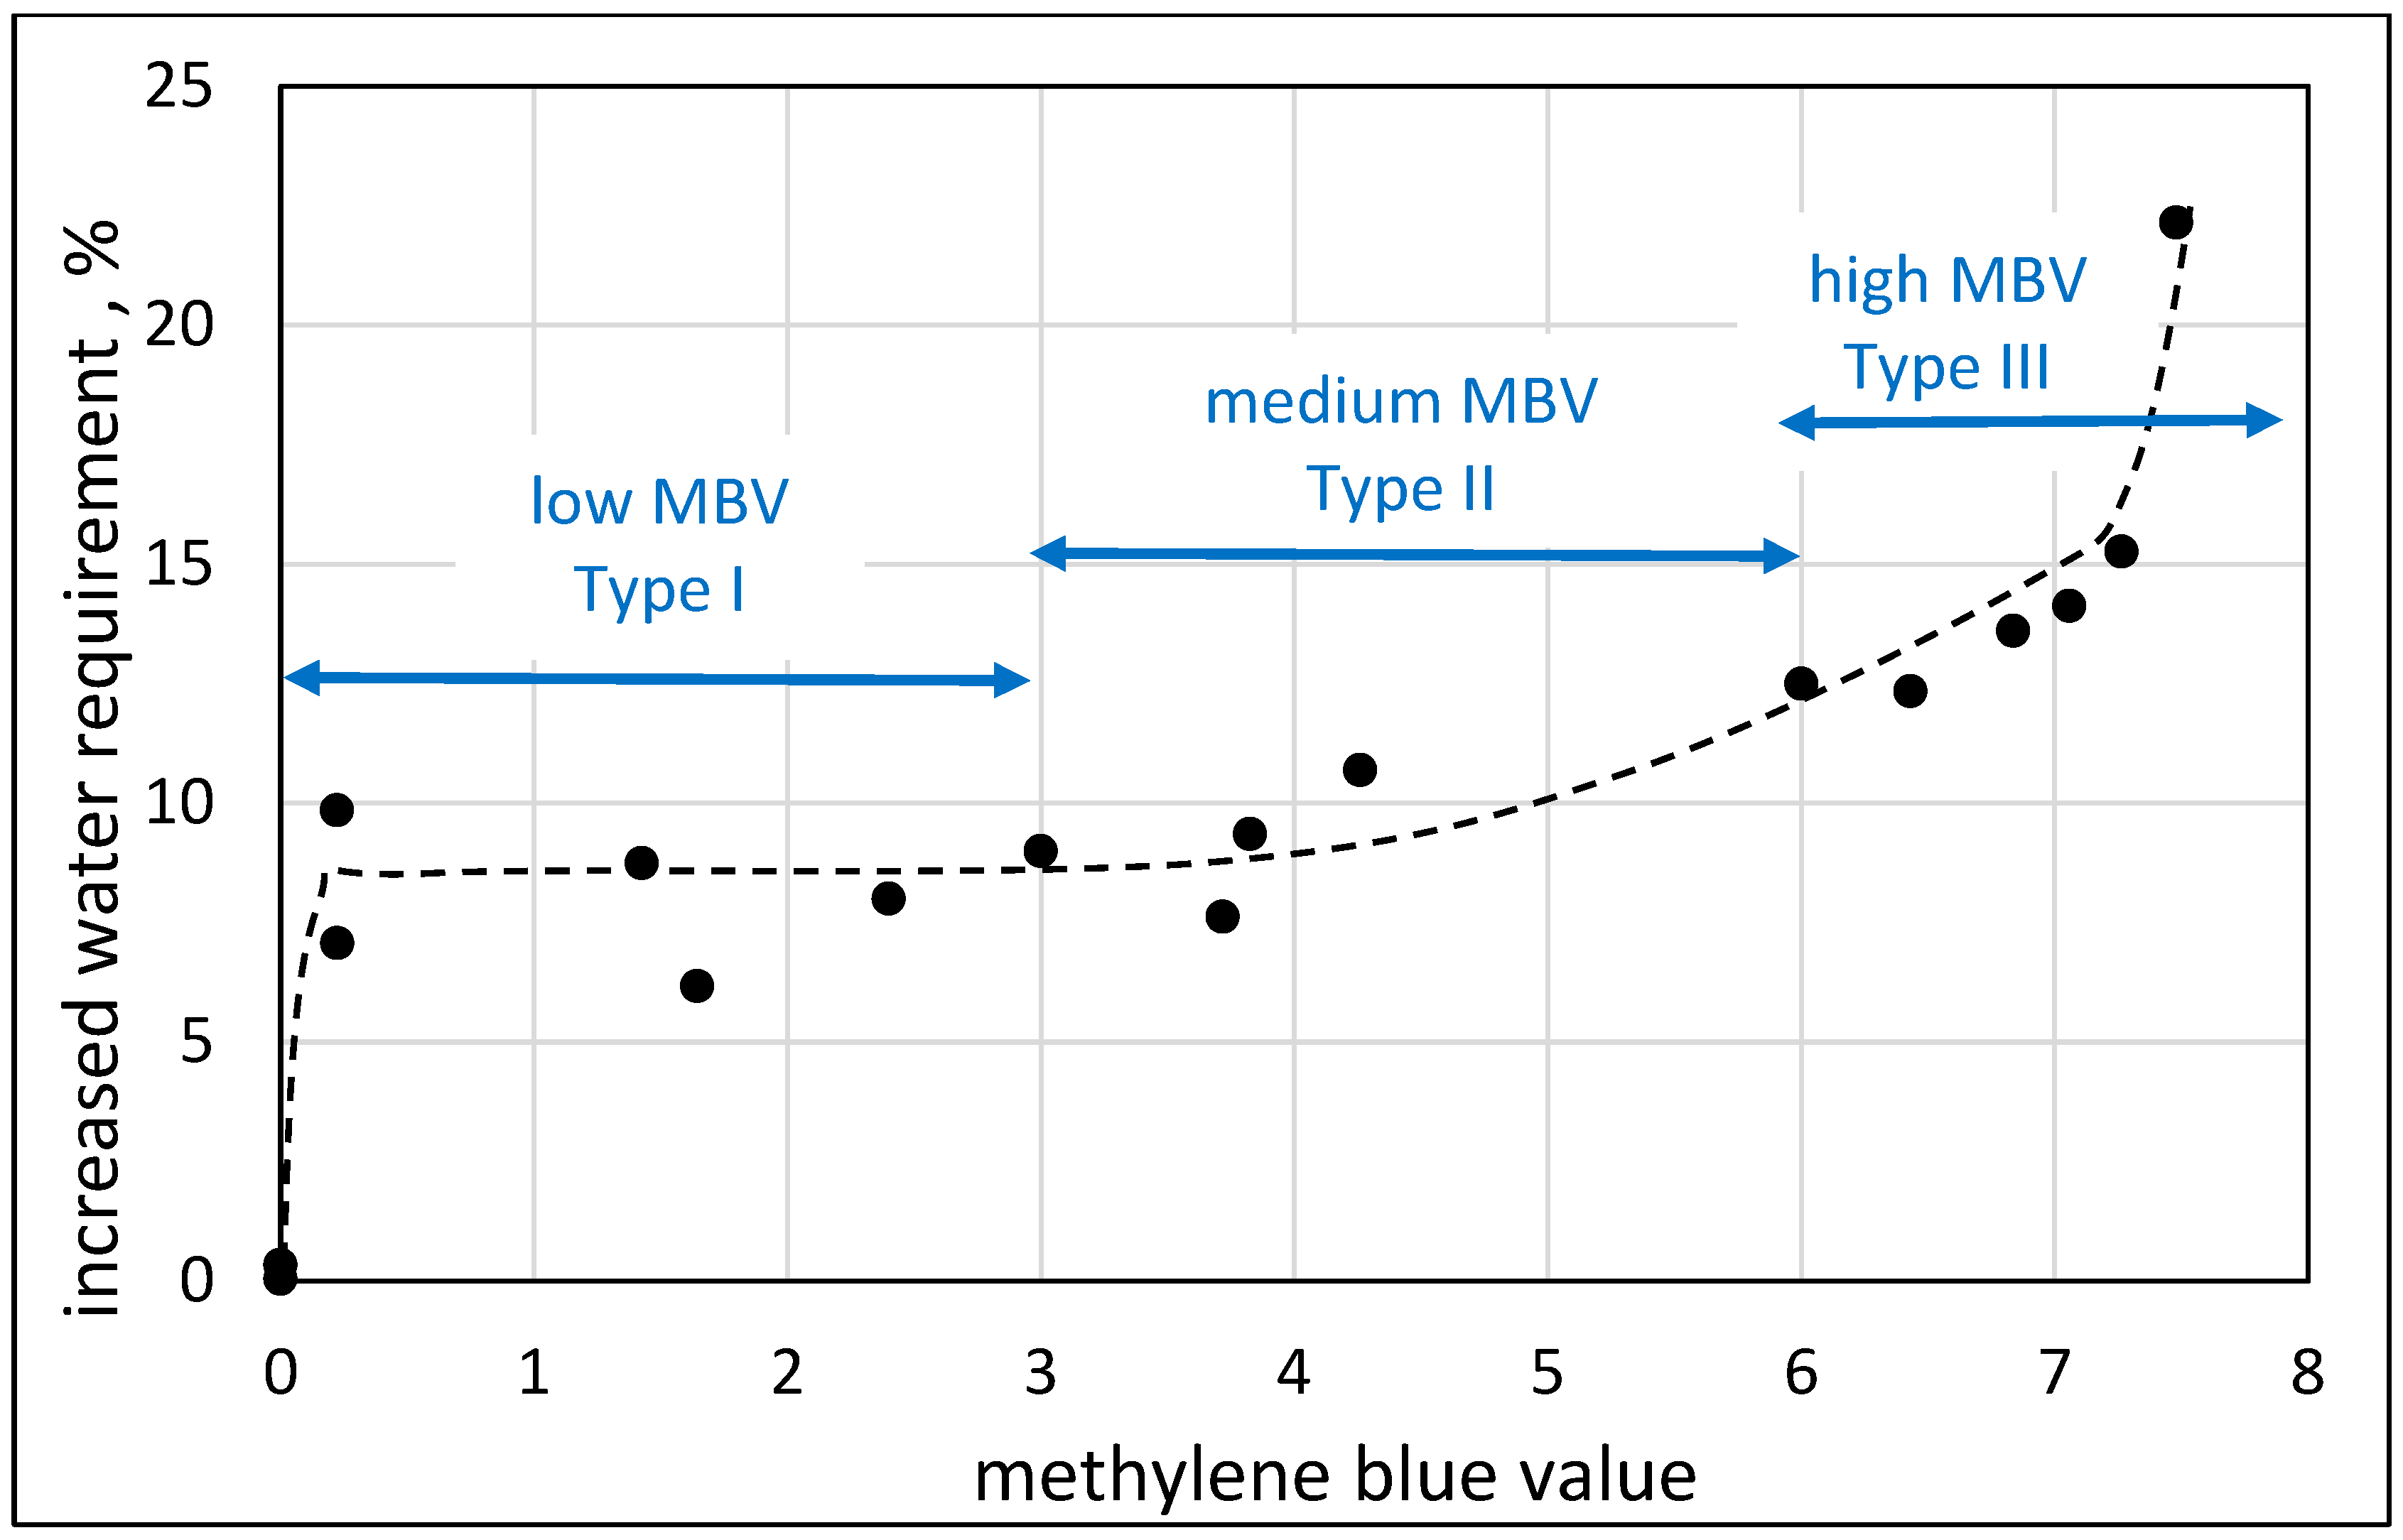
- Micro-fines can be categorized into three types, depending on their MBV; low (less than 3), medium (4–6), and high (more than 7), showing differences in increased water demand in each category.
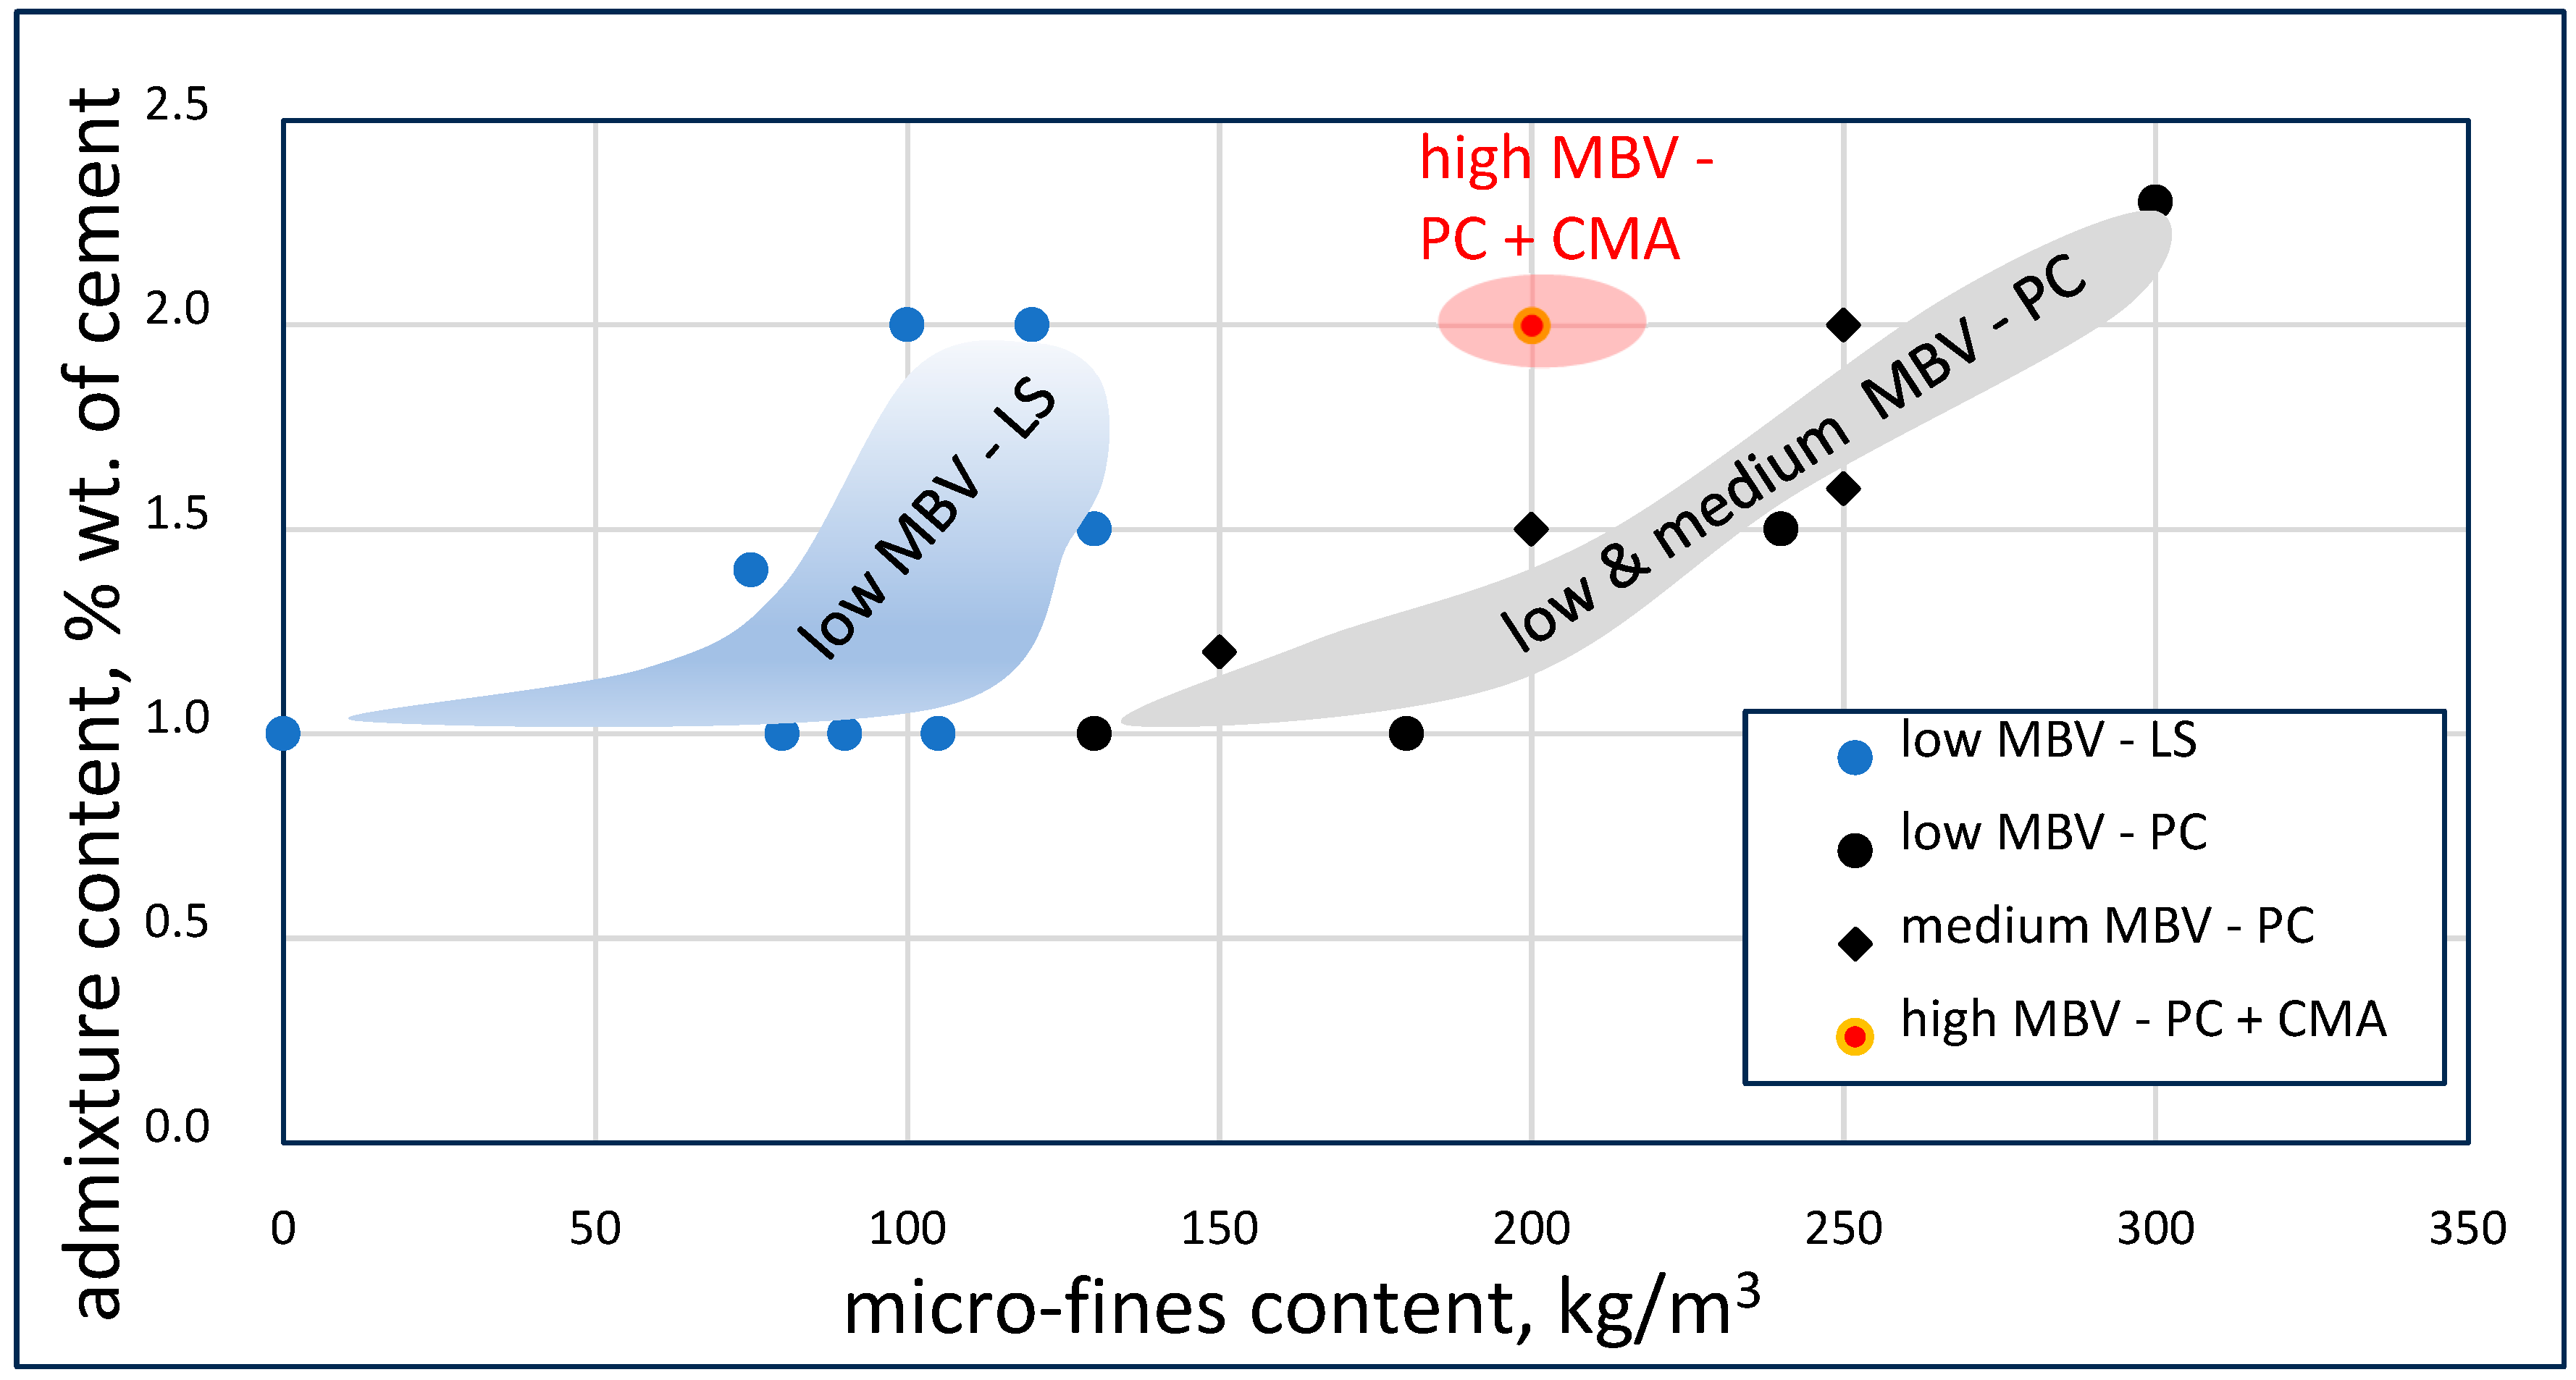
- The strategy for neutralizing the effect of micro-fines on increased water demand in concrete can be quantified in terms of the combination of their content in concrete and their MBV; this is a more rational approach to considering their influence than their content in specific aggregates as specified in standards.
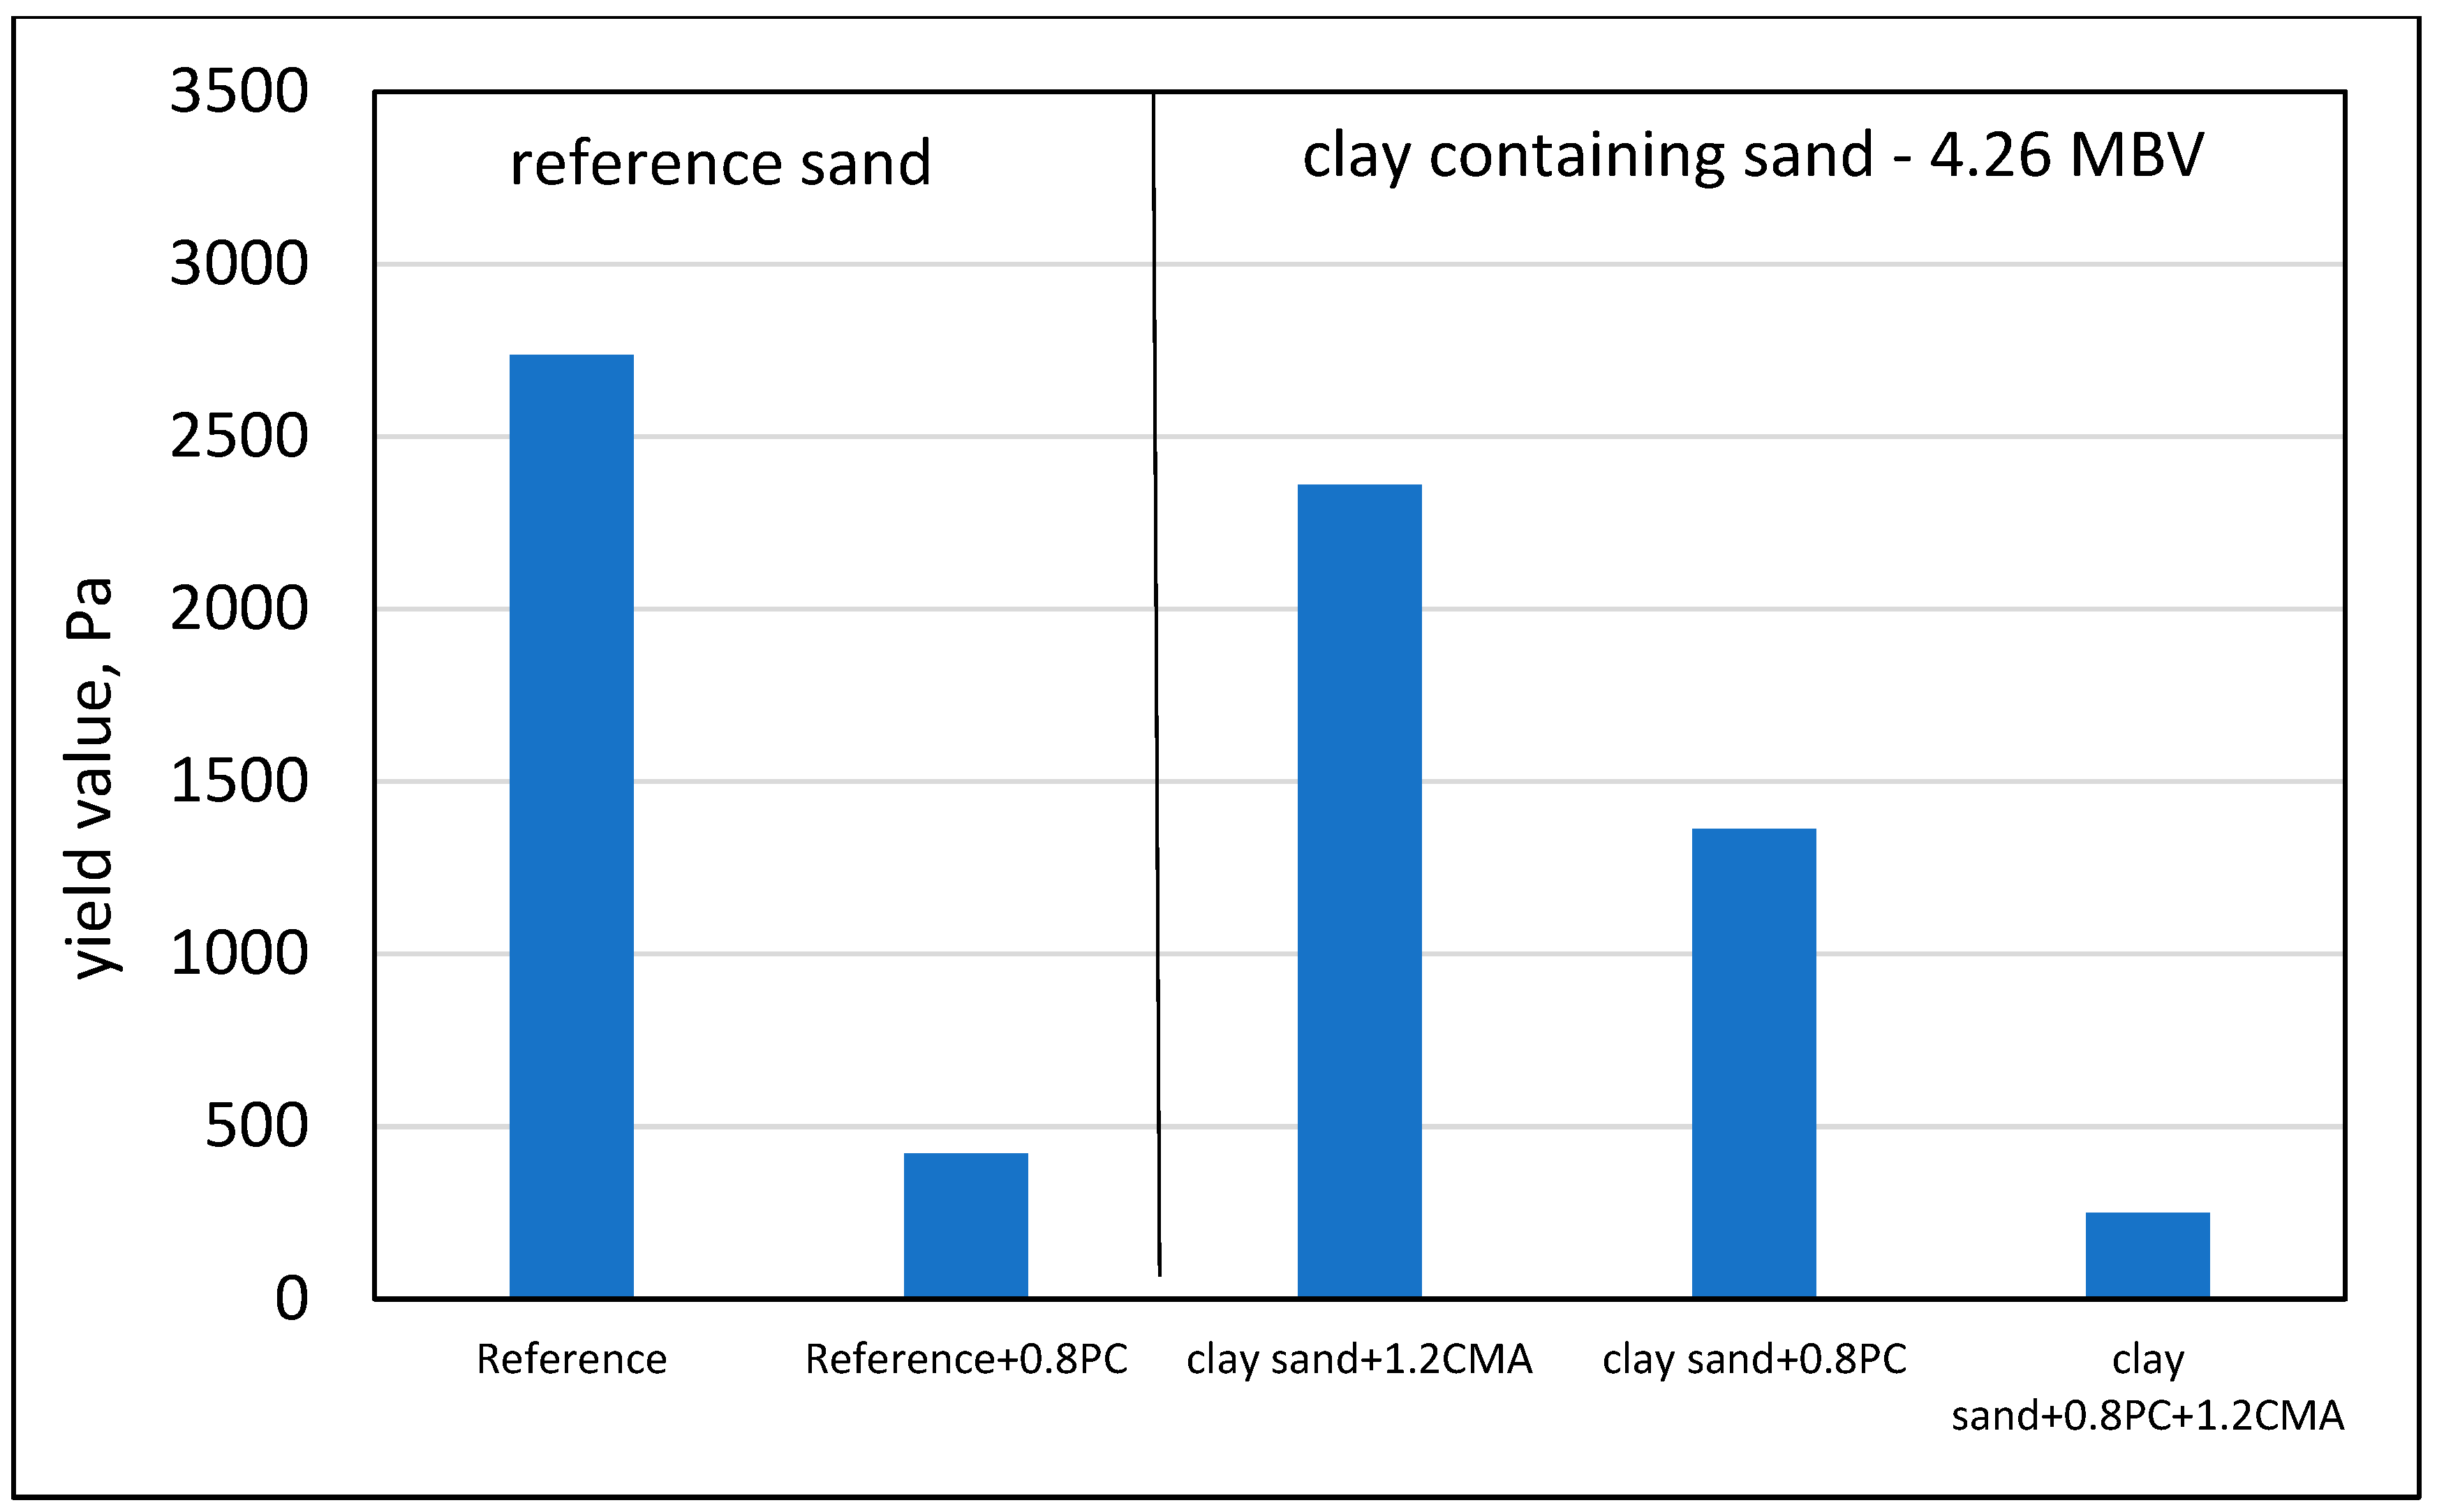
- The effect of low and medium MBV aggregates on the water requirement can be neutralized by lignosulfonates when their content in the concrete is below a threshold value of about 150 kg/m3; PC is required at higher contents; for high MBV aggregates, a combination of PC and CMA is required.
- At the optimum admixture content and type, high micro-fines content in aggregates can provide a beneficial effect on strength, suggesting that the filler effect is being mobilized without having a detrimental effect on shrinkage. This beneficial effect can be mobilized to reduce cement contents in concrete.
Author Contributions
Funding
Institutional Review Board Statement
Data Availability Statement
Acknowledgments
Conflicts of Interest
References
- EN 12620. Available online: https://www.google.com.hk/url?sa=t&source=web&rct=j&opi=89978449&url=https://dl.azmanco.com/standards/EN/EN%252012620.pdf&ved=2ahUKEwiipJ_kiIWIAxX_oa8BHdNjFsYQFnoECCUQAQ&usg=AOvVaw2IjeRwxWWFyMUmrNTHZvYT (accessed on 10 July 2023).
- Katz, A.; Baum, H. Effect of high levels of fines content on concrete properties. ACI Mater. J. 2006, 103, 474. [Google Scholar]
- Quiroga, P.N.; Ahn, N.; Fowler, D.W. Concrete mixtures with high microfines. ACI Mater. J. 2006, 103, 258–264. [Google Scholar]
- Nehdi, M.I. Clay in cement based materials: Critical review of state of the art. Constr. Build. Mater. 2014, 51, 372–382. [Google Scholar] [CrossRef]
- Nikolaides, A.; Manthos, E.; Sarafidou, M. Sand equivalent and methylene blue value of aggregates for highway engineering. Found. Civ. Environ. Eng. 2007, 10, 111–121. [Google Scholar]
- Yool, A.J.G.; Lees, T.P.; Fried, A. Improvements to the methylene blue dye test for harmful clay in aggregates for concrete and mortar. Cem. Concr. Res. 1998, 28, 1417–1428. [Google Scholar] [CrossRef]
- Yukselen, Y.; Kaya, A. Suitability of the methylene blue tests for surface area, cation exchange capacity and swell potential of clayey soils. Eng. Geol. 2008, 102, 38–45. [Google Scholar] [CrossRef]
- Fernandes, V.A.; Purnell, P.; Still, G.T.; Thomas, T.H. The effect of clay content in sands used for cementitious materials in developing countries. Cem. Concr. Res. 2007, 37, 751–758. [Google Scholar] [CrossRef]
- Tregger, N.A.; Pakula, M.E.; Shah, S.P. Influence of clays on the rheology of cement pastes. Cem. Concr. Res. 2010, 40, 384–391. [Google Scholar] [CrossRef]
- Kaci, A.; Chaouche, M.; Andreani, P.A. Influence of bentonite clay on the rheological behavior of fresh mortars. Cem. Concr. Res. 2011, 41, 373–379. [Google Scholar] [CrossRef]
- Chang, T.P.; Shih, J.Y.; Yang, K.M.; Hsiao, T.C. Material properties of Portland cement paste with nano-montmorillonite. J. Mater. Sci. 2007, 42, 478–487. [Google Scholar] [CrossRef]
- Kuo, W.Y.; Huang, J.S.; Lin, C.H. Effects of organo-modified montmorillonite on strength and permeability of cement mortars. Cem. Concr. Res. 2006, 36, 886–895. [Google Scholar] [CrossRef]
- Norvell, J.K.; Stewart, J.G.; Juenger, M.C.G.; Fowler, D.W. Influence of clay-sized particles on concrete performance. ASCE J. Mater. Mater. Civ. Eng. 2007, 19, 1053–1059. [Google Scholar] [CrossRef]
- Lei, L.; Plank, J. A study on the impact of different clay minerals on the dispersing force of conventional and modified vinyl ether based polycarboxylate superplasticizers. Cem. Concr. Res. 2014, 60, 1–10. [Google Scholar] [CrossRef]
- Quintero, L. An overview of surfactant applications in drilling fluids for the petroleum industry. J. Dispers. Sci. Technol. 2002, 23, 393–404. [Google Scholar] [CrossRef]
- Jeknavorian, A.A.; Jardine, L.; Ou, C.C.; Koyata, H.; Folliard, K. Interaction of superplasticizers with clay-bearing aggregates. In Proceedings of the 7th CANMET/ACI International Conference on Superplasticizers and Other Chemical Admixtures in Concrete, Berlin, Germany, 20–23 October 2003; Special Publication (SP-217). Malhotra, V.M., Ed.; American Concrete Institute: Farmington Hills, MI, USA, 2003. [Google Scholar]
- Bentur, A.; Larianovsky, P. Use of High Clay Content Aggregates, Parts I and II; National Building Research Institute, Technion-Israel Institute of Technology: Haifa, Israel, 2020. [Google Scholar]
- Bentur, A.; Larianovsky, P. Use of Marginal Aggregates for Concrete Production, Parts I and II; National Building Research Institute, Yechnion-Israel Institute of Technology: Haifa, Israel, 2020. [Google Scholar]
- Choundhary, H.; Siddiqui, M.A.; Saha, S. Effect of clay fines on strength and workability of concrete. J. Civ. Eng. Environ. Technol. 2019, 6, 311–315. [Google Scholar]
- Beixing, L.; Mingkai, Z.; Jiliang, W. Effect of the methylene blue value of manufactured sand on performance of concrete. J. Adv. Concr. Technol. 2011, 9, 127–132. [Google Scholar] [CrossRef]
- Pitre, B.P. Application of the Modified Methylene Blue Test to Detect Clay Minerals in Coarse Aggregate Fines. Master’s Thesis, Texas A&M University, College Station, TX, USA, 2012. [Google Scholar]
- Zhan’ao, L.; Mingkai, Z.; Beixing, L. Relationships between modified methylene blue value of microfines in manufactures sand and concrete properties. J. Wuhan Univ. Technol.-Mater. Sci. Ed. 2016, 31, 574–581. [Google Scholar]
- Sahin, H.G.; Biricik, O.; Mardani-aghabaglou, A. Polycarboxylate-based water reducing admixture–clay compatibility; literature review. J. Polym. Res. 2022, 29, 33. [Google Scholar] [CrossRef]
- ASTM C 1777. Available online: https://www.astm.org/c1777-20.html (accessed on 10 July 2023).
- ASTM D 4318. Available online: https://www.astm.org/d4318-17e01.html (accessed on 10 July 2023).
- ASTM C 1437. Available online: https://www.astm.org/c1437-20.html (accessed on 10 July 2023).
- ASTM C 230. Available online: https://www.astm.org/c0230_c0230m-20.html (accessed on 10 July 2023).
- Bentur, A.; Larianovsky, P. Turning Marginal Aggregates into Useful Concrete Components. In Concrete Durability and Service Life Planning. ConcreteLife 2020; Kovler, K., Zhutovsky, S., Spatari, S., Jensen, O., Eds.; RILEM Bookseries; Springer: Cham, Switzerland, 2020; Volume 26, pp. 3–7. [Google Scholar]


| E3 * | E4 ** | E2 | E5 | E6 | E7 | E8 | E9 | E10 | E11 | E12 | E13 | E14 | E15 | |
|---|---|---|---|---|---|---|---|---|---|---|---|---|---|---|
| Quartz | 2.1 | 39.9 | 38.2 | 8.1 | 6.2 | 23.2 | 6.2 | 21.4 | 0.8 | 15.2 | 37.2 | 58.8 | 40.7 | |
| Christobalite | 51.6 | |||||||||||||
| Calcite | 32.6 | 9.1 | 67.1 | 11.0 | 9.8 | 60.9 | 55.8 | 45.0 | 22.0 | 46.1 | 13.0 | 7.7 | ||
| Dolomite | 1.3 | 25.9 | 12.9 | 66.6 | 37.6 | 7.9 | 1.8 | 14.4 | 4.7 | 8.2 | ||||
| Ankerite | 2.5 | 4.7 | 18.2 | 4.2 | 39.8 | 55.3 | 6.2 | 5.8 | ||||||
| Rutile | 2.1 | 2.3 | 3.8 | |||||||||||
| Anhydrite | 0.7 | 0.6 | 1.5 | |||||||||||
| Montmorillonite (clay) | 45.9 | 6.3 | 1.7 | 0.3 | 0.3 | 0.3 | 1.1 | 6.5 | 3.4 | 6.7 | ||||
| Kaolinite (clay) | 84.6 | 7.4 | 10.7 | 9.4 | 1.8 | 19.8 | 5.4 | 14.1 | 20.7 | 7.0 | 5.6 | 18.5 | ||
| Halloysite (clay) | 9.7 | 11.5 | 1.4 | 14.4 | 4.7 | 1.2 | 1.5 | 6.0 | 19.1 | |||||
| Illite (clay) | 6.7 | |||||||||||||
| Muscovite (clay) | 6.7 |
| Notation | Nature of Sample | D (10%) µm | D (50%) µm | D (90%) µm | <2 µm %wt. | <8 µm %wt. | Clay Content, XRD, %wt. | MBV |
|---|---|---|---|---|---|---|---|---|
| E1 | Limestone | 1.03 | 7.89 | 19.41 | 16.5 | 50.6 | 0.0 | 0.00 |
| E3 | Montmorillonite | 2.09 | 10.30 | 43.58 | 9.3 | 43.2 | 94.3 | 7.48 |
| E4 | Kaolinite | 0.91 | 7.77 | 27.92 | 21.2 | 50.9 | 94.0 | 0.22 |
| E8 | Micro-fines of sand | 1.17 | 12.83 | 56.41 | 16.0 | 40.6 | 8.5 | 1.64 |
| E10 | Micro-fines of sand | 1.68 | 12.99 | 57.71 | 21.4 | 40.0 | 35.8 | 5.26 |
| E12 | Micro-fines of sand | 0.66 | 3.98 | 50.72 | 33.9 | 63.4 | 66.0 | 7.00 |
| Micro-Fine Type | MBV 20% Dilution | MBV 30% Dilution | Montmorillonite Equivalent Content, % wt. | Dolomite, % wt. | Calcite, % wt. |
|---|---|---|---|---|---|
| “Clean” (R) | 0 | 0 | 0 | 98.6 | 1.4 |
| Low MBV(E37) | 3.0 | 4.6 | 5.5 | 88.8 | 5.8 |
| Medium MBV (E27) | 4.4 | 5.6 | 8.0 | 82.5 | 9.5 |
| High (E) | 7.2 | 10.5 | 13.7 (11.0 by XRD) | 79.5 | 6.8 |
| Content, kg/m3 | ||||
|---|---|---|---|---|
| Cement | Coarse Aggregate | Graded Sand | Sand | Water |
| 330 | 645 | 745 | 337 | 250 |
Disclaimer/Publisher’s Note: The statements, opinions and data contained in all publications are solely those of the individual author(s) and contributor(s) and not of MDPI and/or the editor(s). MDPI and/or the editor(s) disclaim responsibility for any injury to people or property resulting from any ideas, methods, instructions or products referred to in the content. |
© 2024 by the authors. Licensee MDPI, Basel, Switzerland. This article is an open access article distributed under the terms and conditions of the Creative Commons Attribution (CC BY) license (https://creativecommons.org/licenses/by/4.0/).
Share and Cite
Bentur, A.; Larianovsky, P. Marginal Aggregates: The Role of Clays. Materials 2024, 17, 4153. https://doi.org/10.3390/ma17164153
Bentur A, Larianovsky P. Marginal Aggregates: The Role of Clays. Materials. 2024; 17(16):4153. https://doi.org/10.3390/ma17164153
Chicago/Turabian StyleBentur, Arnon, and Pavel Larianovsky. 2024. "Marginal Aggregates: The Role of Clays" Materials 17, no. 16: 4153. https://doi.org/10.3390/ma17164153
APA StyleBentur, A., & Larianovsky, P. (2024). Marginal Aggregates: The Role of Clays. Materials, 17(16), 4153. https://doi.org/10.3390/ma17164153