
Molecular Dynamics Simulation Study of Aluminum–Copper Alloys’ Anisotropy under Different Loading Conditions and Different Crystal Orientations
Abstract
:1. Introduction
2. Method and Modeling
3. Results and Discussion
3.1. Mechanical Property Analysis
3.2. Plastic Deformation Mechanism Analysis
3.2.1. Tensile Deformation Mechanism Analysis
3.2.2. Compressive Deformation Mechanism Analysis
3.2.3. Analysis of the Mechanism of the Loading Methods’ Impact on Mechanical Properties
4. Conclusions
- (1)
- The Al–4%Cu alloy exhibits significant anisotropy under loading in different directions. The elastic modulus and yield strength are the highest under tension along the <> direction. The trend is completely opposite under compression. Al–4%Cu alloy also shows significant differences under different loading conditions. However, the <> direction is not sensitive to the loading condition, and the yield strength is basically the same under tension and compression.
- (2)
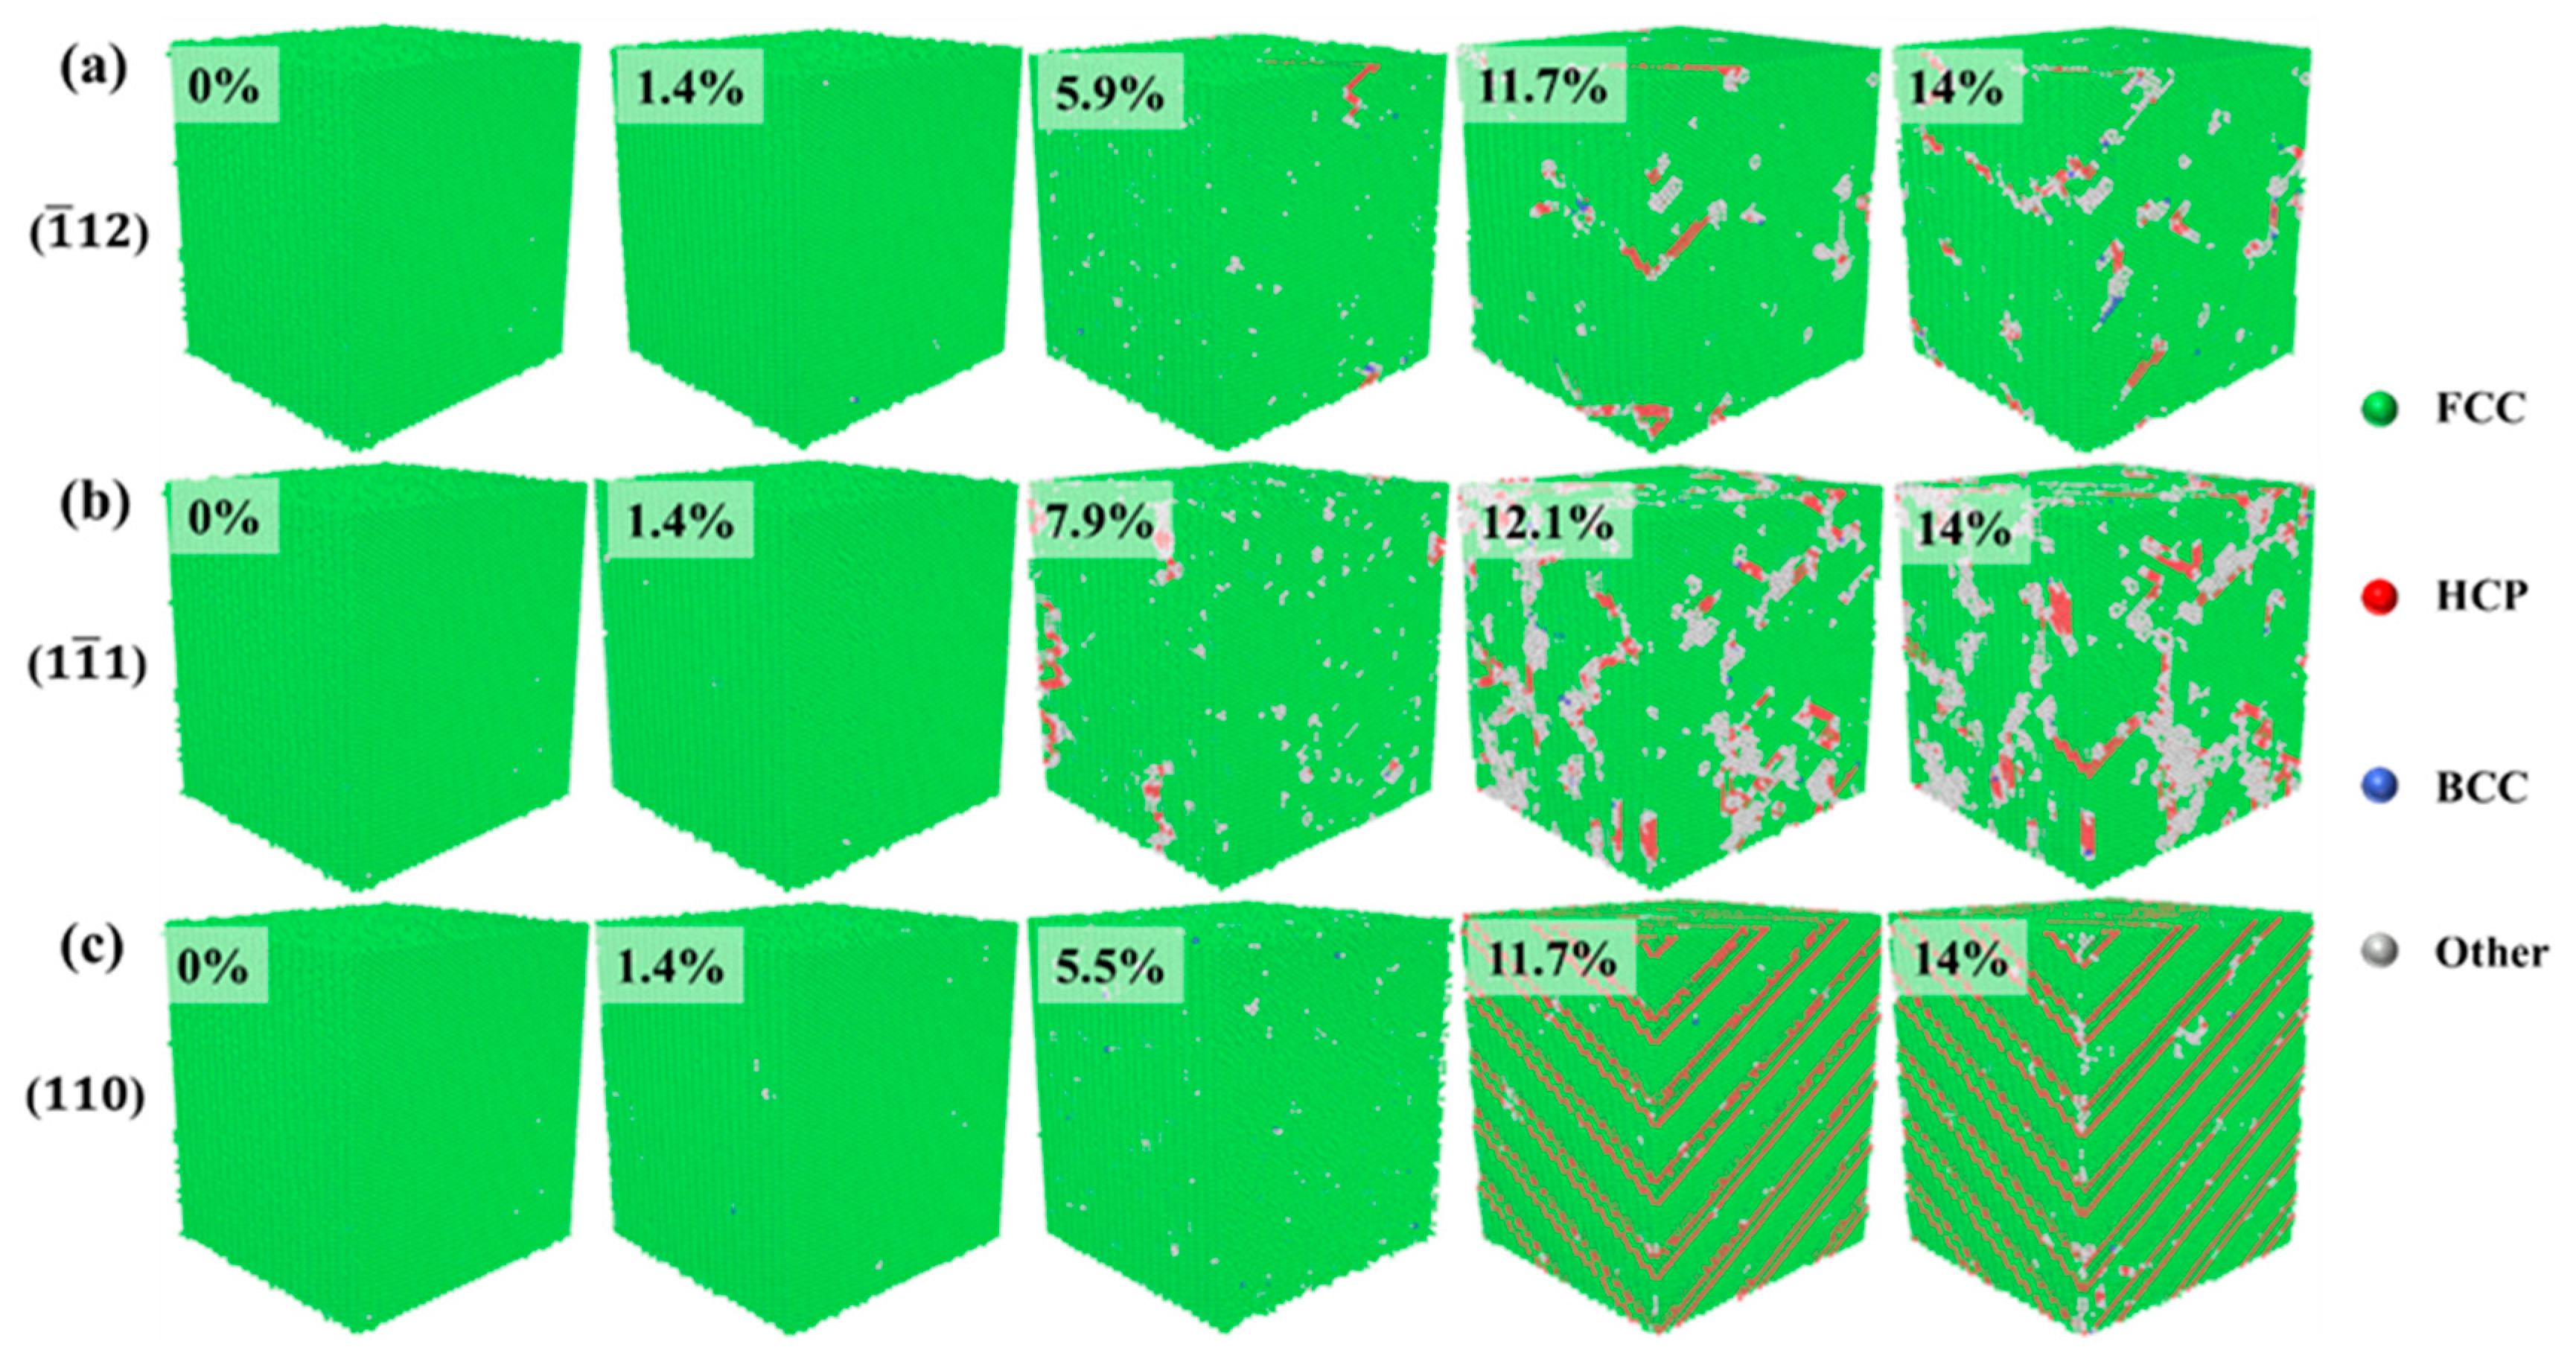
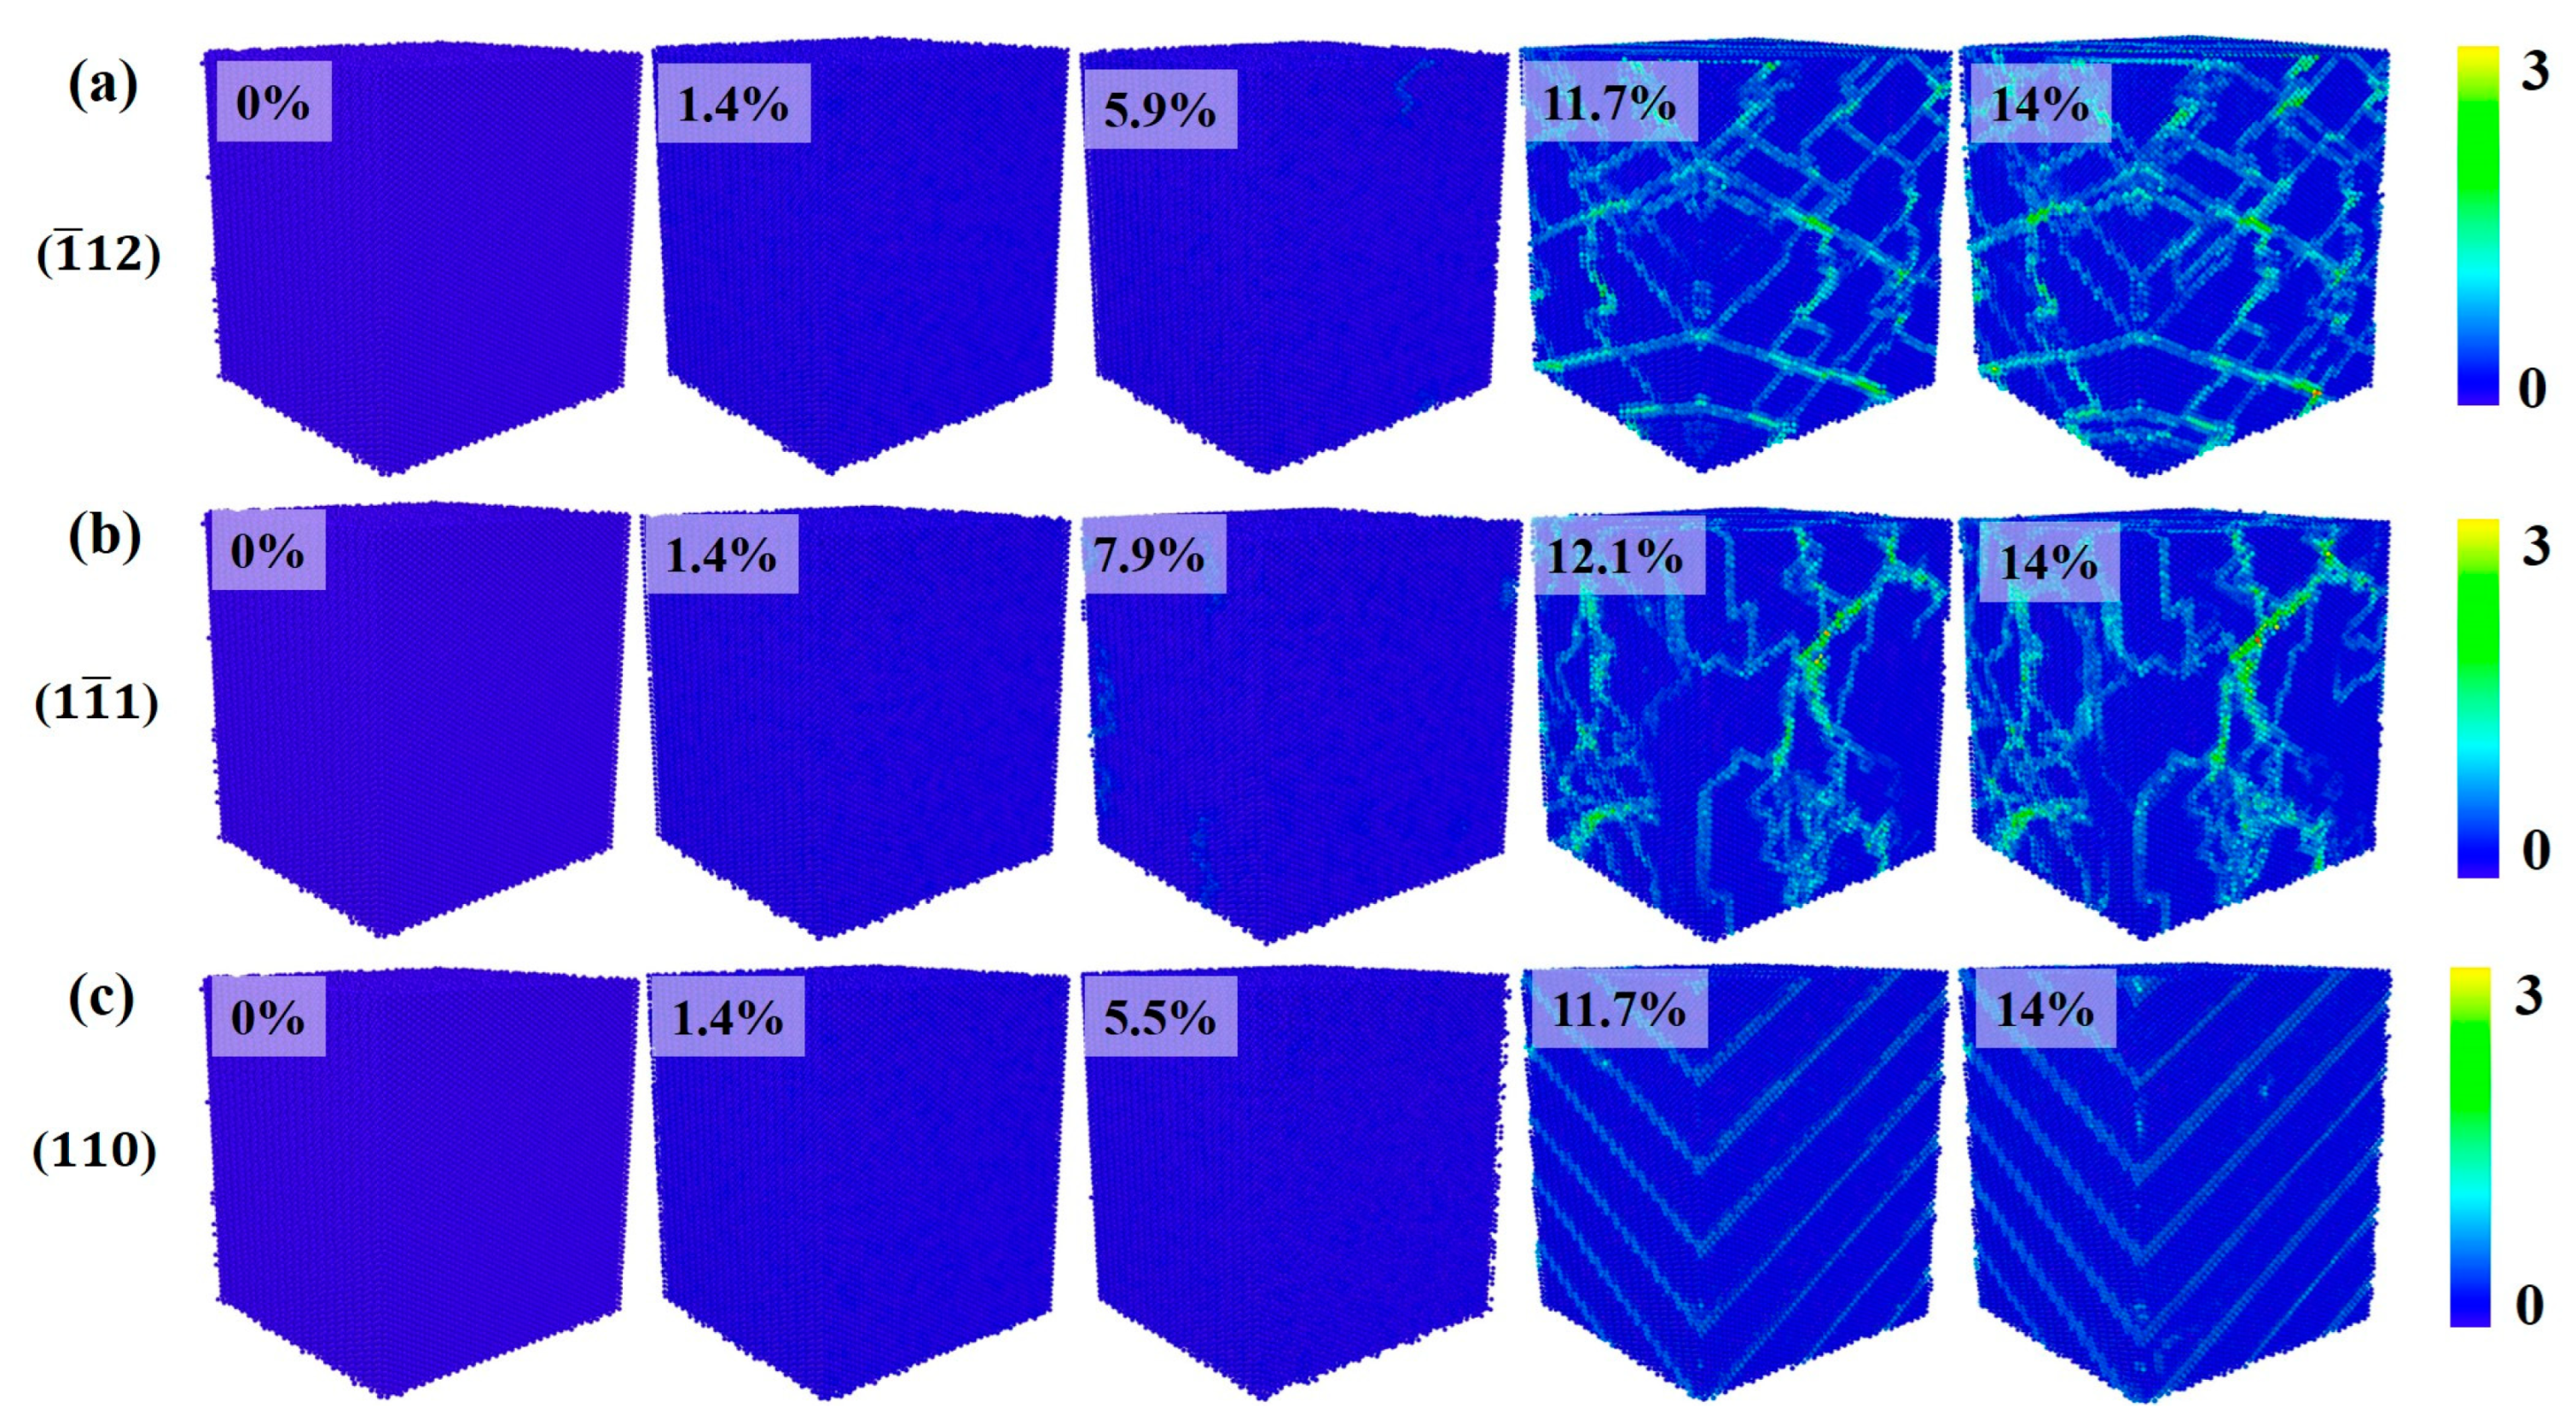
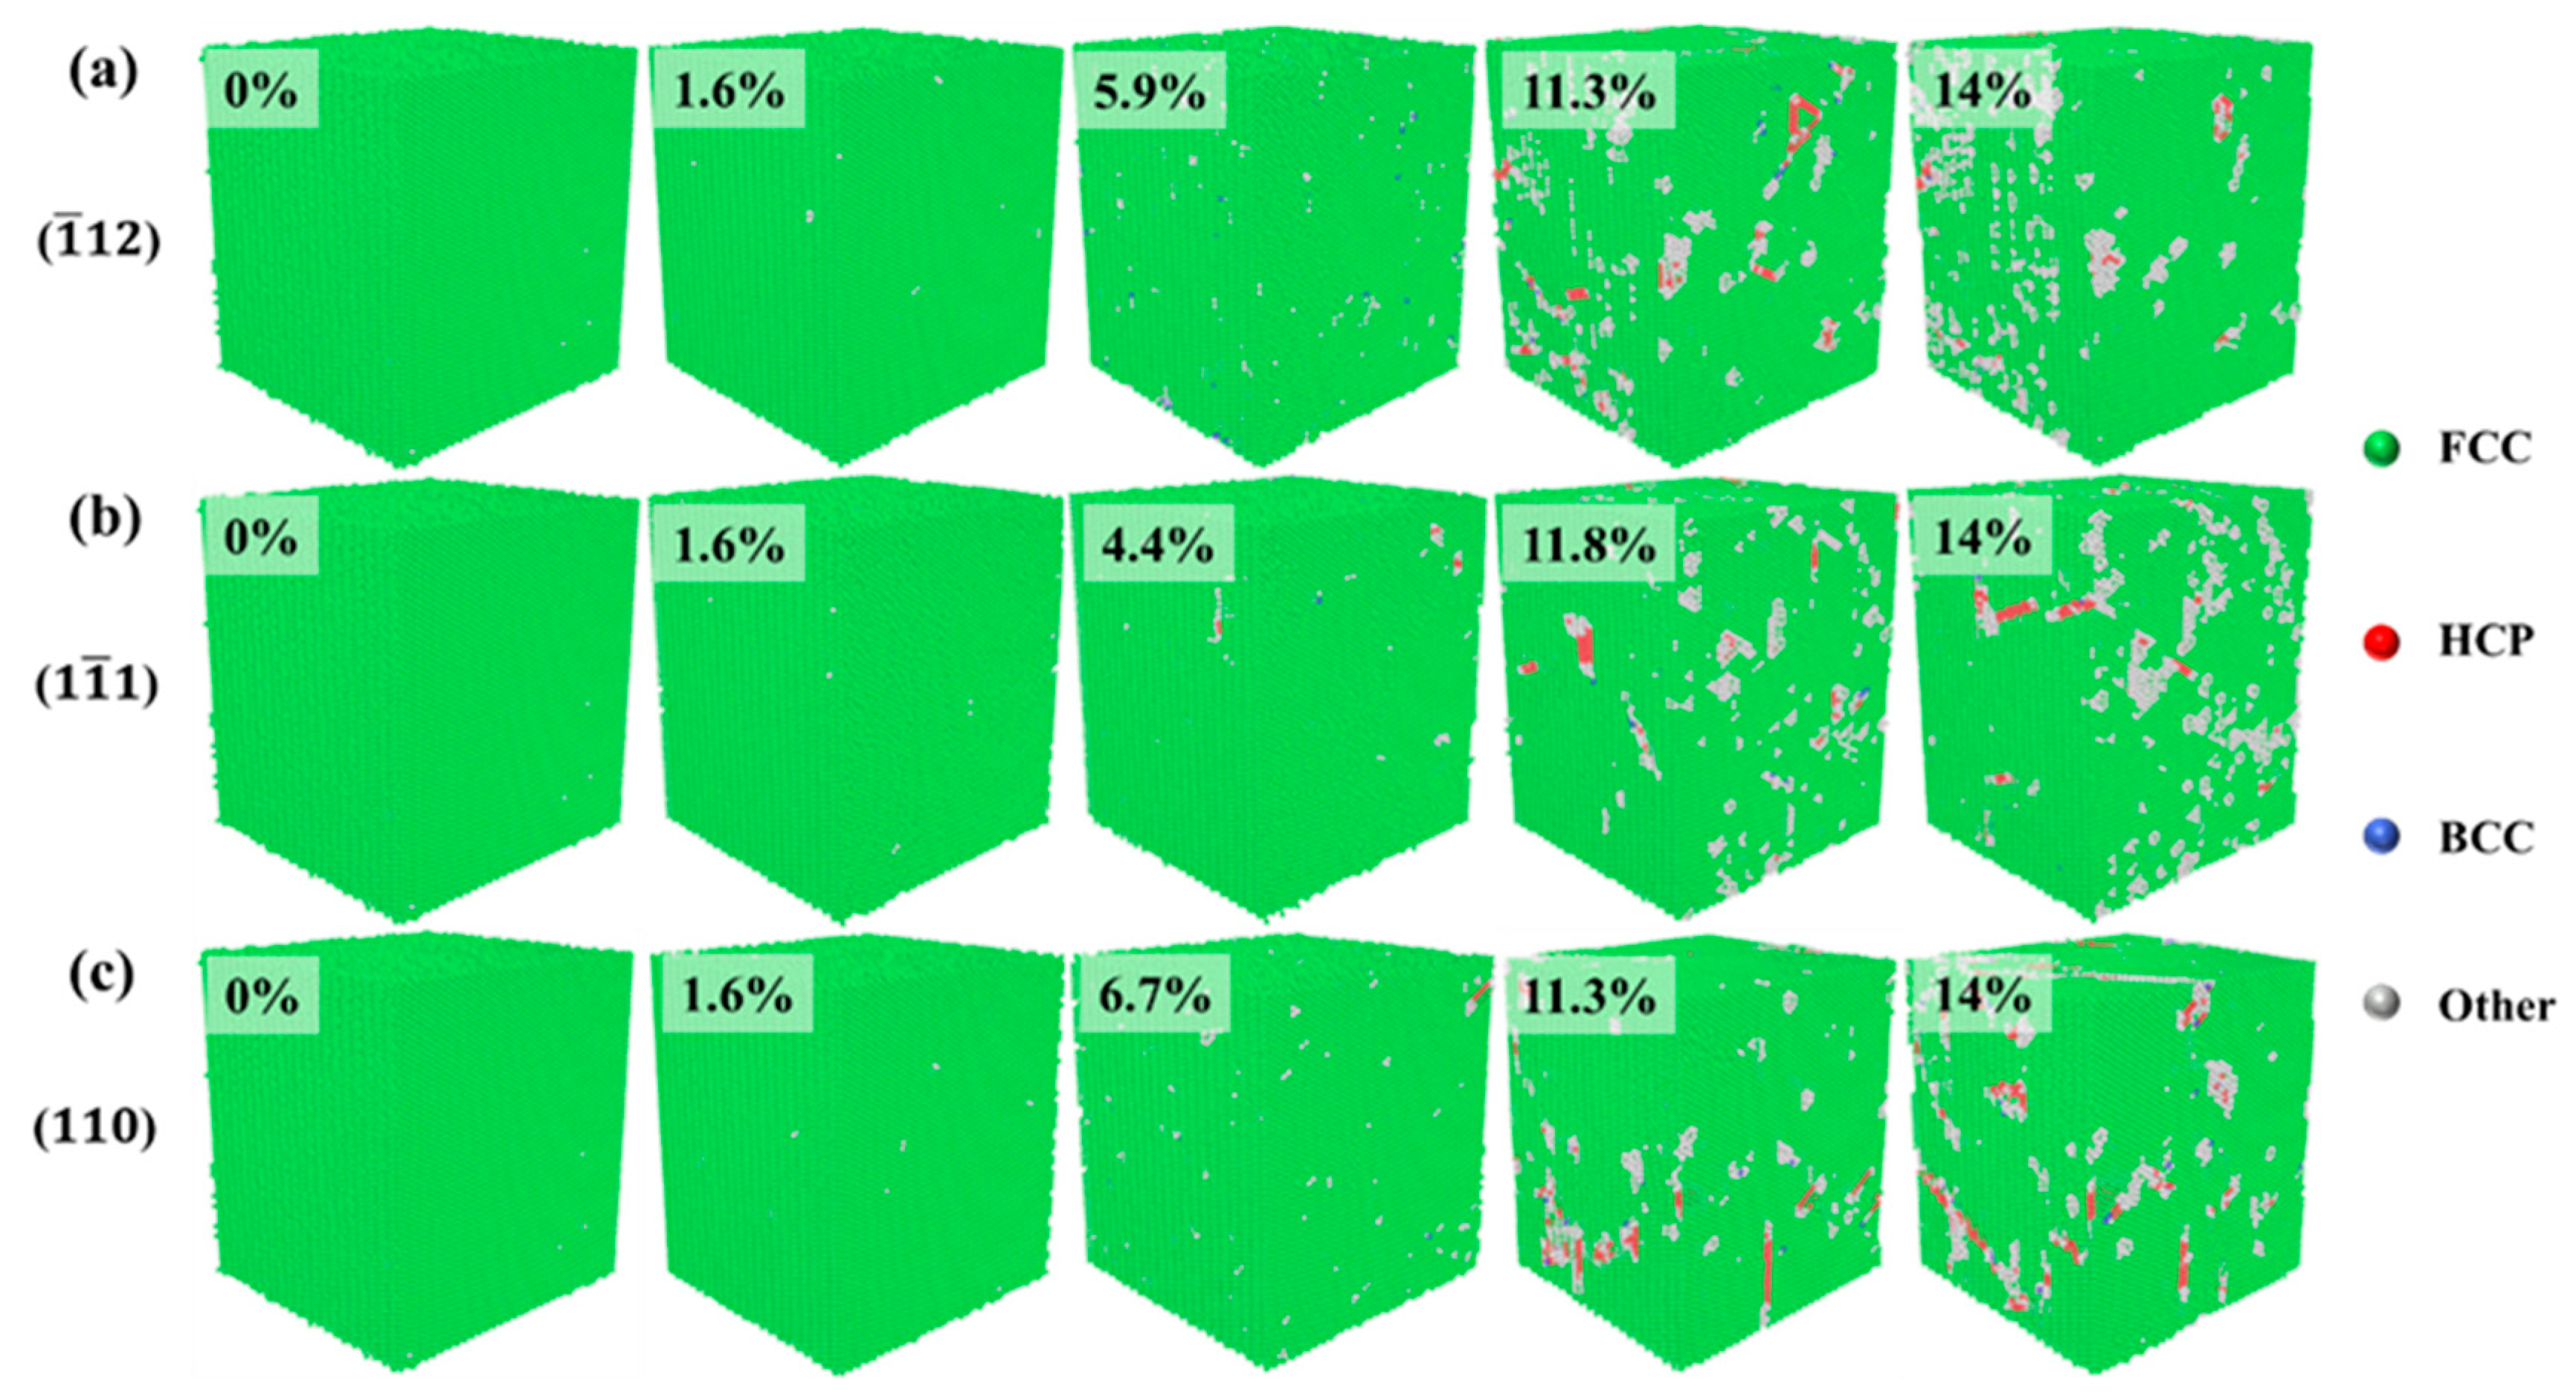
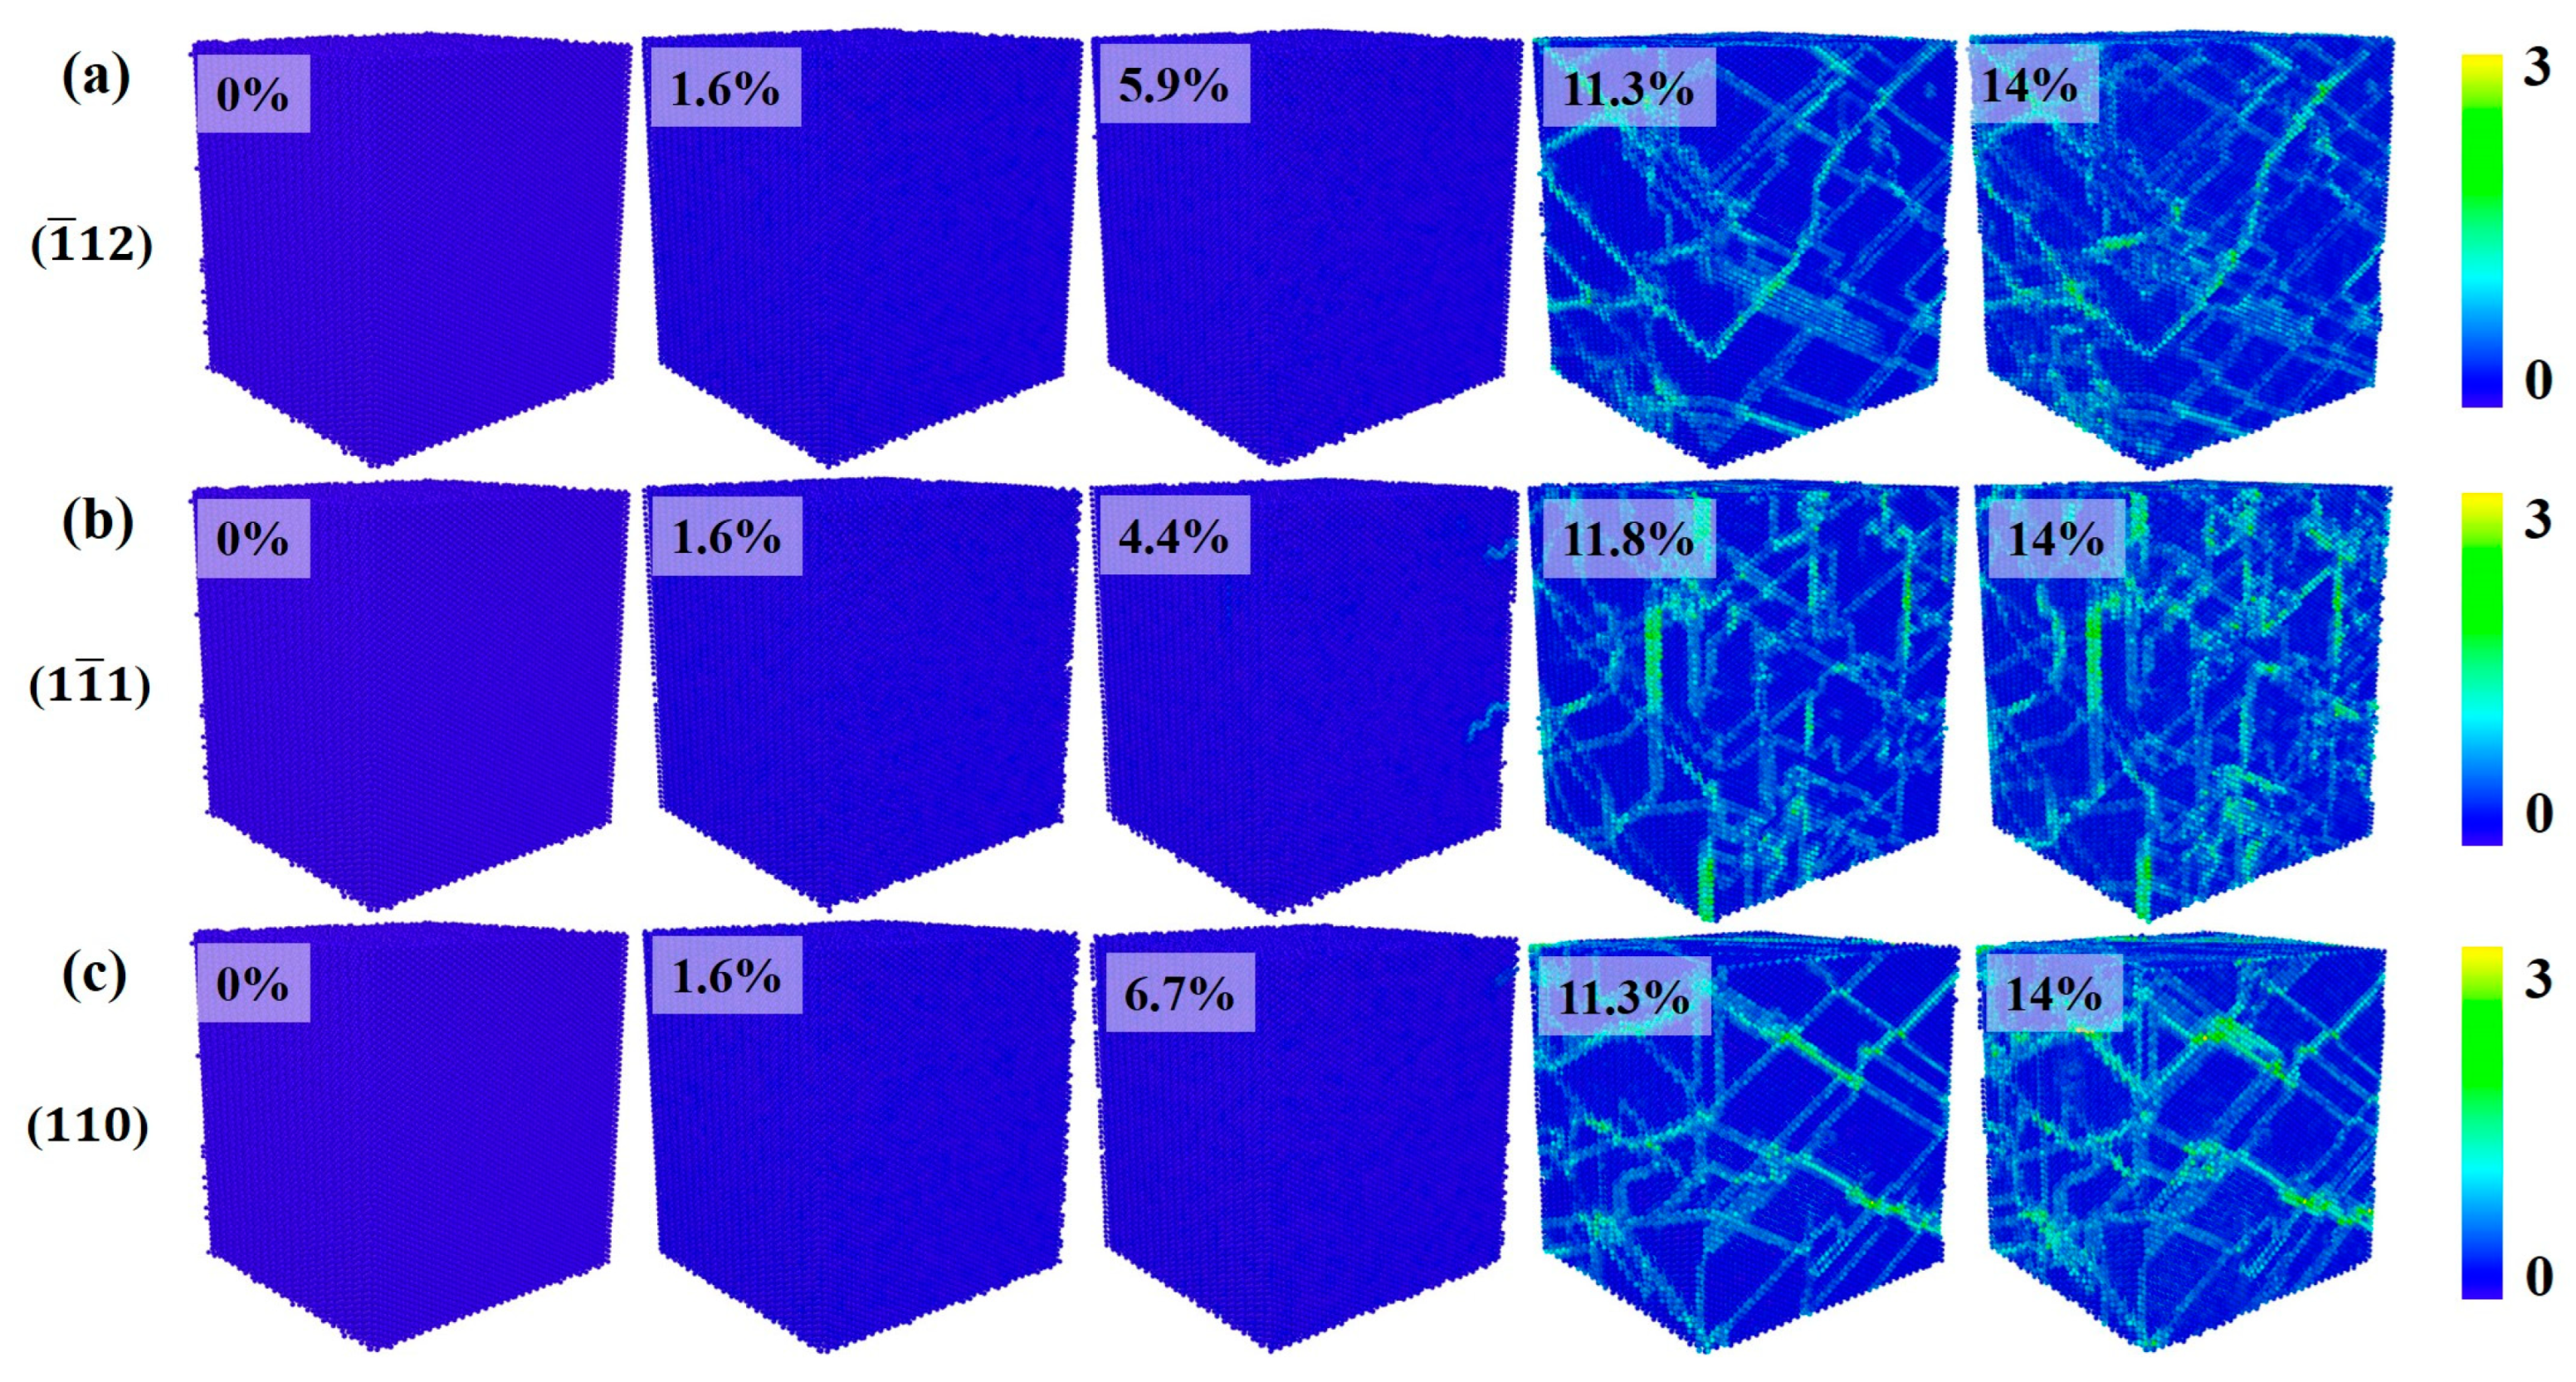
- Changes in atomic structure and atomic potential energy of Al–4%Cu alloy crystals under loading in different directions indicate that crystals under loading in different directions have a single FCC structure in the elastic stage and dislocation glide generates stacking faults in the plastic deformation stage. High-potential energy atoms are mainly concentrated at the stacking faults and dislocation entanglements.
- (3)
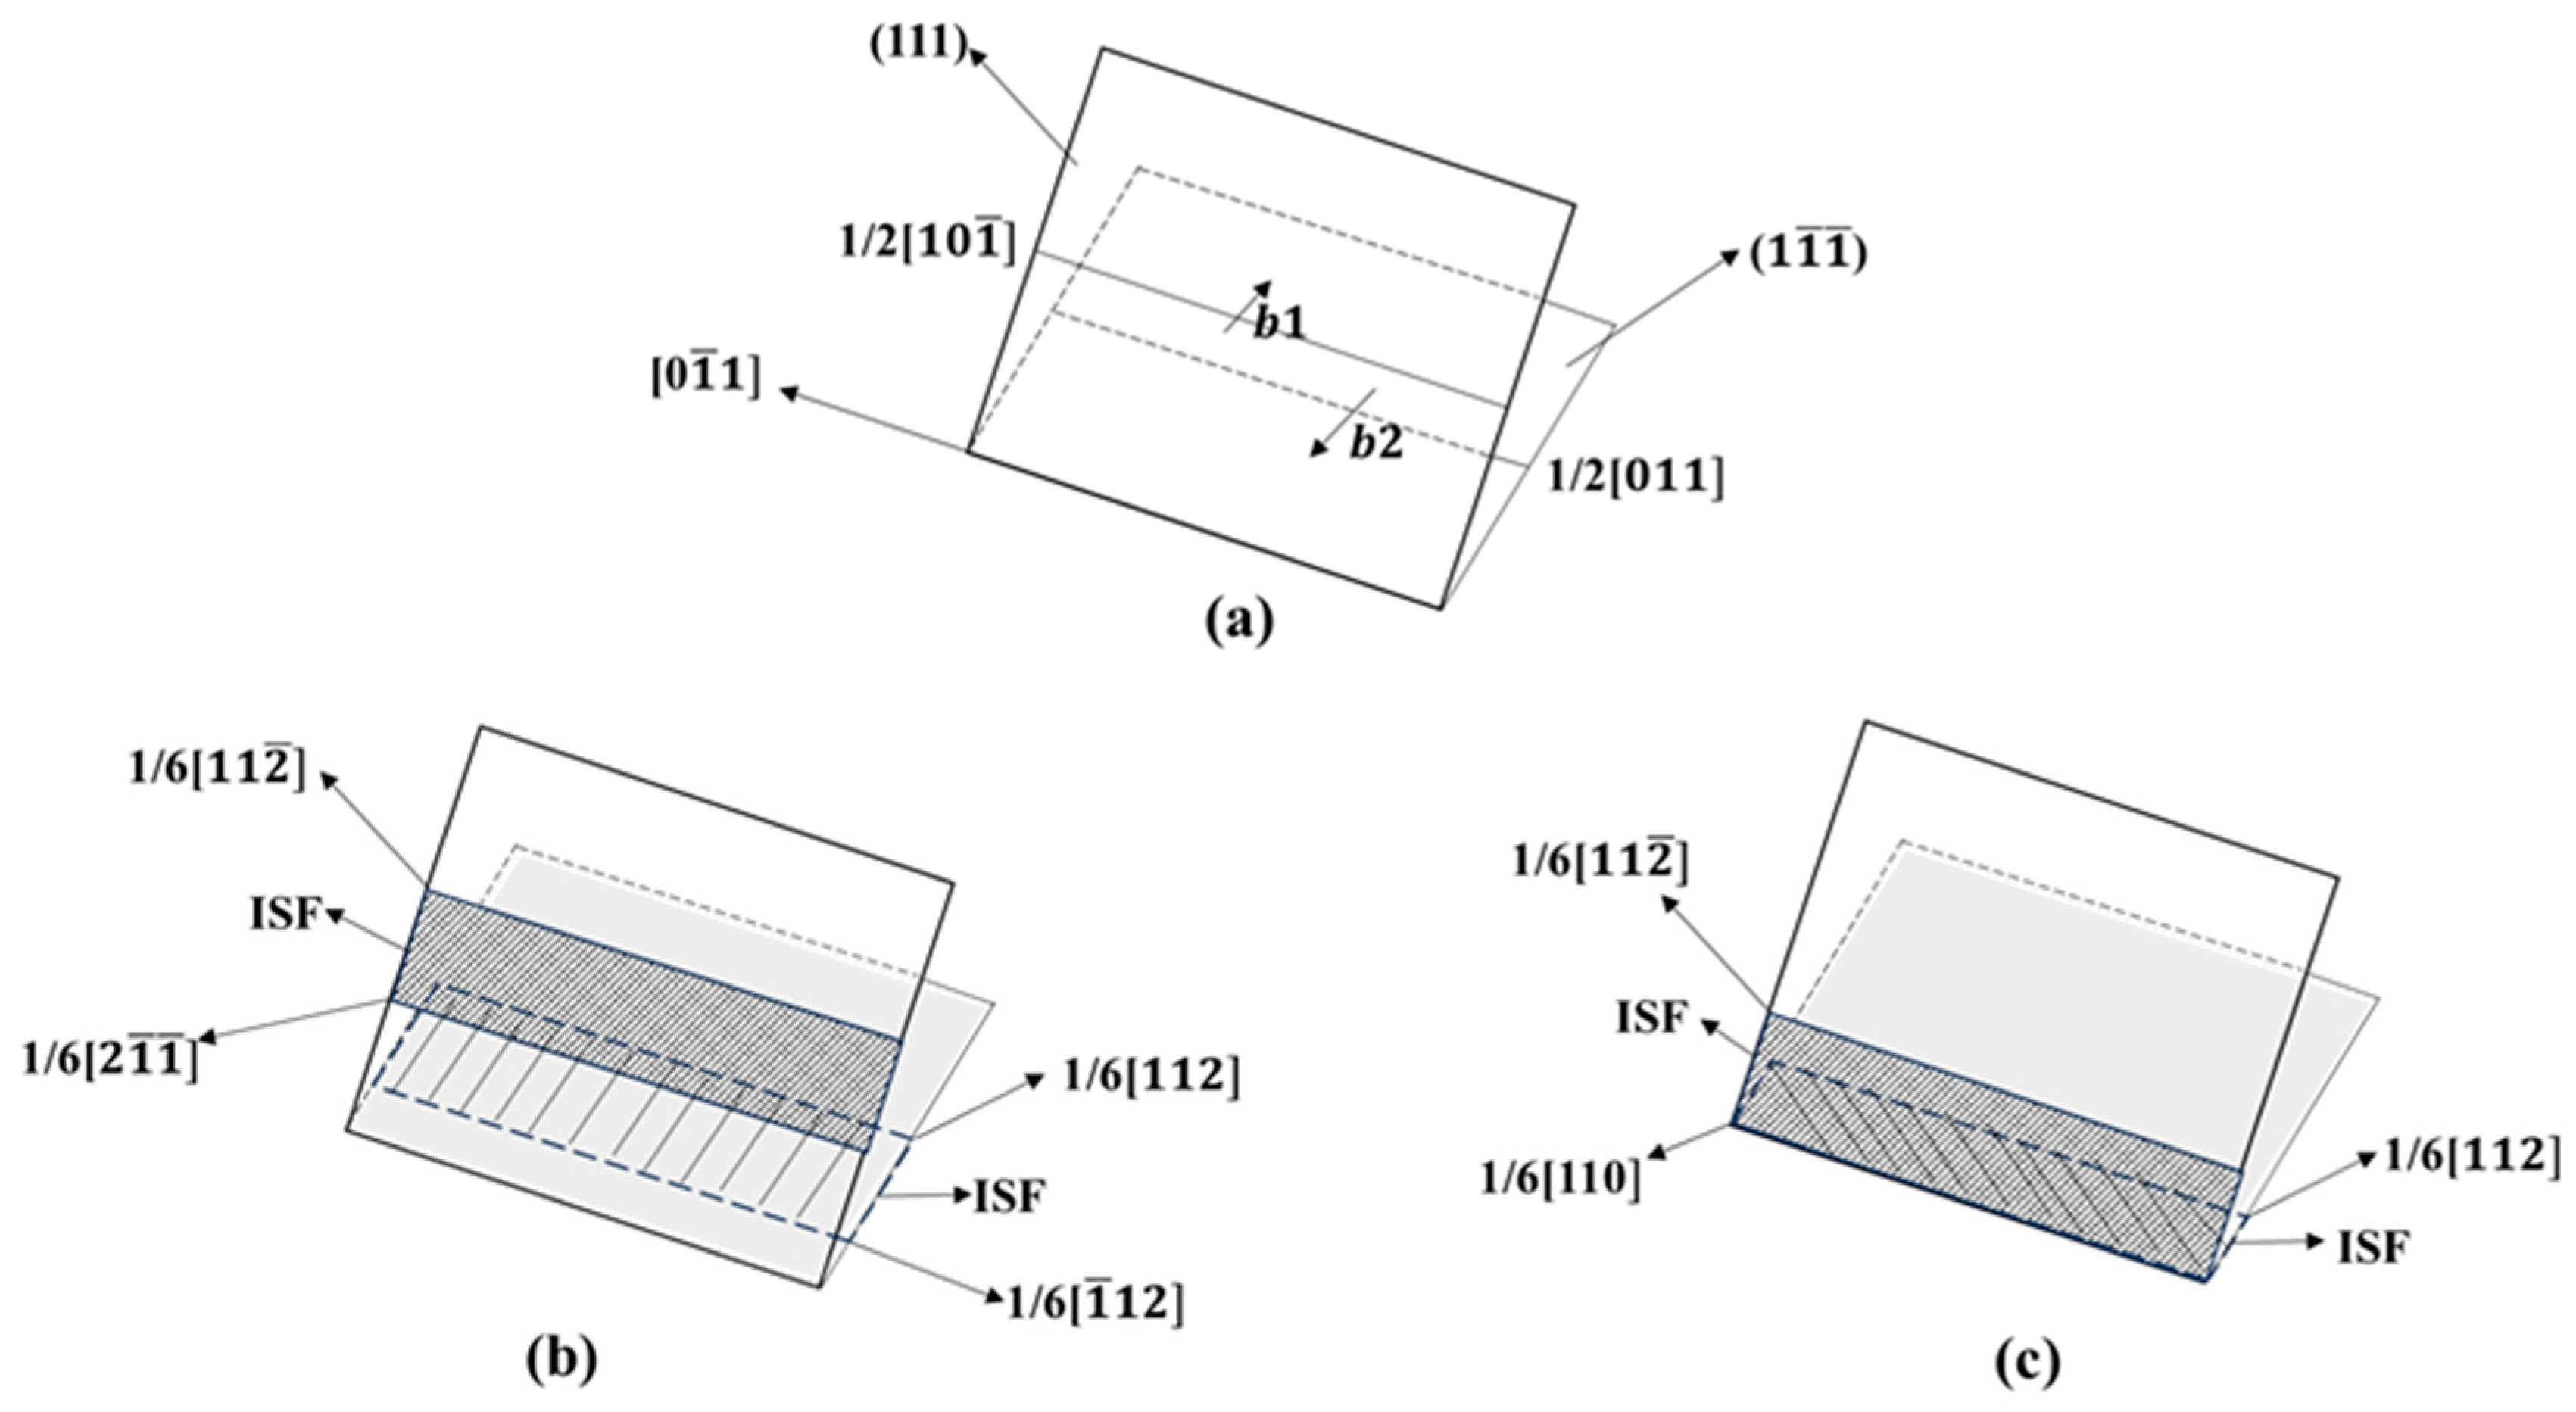
- Under tension along the <> direction, the close-packed plane of atoms leads to large atomic binding forces, which results in a high yield strength. In addition, the Stair-rod dislocation forms a Lomer–Cottrell dislocation lock, which has a strengthening effect on the material. Periodic arrangement of HCP atomic planes appears under tension along the <> direction. That is, the deformation mechanism is dominated by stacking faults. That is because the loose atomic arrangement of the <110> plane could easily lead to atomic misalignment.
- (4)
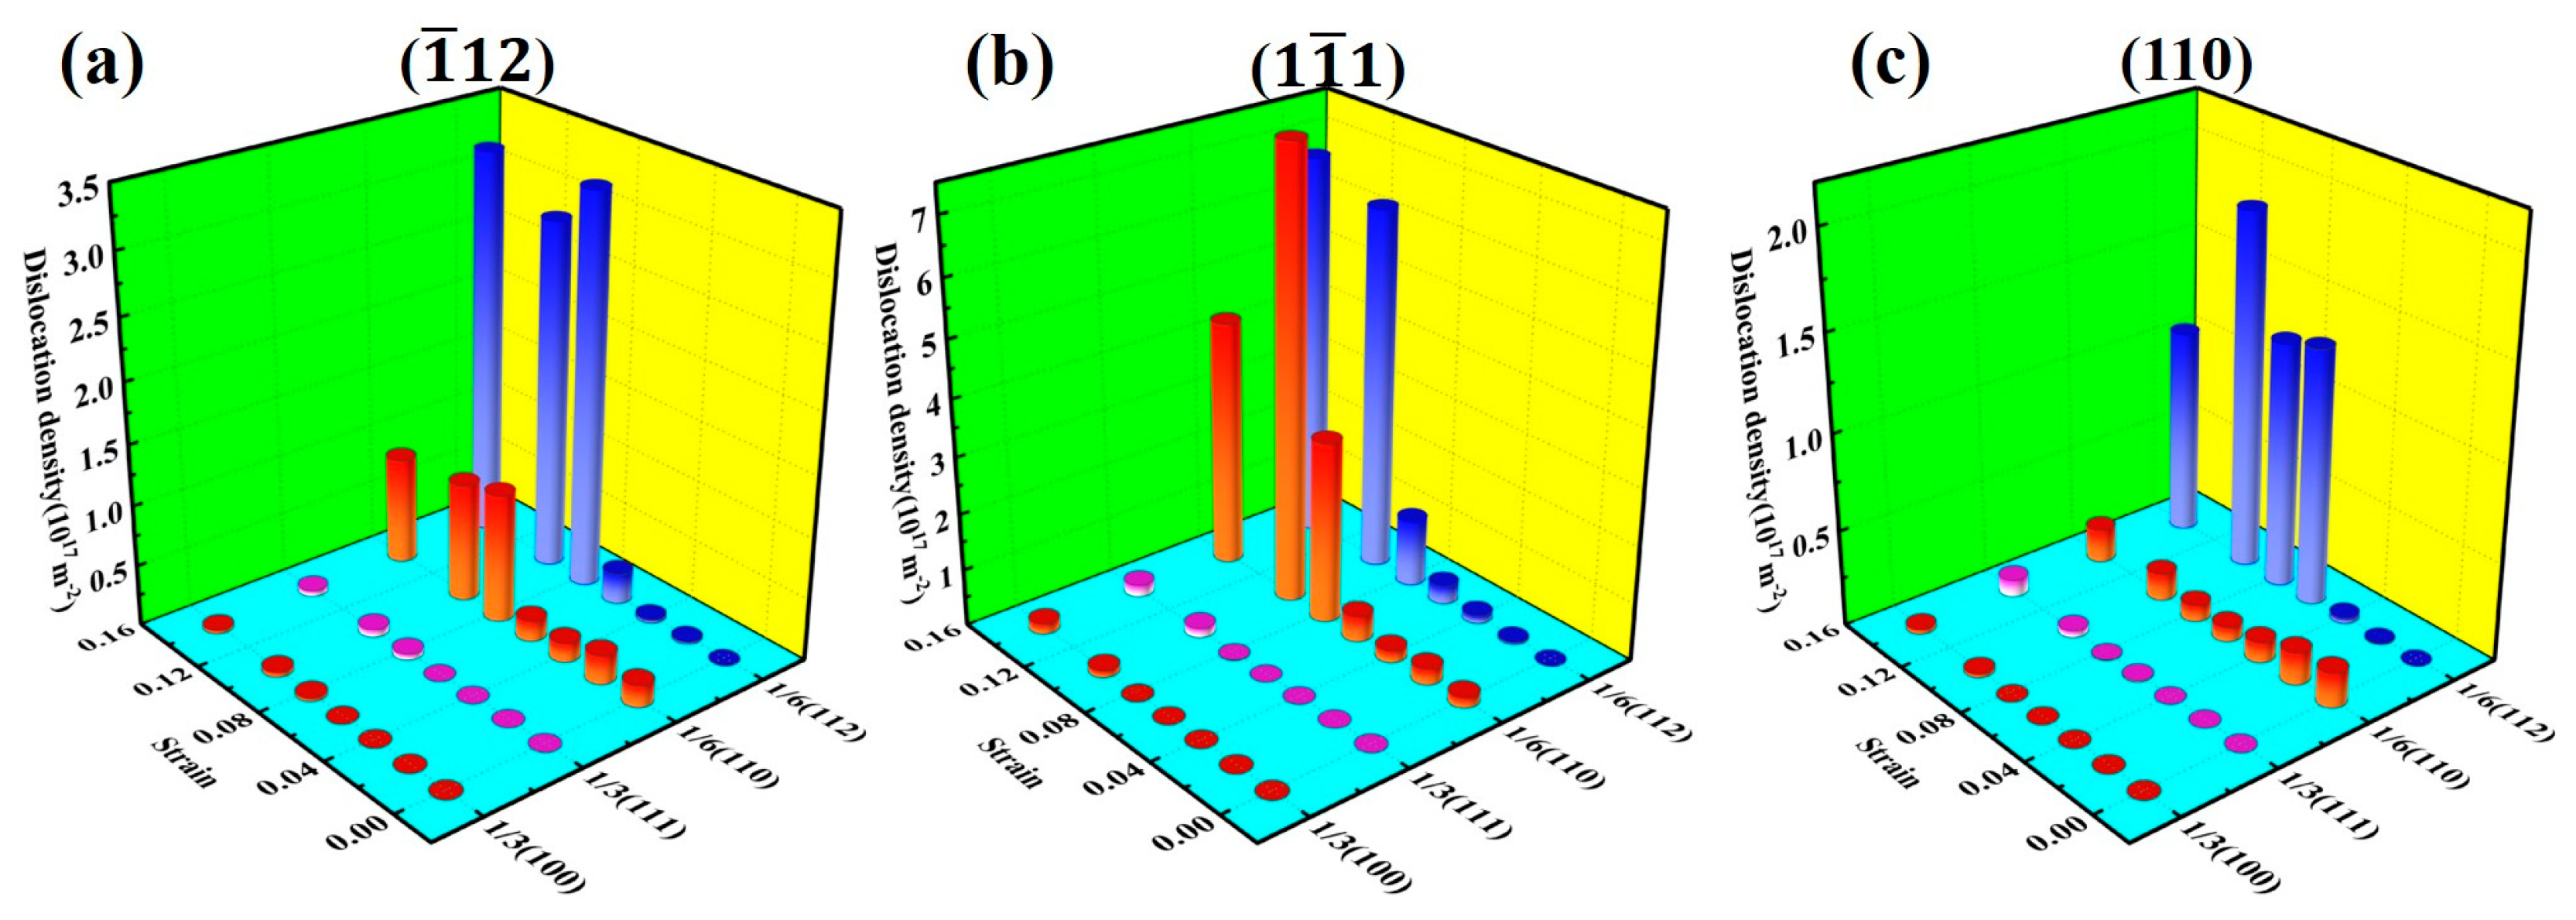
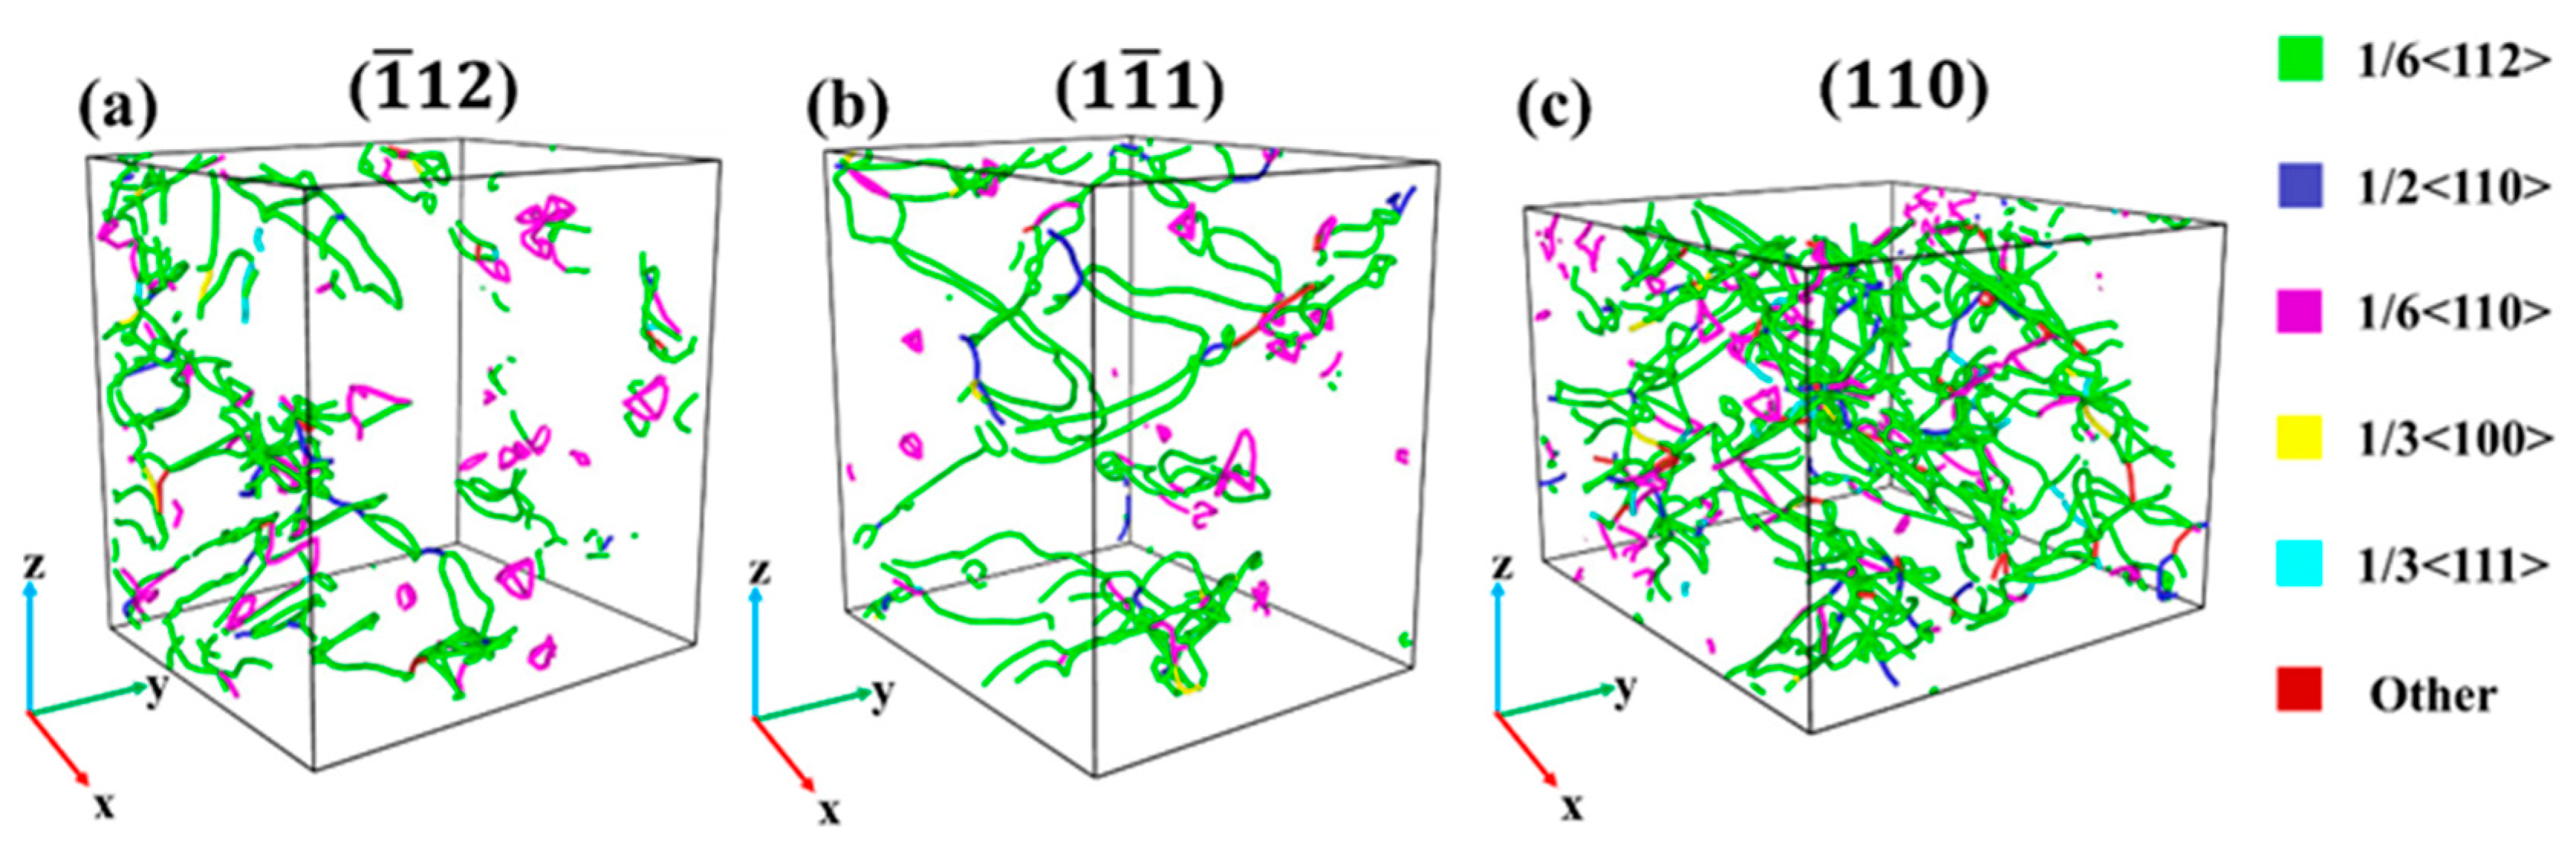
- When compressed in different directions, the plastic deformation mechanism is mainly dominated by dislocations and stacking faults. When compressed along the <> direction, it has a relatively high dislocation density. That should be attributed to the facts below. As the atomic arrangement of the <> plane itself was not dense originally, compression loading would cause an increasingly denser arrangement. In such a case, the stress could only be released through dislocations. Therefore, the yield strength along <> is the largest.
- (5)
- Changes in dislocation density are closely related to the microstructure and stress of the alloy. In the case of dislocation multiplication, as dislocation density increases, stress decreases. When dislocation density stabilizes, stress increases, as there is no new dislocation nucleation. During the tension or compression loading process, the higher the dislocation density along the loading direction, the larger the rheological stress in the plastic deformation stage in that loading direction, which is consistent with the dislocation strengthening theory.
Author Contributions
Funding
Institutional Review Board Statement
Informed Consent Statement
Data Availability Statement
Conflicts of Interest
References
- Tang, J.; Yi, Y.; He, H.; Huang, S.; Zhang, J.; Dong, F. Hot deformation behavior and microstructural evolution of the Al-Cu-Li alloy: A study with processing map. J. Alloys Compd. 2023, 934, 167755. [Google Scholar] [CrossRef]
- Song, H.; Gao, H.; Zhang, Q.; Zhou, X.; Zhang, B. Long-term stress relaxation behaviors and mechanisms of 2219 Al–Cu alloy under various temperatures and initial stresses. J. Mater. Sci. Technol. 2024, 180, 174–192. [Google Scholar] [CrossRef]
- Guo, W.; Yi, Y.; Ruan, J.; Liu, C. Effects of cold deformation modes on microstructure uniformity and mechanical properties of large 2219 Al–Cu alloy rings. Rev. Adv. Mater. Sci. 2023, 62, 20230124. [Google Scholar] [CrossRef]
- Kazemi-Navaee, A.; Jamaati, R.; Aval, J.H. Effect of single roll drive rolling on microstructure, texture, and tensile anisotropy of Al-5.6Zn-2.5Mg-1.4Cu aluminum alloy. Trans. Nonferrous Met. Soc. China 2023, 33, 3266–3281. [Google Scholar] [CrossRef]
- Zhu, L.; Li, K.; Yang, X.; He, J.; Fang, J.; Zhang, Z.; Guo, M.; Zhang, J. Tailoring the formability and planar anisotropy of Al-Mg-Si-Cu-Zn alloys via cross hot rolling and two-stage cold rolling. J. Alloys Compd. 2024, 985, 174089. [Google Scholar] [CrossRef]
- Otani, Y.; Takata, N.; Suzuki, A.; Kobashi, M.; Kato, M. Microstructural origin of anisotropic tensile ductility of Al-Si alloy manufactured by laser powder bed fusion. Scr. Mater. 2023, 226, 115259. [Google Scholar] [CrossRef]
- Choi, Y.; Lee, J.; Panicker, S.S.; Jin, H.K.; Panda, S.K.; Lee, M.G. Mechanical properties, springback, and formability of W-temper and peak aged 7075 aluminum alloy sheets: Experiments and modeling. Int. J. Mech. Sci. 2020, 170, 105344. [Google Scholar] [CrossRef]
- Rahmaan, T.; Noder, J.; Abedini, A.; Zhou, P.; Butcher, C.; Worswick, M.J. Anisotropic plasticity characterization of 6000- and 7000-series aluminum sheet alloys at various strain rates. Int. J. Impact Eng. 2020, 135, 103390. [Google Scholar] [CrossRef]
- Kedharnath, A.; Kapoor, R.; Sarkar, A. Classical molecular dynamics simulations of the deformation of metals under uniaxial monotonic loading: A review. Comput. Struct. 2021, 254, 106614. [Google Scholar] [CrossRef]
- Tian, X.; Ma, K.; Ji, G.; Cui, J.; Liao, Y.; Xiang, M. Anisotropic shock responses of nanoporous Al by molecular dynamics simulations. PLoS ONE 2021, 16, e0247172. [Google Scholar] [CrossRef]
- An, M.; Su, M.; Deng, Q.; Song, H.; Wang, C.; Shang, Y. Anisotropic plasticity of nanocrystalline Ti: A molecular dynamics simulation. Chin. Phys. B 2020, 29, 046201. [Google Scholar] [CrossRef]
- Hou, C.; Zhu, W.; Hu, J.; Ouyang, X. Anisotropic deformation mechanisms in textured nanotwined Cu under shock loading. J. Mater. Res. Technol. 2023, 27, 4180–4190. [Google Scholar] [CrossRef]
- Zhan, L.; Wu, M.; Qin, X. Research on homogeneous nucleation and microstructure evolution of aluminium alloy melt. R. Soc. Open Sci. 2021, 8, 210501. [Google Scholar] [CrossRef]
- Liu, X.-Y.; Liu, C.-L.; Borucki, L.J. A new investigation of copper’s role in enhancing Al-Cu interconnect electromigration resistance from an atomistic view. Acta Mater. 1999, 47, 3227–3231. [Google Scholar] [CrossRef]
- Chen, Y.; Sun, Y.; Cheng, W.; Meng, A.; Zhang, S.; Wang, P. Tissue evolution of Al0.67Cu0.33 alloy during melting and solidification by molecular dynamics simulation. Chem. Phys. 2023, 575, 112049. [Google Scholar] [CrossRef]
- Mojumder, S.; Rakib, T.; Motalab, M. Atomistic study of hardening mechanism in Al-Cu nanostructure. J. Nanoparticle Res. 2019, 21, 88. [Google Scholar] [CrossRef]
- Sefa, K.; Canan, C.A. Investigation of structural phase transformation of Al metallic glass under uniaxial compression strain by molecular dynamics simulation. Appl. Phys. A 2023, 129, 495. [Google Scholar]
- Wu, Y.; Tan, J.; Li, X.; Qiu, Z.; Zhang, R. Molecular dynamics study on friction of high-entropy alloy FeNiCrCoCu. Mater. Today Commun. 2023, 37, 107107. [Google Scholar] [CrossRef]
- Chen, W.; Liu, Y.; Qu, D.; Zheng, M.; Lang, Q.; Zhu, S.; Zhu, Z. Effect of pores on microscopic wear properties and deformation behavior of Ni-Cr alloy coating. J. Mol. Model. 2023, 29, 330. [Google Scholar] [CrossRef] [PubMed]
- Peng, Y.; Liu, C.; Geng, L.; Fan, G. Microstructures and cryogenic mechanical properties of spray deposited 2195 Al–Cu–Li alloy with different heat treatments. Mater. Sci. Eng. A 2024, 895, 146173. [Google Scholar] [CrossRef]
- Wang, G.; Liu, J.; Liu, J.; Jin, T.; Sun, X.; Sun, X.; Hu, Z. High Temperature Stress Rupture Anisotropy of a Ni-Based Single Crystal Superalloy. J. Mater. Sci. Technol. 2016, 32, 1003–1007. [Google Scholar] [CrossRef]
- Sun, Z.H.; Zhang, J.; Xin, G.X.; Xie, L.; Yang, L.C.; Peng, Q. Tensile mechanical properties of CoCrFeNiTiAl high entropy alloy via molecular dynamics simulations. Intermetallics 2022, 142, 107444. [Google Scholar] [CrossRef]
- Ouyang, D.; Mao, R.; Zhang, L.; Liang, S.; Song, J. Study on the tensile properties of Al-Zn-Mg alloy based on molecular dynamics. Eng. Fail. Anal. 2024, 155, 107752. [Google Scholar] [CrossRef]
- Jarlöv, A.; Ji, W.; Babicheva, R.; Tian, Y.; Hu, Z.; Seet, H.L.; Tan, L.; Liu, F.; Liu, Y.; Nai, M.L.; et al. Tailoring short-range order and dislocation evolution in Cr–Co–Ni medium-entropy alloys: A molecular dynamics study. Mater. Des. 2024, 240, 112840. [Google Scholar] [CrossRef]
- Fan, Y.; Wang, W.; Hao, Z.; Zhan, C. Work hardening mechanism based on molecular dynamics simulation in cutting Ni-Fe-Cr series of Ni-based alloy. J. Alloys Compd. 2020, 819, 153331. [Google Scholar] [CrossRef]
- Zhang, H.; Ma, H.; Chang, T.; Zhang, Y.; Loge, R.E.; Zhang, Q.; Fang, X.; Huang, K. Deformation mechanisms of primary γ′ precipitates in nickel-based superalloy. Scr. Mater. 2023, 224, 115109. [Google Scholar] [CrossRef]
- Yan, Z.; Lin, Y. Lomer-Cottrell locks with multiple stair-rod dislocations in a nanostructured Al alloy processed by severe plastic deformation. Mater. Sci. Eng. A 2019, 747, 177–184. [Google Scholar] [CrossRef]
- Zhang, J.; Yan, J.; Liu, C.; Yao, Z.; Huang, J.; Yu, H.; Xie, H.; Yin, F.; Fang, W. Dislocation behavior in initial stage of plastic deformation for CoCrNi medium entropy alloy. J. Alloys Compd. 2023, 943, 169057. [Google Scholar]
- Qi, L.; Liu, C.Q.; Chen, H.W.; Nie, J.F. Atomic scale characterization of complex stacking faults and their configurations in cold deformed Fe42Mn38Co10Cr10 high-entropy alloy. Acta Mater. 2020, 199, 649–668. [Google Scholar] [CrossRef]
- Jian, W.W.; Cheng, G.M.; Xu, W.Z.; Koch, C.C.; Wang, Q.D.; Zhu, Y.T.; Mathaudhu, S.N. Physics and model of strengthening by parallel stacking faults. Appl. Phys. Lett. 2013, 103, 133108. [Google Scholar] [CrossRef]
- Hao, Z.; Liu, Z.; Fan, Y. Work hardening of Ni-based single crystal alloy in vibration grinding based on molecular dynamics method. Arch. Civ. Mech. Eng. 2024, 24, 39. [Google Scholar] [CrossRef]
- Hu, Y.Q.; Zhang, S.; Huang, P.; Wang, F. Dislocation re-emission induced staged work hardening in graphene-nanotwin reinforced Cu: A molecular dynamics simulation study. Proc. Inst. Mech. Eng. Part L J. Mater. Des. Appl. 2022, 236, 989–998. [Google Scholar] [CrossRef]


| Loading Direction and Method | Yield Strength (GPa) | Yield Strain (%) |
|---|---|---|
| <> (Tension) | 3.45 | 5.90 |
| <> (Tension) | 4.15 | 7.90 |
| <110> (Tension) | 2.60 | 5.50 |
| <> (Compression) | 5.00 | 5.90 |
| <> (Compression) | 4.10 | 4.40 |
| <110> (Compression) | 8.00 | 6.70 |
Disclaimer/Publisher’s Note: The statements, opinions and data contained in all publications are solely those of the individual author(s) and contributor(s) and not of MDPI and/or the editor(s). MDPI and/or the editor(s) disclaim responsibility for any injury to people or property resulting from any ideas, methods, instructions or products referred to in the content. |
© 2024 by the authors. Licensee MDPI, Basel, Switzerland. This article is an open access article distributed under the terms and conditions of the Creative Commons Attribution (CC BY) license (https://creativecommons.org/licenses/by/4.0/).
Share and Cite
Wu, X.; Zhang, W. Molecular Dynamics Simulation Study of Aluminum–Copper Alloys’ Anisotropy under Different Loading Conditions and Different Crystal Orientations. Materials 2024, 17, 4162. https://doi.org/10.3390/ma17164162
Wu X, Zhang W. Molecular Dynamics Simulation Study of Aluminum–Copper Alloys’ Anisotropy under Different Loading Conditions and Different Crystal Orientations. Materials. 2024; 17(16):4162. https://doi.org/10.3390/ma17164162
Chicago/Turabian StyleWu, Xiaodong, and Wenkang Zhang. 2024. "Molecular Dynamics Simulation Study of Aluminum–Copper Alloys’ Anisotropy under Different Loading Conditions and Different Crystal Orientations" Materials 17, no. 16: 4162. https://doi.org/10.3390/ma17164162