Article

Fast, Simple, and Sensitive Voltammetric Measurements of Acyclovir in Real Samples via Boron-Doped Diamond Electrode

by
Damian Gorylewski
1,
Katarzyna Tyszczuk-Rotko
1,*,
Magdalena Wójciak
2 and
Ireneusz Sowa
2
1
Faculty of Chemistry, Institute of Chemical Sciences, Maria Curie-Skłodowska University in Lublin, 20-031 Lublin, Poland
2
Department of Analytical Chemistry, Medical University of Lublin, 20-093 Lublin, Poland
*
Author to whom correspondence should be addressed.
Materials 2024, 17(18), 4480; https://doi.org/10.3390/ma17184480
Submission received: 9 August 2024 / Revised: 5 September 2024 / Accepted: 9 September 2024 / Published: 12 September 2024

Abstract

:
The voltammetric acyclovir (ACV) trace-level determination procedure has been introduced. This is the first time that a commercially available boron-doped diamond electrode (BDDE) coupled with differential-pulse voltammetry (DPV) has been used for this purpose. The commercially available BDDE is characterized by a short response time, low background current, and very good analytical parameters of ACV determination. Ultimately, DPV measurements using the BDDE in 0.075 mol L−1 PBS with a pH of 7.2 under optimized conditions achieved the lowest detection limit (LOD = 0.0299 nmol L−1) reported in the literature for voltammetric procedures. Moreover, it is highly resistant to the presence of various interfering agents and has been used to analyze pharmaceutical and municipal wastewater samples. The obtained results are consistent with measurements made using chromatographic reference methods.

Graphical Abstract

1. Introduction

Compounds such as acyclovir (ACV), ganciclovir (GCV), and penciclovir (PCV) are commonly used in the treatment of the herpes simplex virus. Their action consists in inhibiting the replication of the virus, thanks to which the infection does not progress and the symptoms start to subside. This allows for shortened subsequent convalescence and minimizes the possibility of infecting other people [1,2,3].
ACV (2-amino-9-[(2-hydroxyethoxy)methyl]-1,9-dihydro-6H-purin-6-one, Figure 1) is used in the treatment of herpes simplex virus, human herpes virus 6, hepatitis B virus, Epstein–Barr virus, and varicella zoster viruses. It is one of the safest registered antiviral drugs that can be administered intravenously, orally, and topically with minimal risk of side effects. However, excessive consumption of ACV may lead to neurotoxicity, headaches, exacerbation of renal failure, cephalalgia, and diarrhea. ACV has a short life span in the human body and is only 15–20% metabolized. The other 80–85% of the consumed dose is excreted from the body unchanged mainly through the urine. In the treatment of herpes simplex virus, quite high doses of ACV are usually used. For example, for the treatment of genital herpes, ACV dosages for adults and children 12 years of age and older include 200 mg five times a day for 10 days, whereas the American Academy of Pediatrics recommends that high-dose (HD) acyclovir (20 mg kg−1/dose) should be used for the treatment of neonatal HSV disease [4]. Therefore, relatively large amounts of these compounds can end up in sewage and aquatic environments [5,6,7,8,9].
In the natural environment, ACV generally does not occur at high concentration levels, but the highest concentrations of acyclovir have been detected in wastewater treatment plants (WWTPs) (6.04 nmol L−1) and surface waters (7.06 nmol L−1). Additionally, ACV is inherently biodegradable in some amounts. There are indications that some ACV derivatives in high concentrations may be harmful to living organisms such as green algae or Daphnia magna [9]. The long-term effects of exposure to this compound in small amounts are currently unknown. It is very significant to develop effective monitoring tools for determining low concentrations of ACV in the environment.
Many procedures for the determination of ACV using spectroscopy [10], spectrophotometry [11,12], chemiluminescence [13], chromatography [14,15,16], or voltammetry [1,2,5,6,7,8,17,18,19,20,21,22,23,24,25,26,27,28,29,30,31,32,33,34,35,36,37,38,39,40] have been described in the literature (Table 1). Voltammetric procedures have several advantages over other instrumental methods. They are characterized by high sensitivity, low cost of apparatus, and low consumption of reagents and samples as well as they give the ability to perform measurements in field analysis conditions. Additionally, voltammetric methods allow the determination of metal ions and organic compounds to be conducted at trace concentration levels, without costly and time-consuming sample preparation [41,42]. Sample preparation in voltammetry is very cheap and mainly focuses on limiting interference, e.g., from organic substances that may be adsorbed on the electrode surface. Usually, performing a simple and fast filtration step or/and UV mineralization is sufficient to prepare the sample for most voltammetric analysis.
The vast majority of the ACV determination voltammetric procedures described in the literature are based on the use of difficult-to-prepare sensors such as the paste electrodes [20,23,27,30,33,43], gold electrodes (GE) [25], pencil graphite electrodes (PGE) [37,39], electropretrated pencil graphite electrodes (EPPGE) [26], graphite sheet electrodes (GSE) [32], screen-printed electrodes [44], or glassy carbon electrodes (GCE) [1,2,6,7,8,18,21,22,24,28,29,34,35,36,40]. They are primarily modified with, e.g., multi-walled nanotubes (MWNTs), graphene, fullerenes, polymers, nanodiamonds, nanoclay, and magnetic nanoparticles as well as being electrochemically activated. Unmodified electrodes such as GCE [5], pencil graphite electrode (PGE) [19], ultra-trace graphite electrode (UTGE) [5], fluoride doped oxide (FTO) [17], electropretreated pencil graphite electrode (EPPEG) [31], and controlled growth mercury drop electrode (CGME) [38] have also been applied in the analysis of ACV. However, the detection limits (LOD) that have been achieved with unmodified electrodes are quite high compared to the modified ones (Table 1).
In this paper, we would like to introduce the first application of the bare BDDE in ACV trace-level determination. The choice of this type of sensor was dictated by its properties, i.e., a short response time, high stability, chemical inertness, low background current, and good analytical parameters [45,46,47,48,49,50,51,52,53,54,55]. To optimize the ACV determination procedure and to characterize the properties of the sensor and electrode process, many experiments were carried out using several techniques, including differential-pulse voltammetry (DPV), square-wave voltammetry (SWV), and cyclic voltammetry (CV). Ultimately, the optimization of the procedure parameters, investigation of the influence of possible interfering agents, and the ACV analysis in environmental samples were done using DPV. The correctness of the obtained results was verified by performing real sample analysis using reference-chromatographic methods.

2. Materials and Methods

2.1. Equipment

The potentiostat/galvanostat (Eco Chemie, Utrecht, The Netherlands) with GPES 4.9 and FRA 4.9 software was applied to perform voltammetric and EIS analysis, respectively. Experiments were made in a 10 mL cell consisting of the commercially available BDDE (D-064-SA, boron doping level 1000 ppm, Windsor Scientific, Berkshire, UK) or GCE (glassy carbon electrode, Mineral, Łomianki-Sadowa, Poland) with a diameter of 3 mm (working electrodes), an Ag,AgCl/KCl (3 mol L−1) silver chloride electrode (auxiliary electrode), and platinum wire (counter electrode). During the sample preparation stage, an analytical balance (RADWAG, Radom, Poland) and an agate mortar were used. To reduce the influence of potential interferers, the tablet extract was filtered using a 0.22 μm Millipore filter (Burlington, MA, USA).
The Infinity Series II ultra-high performance liquid chromatography (UHPLC) with a DAD detector, an Agilent 6224 ESI/TOF mass detector (Agilent Technologies, Santa Clara, CA, USA), and an RP18 reversed-phase column Titan (Supelco, Bellefonte, PA, USA) (10 cm × 2.1 mm i.d., 1.9 µm particle size) was used to the analysis of the sample. A total of 2% of acetonitrile in water with 0.05% of formic acid (Merck reagents, Darmstadt, Germany) was used as a mobile phase at a flow rate of 0.2 mL min−1 [44].

2.2. Reagents and Solutions

Solutions with appropriate concentrations of phosphate-buffered saline (PBS) with pH = 4.5; 6.0; 6.3; 7.2; and 8.0 were prepared with Merck reagents. Selectivity studies were also performed using Merck standard solutions of Fe3+, Ca2+, Cu2+, Mg2+, Ni2+, Cd2+, Zn2+, Sb3+, Pb2+, NO2, NO3, Cl, ascorbic acid, ritonavir, and lopinavir, as well as Triton X-100—Fluka (Dorset, UK). Solutions of ACV were prepared with Merck reagent. The ACV water solutions with concentrations of 5 and 1 mmol L−1 were prepared once every 2 weeks. On the other hand, 0.1 and 0.01 mmol L−1 solutions were prepared daily by dilution of the 1 mmol L−1 ACV standard in deionized water. All ACV standards were stored in a refrigerator and placed in an ultrasonic bath daily for a couple of minutes prior to the first use. ACV tablets were bought from a local pharmacy and wastewater samples were received from the Municipal Water Supply & Wastewater Treatment Company Ltd. (Lublin, Poland). MS grade nitric acid, formic acid, and acetonitrile were bought from Sigma-Aldrich. The water used for solution preparation was deionized using a Milli-Q system or Ultrapure Millipore Direct-Q® 3UV-R (>18 MW cm).

2.3. Preparation of Tablets and Municipal Wastewater Samples

Tablet preparation: ACV tablets (declared value of ACV content in one tablet = 200 mg) were purchased from a local pharmacy. Three of them were carefully weighed on an analytical balance and grounded using a mortar to form a homogeneous powder. Then, the mass corresponding to the average mass of three ground tablets was weighed and quantitatively transferred to a 200 mL volumetric flask. Next, 20 mL of 1 mol L−1 HNO3 was added and the flask was filled to the mark with deionized water. Subsequently, the suspension was placed in an ultrasonic bath for 60 min. The finally obtained extract was filtered with a syringe using a 0.22 μm Millipore filter [44].
Municipal wastewater preparation: The purified sewage samples were not subjected to any additional preparation steps.

2.4. DPV Procedure Parameters

Differential-pulse voltammetry (DPV) was applied in ACV analysis at the BDDE in 10 mL of 0.075 mol L−1 PBS solution with pH = 7.2. In Table 2 the parameters of DPV technique under optimized conditions are presented. The commercially available BDDE was electrochemically cleaned in the supporting electrolyte (1.4 V for 5 s) to remove residues from the previous measurement. The background was cut out from each DPV curve and the baseline correction stage was always applied.

3. Results and Discussion

3.1. Comparison of the Electrochemical Properties of BDDE and GCE

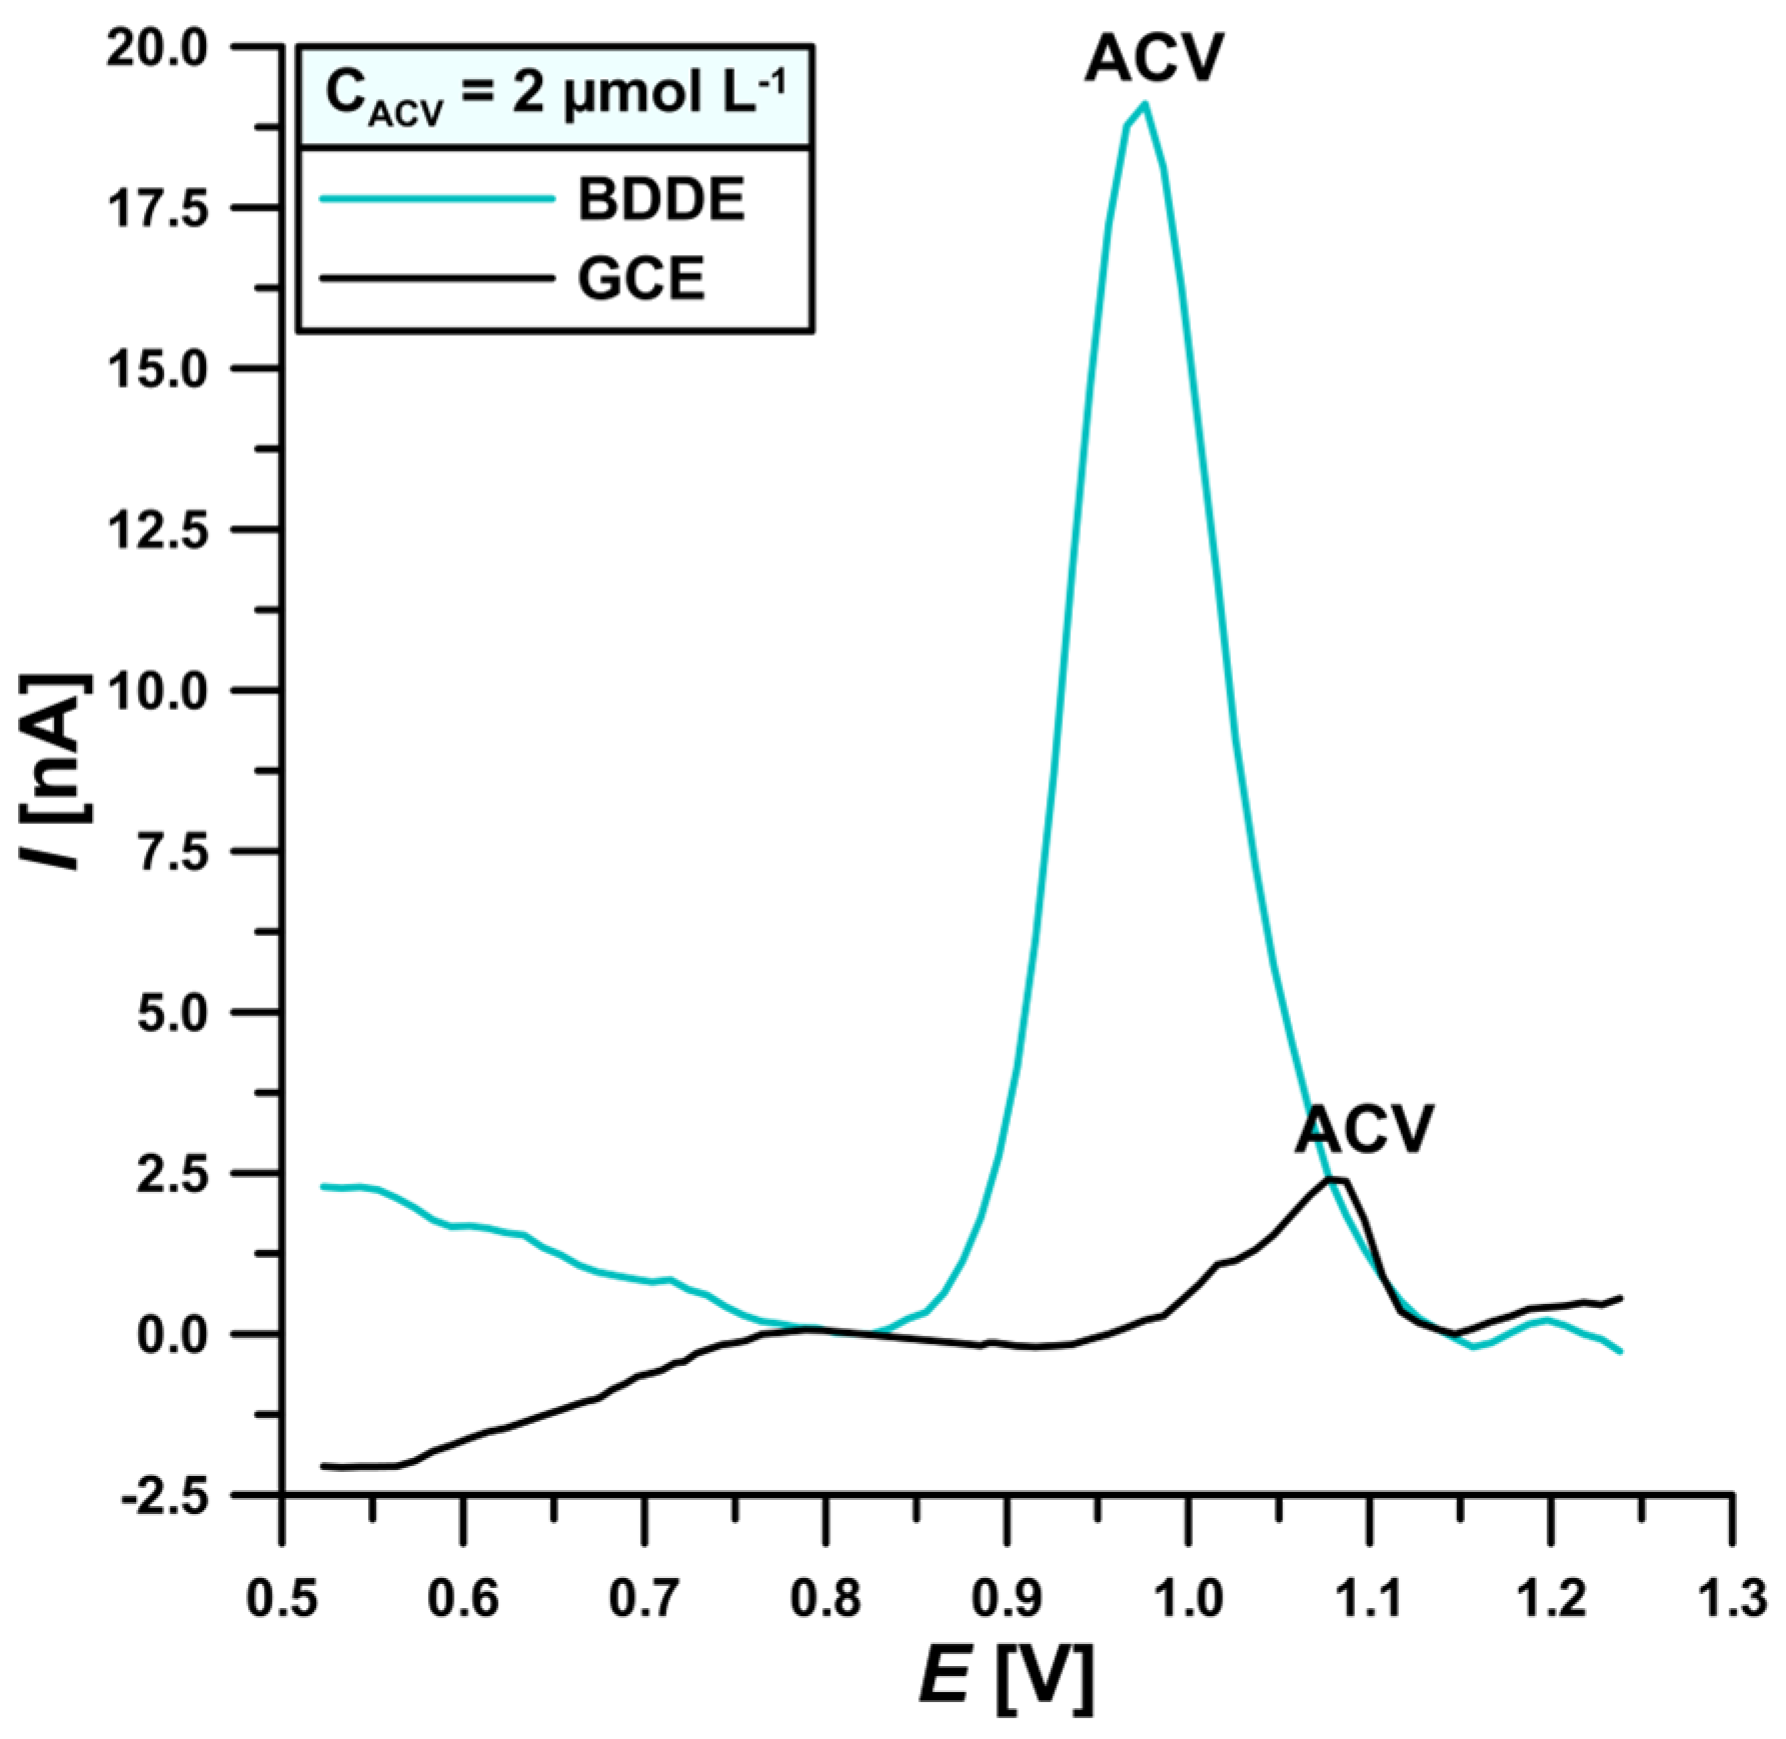
At the beginning of the research, the quality and intensity of the analytical signal on voltammograms obtained on the GCE and the BDDE, in the presence of 2 μmol L−1 of ACV in 0.1 mol L−1 PBS pH = 7.2 solution, were compared. Figure 2 shows that the signal obtained on the BDDE is over 7.8 times higher than on the GCE, while the oxidation peak potential of ACV (Ep) is shifted towards more negative potentials (0.98 V vs. 1.08 V, respectively). Additionally, the GCE peak is asymmetric and tails towards more negative potentials unlike the BDDE signal, which is symmetric, more narrowed, and close to the course of the Gaussian function. Based on the literature data, this may be related to the electrochemical properties of BDDE, including high conductivity achieved by appropriately doping diamonds with boron. It has been shown that significant changes in the conductivity of doped diamonds occur when there are 1000 carbon atoms per boron atom [45,46,47,48,49,50,51,52,53,54,55]. The commercially available BDDE was selected for further research.
To explain the cause of the increase in the signal, the sensors were compared in a solution consisting of 5 mmol L−1 K3[Fe(CN)6] and 0.1 mol L−1 KCl using CV and EIS (Figure 3). It is worth emphasizing that such studies are available in the literature for BDDE and GCE, but not for the specific sensors described in this paper [45,46,47,48,49,50,51,52,53,54,55]. Electrooxidation and electroreduction signals of iron ions on CV voltammograms (ν = 100 mV s−1) (Figure 3A) are higher on the BDDE electrode relative to the GCE. Additionally, the relative separation of the oxidation and reduction peaks (χ0) measured for the GCE and BDDE (7.78 vs. 6.04, respectively) indicates a faster electron transfer in the case of the BDDE because (χ0 = 6.04) is closer to the theoretical value of (χ0 = 1).
Based on the results obtained for the CV voltammograms recorded for scanning rates from 7.5 to 500 mV s−1, the dependence of the peak current (Ip) on the square root of the scan rate (ν) was determined for both electrodes (Figure 3B). On the basis of these relationships, the active surface areas (As) of the GCE and BDDE were enumerated (0.02509 vs. 0.02572 cm2, respectively), using the Randles–Ševčík equation [56]. Thus, the BDDE was found to have a faster electron transfer and a larger active surface. In order to thoroughly examine the electrical properties of both sensors, measurements were made using EIS (50 kHz–1 Hz), and the value of charge transfer resistance (Rct) was designated for both electrodes. The impedance spectra presented in Figure 3C indicate a lower charge transfer resistance on the BDDE relative to the GCE (24.6 vs. 31.0 Ω cm2, respectively).

3.2. Optimization of the Basic Electrolyte Composition and Study of the ACV Electrode Process

As the first step, the effect of 0.1 mol L−1 PBS pH on the 0.2 and 0.5 μmol L−1 ACV signal (Figure 4A) and peak potential (Figure 4B) on the BDDE was examined. Among the tested values (pH = 4.5; 6.0; 6.3; 7.2; and 8.0), the highest peak current was obtained at pH = 7.2. The pH of the solution changes ACV acid-base balance and this is reflected in the changes in its electrochemical behavior for BDDE surface. ACV is charged at the two extremes of the pH range (pKa1 = 2.27 and pKa2 = 9.25). Consequently, the molecule bears a positive charge in solutions up to pH = 2.27. Then, when the pH increases the formation of neutral and anionic species of ACV is favored and this could increase the interaction with the BDDE surface which affects the charge transfer. Finally, at pH = 8, electrooxidation responses decrease due to the predominance of negatively charged species of ACV [17]. According to Figure 4B, the peak potentials of ACV move towards lower values as pH increases, which indicates that protons are included in the oxidation reaction of ACV on the BDDE [57]. Next, the effect of the PBS concentration ranging from 0.025 to 0.125 mol L−1 on the ACV signal was examined (Figure 4C). Ultimately, the best results were achieved in 0.075 mol L−1 PBS pH = 7.2. The increase in ACV signal is related to the improvement of the supporting electrolyte’s electrical conductivity. At concentrations higher than 0.075 mol L−1, subsequent processes may occur that contribute to a reduction in the efficiency of ACV determination.
In the next stage of our research, CV voltammograms were recorded in the optimized electrolyte composition with the presence of 50 μmol L−1 ACV. The influence of changes in the scanning rate ranging from 15 to 400 mV s−1 on the ACV signal was checked. It is noticeable that as the scanning speed increases towards higher values, the ACV electrooxidation peak current also increases significantly (Figure 5A). In addition, the ACV signal shift towards more positive values of potential is visible, along with an increase in the scanning rate. The lack of the reduction peak is proof of the irreversibility of the tested electrode process [56]. The linear relationship between Ip and ν1/2 (Figure 5B) in combination with the log Ip and log ν (Figure 5C) dependence (the slope of the curve approaches the theoretical value of 0.5) is proof of the purely diffusive nature of the studied process. Based on the slope of the curve obtained from the dependency between Ep and log ν (Figure 5D) and the Laviron equation [58], the n value (electron transfer number involved in the rate-determining step) was determined. The received value (n = 2.01) means that two electrons take part in the electrooxidation reaction of ACV on the BDDE. Moreover, oxidation of ACV on BDDE involves a deprotonation step and breaking of the double bond in the imidazole ring between the N(7) = C(8) atoms. Ultimately, an oxoguanine analog is obtained as the final product of this reaction [2,17,19] (Figure 6).

3.3. Procedure Optimization

It was found that the investigated process is purely diffusive (Figure 5). To facilitate access of ACV molecules to the electrode surface, the influence of the base electrolyte solution mixing time (t) before DPV registration on the ACV (0.2 and 0.5 μmol L−1) analytical signal was first checked. Measurements were carried out in the t ranging from 5 s to 30 s. Among the tested values, the highest signal was achieved for the mixing time of 5 s, which is consistent with the nature of the tested process. As t increased, the current intensity of the ACV peak decreased and at t > 15 s, a plateau was established.
In the next part of the research, the DPV technique parameters such as amplitude (ΔEA), scan rate (ν), and modulation time (tm) were optimized (Figure 7). When selecting the optimal value of the tested parameters, the height of the analytical signal, its shape, and signal repeatability were considered. First, ΔEA was changed from 2 to 150 mV, with constant values of ν = 100 mV s−1 and tm = 10 ms. The highest signal from the two ACV additions (0.2 and 0.5 μmol L−1) was obtained for ΔEA = 125 mV. Then, the scanning speed value was optimized by changing it from 100 to 250 mV s−1, with constant ΔEA = 125 mV and tm = 10 ms. The ν = 175 mV s−1 value was chosen as optimal. Finally, the influence of modulation time changes in the range from 4 to 12 ms was checked similarly and tm = 10 ms was the most optimal value.
During the next stage of this research, the repeatability of the 0.5 μmol L−1 ACV signals with optimized DPV technique parameters on the BDDE electrode was examined. The relative standard deviation (RSD) was checked for 10 measurements. The obtained results allowed determining that RSD = 10.2%. To improve signal repeatability, the effect of applying different purification potentials while mixing the solution for a certain period before the measurement was tested. It was found (Table 3) that applying a potential of 1.4 V for 10 s causes a significant improvement in the value of the obtained RSD (%). However, the best results were achieved by applying a potential of 1.4 V during the already optimized value of the mixing time of the basic electrolyte solution (t = 5 s).

3.4. Analytical Parameters of the Procedure and the Influence of Interference Species

To determine the quality and capabilities of the newly developed procedure, the linearity ranges of the calibration curve and the limit of detection (LOD) and quantification (LOQ) were determined under optimized conditions of the base electrolyte composition and DPV parameters. For this purpose, DPV signals were recorded for increasing ACV concentrations (0.1–50,000 nmol L−1) (Figure 8A). On their basis, a calibration curve (Figure 8B) was determined, which consists of three linearity ranges: 0.0001–0.001 μmol L−1 (r = 0.9971, sensitivity = 12.52 ± 0.050 μA/nmol L−1), 0.001–0.01 μmol L−1 (r = 0.9909), and 0.01–50.0 μmol L−1 (r = 0.9927) (0.1–1.0 nmol L−1; 1.0–10.0 nmol L−1 and 10.0–50,000 nmol L−1). The LOD and LOQ were calculated from the following equations: 3SDa/b and 10SDa/b (SDa is the standard deviation of intercept for n = 3 and b is the slope of the calibration plot), respectively [59]. The LOD value was determined at 0.0299 nmol L−1 and LOQ = 0.0995 nmol L−1. RSD between measurements for one standard addition over the entire range of the calibration curve ranged between 0.93% and 4.40%. This result proves very good signal repeatability. It is worth emphasizing that the developed ACV trace-level determination procedure is characterized by the lowest detection limit of all voltammetric procedures described in the literature (Table 1). This is the first time that a bare electrode outperforms modified ones in ACV analysis.
Selectivity tests were performed in the presence of 0.1 μmol L−1 ACV and a 10-fold excess of ions such as Fe3+, Ca2+, Cu2+, Mg2+, Ni2+, Cd2+, Zn2+, Sb3+, Pb2+, NO2, NO3, Cl, and ascorbic acid, ritonavir, lopinavir as well as Triton X-100 (0.2–2.0 ppm). The presence of these substances did not affect the ACV analytical signal by more than ± 10%.

3.5. Sample Analysis

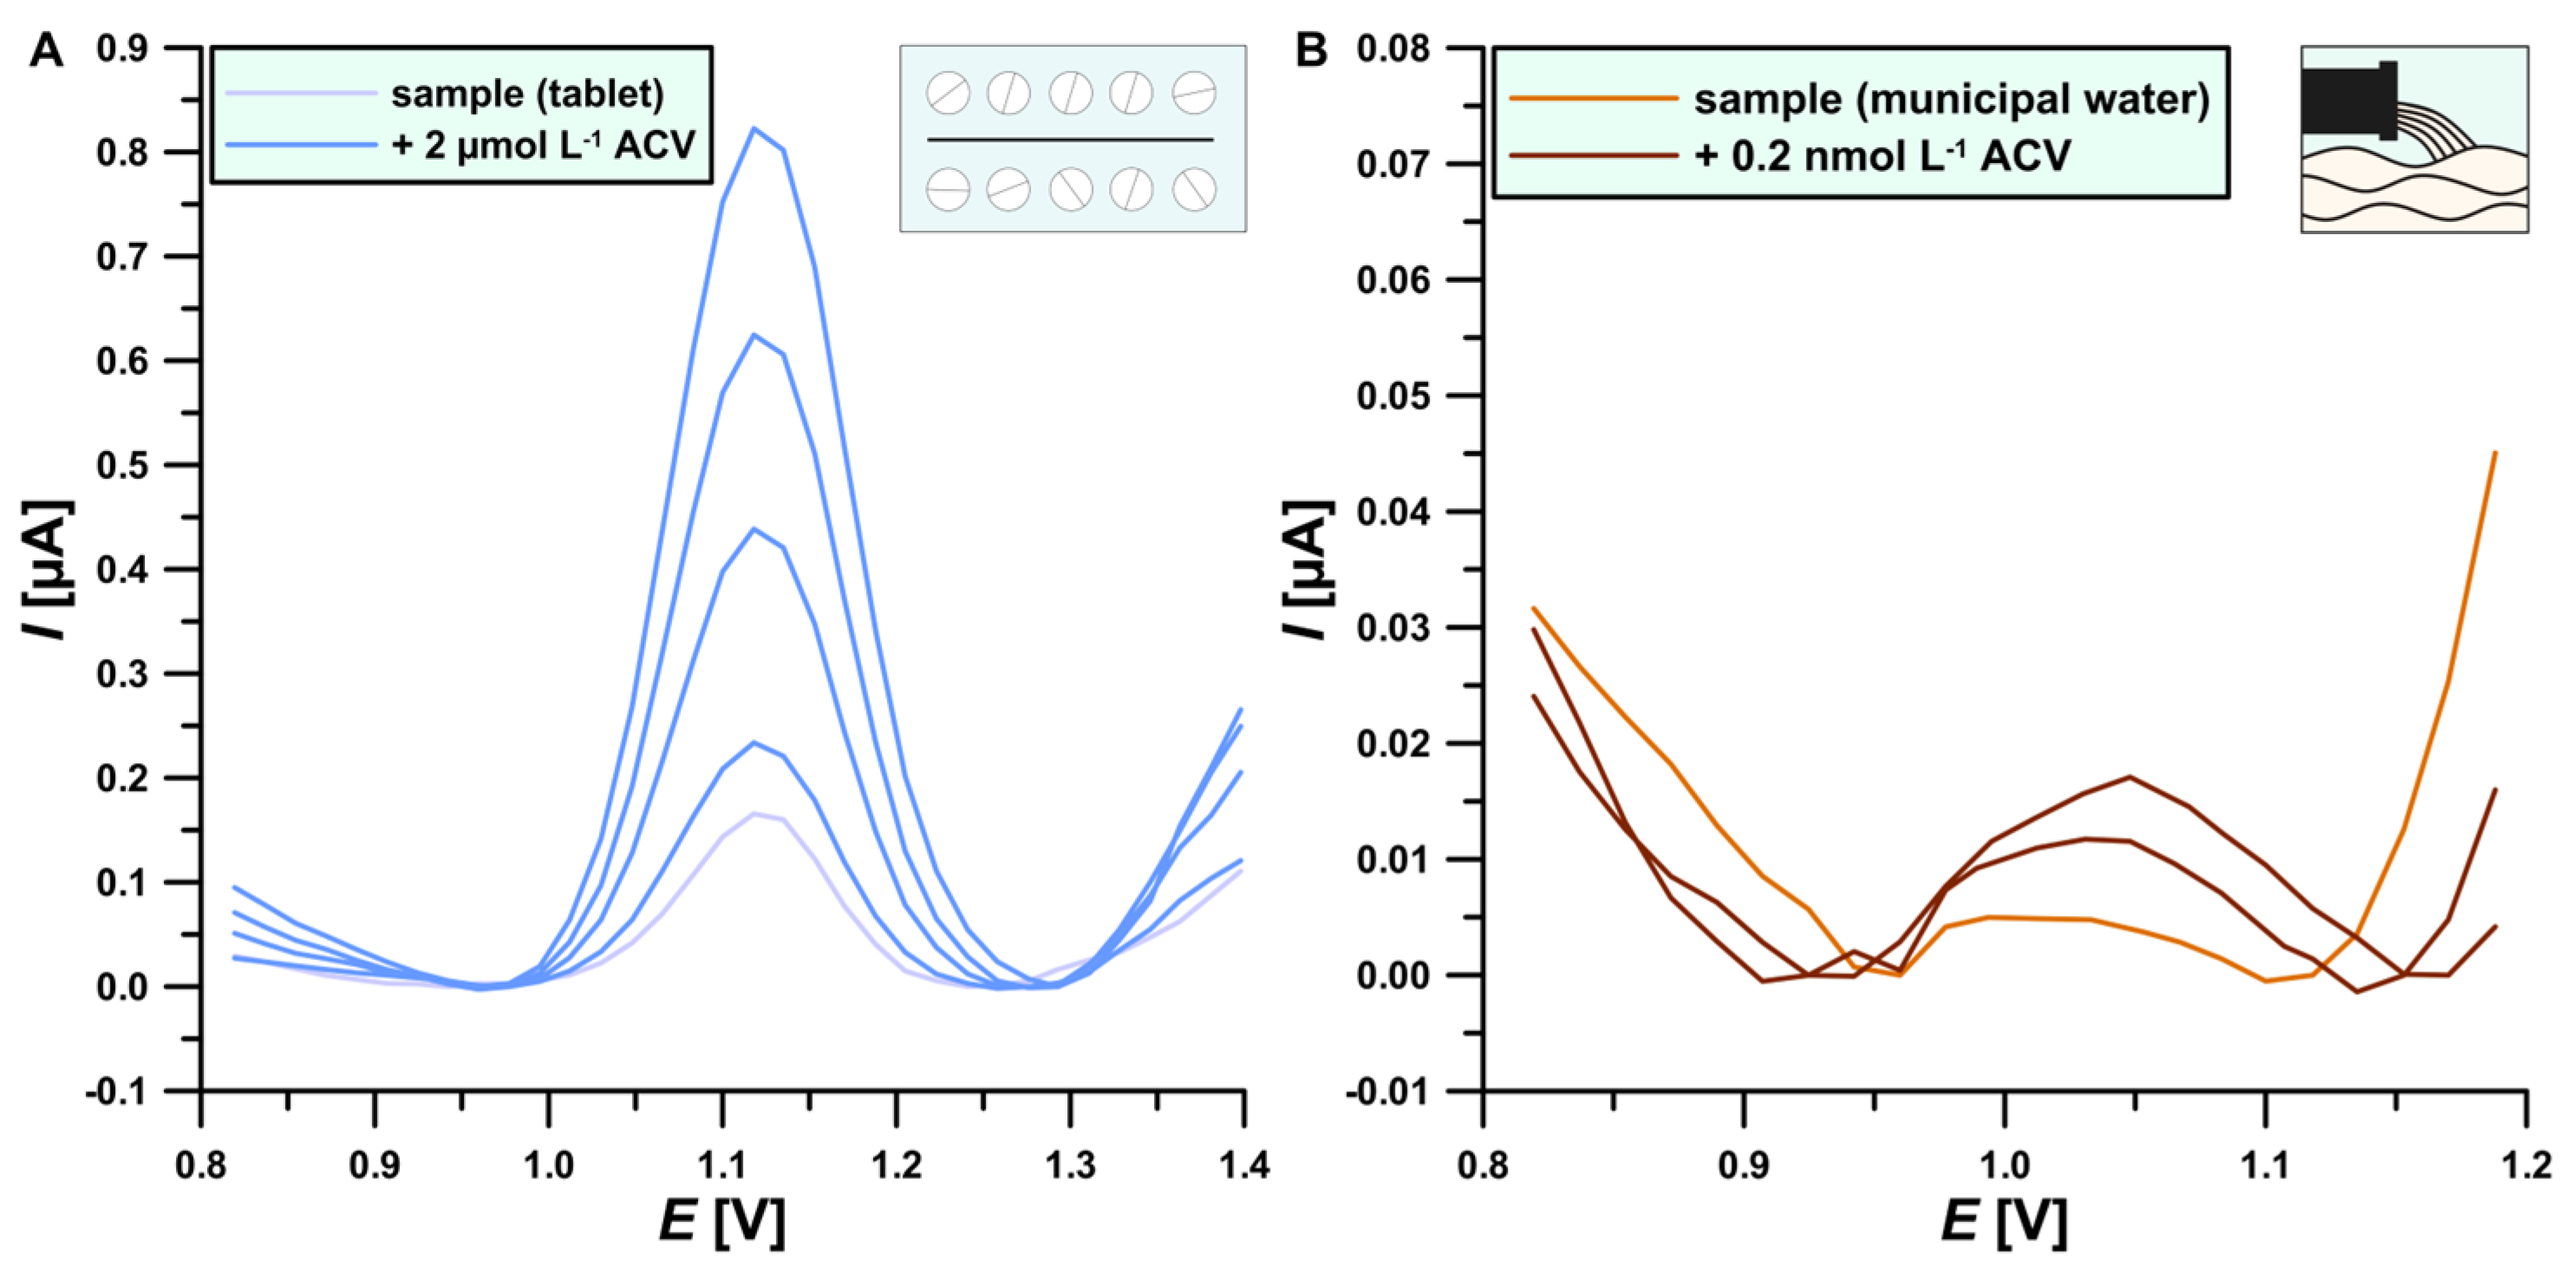
The samples were analyzed using the standard addition method (voltammetry and chromatography) as well as external calibration (chromatography). The comparative methods are UHPLC-DAD and UHPLC-MS (TOF). Quantification of DPV tablets was performed by adding 1 μL of the extract to the electrochemical cell (Figure 9A). The analysis of wastewater samples was carried out by diluting the starting solution 10 times to reduce matrix effects (Figure 9B). The results of ACV determinations in the tablet extract and purified municipal wastewater performed using the voltammetry technique as well as chromatography reference methods are presented in Table 4.
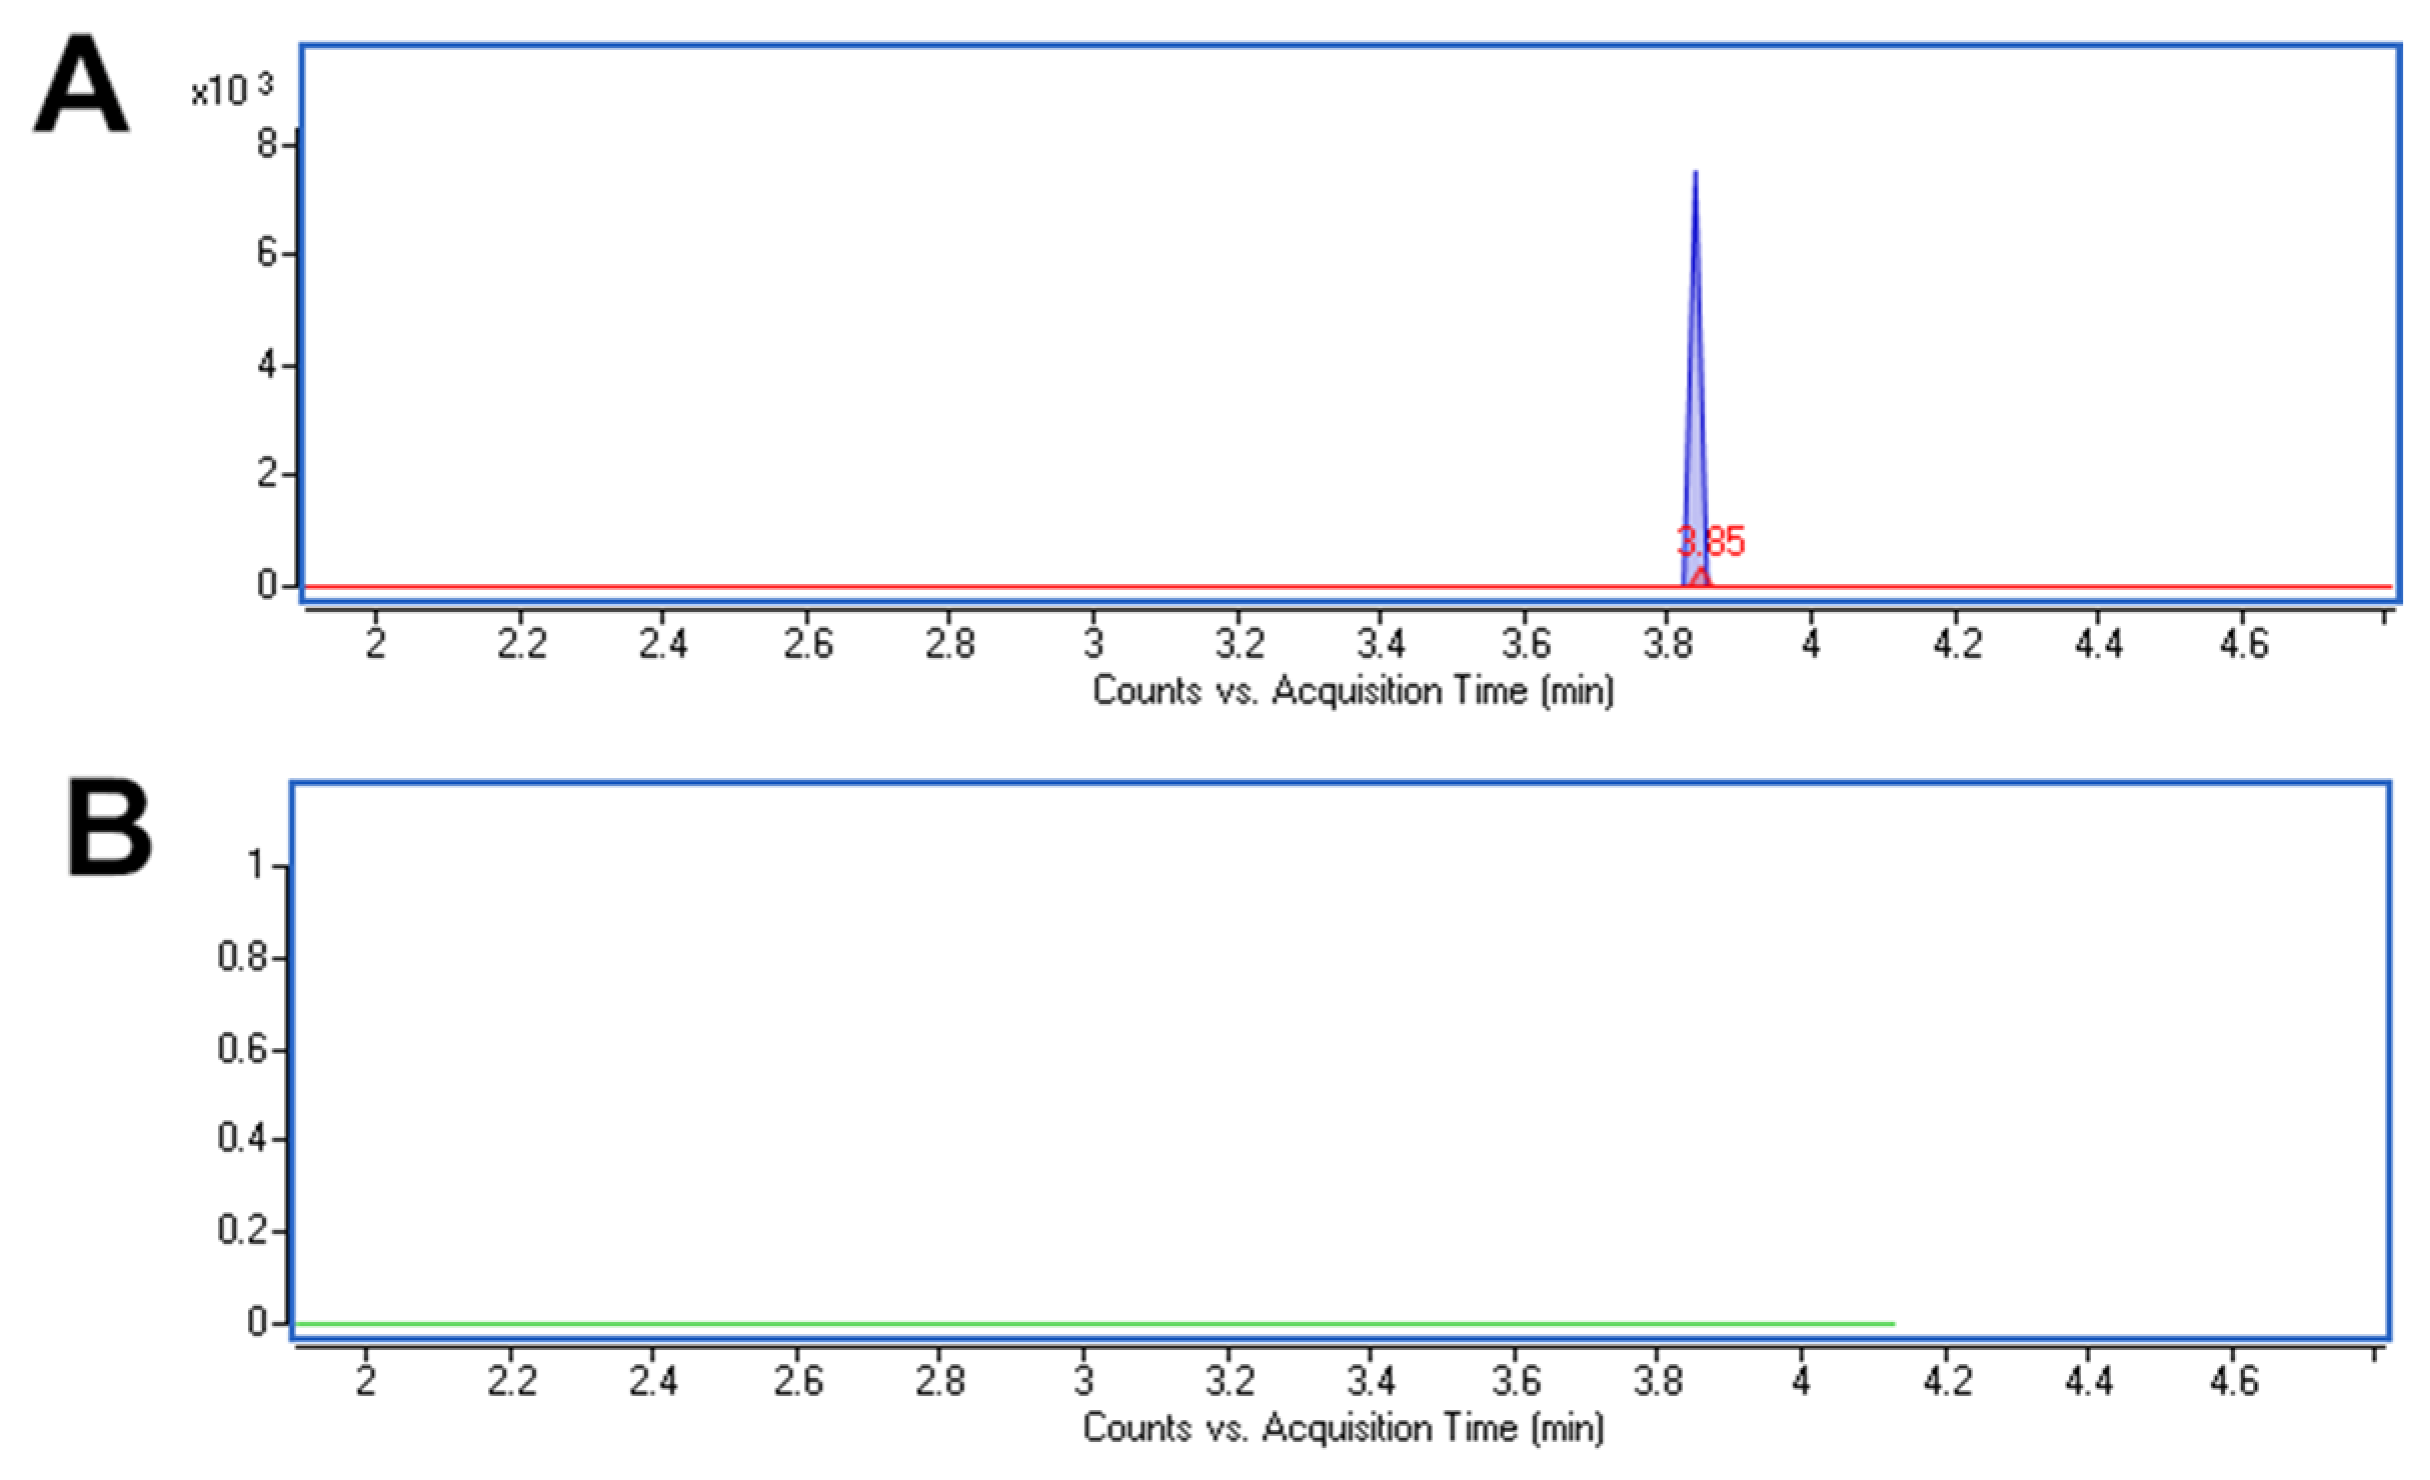
In the case of the analysis of the tablet extract, consistent results were obtained both using the DPV procedure and chromatographic reference methods [14,15,16]. The obtained recovery values are close to 100% (in the range of 94.47–96.26%), indicating a low effect of the sample matrix on the ACV peak. During the analysis of wastewater samples, the advantages of the voltammetric methods emerged. In the case of the DPV procedure, the ACV concentration in a wastewater sample was determined at 1.34 nmol L−1, which is a value consistent with the literature data [9]. In the case of the reference methods, it was not possible to perform a quantitative analysis of not spiked samples. Only UHPLC-MS (TOF)) was able to detect ACV in the sample (Figure 10).
The voltammetric and chromatographic methods allowed for the determination of ACV in the enriched sample (wastewater samples spiked with 100 ng L−1 ACV standard solution). The recovery values calculated for the spiked samples are in the range of 92.27–95.21%. The recovery analysis showed a low impact of matrix effects on the ACV signal.

4. Conclusions

For the first time, unmodified BDDE combined with DPV was used for the determination of ACV. The developed procedure using BDDE allows for achieving the lowest detection limit (LOD = 0.0299 nmol L−1) of all the voltammetric ACV determination procedures described in the literature. Additionally, the developed procedure has a low limit of quantification (LOQ = 0.0995 nmol L−1) as well as a wide range of linearity of the calibration curve: 0.0001–0.001 μmol L−1; 0.001–0.01 μmol L−1; and 0.01–50.0 μmol L−1. Our sensor is unmodified, which significantly shortens the preparation time compared to complex sensors described in the literature. The time needed from the beginning of the measurement to obtain the voltammogram is also very short (the total time of one measurement is less than 18 s). Moreover, the proposed procedure with BDDE was successfully used to analyze pharmaceutical and municipal wastewater samples. The obtained results are consistent with measurements made using chromatographic methods. The lack of time-consuming preparation of the sensor and the low consumption of samples and reagents meet the requirements of green chemistry. The results are promising for the potential application of the BDDE in simple, fast, and sensitive ACV quantification.

Author Contributions

Conceptualization, D.G. and K.T.-R.; Methodology, D.G. and K.T.-R.; Validation, D.G., K.T.-R., M.W. and I.S.; Investigation, D.G., K.T.-R., M.W. and I.S.; Resources, D.G., K.T.-R., M.W. and I.S.; Data curation, D.G., K.T.-R., M.W. and I.S.; Writing—original draft preparation, D.G. and K.T.-R.; Writing—review and editing, D.G., K.T.-R., M.W. and I.S.; Visualization, D.G. and M.W.; Supervision, K.T.-R. All authors have read and agreed to the published version of the manuscript.

Funding

This research received no external funding.

Institutional Review Board Statement

Not applicable.

Informed Consent Statement

Not applicable.

Data Availability Statement

The original contributions presented in the study are included in the article, further inquiries can be directed to the corresponding author.

Acknowledgments

We would like to thank the employees of Municipal Water Supply & Waste Water Treatment Company Ltd. (Lublin, Poland) for the wastewater samples.

Conflicts of Interest

The authors declare no conflicts of interest.

References

  1. Shetti, N.P.; Malode, S.J.; Nandibewoor, S.T. Electrochemical Behavior of an Antiviral Drug Acyclovir at Fullerene-C60-Modified Glassy Carbon Electrode. Bioelectrochemistry 2012, 88, 76–83. [Google Scholar] [CrossRef] [PubMed]
  2. Shahrokhian, S.; Azimzadeh, M.; Amini, M.K. Modification of Glassy Carbon Electrode with a Bilayer of Multiwalled Carbon Nanotube/Tiron-Doped Polypyrrole: Application to Sensitive Voltammetric Determination of Acyclovir. Mater. Sci. Eng. C 2015, 53, 134–141. [Google Scholar] [CrossRef] [PubMed]
  3. Suazo, P.A.; Tognarelli, E.I.; Kalergis, A.M.; González, P.A. Herpes Simplex Virus 2 Infection: Molecular Association with HIV and Novel Microbicides to Prevent Disease. Med. Microbiol. Immunol. 2015, 204, 161–176. [Google Scholar] [CrossRef] [PubMed]
  4. Sadikoglu, M.; Saglikoglu, G.; Yagmur, S.; Orta, E.; Yilmaz, S. Voltammetric Determination of Acyclovir in Human Urine Using Ultra Trace Graphite and Glassy Carbon Electrodes. Curr. Anal. Chem. 2011, 7, 130–135. [Google Scholar] [CrossRef]
  5. Ericson, J.E.; Gostelow, M.; Autmizguine, J.; Hornik, C.P.; Clark, R.H.; Benjamin, D.K.; Smith, P.B. Safety of High-Dose Acyclovir in Infants with Suspected and Confirmed Neonatal Herpes Simplex Virus Infections. Pediatr. Infect. Dis. J. 2017, 36, 369–373. [Google Scholar] [CrossRef]
  6. Dorraji, P.S.; Fotouhi, L. Electropolymerized Film of L-Cysteine in the Presence of Deep Eutectic Solvent on NaOH Nanorods Glassy Carbon Electrode for Sensitive Determination of Acyclovir in Biological Fluids. IEEE Sens. J. 2021, 21, 1324–1331. [Google Scholar] [CrossRef]
  7. Castro, A.A.; Cordoves, A.I.P.; Farias, P.A.M. Determination of the Antiretroviral Drug Acyclovir in Diluted Alkaline Electrolyte by Adsorptive Stripping Voltammetry at the Mercury Film Electrode. Anal. Chem. Insights 2013, 8, ACI.S11608. [Google Scholar] [CrossRef]
  8. Wang, F.; Chen, L.; Chen, X.; Hu, S. Studies on Electrochemical Behaviors of Acyclovir and Its Voltammetric Determination with Nano-Structured Film Electrode. Anal. Chim. Acta 2006, 576, 17–22. [Google Scholar] [CrossRef]
  9. Gupta, A.; Vyas, R.K.; Gupta, A.B. Occurrence of Acyclovir in the Aquatic Environment, Its Removal and Research Perspectives: A Review. J. Water Process Eng. 2021, 39, 101855. [Google Scholar] [CrossRef]
  10. Yu, L.; Xiang, B. Quantitative Determination of Acyclovir in Plasma by near Infrared Spectroscopy. Microchem. J. 2008, 90, 63–66. [Google Scholar] [CrossRef]
  11. Mustafa, A.A.; Abdel-Fattah, S.A.; Toubar, S.S.; Sultan, M.A. Spectrophotometric Determination of Acyclovir and Amantadine Hydrochloride through Metals Complexation. J. Anal. Chem. 2004, 59, 33–38. [Google Scholar] [CrossRef]
  12. Ayad, M.M.; Abdellatef, H.E.; El-Henawee, M.M.; El-Sayed, H.M. Spectrophotometric and Spectrofluorimetric Methods for Analysis of Acyclovir and Acebutolol Hydrochloride. Spectrochim. Acta A Mol. Biomol. Spectrosc. 2007, 66, 106–110. [Google Scholar] [CrossRef] [PubMed]
  13. Long, X.; Chen, F. Flow Injection-Chemiluminescence Determination of Acyclovir: FI-CL Determination of Acyclovir. Luminescence 2012, 27, 478–481. [Google Scholar] [CrossRef] [PubMed]
  14. Weller, D.R.; Balfour, H.H.; Vezina, H.E. Simultaneous Determination of Acyclovir, Ganciclovir, and (R)-9-[4-Hydroxy-2-(Hydroxymethyl)Butyl]Guanine in Human Plasma Using High-Performance Liquid Chromatography. Biomed. Chromatogr. 2009, 23, 822–827. [Google Scholar] [CrossRef] [PubMed]
  15. Shao, C.; Dowling, T.C.; Haidar, S.H.; Yu, L.X.; Polli, J.E.; Kane, M.A. Quantification of Acyclovir in Human Plasma by Ultra-High-Performance Liquid Chromatography—Heated Electrospray Ionization—Tandem Mass Spectrometry for Bioequivalence Evaluation. J. Anal. Bioanal. Tech. 2012, 3, 1000139. [Google Scholar] [CrossRef]
  16. Jin, L.; Wei, G.; Lu, W.-Y.; Xu, L.-J.; Pan, J. Quantitative Determination of Acyclovir in Aqueous Humor by LC-MS. Chromatographia 2006, 63, 239–242. [Google Scholar] [CrossRef]
  17. Martínez-Rojas, F.; Del Valle, M.A.; Isaacs, M.; Ramírez, G.; Armijo, F. Electrochemical Behaviour Study and Determination of Guanine, 6-Thioguanine, Acyclovir and Gancyclovir on Fluorine-Doped SnO2 Electrode. Application in Pharmaceutical Preparations. Electroanalysis 2017, 29, 2888–2895. [Google Scholar] [CrossRef]
  18. Dorraji, P.S.; Jalali, F. Differential Pulse Voltammetric Determination of Nanomolar Concentrations of Antiviral Drug Acyclovir at Polymer Film Modified Glassy Carbon Electrode. Mater. Sci. Eng. C 2016, 61, 858–864. [Google Scholar] [CrossRef]
  19. Dilgin, D.G.; Karakaya, S. Differential Pulse Voltammetric Determination of Acyclovir in Pharmaceutical Preparations Using a Pencil Graphite Electrode. Mater. Sci. Eng. C 2016, 63, 570–576. [Google Scholar] [CrossRef]
  20. Shetti, N.P.; Nayak, D.S.; Malode, S.J.; Kulkarni, R.M. Nano Molar Detection of Acyclovir, an Antiviral Drug at Nanoclay Modified Carbon Paste Electrode. Sens. Bio-Sens. Res. 2017, 14, 39–46. [Google Scholar] [CrossRef]
  21. Carolina Ordoñez, H.; José Espitia, H.; Harold Díaz, S.; Rojas, G.; Alonso Jaramillo, A. Voltammetric Analysis of Acyclovir at Glassy Carbon/Oppy/Templated Electrode. J. Phys. Conf. Ser. 2018, 1119, 012008. [Google Scholar] [CrossRef]
  22. Wei, Y.; Yao, L.; Wu, Y.; Liu, X.; Feng, J.; Ding, J.; Li, K.; He, Q. Ultrasensitive Electrochemical Detection for Nanomolarity Acyclovir at Ferrous Molybdate Nanorods and Graphene Oxide Composited Glassy Carbon Electrode. Colloids Surf. Physicochem. Eng. Asp. 2022, 641, 128601. [Google Scholar] [CrossRef]
  23. Karim-Nezhad, G.; Khorablou, Z.; Mehdikhani, S. Preparation of a Double-Step Modified Carbon Paste Electrode for Trace Quantification of Acyclovir Using TiO2 Nanoparticle and β-Cyclodextrin. Electroanalysis 2018, 30, 2908–2915. [Google Scholar] [CrossRef]
  24. Lu, X.-Y.; Li, J.; Kong, F.-Y.; Wei, M.-J.; Zhang, P.; Li, Y.; Fang, H.-L.; Wang, W. Improved Performance for the Electrochemical Sensing of Acyclovir by Using the rGO–TiO2–Au Nanocomposite-Modified Electrode. Front. Chem. 2022, 10, 892919. [Google Scholar] [CrossRef]
  25. Joseph, R.; Kumar, K.G. Electrochemical Sensing of Acyclovir at a Gold Electrode Modified with 2-Mercaptobenzothiazole–[5,10,15,20-Tetrakis-(3-Methoxy-4-Hydroxyphenyl)Porphyrinato]Copper(II). Anal. Sci. 2011, 27, 67–72. [Google Scholar] [CrossRef]
  26. Saleh, G.A.; Askal, H.F.; Refaat, I.H.; Abdel-aal, F.A.M. Adsorptive Square Wave Voltammetric Determination of Acyclovir and Its Application in a Pharmacokinetic Study Using a Novel Sensor of β-Cyclodextrin Modified Pencil Graphite Electrode. Bull. Chem. Soc. Jpn. 2015, 88, 1291–1300. [Google Scholar] [CrossRef]
  27. Naghian, E.; Marzi Khosrowshahi, E.; Sohouli, E.; Pazoki-Toroudi, H.R.; Sobhani-Nasab, A.; Rahimi-Nasrabadi, M.; Ahmadi, F. Electrochemical Oxidation and Determination of Antiviral Drug Acyclovir by Modified Carbon Paste Electrode with Magnetic CdO Nanoparticles. Front. Chem. 2020, 8, 689. [Google Scholar] [CrossRef] [PubMed]
  28. Lotfi, Z.; Gholivand, M.B.; Shamsipur, M.; Mirzaei, M. An Electrochemical Sensor Based on Ag Nanoparticles Decorated on Cadmium Sulfide Nanowires/Reduced Graphene Oxide for the Determination of Acyclovir. J. Alloys Compd. 2022, 903, 163912. [Google Scholar] [CrossRef]
  29. Hamtak, M.; Fotouhi, L.; Hosseini, M.; Dorraji, P.S. Sensitive Determination of Acyclovir in Biological and Pharmaceutical Samples Based on Polymeric Film Decorated with Nanomaterials on Nanoporous Glassy Carbon Electrode. J. Electrochem. Soc. 2018, 165, B632–B637. [Google Scholar] [CrossRef]
  30. Karim-Nezhad, G.; Sarkary, A.; Khorablou, Z.; Dorraji, P.S. Synergistic Effect of ZnO Nanoparticles and Carbon Nanotube and Polymeric Film on Electrochemical Oxidation of Acyclovir. Iran. J. Pharm. Res. 2018, 17, 52–62. [Google Scholar]
  31. Saleh, G.A.; Askal, H.F.; Refaat, I.H.; Abdel-aal, F.A.M. A New Electrochemical Method for Simultaneous Determination of Acyclovir and Methotrexate in Pharmaceutical and Human Plasma Samples. Anal. Bioanal. Electrochem. 2016, 8, 691–716. [Google Scholar]
  32. Abedini, S.; Rafati, A.A.; Ghaffarinejad, A. A Simple and Low-Cost Electrochemical Sensor Based on a Graphite Sheet Electrode Modified by Carboxylated Multiwalled Carbon Nanotubes and Gold Nanoparticles for Detection of Acyclovir. New J. Chem. 2022, 46, 20403–20411. [Google Scholar] [CrossRef]
  33. Ghadirinataj, M.; Hassaninejad-Darzi, S.K.; Emadi, H. An Electrochemical Nanosensor for Simultaneous Quantification of Acetaminophen and Acyclovir by ND@Dy2O3-IL/CPE. Electrochim. Acta 2023, 450, 142274. [Google Scholar] [CrossRef]
  34. Can, S.; Yilmaz, S.; Saglikoglu, G.; Sadikoglu, M.; Menek, N. Electrocatalytic Oxidation of Acyclovir on Poly(p-Aminobenzene Sulfonic Acid) Film Modified Glassy Carbon Electrode. Electroanalysis 2015, 27, 2431–2438. [Google Scholar] [CrossRef]
  35. Tarlekar, P.; Khan, A.; Chatterjee, S. Nanoscale Determination of Antiviral Drug Acyclovir Engaging Bifunctionality of Single Walled Carbon Nanotubes—Nafion Film. J. Pharm. Biomed. Anal. 2018, 151, 1–9. [Google Scholar] [CrossRef] [PubMed]
  36. Shaidarova, L.G.; Gedmina, A.V.; Poadnyak, A.A.; Chelnokova, I.A.; Budnikov, H.C. Selective Voltammetric and Flow-Injection Amperometric Determination of Acyclovir and Valacyclovir on an Electrode with a Reduced Graphene Oxide–Polyglycine Film Composite. J. Anal. Chem. 2022, 77, 681–687. [Google Scholar] [CrossRef]
  37. Yanik, S.; Emre, D.; Alp, M.; Algi, F.; Yilmaz, S.; Bilici, A.; Ozkan-Ariksoysal, D. A Novel Electrochemical Biosensor Based on Palladium Nanoparticles Decorated on Reduced Graphene Oxide-Polyaminophenol Matrix for the Detection and Discrimination of Mitomycin C-DNA and Acyclovir-DNA Interaction. J. Pharm. Biomed. Anal. 2023, 234, 115524. [Google Scholar] [CrossRef]
  38. Skrzypek, S.; Ciesielski, W.; Yilmaz, S. Voltammetric Study of Aciclovir Using Controled Grow Mercury Drop Electrode. Chem. Anal. 2007, 52, 1071–1078. [Google Scholar]
  39. Lalei, M.; Zarei, K. Fabrication of RuNPs/TBA/PGE and Its Application for the Electrochemical Determination of Trace Amounts of Acyclovir. Microchem. J. 2023, 190, 108667. [Google Scholar] [CrossRef]
  40. Atta, N.F.; Galal, A.; Ahmed, Y.M. New Strategy for Determination of Anti-Viral Drugs Based on Highly Conductive Layered Composite of MnO2/Graphene/Ionic Liquid Crystal/Carbon Nanotubes. J. Electroanal. Chem. 2019, 838, 107–118. [Google Scholar] [CrossRef]
  41. El Henawee, M.; Saleh, H.; Attia, A.K.; Hussien, E.M.; Derar, A.R. Carbon Nanotubes Bulk Modified Printed Electrochemical Sensor for Green Determination of Vortioxetine Hydrobromide by Linear Sweep Voltammetry. Measurement 2021, 177, 109239. [Google Scholar] [CrossRef]
  42. Alinejad, T.; Chen, C.; Shamsipur, M.; Bagher Gholivand, M.; Paimard, G. Electrochemical Evaluation and Determination of Antiretroviral Drug Ganciclovir Based on Fe-Cu/TiO2/Multi-Walled Carbon Nanotubes Sensor. Measurement 2023, 214, 112846. [Google Scholar] [CrossRef]
  43. Shetti, N.P.; Malode, S.J.; Nayak, D.S.; Naik, R.R.; Kuchinad, G.T.; Reddy, K.R.; Shukla, S.S.; Aminabhavi, T.M. Hetero-Nanostructured Iron Oxide and Bentonite Clay Composite Assembly for the Determination of an Antiviral Drug Acyclovir. Microchem. J. 2020, 155, 104727. [Google Scholar] [CrossRef]
  44. Tyszczuk-Rotko, K.; Staniec, K.; Gorylewski, D.; Keller, A. First Acyclovir Determination Procedure via Electrochemically Activated Screen-Printed Carbon Electrode Coupled with Well-Conductive Base Electrolyte. Sensors 2024, 24, 1125. [Google Scholar] [CrossRef]
  45. Compton, R.G.; Foord, J.S.; Marken, F. Electroanalysis at Diamond-Like and Doped-Diamond Electrodes. Electroanalysis 2003, 15, 1349–1363. [Google Scholar] [CrossRef]
  46. Vinokur, N.; Miller, B.; Avyigal, Y.; Kalish, R. Electrochemical Behavior of Boron-Doped Diamond Electrodes. J. Electrochem. Soc. 1996, 143, L238–L240. [Google Scholar] [CrossRef]
  47. Oliveira, S.C.B.; Oliveira-Brett, A.M. Voltammetric and electrochemical impedance spectroscopy characterization of a cathodic and anodic pre-treated boron doped diamond electrode. Electrochim. Acta 2010, 55, 4599–4605. [Google Scholar] [CrossRef]
  48. Einaga, Y. Boron-Doped Diamond Electrodes: Fundamentals for Electrochemical Applications. Acc. Chem. Res. 2022, 55, 3605–3615. [Google Scholar] [CrossRef]
  49. Matvieiev, O.; Šelešovská, R.; Vojs, M.; Marton, M.; Michniak, P.; Hrdlička, V.; Hatala, M.; Janíková, L.; Chýlková, J.; Skopalová, J.; et al. Novel Screen-Printed Sensor with Chemically Deposited Boron-Doped Diamond Electrode: Preparation, Characterization, and Application. Biosensors 2022, 12, 241. [Google Scholar] [CrossRef]
  50. Muzyka, K.; Sun, J.; Fereja, T.H.; Lan, Y.; Zhang, W.; Xu, G. Boron-doped diamond: Current progress and challenges in view of electroanalytical applications. Anal. Methods 2019, 11, 397–414. [Google Scholar] [CrossRef]
  51. Baluchová, S.; Daňhel, A.; Dejmková, H.; Ostatná, V.; Fojta, M.; Schwarzová-Pecková, K. Recent progress in the applications of boron doped diamond electrodes in electroanalysis of organic compounds and biomolecules—A review. Anal. Chim. Acta 2019, 1077, 30–66. [Google Scholar] [CrossRef] [PubMed]
  52. Hrdlička, V.; Matvieiev, O.; Navrátil, T.; Šelešovská, R. Recent advances in modified boron-doped diamond electrodes: A review. Electrochim. Acta 2023, 456, 142435. [Google Scholar] [CrossRef]
  53. Sousa, C.P.; Ribeiro, F.W.P.; Oliveira, T.M.B.F.; Salazar-Banda, G.R.; de Lima Neto, P.; Morais, S.; Correia, A.N. Electroanalysis of Pharmaceuticals on Boron-Doped Diamond Electrodes: A Review. ChemElectroChem 2019, 6, 2350–2378. [Google Scholar] [CrossRef]
  54. Coldibeli, B.; Sartori, E.R. Development of environmentally friendly voltammetric methods for the individual and simultaneous determination of antihypertensives: Validation and application. Diam. Relat. Mater. 2024, 142, 110787. [Google Scholar] [CrossRef]
  55. Ali, H.S.; Yardım, Y. Simultaneous estimation of total phenolic and alkaloid contents in the tea samples by utilizing the catechin and caffeine oxidation signals through the square-wave voltammetry. Food Chem. 2024, 441, 138262. [Google Scholar] [CrossRef]
  56. Beck, F. Cyclic Voltammetry—Simulation and Analysis of Reaction Mechanisms. Electroanalysis 1995, 7, 298. [Google Scholar] [CrossRef]
  57. Özok, H.İ.; Kıran, M.; Yunusoğlu, O.; Yardım, Y. The First Electroanalytical Study of Umifenovir (Arbidol) Used as a Potential Antiviral Drug for the Treatment of SARS-CoV-2: A Voltammetric Quantification on the Boron-Doped Diamond Electrode by Using Anionic Surfactant Media. J. Electrochem. Soc. 2023, 170, 016501. [Google Scholar] [CrossRef]
  58. Laviron, E. General Expression of the Linear Potential Sweep Voltammogram in the Case of Diffusionless Electrochemical Systems. J. Electroanal. Chem. Interfacial Electrochem. 1979, 101, 19–28. [Google Scholar] [CrossRef]
  59. Mocak, J.; Bond, A.M.; Mitchell, S.; Scollary, G. A Statistical Overview of Standard (IUPAC and ACS) and New Procedures for Determining the Limits of Detection and Quantification: Application to Voltammetric and Stripping Techniques. Pure Appl. Chem. 1997, 69, 297–328. [Google Scholar] [CrossRef]
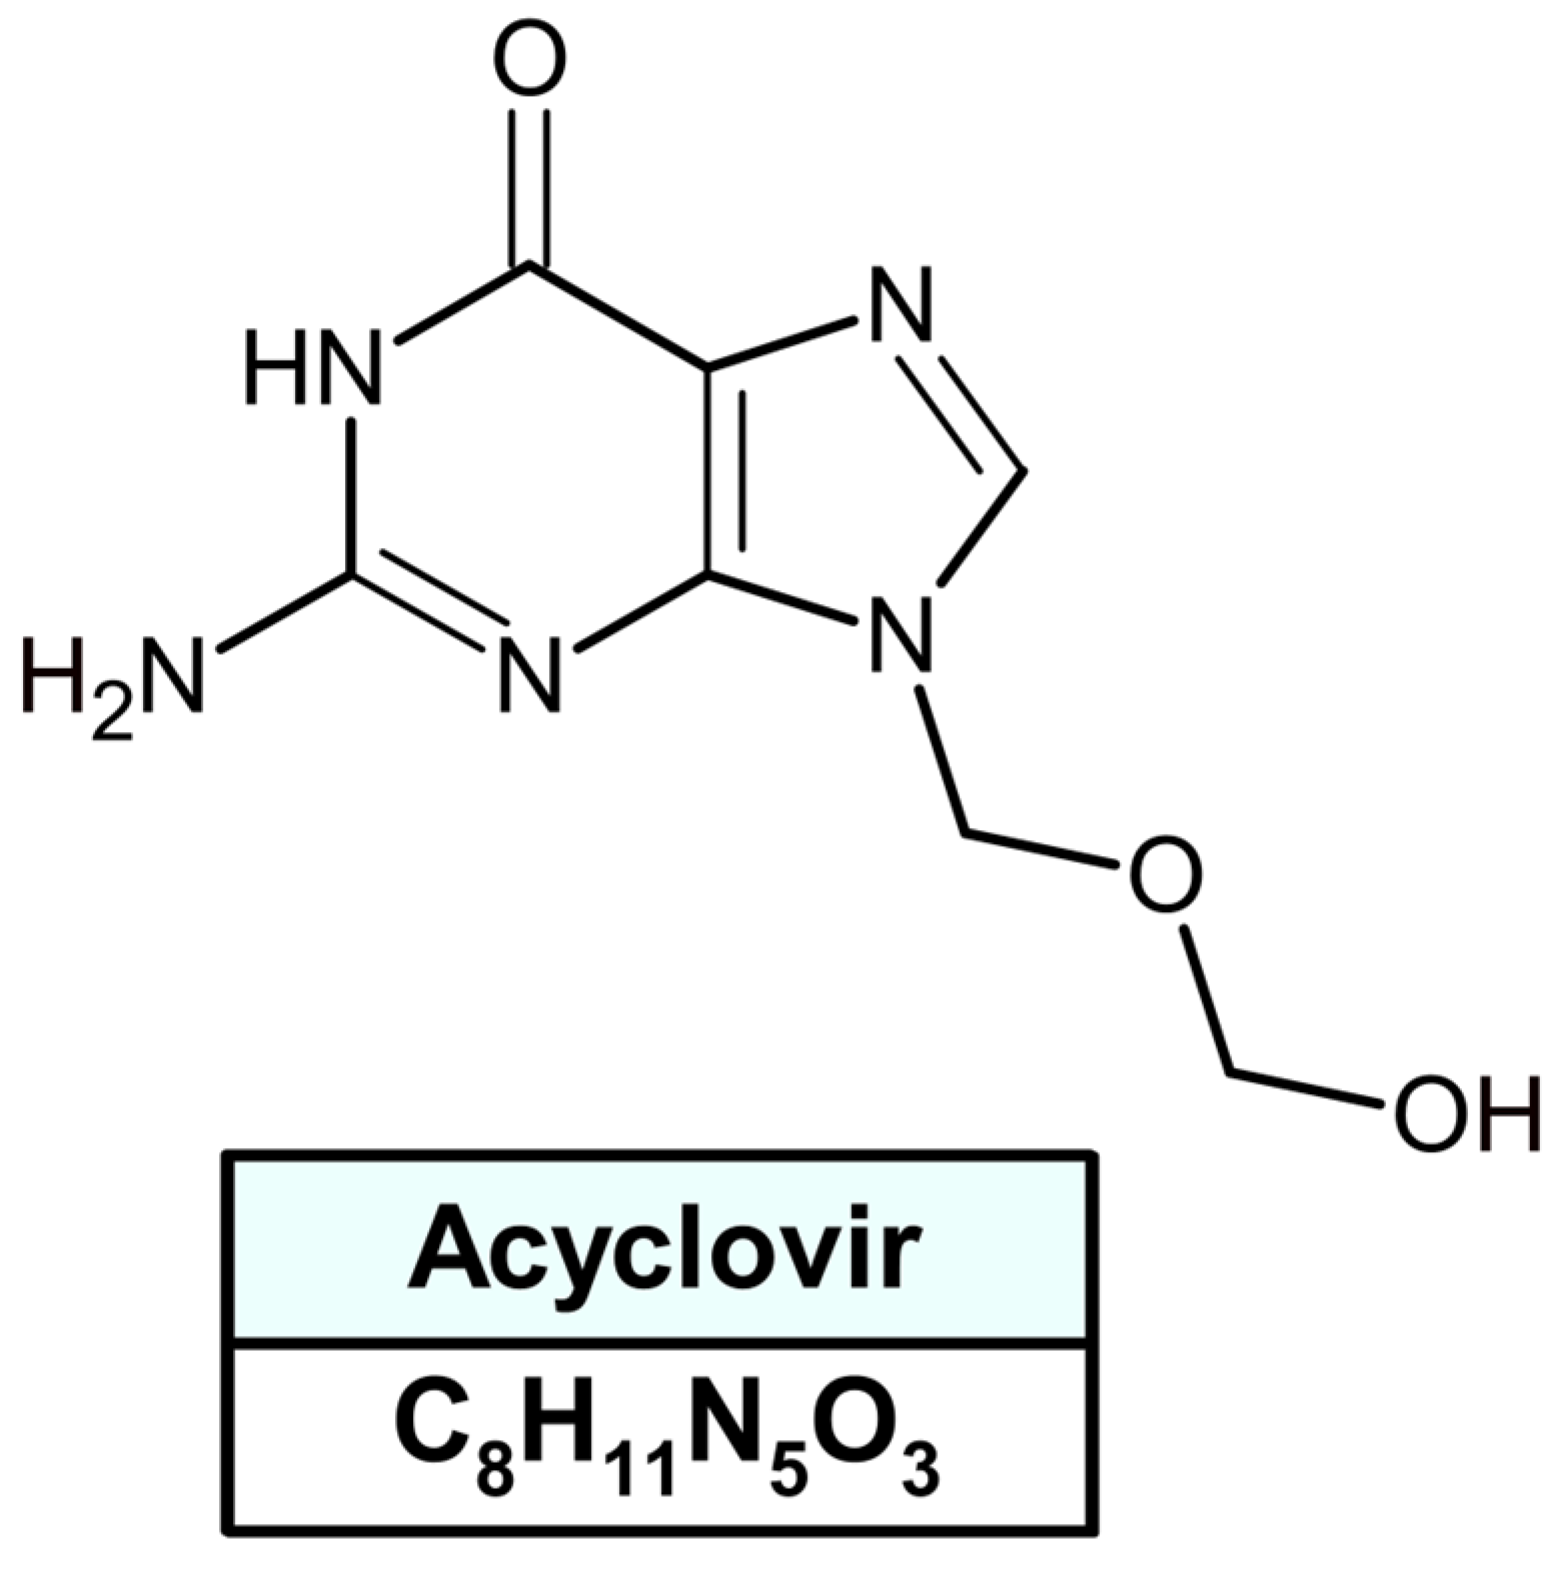
Figure 1. ACV structural formula.
Materials 17 04480 g001
Figure 2. DPVs of 2 μmol L−1 ACV at the GCE and BDDE. Technique parameters: ΔEA = 10 mV, ν = 100 mV s−1, and tm = 10 ms.
Materials 17 04480 g002
Figure 3. Cyclic voltammetry (CV) measurements (A) conducted on the GCE and BDDE; (B) dependence of the peak current (Ip) on the square root of the scanning rate (ν) from 7.5 to 500 mV s−1; (C) electrochemical impedance spectroscopy (EIS) spectrum of the GCE and BDDE. All measurements were performed in a solution consisting of 0.1 mol L−1 KCl and 5 mmol L−1 K3[Fe(CN)6].
Materials 17 04480 g003
Figure 4. The influence of pH = (4.5; 6.0; 6.3; 7.2; and 8.0) of 0.1 mol L−1 PBS on 0.2 and 0.5 mol L−1 ACV signal (A) and peak potential (B). The influence of concentration of PBS pH = 7.2 on 0.2 and 0.5 mol L−1 ACV signal (C). DPV parameters: ΔEA = 10 mV, ν = 100 mV s−1, and tm = 10 ms. The standard deviation was calculated for n = 3.
Materials 17 04480 g004
Figure 5. (A) CVs obtained on the BDDE in the optimized electrolyte formulation; (B) relationship between the peak current (Ip) and the square root of the scanning rate (ν)–(ν: 15–400 mV s−1); (C) log Ip and log ν dependence; (D) Ep and log ν dependence. The standard deviation was calculated for n = 3.
Materials 17 04480 g005
Figure 6. ACV oxidation mechanism.
Materials 17 04480 g006
Figure 7. The dependence in the presence of 0.2 and 0.5 mol L−1 ACV in the optimized electrolyte formulation between (A) Ip and ΔEA; (B) Ip and ν; (C) Ip and tm. The standard deviation was calculated for n = 3.
Materials 17 04480 g007
Figure 8. (A) DPVs registered on the BDDE in 0.075 mol L−1 PBS pH = 7.2 in the presence of a rising ACV concentration: (a→r, 0.0001, 0.0002, 0.0005, 0.001, 0.002, 0.005, 0.01, 0.02, 0.05, 0.1, 0.2, 0.5, 1.0, 2.0, 5.0, 10.0, 20.0, and 50.0 μmol L−1). (B) The linear calibration curve. All measurements were performed under optimized DPV parameters. The standard deviation was calculated for n = 3.
Materials 17 04480 g008
Figure 9. DPVs recorded on the BDDE in the presence of the tested sample: (A) tablet extract; (B) purified municipal wastewater and the tested sample + the addition of the ACV standard.
Materials 17 04480 g009
Figure 10. UHPLC-MS (TOF) analysis of ACV: (A) EIC in the mass range of m/z: 226.092–226.094 for ACV standard at a concentration of 0.1 μmol L−1 (blue line) and the sewage sample (red line); (B) EIC in the mass range of m/z 226.092–226.094 for deionized water (blanc).
Materials 17 04480 g010
Table 1. ACV determination procedures.
Technique
(Sensor)
Linear Range
(µmol L−1)
LOD
(µmol L−1)
Matrix TypeRef.
Spectroscopic Methods
PLS—NIRS0.22–9.55plasma samples[10]
Spectrophotometry497.31–7193.29pharmaceutical samples[11]
Spectrophotometry8.88–35.521.13pharmaceutical samples[12]
Spectrofluorimetry1.13–11.100.09pharmaceutical samples[12]
FI–CL0.89–355.220.27pharmaceutical samples[13]
Chromatographic Methods
HPLC–UV0.018plasma samples[14]
UHPLC–HESI–MS/MS0.0044–8.880.0022plasma samples[15]
LC–ESI–MS0.022–0.220.0044aqueous humor[16]
Voltammetric Methods
LCAdSV (MWNTs-DHP film-coated GCE)0.08–10.00.03tablets[8]
DPAdSV (C60/GCE)0.09–6.00.0148pharmaceutical samples, human urine, and blood plasma[1]
LCAdSV (GCE/TFM)0.09–0.530.001synthetic sample that contains antiretroviral drugs or ATP and DNA[7]
SWV (FTO)4.0–40.01.25pharmaceutical samples[17]
DPAdSV (Cysteic acid (DES)/nano-NaOH/GCE)0.03–0.1
0.1–3.2
0.008tablets and biological fluids[6]
DPV (UTGE and GCE)(UTGE) 4–70
(GCE) 2–100
(UTGE) 1.0
(GCE) 0.35
spiked human urine[5]
DPV (PEBT/GCE)0.03–0.3
0.3–1.5
0.012human blood serum, pharmaceutical formulations[18]
LSAdSV (OPPY/CNT/GCE)0.03–10.00.01pharmaceutical and clinical preparations[2]
DPV (PGE)1.0–100.00.3pharmaceutical formulations[19]
SWAdSV (NC/GPE)0.05–1.00.0002pharmaceutical and biological samples[20]
SWV (GC/OPPy/Acy)0.5–10.00.2pharmaceutical samples[21]
LSAdSV (FeMoO4-GO/GCE)0.1–10.0
10.0–100
0.02drug samples[22]
DPV (β-CD/TiO2 NPs/CPE)0.09–2.98
2.98–47.61
0.021blood serum samples[23]
LSAdSV (rGO–TiO2–Au/GCE)1.0–1000.3tablet samples[24]
SWV (MBZ/TMHPP Cu(II)-modified GE)0.01–1000.00.01pharmaceutical formulations and urine samples[25]
SWAdSV (β-CD/EPPGE)0.05–0.6
1.0–9.0
0.00759tablets, human urine[26]
DPV (CdO/Fe3O4/CPE)1.0–100.00.3tablets, blood serum, and urine samples[27]
DPAASV (Ag NPs/CdS NWs/RG/GCE)0.01–4.0
4.0–40.0
0.0033blood serum, tablet, and topical cream samples[28]
DPAASV (CS-MWCNTs+TiO2 NPs/PCC/nanoporous GCE)0.03–1.00.01human fluid and tablet samples[29]
DPV (P-OAP/MWCNTs-ZnO NPs-CPE)0.399–35.360.3pharmaceutical formulations[30]
SWAdSV (EPPEG)0.5–3.00.0607pharmaceutical formulations and human plasma[31]
LSV (AuNPs/CNTs-COOH/GSE)0.192–52.0
52.0–200.0
0.057pharmaceutical preparations[32]
SWV (ND@Dy2O3-IL/CPE)0.097–116.60.029human serum sample[33]
DPV (p-ABSA-GCE)0.2–9.00.0557tablets[34]
SWV (SWNT/Naf/GCE)0.01–30.00.0018human urine sample[35]
CV (polyGly-GOred-GCE)5.0–5000.0pharmaceutical preparations[36]
DPV (rGO/Pd@PACP/PGE)0.1–0.50.0513[37]
SWV (CGMDE)0.2–2.00.07[38]
DPAdSV (RuNPs/TBA/PGE)0.003–0.030
0.030–3.0
0.0008tablet and urine samples[39]
DPV (GC/CNT/ILC/RGO/MnO2)0.01–30.00.000843human serum[40]
SWV (γ-Fe2O3-Bent/CPE)0.5–8.00.00155pharmaceutical and urine samples[43]
DPAdSV (aSPCE)0.0005–0.05
0.005–1.0
0.00012tablets[44]
DPV (BDDE)0.0001–0.001
0.001–0.01
0.01–50.0
0.0000299municipal water samples and tabletsThis work
Techniques: PLS–NIRS—partial least squares regression model coupled with near-infrared spectroscopy; FI–CL—flow-injection analysis–chemiluminescence detection; HPLC–UV—high-performance liquid chromatography–ultraviolet detection; UHPLC-HESI–MS/M—ultra-high-performance liquid chromatography–heated electrospray ionization–tandem mass spectrometry; LC–ESI–MS—liquid chromatography–electrospray ionization–mass spectrometry; LCAdSV—linear cyclic adsorptive stripping voltammetry; DPAdSV—differential-pulse adsorptive stripping voltammetry; SWV—square-wave voltammetry; DPV—differential-pulse voltammetry; SWAdS—square-wave adsorptive stripping voltammetry, LSAdSV—linear sweep adsorptive stripping voltammetry; DPAASV—differential-pulse adsorptive anodic stripping voltammetry; LSV—linear sweep voltammetry; CV—cyclic voltammetry. Electrodes: MWNTs-DHP film-coated GCE—multi-wall carbon nanotubes (MWNTs)-dihexadecyl hydrogen phosphate (DHP) film-coated glassy carbon electrode (GCE); C60/GCE—fullerene- C60-modified glassy carbon electrode; GCE/TFM—glassy carbon electrode modified with thin mercury film; FTO—fluoride doped oxide electrodes; cysteic acid (DES)/nano-NaOH/GCE)—glassy carbon electrode modified with nanorods of NaOH decorated with polymeric film in the presence of deep eutectic solvent; UTGE—ultra-trace graphite electrode; GCE—glassy carbon electrode; PEBT/GCE—glassy carbon electrode modified with coated with polymerized eriochrome black T; OPPY/CNT/GCE—glassy carbon electrode modified with a bilayer of multi-walled carbon nanotube/tiron-doped polypyrrole; PGE—pencil graphite electrode; NC/GPE—nanoclay modified graphite paste electrode; GC/OPPy/Acy—glassy carbon electrode coated with molecularly imprinted, overoxidized polypyrrole (OPPy) dotted with acyclovir; FeMoO4-GO/GCE—ferrous molybdate nanorods and graphene oxide composited glassy carbon electrode; β-CD/TiO2 NPs/CPE—carbon paste electrode modified with titanium (IV) oxide nanoparticles and coated with β-Cyclodextrin; rGO–TiO2–Au/GCE—reduced graphene oxide–TiO2–Au nanocomposite-modified glassy carbon electrode; MBZ/TMHPP Cu (II)-modified GE—gold electrode modified with 2-mercaptobenzothiazole–[5,10,15,20-tetrakis-(3-methoxy-4-hydroxyphenyl)porphyrinato]copper(II); β-CD/EPPGE—electropretrated pencil graphite electrode modified with polymerized β-Cyclodextrin; CdO/Fe3O4/CPE—carbon paste electrode modified with magnetic cadmium oxide CdO/Fe3O4; Ag NPs/CdS NWs/RG/GCE—glassy carbon electrode modified with silver nanoparticles/cadmium sulfide nanowires/reduced graphene oxide nanocomposite; CS-MWCNTs+TiO2 NPs/PCC/nanoporous GCE—nanoporous glassy carbon electrode modified with polymeric film decorated multi-walled carbon nanotubes and TiO2 nanoparticles; P-OAP/MWCN—Ts-ZnO NPs-CPE—poly (o-aminophenol)/multi-walled carbon nanotubes-ZnO nanoparticles-carbon paste electrode; EPPEG—electropretreated pencil graphite electrode; AuNPs/CNTs-COOH/GSE—graphite sheet electrode modified with carboxylatedcarbon nanotubes and Au nanoparticles; ND@Dy2O3-IL/CPE—nanodiamond decorated dysprosium oxide and ionic liquid (IL) modified carbon paste electrode; p-ABSA-GCE—glassy carbon electrode modified with p-aminobenzene sulfonic acid; SWNT/Naf/GCE—glassy carbon electrode modified with single-walled carbon nanotubes and nafion composite film; polyGly-GOred–GCE—glassy carbon electrode modified with reduced graphene oxide–polyglycine film composite; rGO/Pd@PACP/PGE—pencil graphite electrode modified with reduced graphene oxide/palladium nanoparticles/poly(2-amino-4-chlorophenol) (rGO/Pd@PACP) nanocomposite; CGMDE—controlled growth mercury drop electrode; RuNPs/TBA/PGE—pencil graphite electrode modified by ruthenium nanoparticles and thiobarbituric acid; GC/CNT/ILC/RGO/MnO2—glassy carbon electrode modified with layers of multi-walled carbon nanotubes (CNTs), an ionic liquid crystal (ILC), graphene (RGO) and MnO2; γ-Fe2O3-Bent/CPE—carbon paste electrode modified with nano γ-Fe2O3 composite and bentonite clay; aSPCE—electrochemically activated screen-printed carbon electrode; BDDE—boron-doped diamond electrode.
Table 2. DPV parameters under optimized conditions.
ParameterValue
Electrochemical cleaning step1.4 V (5 s)
Analytical signal recording rangefrom 0.1 V to 1.4 V
Scan rate (ν)175 mV s−1
Amplitude (ΔEA)125 mV
Modulation time (tm)10 ms
Equilibrium time5 s
Table 3. Effect of the electrochemical purification step on the ACV signal.
Electrochemical Cleaning StepRSD (%)
-10.2
1.2 V (10 s)13.1
1.4 V (10 s)6.64
1.4 V (5 s)3.99
Table 4. Results of ACV determination in real samples.
ParameterMeasurement Method
DPV
LOD: 0.0299 nmol L−1
LOQ: 0.0995 nmol L−1
UHPLC-DAD
LOD: 32 nmol L−1
UHPLC-MS (TOF)
LOD: 1.1 nmol L−1
Tablet (Declared Value = 200 mg)
Found ± SD
(n = 3)
188.93 ± 9.45 mg192.51 ± 5.2 mg191.92 ± 5.7 mg
Recovery ± Coefficient of variation94.47 ± 5.00%96.26 ± 2.58%95.96 ± 2.97%
ParameterPurified municipal wastewater
Found ± SD
(n = 3)
1.34 ± 0.0659 nmol L−1>LOD
>LOQ
Detected
>LOQ
Recovery * ± Coefficient of variation92.27 ± 2.59%93.42 ± 8.10%95.21 ± 8.61%
Recovery [%] = (found × 100)/declared value; Coefficient of variation [%] = (SD × 100)/found; * ACV = 100 ng L−1 standard addition.
Disclaimer/Publisher’s Note: The statements, opinions and data contained in all publications are solely those of the individual author(s) and contributor(s) and not of MDPI and/or the editor(s). MDPI and/or the editor(s) disclaim responsibility for any injury to people or property resulting from any ideas, methods, instructions or products referred to in the content.