
Research on Vault Settlement during Three-Step Tunnel Construction Process Based on Sandstone Rheological Experiment

Abstract
:1. Introduction
2. Test Equipment and Specimen Preparation
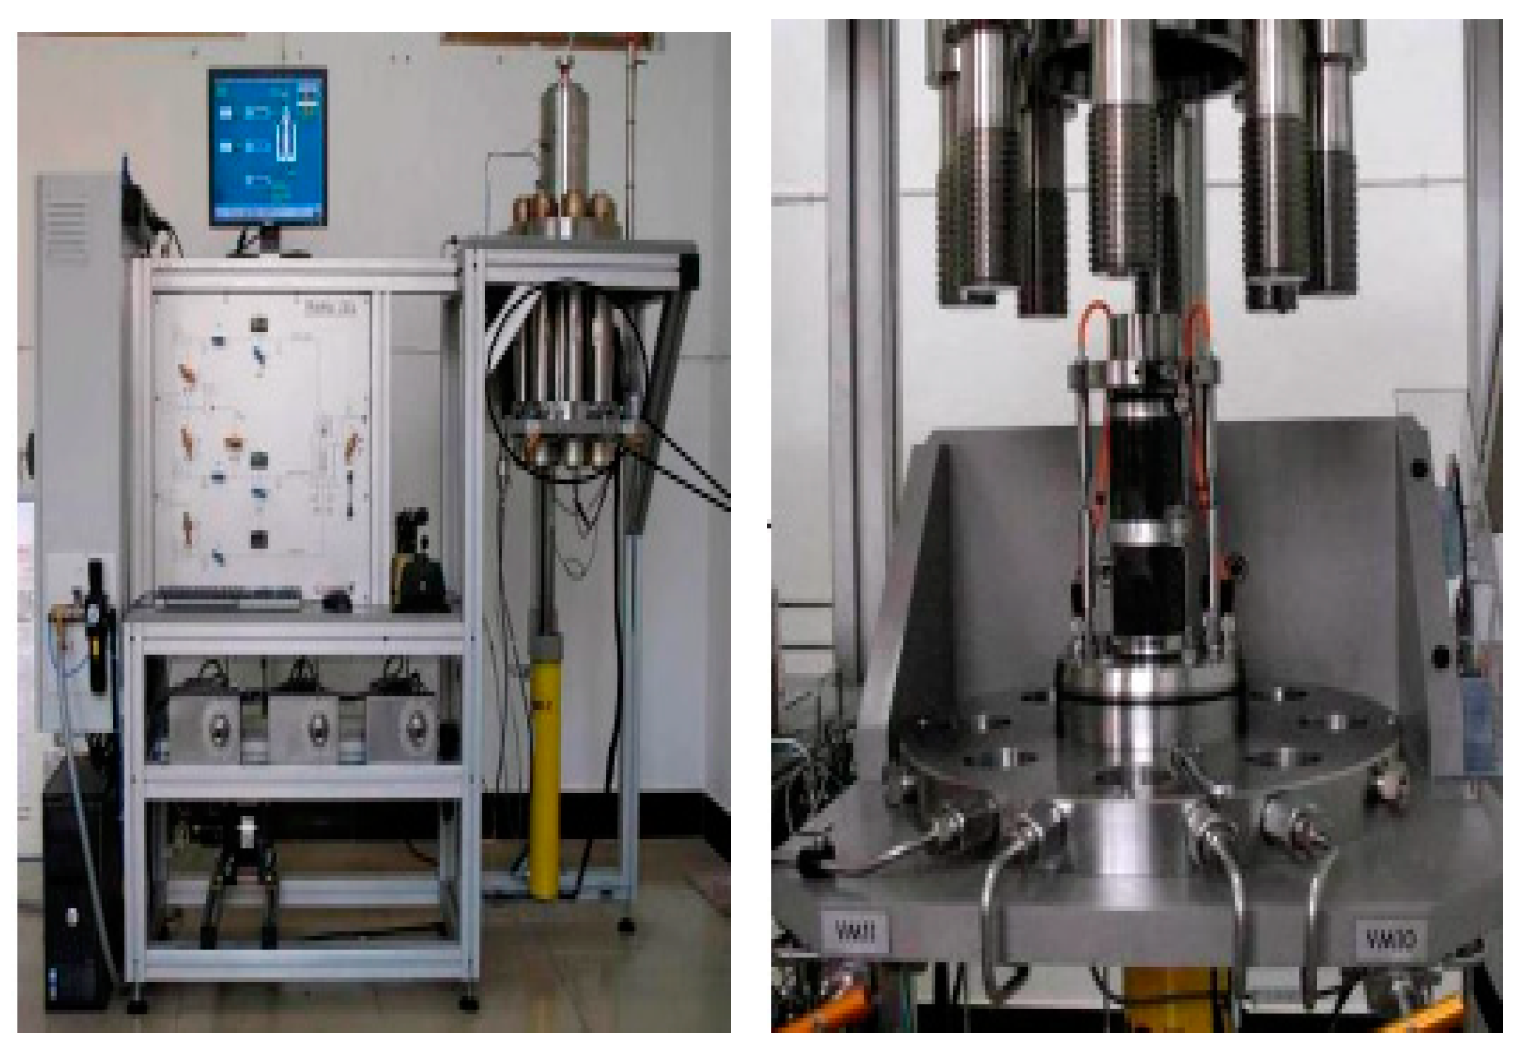
2.1. Test Equipment
2.2. Specimen Preparation
3. Rheological Test of Silty Sandstone
3.1. Test Schemes
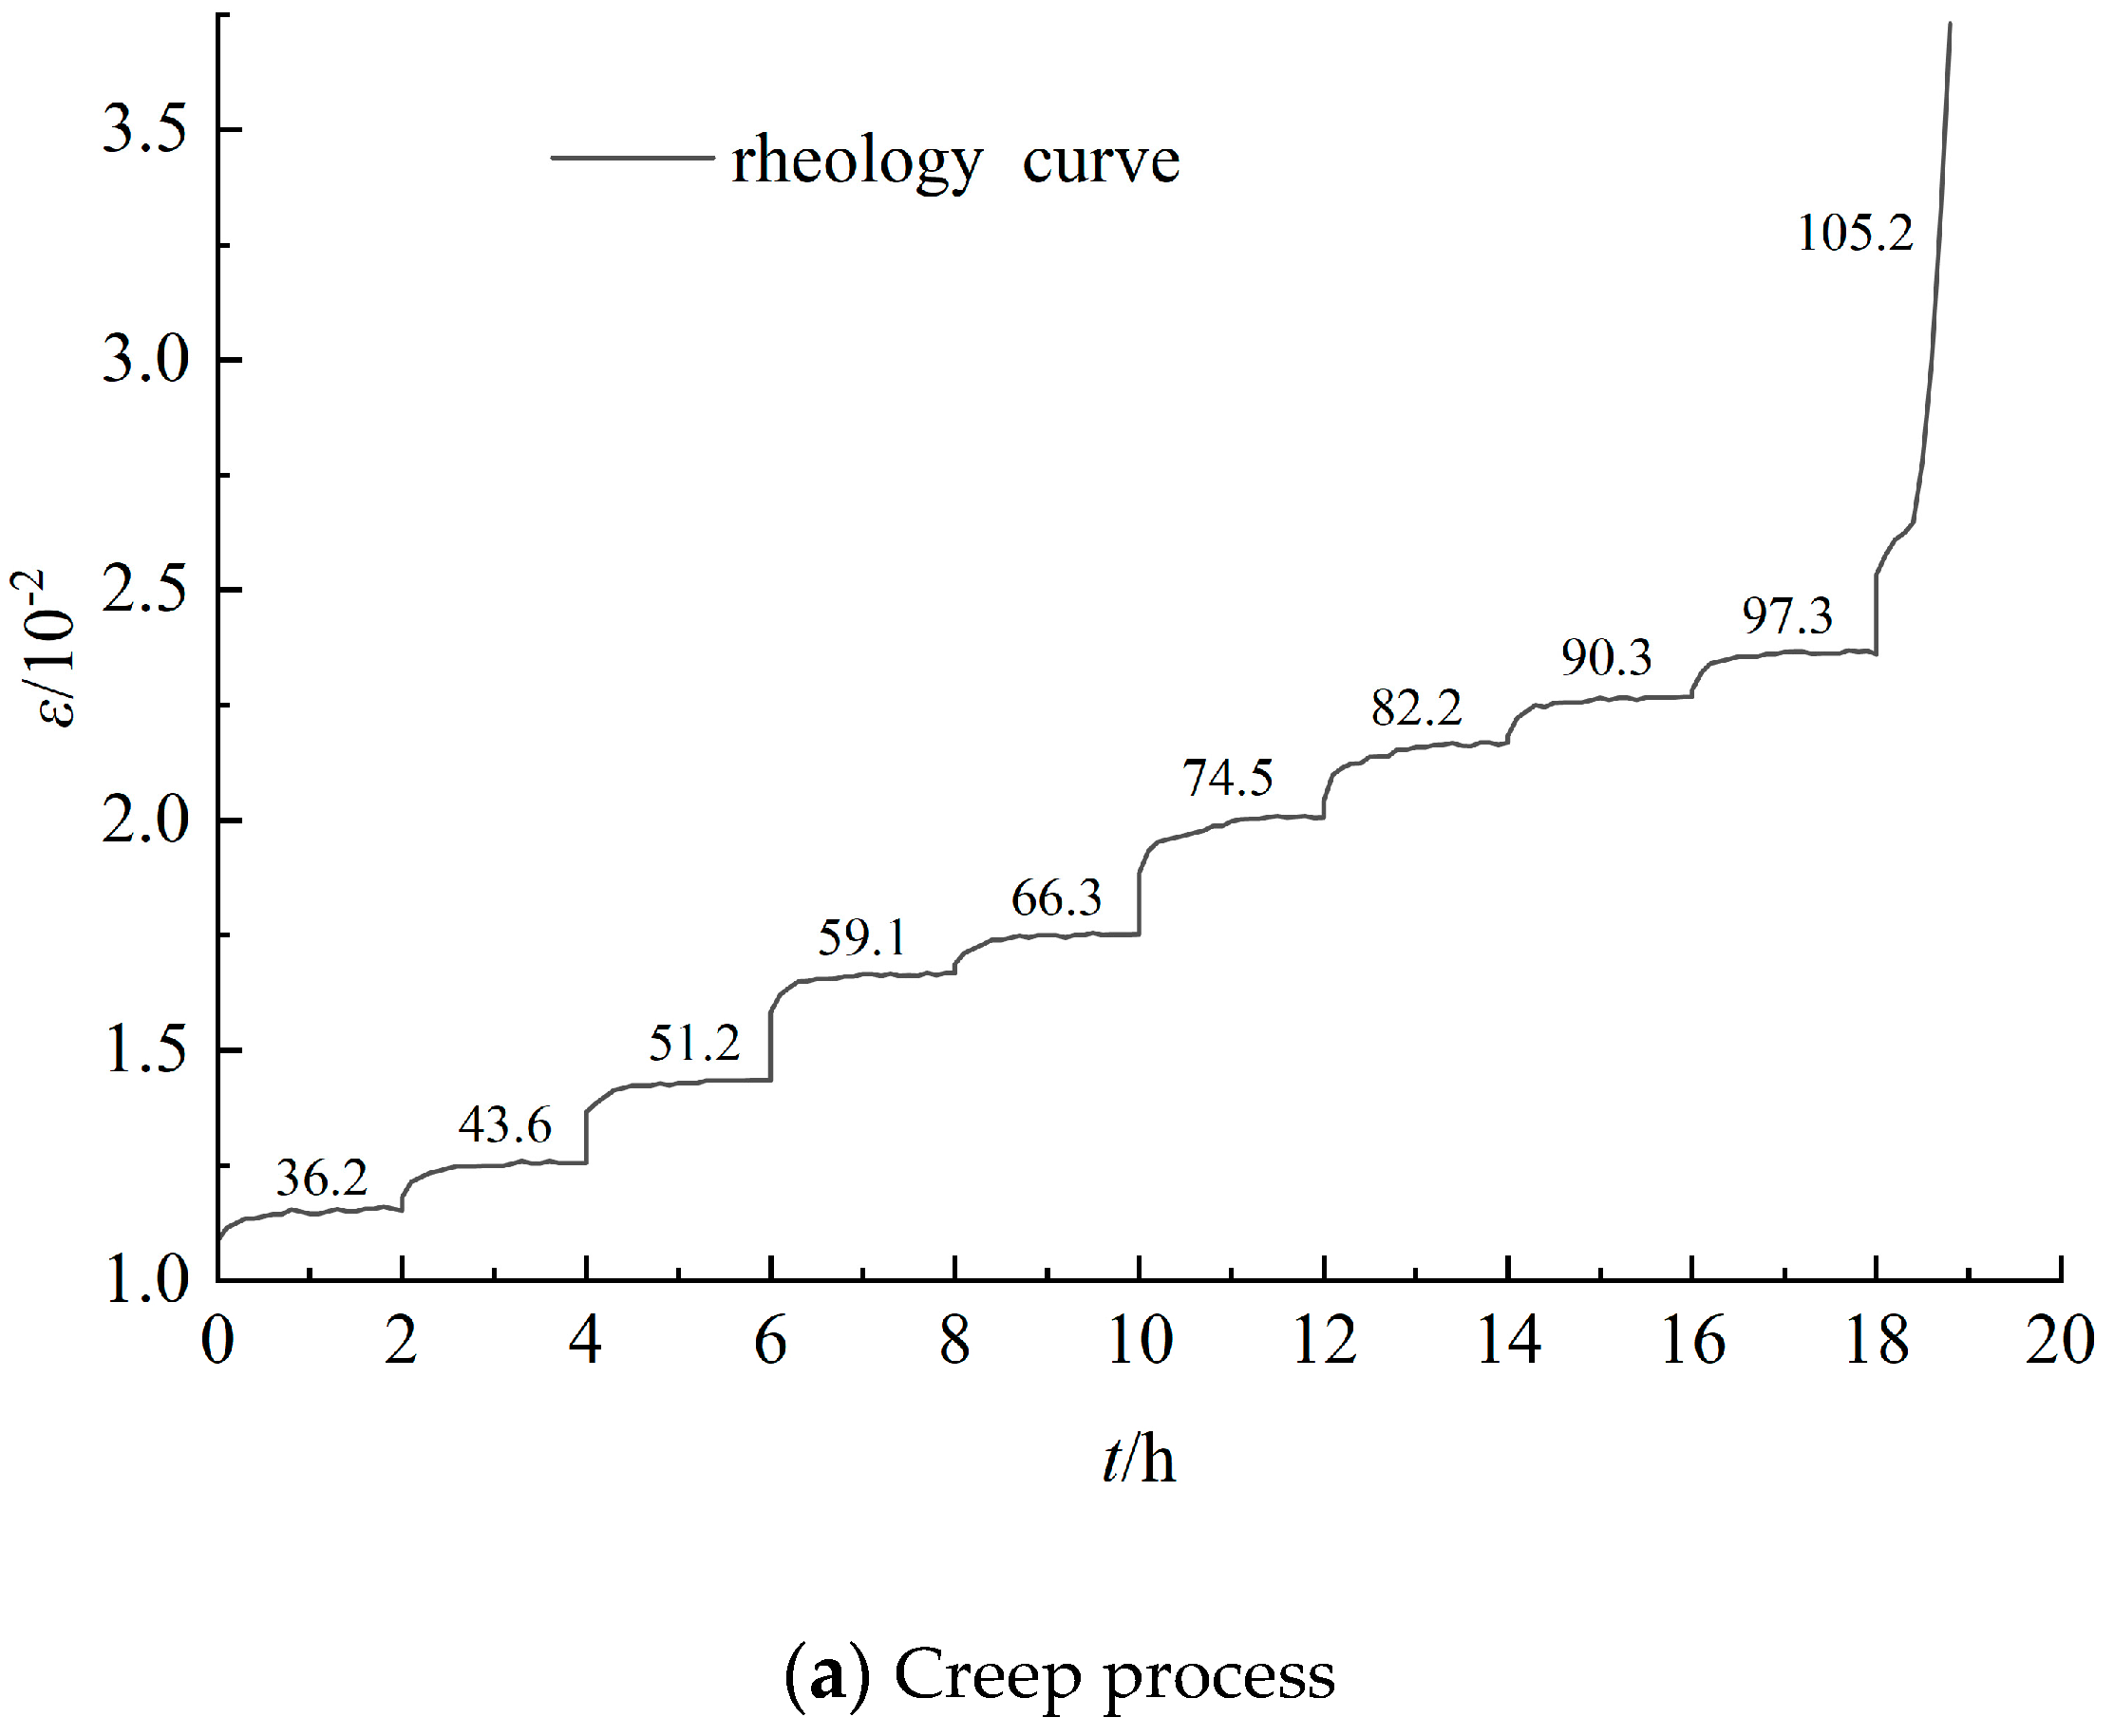
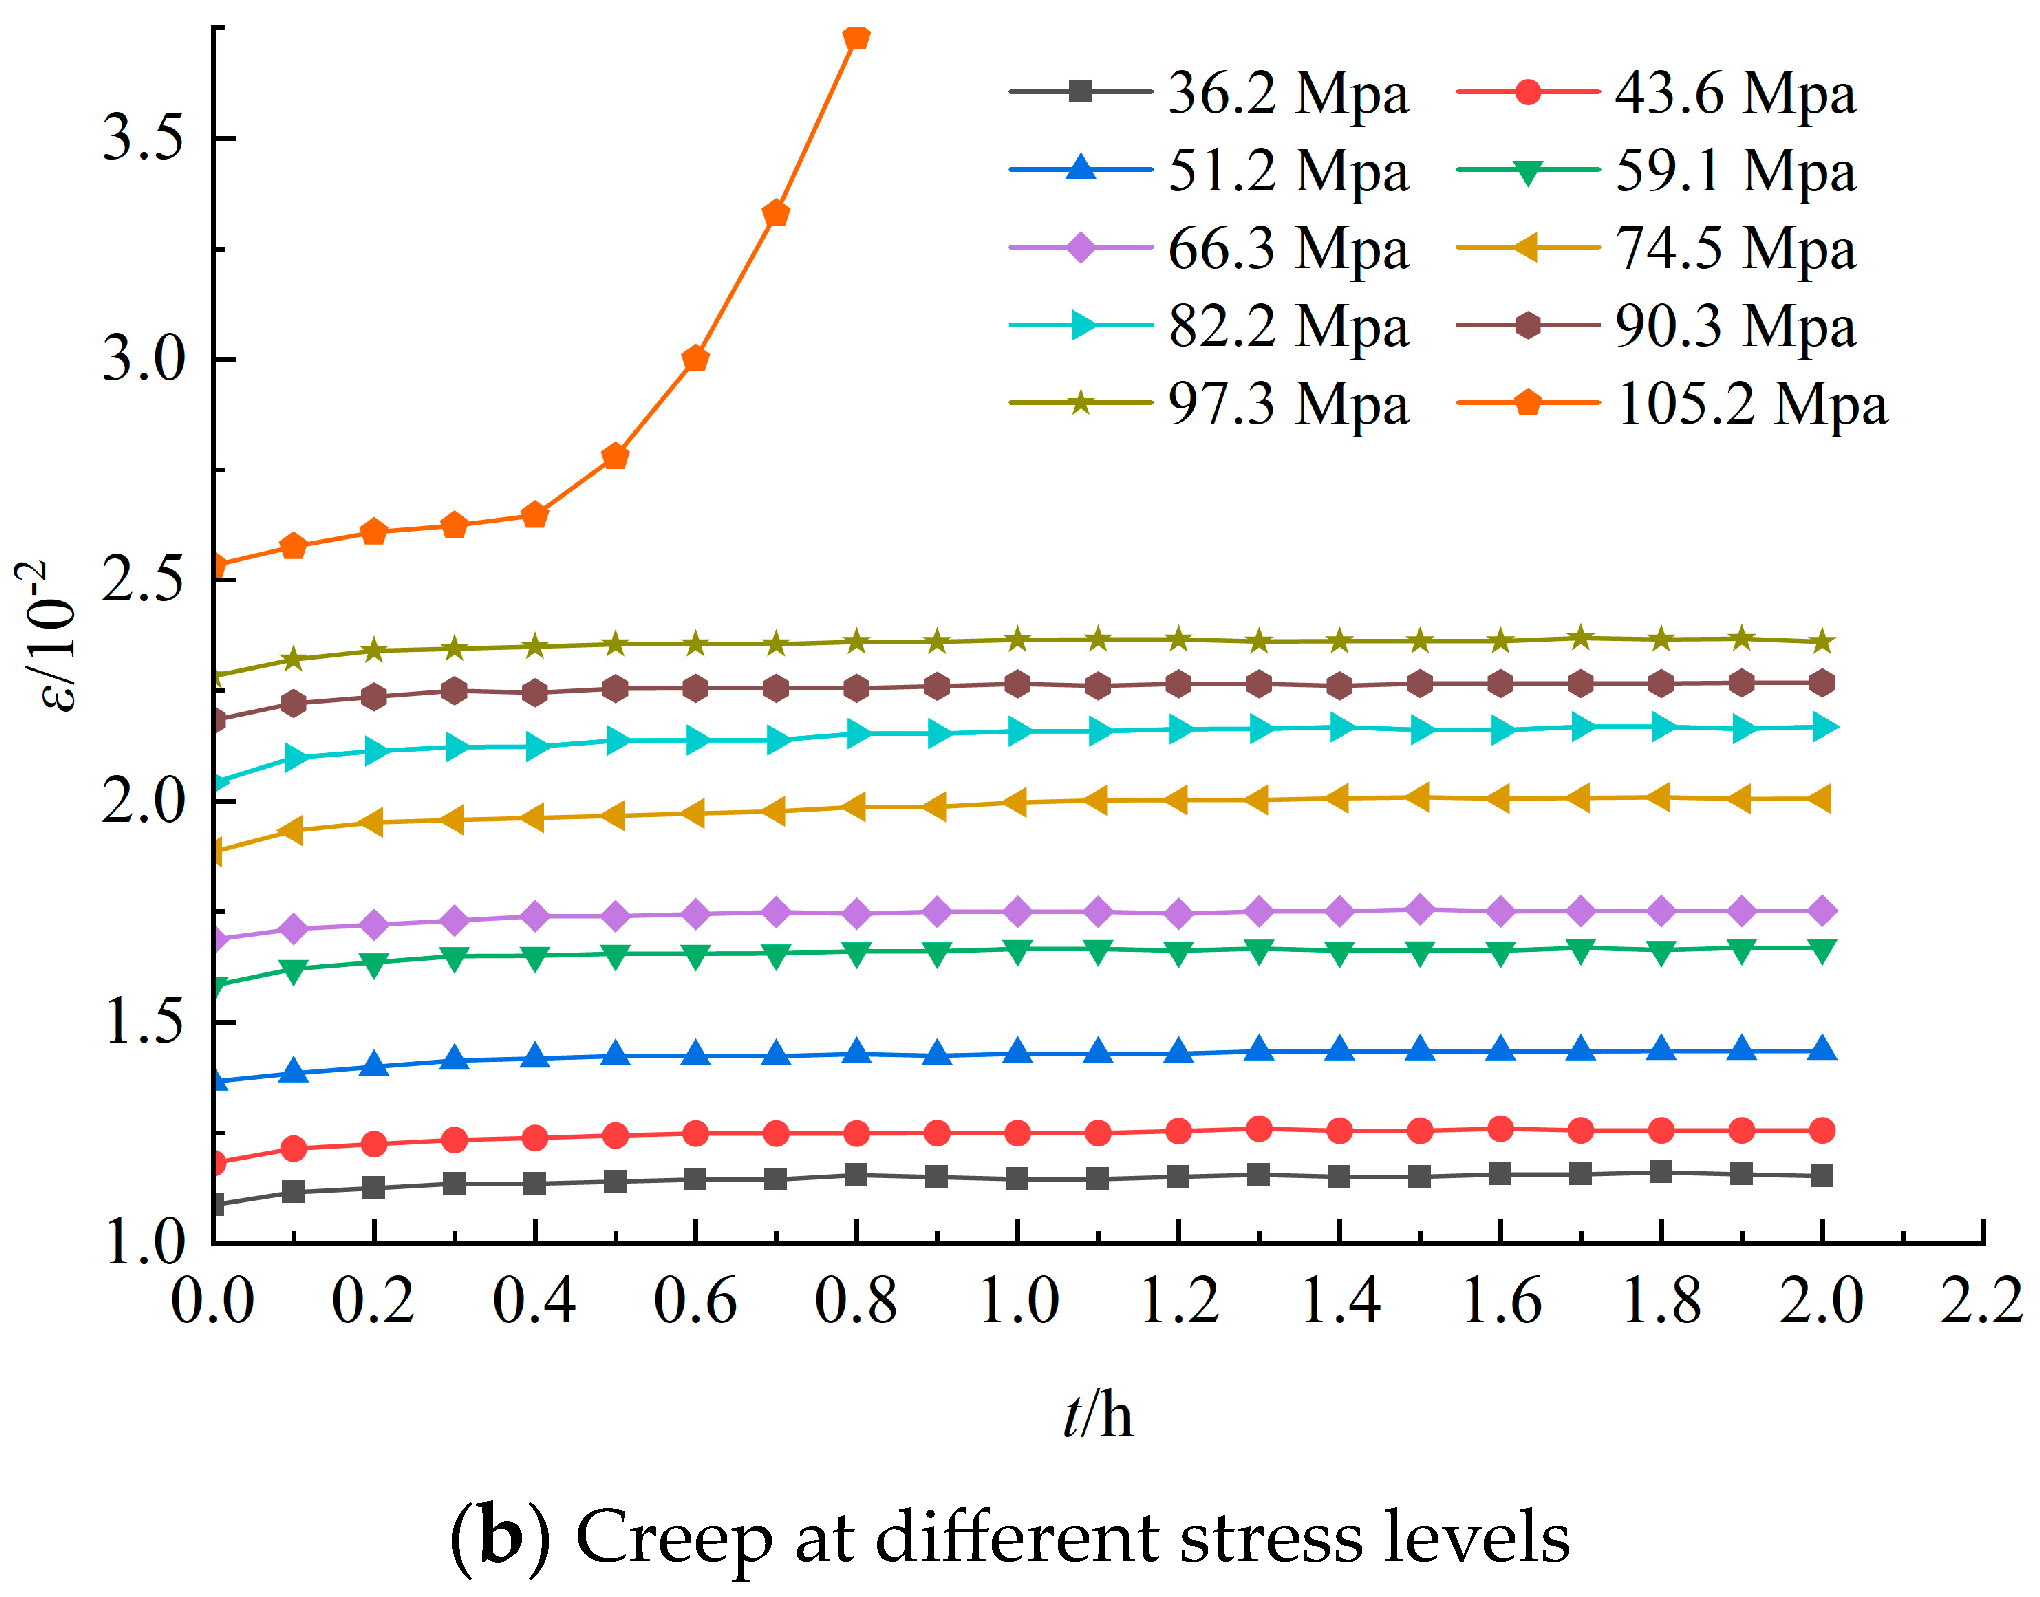
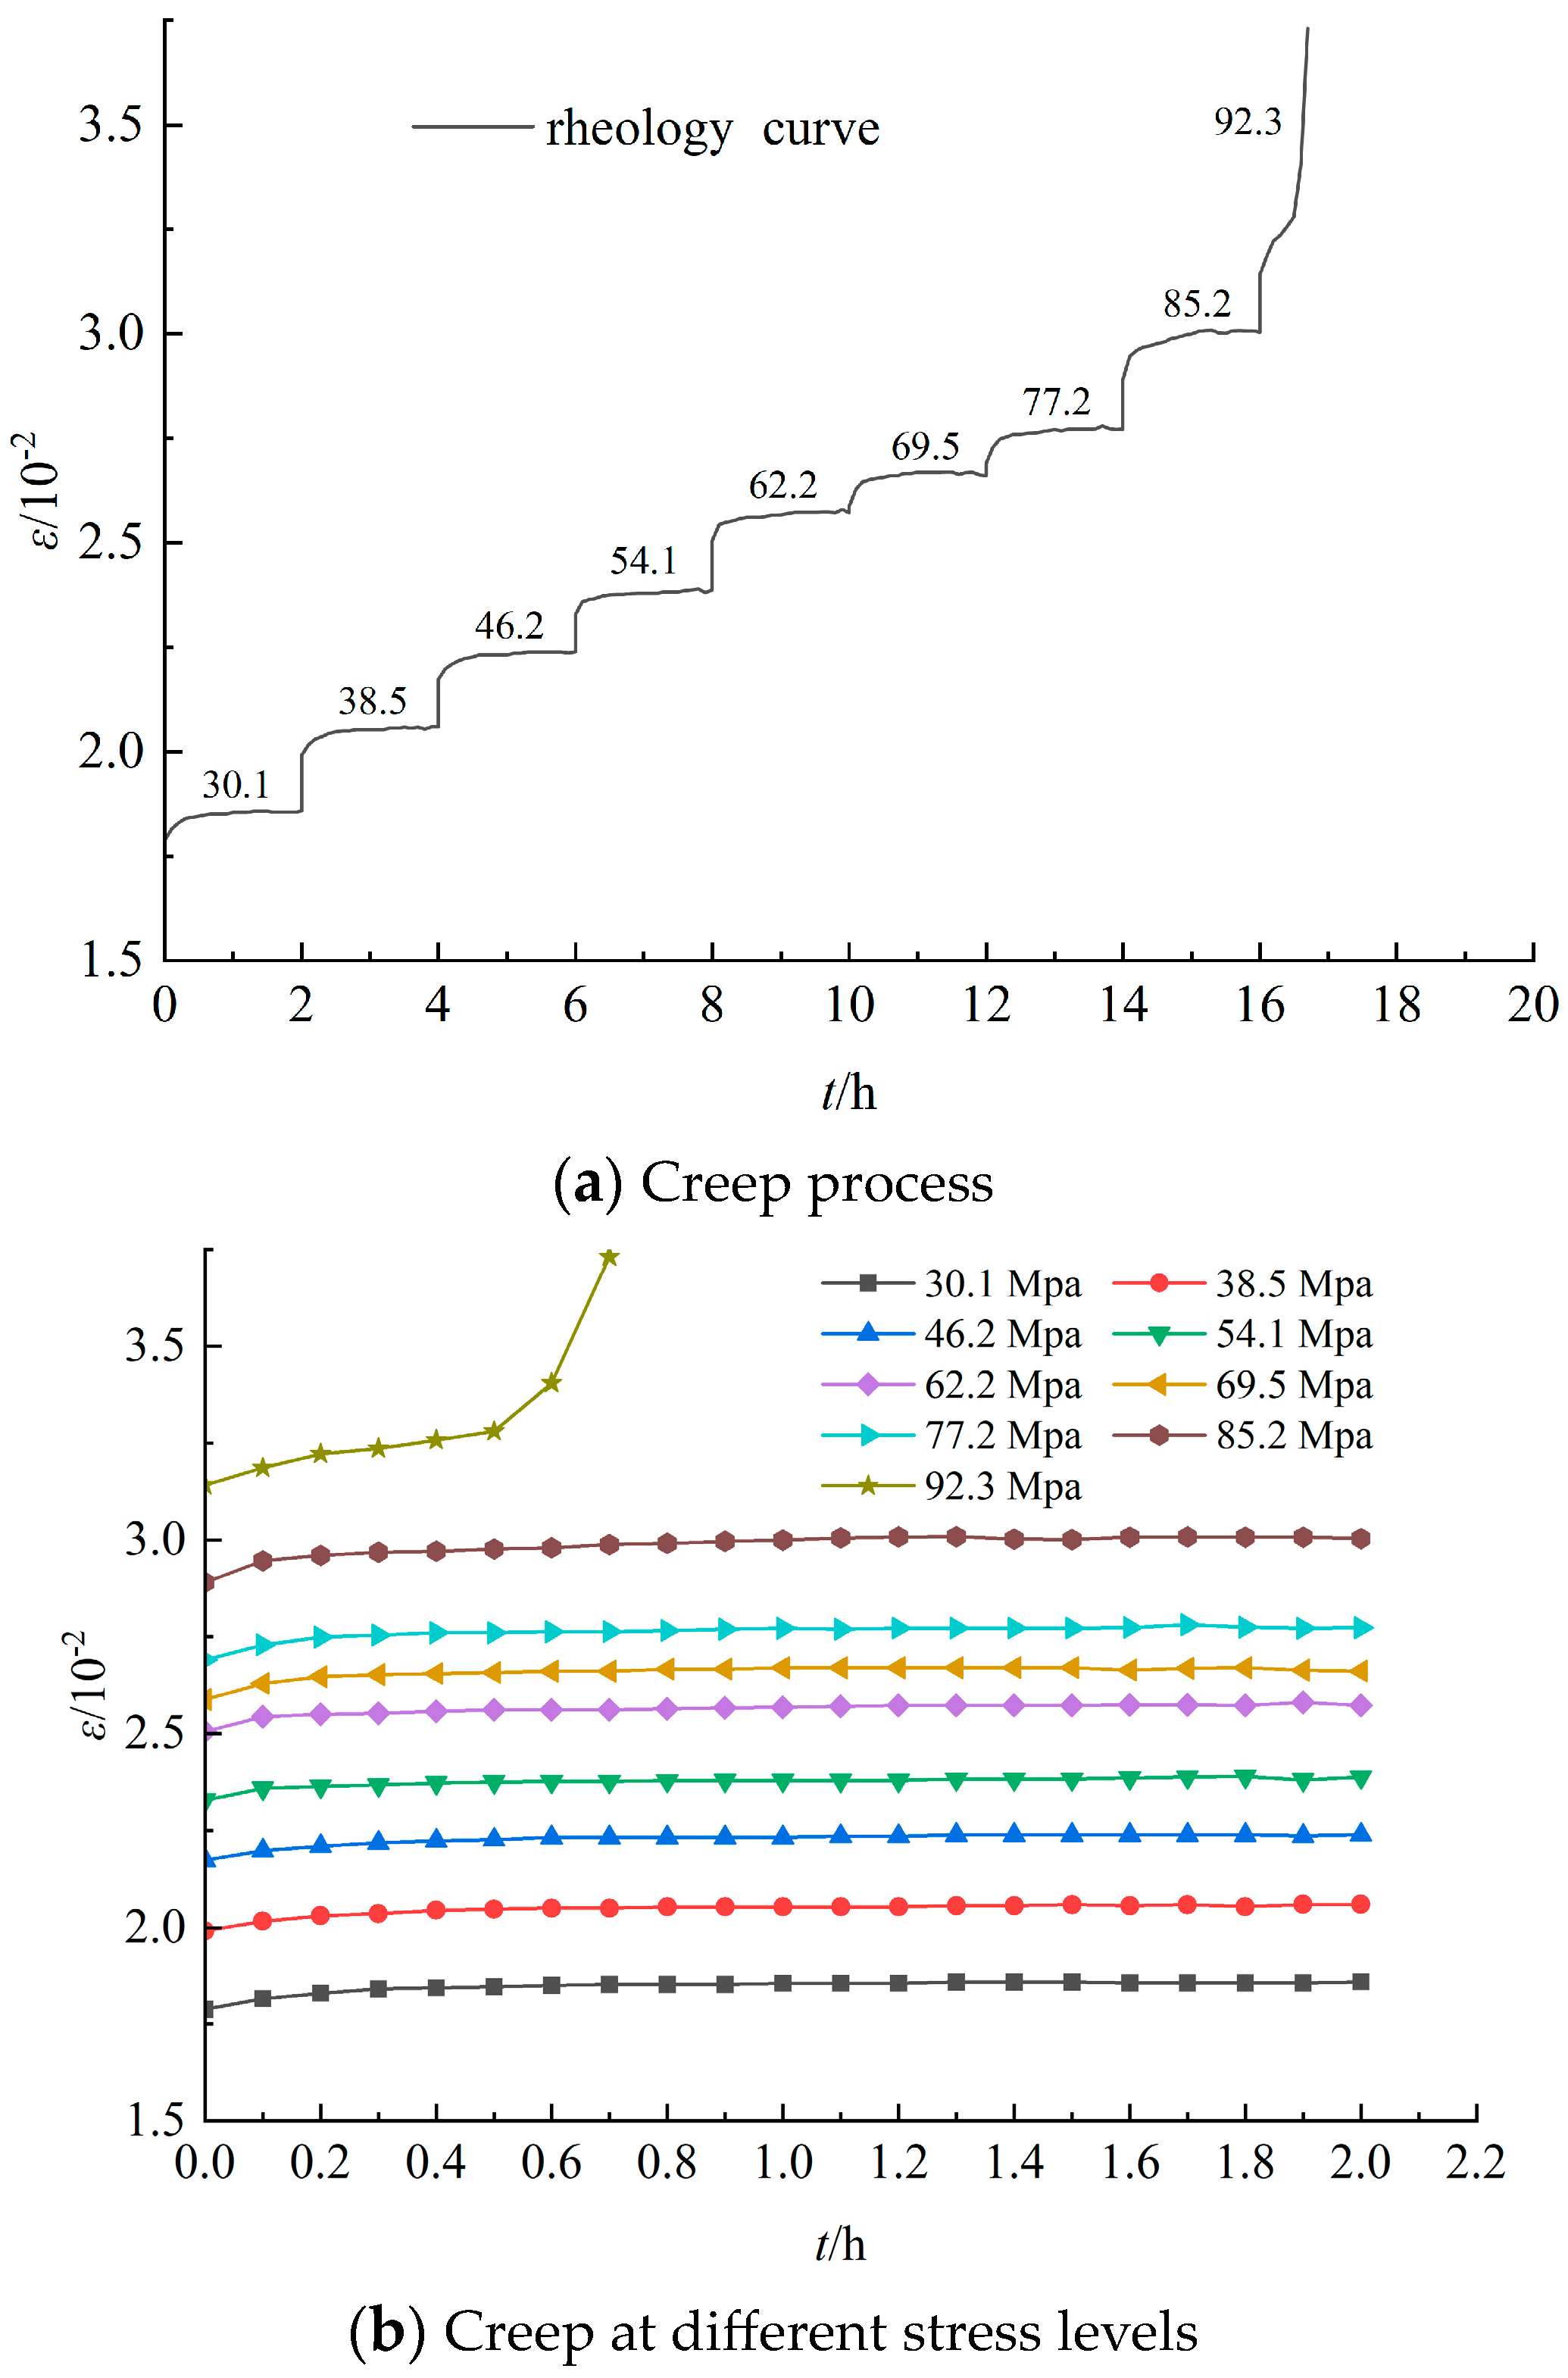
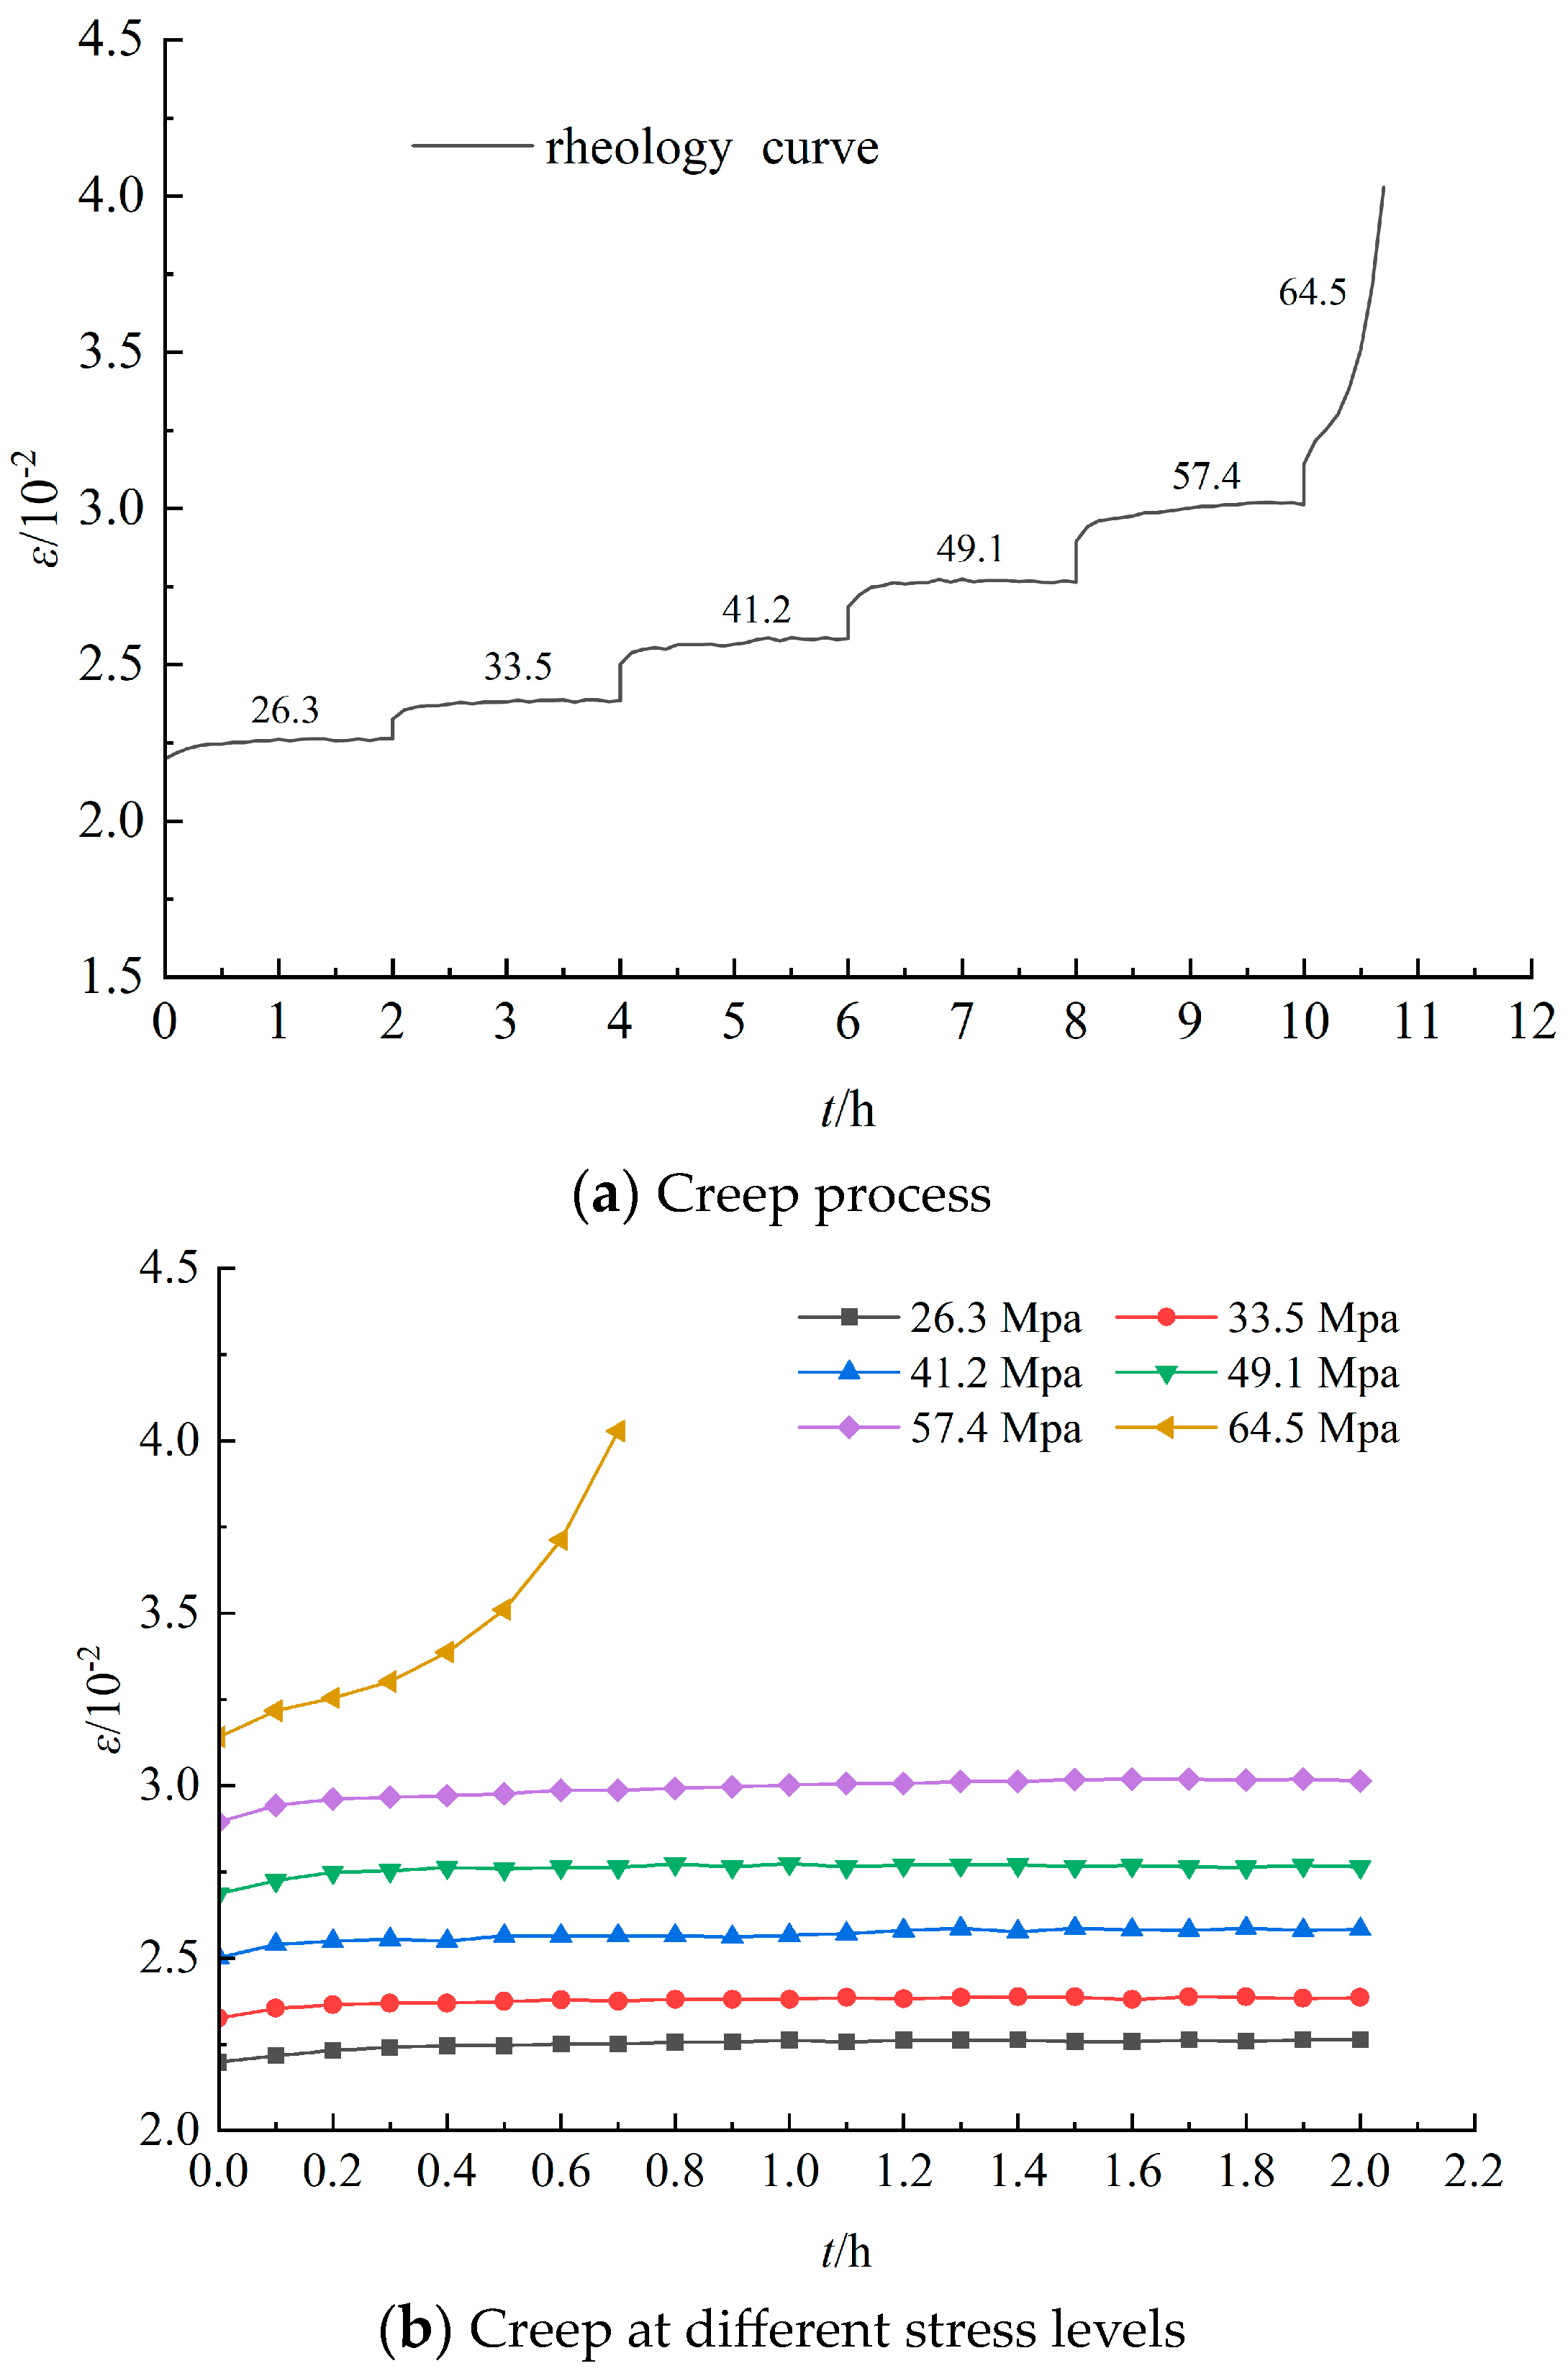
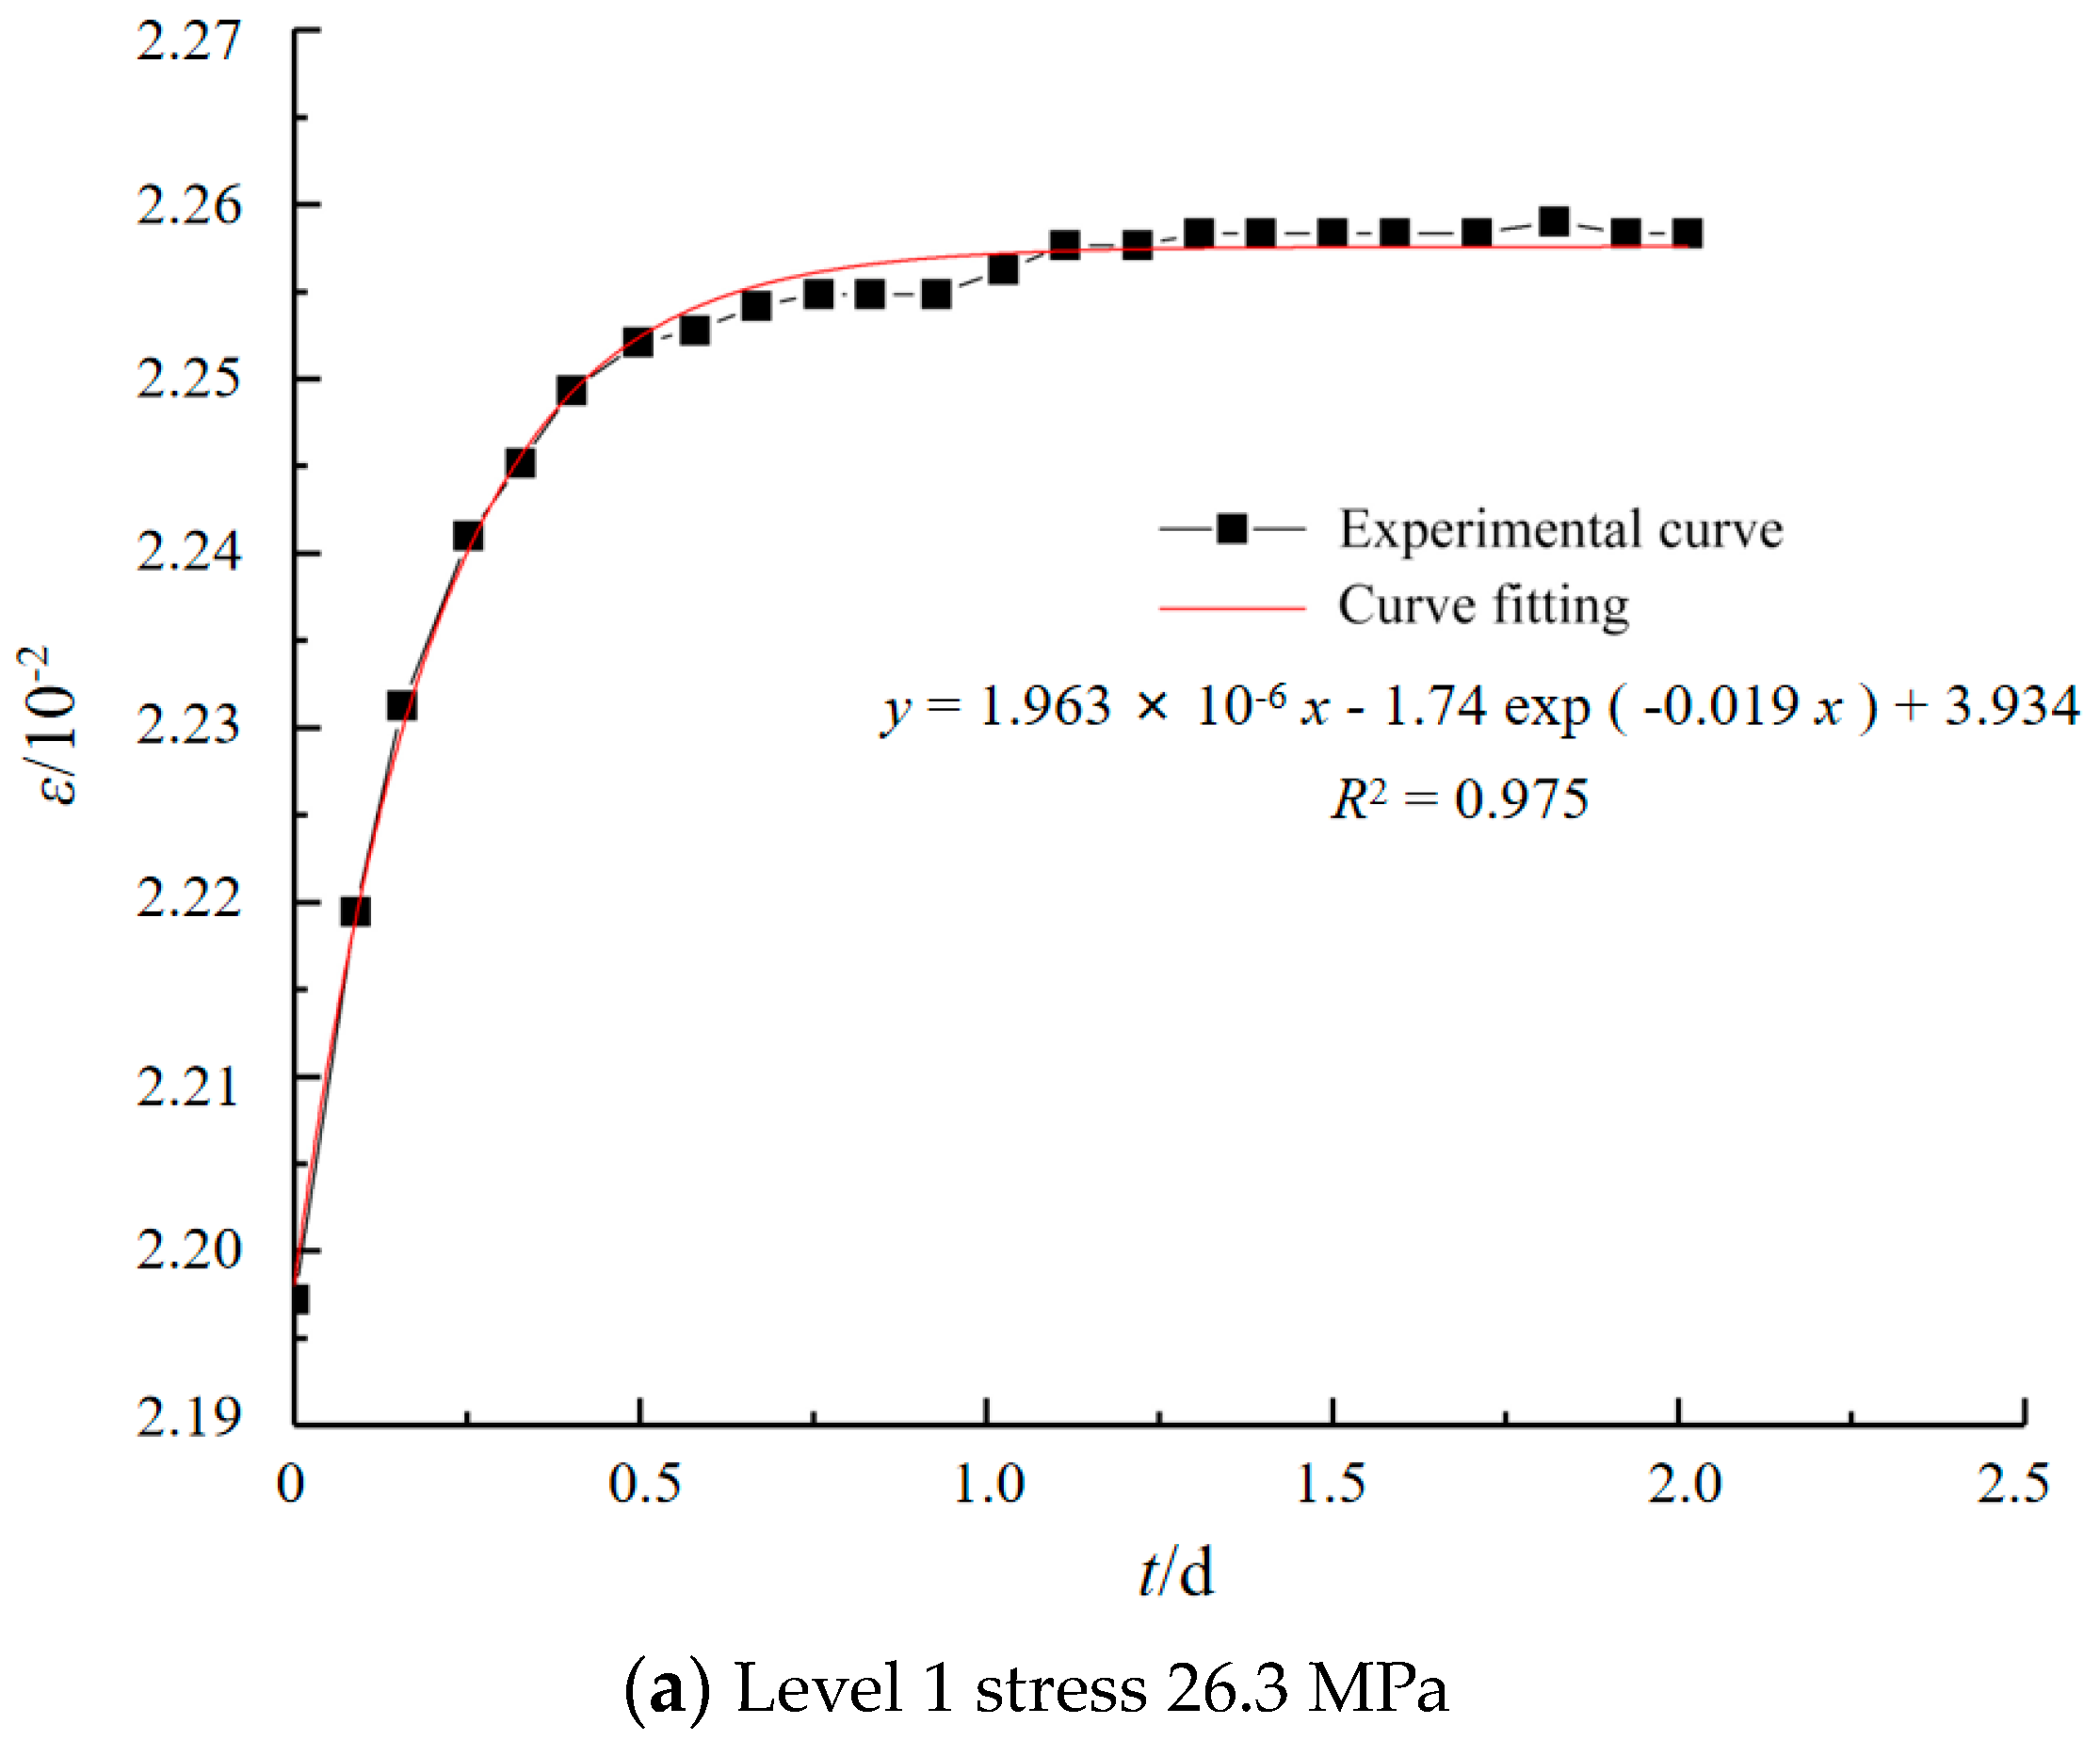
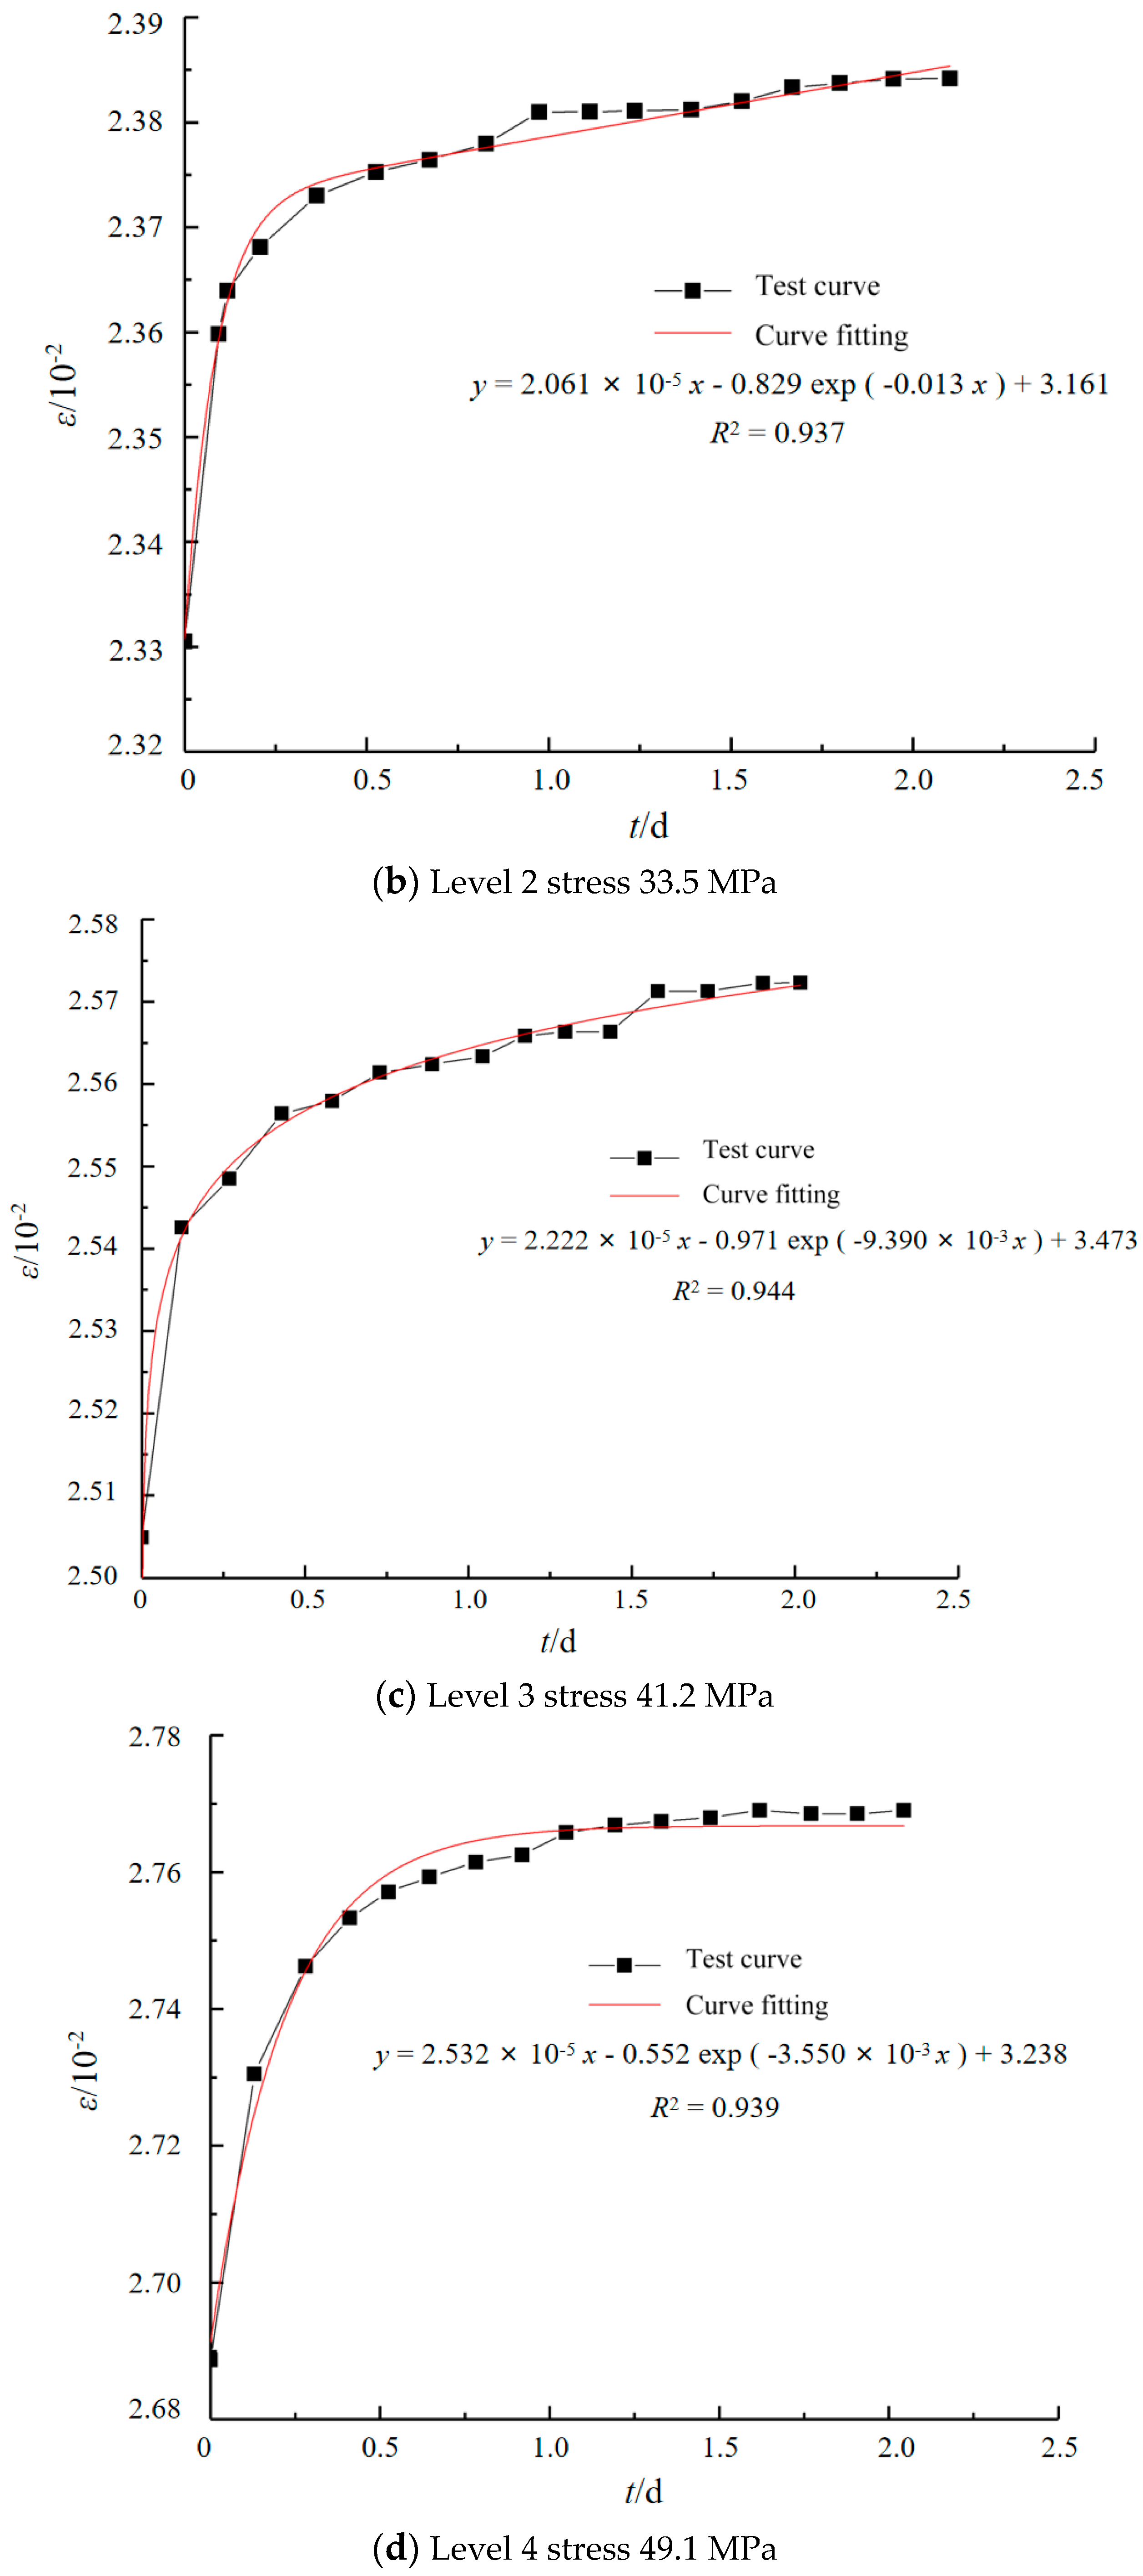
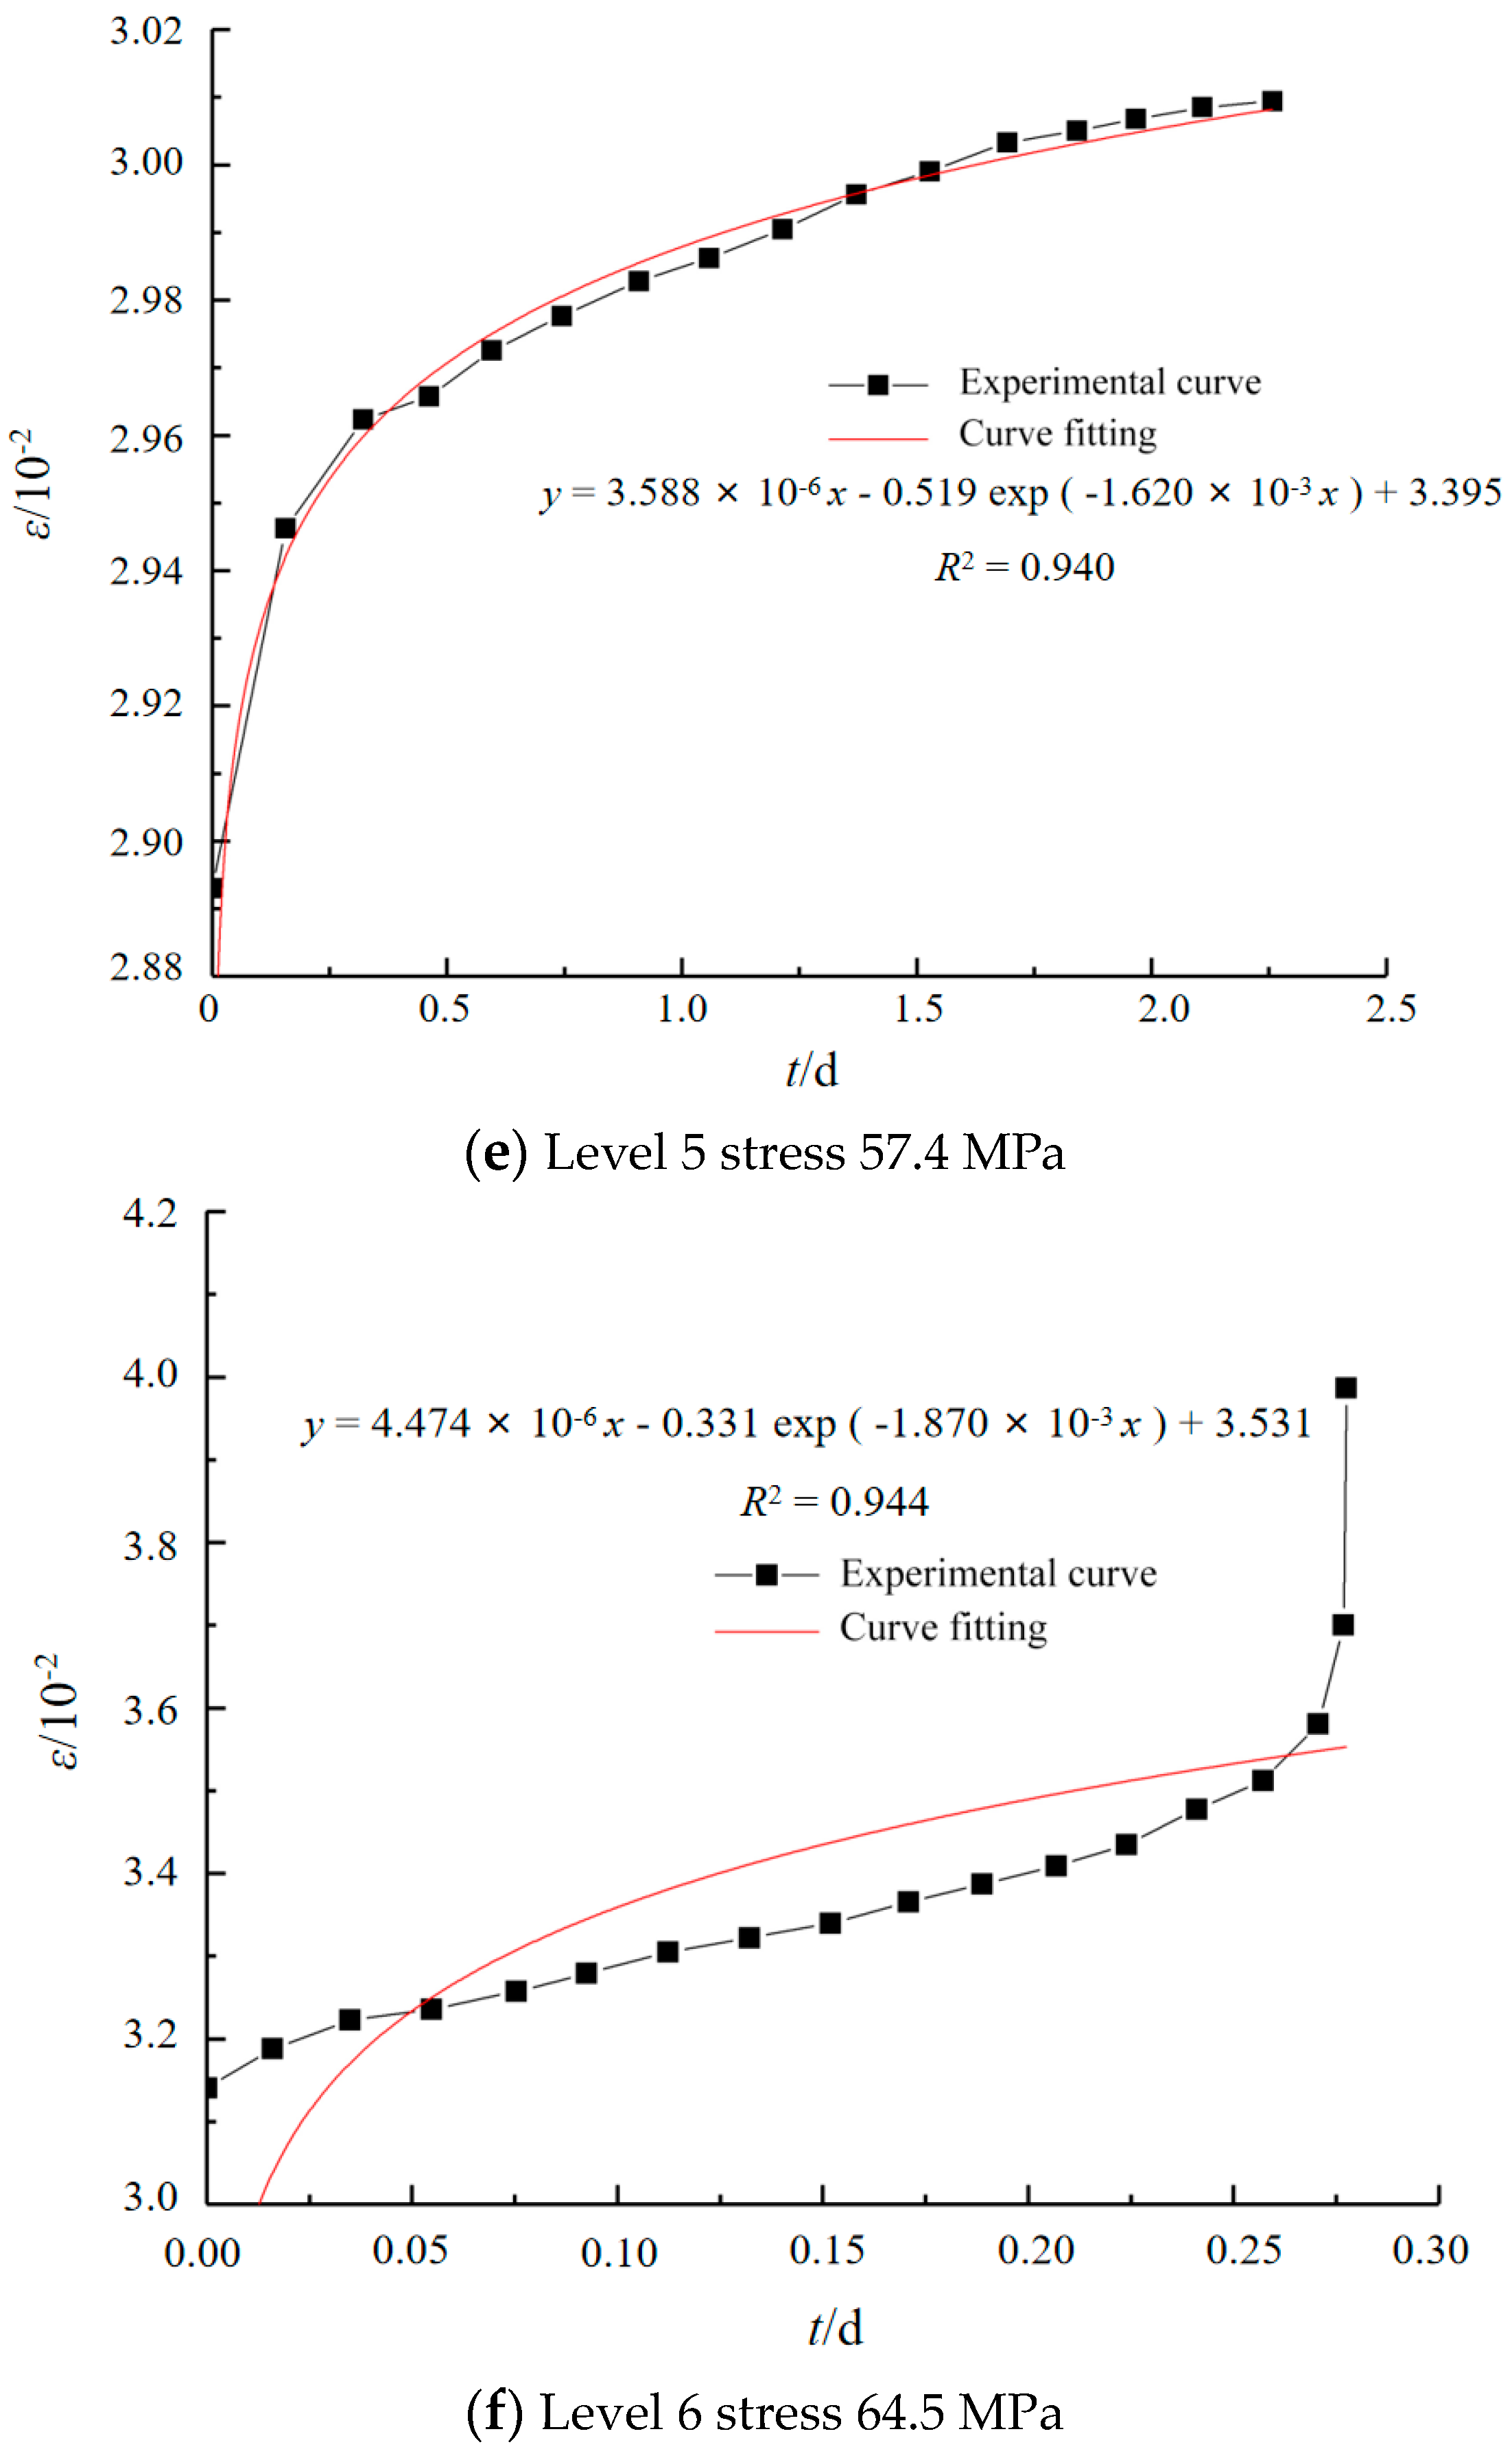
3.2. Test Results
3.3. Cvisc Model for Rheological Testing of Silty Sandstone
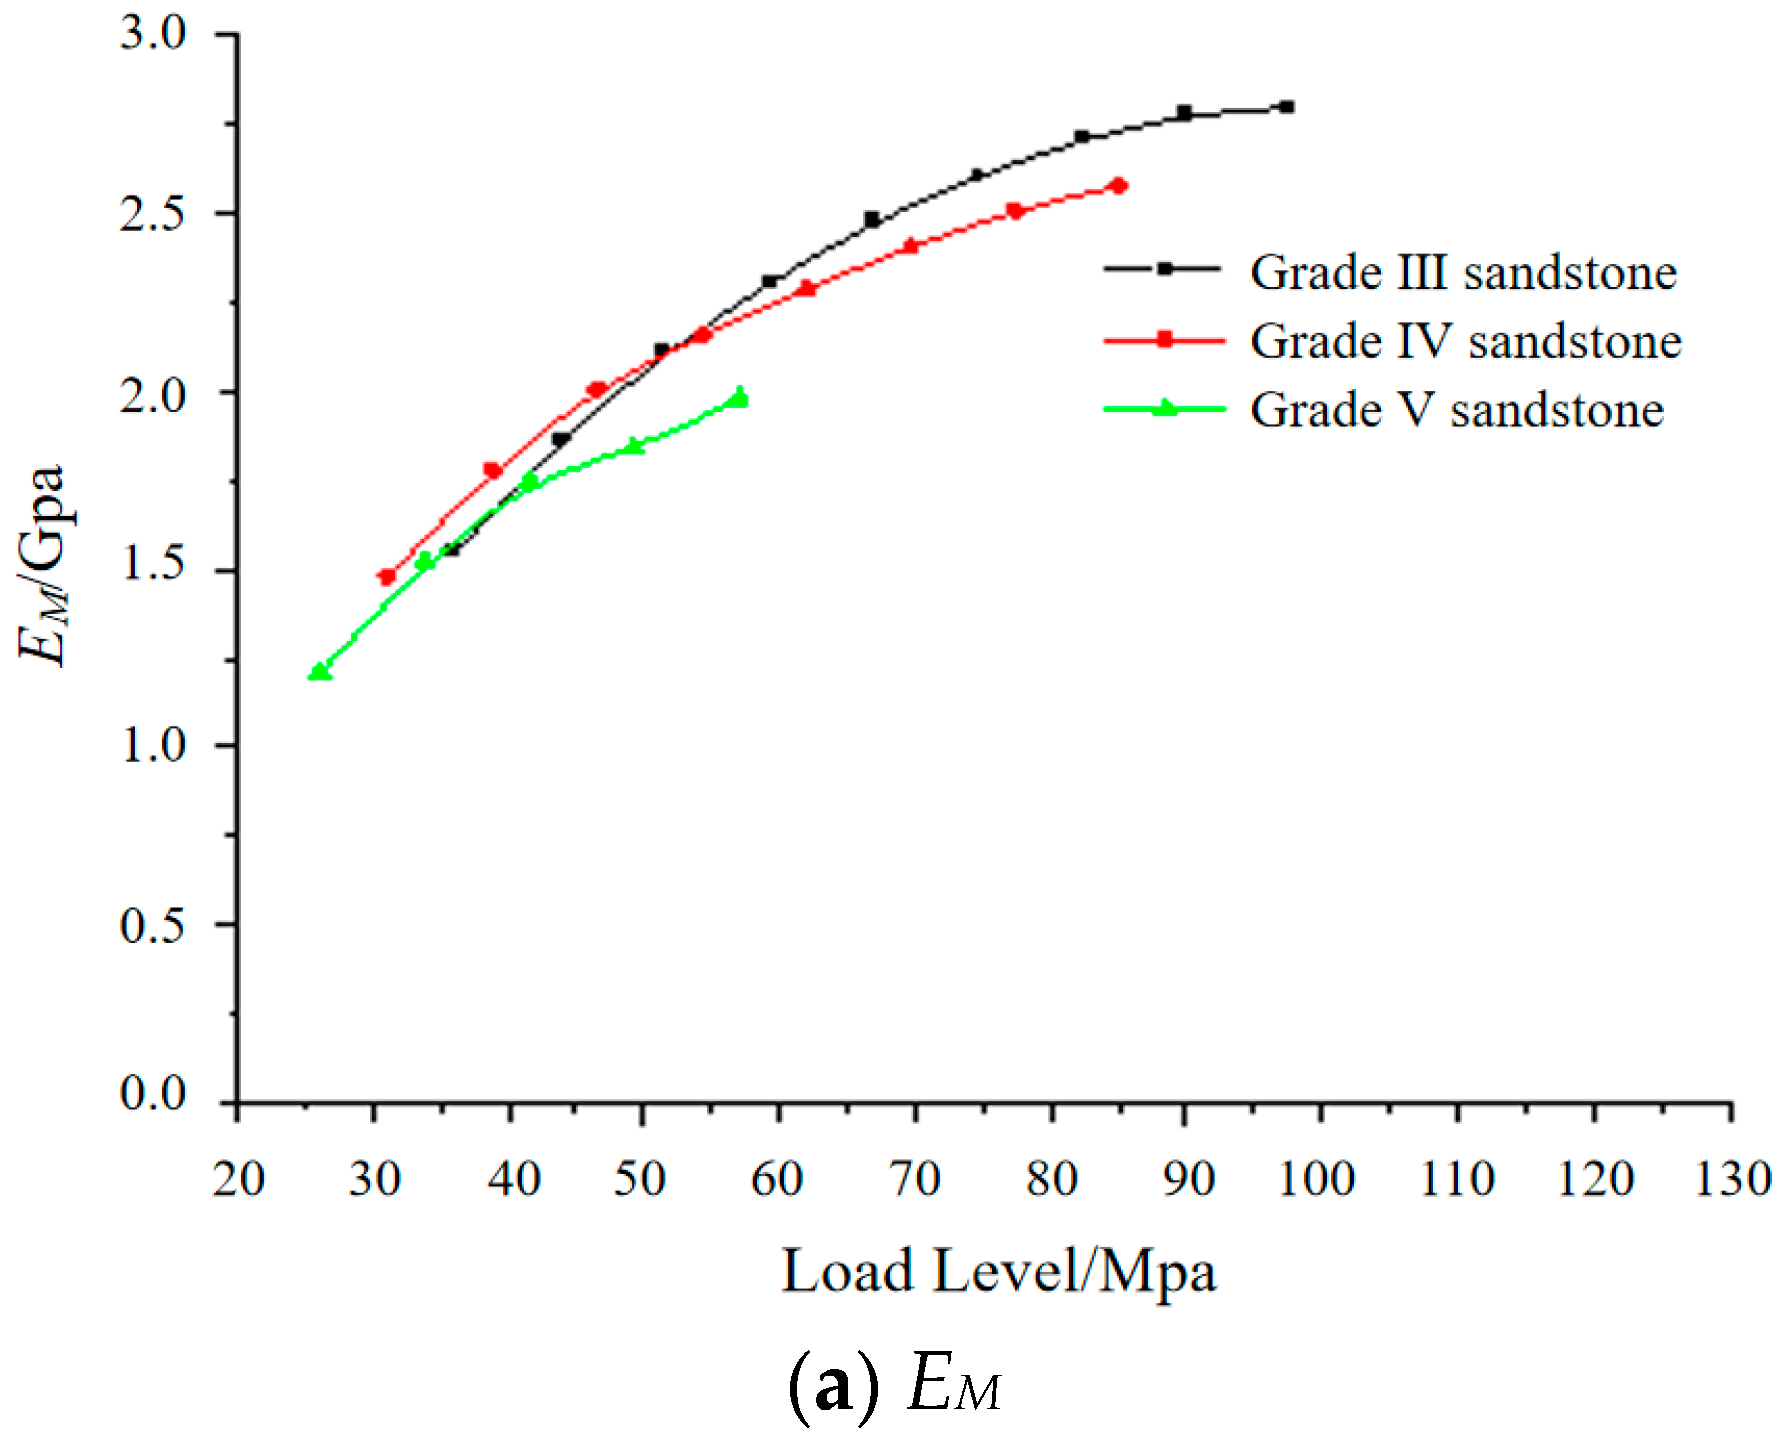
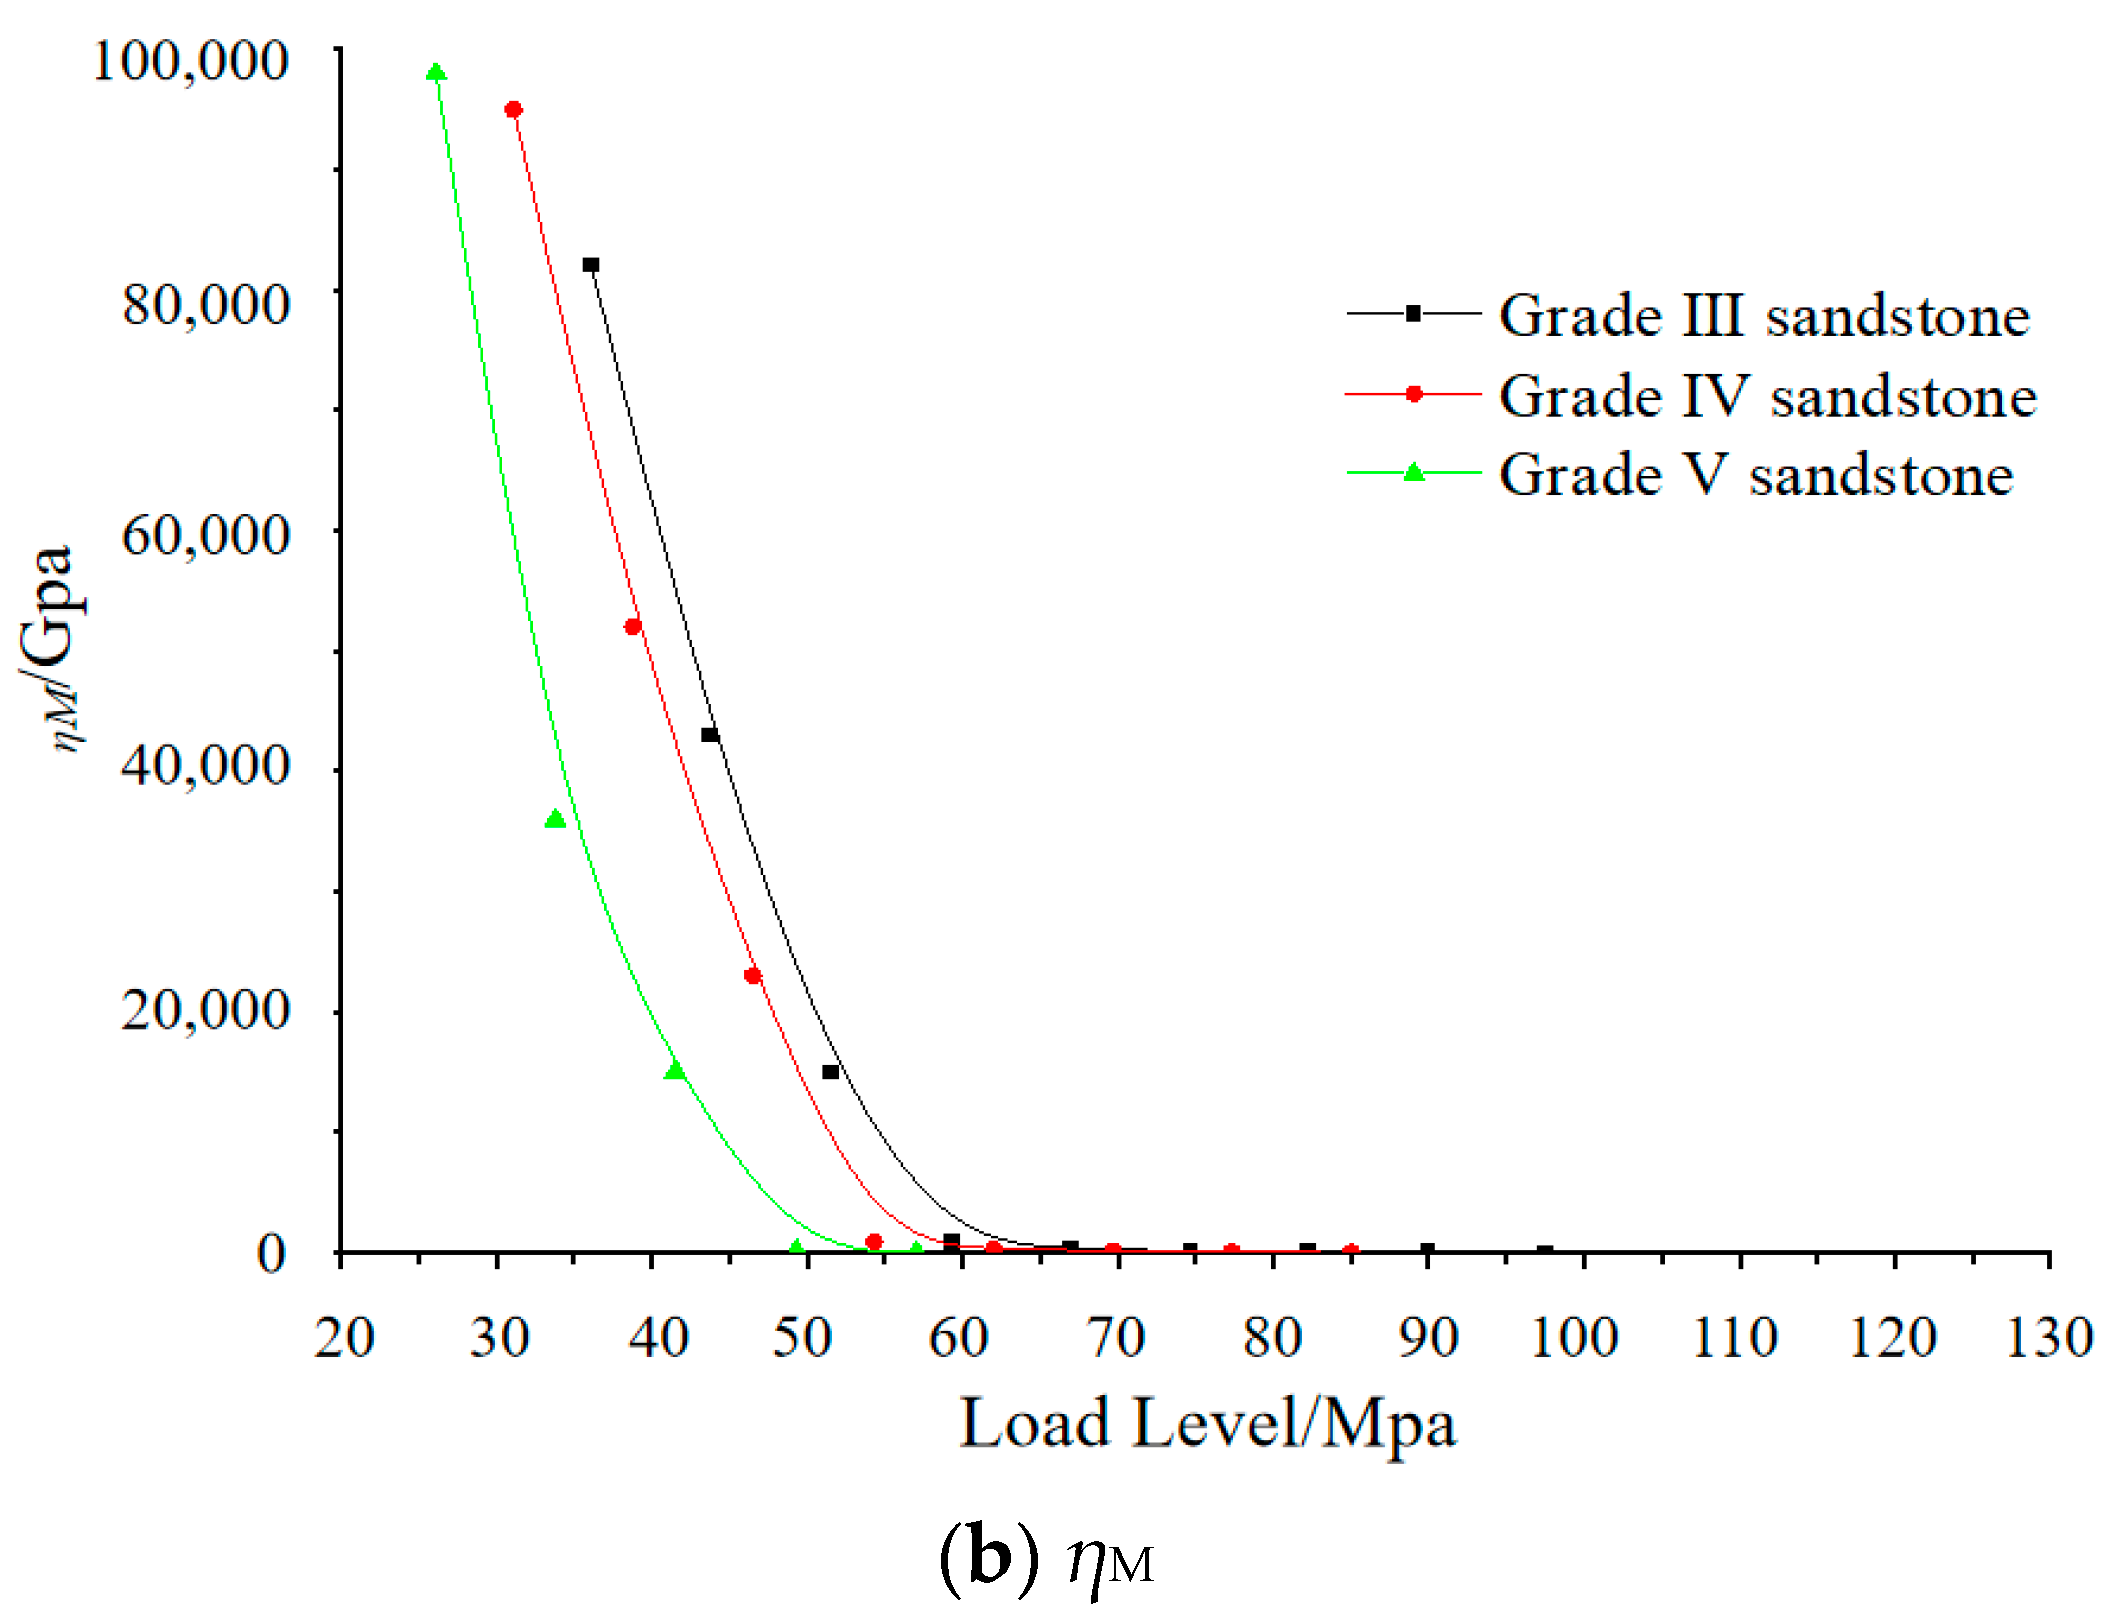
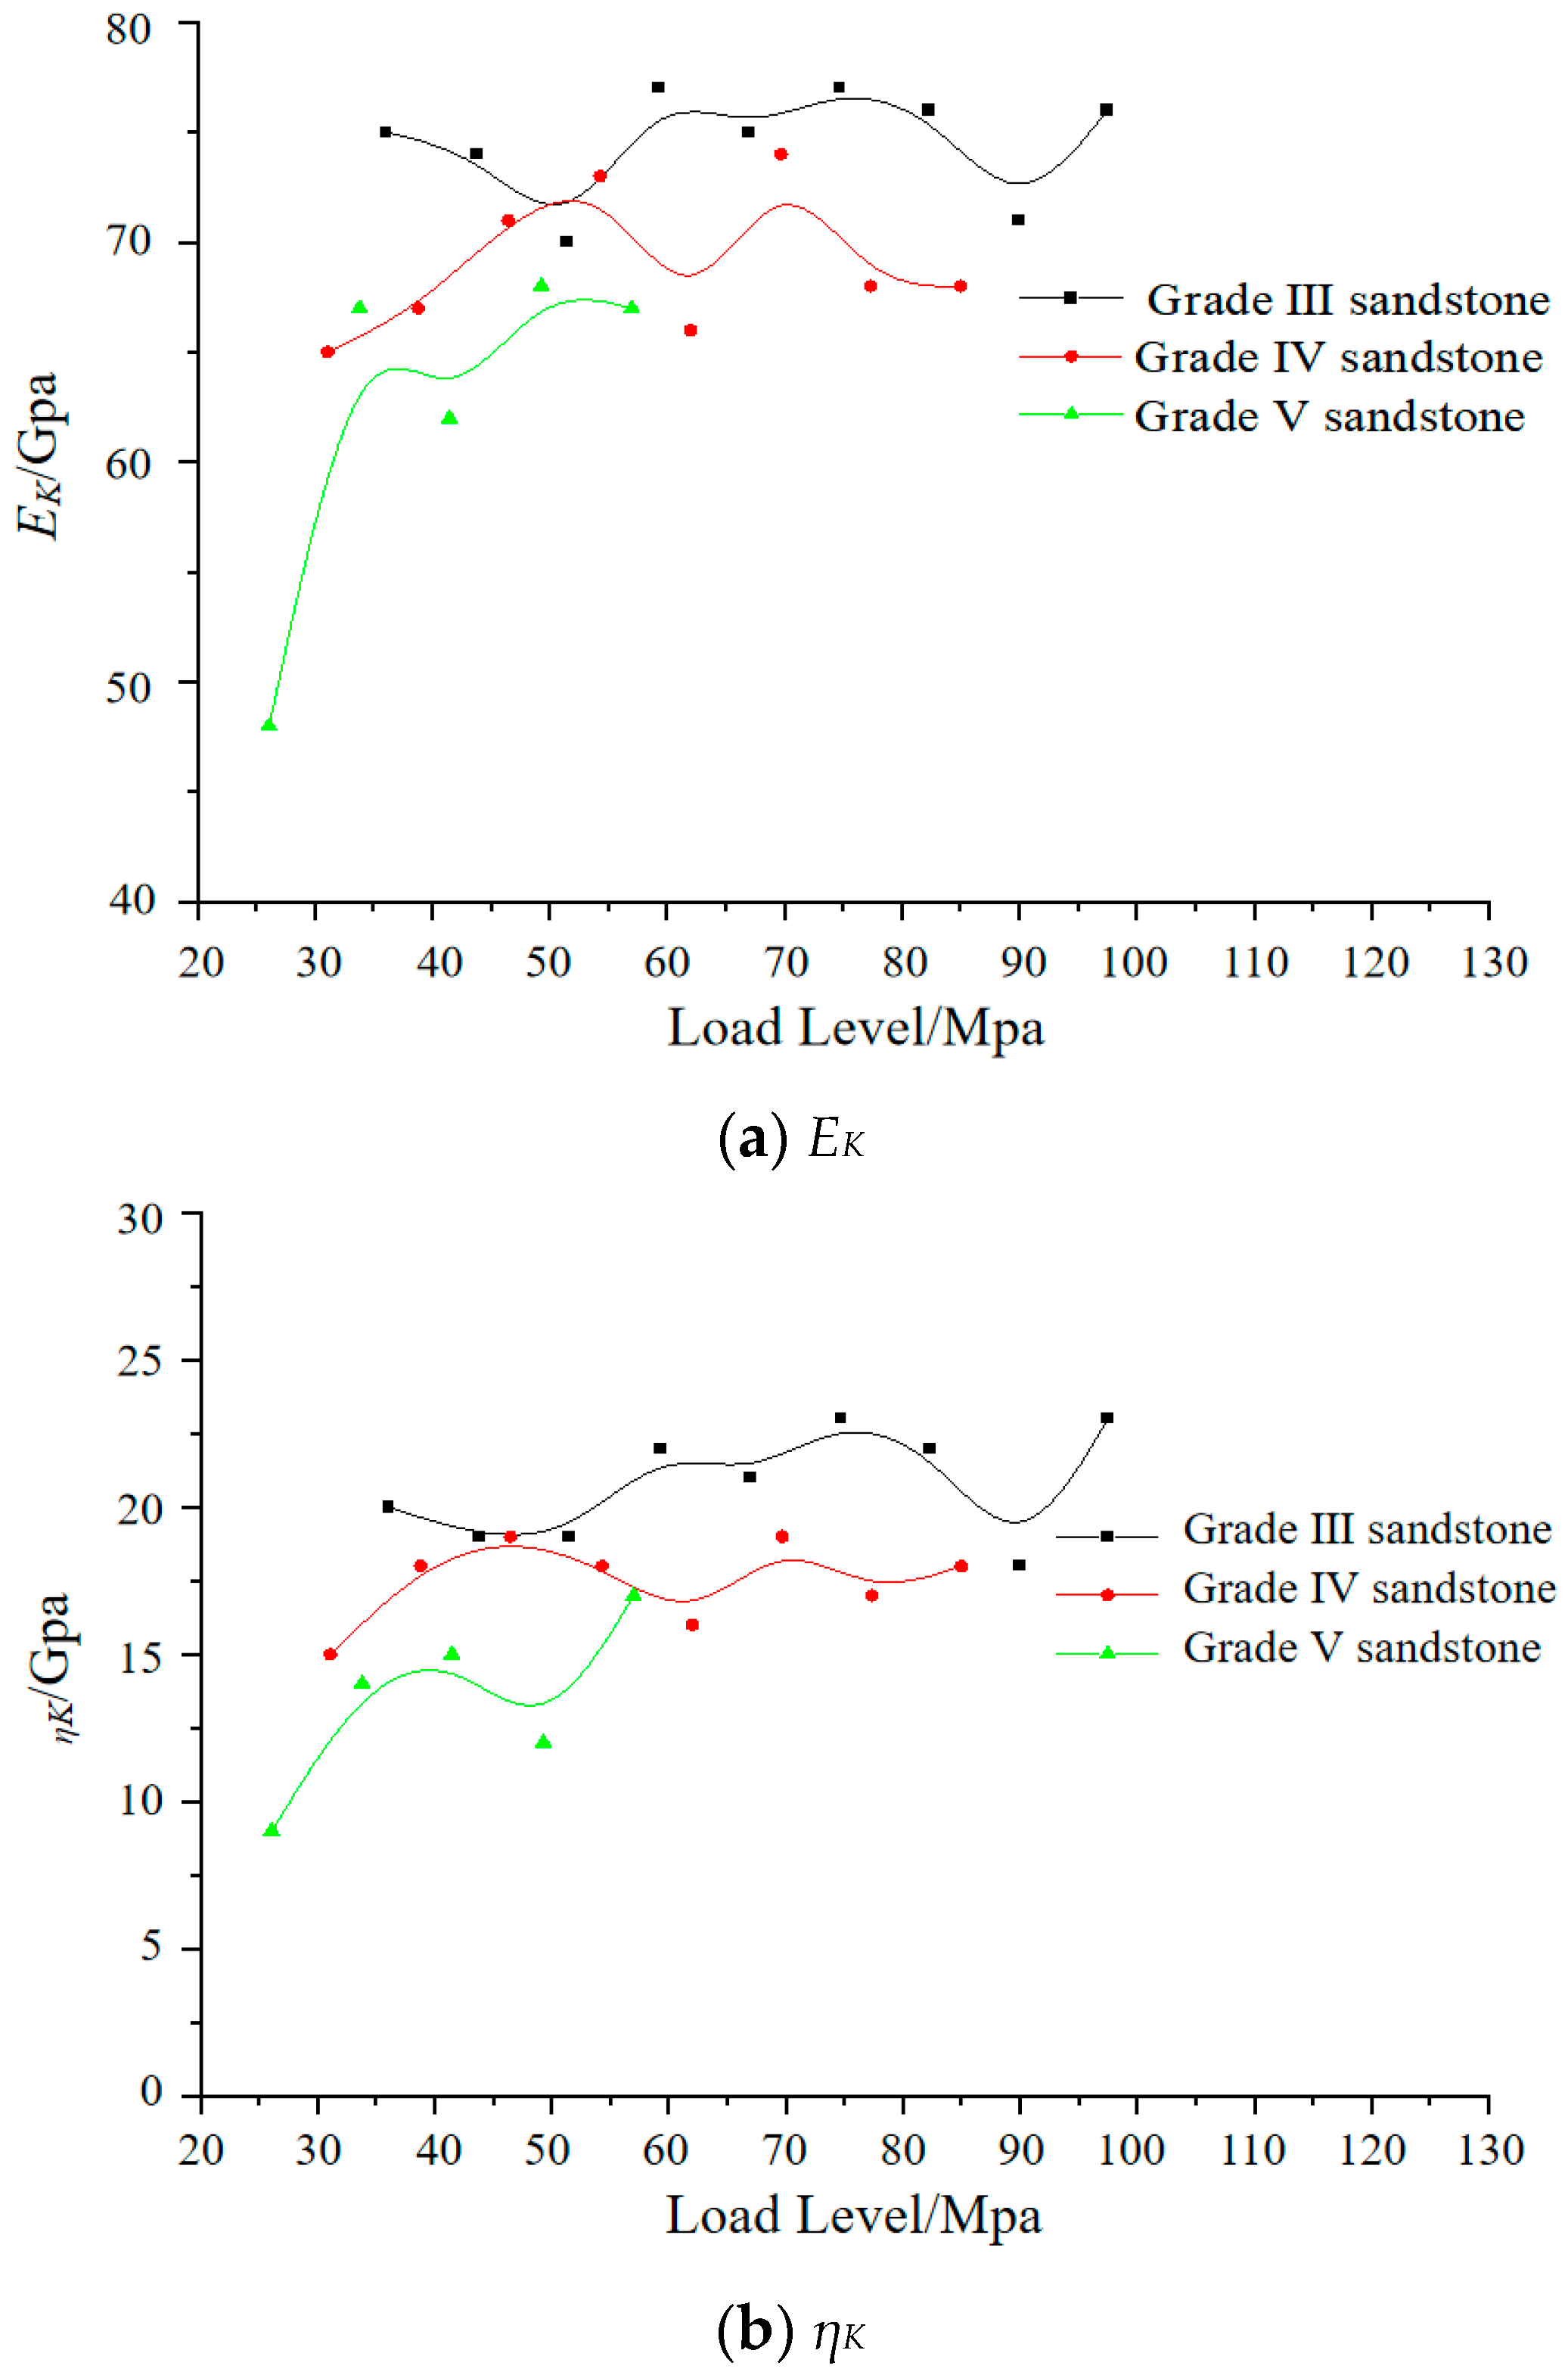
3.4. Determination and Analysis of Cvisc Model Parameters
4. Numerical Modeling Calculation
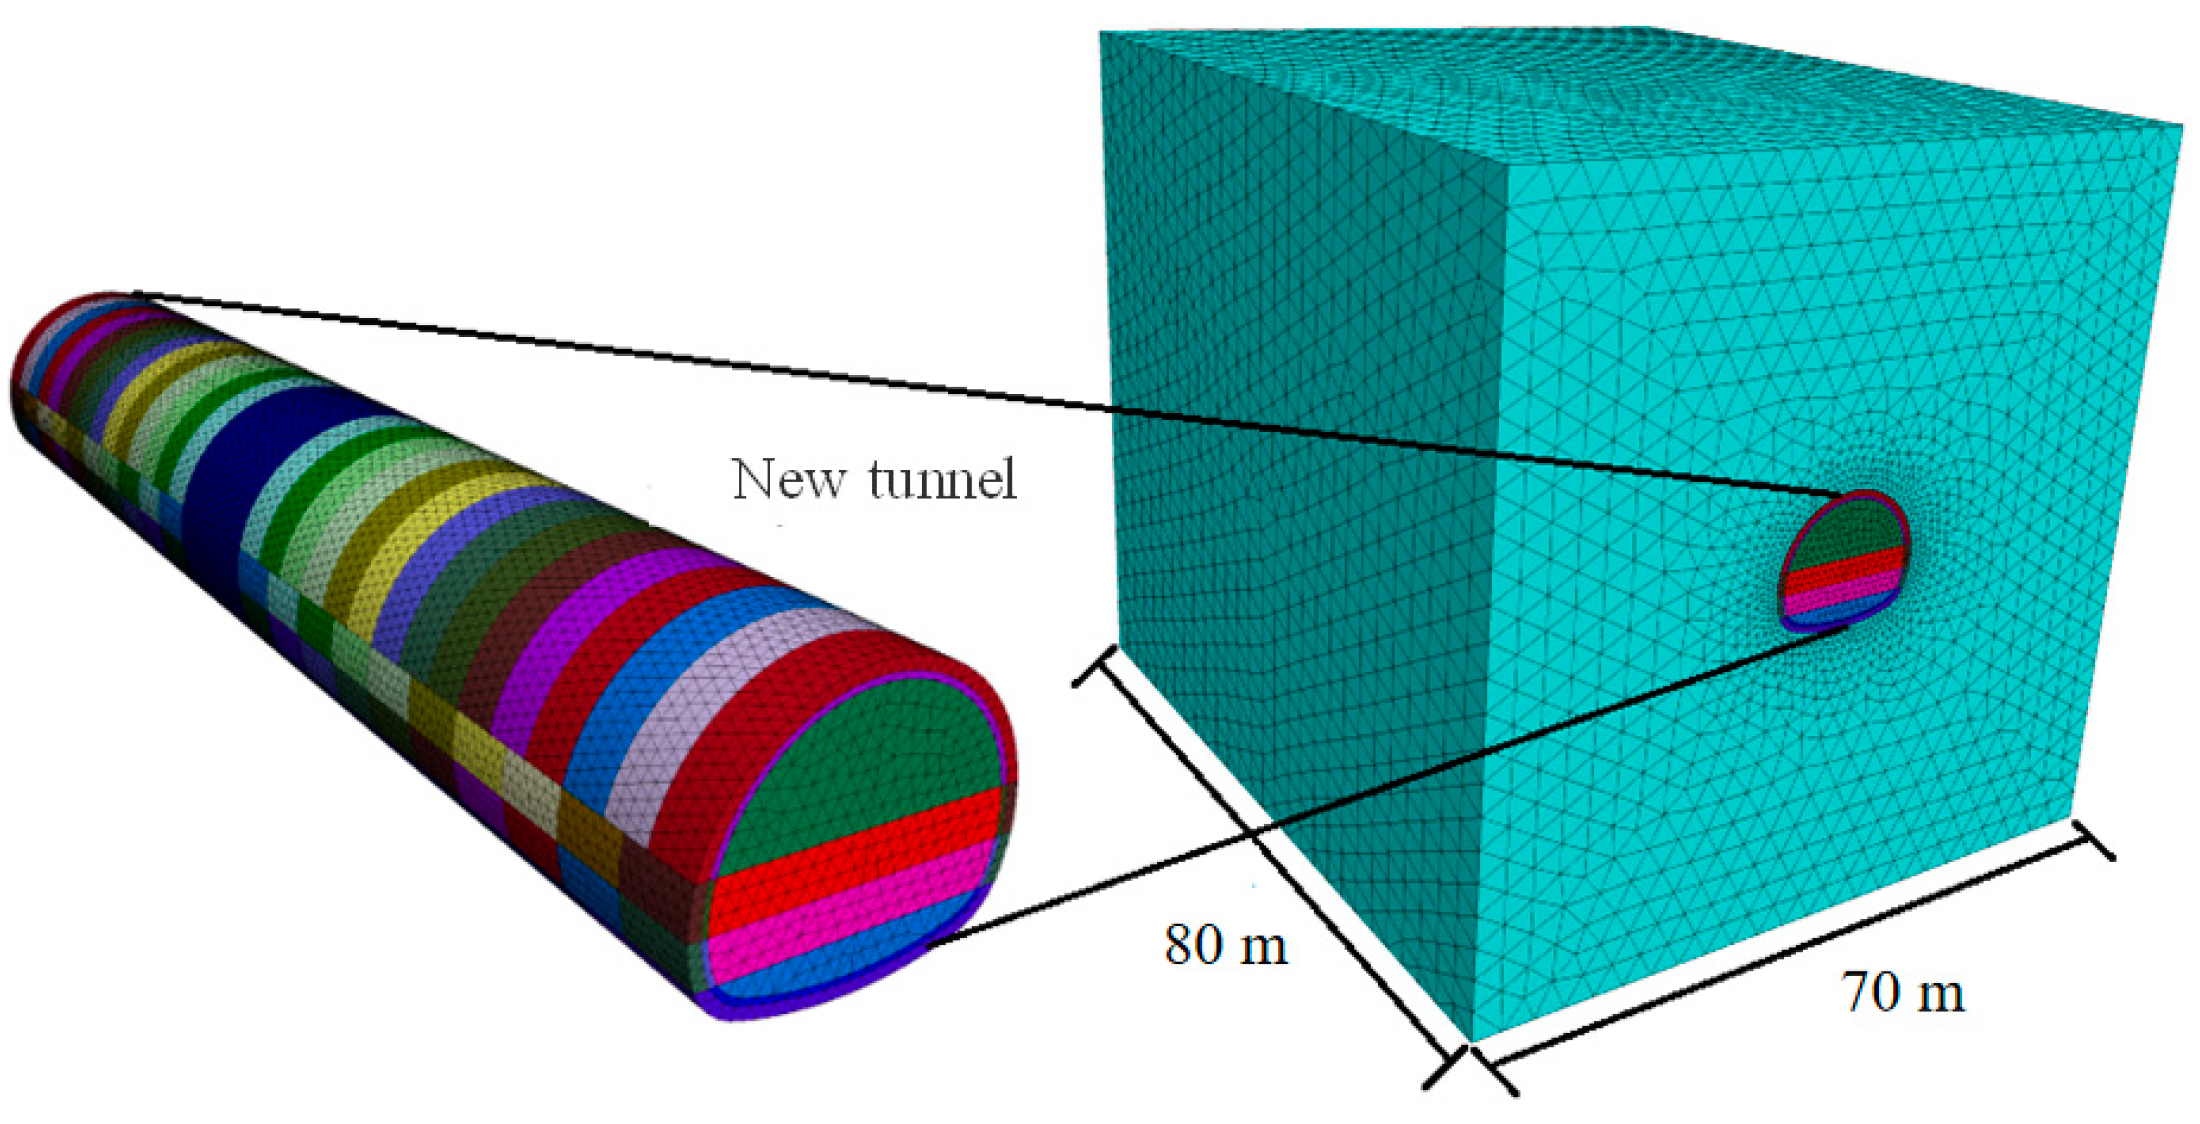
4.1. Numerical Model Establishment
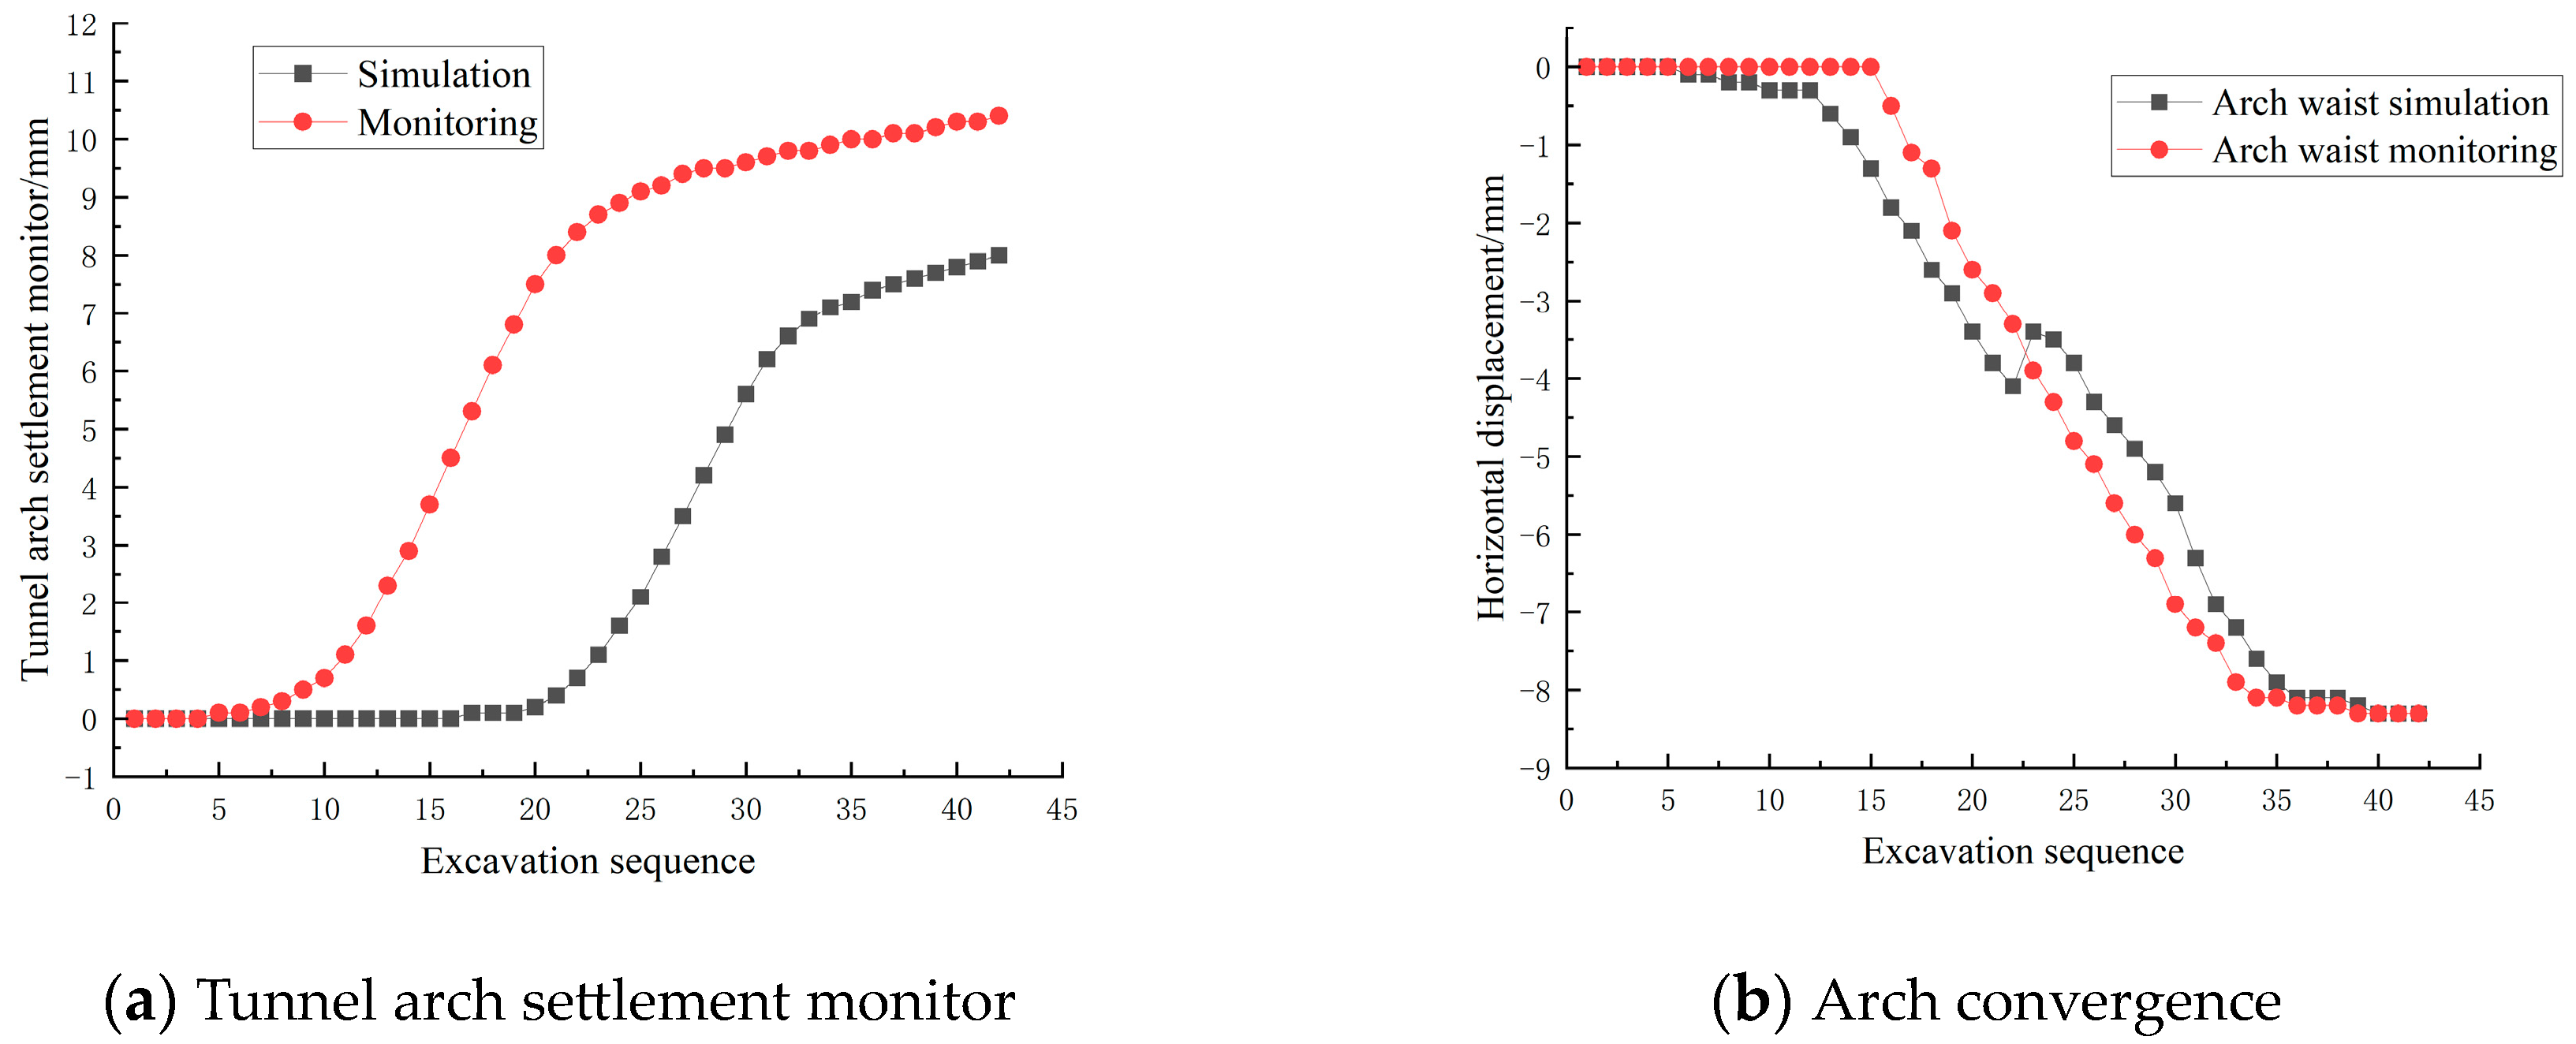
4.2. Field Monitoring
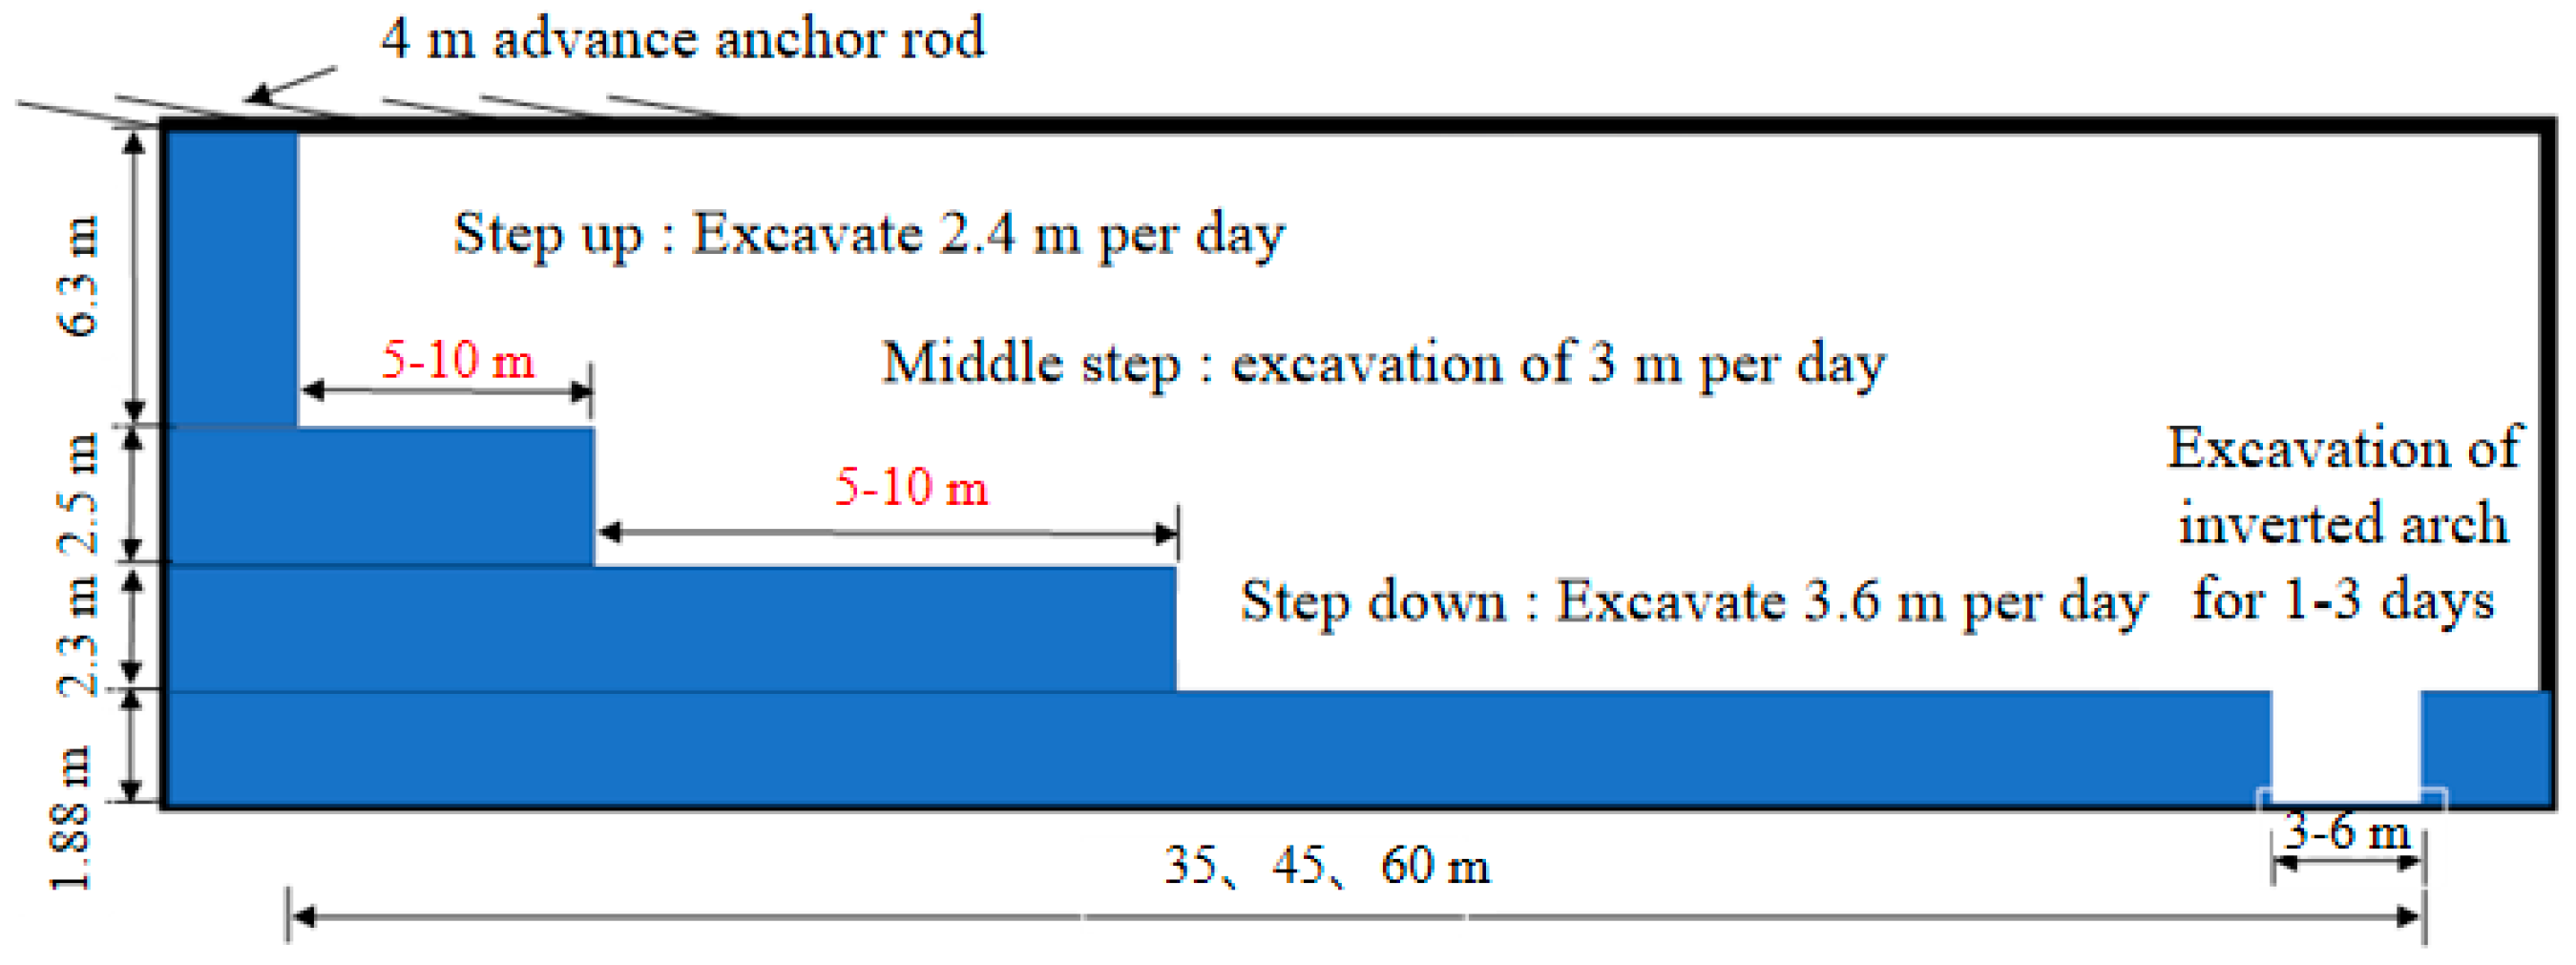
4.3. The Step of the Tunnel Excavation
4.4. Material Parameter Determination
4.5. Creep Constitutive Law and Its Parameters
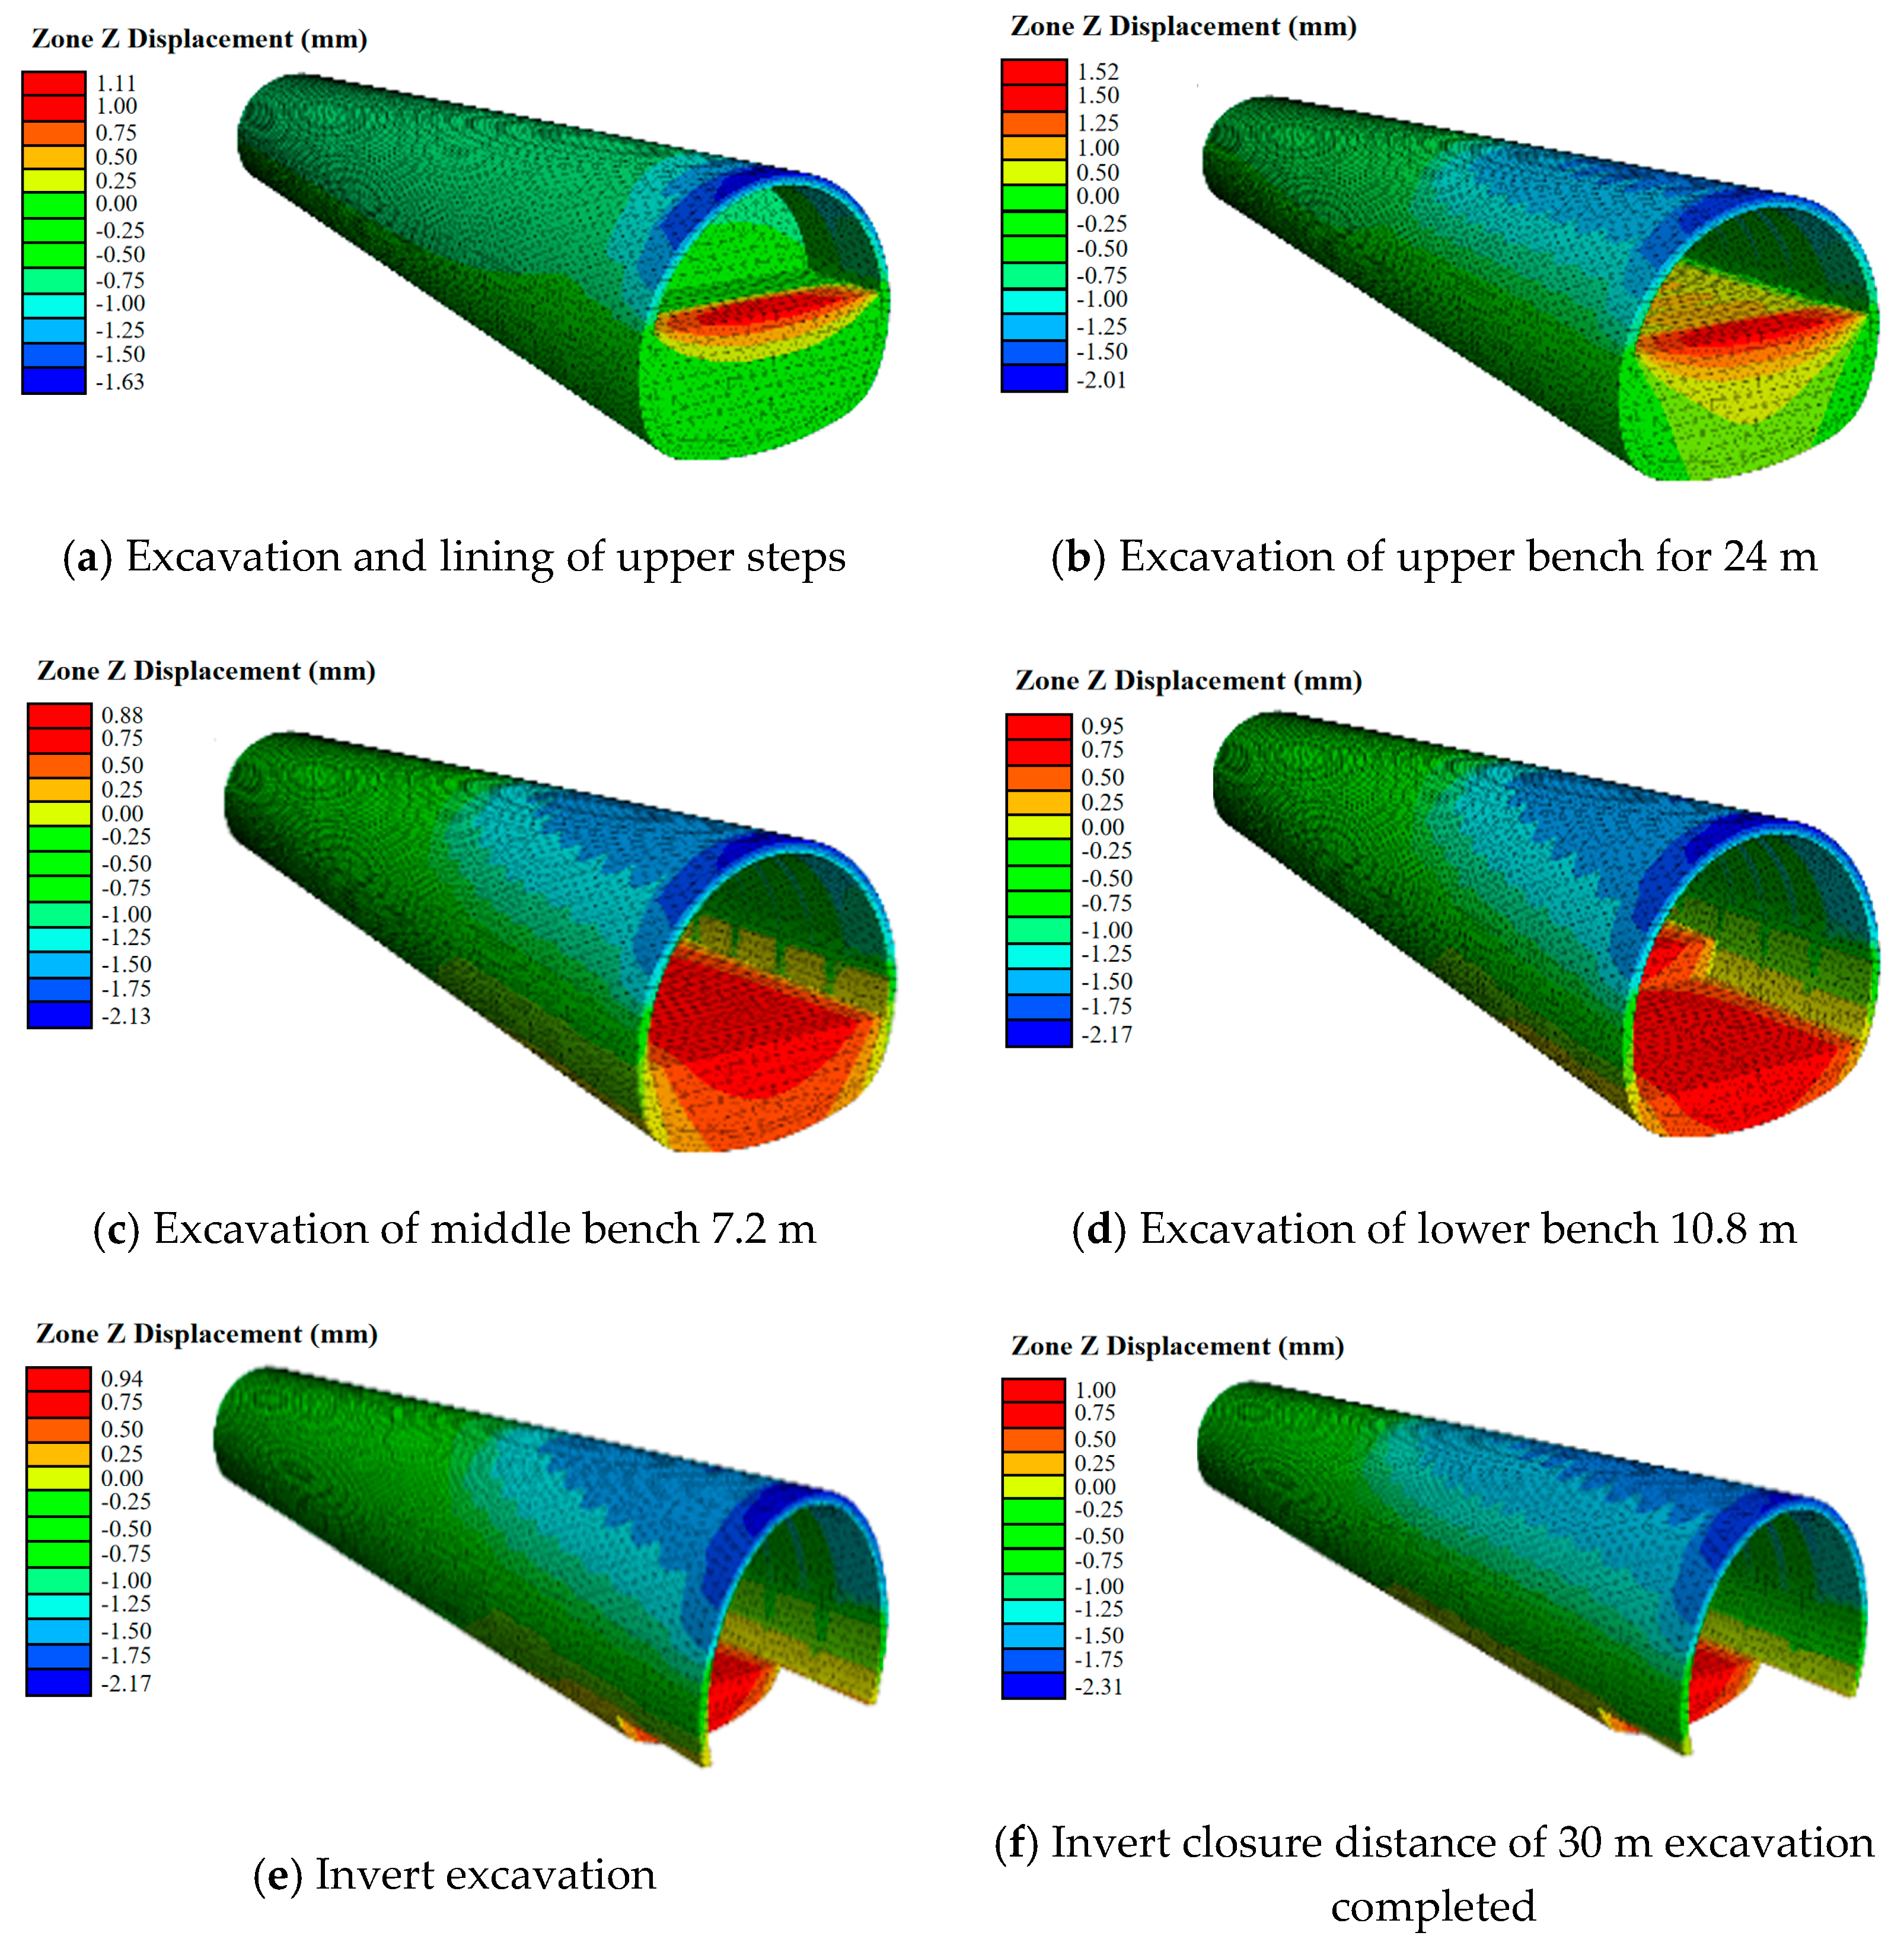
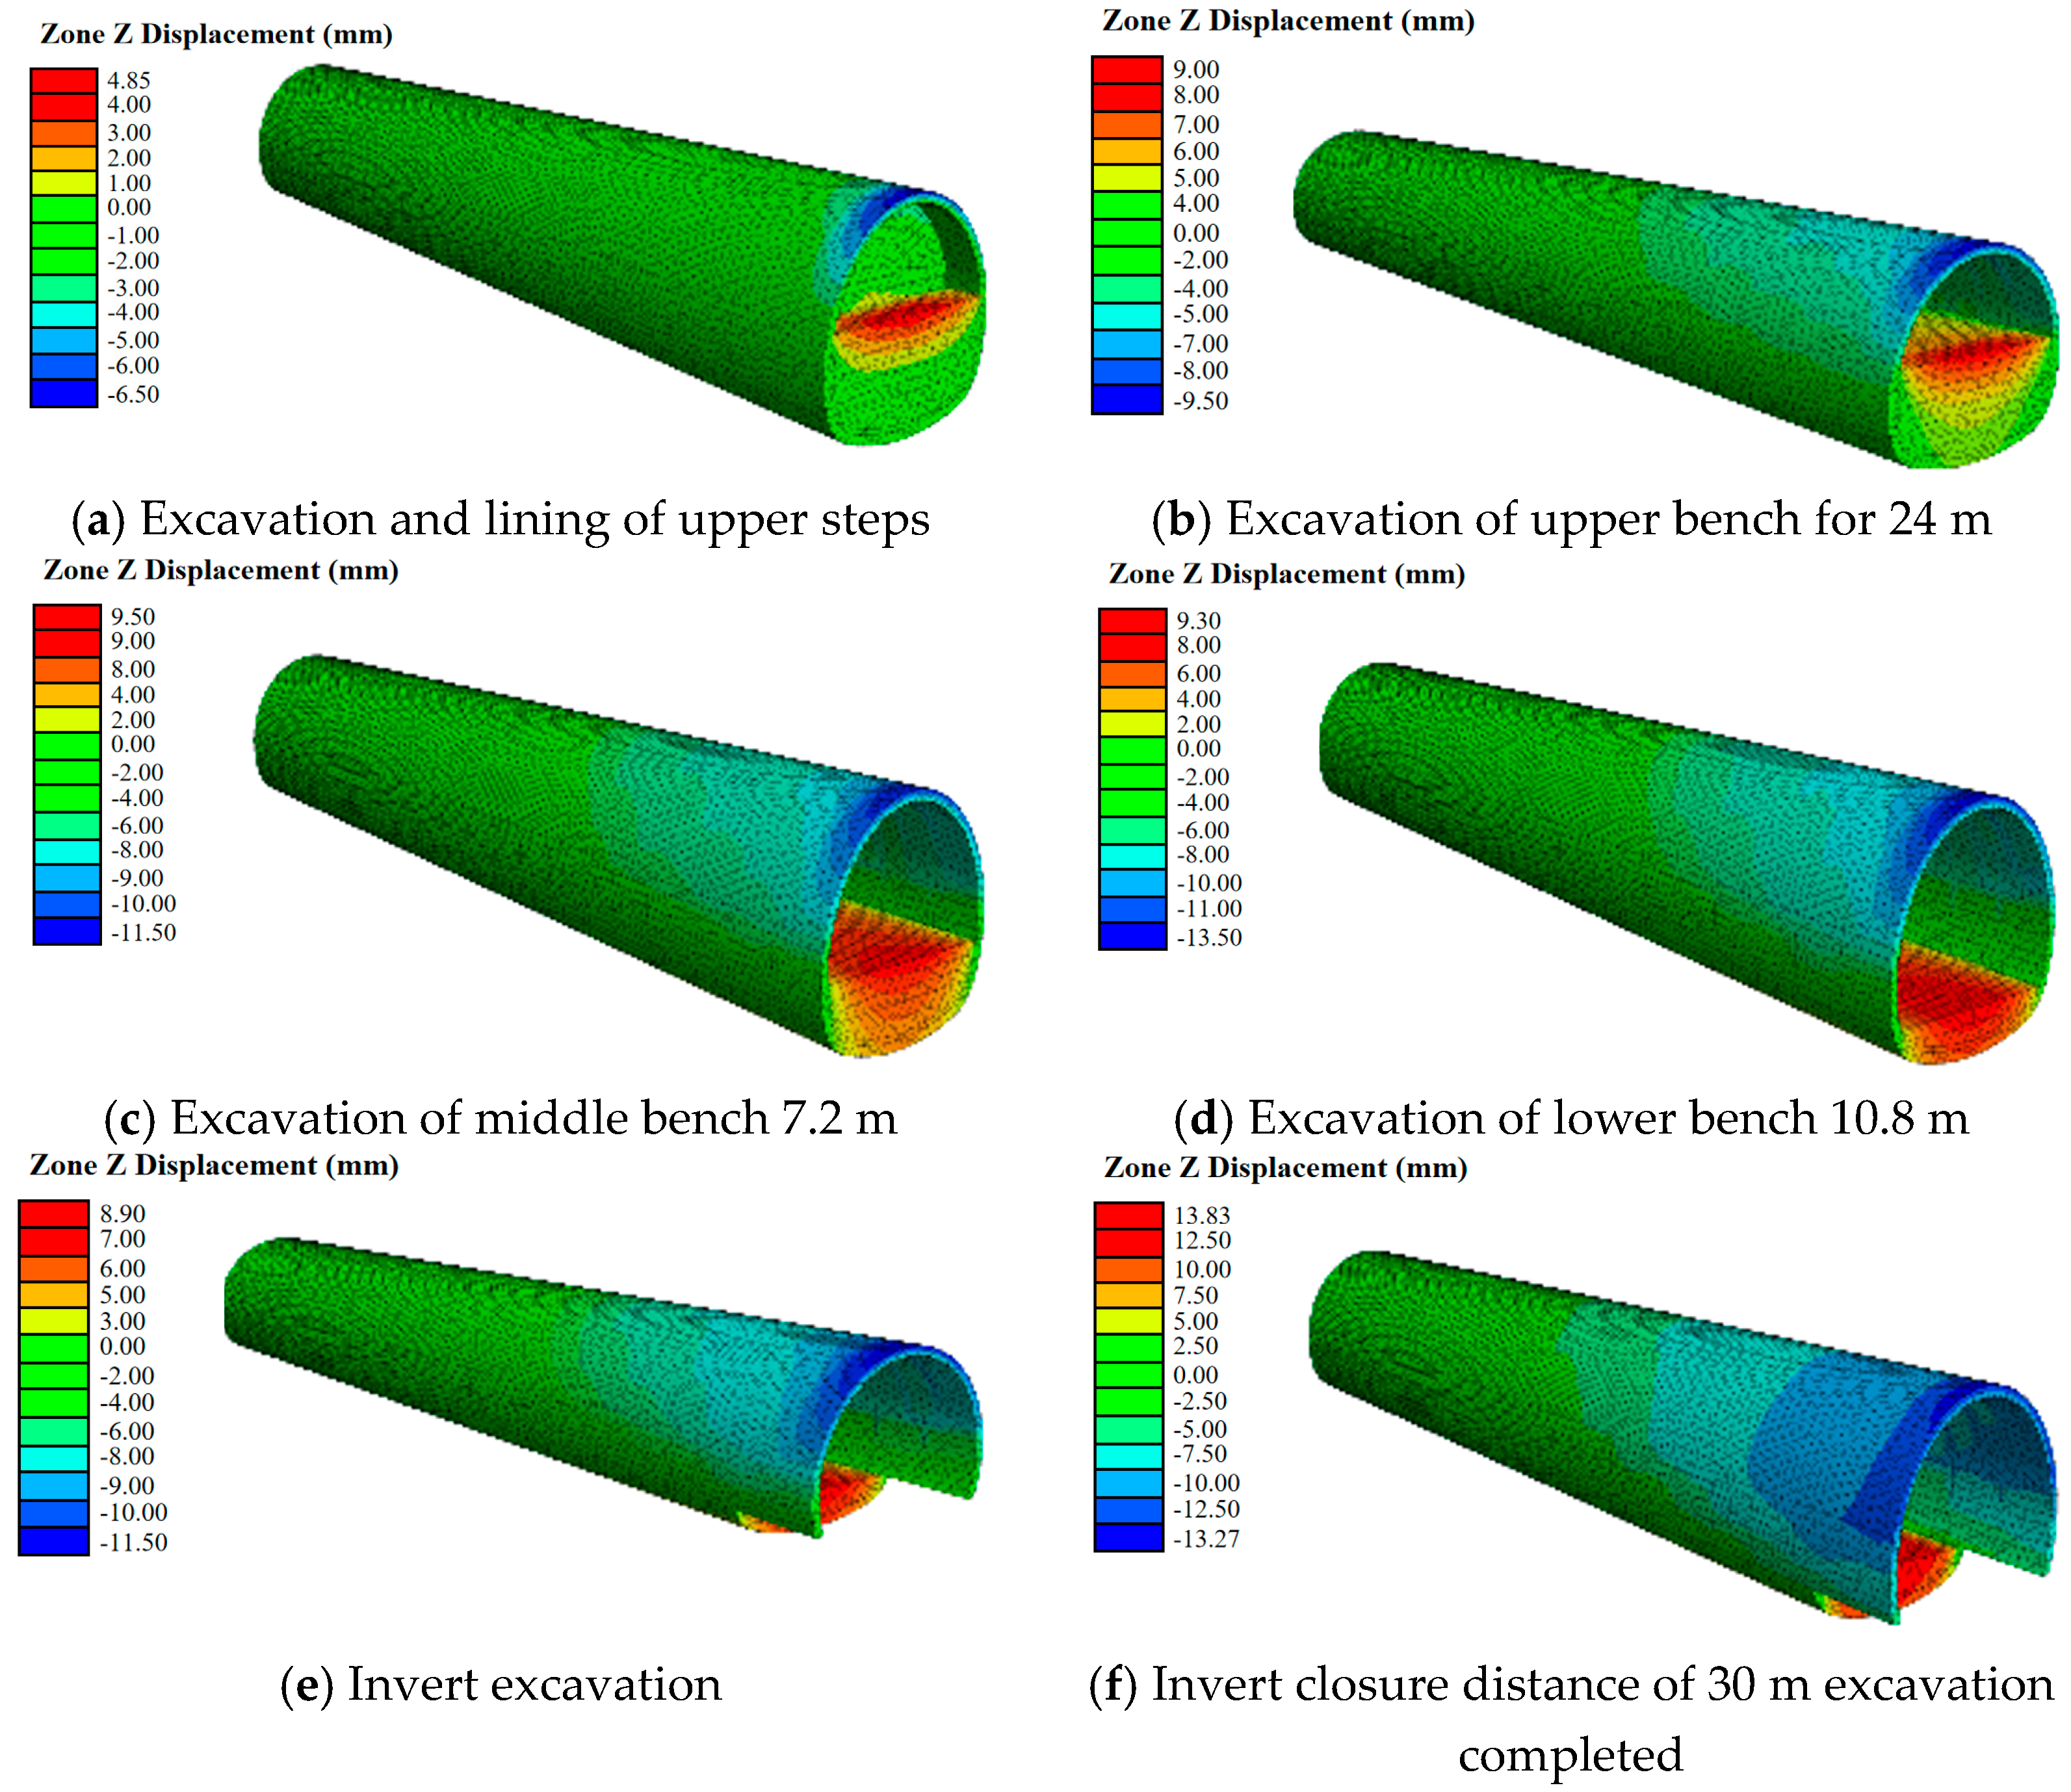
4.6. Numerical Simulation-Based Analysis of Arch Settlement of V-Class Surrounding Rock Tunnel
5. Discussion
5.1. The Influence of Whether Considering the Rheological Effects on Surrounding Rock
5.2. The Influence of Tunnel Vault Settlement
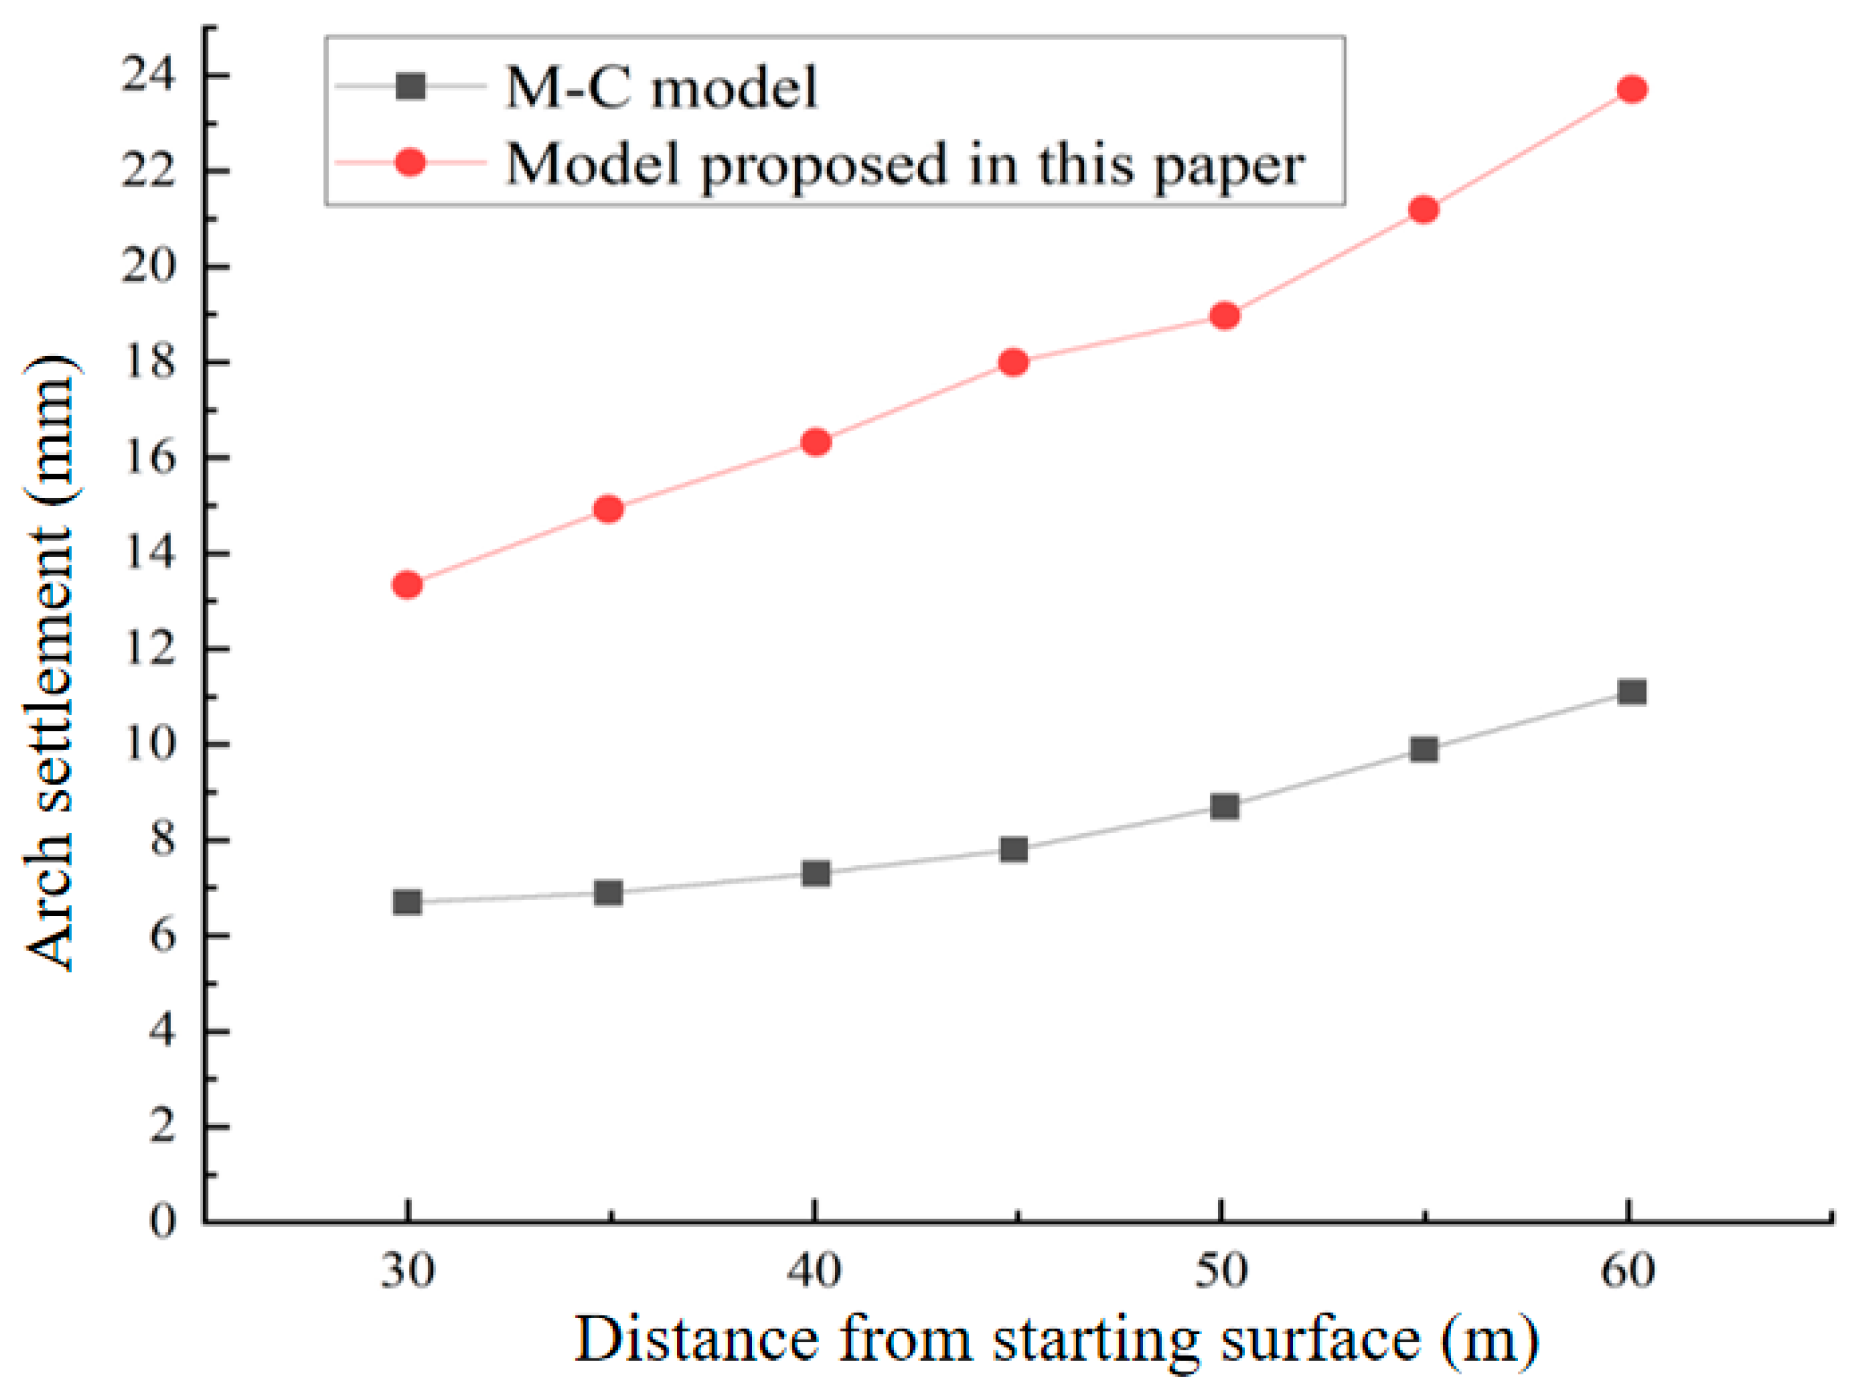
5.3. Reasons for Using the Modified Model Proposed in This Paper and Comparison
6. Conclusions
Author Contributions
Funding
Institutional Review Board Statement
Informed Consent Statement
Data Availability Statement
Acknowledgments
Conflicts of Interest
References
- Luo, K.J.; Dong, H.L.; Gao, Q.S. Deformation zoning of roadway surrounding rock Considering Rheological and intermediate principal stress. J. Coal Mine 2017, 42, 331–337. [Google Scholar]
- Wang, T.; Rong, C.X.; Wang, B. Rheological analysis of surrounding rock based on Burgers three-dimensional damage creep model. J. Guangxi Univ. 2017, 42, 205–213. [Google Scholar]
- Yao, Y.P.; Kong, L.M.; Hu, J. An elastic-viscous-plastic model for overconsolidated clays. Sci. China-Technol. Sci. 2013, 56, 441–457. [Google Scholar] [CrossRef]
- Guo, S.T.; Wen, S.J.; Guo, H.Y.; Fu, H. The Creep Test Study and Macro-Detail Analysis of Argillaceous Red Sandstone in Different Water-Containing States. Adv. Civ. Eng. 2022, 2022, 9698675. [Google Scholar] [CrossRef]
- Wang, G.; Han, W.; Liu, C.Z.; Wang, K.; Luan, H.J. Time-varying effect analysis of coupled model of prestressing bolt and surrounding rock. Chin. J. Highw. 2018, 31, 311–319. [Google Scholar]
- Feng, X.W.; Wang, W.; Wang, R.B. Constitutive model for rheological damage of sandstone considering hydrochemical damage. Geotech. Mech. 2018, 39, 3340–3346+3354. [Google Scholar]
- Wang, K.; Xu, S.S.; Zhong, Y.J.; Han, Z.; Ma, E. Deformation failure characteristics of weathered sandstone strata tunnel: A case study. Eng. Fail. Anal. 2021, 127, 105565. [Google Scholar] [CrossRef]
- Shreedharan, S.; Kulatilake, P. Discontinuum–Equivalent Continuum Analysis of the Stability of Tunnels in a Deep Coal Mine Using the Distinct Element Method. Rock Mech. Rock Eng. 2016, 49, 1903–1922. [Google Scholar] [CrossRef]
- Choi, S.; Shin, H.S. Stability analysis of a tunnel excavated in a weak rock mass and the optimal supporting system design. Int. J. Rock Mech. Min. Sci. 2004, 41, 537. [Google Scholar] [CrossRef]
- Ye, W.J.; Wu, Y.T.; Chen, M.; Gao, C. Temporal and Spatial Effect of Surrounding Rock and Supporting Construction of a Large Soil Tunnel. Adv. Civ. Eng. 2021, 2021, 9962660. [Google Scholar] [CrossRef]
- Chen, J.X.; Luo, Y.B.; Li, Y.; Zhao, P.; Xu, D.; Wang, Q. The change of rock mass pressure of Lianchengshan tunnel. Environ. Earth Sci. 2020, 79, 192. [Google Scholar] [CrossRef]
- Terron-Almenara, J.; Holter, K.G.; Hoien, A.H. A Hybrid Methodology of Rock Support Design for Poor Ground Conditions in Hard Rock Tunnelling. Rock Mech. Rock Eng. 2023, 56, 4061–4088. [Google Scholar] [CrossRef]
- Lin, X.T.; Su, D.; Shen, X.; Peng, Y.; Han, K.; Chen, X. Effect of tunnelling-induced ground loss on the distribution of earth pressure on a deep underground structure. Chin. J. Geotech. Eng. 2022, 147, 104781. [Google Scholar] [CrossRef]
- Aksoy, C.O.; Onargan, T. The role of umbrella arch and face bolt as deformation preventing support system in preventing building damages. Tunn. Undergr. Space Technol. 2010, 25, 553–559. [Google Scholar] [CrossRef]
- Aksoy, C.O.; Ogul, K.; Topal, I.; Poşluk, E.; Gicir, A.; Kucuk, K.; Aldas, G.U. Reducing deformation effect of tunnel with Non-Deformable Support System by Jointed Rock Mass Model. Tunn. Undergr. Space Technol. 2014, 40, 218–227. [Google Scholar] [CrossRef]
- Fu, H.L.; Xu, W.; Wu, Y.M. Research on the Influence of Tunnel Invert Excavation on the Rheological Deformation of Different Levels of Surrounding Rock. Appl. Sci. 2023, 13, 6960. [Google Scholar] [CrossRef]
- Cantieni, L.; Anagnostou, G.; Hug, R. Interpretation of Core Extrusion Measurements When Tunnelling Through Squeezing Ground. Rock Mech. Rock Eng. 2011, 44, 641–670. [Google Scholar] [CrossRef]
- Zhao, J.P.; Tan, Z.S.; Wang, X.Y.; Zhou, Z.; Li, G. Engineering characteristics of water-bearing weakly cemented sandstone and dewatering technology in tunnel excavation. Tunn. Undergr. Space Technol. 2022, 121, 104316. [Google Scholar] [CrossRef]
- Barla, G.; Bonini, M.; Semeraro, M. Analysis of the behaviour of a yield-control support system in squeezing rock. Tunn. Undergr. Space Technol. 2011, 26, 146–154. [Google Scholar] [CrossRef]
- Azhar, M.U.; Zhou, H.; Yang, F.J.; Younis, A.; Lu, X.; Fang, H.; Geng, Y. Water-induced softening behavior of clay-rich sandstone in Lanzhou Water Supply Project, China. J. Rock Mech. Geotech. Eng. 2020, 12, 557–570. [Google Scholar] [CrossRef]
- Lv, S.R.; Wang, W.Q.; Liu, H.Y. A Creep Damage Constitutive Model for a Rock Mass with Nonpersistent Joints under Uniaxial Compression. Math. Probl. Eng. 2019, 2019, 4361458. [Google Scholar] [CrossRef]
- Kumar, K.R.; Hajibeygi, H. Multiscale simulation of in elastic creep deformation for geological rocks. Comput. Phys. 2021, 440, 110439. [Google Scholar] [CrossRef]
- Sterpi, D.; Gioda, G. Visco-Plastic Behaviour around Advancing Tunnels in Squeezing Rock. Rock Mech. Rock Eng. 2009, 42, 319–339. [Google Scholar] [CrossRef]
- Paraskevopoulou, C.; Diederichs, M. Analysis of time-dependent deformation in tunnels using the Convergence-Confinement Method. Tunn. Undergr. Space Technol. 2018, 71, 62–80. [Google Scholar] [CrossRef]
- Wang, R.F.; Li, L.; Simon, R. A model for describing and predicting the creep strain of rocks from the primary to the tertiary stage. Rock Mech. Min. Sci. 2019, 123, 104087. [Google Scholar] [CrossRef]
- Kabwe, E.; Karakus, M.; Chanda, E.K. Isotropic damage constitutive model for time-dependent behaviour of tunnels in squeezing ground. Comput. Geotech. 2020, 127, 103738. [Google Scholar] [CrossRef]
- Song, F.; Rodriguez-Dono, A.; Olivella, S.; Gens, A. Coupled solid-fluid response of deep tunnels excavated in saturated rock masses with a time-dependent plastic behaviour. Appl. Math. Model. 2021, 100, 508–535. [Google Scholar] [CrossRef]
- Wang, H.N.; Chen, X.P.; Jiang, M.J.; Song, F.; Wu, L. The analytical predictions on displacement and stress around shallow tunnels subjected to surcharge loadings. Tunn. Undergr. Space Technol. 2018, 71, 403–427. [Google Scholar] [CrossRef]
- Frenelus, W.; Peng, H.; Zhang, J.Y. Creep Behavior of Rocks and Its Application to the Long-Term Stability of Deep Rock Tunnels. Appl. Sci. 2022, 12, 8451. [Google Scholar] [CrossRef]
- Zhang, J.F.; Chen, J.J.; Wang, J.H.; Zhu, Y.-F. Prediction of tunnel displacement induced by adjacent excavation in soft soil. Tunn Undergr Space Technol. 2013, 36, 24–33. [Google Scholar] [CrossRef]
- He, H.J.; Wang, S.F.; Shen, W.M.; Zhang, W. The influence of pipe-jacking tunneling on deformation of existing tunnels in soft soils and the effectiveness of protection measures. Transp. Geotech. 2023, 42, 101061. [Google Scholar] [CrossRef]
- Li, P.F.; Zhao, Y.; Zhou, X.J. Displacement characteristics of high-speed railway tunnel construction in loess ground by using multi-step excavation method. Tunn. Undergr. Space Technol. 2016, 51, 41–55. [Google Scholar] [CrossRef]
- Li, D.P.; Zhang, D.L.; Fang, Q.; Sun, Z.; Cao, L.; Li, A. Displacement Characteristics of Shallow-Buried Large-Section Loess Tunnel with Different Types of Pre-Supports: A Case Study of New Badaling Tunnel. Appl. Sci. 2020, 10, 195. [Google Scholar] [CrossRef]
- Zhou, J.G.; Qiu, D.C.; Sun, S.Q.; Zhou, H.; Chen, D.; Chen, H.; Hu, H.; Hu, H. Settlement Prediction Method of Extra-Large Diameter Tunnels in Soft Rock Strata. Adv. Civ. Eng. 2023, 2023, 5558160. [Google Scholar] [CrossRef]
- Liu, J.H.; Liu, X.M.; Zhang, Y.J.; Xiao, T. Numerical analysis and field monitoring tests on shallow tunnels under weak surrounding rock. J. Cent. South Univ. 2015, 22, 4056–4063. [Google Scholar] [CrossRef]
- Hao, S.J.; Fei, R.Z.; Yu, J. Mechanical characteristics of ultra-shallow buried high-speed railway tunnel in broken surrounding rock during construction. Arch. Civ. Eng. 2022, 68, 645–659. [Google Scholar]
- Wang, Z.; Yao, W.J.; Cai, Y.Q.; Xu, B.; Fu, Y.; Wei, G. Analysis of ground surface settlement induced by the construction of a large-diameter shallow-buried twin-tunnel in soft ground. Tunn. Undergr. Space Technol. 2019, 83, 520–532. [Google Scholar] [CrossRef]
- Yu, J.; He, C. 3D Elastoplastic Numerical Simulation of Surrounding Rock Displacement in Soft Surrounding Rock Section During Construction Process. Chin. J. Rock Mech. Eng. 2006, 25, 623–629. [Google Scholar]
- Liu, X.J.; Yang, C.; Yu, J. The Influence of Moisture Content on the Time-Dependent Characteristics of Rock Material and Its Application to the Construction of a Tunnel Portal. Adv. Mater. Sci. Eng. 2015, 2015, 725612. [Google Scholar] [CrossRef]
- Zhao, D.P.; Jia, L.L.; Wang, M.N.; Wang, F. Displacement prediction of tunnels based on a generalised Kelvin constitutive model and its application in a subsea tunnel. Tunn. Undergr. Space Technol. 2016, 54, 29–36. [Google Scholar] [CrossRef]


| Group Number | Average Diameter/mm | Average Height/mm | Surrounding Rock Grade |
|---|---|---|---|
| 1 | 50.11 | 100.03 | III |
| 2 | 49.93 | 99.88 | IV |
| 3 | 50.04 | 99.93 | V |
| Group Number | ρ/(g/cm3) | ES/(GPa) | υ | c/(kPa) | φ/(°) | Surrounding Rock Grade |
|---|---|---|---|---|---|---|
| 1 | 2.32 | 11.8 | 0.18 | 120.32 | 28.65 | III |
| 2 | 2.39 | 12.8 | 0.21 | 125.45 | 25.43 | IV |
| 3 | 2.51 | 12.3 | 0.19 | 135.32 | 30.54 | V |
| Group Number | Level 1 MPa | Level 2 MPa | Level 3 MPa | Level 4 MPa | Level 5 MPa | Level 6 MPa | Level 7 MPa | Level 8 MPa | Level 9 MPa | Level 10 MPa |
|---|---|---|---|---|---|---|---|---|---|---|
| 1 | 36.2 | 43.6 | 51.2 | 59.1 | 66.3 | 74.5 | 82.2 | 90.3 | 97.3 | 105.2 |
| 2 | 30.1 | 38.5 | 46.2 | 54.1 | 62.2 | 69.5 | 77.2 | 85.2 | 92.3 | / |
| 3 | 26.3 | 33.5 | 41.2 | 49.1 | 57.4 | 64.5 | / | / | / | / |
| Step | Left Vault Settling/mm | Right Vault Settling/mm | Step | Left Vault Settling/mm | Right Vault Settling/mm |
|---|---|---|---|---|---|
| 1 | 0.0 | 0.0 | 22 | 0.7 | 8.4 |
| 2 | 0.0 | 0.0 | 23 | 1.1 | 8.7 |
| 3 | 0.0 | 0.0 | 24 | 1.6 | 8.9 |
| 4 | 0.0 | 0.0 | 25 | 2.1 | 9.1 |
| 5 | 0.0 | 0.1 | 26 | 2.8 | 9.2 |
| 6 | 0.0 | 0.1 | 27 | 3.5 | 9.4 |
| 7 | 0.0 | 0.2 | 28 | 4.2 | 9.5 |
| 8 | 0.0 | 0.3 | 29 | 4.9 | 9.5 |
| 9 | 0.0 | 0.5 | 30 | 5.6 | 9.6 |
| 10 | 0.0 | 0.7 | 31 | 6.2 | 9.7 |
| 11 | 0.0 | 1.1 | 32 | 6.6 | 9.8 |
| 12 | 0.0 | 1.6 | 33 | 6.9 | 9.8 |
| 13 | 0.0 | 2.3 | 34 | 7.1 | 9.9 |
| 14 | 0.0 | 2.9 | 35 | 7.2 | 10.0 |
| 15 | 0.0 | 3.7 | 36 | 7.4 | 10.0 |
| 16 | 0.0 | 4.5 | 37 | 7.5 | 10.1 |
| 17 | 0.1 | 5.3 | 38 | 7.6 | 10.1 |
| 18 | 0.1 | 6.1 | 39 | 7.7 | 10.2 |
| 19 | 0.1 | 6.8 | 40 | 7.8 | 10.3 |
| 20 | 0.2 | 7.5 | 41 | 7.9 | 10.3 |
| 21 | 0.4 | 8.0 | 42 | 8.0 | 10.4 |
| Material Science | Deformation Modulus/(GPa) | Poisson’s Ratio | Cohesion/(MPa) | Internal Friction Angle/(°) | Density/(kg/m3) |
|---|---|---|---|---|---|
| V-grade surrounding rock | 18 | 0.30 | 0.05 | 25 | 2000 |
| Initial support | 1.6 | 0.4 | / | / | 2500 |
| Secondary support | 20 | 0.25 | / | / | 2500 |
| IV-grade surrounding rock | 30 | 0.25 | 0.35 | 30 | 2200 |
| III-grade surrounding rock | 40 | 0.22 | 0.50 | 35 | 2500 |
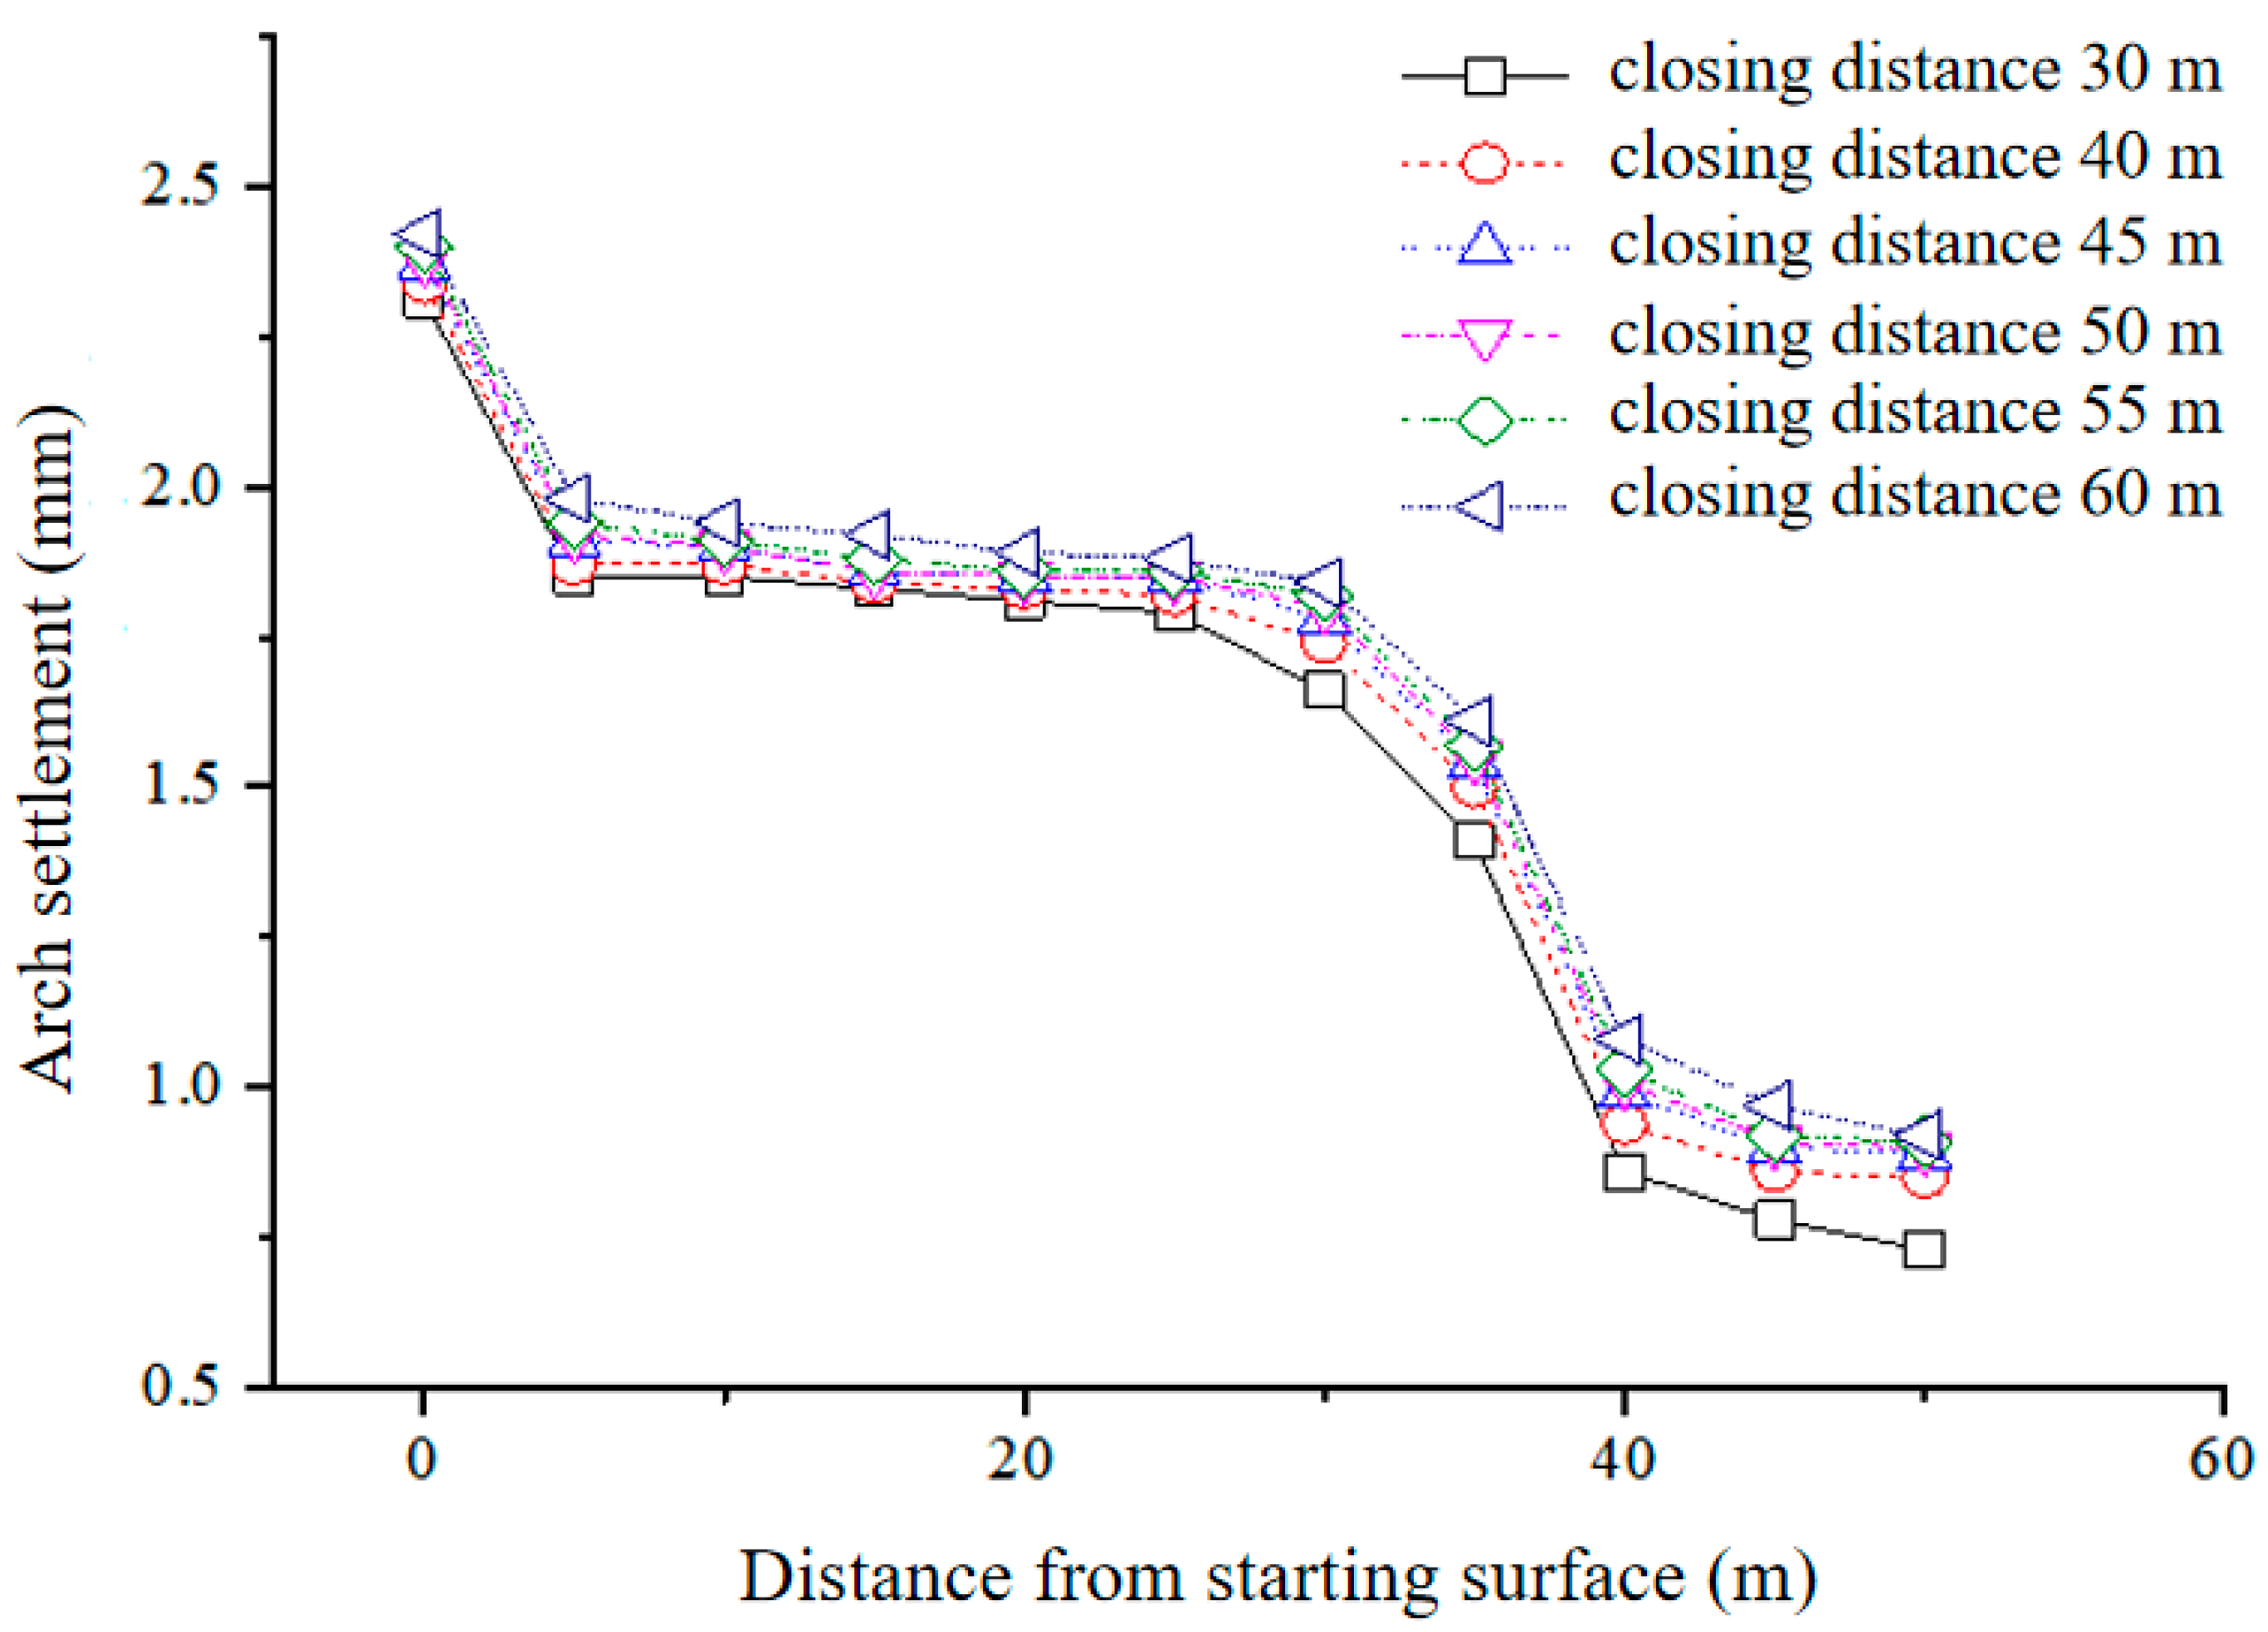
| Closing Distance (m) | Excavation Time (Day) | Maximum Displacement of Vault (mm) |
|---|---|---|
| 30 | 17 | 13.33 |
| 40 | 22 | 16.38 |
| 45 | 25 | 17.93 |
| 50 | 29 | 21.71 |
| 55 | 35 | 23.9 |
| 60 | 38 | 25.1 |
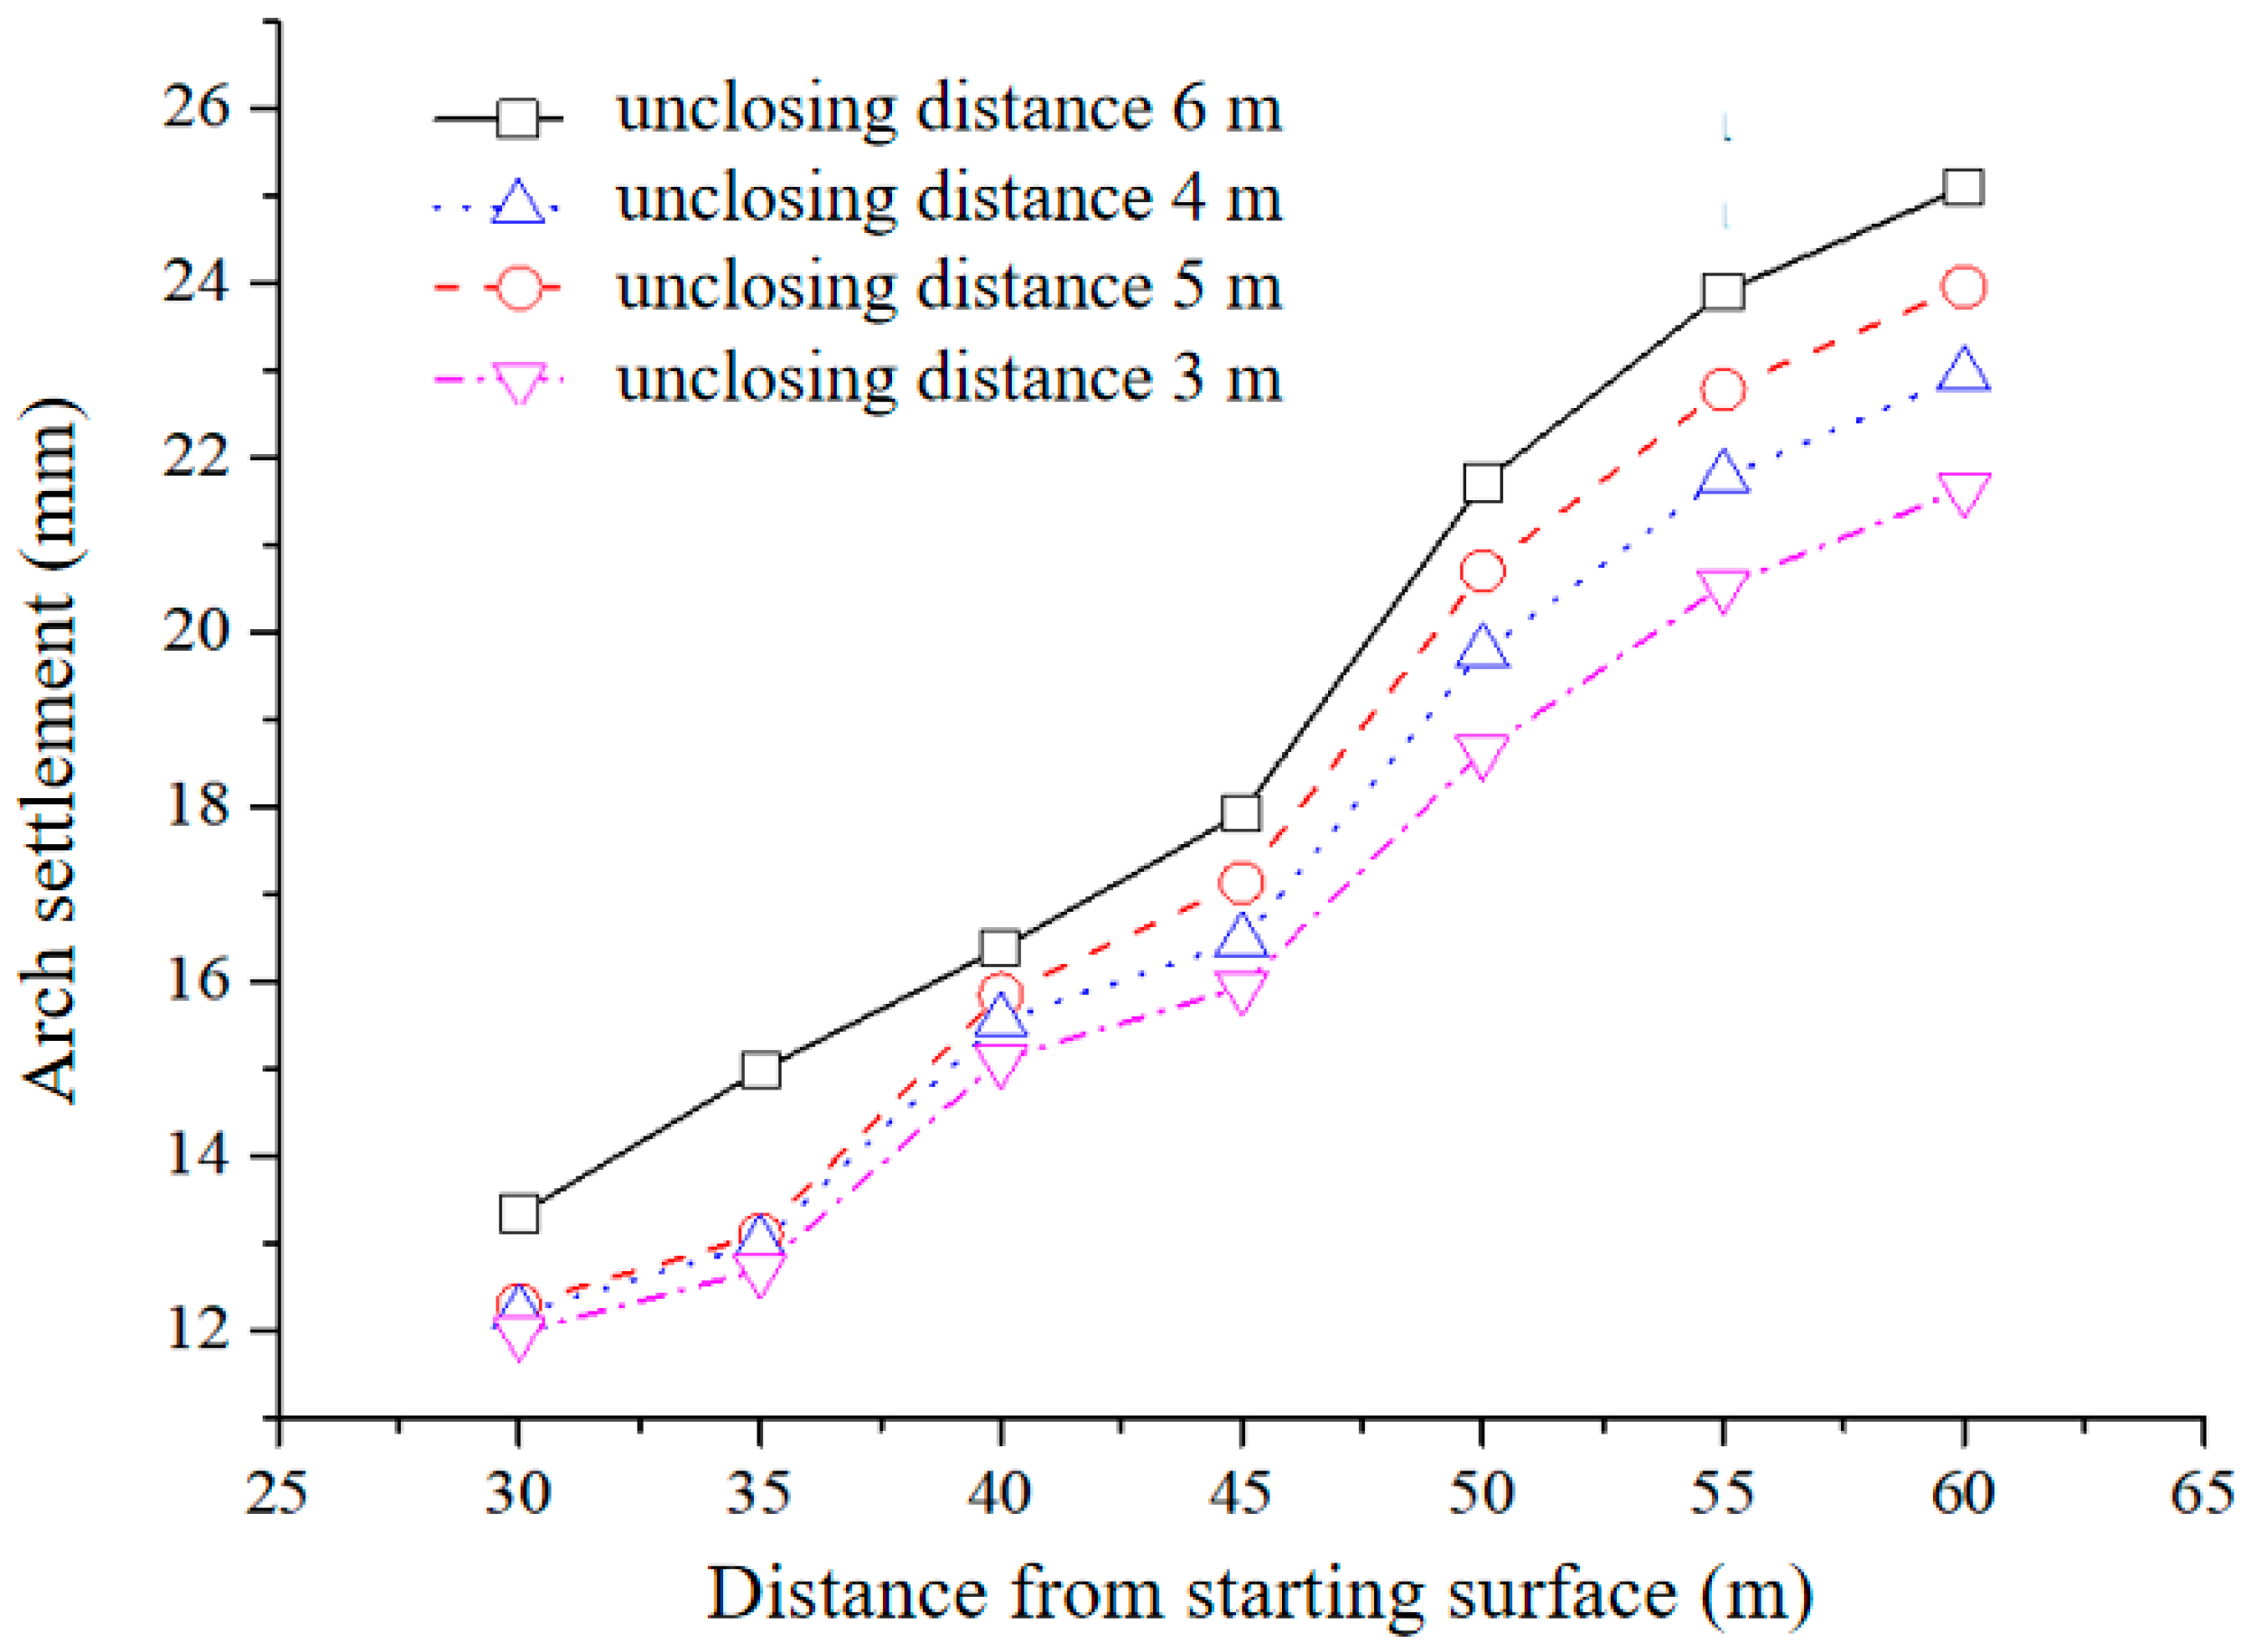
| Closing Distance (m) | Unenclosed Inverted Arch 6 m Maximum Displacement of Vault (mm) | Unenclosed Inverted Arch 5 m Maximum Displacement of Vault (mm) | Unenclosed Inverted Arch 4 m Maximum Displacement of Vault (mm) | Unenclosed Inverted Arch 3 m Maximum Displacement of Vault (mm) |
|---|---|---|---|---|
| 30 | 13.33 | 12.3 | 12.2 | 11.98 |
| 35 | 14.98 | 13.1 | 13 | 12.7 |
| 40 | 16.38 | 15.85 | 15.55 | 15.1 |
| 45 | 17.93 | 17.13 | 16.47 | 15.94 |
| 50 | 21.71 | 20.7 | 19.78 | 18.64 |
| 55 | 23.9 | 22.78 | 21.77 | 20.54 |
| 60 | 25.1 | 23.96 | 22.95 | 21.64 |
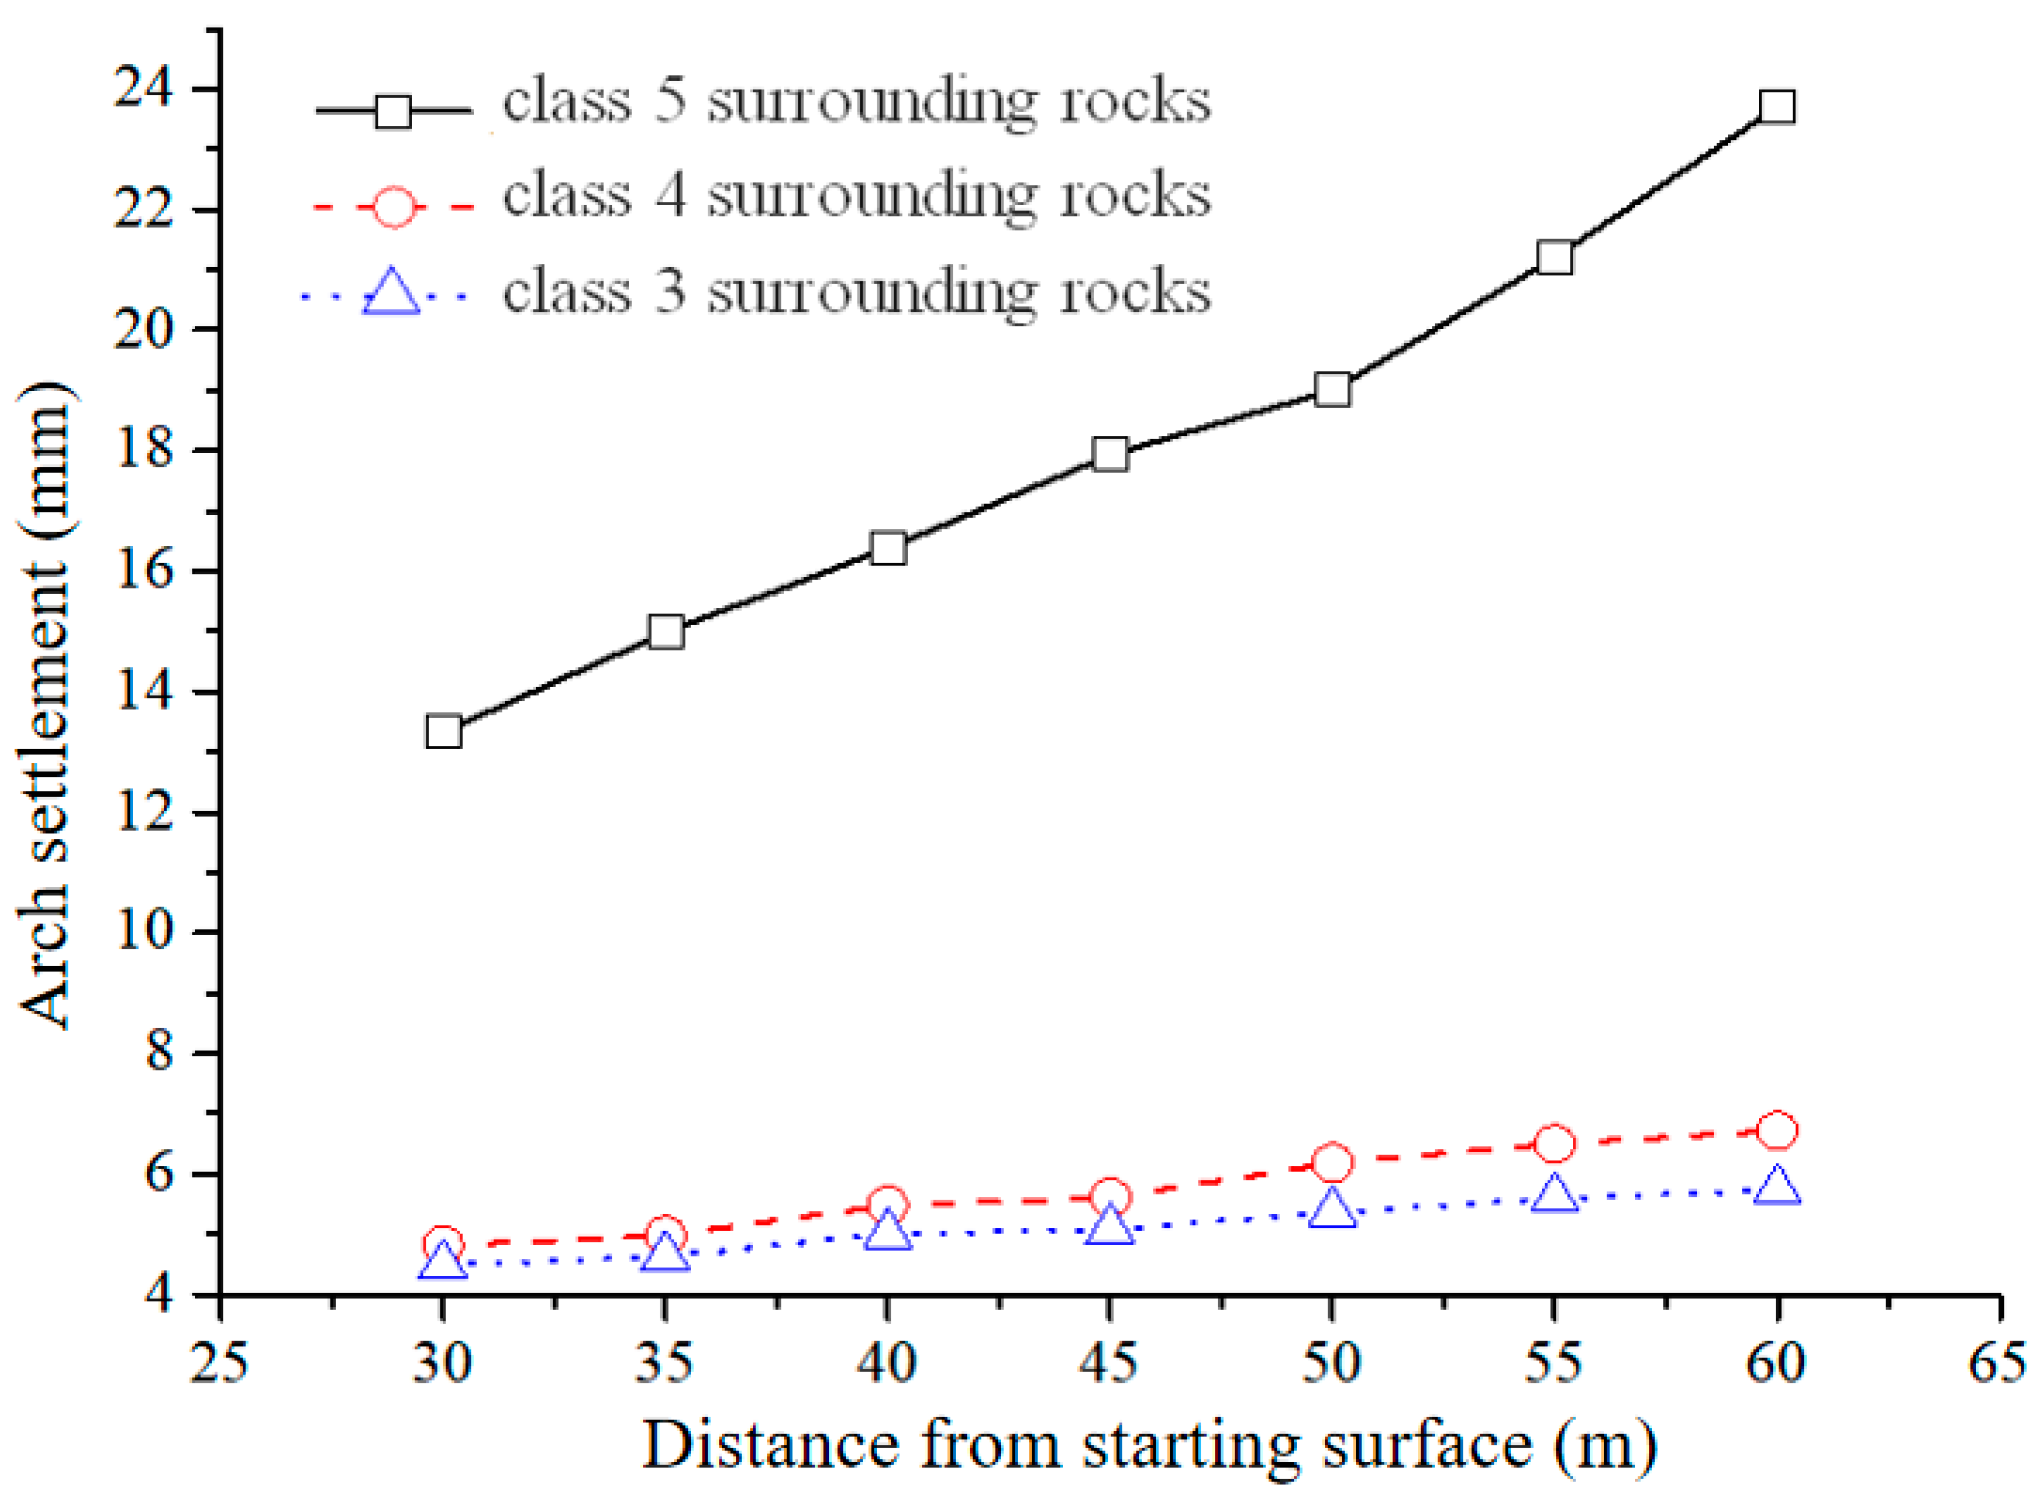
| Closing Distance (m) | Maximum Settlement of Class V Surrounding Rock Arch (mm) | Maximum Settlement of Class IV Surrounding Rock Arch (mm) | Maximum Settlement of Class III Surrounding Rock Arch (mm) |
|---|---|---|---|
| 30 | 13.33 | 4.82 | 4.49 |
| 35 | 14.98 | 4.98 | 4.63 |
| 40 | 16.38 | 5.48 | 5.00 |
| 45 | 17.93 | 5.61 | 5.08 |
| 50 | 21.71 | 6.18 | 5.36 |
| 55 | 23.9 | 6.5 | 5.6 |
| 60 | 25.1 | 6.72 | 5.74 |
Disclaimer/Publisher’s Note: The statements, opinions and data contained in all publications are solely those of the individual author(s) and contributor(s) and not of MDPI and/or the editor(s). MDPI and/or the editor(s) disclaim responsibility for any injury to people or property resulting from any ideas, methods, instructions or products referred to in the content. |
© 2024 by the authors. Licensee MDPI, Basel, Switzerland. This article is an open access article distributed under the terms and conditions of the Creative Commons Attribution (CC BY) license (https://creativecommons.org/licenses/by/4.0/).
Share and Cite
Peng, C.; Qu, Y.; Fu, H.; Xie, C.; Cao, G. Research on Vault Settlement during Three-Step Tunnel Construction Process Based on Sandstone Rheological Experiment. Materials 2024, 17, 4619. https://doi.org/10.3390/ma17184619
Peng C, Qu Y, Fu H, Xie C, Cao G. Research on Vault Settlement during Three-Step Tunnel Construction Process Based on Sandstone Rheological Experiment. Materials. 2024; 17(18):4619. https://doi.org/10.3390/ma17184619
Chicago/Turabian StylePeng, Chang, Yong Qu, Helin Fu, Chengda Xie, and Guiqian Cao. 2024. "Research on Vault Settlement during Three-Step Tunnel Construction Process Based on Sandstone Rheological Experiment" Materials 17, no. 18: 4619. https://doi.org/10.3390/ma17184619
APA StylePeng, C., Qu, Y., Fu, H., Xie, C., & Cao, G. (2024). Research on Vault Settlement during Three-Step Tunnel Construction Process Based on Sandstone Rheological Experiment. Materials, 17(18), 4619. https://doi.org/10.3390/ma17184619