
Performance Study of Asphalt Mixtures Reinforced with Gradated Basalt Fibers of Mixed Lengths

Abstract
1. Introduction
2. Materials and Methods
2.1. Raw Materials
2.1.1. Asphalt
2.1.2. Aggregates
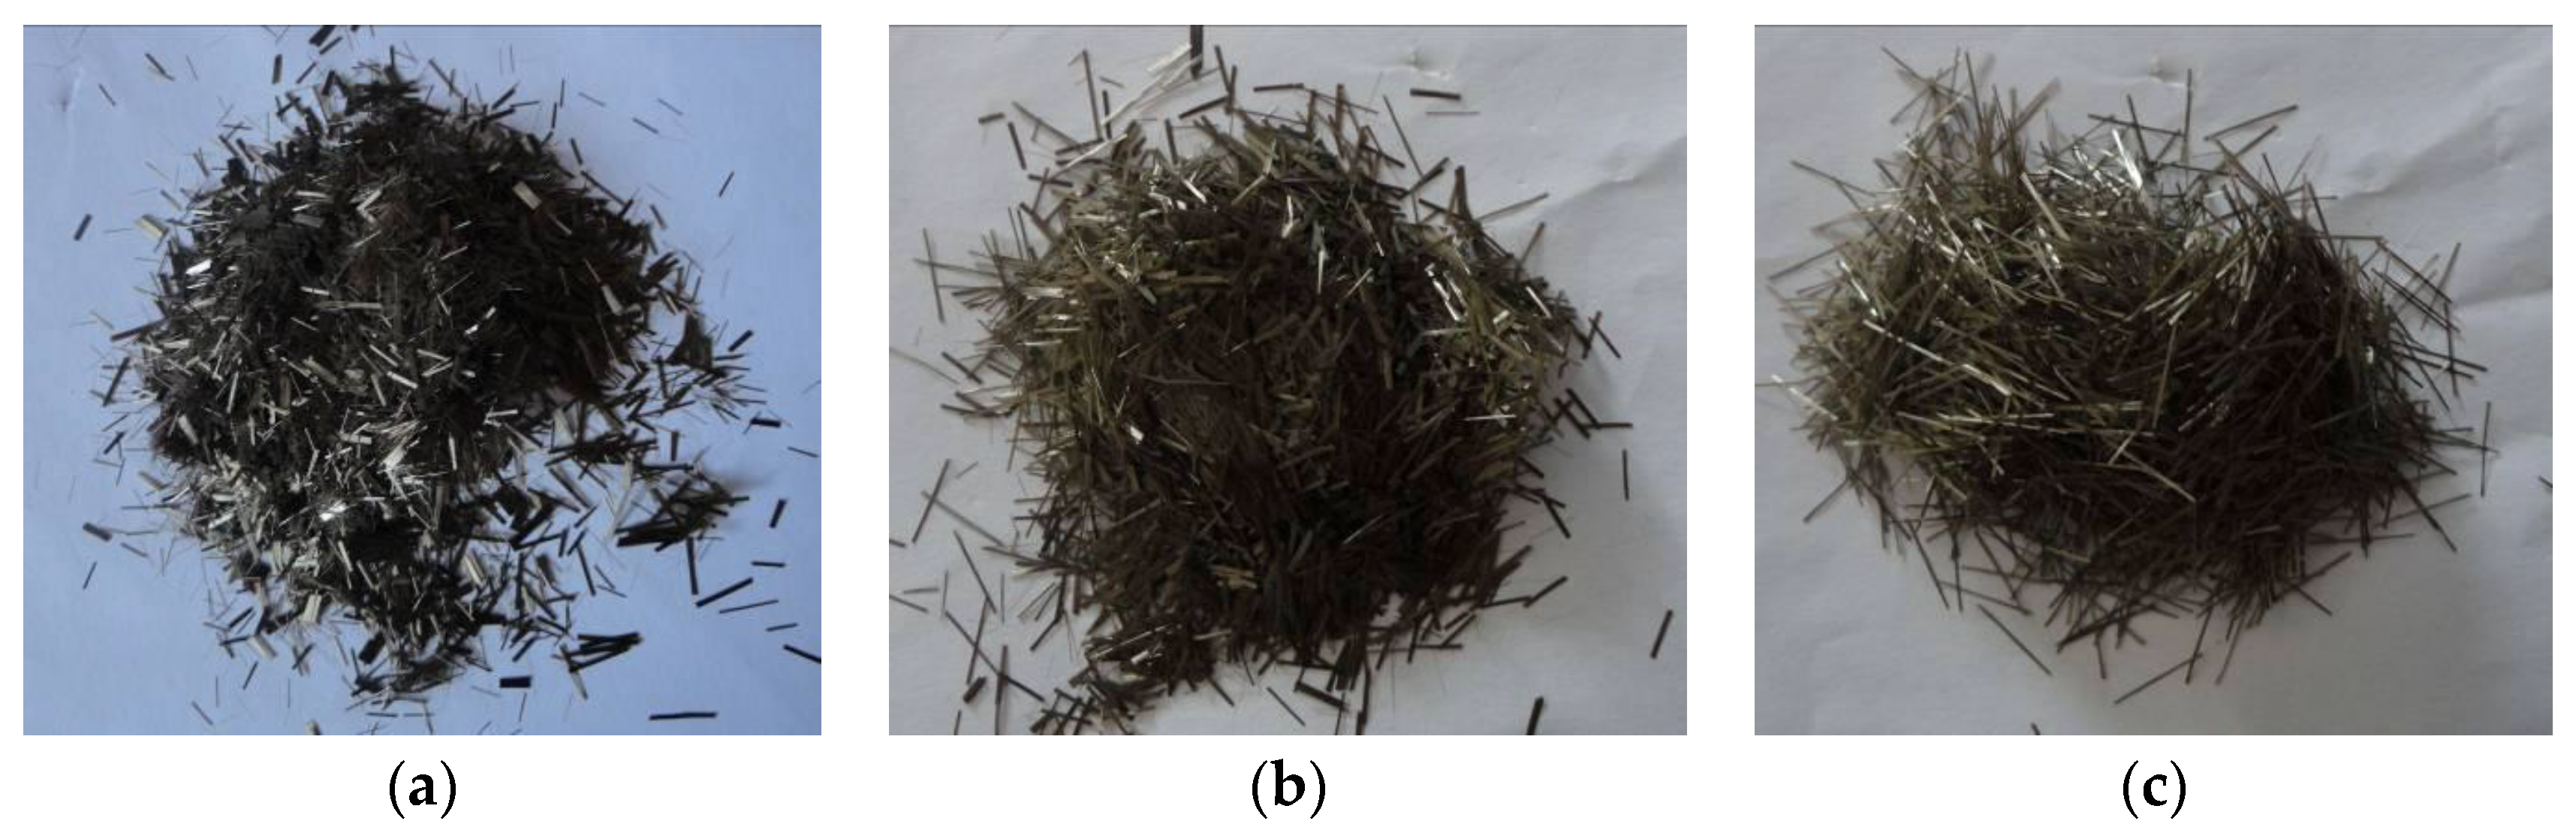
2.1.3. Fibers
2.1.4. Asphalt Mixture Design
2.1.5. Fiber Gradation Scheme Design
2.2. Experimental Methods
2.2.1. Rutting Test
2.2.2. Immersion Marshall Test
2.2.3. Freeze-Thaw Splitting Test
2.2.4. Low-Temperature Splitting Test
2.2.5. Grey Target Decision Method
2.2.6. Statistical Analysis
3. Results and Analysis
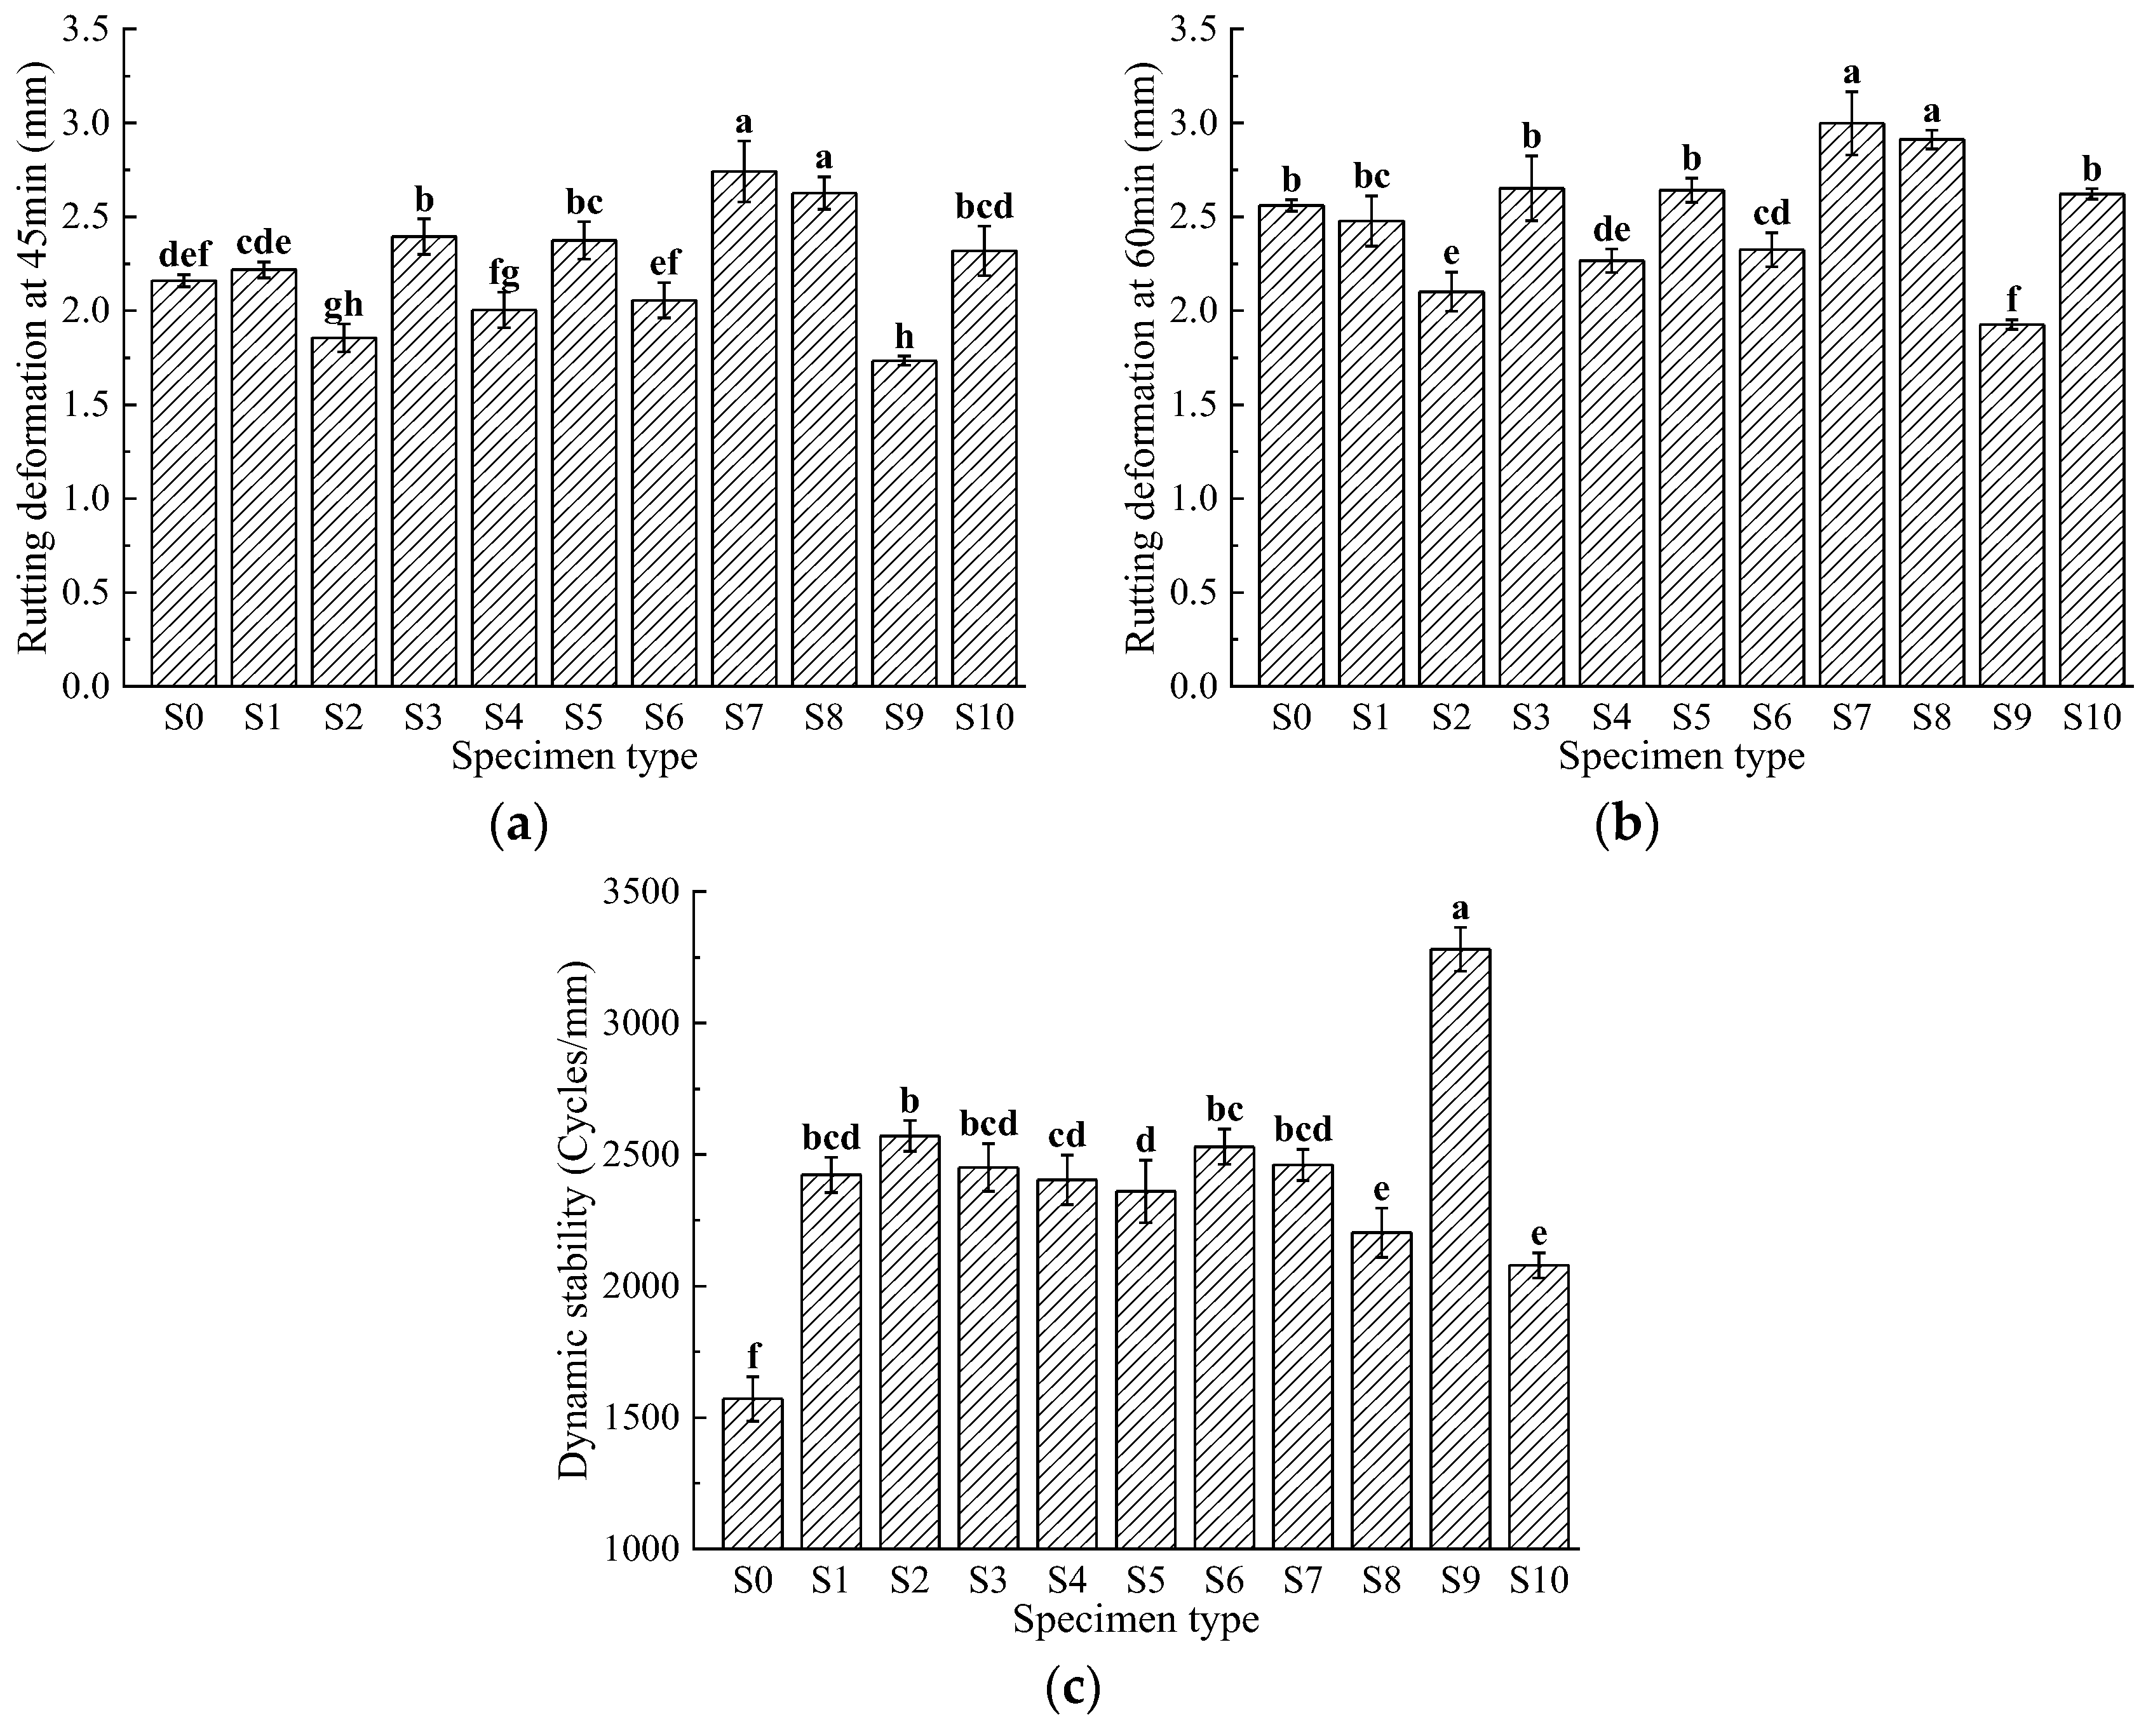
3.1. High-Temperature Stability
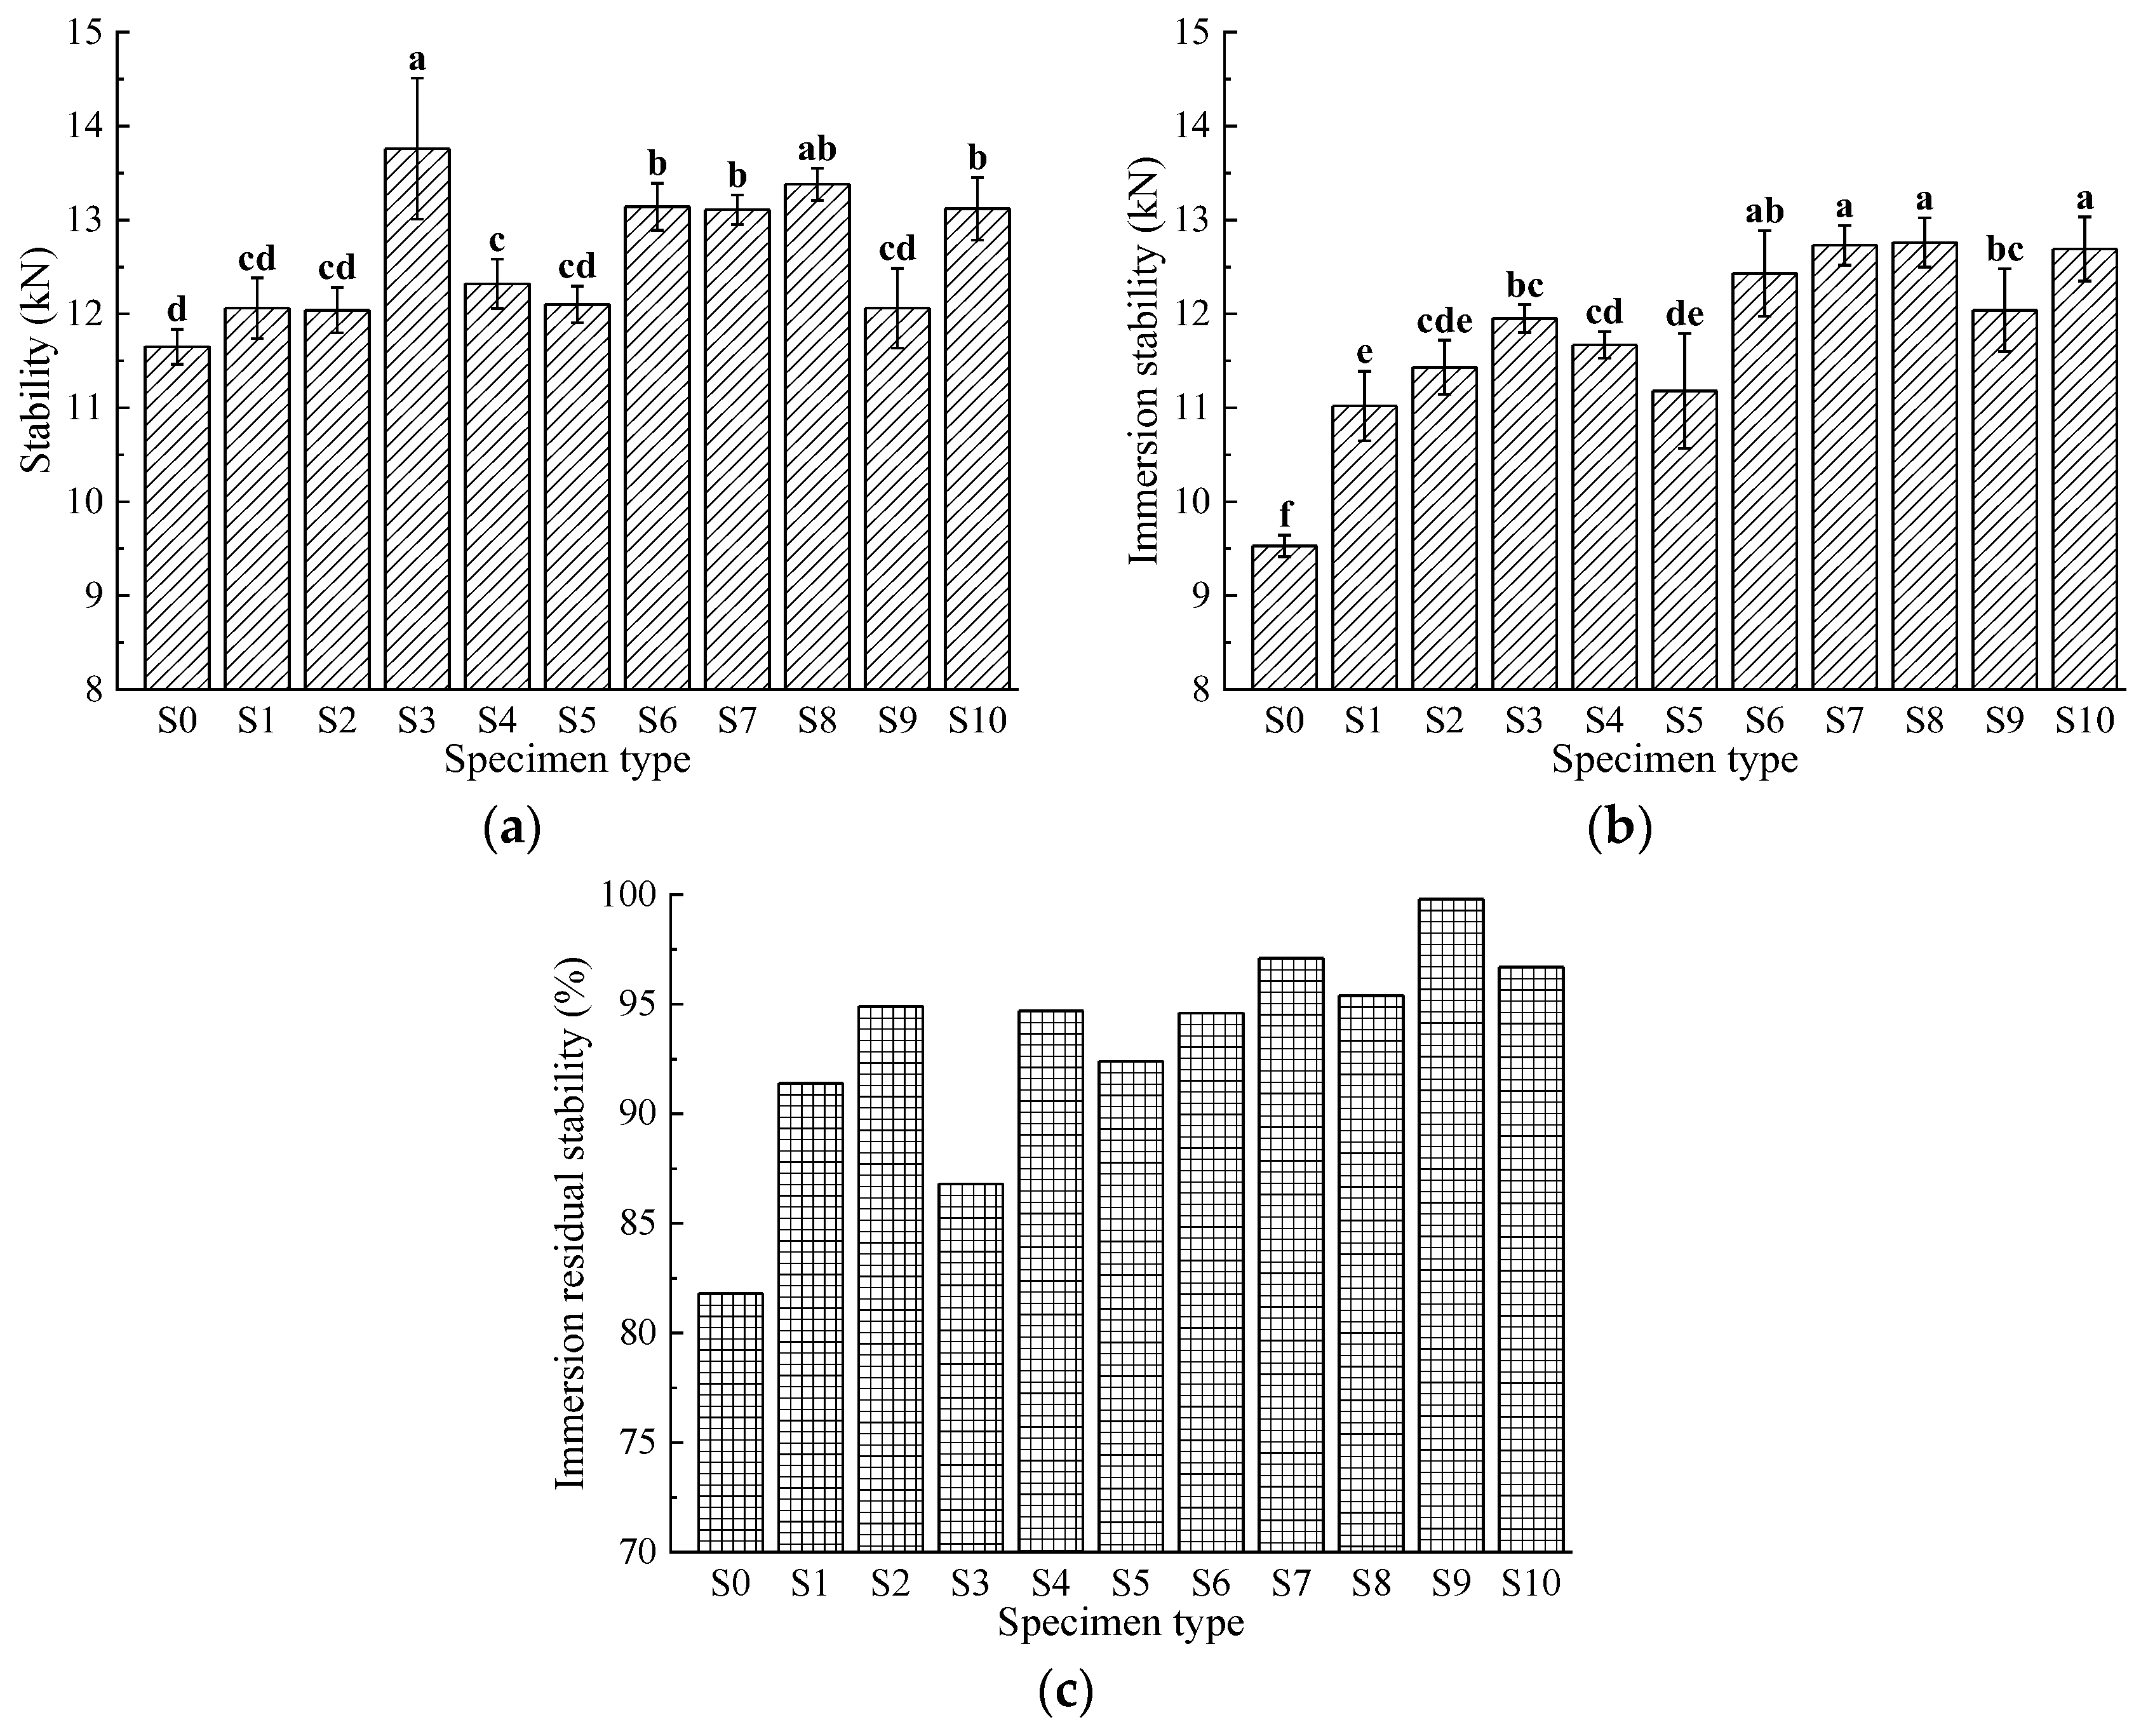
3.2. Moisture Susceptibility
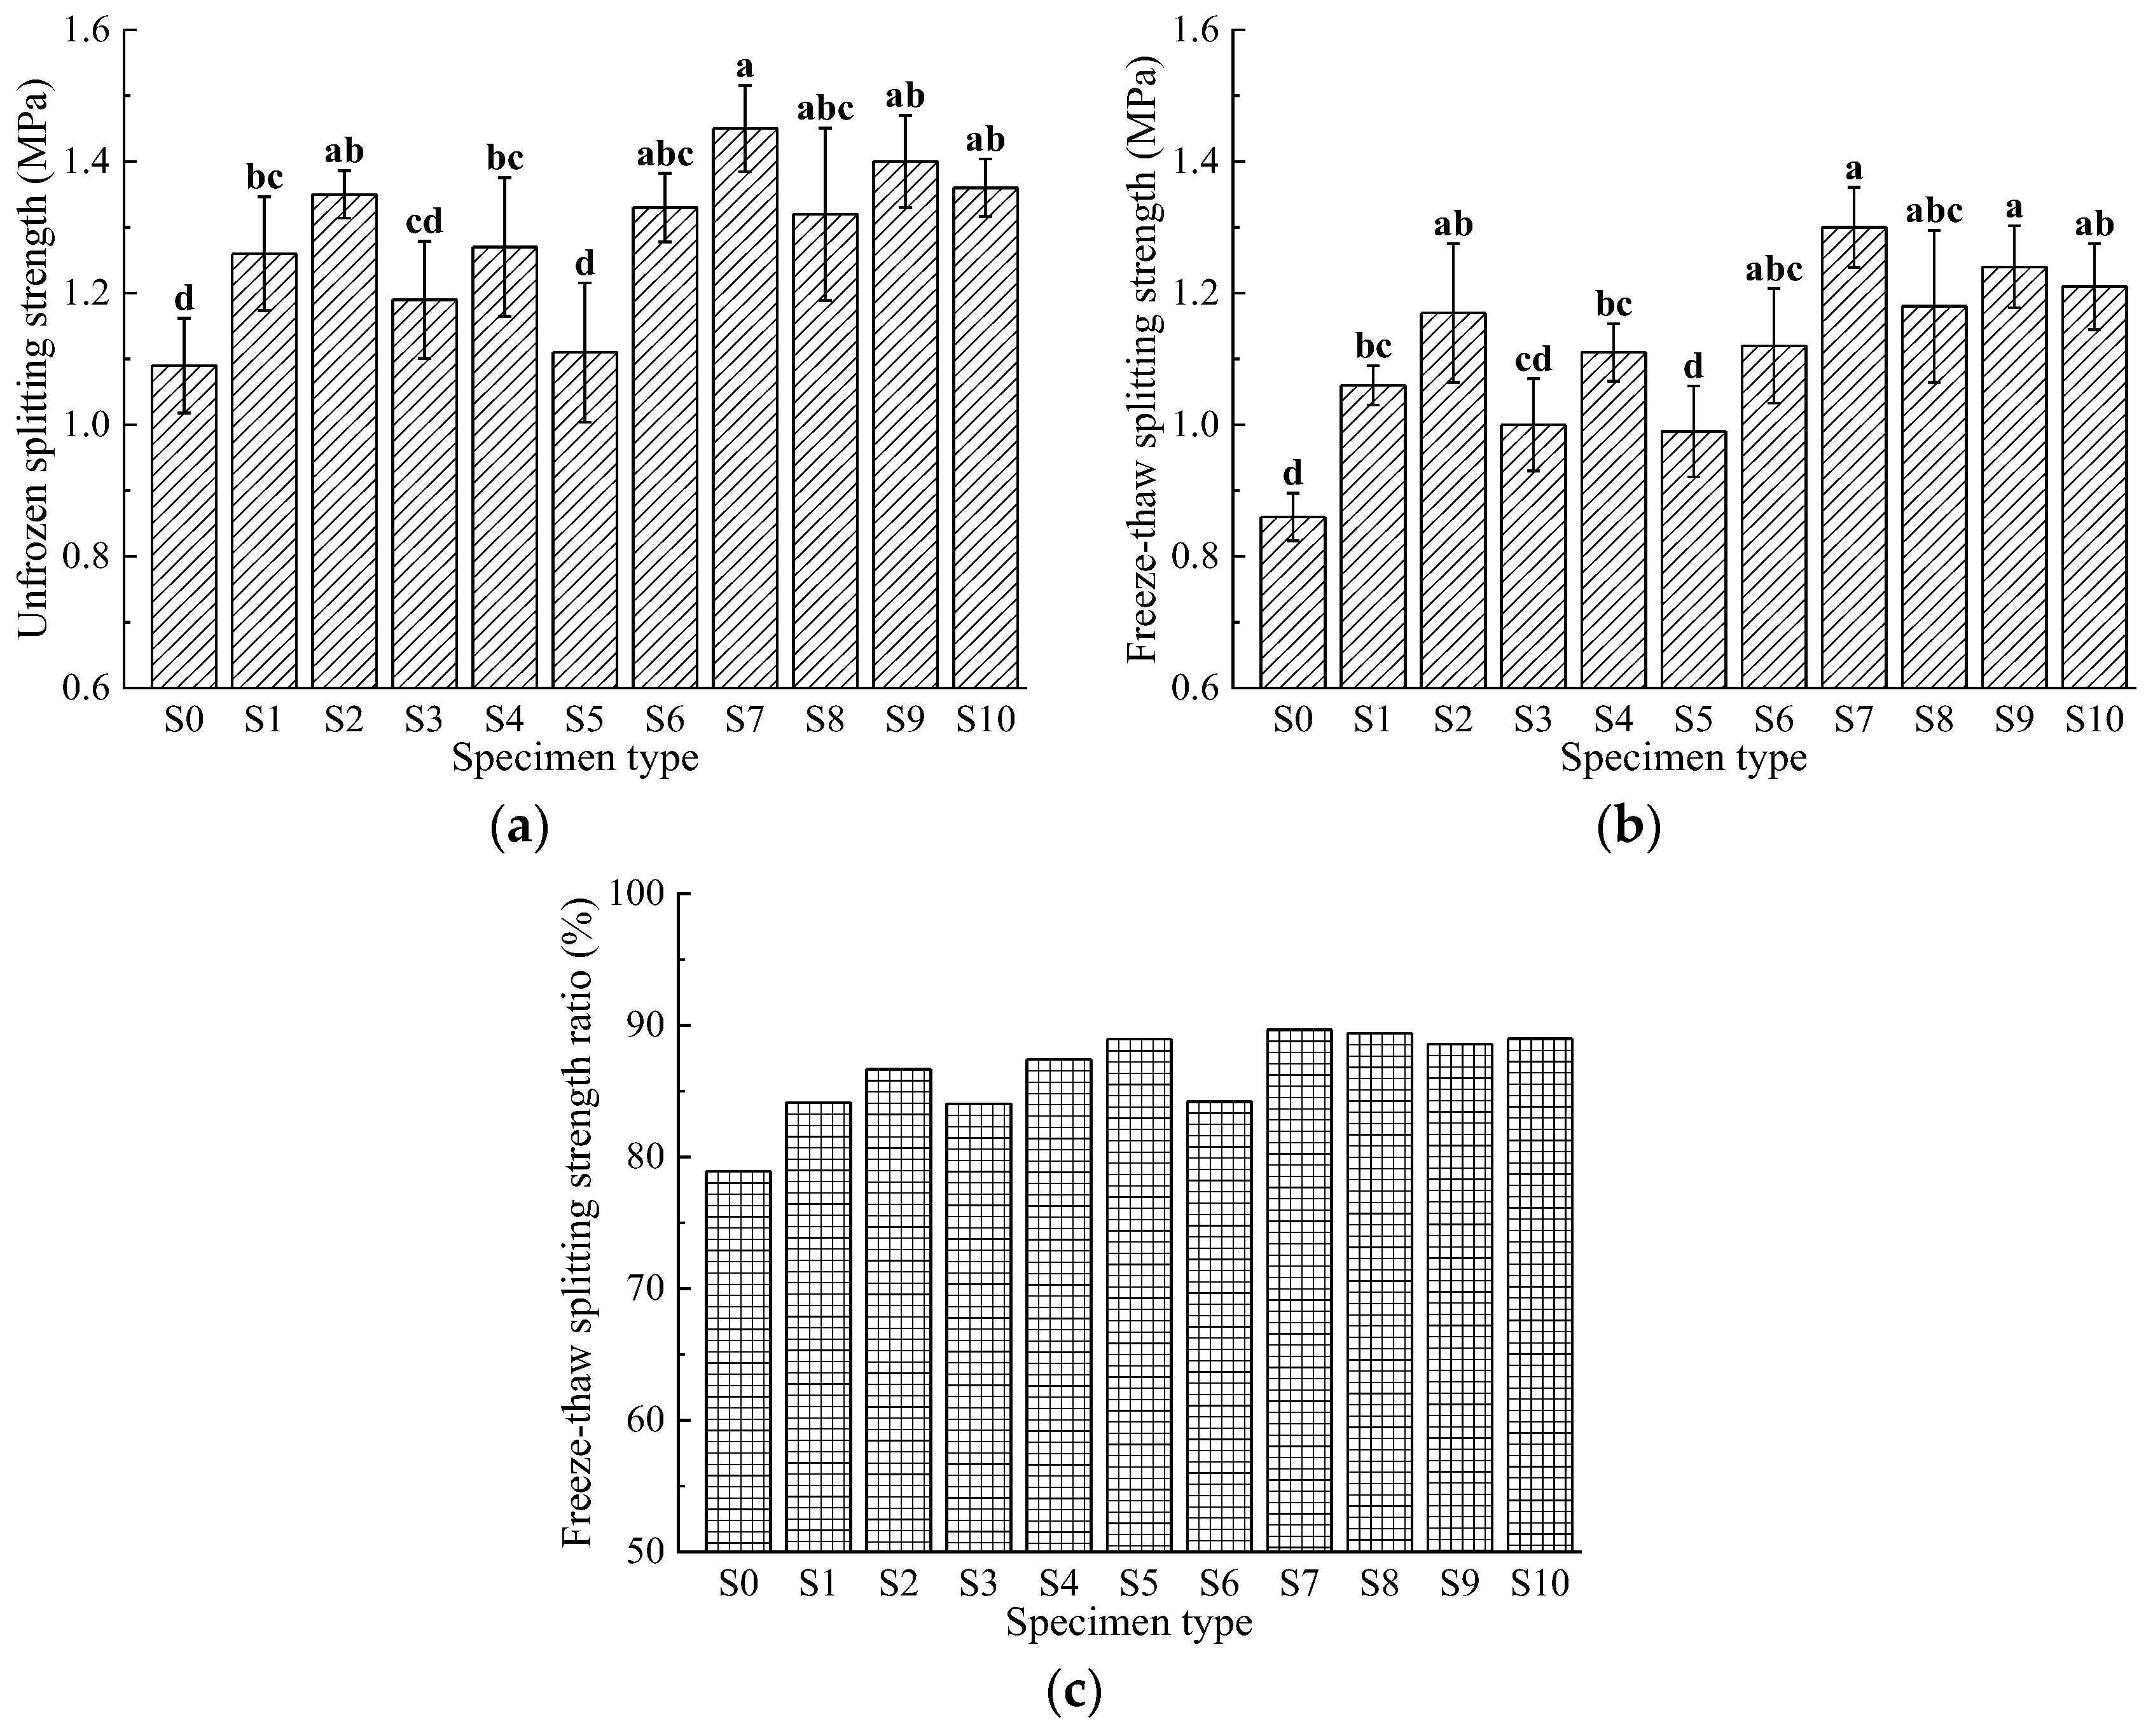
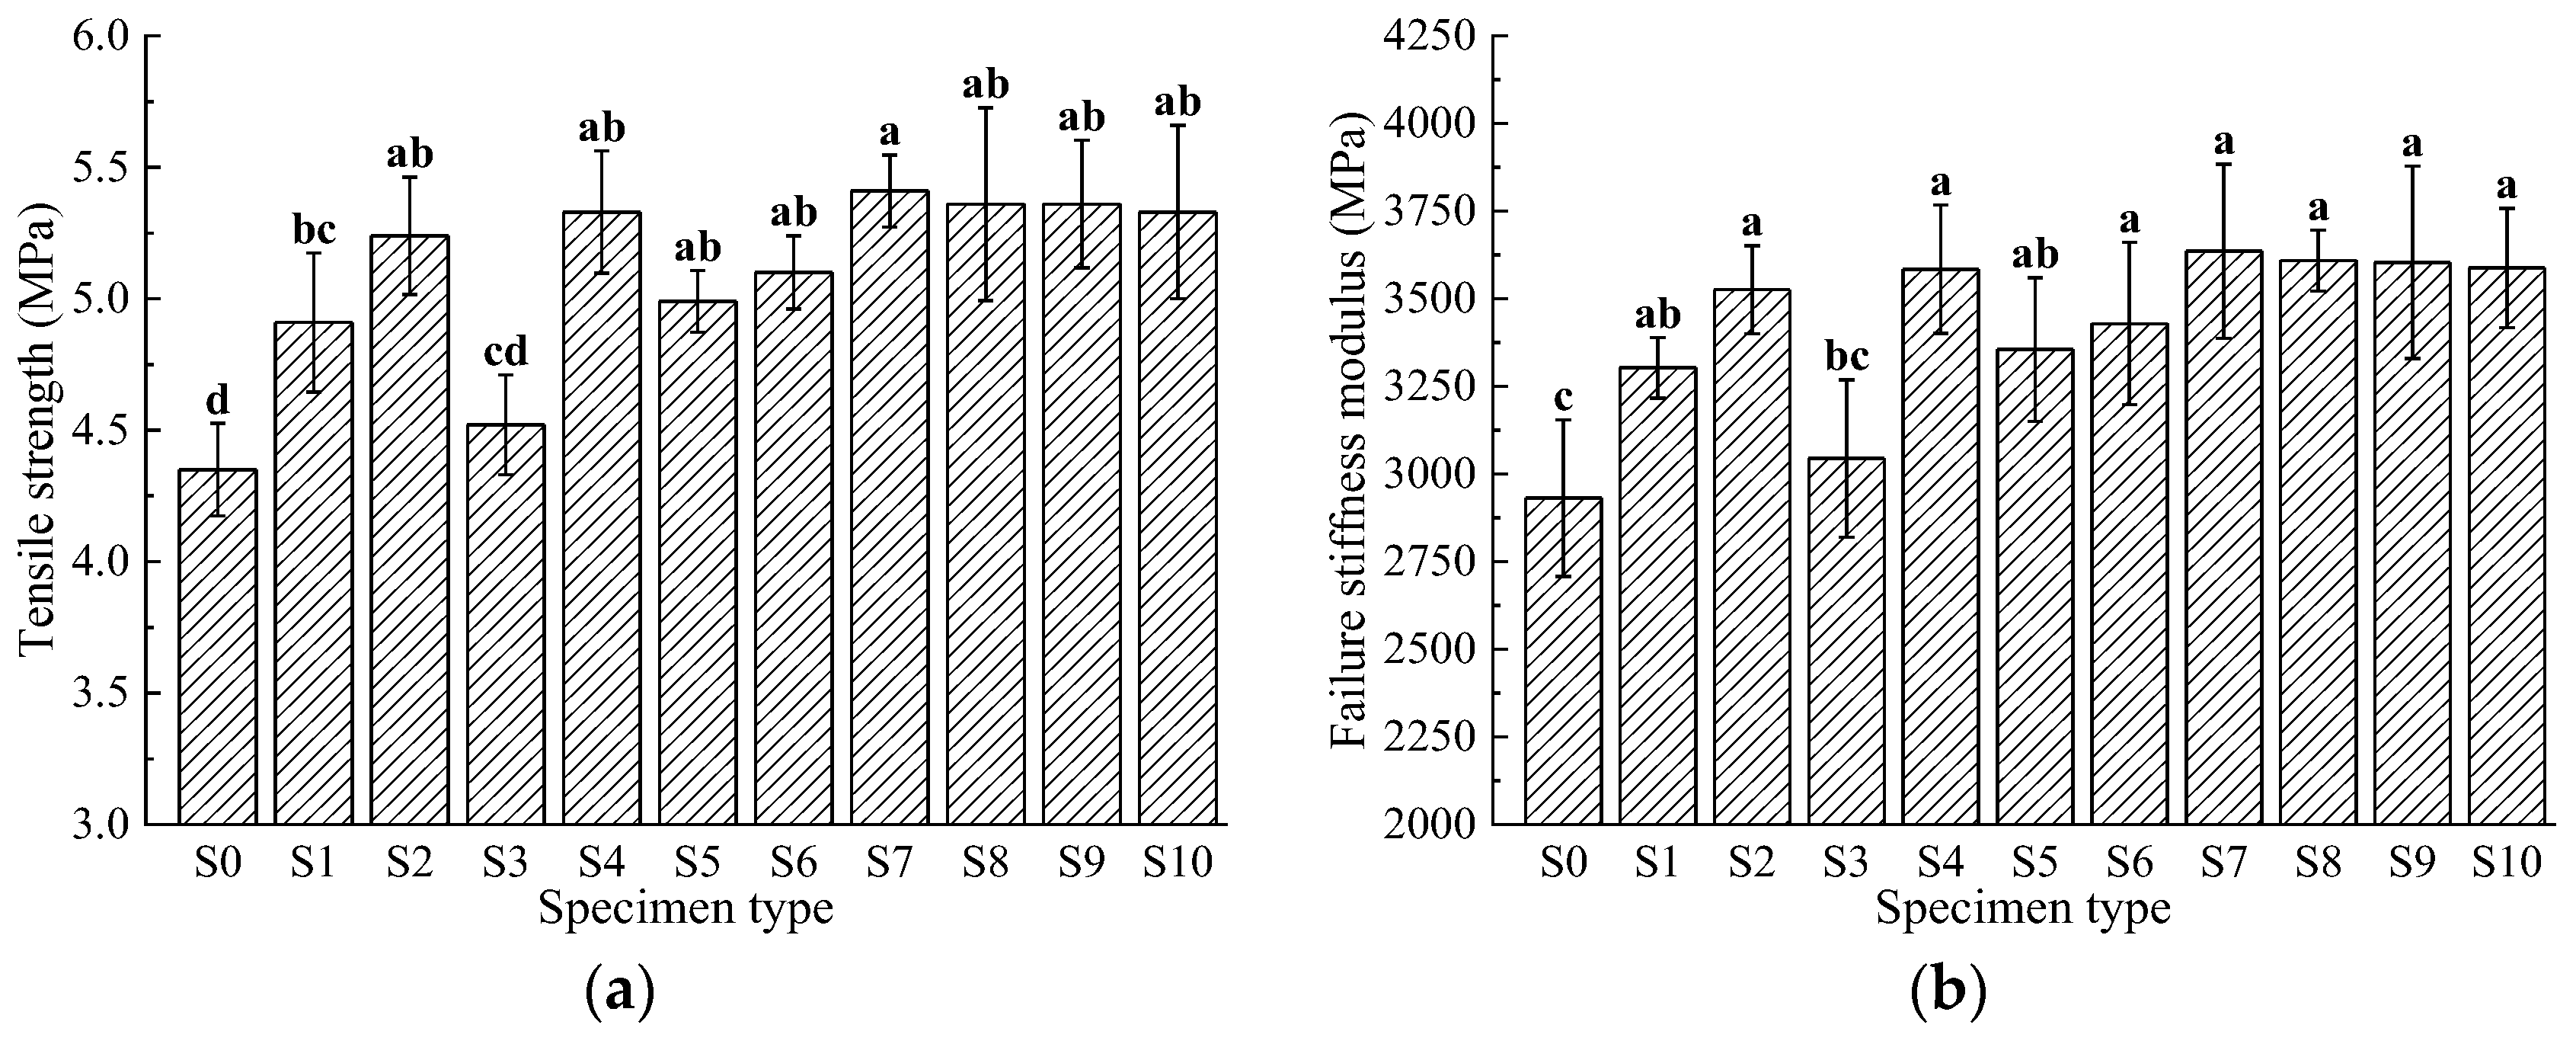
3.3. Low-Temperature Stability
3.4. Optimization of Basalt Fiber Gradation
4. Conclusions
Author Contributions
Funding
Institutional Review Board Statement
Informed Consent Statement
Data Availability Statement
Conflicts of Interest
References
- Saleh, N.F.; Keshavarzi, B.; Rad, F.Y.; Mocelin, D.; Elwardany, M.; Castorena, C.; Underwood, B.S.; Kim, Y.R. Effects of aging on asphalt mixture and pavement performance. Constr. Build. Mater. 2020, 258, 120309. [Google Scholar] [CrossRef]
- Gao, Y.; Hou, K.; Jia, Y.; Wei, Z.; Wang, S.; Li, Z.; Ding, F.; Gong, X. Variability evaluation of gradation for asphalt mixture in asphalt pavement construction. Autom. Constr. 2021, 128, 103742. [Google Scholar] [CrossRef]
- Guo, M.; Liu, H.; Jiao, Y.; Mo, L.; Tan, Y.; Wang, D.; Liang, M. Effect of WMA-RAP technology on pavement performance of asphalt mixture: A state-of-the-art review. J. Clean. Prod. 2020, 266, 121704. [Google Scholar] [CrossRef]
- Gan, Y.; Li, C.; Ke, W.; Deng, Q.; Yu, T. Study on pavement performance of steel slag asphalt mixture based on surface treatment. Case Stud. Constr. Mater. 2022, 16, e01131. [Google Scholar] [CrossRef]
- Chen, Y.; Hossiney, N.; Yang, X.; Wang, H.; You, Z. Application of Epoxy-Asphalt Composite in Asphalt Paving Industry: A Review with Emphasis on Physicochemical Properties and Pavement Performances. Adv. Mater. Sci. Eng. 2021, 2021, 3454029. [Google Scholar] [CrossRef]
- Slebi-Acevedo, C.J.; Lastra-González, P.; Calzada-Pérez, M.A.; Castro-Fresno, D. Effect of synthetic fibers and hydrated lime in porous asphalt mixture using multi-criteria decision-making techniques. Materials 2020, 13, 675. [Google Scholar] [CrossRef]
- Afonso, M.L.; Dinis-Almeida, M.; Fael, C.S. Study of the porous asphalt performance with cellulosic fibers. Constr. Build. Mater. 2017, 135, 104–111. [Google Scholar] [CrossRef]
- Enieb, M.; Diab, A.; Yang, X. Short-and long-term properties of glass fiber reinforced asphalt mixtures. Int. J. Pavement Eng. 2021, 22, 64–76. [Google Scholar] [CrossRef]
- Kou, C.; Wu, X.; Xiao, P.; Liu, Y.; Wu, Z.G. Physical, Rheological, and Morphological Properties of Asphalt Reinforced by Basalt Fiber and Lignin Fiber. Materials 2020, 13, 2520. [Google Scholar] [CrossRef] [PubMed]
- Li, Z.; Shen, A.; Wang, H.; Guo, Y.; Wu, H. Effect of basalt fiber on the low-temperature performance of a bitumen mixture in a heavily frozen area. Constr. Build. Mater. 2020, 10, 1561. [Google Scholar]
- Niu, D.; Su, L.; Luo, Y.; Huang, D.; Luo, D. Experimental study on mechanical properties and durability of basalt fiber reinforced coral aggregate concrete. Constr. Build. Mater. 2020, 237, 117628. [Google Scholar] [CrossRef]
- Adepu, R.; Ramayya, V.; Mamatha, A.; Ram, V. Fracture studies on basalt fiber reinforced asphalt mixtures with reclaimed asphalt pavement derived aggregates and warm mix additives. Constr. Build. Mater. 2023, 386, 131548. [Google Scholar] [CrossRef]
- Cheng, Y.; Li, L.; Zhou, P.; Zhang, Y.; Liu, H. Multi-Objective Optimization Design and Test of Compound Diatomite and Basalt Fiber Asphalt Mixture. Materials 2019, 12, 1461. [Google Scholar] [CrossRef]
- Cheng, Y.; Wang, W.; Gong, Y.; Wang, S.; Yang, S.; Sun, X. Comparative Study on the Damage Characteristics of Asphalt Mixtures Reinforced with an Eco-Friendly Basalt Fiber under Freeze-thaw Cycles. Materials 2018, 11, 2488. [Google Scholar] [CrossRef]
- Jiu, X.; Wang, Y.; Wu, Z.; Xiao, P.; Kang, A. High-Temperature Performance Evaluation of Asphalt Mixtures by Adding Short-Chopped Basalt Fiber. Buildings 2023, 13, 370. [Google Scholar] [CrossRef]
- Lou, K.; Wu, X.; Xiao, P.; Kang, A.; Wu, Z.; Xia, Y. Comprehensive Study about Effect of Basalt Fiber, Gradation, Nominal Maximum Aggregate Size and Asphalt on the Anti-Cracking Ability of Asphalt Mixtures. Appl. Sci. 2021, 11, 2289. [Google Scholar] [CrossRef]
- Wang, X.; Sun, K.; Shao, J.; Ma, J. Fracture properties of graded basalt fiber reinforced concrete: Experimental study and Mori-Tanaka method application. Constr. Build. Mater. 2023, 398, 132510. [Google Scholar] [CrossRef]
- Wu, B.; Meng, W.; Xia, J.; Xiao, P. Influence of Basalt Fibers on the Crack Resistance of Asphalt Mixtures and Mechanism Analysis. Materials 2022, 15, 744. [Google Scholar] [CrossRef]
- Lou, K.; Wu, X.; Xiao, P.; Zhang, C. Investigation on Fatigue Performance of Asphalt Mixture Reinforced by Basalt Fiber. Materials 2021, 14, 5596. [Google Scholar] [CrossRef] [PubMed]
- Zhu, C.; Luo, H.; Tian, W.; Teng, B.; Qian, Y.; Ai, H.; Xiao, B. Investigation on Fatigue Performance of Diatomite/Basalt Fiber Composite Modified Asphalt Mixture. Polymers 2022, 14, 414. [Google Scholar] [CrossRef]
- Zhao, H.; Guan, B.; Xiong, R.; Zhang, A. Investigation of the Performance of Basalt Fiber Reinforced Asphalt Mixture. Appl. Sci. 2020, 10, 1561. [Google Scholar] [CrossRef]
- Cetin, A.; Evirgen, B.; Karslioglu, A.; Tuncan, A. The effect of basalt fiber on the performance of stone mastic asphalt. Period. Polytech. Civ. Eng. 2021, 65, 299. [Google Scholar] [CrossRef]
- Lou, K.; Xiao, P.; Kang, A.; Wu, Z.; Li, B.; Lu, P. Performance evaluation and adaptability optimization of hot mix asphalt reinforced by mixed lengths basalt fibers. Constr. Build. Mater. 2021, 292, 123373. [Google Scholar] [CrossRef]
- Xue, Y.; Qian, Z. Development and performance evaluation of epoxy asphalt concrete modified with mineral fiber. Constr. Build. Mater. 2016, 102, 378–383. [Google Scholar] [CrossRef]
- Zhang, Y.; Sang, T.; Kang, A.; Wang, B.; Wu, X.; Zhao, Y. Investigation of fiber length distribution on crack resistance mechanism of basalt fiber asphalt mixture based on digital image processing technology. Constr. Build. Mater. 2023, 401, 132753. [Google Scholar] [CrossRef]
- Zhang, X.; Gu, X.; Lv, J.; Zou, X. 3D numerical model to investigate the rheological properties of basalt fiber reinforced asphalt-like materials. Constr. Build. Mater. 2017, 138, 185–194. [Google Scholar] [CrossRef]
- Pirmohammad, S.; Amani, B.; Shokorlou, Y.M. The effect of basalt fibres on fracture toughness of asphalt mixture. Fatigue Fract. Eng. Mater. Struct. 2020, 43, 1446–1460. [Google Scholar] [CrossRef]
- Xie, T.; Wang, L. Optimize the design by evaluating the performance of asphalt mastic reinforced with different basalt fiber lengths and contents. Constr. Build. Mater. 2023, 363, 129698. [Google Scholar] [CrossRef]
- Wang, W.; Cheng, Y.; Tan, G. Design Optimization of SBS-Modified Asphalt Mixture Reinforced with Eco-Friendly Basalt Fiber Based on Response Surface Methodology. Materials 2018, 11, 1311. [Google Scholar] [CrossRef]
- Xu, J.; Liu, M.; Kang, A.; Wu, Z.; Kou, C.; Zhang, Y.; Xiao, P. Effect of fiber characteristic parameters on the synergistic action and mechanism of basalt fiber asphalt mortar. Constr. Build. Mater. 2024, 438, 137234. [Google Scholar] [CrossRef]
- Guo, F.; Li, R.; Lu, S.; Bi, Y.; He, H. Evaluation of the Effect of Fiber Type, Length, and Content on Asphalt Properties and Asphalt Mixture Performance. Materials 2020, 13, 1556. [Google Scholar] [CrossRef] [PubMed]
- Qiu, Y.; An, S.; Rahman, A.; Ai, C. Evaluation and optimization of bridge deck waterproof bonding system using multi-objective grey target decision method. Road Mater. Pavement Des. 2019, 21, 1844–1858. [Google Scholar] [CrossRef]
- Chen, Q.; Wang, C.; Wen, P.; Sun, X.; Guo, T. Performance evaluation of tourmaline modified asphalt mixture based on grey target decision method. Constr. Build. Mater. 2019, 205, 137–147. [Google Scholar] [CrossRef]
- Wang, B.; Kang, A.; Wu, X.; Wu, X.; Kong, H.; Wang, Y. Length Gradation Design of Basalt Fiber Asphalt Mixture. J. Henan Univ. Sci. Technol. (Nat. Sci.) 2022, 43, 63–70. [Google Scholar]
- Li, H.; Si, J.; Jia, W.; Fu, L.; Li, Q.; Yang, S.; Zhang, M. Multi-objective Weighted Grey Target Decision-making of Asphalt Pavement Pre-maintenance Scheme Based on Three-level Maintenance Standard. J. Beijing Univ. Technol. 2024, 50, 591–599. [Google Scholar]
- Zhu, Q.; Zhang, E.; Li, Q.; Ma, S.; Zhang, Z. Risk Assessment Theory of the Coal and Gas Outbursts and Its Application to the Entropy Weight and Grey Target Decision Methods. J. Saf. Environ. 2020, 20, 1205–1212. [Google Scholar]
- JTG E20-2011; Standard Test Methods of Bitumen and Bituminous Mixtures for Highway Engineering. Ministry of Transport: Beijing, China, 1 December 2011. (In Chinese)
- JTG F40-2004; Technical Specifications for Construction of Highway Asphalt Pavements. Ministry of Transport: Beijing, China, 4 September 2004. (In Chinese)
- Hao, M.; Guo, J.; Tian, W.; Li, W. Research on Natural Mineral Fiber Improving Asphalt Mixture Performance. Chin. Foreign Road 2014, 39, 285–289. [Google Scholar]


| Properties | Requirements | Values |
|---|---|---|
| Penetration (25 °C, 5 s, 0.1 mm) | 60–80 | 67 |
| Ductility (15 °C, cm) | ≥40 | 1355 |
| Softening Point/°C | ≥44 | 46.2 |
| Density (g/cm3) | 1.033 |
| Aggregate | Properties | Requirements | Values |
|---|---|---|---|
| Coarse Aggregate | Apparent Relative Density | ≥2.60 | 2.74 |
| Dry Relative Density | 2.71 | ||
| Absolute Volume Relative Density | 2.70 | ||
| Water Absorption Rate (%) | ≤2.0 | 0.5 | |
| Los Angeles Abrasion (%) | ≤28 | 25.5 | |
| Crushing Value/% | ≤26 | 24.4 | |
| Needle-Plate Particle Content (%) | ≤15 | 7 | |
| Fine Aggregate | Apparent Relative Density | ≥2.50 | 2.70 |
| Dry Relative Density | 2.71 | ||
| Absolute Volume Relative Density | 2.70 | ||
| Water Absorption (%) | ≤2.0 | 0.5 |
| Properties | Requirements | Values |
|---|---|---|
| Apparent Density (g/cm3) | ≥2.50 | 2.65 |
| Appearance | No clumping | |
| Water Absorption | ≦1 | 0.2 |
| Properties | Requirements | Values |
|---|---|---|
| Tensile Strength (MPa) | ≥1200 | 2130 |
| Elastic Modulus (GPa) | ≥80 | 108 |
| Elongation at Break (%) | 2.4~3.1 | 2.68 |
| Moisture Content (%) | ≤0.2 | 0.035 |
| Oil Absorption (%) | ≥50 | 58 |
| Length/mm | Fiber Content/% | ||||||||||
|---|---|---|---|---|---|---|---|---|---|---|---|
| S0 | S1 | S2 | S3 | S4 | S5 | S6 | S7 | S8 | S9 | S10 | |
| 6 | 0 | 100 | 0 | 0 | 50 | 50 | 0 | 40 | 50 | 30 | 30 |
| 9 | 0 | 0 | 100 | 0 | 50 | 0 | 50 | 50 | 30 | 40 | 30 |
| 12 | 0 | 0 | 0 | 100 | 0 | 50 | 50 | 10 | 20 | 30 | 40 |
| Scheme | S0 | S1 | S2 | S3 | S4 | S5 | S6 | S7 | S8 | S9 | S10 |
|---|---|---|---|---|---|---|---|---|---|---|---|
| Target center distances | 0.27 | 0.17 | 0.13 | 0.18 | 0.13 | 0.20 | 0.11 | 0.16 | 0.15 | 0.11 | 0.12 |
Disclaimer/Publisher’s Note: The statements, opinions and data contained in all publications are solely those of the individual author(s) and contributor(s) and not of MDPI and/or the editor(s). MDPI and/or the editor(s) disclaim responsibility for any injury to people or property resulting from any ideas, methods, instructions or products referred to in the content. |
© 2024 by the authors. Licensee MDPI, Basel, Switzerland. This article is an open access article distributed under the terms and conditions of the Creative Commons Attribution (CC BY) license (https://creativecommons.org/licenses/by/4.0/).
Share and Cite
Ji, X.; Yuan, Y.; Huang, Y.; Shao, J.; Li, S. Performance Study of Asphalt Mixtures Reinforced with Gradated Basalt Fibers of Mixed Lengths. Materials 2024, 17, 4706. https://doi.org/10.3390/ma17194706
Ji X, Yuan Y, Huang Y, Shao J, Li S. Performance Study of Asphalt Mixtures Reinforced with Gradated Basalt Fibers of Mixed Lengths. Materials. 2024; 17(19):4706. https://doi.org/10.3390/ma17194706
Chicago/Turabian StyleJi, Xiaoxiang, Yuqing Yuan, Yunjun Huang, Jinggan Shao, and Sihao Li. 2024. "Performance Study of Asphalt Mixtures Reinforced with Gradated Basalt Fibers of Mixed Lengths" Materials 17, no. 19: 4706. https://doi.org/10.3390/ma17194706
APA StyleJi, X., Yuan, Y., Huang, Y., Shao, J., & Li, S. (2024). Performance Study of Asphalt Mixtures Reinforced with Gradated Basalt Fibers of Mixed Lengths. Materials, 17(19), 4706. https://doi.org/10.3390/ma17194706