Article

Characterization and Growth Kinetics of Borides Layers on Near-Alpha Titanium Alloys

1
School of Mechanical and Electrical Engineering, Anhui University of Science and Technology, Huainan 232001, China
2
Anhui Intelligent Mine Technology and Equipment Engineering Research Center, Huainan 232001, China
3
School of Materials Science and Engineering, Anhui University of Science and Technology, Huainan 232001, China
*
Author to whom correspondence should be addressed.
Materials 2024, 17(19), 4815; https://doi.org/10.3390/ma17194815
Submission received: 8 September 2024 / Revised: 26 September 2024 / Accepted: 27 September 2024 / Published: 30 September 2024

Abstract

:
Pack boriding with CeO2 was performed on the powder metallurgical (PM) near-α type titanium alloy at a temperature of 1273–1373 K for 5–15 h followed by air cooling. The microstructure analysis showed that the boride layer on the surface of the alloy was mainly composed of a monolithic TiB2 outer layer, inner whisker TiB and sub-micron sized flake-like TiB layer. The growth kinetics of the TiB2 and TiB layers obeyed the parabolic diffusion model. The diffusion coefficient of boron in the boride layers obtained in the present study was well within the ranges reported in the literature. The activation energies of boron in the TiB2 and TiB layers during the pack boriding were estimated to be 166.4 kJ/mol and 122.8 kJ/mol, respectively. Friction tests showed that alloys borided at moderate temperatures and times had lower friction coefficients, which may have been due to the fine grain strengthening effect of TiB whiskers. The alloy borided at 1273 K for 10 h had a minimum friction coefficient of 0.73.

1. Introduction

Near-alpha titanium alloys containing major alloying elements of Al–Zr(–Sn) are widely used in aircraft engine components, aircraft partitions frames and ribbed panels due to their excellent high-temperature creep resistance, good thermal stability, high strength to weight ratio and good corrosion resistance [1,2]. However, like most titanium alloys, it has extremely poor tribological properties by low surface hardness and poor wear resistance, which limits its wider application in wear-resistant parts such as certain mechanical structures, transmission gears, bearings and brakes [3,4,5,6].
Boriding, as a thermochemical surface treatment method, is an effective way to improve the wear resistance of titanium and its alloys by forming a harder boride layer on the surface [7,8,9]. Boriding treatment can be conducted by various methods, including pack boriding [7,10], plasma assisted boriding [11], paste boriding [10], ion boriding [11], laser boriding [12], etc. Among them, pack boriding not only meets the requirements of improving hardness and wear resistance, but also has the advantages of a simple process and equipment, convenient operation and simplified workpiece cleaning [13,14].
During the boriding process, the diffusion of boron into the substrate determines the growth rate of hard dual TiB2 and TiB layers [15], depending on processing parameters such as the boriding temperature and boriding time. By developing a growth kinetic model, the nature of growth of titanium borides on the surface of Ti alloy can be explored. Previously, a few studies of growth kinetic model have been reported in the pack boriding process. Li et al. [16] studied the growth kinetics of titanium boride layers on the surface of Ti–6Al–4V (TC4) using the diffusion model d 2 = D t , where the square of the boride layer thickness was directly proportional to the boriding time. By analyzing the growth kinetics of the total thickness of the boride layer, the diffusivities of boron at 1273–1373 K was determined as the order of magnitude 10−15 m2/s, and the average diffusion activation energy of boron atom in Ti-6Al-4V alloy was 65.2 kJ/mol. Li et al. [13] used the diffusion model d = k t 0.5 to study the growth kinetics of boride layer thickness in Ti–5Mo–5V–8Cr–3Al (TB2) alloy. This model was based on solving the mass balance equations at two (TiB2/TiB and TiB/Ti) interfaces by considering the parabolic growth constants. By comparing the two models of d = k t 0.5 and d 2 = D t , they concluded that the diffusion model of d = k t 0.5 was found to predict the thickness of boride layer more accurately. Similarly, Liu et al. [17] suggested that the growth kinetics of boride layers in Ti−5Mo−5V−8Cr−3Al (TB2) alloy during pack boriding with REs catalyst conformed to the parabolic diffusion model of d = k t 0.5 instead of d 2 = D t . Sarma et al. [18] studied the kinetics of growth of boride layers during pack boriding of Cp-Ti, developed the parabolic model by considering error function solution and concluded that the growth of TiB2 as well as that of the total (TiB2 + TiB) layer was obeyed the parabolic kinetics. Recently, Xing et al. [19] investigated the growth kinetics of boride layers of Ti−5Al−2.5Sn (TA7) alloy using both models of d = k t 0.5 and d 2 = D t and suggested that the diffusion model of d 2 = D t was more accurate in predicting the thickness of boride layer compared to the parabolic model. Ouyang et al. [3] predicted the growth kinetics of boride layers of near-α Ti−6Al−2Zr−1Mo−1V (TA15) alloy by establishing a parabolic diffusion model d = k t 0.5 , and their model predictions presented satisfactory consistency with the experimental data. At present, there are two main diffusion models used in investigating the growth kinetics of boride layers of different Ti alloys. Although these models’ predictions show reasonable agreement to experimental data, limited studies have been performed on the growth kinetics of boride layers during pack boriding of near-α Ti alloys.
This work aimed to investigate the growth kinetics of boride layers in the near-α Ti alloys during the pack boriding process. For this purpose, the characterization of the boride layers on the surface of the alloy was studied. The growth kinetics model was established based on the parabolic growth law together with the mass balance equation, and a series of comparisons were made between the estimated diffusion coefficients and activation energy data and the reported data. Additionally, the wear property of near-α Ti alloys after pack boriding process was also discussed.

2. Experimental Procedure

The alloy used in this study were prepared by powder metallurgy using vacuum sintering and a hot isostatic pressing processes [20]. The nominal chemical composition of the alloy is given in Table 1. The alloy was cut into the samples with sizes of 15 mm × 10 mm × 3 mm by a wire-cutting machine. The samples were ground using emery paper and polished with diamond polishing paste to an average roughness of Ra ≤ 0.4 μm (Figure 1), and then ultrasonic cleaning was carried out in acetone.
Before the solid-state boriding heat treatment, boriding agent was made by mixing 94wt% B4C (as the boron source) and 6wt% CeO2 (as the catalyst) with particle size ≤ 200 mesh. Then, the samples were sealed in a corundum crucible (Changsha Dongyan Advanced Materials Co., LTD., Changsha, China) with a lid by tightly packing the boronizing agent powder around the sample. The boriding temperature was chosen in the range of 1273–1373 K near the α/β transition temperature (Tβ = 1293 K [20]), which is generally considered to have good boriding effects [18]. Thus, the rare-earth-catalyzed boriding of the Ti−5.1Al−2.0Sn−3.7Zr−0.3Mo−0.3Si alloy was performed at 1273–1373 K for 5–15 h. After reaching the target temperature and holding time for boronizing, the corundum crucible containing the boronized sample was taken out from the furnace and cooled in the air.
After the boriding heat treatment, the cross section of the boronized sample was ground and polished, cleaned with acetone and then etched in Kroll’s reagent (1 mL HF, 5 mL HNO3 and 100 mL water). The microstructure of the boride layer on the cross section of the sample was observed by the FlexSEM1000 scanning electron microscope (SEM, TESCAN-MIRA 4, Tescan Co., LTD., Shanghai, China) with an energy dispersive spectrometer (EDS) and DMM490C optical microscope (OM, Caikang Optical Instrument Co., LTD., Shanghai, China). The thickness of boriding layers was determined by taking the average of at least 5–10 measurements on each sample [3], and the details of the measurements can be found in the Supplementary Materials. The microhardness measurement was carried out on the HV-1000Z microhardness tester (Deka precision meter Co., LTD., Shenzhen, China) under the conditions of a test force of 10 gf and a holding time of 15 s. Hardness testing was performed from the surface of the boriding layer toward the substrate at an interval of 2–3 μm at the boriding layer and 5 μm at the substrate. The phase analysis of the boronized surface of the sample was carried out by X-ray diffraction (XRD). The dry friction test was conducted at room temperature using the ball-on-plate linear reciprocating GF-I tribometer (Zhongke Kaihua Technology, Lanzhou, China). During the test, an Al2O3 ball with a diameter of Ø10 mm was selected as the counter material, and the reciprocating sliding test was conducted under normal load of 5N, constant sliding speed of 0.06 m/s, sliding length of 5 mm and duration of 10 min. The measured value at 10 min was taken as the final friction coefficient of the alloy.

3. Results

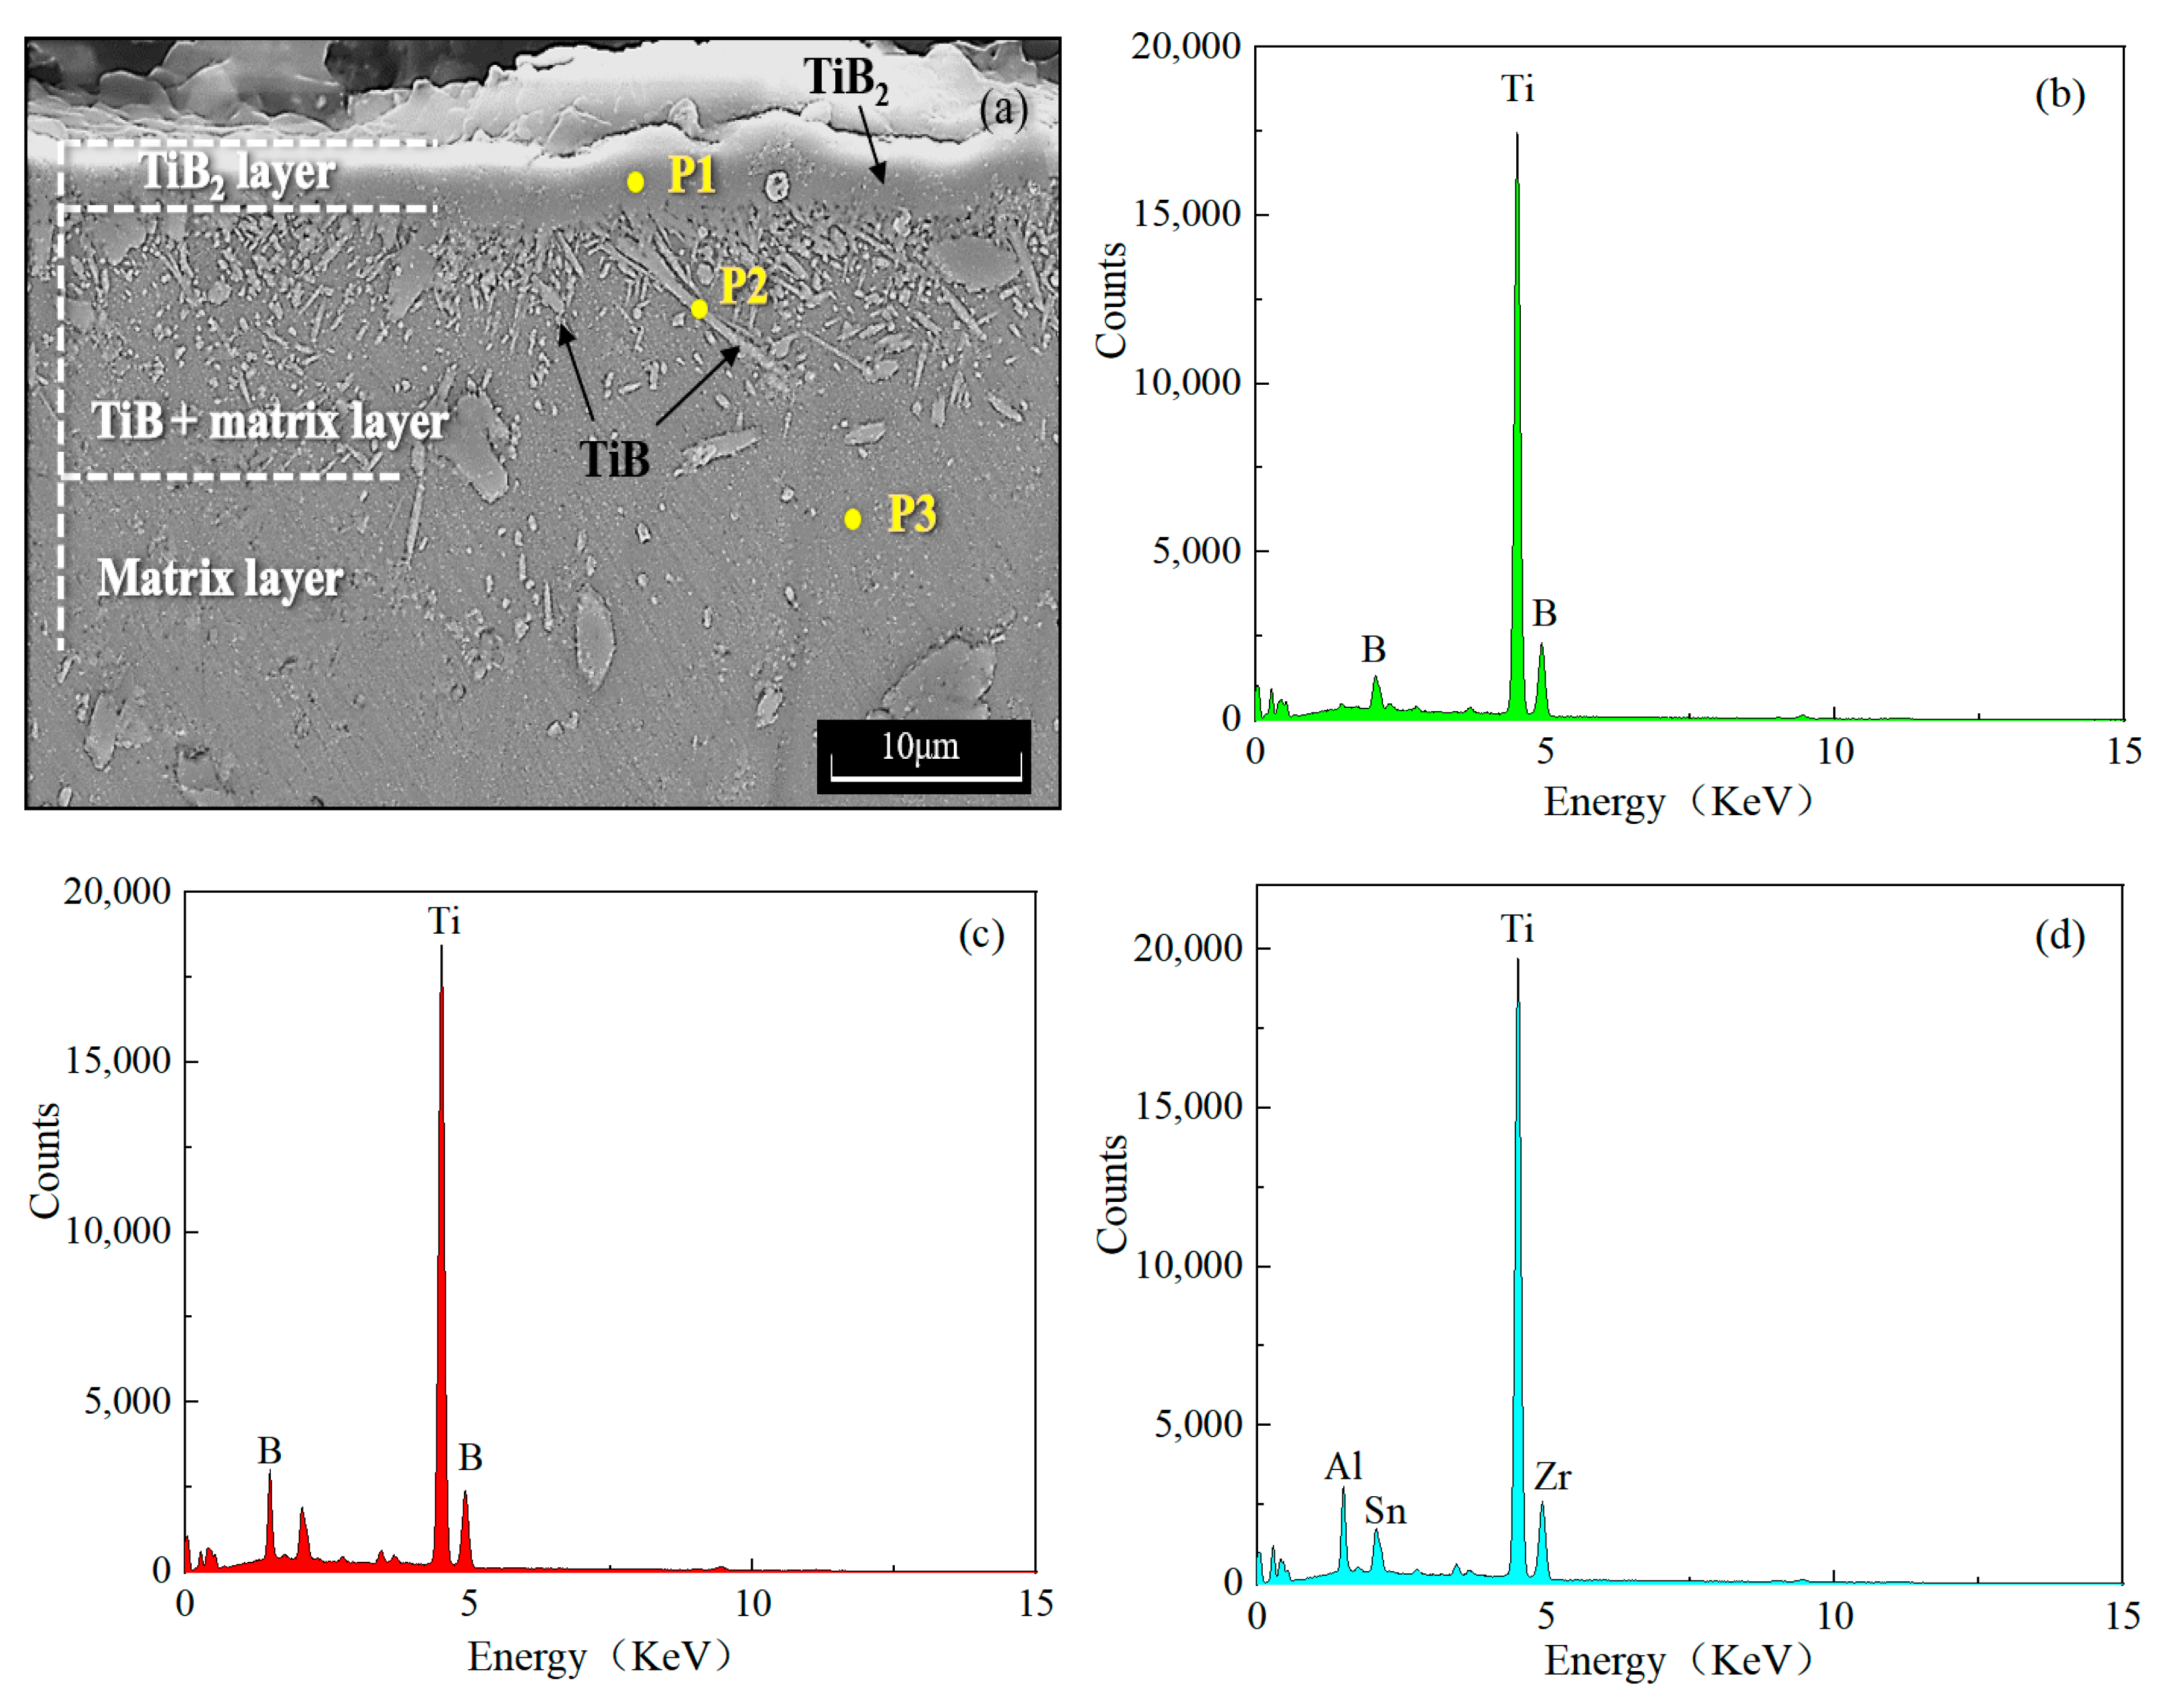
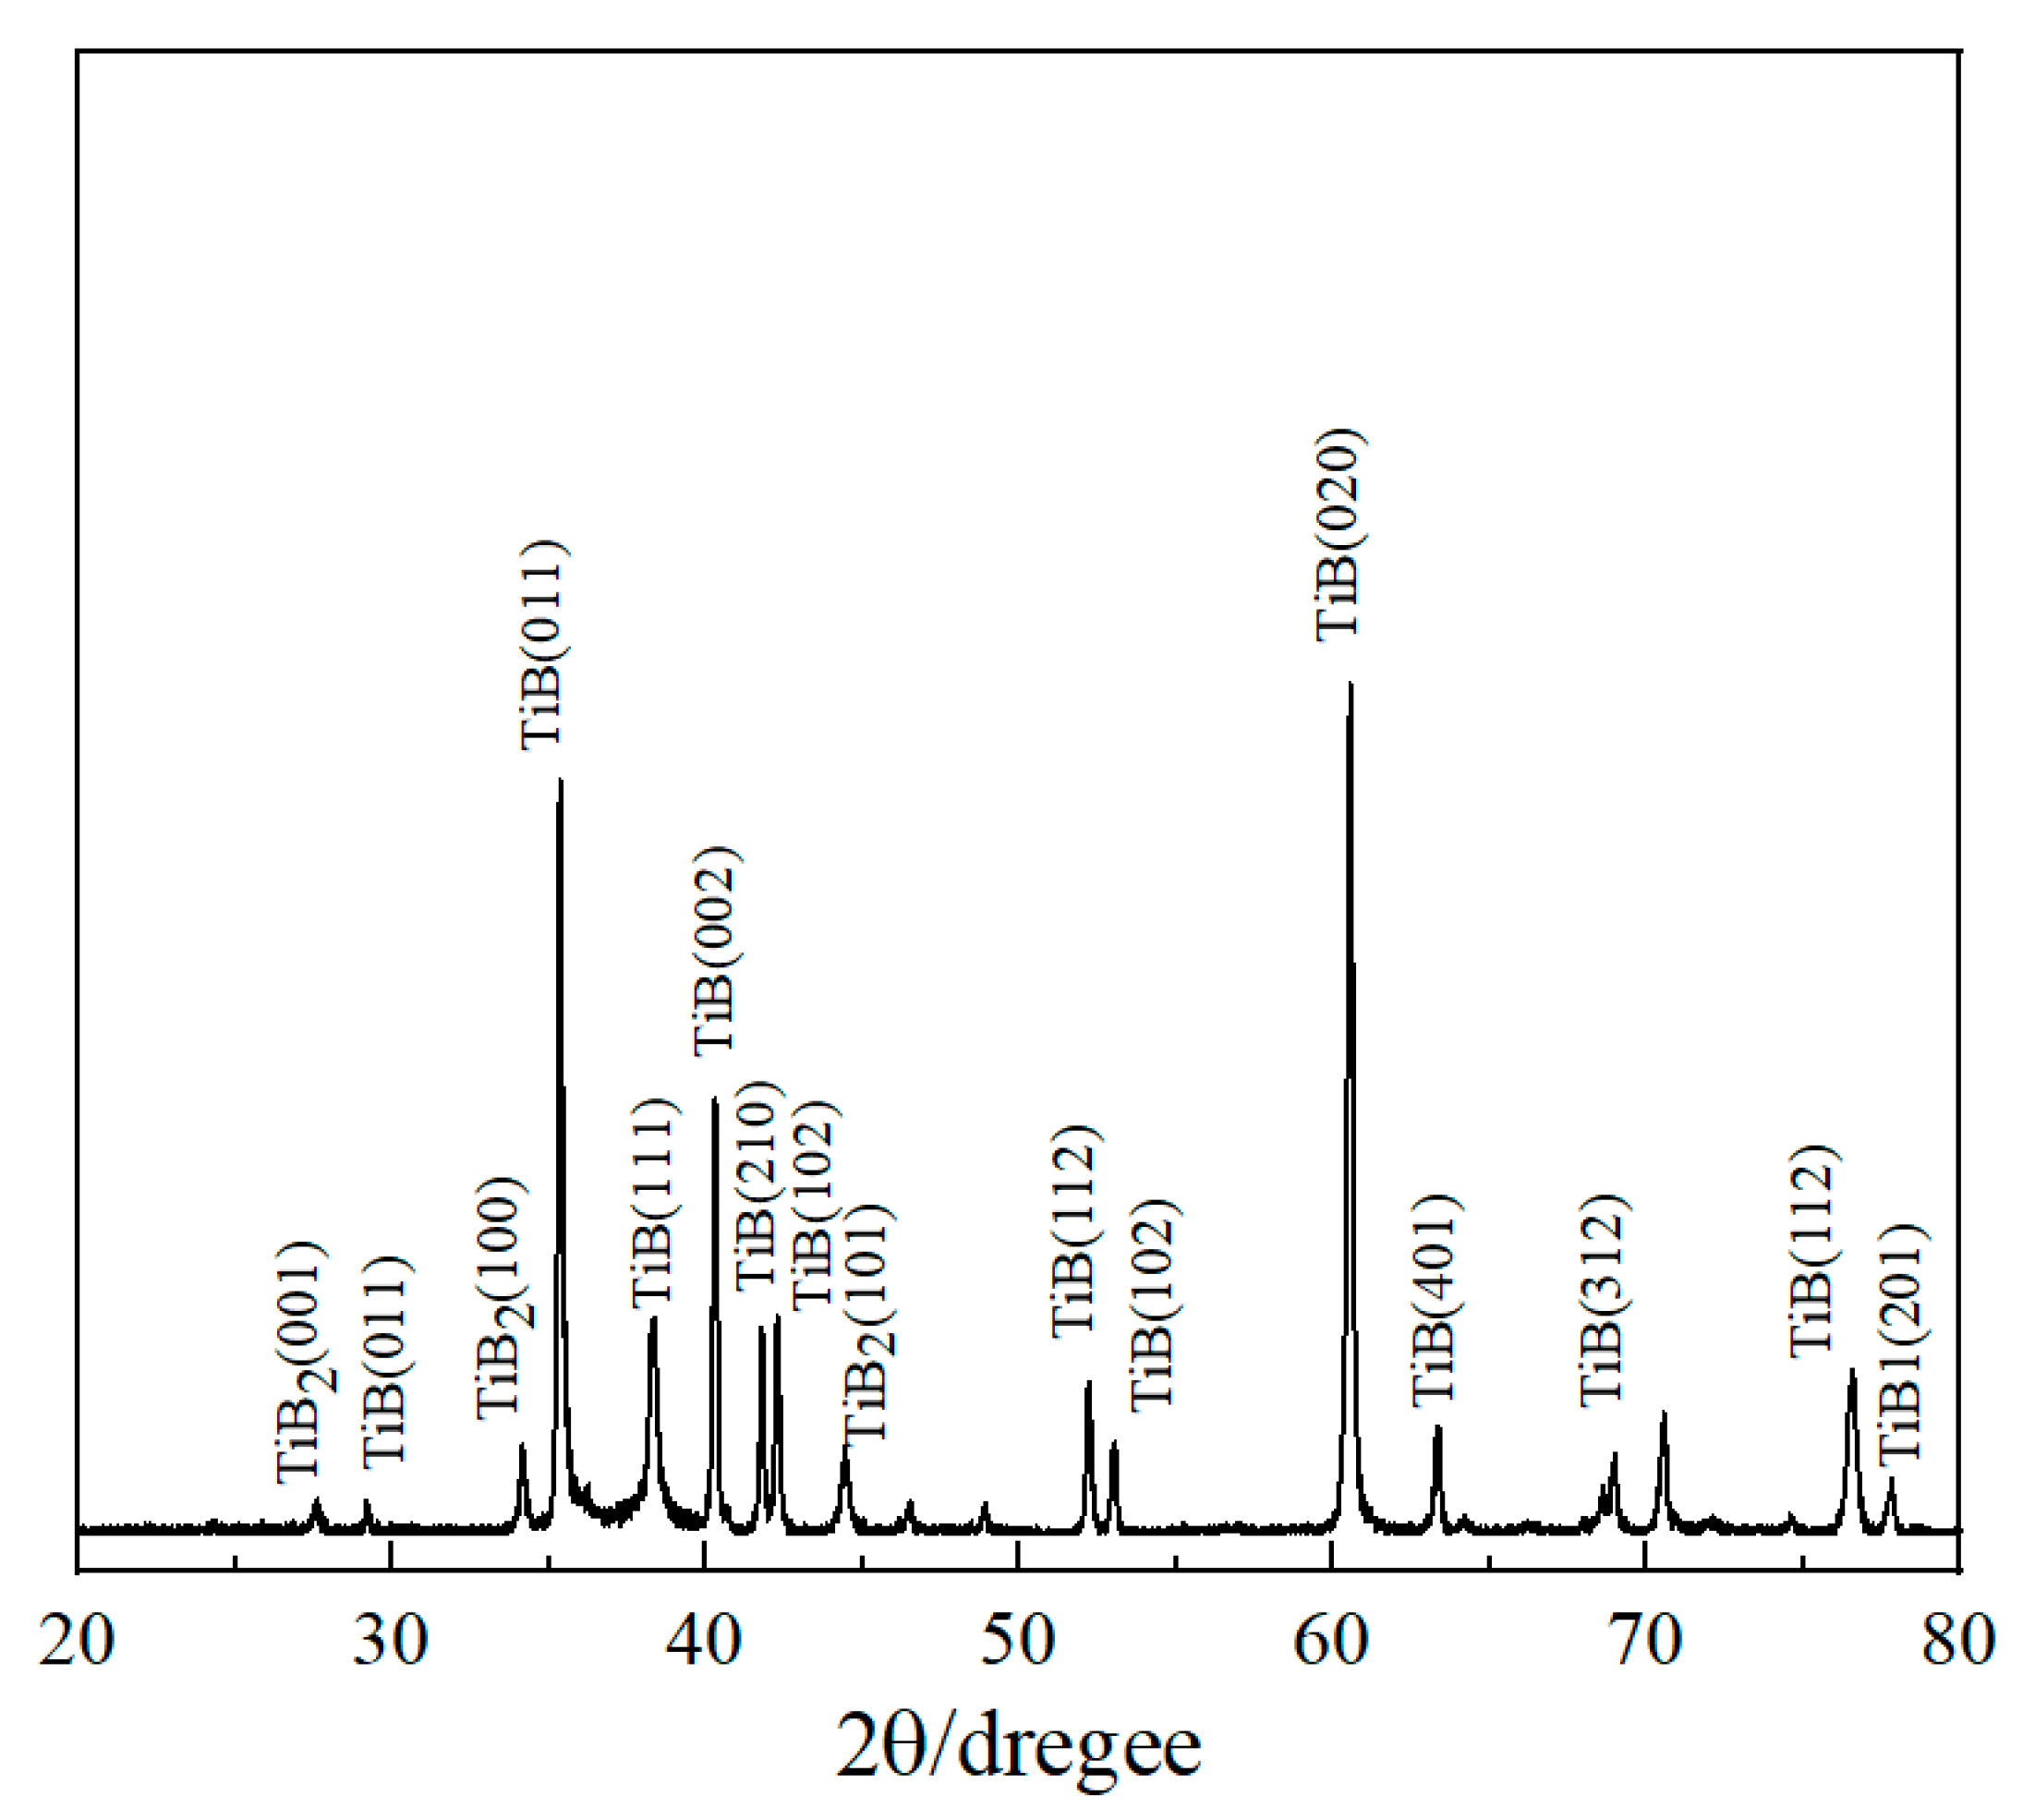
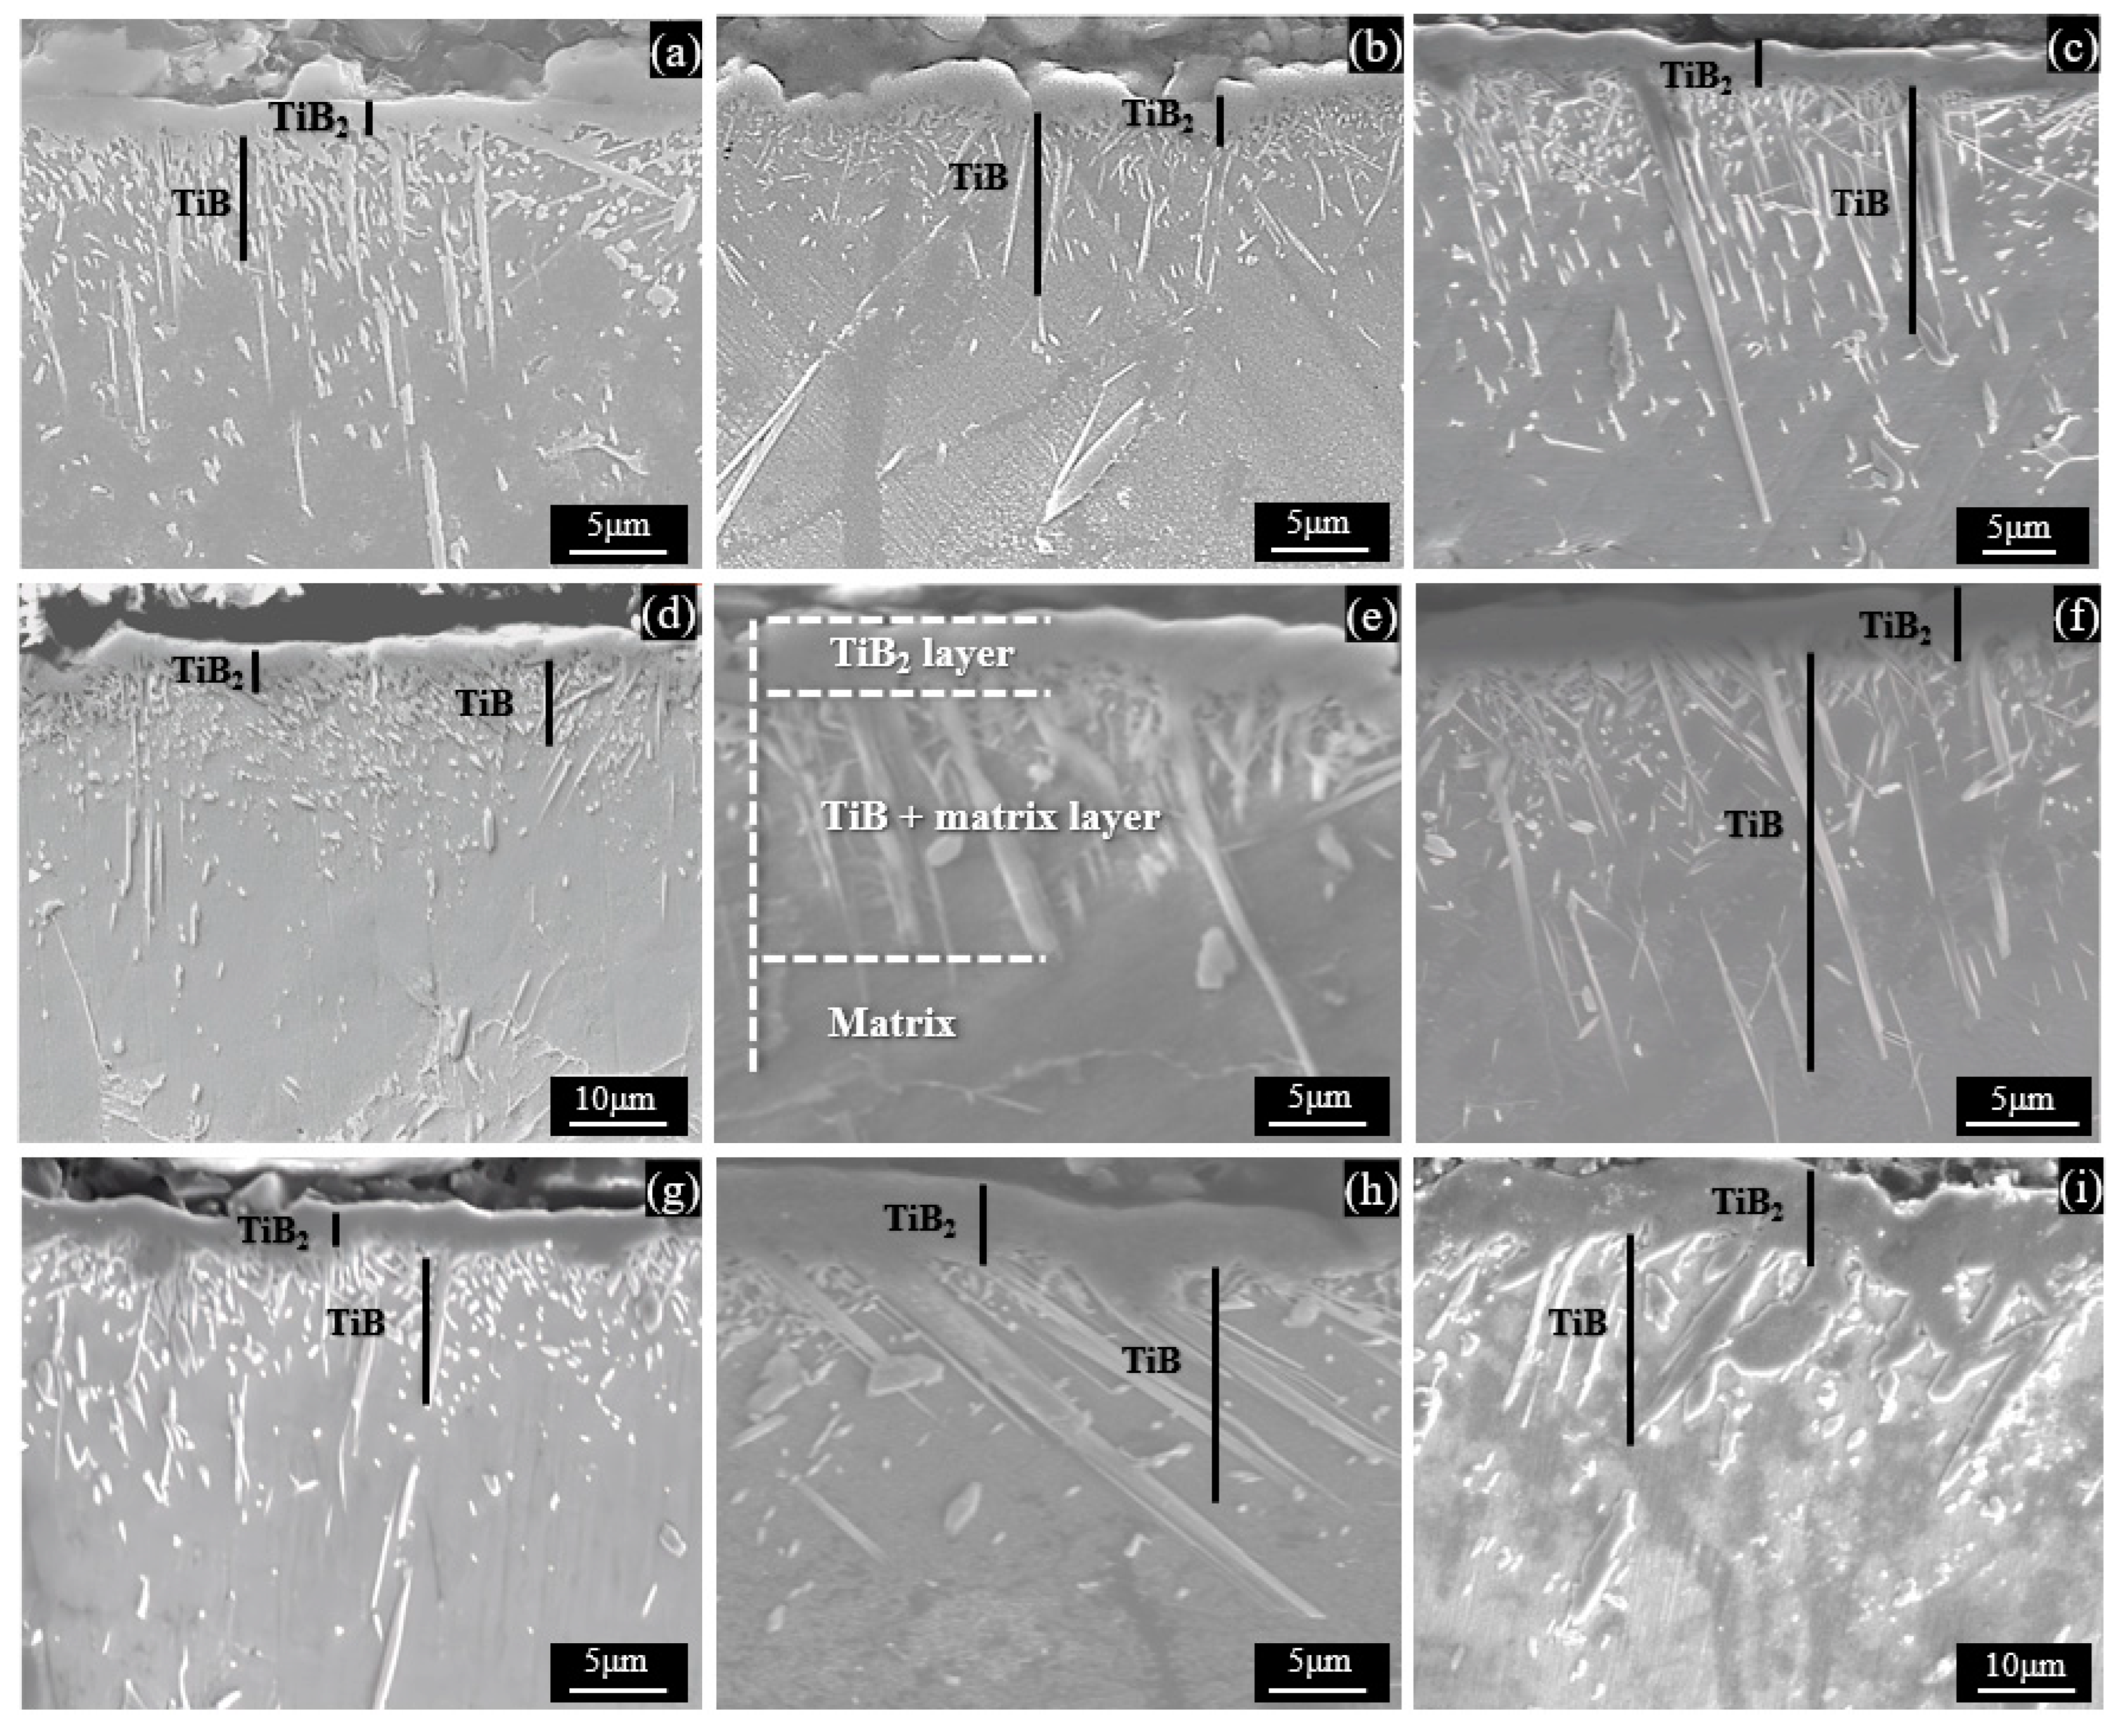
3.1. Characterization of Titanium Boride Layers

Figure 2a shows the typical characteristics of the surface boride layer on the cross-section of the Ti−5.1Al−2.0Sn−3.7Zr−0.3Mo−0.3Si alloy. It can be seen in Figure 2a that the boride layer exhibited a structure of a monolithic TiB2 outer layer and an inner layer of whisker TiB penetrating into the substrate. Similar morphologies have been confirmed in various dual-phase titanium alloys [3,4]. The different morphologies between TiB2 and TiB layers may be attributed to the different preferential growth directions of TiB2 and TiB crystals [21]. It is generally known that the hexagonal TiB2 has a preferential growth direction on ab plane perpendicular to the [0001] direction, selectively forming a dense structure [21,22], while TiB has a preferential growth direction of [010], and there are some specific orientation relationships between TiB and titanium substrates, resulting in needle-like or whisker-like morphology along the [010] direction [3]. In both the TiB2 and TiB layers, no obvious microcracks or holes were observed, showing a good bonding structure between the boride layer and the substrate. The density measurements indicate that the density of the alloy increased from the original 4.5 g/cm3 to an average value of 4.73 g/cm3 after the boriding process, confirming the densification of the alloy. It is worth noting that a lot of short flaky or irregularly shaped TiB with sub-micron sizes (<0.7 μm) were also observed in the TiB + matrix layer. These sub-micron-sized TiB may have been formed by the reaction (Ti + [B] = TiB) between active [B] diffused from boron source through the outer layer of TiB2 and Ti from the alloy substrate. When the thickness of the TiB2 layer reached a certain value, it hindered the diffusion of active [B] atoms into the alloy substrate, thereby limiting the growth of the boride layer and forming short flaky morphology [22,23,24]. Another reason may be the presence of micropores in the alloy during powder metallurgy preparation. As preliminary density measurements, the density of the alloy used in present study was 4.5 g/cm, which was 97.1% of the theoretical density [20]. This different density indicates the presence of micropores in the matrix, which acted as anchor sites for boron diffusion, forming sub-micron-sized TiB phases. More research details need to be confirmed in future work.
The EDS analyses show the presence of Ti and B in Figure 2b–c, as well as the main elements of the matrix in Figure 2d. The XRD measurements identified the existence of TiB2 and TiB phases as shown in Figure 3.
Figure 4 shows the SEM microstructure of Ti−5.1Al−2.0Sn−3.7Zr−0.3Mo−0.3Si alloys borided at different conditions. It can be clearly seen that there were three different regions, namely the outer layer of single TiB2, the inner layer of whiskers or discontinuous flaky TiB penetrating into the substrate and the substrate. The average thicknesses of the TiB2, TiB and total TiB2 + TiB layers at different boriding temperature and time are summarized in Table 2. The monolithic outer layer of TiB2 had a thickness of mostly less than 7 μm in all temperature ranges, and it had only a small portion of the total boride layer thickness. The whisker TiB had a thickness ranging from 7 μm to 23 μm under the present boriding conditions, and it accounted for a high proportion of the total boride layer thickness. Moreover, it can be seen from Figure 4a–d,g that the morphology of the alloy was characterized by a large number of sub-micron (<0.7 μm)-sized short flaky TiB phases under the boriding conditions of a relatively lower temperature (1273 K) and shorter time (5 h). With the increase of the boriding temperature and time, the TiB2 boride layer increased, and the TiB whiskers also became longer and thicker, while the tiny flaky TiB phase no longer existed in large quantities as shown in Figure 4e,f,h,i. According to above observations, it can be known that as the temperature and duration increased, surface [B] atoms became more active in diffusing into the substrate, resulting in an increase in the concentration of B atoms in the alloy matrix and accelerating the growth of the boride layer by merging small flake-like TiB phases.
To clearly see the growth behavior of the boride layers, the variation relationships of boride layer thickness under different conditions are presented in Figure 5. The growth patterns of various boride layers were considered parabolic growth. As expected, the thickness of all boride layers increased with temperature and time. The outer layer of TiB2 showed a relatively slow growing tendency at the temperature of 1273–1323 K and heat treatment time below 10 h, followed by a relatively fast increase after 15 h. As the temperature rose to 1373 K, the thickness kinetic curve of the boride layers exhibited parabolic smooth growth. Since this temperature was well into the β-phase field of the alloy, the growth rate of boride layers was relatively higher than that at the temperature of 1273–1323 K. Similar growth behavior could be observed in TiB whisker, but the growth rate of this layer was much higher than that of TiB2. Due to the high proportion of TiB thickness out of the total layer, the growth kinetic curve of the total thickness of the boride layer was similar to that of the TiB layer.

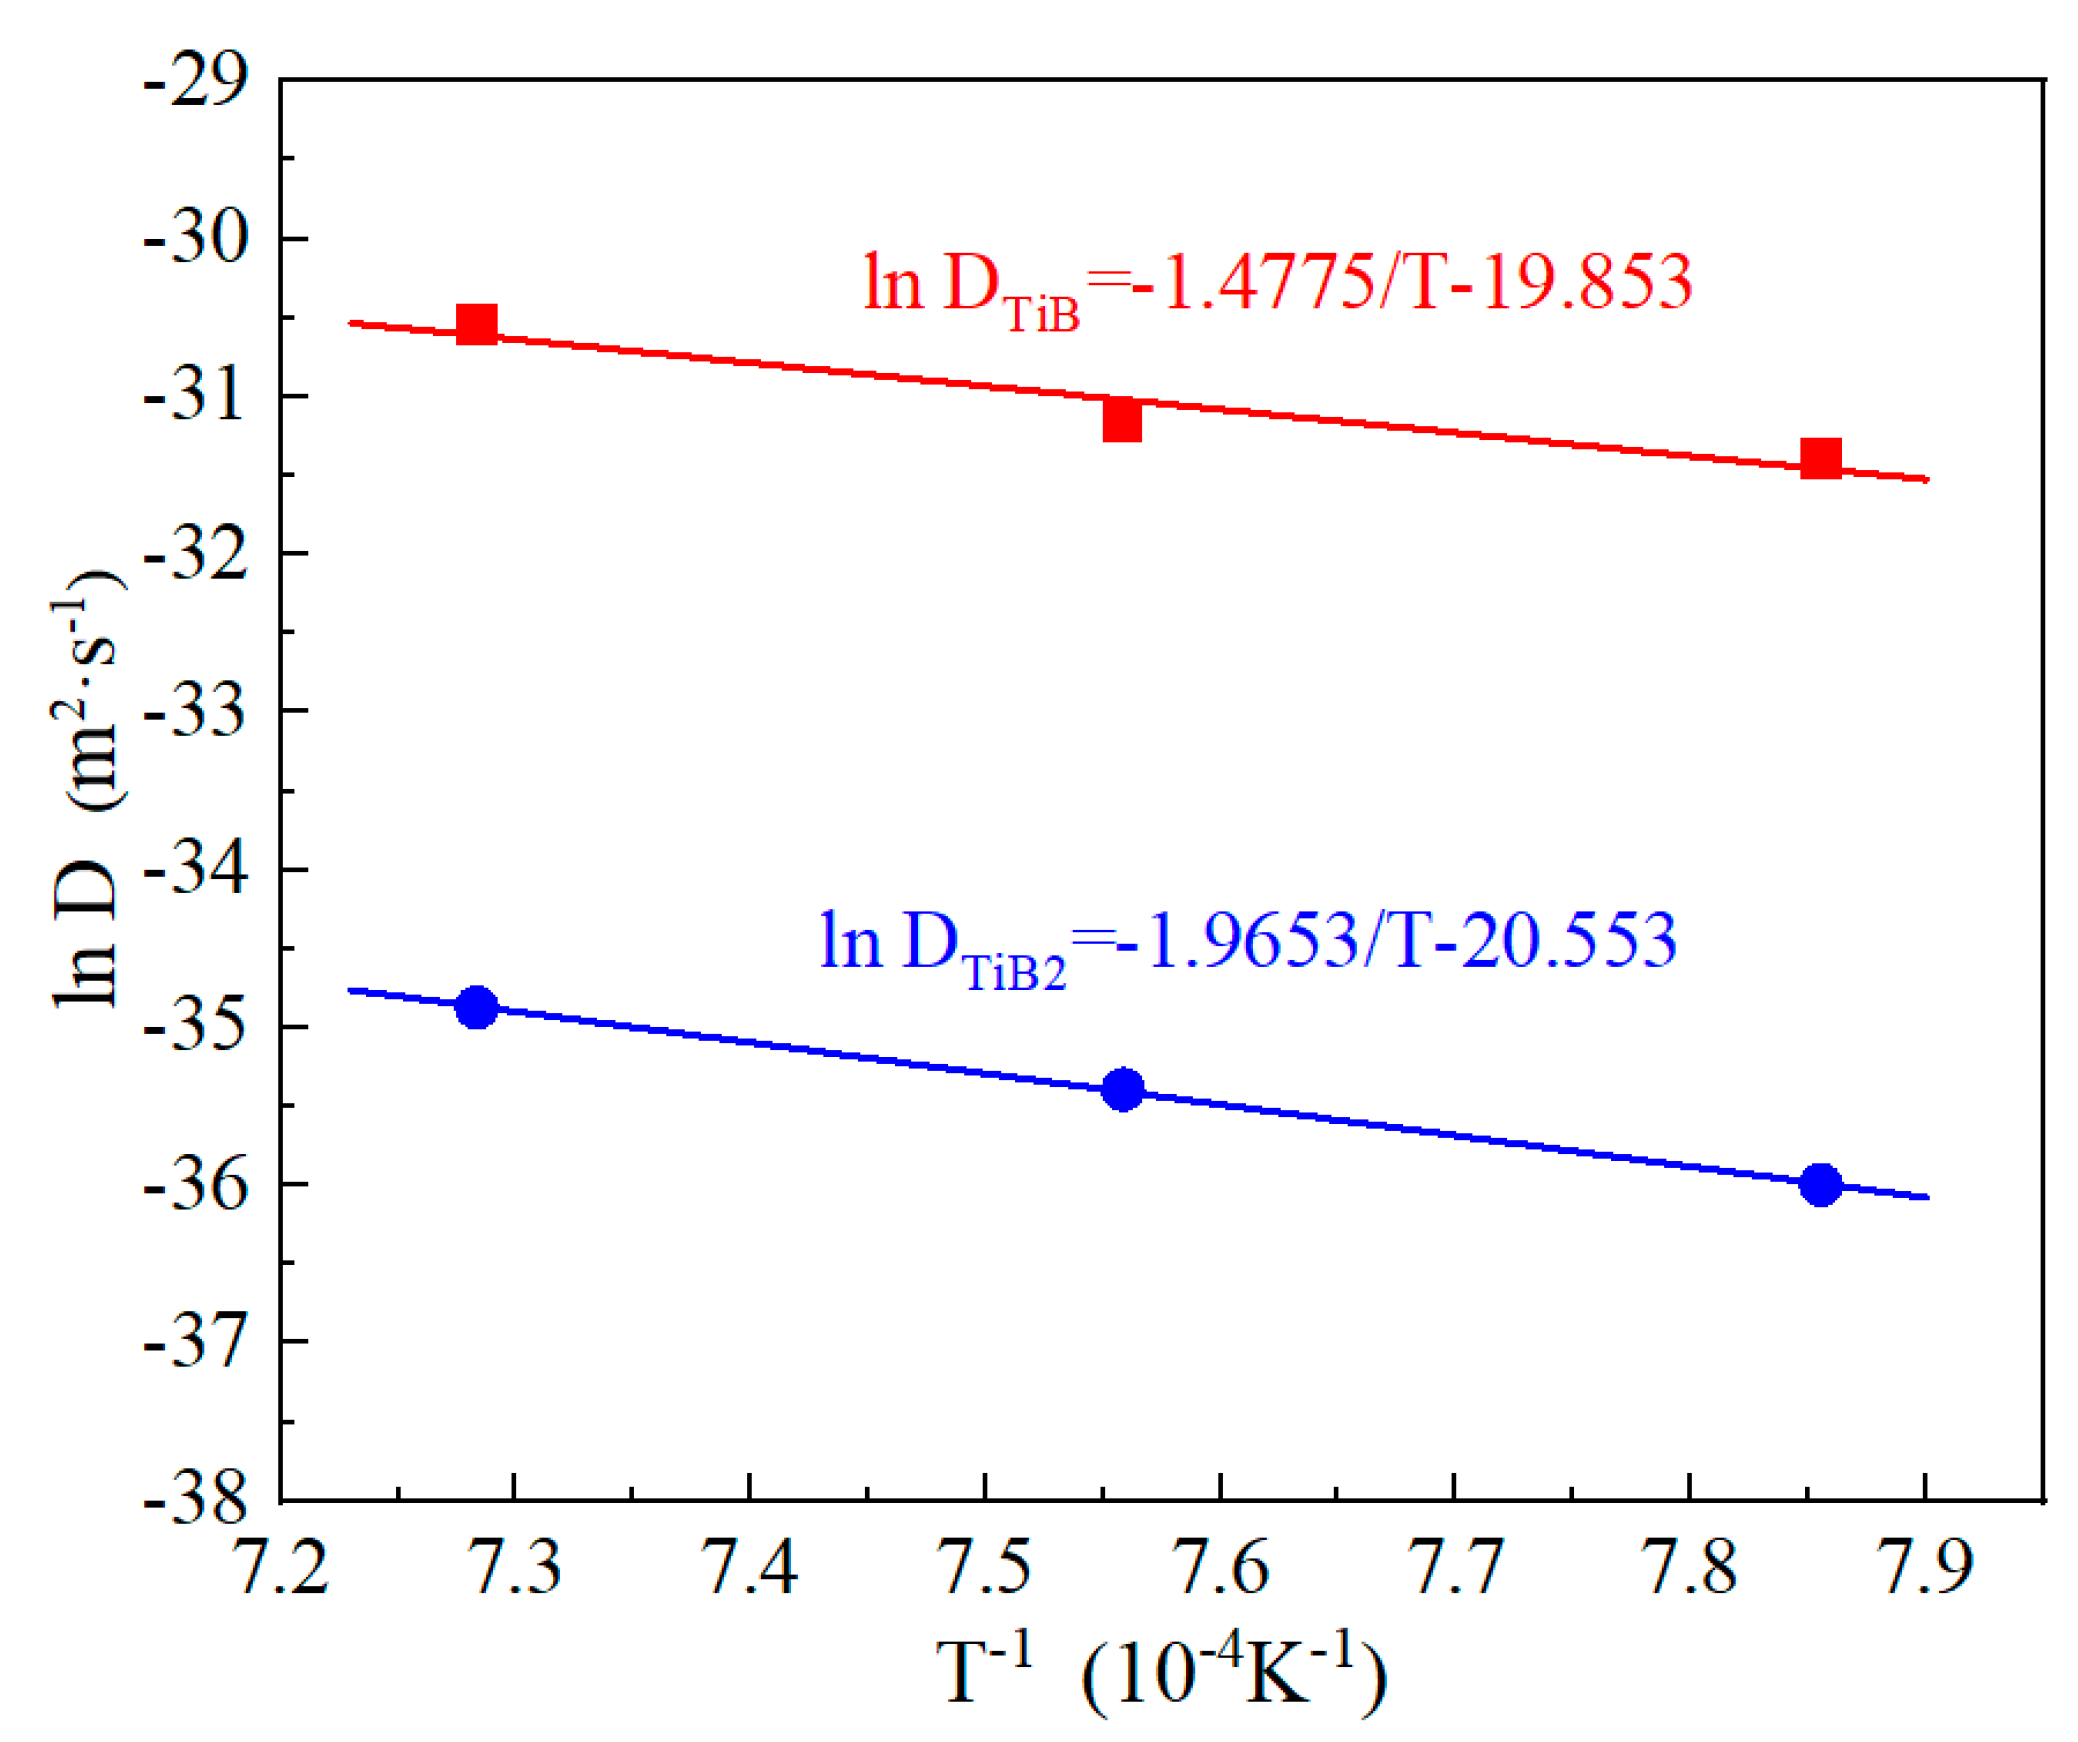
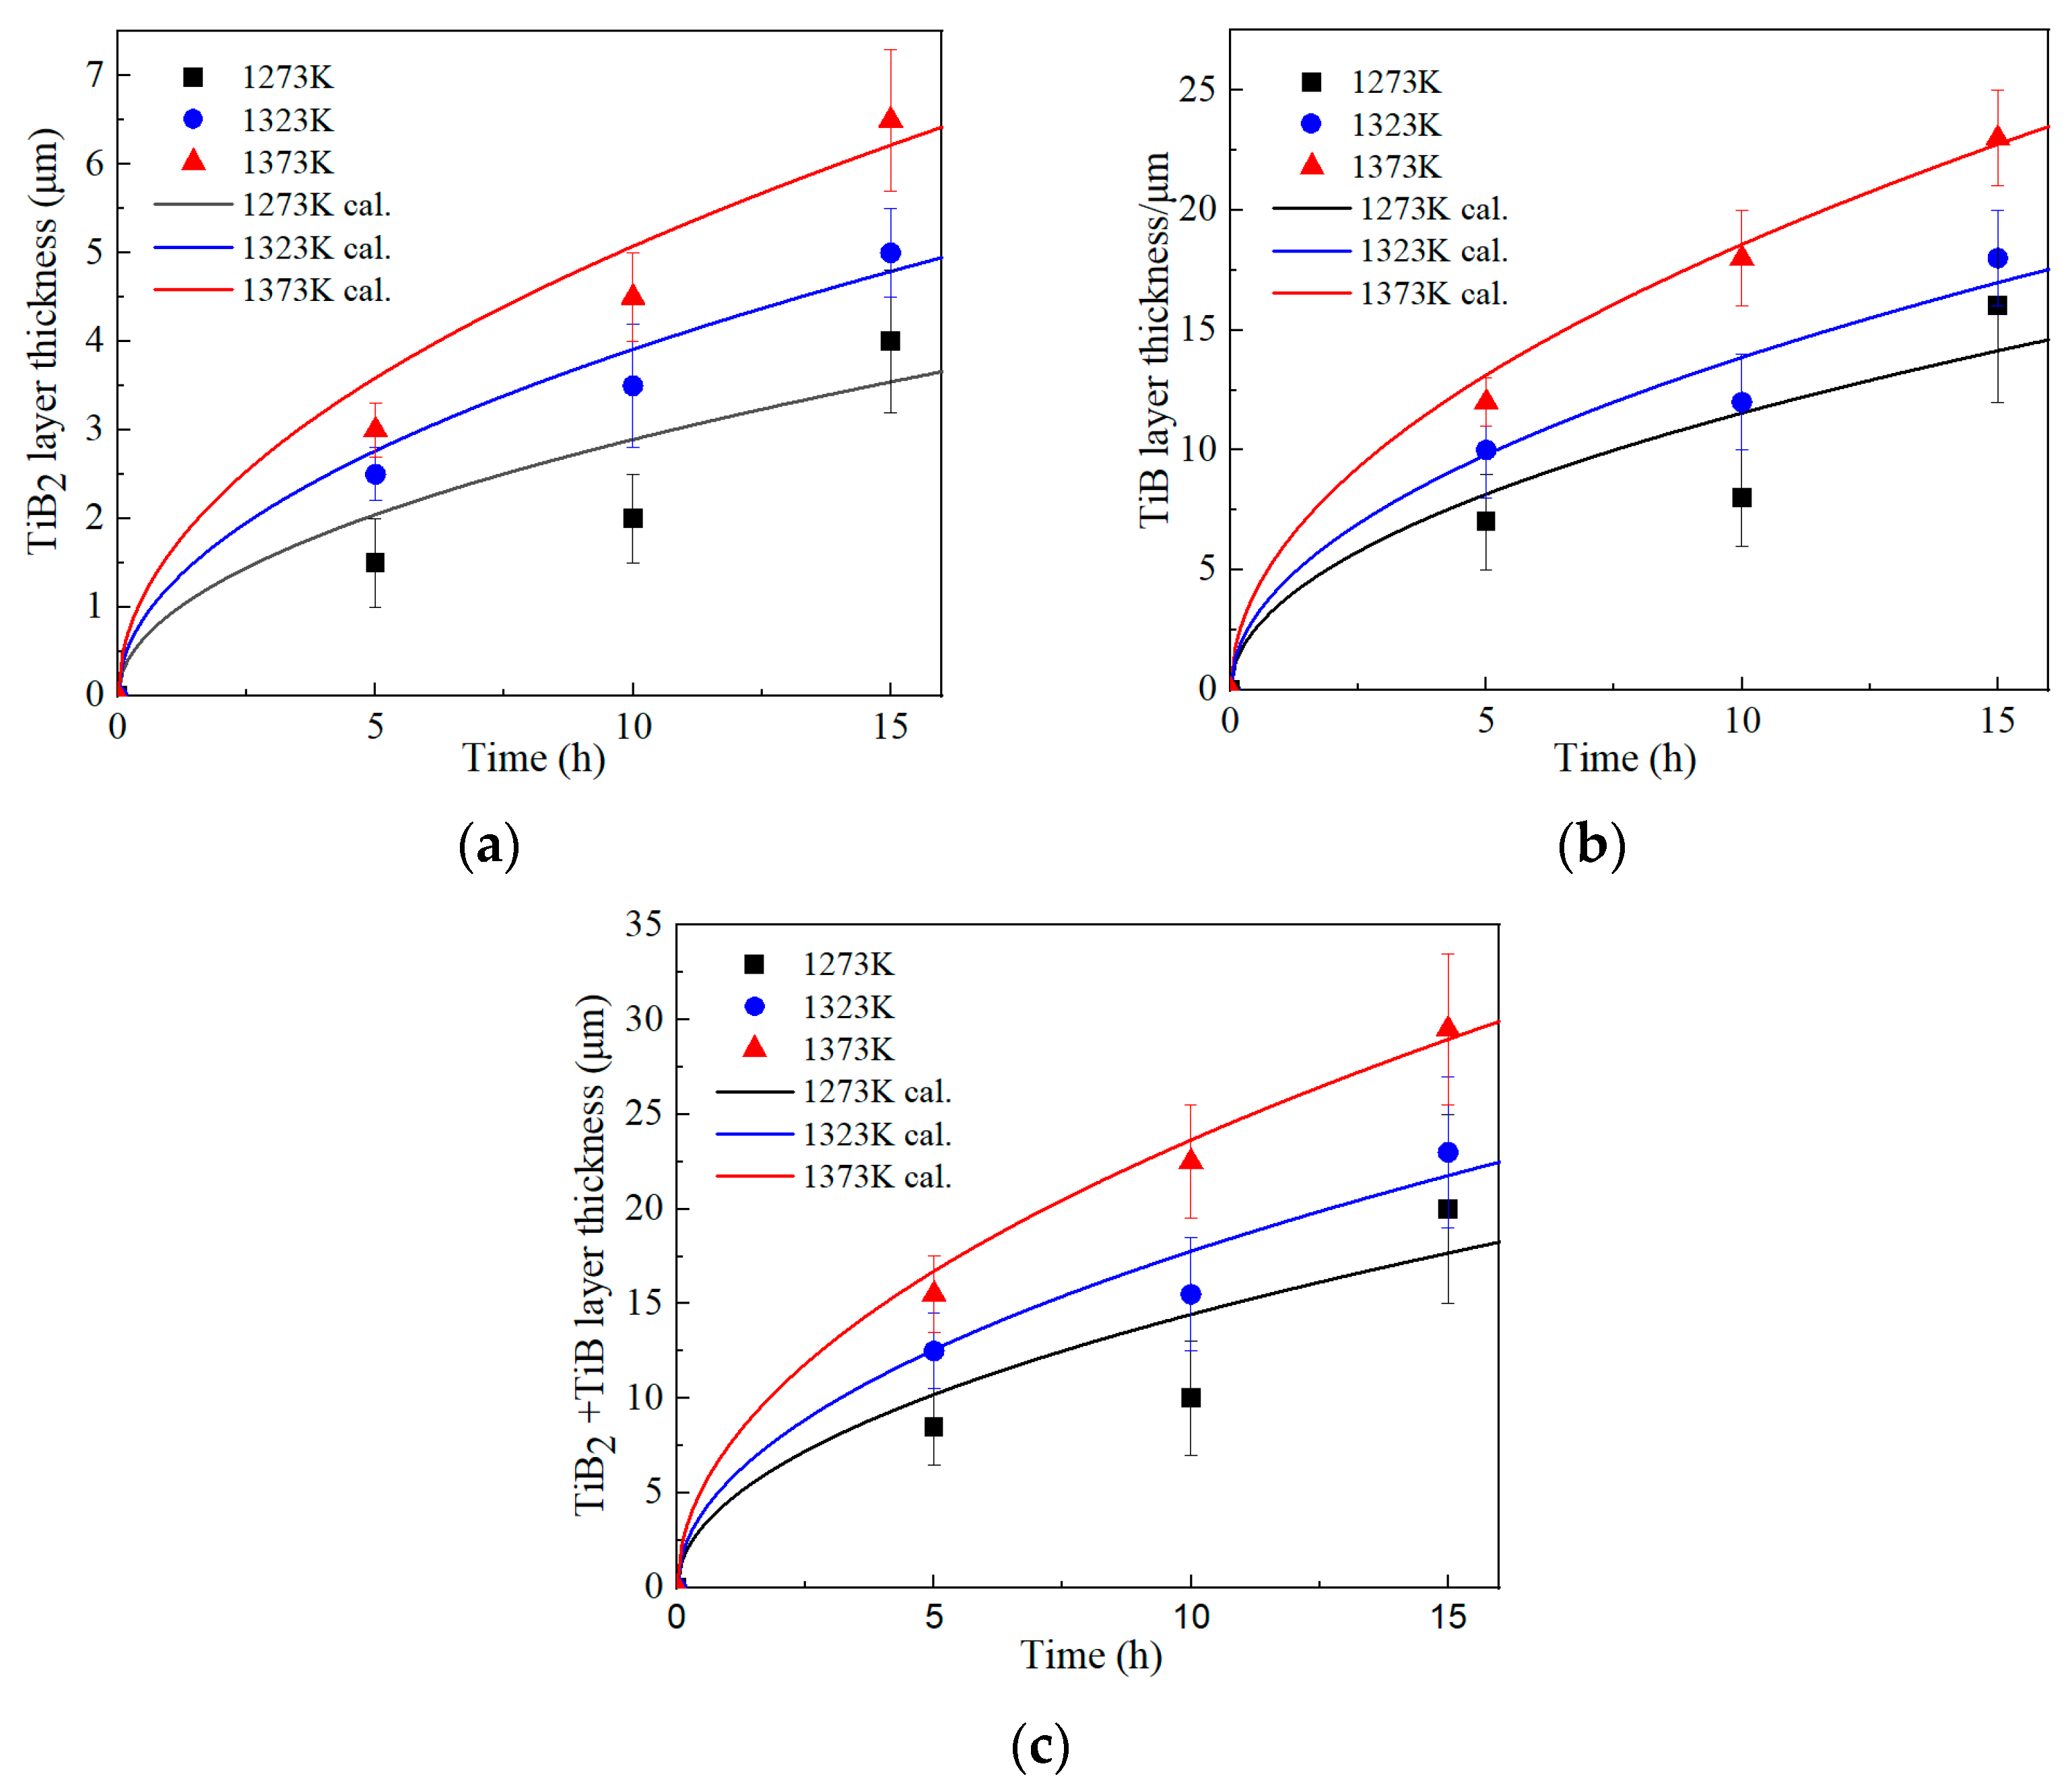
3.2. Growth Kinetics of Boride Layers

It is known that diffusion of the B atom in Ti-based alloy is the main controlling step for the growth of TiB2 and TiB borides, so the growth of the boride layer is the result of B atoms diffusing into the substrate [16,25]. A diffusion-based parabolic model has widely been used to describe the growth kinetics of boride layers on titanium and its alloy [3,25,26,27]. Figure 6 shows a schematic diagram of the diffusion model considering the growth of the TiB2 and TiB whisker layers. In the model, the following assumptions were made [3,4]: (1) the growth of boride layer was controlled by the B diffusion, (2) the diffusion coefficient of B was concentration-independent, and (3) B diffusion in the Ti alloy matrix was negligible. Also, the growth of the TiB2 and TiB layers was considered as the displacements of the TiB2/TiB and TiB/Ti-substrate interfaces, and B concentration refers to the B concentration at the B/TiB2, TiB2/TiB and TiB/Ti-substate interfaces; thus, the boride thickness can be described as   d = k t 0.5 using the parabolic growth constant and boriding time term. By combining mass balance equations [28,29] and introducing the correction factors of A and B, the B diffusion coefficient in TiB2 ( D B T i B 2 ) and TiB ( D B T i B ) layers can be determined as follows [3]:
D B T i B 2 = A w T i B 2 + w k 1 2 + w T i B k 1 k 2 2 ( C U p T i B 2 C L o w T i B 2 )  
D B T i B = B ( k 2 k 1 ) w T i B k 2 + w k 1 2 ( C U p T i B C L o w T i B )
with
w T i B 2 = 0.5 C U p T i B 2 C L o w T i B 2 + ( C U p T i B 2 C L o w T i B )  
w T i B = 0.5 C U p T i B C L o w T i B + ( C L o w T i B C 0 )
w = 0.5 ( C U p T i B C L o w T i B )
Here, based on the model assumptions mentioned above, initial condition (for t = 0) of the boron solubility in the substate was set as C0 = 0, and boundary conditions (for t > 0) for the upper and lower limit of B concentration in boride layer were set as   C U p T i B 2   = 0.311, C L o w T i B 2 = 0.301, C U p T i B = 0.185 and C L o w T i B = 0.18 [3,4,10,18].
According to the parabolic growth model d = k t 0.5 , the positions of the TiB2/TiB interface and TiB/Ti-substrate interface can be given as:
x T i B 2 = k 1 t 0.5
( x T i B 2 + x T i B ) = k 2 t 0.5
Thus, the TiB layer thickness can be given as
x T i B = x T i B 2 + x T i B x T i B 2 = ( k 2 k 1 ) t 0.5
where x T i B 2 and x T i B are the layers of TiB2 and TiB, and k 1 and k 2 are the parabolic growth constants at the TiB2/TiB and TiB/Ti interfaces, which can be determined by the linear fitting curve of x T i B 2 t 0.5 and x T i B t 0.5 .
Figure 7 shows the relationship between the boride thickness and square root of boriding time according to Equations (6)–(8). By analyzing the slope of linear fitting of curves in Figure 7, the parabolic growth constants at different boriding temperatures were determined and listed in Table 3. The parabolic growth constant showed an increasing tendency with time and temperature.
For better kinetic modeling and prediction, the correction factors of A and B for D B T i B 2 and D B T i B were introduced based on the relationship of k = D 0.5 and determined as 0.0203 and 0.2508 through the following equations [3]:
A = k 1 2 / w T i B 2 + w k 1 2 + w T i B k 1 k 2 2 ( C u p T i B 2 C l o w T i B 2 )
B = ( k 1 k 2 ) 2 / w T i B 2 + w k 1 2 + w T i B k 1 k 2 2 ( C u p T i B 2 C l o w T i B 2 )
As a result, the boron diffusion coefficients using parabolic constants in the boride layers can be determined based on Equations (1) and (2), and the calculation results at different temperatures are also listed in Table 3. Similar to the parabolic constants, the B diffusion coefficients in both TiB2 and TiB showed a gradual increasing tendency as the boriding temperature increased. As seen in Table 3, the diffusion coefficient of boron in TiB2 ranged from 2.33 × 10⁻¹⁶ to 7.16 × 10⁻¹⁶ m2·s−1, and the diffusion coefficient of boron in TiB was two orders of magnitude higher than that in TiB2, ranging from 2.33 × 10⁻¹⁴ to 5.45 × 10⁻¹⁴ m2 ·s−1. Table 4 lists the diffusion coefficients of boron in different borided Ti alloys calculated by the parabolic diffusion model of d = kt0.5. The diffusion coefficients of boron in the boride layers were typically of the order of 10−16 to 10−13, where the diffusion coefficient of boron in the α-type Ti alloy substrate was relatively lower than that in the β-type Ti alloy substrate. This is because B atoms have a lower diffusion energy barrier when diffusing in the β-type Ti alloy compared to the α-type Ti alloy [30]. Also, the diffusion coefficient of boron in TiB2 ( D B T i B 2 ) was generally higher than that in TiB ( D B T i B ) layer. This was due to the dense structure of the TiB2 layer, which hinders the diffusion of the B atom [19]. The diffusion coefficient of boron in TiB2, D B T i B 2 obtained in the present study was well within the range of α-type Ti alloy substrates reported in the literature. On the other hand, the diffusion coefficient of boron in TiB, D B T i B was within the range of Cp−Ti substrates but relatively higher than that in the α-type Ti−6Al−2Zr−1Mo−1V or Ti−5Al−2.5Sn alloy. This difference may have been caused by the different diffusion energy barriers influenced by the alloy elements. It has been recently reported that alloying elements dissolved in Ti substrate can segregate at the TiB/Ti interface, thus increasing the diffusion energy barrier for B atoms to further diffuse in multi-component Ti alloys compared to the clean (or without alloying) Ti matrix [22]. Another reason may have been the influence of boriding temperature. It can be seen in Table 4 that when boriding temperature was close to or higher than Tβ, the diffusion coefficient of boron usually showed a higher value than at a relatively lower temperature. The boriding temperature used in the present study was close to or higher than Tβ and higher than the temperature used in α-type Ti−6Al−2Zr−1Mo−1V or Ti−5Al−2.5Sn alloy, thereby showing a higher diffusion coefficient in the present study.
The temperature dependence of boron diffusion in both layers was analyzed by Arrhenius-type expression:
D = D 0 e x p ( Q R T )
where Q is the diffusion activation energy (kJ/mol) of boron in a relevant boride layer, D 0 is the pre-exponential factor (m2/s), R is the gas constant (kJ/(mol·K)) and T is the absolute temperature (K).
By taking natural logarithm of Equation (11), the activation energy and exponential factor were determined from the slope and intercept of linear fitting between lnD and 1/T shown in Figure 8. Thus, the diffusion coefficients of boron in the TiB2 and TiB layers are given as follows:
D B T i B 2 = 1.1856 × 10 9 e x p ( 166.4 R T )
D B T i B = 2.3875 × 10 9 e x p ( 122.8 R T )
The calculated activation energies of boron in the TiB2 layer and TiB layer were 166.4 kJ/mol and 122.8 kJ/mol, respectively. Due to the dense structural characteristics of the TiB2 layer, the diffusion of boron in this layer was relatively more difficult than in the TiB layer, so the boron diffusion activation energy in TiB2 layer was higher than that in the TiB layer. In addition, the growth of the TiB layer has a preferred growth direction in [010] [13], which can promote the growth of TiB whiskers. This means that the boron activation energy required for diffusion in the TiB layer is lower.
The reported values of the boron diffusion activation energies of borided Cp−Ti, Ti−6Al−2Zr−1Mo−1V, TA7, TC4 and TB2 titanium alloys are listed in Table 5 together with the values calculated in this study. As shown in table, the diffusion activation energies varied depending on the substrate, boriding method and temperature range. The activation energies of boron in the TiB2 and TiB layers obtained in present study were higher than that in Cp-Ti by plasma paste boriding. This was attributed to the diffusion barrier of alloy elements in the Ti−5Al−2Sn−3.7Zr−0.3Mo−0.3Si alloy hindering the diffusion of boron atom. Another reason was the use of plasma in Cp-Ti, which can generate extensive amounts of active boron and increase of activity of Ti and B [25]. In Ti−6Al−4V alloy, by plasma paste boriding, the boron activation energy ( Q B T i B 2   = 136.2 kJ/mol, Q B T i B   = 63.8 kJ/mol) was lower than present study. This was also ascribed to the generation of active boron using plasma. Moreover, an increase of β-phase by the addition of V (acting as a β-phase stable element) may have been the reason for the promotion of boron diffusion in the Ti−6Al−4V alloy. Due to the same reason for high diffusion in the β-phase, the activation energy of boron diffusion in the β-type Ti−5Mo−5V−8Cr−3Al titanium alloy was lower than the results of present study. However, the diffusion activation energy (189.9 kJ/mol) of the boron in the TiB2 layer of CRTD (Cathodic Reduction and Thermal Diffusion)-based borided Cp-Ti, the diffusion activation energy of boron in the TiB2 and TiB layers of sigma fiber composite boronized Ti−6Al−4V and pack-borided Ti−6Al−2Zr−1Mo−1V, and the activation energy of boron in the TiB layer of the pack-borided Ti−5Al−2.5Sn alloy showed higher values than our results. This was due to the model used to estimate the boron activation energy is d 2 = D t , in which boron diffuses into the layers along the direction perpendicular to the interfaces, while the parabolic growth model d = k t 0.5 considers the growth of TiB2 and TiB layer as the displacements of TiB2/TiB and TiB/Ti-substrate interfaces [31]. Therefore, the boron activation energies estimated by the diffusion model d 2 = D t in the literature [3,19,32,33] were higher than the present results given by the diffusion model d = k t 0.5 .
Figure 9 shows the boride growth kinetics curve calculated using the parabolic diffusion model based on Equations (6)–(8) together with the experimental data. The predicted thicknesses of the TiB2, TiB and total layer at relatively high temperatures of 1323 K and 1373 K were relatively consistent with experimental results, but the prediction at a low temperature of 1273 K slightly deviated from the experimental observations, especially at boriding times of 5 h and 10 h. This may be attributed to the fact that the TiB2 layer recedes by a complex mechanism involving enhanced anomalous diffusion in Ti near the β transition temperature [4]. Although some predictions may have some deviation, a reasonable agreement between predicted and experimental data was found in most cases within the error range, so the present model can be considered as a predictive model of the growth kinetics of the boriding layers for Ti−5Al−2Sn−3.7Zr−0.3Mo−0.3Si alloy.

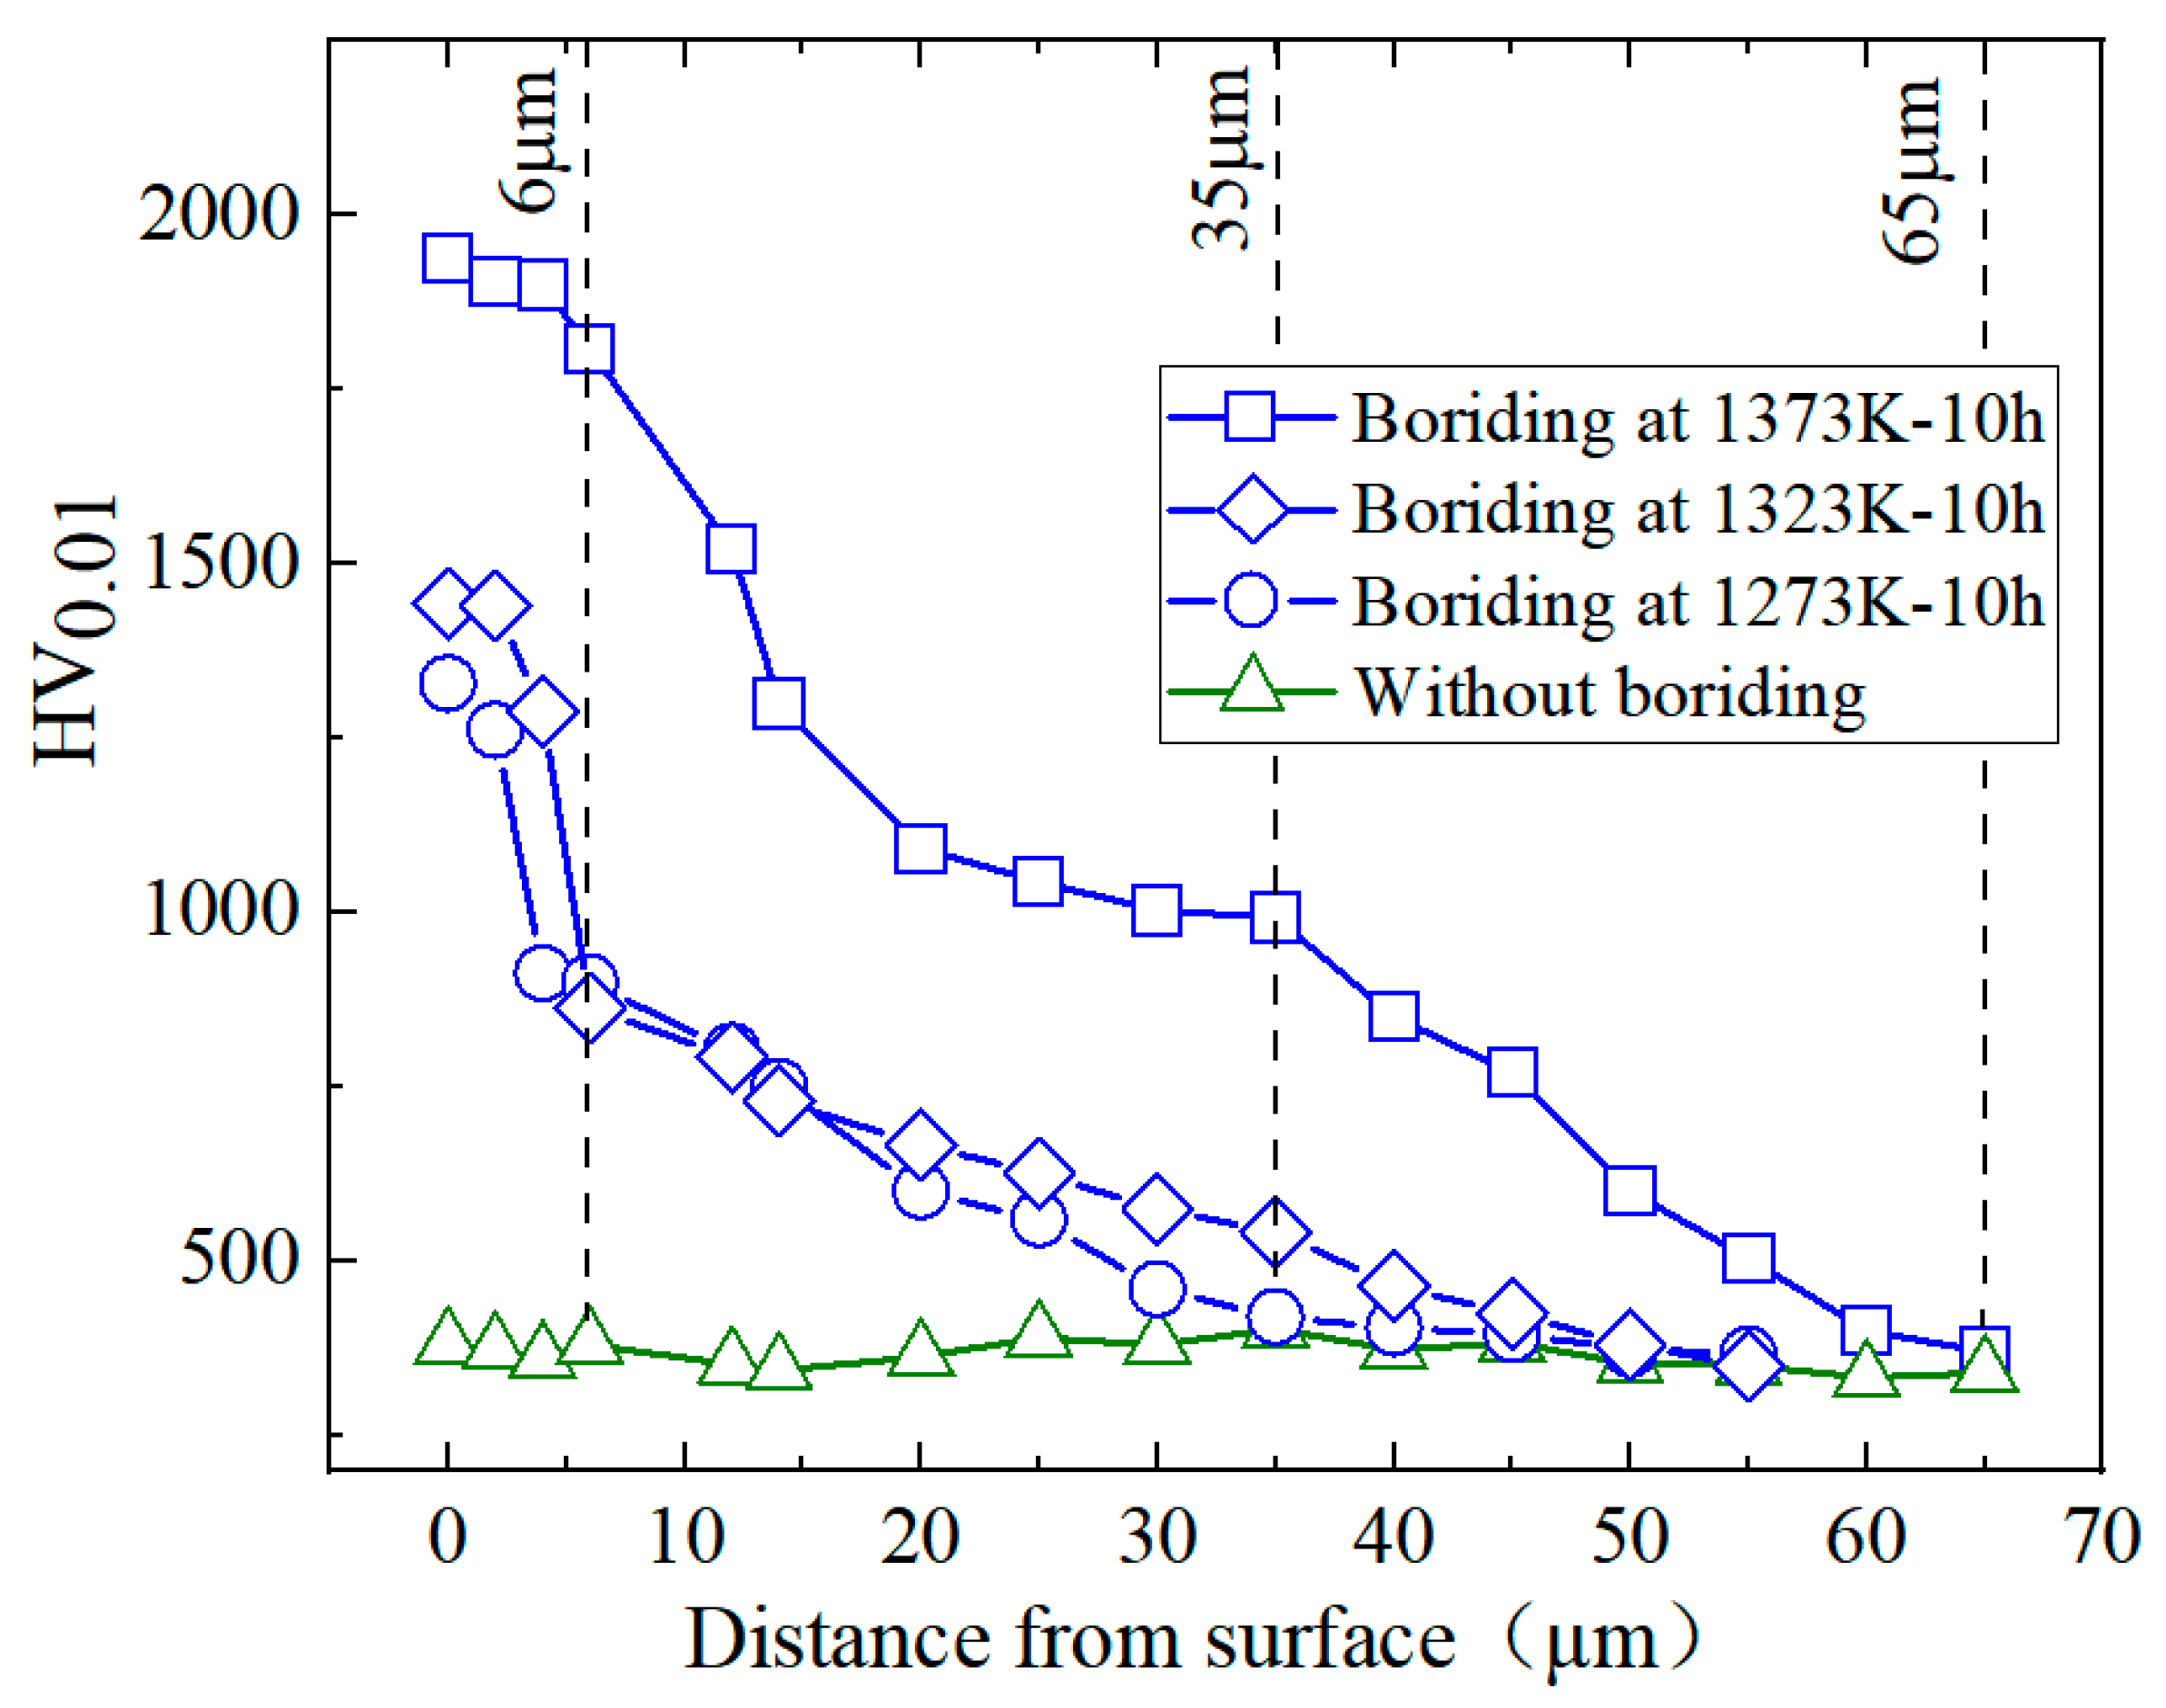
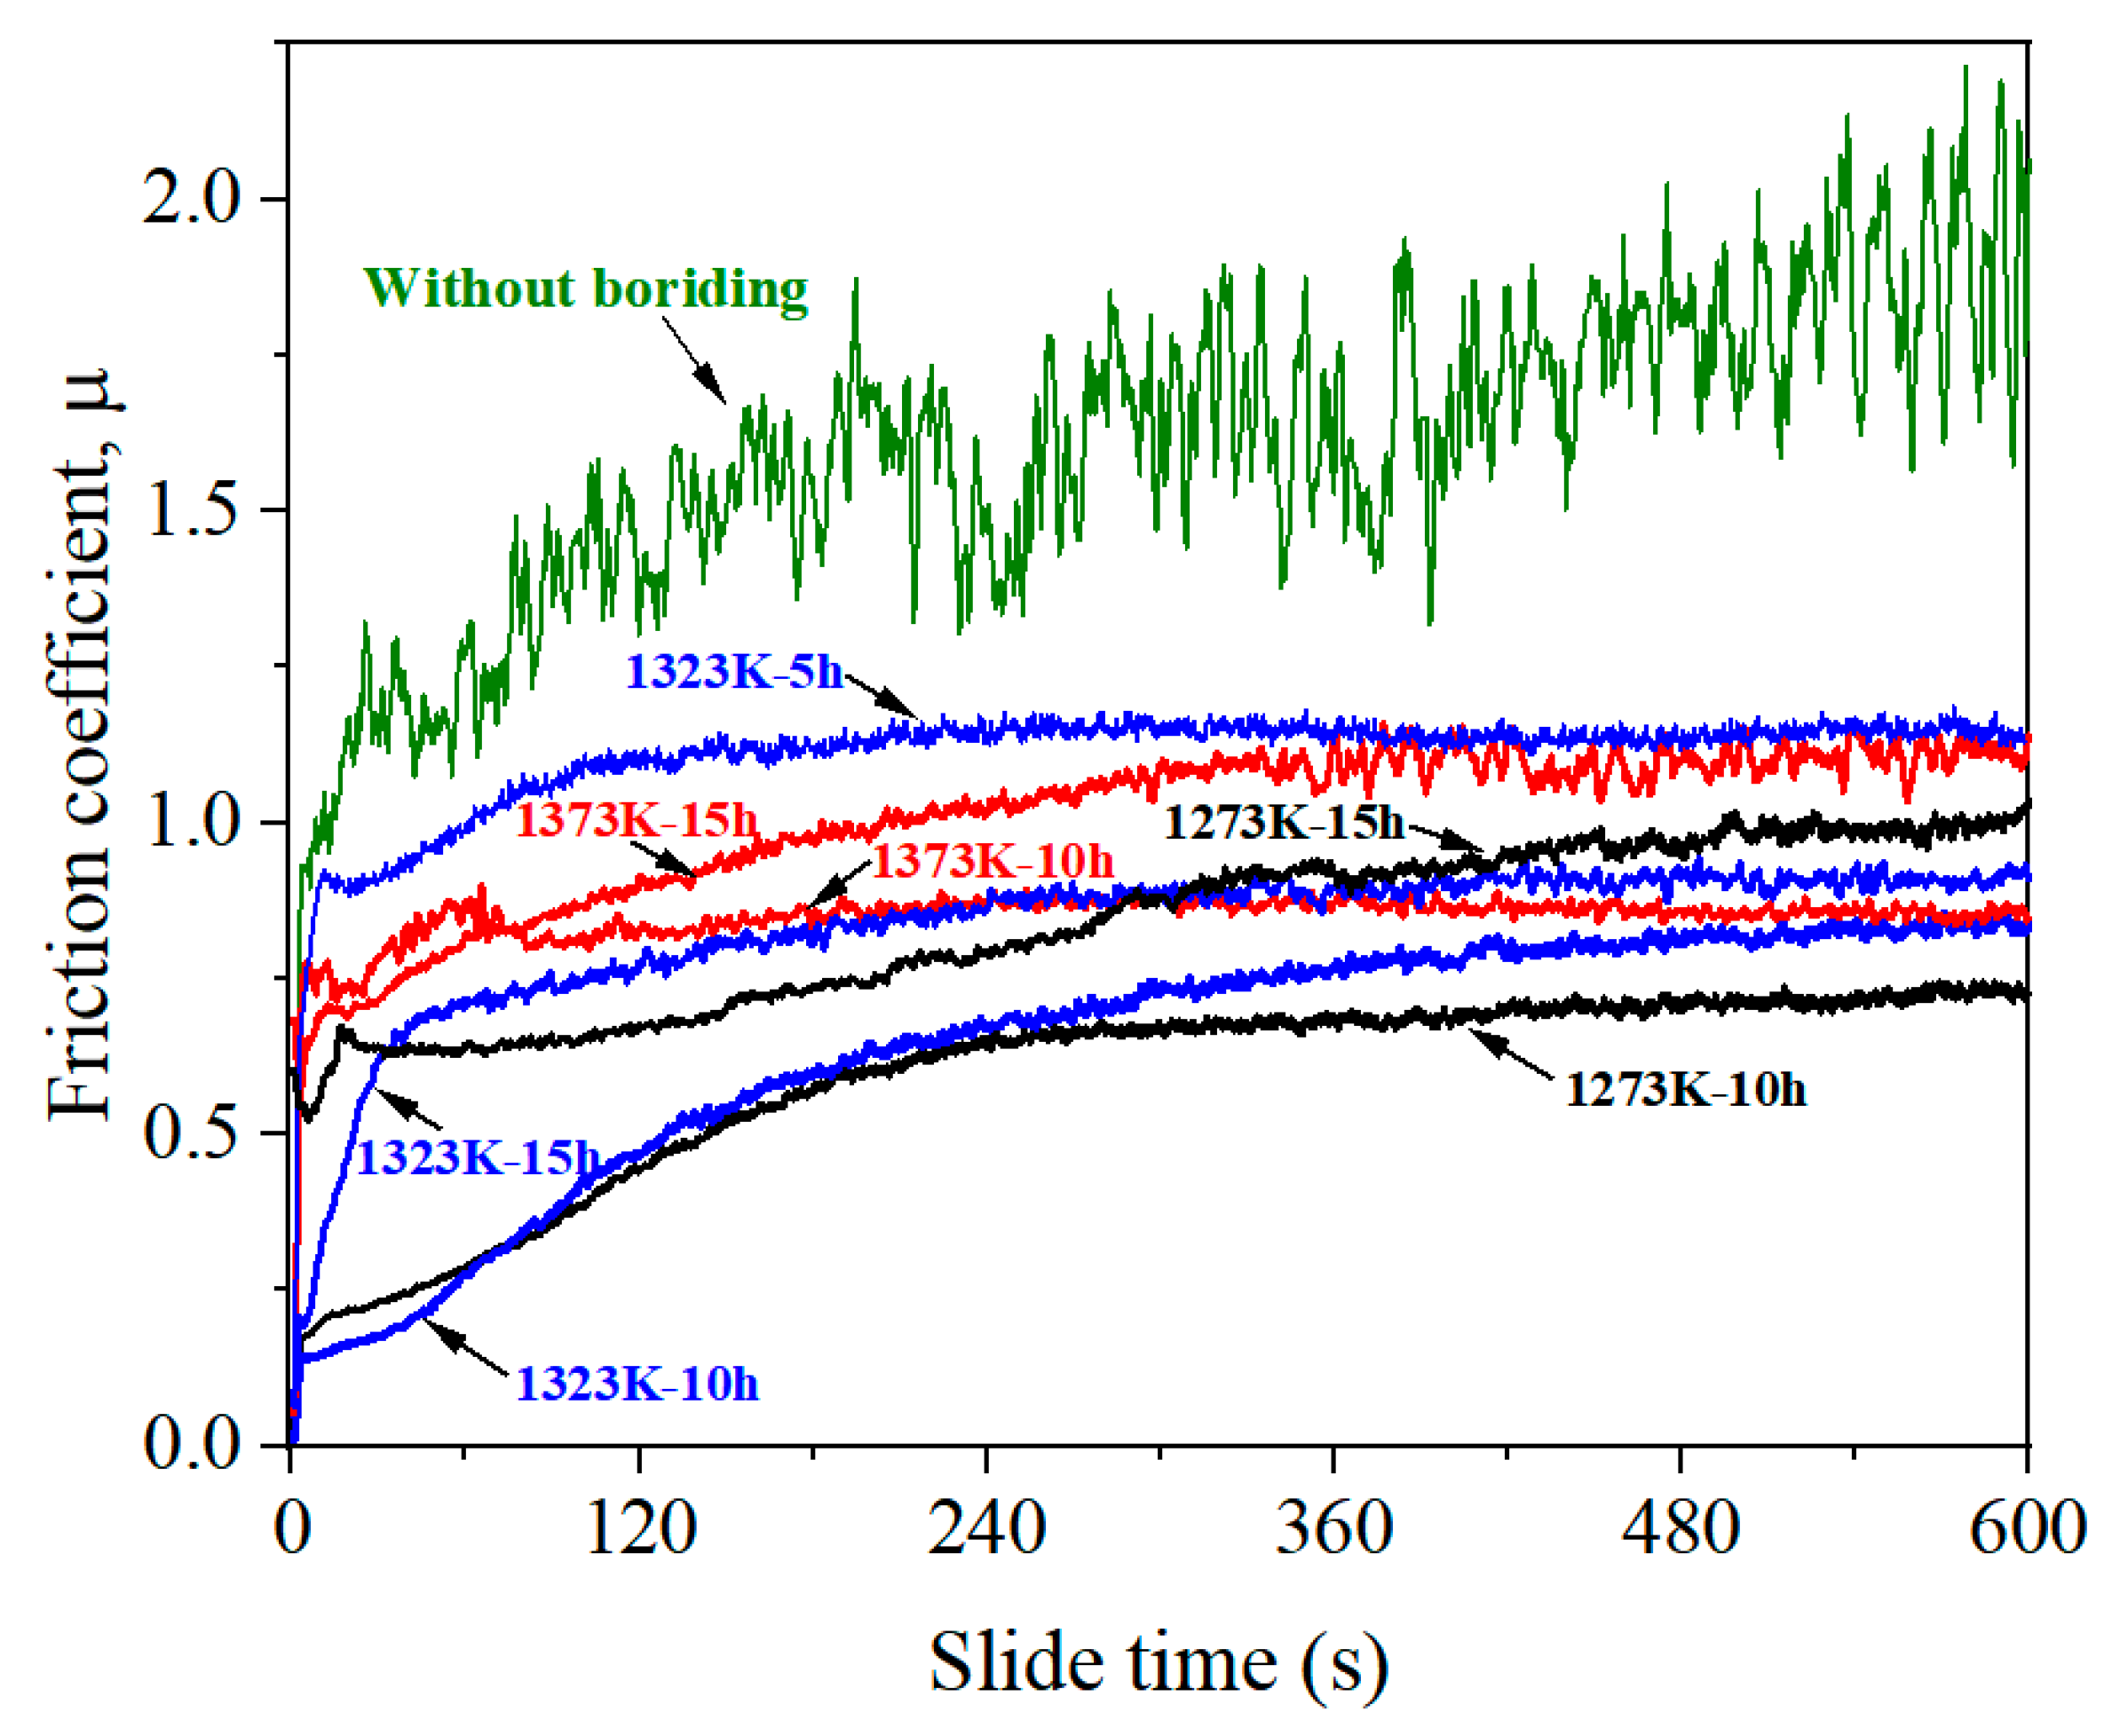
3.3. Microhardenss and Wear Properties

The variation of microhardness with distance from the surface directly affected the wear resistance of the alloy. Figure 10 presents the microhardness from the surface to the interior for the as-sintered and the alloys pack borided at different temperatures for 10 h. It can be clearly seen that the microhardness of pack-borided alloys was higher than that of as-sintered alloys within a depth of 65 μm. Moreover, the maximum microhardness of the borided alloy was located at the top of the boriding layer, and it gradually decreased from the outside to the inside; on the other hand, no changes in microhardness were observed in the as-sintered alloy. As seen in the alloy borided 1373 K and 10 h, when the distance from surface was about 6μm, the microhardness changed from 1938 HV (19 GPa) to 1808 HV (17.7 GPa), approaching that of TiB2 (22 GPa) [34], thus considered as the outer layer of TiB2 within this distance range. When the distance was in the range from 6 μm to 35 μm, the microhardness decreased continuously from 1808 HV (17.7 GPa) to 993 HV (9.7 GPa), which was close to that of TiB (18.6 GPa) [35], thereby indicating that this range of distance is regarded as the TiB layer containing the matrix. As the distance increased further to the range from 35 μm to 65 μm, the microhardenss decreased linearly down to 370 HV (3.6 GPa). The microhardenss in this range was still higher than that of as-sintered alloy, although no boride phase was observed from the microsturue analysis. This implies that this area is still considered as TiB boride dispersed in the substrate. Similar results have been observed in TiB2 alloy [17]. When the distance exceeded 65 μm, the microhardness of the borided alloy was very close to the microhardness of the as-sintered alloy (350 HV or 3.4 GPa), so this range was considered as the matrix phase. As the boriding temperature decreased, the surface microhardness of the boride layers showed a decreasing tendency. The microhardness at surface of the alloy borided at relatively low temperature (1273 K and 1323 K) for 10 h showed a relatively lower value compared to that at 1373 K. This was attributed to the insufficient growth depth of the TiB2 layer at relatively low temperatures to resist surface pressure during hardness testing. Nevertheless, it clearly shows that the microhardness of the alloy surface was significantly improved after boriding compared to the alloy without boriding. These results imply that boride layers formed by pack boriding can greatly improve the surface hardness of the alloy, which is beneficial for improving the wear resistance of the alloy.
Figure 11 shows the friction coefficient of as-sintered and borided alloys under different reciprocating sliding test conditions. The friction test indicates that pack-borided alloy had a lower value of friction coefficient than that of as-sintered alloy during all test durations, due to the high surface hardness of the borided alloy. The friction coefficients observed at 600 s in this study ranged from 0.73 to 1.13, which was near half of the as–sintered alloy. Moreover, it can be seen that friction coefficient curve of the borided alloy showed a smooth trend, indicating a significant improvement in the surface quality of the alloy after pack boriding treatment. The friction coefficient of the alloys borided at 1323 K for 5 h showed a relatively high value of 1.13, showing relatively poor wear resistance. As treatment time increased to 10 h, the break-in period length increased, and the friction coefficient approached 0.83. As the processing time increased to 15 h, the friction coefficient did not decrease but slightly increased, reaching 0.92. Although the surface hardness increased with treatment time as shown in Figure 10, the friction coefficient showed a tendency to decrease first and then increase with time. Also, the friction coefficients of the alloy after 10 h of boronization at 1273 K and 1373 K were lower than the friction coefficient after 15 h of boronization at the corresponding temperature. In general, the growth of boride layer showed an increasing tendency of hardness simply due to the formation of harder boride phases, but it was not the only reason for the improvement of the wear property of the material. According to the surface uniaxial compression model [36,37], the wear volume of the boride layers is dependent not only on hardness but also on the size of TiB phase. When the size of TiB is small, a higher dislocation density is generated in the friction test near the TiB phase, leading to more improvement in surface tensile flow stress and further improvement in friction performance of the boride layers [37]. As discussed in Section 3.1, a lot of sub-micron-sized (<0.7 μm) TiB were observed in the PM-alloys borided at a relatively low temperature (1273 K and 1323 K) and short time durations (5–10 h), and the number of these tiny TiB whiskers decreased with increasing temperature and time. When the sub-micron-sized TiB whiskers were dominant, the wear resistance may have been mainly governed by fine-grain strengthening effect of the TiB whisker. As the boriding time increased from 10 h to 15 h at a fixed temperature, the amount of sub-micron-sized TiB decreased, while the TiB whiskers continued to grow longer and thicker, resulting in a higher friction coefficient over longer treatment times. When the boriding temperature was increased to 1373 K and the time was 15 h, the sub-micron-sized TiB basically disappeared, and the TiB whiskers grew abnormally, so the friction coefficient at this condition was quite high, showing poor wear performance. When the boriding temperature was 1273 K and the time was 10 h, the alloy had a relatively large amount of sub-micron-sized TiB with a certain length of TiB layers, demonstrating the best wear performance in this study.

4. Conclusions

The PM near-α titanium alloy was successfully borided by pack boriding with CeO2 at the temperature range of 1273–1373 K for 5–15 h. The boride layers on the surface of the alloy were composed of an outer TiB2 layer, a whisker-like TiB inner layer penetrating into the substrate and sub-micron TiB flakes distributed in the TiB + matrix layer. The thickness of both the TiB2 and TiB layers increased with the boriding temperature and time, in which the growth of TiB layer was more obvious. The parabolic diffusion model was used to predict the thickness of the boride layer, and the predicted results of the model were in good agreement with the experimental data within the experimental error range. The activation energies of boron in TiB2 and TiB layers during pack boriding were determined to be 166.4 kJ/mol and 122.8 kJ/mol, respectively. As the boriding temperature and time increased, the surface microhardness of the outer TiB2 layers showed an increasing tendency. The microhardness of the TiB2 outer layer of the alloy borided at 1373 K for 10 h was determined to be 1938 HV (19 GPa), which was almost five times higher than the as-sintered alloy. The friction coefficient of the borided alloy was in the range of 0.73~1.13, which was near half of the as-sintered alloy. The lowest friction coefficient of the borided alloy was observed after boriding at 1273 K for 10 h.

Supplementary Materials

The following are available online at https://www.mdpi.com/article/10.3390/ma17194815/s1, Figure S1: Measurements of boride layer thickness of the samples borided under different conditions: (a) 1273 K for 10 h, (b) 1323 K for 10 h, and (c) 1373 K for 15 h.

Author Contributions

Conceptualization, R.P. and H.H.; methodology, R.P., B.H. and H.H.; software, R.P. and W.W.; validation, R.P. and W.W.; investigation, W.W. and B.H; writing—original draft preparation, R.P. and W.W.; writing—review and editing, R.P. and B.H.; funding acquisition, R.P. All authors have read and agreed to the published version of the manuscript.

Funding

This research was funded by the Scientific Research Foundation for High-level Talents of Anhui University of Science and Technology (No.13200456) and also supported by Anhui Key Laboratory of Mine Intelligent Equipment and Technology, Anhui University of Science & Technology (AIMTEERC202303).

Institutional Review Board Statement

Not applicable.

Informed Consent Statement

Not applicable.

Data Availability Statement

The raw data supporting the conclusions of this article will be made available by the authors on request.

Acknowledgments

Anhui Key Laboratory of Mine Intelligent Equipment and Technology, Anhui University of Science and Technology for the support.

Conflicts of Interest

The authors declare no conflict of interest.

References

  1. Lei, Z.N.; Gao, P.F.; Li, H.W.; Cai, Y. On the fracture behavior and toughness of TA15 titanium alloy with tri-modal microstructure. Mater. Sci. Eng. A 2019, 753, 238–246. [Google Scholar] [CrossRef]
  2. Williams, J.C.; Starke, E.A. Progress in structural materials for aerospace systems. Acta Mater. 2003, 51, 5775–5799. [Google Scholar] [CrossRef]
  3. Ouyang, D.L.; Hu, S.W.; Tao, C.; Cui, X.; Zhu, Z.; Lu, S. Experiment and modeling of TiB2/TiB boride layer of Ti6Al2Zr1Mo1V alloy. Trans. Nonferrous Met. Soc. China 2021, 31, 3752–3761. [Google Scholar] [CrossRef]
  4. Sarma, B.; Chandran, K.S.R. Accelerated kinetics of surface hardening by diffusion near phase transition temperature: Mechanism of growth of boride layers on titanium. Acta Mater. 2011, 59, 4216–4228. [Google Scholar] [CrossRef]
  5. Li, C.Z.; Fu, B.G.; Dong, T.S.; Liu, J.; Song, Y.; Zhao, X.; Li, G. Microstructure and dry sliding wear behavior of as-cast TiCp/Ti-1100-0.5Nb titanium matrix composite at elevated temperatures. China Foundry 2020, 6, 17. [Google Scholar] [CrossRef]
  6. Blau, P.J.; Jolly, B.C.; Qu, J.; Peter, W.H.; Blue, C.A. Tribological investigation of titanium-based materials for brakes. Wear 2007, 263, 1202–1211. [Google Scholar] [CrossRef]
  7. Zhang, J.; Yuan, H.; Zheng, X.; Tu, Y.; Ran, X.; Wang, W.; Wang, Q.y.; Lin, Y.H. Preparation and wear resistance of B–Al co-permeation layers on TC4 titanium alloy surface. Mater. Today Commun. 2024, 39, 108697. [Google Scholar]
  8. Lv, X.J.; Hu, L.Y.; Liu, J.H.; Lai, Y.Q.; Jiang, X.L.; Li, J. The growth behavior of titanium boride layers in α and β phase fields of titanium. Metall. Mater. Trans. A 2016, 47, 3573–3579. [Google Scholar] [CrossRef]
  9. Peretti, V.; Ferraris, S.; Gautier, G.; Hellmich, C.; Lahayne, O.; Stella, B.; Yamaguchi, S. Surface treatments for boriding of Ti6Al4V alloy in view of applications as a biomaterial. Tribol. Int. 2018, 126, 21–28. [Google Scholar] [CrossRef]
  10. Keddam, M.; Taktak, S. Characterization and diffusion model for the titanium boride layers formed on the Ti6Al4V alloy by plasma paste boriding. Appl. Surf. Sci. 2017, 399, 229–236. [Google Scholar] [CrossRef]
  11. Kaestner, P.; Olfe, J.; Rie, K.T. Plasma-assisted boriding of pure titanium and TiAl6V4. Surf. Coat. Technol. 2001, 142–144, 248–252. [Google Scholar] [CrossRef]
  12. Monisha, K.; Shariff, S.M.; Sekar, A.; Raju, R.; Manonmani, J.; Senthilselvan, J. Titanium boride coating by high power diode laser alloying of amorphous boron with titanium and its surface property investigations. Opt. Laser Technol. 2024, 170, 110159. [Google Scholar] [CrossRef]
  13. Li, P.; Liu, D.; Bao, Z.W.; Ma, L.S.; Duan, Y.H. Surface characterization and diffusion model of pack borided TB2 titanium alloy. Ceram. Int. 2018, 44, 18429–18437. [Google Scholar] [CrossRef]
  14. Keddam, M.; Chentouf, S.M. A diffusion model for describing the bilayer growth (FeB/Fe2B) during the iron powder-pack boriding. Appl. Surf. Sci. 2005, 252, 393–399. [Google Scholar] [CrossRef]
  15. Keddam, M.; Taktak, S.; Tasgetiren, S. A diffusion model for the titanium borides on pure titanium. Surf. Eng. 2016, 32, 802–808. [Google Scholar] [CrossRef]
  16. Li, F.; Yi, X.; Zhang, J.; Fan, Z.; Gong, D.; Xi, Z. Growth kinetics of titanium boride layers on the surface of Ti6Al4V. Acta Metall. Sin.-Engl. Lett. 2010, 23, 293–300. [Google Scholar]
  17. Liu, D.; Duan, Y.; Bao, W.; Peng, M. Characterization and growth kinetics of boride layers on Ti-5Mo-5V-8Cr-3Al alloy by pack boriding with CeO2. Mater. Charact. 2020, 164, 110362. [Google Scholar] [CrossRef]
  18. Sarman, B.; Tikekar, N.M.; Ravi Chandran, K.S. Kinetics of growth of superhard boride layers during solid state diffusion of boron into titanium. Ceram. Int. 2012, 38, 6795–6805. [Google Scholar] [CrossRef]
  19. Xing, Z.; Feng, Z.; Wu, Y.; Lu, Y.; Duan, Y.; Zheng, S.; Peng, M.; Li, M.; Wu, Y. Growth kinetics and corrosion properties of pack-borided Ti-5Al-2.5Sn alloy. Surf. Coat. Technol. 2023, 473, 130003. [Google Scholar] [CrossRef]
  20. Piao, R.; Zhu, W.J.; Ma, L.; Zhao, P.; Hu, B. Characterization of Hot Deformation of near alpha Titanium Alloy Prepared by TiH2-Based Powder Metallurgy. Materials 2022, 15, 5932. [Google Scholar] [CrossRef]
  21. Duan, Y.H.; Li, P.; Chen, Z.Z.; Shi, J.; Ma, L.S. Surface evolution and growth kinetics of Ti6Al4V alloy in pack boriding. J. Alloys Compd. 2018, 742, 690–701. [Google Scholar] [CrossRef]
  22. Yang, A.; Wu, Y.; Duan, Y.H.; Peng, M.J.; Zheng, S.J.; Li, M.N.; Yu, J. The effect of alloying elements in Ti-5Mo-5V-8Cr-3Al alloy on growth kinetics of TiB whiskers in boride layer. Mater. Des. 2023, 225, 111478. [Google Scholar] [CrossRef]
  23. Cui, G.; Yang, B.; Hou, J.; Chen, W.; Zhang, W. The Sticking Out Mechanism and Growth of TiB Whiskers from TiBw/Ti-6Al-4V Composites during Sintering. Metals 2020, 11, 1467–1478. [Google Scholar] [CrossRef]
  24. Singh, H.; Hayat, M.; He, Z.; Peterson, V.K.; Das, R.; Cao, R. In situ neutron diffraction observations of Ti-TiB composites. Compos. Part A 2019, 124, 105501. [Google Scholar] [CrossRef]
  25. Ataibis, V.; Taktak, S. Characteristics and growth kinetics of plasma paste borided Cp–Ti and Ti6Al4V alloy. Surf. Coat. Technol. 2015, 279, 65–71. [Google Scholar] [CrossRef]
  26. Makuch, N.; Kulka, M.; Keddam, M.; Taktak, S.; Ataibis, V.; Dziarski, P. Growth kinetics and some mechanical properties of two-phase boride layers produced on commercially pure titanium during plasma paste boriding. Thin Solid Film. 2017, 626, 25–37. [Google Scholar] [CrossRef]
  27. Kara, G.; Purcek, G. Boriding behaviour of titanium alloys with different crystalline structures. Surf. Eng. 2019, 35, 611–617. [Google Scholar] [CrossRef]
  28. Keddam, M. Simulation of the growth kinetics of the (FeB/Fe2B) bilayer obtained on a borided stainless steel. Appl. Surf. Sci. 2011, 257, 2004–2010. [Google Scholar] [CrossRef]
  29. Keddam, M.; Kulka, M.; Makuch, N.; Pertek, A.; Małdzinski, L. A kinetic model for estimating the boron activation energies in the FeB and Fe2B layers during the gas-boriding of Armco iron: Effect of boride incubation times. Appl. Surf. Sci. 2014, 298, 155–163. [Google Scholar] [CrossRef]
  30. Duan, Y.H.; Wu, Y.; Peng, M.J.; Qi, H.R. The interstitial diffusion behaviors and mechanisms of boron in a-Ti and b-Ti: A first-principles calculation. Comp. Mater. Sci. 2020, 184, 109866. [Google Scholar] [CrossRef]
  31. Kara, G.; Purcek, G. Growth kinetics and mechanical characterization of boride layers formed on β-type Ti−45Nb alloy. Surf. Coat. Technol. 2018, 352, 201–212. [Google Scholar] [CrossRef]
  32. Kartal, G.; Timur, S. Growth kinetics of titanium borides produced by CRTD-Bor method. Surf. Coat. Technol. 2013, 215, 440–446. [Google Scholar] [CrossRef]
  33. Fay, Z.; Guo, Z.X.; Cantor, B. The kinetics and mechanism of interfacial reaction in sigma fibre-reinforced Ti MMCs. Compos. A 1997, 28, 131–140. [Google Scholar]
  34. Munro, R.G. Material properties of titanium diboride. J. Res. Natl. Inst. Stand. Technol. 2000, 105, 709–720. [Google Scholar] [CrossRef] [PubMed]
  35. Madtha, S.; Lee, C.; Chandran, K.S.R. Physical and mechanical properties of nanostructured titanium boride (TiB) ceramic. J. Am. Ceram. Soc. 2008, 91, 1319–1321. [Google Scholar] [CrossRef]
  36. Liu, Y.F.; Liskiewicz, T.W.; Beake, B.D. Dynamic changes of mechanical properties induced by friction in the Archard wear model. Wear 2019, 428–429, 366–375. [Google Scholar] [CrossRef]
  37. Zhu, Y.S.; Liu, Y.F.; Wei, X.N.; Sun, D.; Lu, W.Z.; Ko, T.J. Tribological characteristics of the dual titanium boride layers (TiB2+TiB) on titanium alloy. Ceram. Int. 2021, 47, 13957–13969. [Google Scholar] [CrossRef]
Figure 1. Three-dimensional topography of the polished surface of the PM Ti−5.1Al−2.0Sn−3.7Zr−0.3Mo−0.3Si alloy.
Materials 17 04815 g001
Figure 2. SEM micrograph of the Ti−5.1Al−2.0Sn−3.7Zr−0.3Mo−0.3Si alloy borided at 1323 K for 10 h (a), and EDS point analysis at P1 (b), P2 (c) and P3 (d) in (a).
Materials 17 04815 g002
Figure 3. XRD pattern of the Ti−5.1Al−2.0Sn−3.7Zr−0.3Mo−0.3Si alloy borided at 1273 K for 10 h.
Materials 17 04815 g003
Figure 4. SEM micrographs of Ti−5.1Al−2.0Sn−3.7Zr−0.3Mo−0.3Si alloy borided for different condition: (ac) 1273 K for 5, 10, 15 h; (df) 1323 K for 5, 10, 15 h; and (gi) 1373 K for 5, 10, 15 h.
Materials 17 04815 g004
Figure 5. Changes in the boride layer thickness of the TiB2 layer (a), TiB layer (b) and TiB2 + TiB layer (c) under different conditions.
Materials 17 04815 g005
Figure 6. Schematic representation of B concentration profile across the boride layer. The X axis represents the depth from the surface (in μm). CS represents the B effective weight fraction in the boron source; is the upper and lower limits of B concentrations in TiB2, respectively; and denotes the lower and upper limits of B content in TiB; C0 is the solubility of B in the substrate, respectively.
Materials 17 04815 g006
Figure 7. Plots of the boride layer thickness vs. square root of boriding time: (a) TiB2, (b) TiB and (c) TiB + TiB2.
Materials 17 04815 g007
Figure 8. Linear relationship of lnD and 1/T.
Materials 17 04815 g008
Figure 9. Comparison of the calculated and experimental values of boride layer thickness: (a) TiB2, (b) TiB and (c) TiB2 + TiB.
Materials 17 04815 g009
Figure 10. Variation of microhardenss with distance from the surface for the sample borided at 1373 K for 10 h and the as-sintered alloy.
Materials 17 04815 g010
Figure 11. Friction coefficient of the sample borided at different conditions and the as-sintered alloy.
Materials 17 04815 g011
Table 1. Chemical composition of near-alpha Ti alloy (mass%).
AlSnZrMoSiTi
5.051.963.6890.320.29Bal.
Table 2. Averages thickness of the TiB2, TiB and total (TiB2 + TiB) layers at different treatment conditions.
T (K)t (h)d (μm)
TiB2TiBTiB2 + TiB
127351.5 ± 0.27 ± 48.5 ± 4
1273102 ± 0.58 ± 210 ± 3
1273154 ± 0.816 ± 420 ± 5
132352.5 ± 0.310 ± 412.5 ± 4
1323103.5 ± 0.712 ± 515.3 ± 5
1323155 ± 0.518 ± 723 ± 8
137353 ± 0.312 ± 215 ± 2
1373104.5 ± 0.518 ± 222.5 ± 3
1373156.5 ± 0.523 ± 529.8 ± 5
Table 3. Parabolic growth constants at TiB2/TiB and TiB/Ti-substrate interfaces, and diffusion coefficients at different boriding temperatures.
T (K) k 1 (μm × s−0.5) k 2 (μm × s−0.5) ( k 2 k 1 ) (μm × s−0.5) D B T i B 2 (m2 × s−1) D B T i B (m2 × s−1)
12730.0150.0760.0612.33 × 10−162.33 × 10⁻¹⁴
13230.0210.0940.0734.25 × 10−162.92 × 10⁻¹⁴
13730.0270.1250.0987.16 × 10−165.45 × 10⁻¹⁴
Table 4. The diffusion coefficients of boron in different borided Ti alloys calculated by the diffusion model of d = kt0.5.
SubstrateBoriding MethodsTβT(K) D B T i B 2 (m2 × s−1) D B T i B (m2 × s−1)
Ti5Al2Sn3.7Zr0.3Mo0.3Si
(near-α type) [Present]
Pack boriding1293 [20] 12732.33 × 10−162.33 × 10⁻¹⁴
13234.25 × 10−162.92 × 10⁻¹⁴
13737.16 × 10−165.45 × 10⁻¹⁴
Cp−Ti [18]
(α-type)
Pack boriding118311231.34 × 10−166.13 × 10⁻¹⁵
12236.92 × 10−163.25 × 10⁻¹⁴
13232.78 × 10−151.34 × 10⁻¹³
Ti6Al2Zr1Mo1V [3]
(α-type)
Pack boriding125311933.72 × 10−179.64 × 10⁻¹⁶
12731.25 × 10−163.94 × 10⁻¹⁵
13132.89 × 10−169.33 × 10⁻¹⁵
13535.22 × 10−161.81 × 10⁻¹⁴
Ti5Al2.5Sn [19]
(α-type, TA7)
Pack boriding129812482.45 × 10−141.09 × 10⁻¹⁵
12733.31 × 10−142.26 × 10⁻¹⁵
12983.87 × 10−143.49 × 10⁻¹⁵
13234.42 × 10−148.05 × 10⁻¹⁵
13485.22 × 10−141.10 × 10⁻¹⁴
Ti6Al4V [10]
(α + β type, TC4)
Plasma paste
boriding
1183 [4]9735.08 × 10−151.90 × 10⁻¹⁵
10237.25 × 10−154.32 × 10⁻¹⁵
107310.18 × 10−159.13 × 10⁻¹⁵
Ti5Mo5V8Cr3Al
(β-type,TB2) [13]
Pack boriding 12236.47 × 10−152.79 × 10⁻¹⁴
-12739.93 × 10−155.01 × 10⁻¹⁴
13231.27 × 10−149.24 × 10⁻¹⁴
13731.88 × 10−141.50 × 10⁻¹³
Ti5Mo5V8Cr3Al
(β-type, TB2) [17]
Pack boriding-12234.20 × 10−147.35 × 10⁻¹⁴
12738.42 × 10−141.06 × 10⁻¹³
13231.39 × 10−131.55 × 10⁻¹³
13732.05 × 10−131.93 × 10⁻¹³
Table 5. Diffusion activation energy of boron in the TiB2 and TiB layers.
MaterialsBording MethodModelT (K) Q B T i B 2 (kJ/mol) Q B T i B (kJ/mol)
Ti5Al2Sn3.7Zr0.3Mo0.3Si (near α-type) [present study]Pack boridingParabolic
model
1273–1373166.4122.8
Cp−Ti [15]
(α-type)
Plasma paste boridingParabolic
model
973–1073137.655.2
Cp−Ti [32]
(α-type)
CRTD based
boriding
d 2 = D t 1173–1373189.9-
Ti6Al2Zr1Mo1V [3]
(near α-type)
Pack boriding d 2 = D t 1193–1353223.1246.9
Ti5Al2.5Sn [19]
(α-type, TA7)
Pack boriding d 2 = D t 1248–134894.8 221.2
Ti6Al4V [16]
(α + β type, TC4)
Pack boriding d 2 = D t 1273–1373 65.2   ( = Q B ( T i B 2 + T i B ) )
Ti6Al4V [10]
(α + β type, TC4)
Plasma paste bordingParabolic
model
973–1073136.263.8
Ti6Al4V [33]
(α + β type, TC4)
Sigma fiber composites d 2 = D t 1143–1243187 190
Ti5Mo5V8Cr3Al [17]
(β-type, TB2)
Pack boridingParabolic
model
1223–1373158.196.2
Disclaimer/Publisher’s Note: The statements, opinions and data contained in all publications are solely those of the individual author(s) and contributor(s) and not of MDPI and/or the editor(s). MDPI and/or the editor(s) disclaim responsibility for any injury to people or property resulting from any ideas, methods, instructions or products referred to in the content.

