Article

Time-Dependent Evolution of Al–Al4C3 Composite Microstructure and Hardness during the Sintering Process

by
Audel Santos Beltrán
1,2,*,
Verónica Gallegos Orozco
2,*,
Miriam Santos Beltrán
1,
Hansel Medrano Prieto
1,
Ivanovich Estrada Guel
3,
Carmen Gallegos Orozco
4 and
Roberto Martínez Sánchez
3
1
Departamento de Nanotecnología, Universidad Tecnológica de Chihuahua Sur, Km. 3.5 Carr. Chihuahua a Aldama, Chihuahua 31313, Mexico
2
Departamento de Ciencias Básicas, Tecnológico Nacional de México, Campus Chihuahua, Ave. Tecnológico 2909, Chihuahua 31310, Mexico
3
Centro de Investigación en Materiales Avanzados (CIMAV), Laboratorio Nacional de Nanotecnología, Miguel de Cervantes No. 120, Chihuahua 31136, Mexico
4
Departamento de Económico Administrativo, Tecnológico Nacional de México, Campus Chihuahua II, Ave. de las Industrias #11101, Complejo Industrial Chihuahua, Chihuahua 31130, Mexico
*
Authors to whom correspondence should be addressed.
Materials 2024, 17(19), 4818; https://doi.org/10.3390/ma17194818
Submission received: 23 August 2024 / Revised: 16 September 2024 / Accepted: 24 September 2024 / Published: 30 September 2024
(This article belongs to the Section Metals and Alloys)

Abstract

:
In this study, Al-Al4C3 compounds were manufactured by mechanical milling followed by heat treatment. To analyze the microstructural evolution, the composites were sintered at 550 °C at different sintering times of 2, 4 and 6 h. The mechanical results suggest that dislocation density and crystallite size primarily contribute to hardening before the sintering process, with a minimal contribution from particle dispersion in this condition. The compound exhibited a significant 75% increase in hardness after 2 h of sintering, primarily attributed to the nucleation and growth of Al4C3 nanorods. The HRTEM analysis, combined with geometric phase analysis (GPA) at and near the Al-Al4C3 interface of the nanorods, revealed strain field distributions primarily associated with partial screw dislocations and the presence of closely spaced dislocation dipoles. These findings are consistent with the microstructural parameters determined from X-ray diffraction pattern analysis using the convolutional multiple whole profile (CMWP) method. This analysis showed that the predominant dislocation character is primarily of the screw type, with the dislocation dipoles being closely correlated. Based on these results, it is suggested that samples with a lower weight percentage of reinforcement and longer sintering times may experience reduced brittleness in Al/Al4C3 composites. Strengthening contributions were calculated using the Langford–Cohen and Taylor equations.

1. Introduction

Metal matrix nanocomposites (MMNCs) have recently attracted considerable interest due to their potential applications in various fields, such as aerospace, transportation, electronics, and thermal management. These advanced materials are made by integrating nanoparticles, nanowires, nanotubes, or nanosheets into a metal matrix. The result is a remarkable strength-to-weight ratio and improved mechanical, physical, and chemical properties compared to traditional materials. The specific types of MMNCs vary depending on the metal matrix chosen, which typically includes metals such as aluminum, magnesium, titanium, copper, or iron. The development of MMNCs presents critical challenges, including achieving effective dispersion of nano-reinforcement phases, optimizing interface structure, and understanding the fundamental theoretical mechanisms governing mechanical and functional properties [1,2,3].
Mechanical milling (MM) is an effective method for synthesizing a wide variety of materials, including equilibrium, out-of-equilibrium, and nanocomposite materials. Mechanical milling offers a unique capability for fabricating materials that are challenging to produce using conventional methods. However, despite its versatility, several variables must be considered for optimal results, such as the type and size of the initial powders, the milling atmosphere, the ratio of the balls to the powder, the milling speed, the size of the balls, the milling time, and the process control agent [4]. To achieve a homogeneous distribution of nanometer-sized dispersoids in a ductile matrix, this method is critical. In particular, pure Al and its alloy matrix, reinforced with particles such as aluminum oxide (Al2O3), boron carbide (B4C), titanium carbide (TiC), silicon carbide (SiC), titanium dioxide (TiO2), titanium diboride (TiB2) and aluminum carbide (Al4C3), possess improved properties in tribology, mechanics, and corrosion [5]. Specifically, the Al4C3 intermetallic phase exhibits outstanding physical and mechanical properties, such as heat resistance, thermal cyclic resistance, wear protection, and low linear expansion. However, it has been reported that excessive Al4C3 could adversely affect the mechanical properties due to the intrinsic fragility of this phase [6]. Various techniques are commonly combined in the fabrication of Al/Al4C3 composite materials. These include mechanical milling (MM) followed by sintering, MM with extrusion, spark plasma sintering (SPS) combined with hot extrusion, SPS with MM, and hot pressing. Researchers have proposed multiple methods to integrate Al4C3 nanoparticles into the Al matrix, utilizing carbon-based starting powders such as graphite, fullerene, or graphene oxide (GO). The primary objective is to facilitate the precipitation of Al4C3 during heat treatment [7,8,9,10,11].
The mechanical properties of nanocomposite materials are influenced by the type and characteristics of the metal-reinforcing interface; therefore, it is crucial to identify the origin of heterogeneous microdeformations associated with these interfaces. It has been previously reported that the density of dislocations within metal–ceramic (M-C) interfaces becomes dominant throughout the crystal due to the high-volume fraction of these interfaces [12].
In order to adjust the parameters of the mechanical milling manufacturing process and obtain the required microstructure and mechanical properties, it is crucial to determine the relative contributions of reinforcement factors in composite materials [13]. The total strength of a material is derived from the cumulative effect of several factors, including grain limit reinforcement (σGB), precipitation reinforcement (σp), solid solution reinforcement (σss), Peierls–Nabarro friction (σPN), and dislocation reinforcement (σd). Each of these elements contributes to overall reinforcement, and their combined effect can be summarized as follows [14]:
σtot = σGB + σp + σp + σpn + σd
The total hardness of a material can be determined by quantifying the various contributions using experimental results. Once calculated, this estimated total hardness can then be compared with the hardness measured experimentally for comparison and analysis.
The Convolutional Multiple Whole Profile (CMWP) fitting method has demonstrated its efficacy in determining the microstructural parameters such as dislocation densities (arrangements and character), and crystallite size distributions. CMWP fitting is performed using the CMWP software (http://csendes.elte.hu/mwp/. Accessed 26 June 2023) created by G. Ribárik and T. Ungár [15]. The examination of diffraction peaks using the CMWP software relies on microstructural models, assuming that the microstrains within the material matrix primarily result from the existence of dislocations. The observed diffraction pattern is fitted to a theoretically generated pattern, which takes into account the influence of dislocations (via average dislocation contrast factors) and the distribution of crystallite sizes. This fitting is achieved using five parameters: strain anisotropy parameter q, variance of the lognormal crystallite size distribution sLN, effective outer cut-off radius of dislocation R * e , dislocation density r, and crystallite size L0. These five parameters are represented as a, b, c, d, and e, respectively, in the CMWP software, as follows:
q = a
σ L N = c 2
ρ = 2 π ( b B u r g e r s d ) 2
R * e = exp ( 1 4   ) 2 e
L 0 = 2 3 exp ( 5 4 c 2 + b )
The d and e parameters are related to the dislocation density and effective outer cut-off radius of dislocations, respectively. The q value is the dislocation character (edge versus screw). The theoretical character of the dislocations q parameter is obtained from [16].
The theoretical q parameter is subsequently compared with the experimental q obtained from the CMWP program. If the value of the experimental q parameter closely aligns with the q value estimated for edge dislocations, then the dislocations are characterized as edge dislocations. Conversely, if the experimental q value closely matches the q value estimated for screw dislocations, then the dislocations exhibit a screw character, as described by T. Ungar et Al. Finally, if the experimental q value falls near the average of the edge and screw q values, the dislocations are considered to have a mixed character. The arrangement parameter M is expressed as [17,18]:
M = R * e ρ
The dimensionless parameter M = R e ρ   describes the arrangement of dislocations, where the physical significance of Re (the effective outer cut-off radius of dislocations) aligns with that in the elastic stored energy of dislocations. M assumes a high value when dislocations are unrelated and randomly dispersed, causing their associated strain fields to extend over a significant distance. In such cases, M exceeds one (i.e., M > 1). Conversely, when dislocations of opposing signs are closely correlated and situated near each other, resulting in strain fields that extend over a short distance due to screening, M assumes a low value (M < 1) [15].
In our research, we synthesized Al4C3 powder through mechanical milling of aluminum and graphite, followed by thermal treatment. Our analysis focused on three key factors contributing to the strengthening of the aluminum matrix: dislocation density, crystallite size, and particle dispersion. Additionally, we compared the strain field distribution at the metal–nanorod interface with the microstructural parameters observed in CMWP.

2. Materials and Methods

The Al4C3 reinforcement powder was produced through a reaction between Al and C following the methodology outlined in our previous work [19]. The resulting powder (named mixture powder Mix) consists of approximately 51 wt.% Al4C3 particles with an average size of 13 nm, around 3 wt.% of C phase with an average size of 20 nm, and the remaining portion is composed of Al. The Al composites were produced by mixing Al powder (99.5% purity, Sigma-Aldrich, St. Louis, MO, USA) with 1 and 2 wt.% of Mix, each Al–Mix mixtures were mechanically milled in a high energy Simoloyer mill (Zoz GmbH, Wenden, Germany) for 8 h. Argon was used as the milling atmosphere and ~4 mL methanol as a process-control agent. The device and milling media used were made from hardened steel. The milling ball to powder weight ratio was set to 50:1. Consolidated samples of 6 mm diameter and 12 mm length were obtained by pressing the powder mixtures for 2 min at ~1250 MPa in uniaxial load. After that, the samples were sintered at different times: 2 h, 4 h and 6 h at 550 °C. Table 1 describes the nomenclature, composition and sintering times composites, the first number indicates the wt.% of the mixture powder M and the second one indicates the sintering time. The composites were studied by X-ray diffraction and Transmission Electron Microscopy (TEM). The diffraction profiles were measured by a Philips X’pert powder diffractometer using a Cu cathode (l = 0.15406 nm). The step size and step time were 0.02° and 5 s, respectively. The X-ray diffraction peak profile analysis was carried out to determine the crystallite size distribution and the dislocation density of the nanocomposites studied using the CMWP fitting procedure program. TEM characterization was performed using electron microscopy (JEOL Ltd. (Tokyo, Japan) JEM-2200FS equipped with a 200 kV field emission gun (FEG) and energy dispersive spectrometer (EDS) (JEOL Ltd., Seefeld, Germany)). For the preparation of TEM samples, a focused ion beam (JEM9320FIB) technique was used. Vickers hardness (HV) was measured by a Hardness tester (FM-07) (Future-Tech Corp., Wenden, Germany), using an indentation time of 10 s and a maximum load of 200 g.

3. Results

3.1. Microstructural Analysis

Figure 1a,b display TEM bright-field and dark-field images, respectively. The corresponding selected area diffraction (SAD) patterns (visible in the inset) reveal the distribution of the Al4C3 phase within the Al matrix.
The microstructural, morphological phase and dislocation strain distribution characteristics are revealed through the TEM-HRTEM imaging study. Figure 2a–c present the brightfield TEM images, illustrating the distribution of Al4C3 nanoparticles within the Al matrix, adopting a nanorod morphology (some of the nanorods are indicated by arrows for clarity).
Histograms with overlaid distribution curves of nanorod sizes, determined from TEM images for Al-22, Al-24, and Al-26 samples, are graphically represented in Figure 3a–c, respectively. The graphs also display the mean and standard deviation parameters obtained from histograms fitted to a log-normal function.
High-resolution transmission electron microscopy (HRTEM) analyses were conducted in the vicinity of Al4C3 nanorods in samples with 2 wt.% of Mix sintered at intervals of 2, 4, and 6 h. Figure 4a, Figure 5a, and Figure 6a illustrate the selected region adjacent to the Al4C3 nanorod, along with the associated digital diffraction pattern based on the results of the Fast Fourier Transform (FFT) (obtained using GATAN software DigitalMicrograph 3.6.1, Gatan Inc.). The digital diffraction pattern conducted in Zone A on the Al-22 sample shows the Al phase oriented along the [011] direction. Using Geometric Phase Analysis (GPA), we determined the projected 2D strain tensor component, represented by ε, with the assistance of CrysTBox software (version 1.10) [20]
To calculate the geometric phase using the methodology proposed by M.J. Hytch and colleagues [21], we selected two primary reciprocal lattice vectors (g1(111) and g2(200)) corresponding to the Al phase from the digital diffraction pattern.
The strain field (εxy) distribution within the specified region A is depicted in Figure 4b. This image reveals how the strain fields are influenced by the presence of dislocations within the examined region. In Figure 4c, we observe the enlarged FFT-filtered image obtained from the selected region B (see Figure 4b). The image shows the fringes associated with the (111) Al lattice plane. Figure 4d provides an enhanced view of the strain field (εxy) distribution within the specified region B. The detailed relationship between lattice defects and strain fields (dislocations and stacking faults) is observed in Figure 4c,d.
The HRTEM image at the interface of an Al4C3 nanorod corresponding to the Al24 sample is shown in Figure 5a. The digital diffraction pattern inset obtained via FFT from region A indicates that this region corresponds to the aluminum Al phase, which is oriented along the [011] zone axis. The FFT-filtered image of region A using the (111) plane of the digital diffraction pattern, is shown in Figure 5b. This image illustrates the distribution of dislocations within the examined region. For calculating the geometric phase, two primary vectors in reciprocal space were chosen: g1 = 111 and g2 = 200 from de digital diffraction pattern. Strain field distribution (εxy) within the specified region A is depicted in Figure 5c. Figure 5d provides an enhanced view of the specific area B of both Fourier-filtered and strain field images, detailing how the deformation fields are influenced by the presence of dislocations.
In Figure 6a, we observe the HRTEM image of an Al4C3 nanorod taken from the Al26 sample. The digital diffraction patterns corresponding to a region inside the nanorod (region A) and a region outside the nanorod (region B) are visible. Area A corresponds to the Al4C3 phase oriented along the [100] zone axis, while area B corresponds to the Al phase, oriented along the [101] zone axis. The Fourier-filtered images using the (015) plane for the Al4C3 phase (area A) and the (101) plane for the Al phase (area B), are shown in Figure 6b,c, respectively. The images display the dislocation distribution within the examined regions. For calculating the geometric phase, two primary vectors in the reciprocal space of the FFT image, were chosen: g1 = 015 and g2 = 006 and g1 = 021 and g2 = 101 for the Al4C3 and Al phase, respectively. The distribution of strain fields (εxy) localized at the dislocations for Al4C3 and Al is depicted in Figure 6d,e, respectively.
Table 2 provides the following values obtained from X-ray diffraction patterns using the CMWP technique for each sample: the average dislocation density, r, the area average mean crystallite size, <x> area and the median and variance, m and sLN, of the log-normal size distribution function, the q experimental parameter, the average character number, M and the effective outer cut-off radius Re of dislocations.
The size distribution curve of crystallites was modeled using the log-normal distribution function, f(x), defined by Equation (8) [22]:
f ( x ) = 1 2 π σ · 1 x · e x p { [ ln ( x / m ) ] 2 2 · σ 2 }
This function depends on the median, m, and the variance, σ parameters determined from X-ray analyses (see Table 2). The results corresponding to the concentration of 1 and 2% by weight of Mix and subjected to 0, 2, 4 and 6 h of sintering, are shown in Figure 3a,b, respectively.

3.2. Hardness Analysis

By expressing the microhardness (H) as the sum of each of the strengthening contributions in the Al composites, the following equation proposed by Cahn et al. [23] was used:
H = HPN + HSS + HD + HC + HP
where HPN is the Peierls–Nabarro strengthening hardness contribution, HSS is the contribution caused by solid solution, HD is the dislocations contribution, HC is the contribution by crystallite size, and HP is the direct contribution by particle dispersion. Following the methodology outlined in prior studies [24], we computed the values of HL, HD, HC, and HP. Here, HL represents the sum of HPN and HSS. Table 3 presents the individual hardening contributions calculated using Vickers Hardness (VH) for each sample. Additionally, the table provides the experimental microhardness, HEXP (VH), along with its corresponding standard deviation (SD).

4. Discussion

The discussion about classical mechanisms contributing to hardness, such as solid solution, Peierls–Nabarro, dislocation, grain size, particle dispersion and precipitation, can be found in our previous work [19,24]. During mechanical milling, numerous linear defects are induced in the aluminum matrix. These defects include dislocations generated by shear forces resulting from the impact of the milling media. In the early stages of milling, dislocations organize and form small-angle sub-boundaries. As the milling process advances, a nanostructured state composed of fine crystallites develops [25]. At this stage of the process, the aluminum matrix experiences an increase in its strength, mainly due to the reduction in crystallite size and the increase in dislocation density. On the other hand, during the sintering process, recovery, recrystallization, and grain growth are promoted, which negatively impact the mechanical properties of the composite.
Based on the results obtained from the CMWP, the logarithmic distribution of the normal grain size (as shown in Figure 7a,b) reveals a significant difference between the curves of the samples in the green state and those sintered for 2, 4, and 6 h (for both samples 1 and 2 wt.% of Mix). The findings indicate that the dispersion of crystallite size values increases with longer sintering times. On the other hand, the behavior of dislocation density concerning sintering time and the samples in the green state can be observed in Table 2. Specifically, in the green samples, relatively high dislocation density values were observed (~28 × 1014 m−2); however, in the sintered samples, a significant decrease is evident, with dislocation density values around ~1.8 × 10¹⁴ m−2 after 6 h of sintering in the samples containing 1 wt.% of Mix. Similar trends were observed in samples with 2 wt.% of Mix. In this study, the strengthening of the Al matrix was attributed to a combination of various mechanisms, including Peierls–Nabarro and solid solution strengthening (HL), dislocation density strengthening (HD), grain boundary strengthening (HD), and the Orowan effect (HP), as exposed in Equation (9). Based on the results obtained from the individual hardening contributions calculated (refer to Table 3), the value of the experimental microhardness is equated to the sum of three main contributions to hardening: HL + HD + HC values. For more clarity, the graph in Figure 8 depicts the microhardness as a function of sintering time for samples containing 1 wt.% and 2 wt.% of Mix. The columns specify the calculated strengthening contribution, denoted as HL + HD + HC, as well as the contribution from particle dispersion, represented by HP. The latter is determined as the difference between the experimental microhardness (HEXP) and the sum of HL + HD + HC (refer to Table 3). According to these findings, during mechanical milling, fine and irregular particles of Al4C3 disperse within the aluminum matrix, primarily contributing to the generation of dislocation density and reduction in crystallite size in the green state. It is noteworthy that for the samples in the green state (Al-10 and Al-20), an important contribution to hardening is attributed to dislocation density (HD) and crystallite size (HC), while a smaller contribution to hardening is observed due to Al4C3 nanoparticle dispersion, HP (see Figure 8). These nanoparticles were observed using TEM conducted on the Mix powder, which was used to reinforce the Al matrix. Figure 1a,b present TEM bright-field and dark-field images, respectively, accompanied by the corresponding selected area diffraction (SAD) pattern (inset). These images reveal the distribution of the Al4C3 phase, which exhibits an irregular shape and ranges in size from approximately 5 nm to 20 nm.
On the other hand, after 2 h of sintering in both samples with 1 and 2 wt.% of Mix, a noticeable reduction in the combined effect of contributions (HL + HD + HC) was observed. Subsequently, a gradual decrease occurs at 4 and 6 h of sintering, as shown in the graph in Figure 8. However, the strengthening effect from particle dispersion (HP) intensifies after 2 h of sintering, reaching a dispersion strengthening value (HP) of approximately 160 HV (~80% higher than the green state sample, Al-10) in samples with 1 wt.% of Mix. In samples with 2 wt.% of Mix, a similar behavior was observed, with an increase of ~100% over the green state sample, Al-20. Moreover, a reduction was observed as the sintering time extended from 4 to 6 h, resulting in hardness values (HP) of approximately 60 HV for both samples with Mix contents of 1 and 2 wt.%. The results indicate that second phase precipitation with sintering significantly influences the Al matrix strengthening. Brightfield TEM images of the Al-22, Al-24, and Al-26 samples in Figure 2a–c, respectively, reveal a homogeneous dispersion of nanorod-like Al4C3 particles, which are responsible for the increase in hardness. On the other hand, the decrease in hardness of the aluminum matrix with sintering time is associated with the increase in nanorod size. Based on the histograms with overlaid distribution curves of nanorod sizes shown in Figure 3a–c, it becomes evident that as sintering time increases, there is an enlargement in the size of nanorods. The average media and standard deviation values obtained from histograms fitted to a log-normal function (values inset in each graph) increase from 57.5 (0.220) for the Al22 sample to 70.5 (0.315) for the Al24 sample, and finally to 64.2 (0.339) for the Al26 sample. In summary, during the mechanical milling (MM) process, fine and irregular Al4C3 particles are dispersed within the Al matrix. During the initial 2 h of sintering, these particles transform into Al4C3 nanorods, which continue to grow as the sintering period extends from 4 to 6 h. According to Lee et al., smaller particles grow at the expense of larger ones [26]. Consequently, this leads to an increase in the interparticle distance. The Orowan strengthening equation predicts a decrease in yield stress as the interparticle mean free path for dislocation motion increases [27]. The reduction in the strengthening dispersion effect (HP) particles with increasing sintering time, as depicted in Figure 8, can be reasonably attributed to the formation of larger particles, as expressed above.
For the design of this type of composite, it is essential to consider that short sintering times have a positive effect on the mechanical properties. However, it is crucial to ensure that the sintering time is sufficient for the carbon phase to fully transform into the Al4C3 phase. On the other hand, excessively long sintering times can cause excessive growth of the nanorods, which negatively impacts the mechanical properties.
On the other hand, one of the issues encountered in metal matrix composites reinforced with ceramic particles is the generation of lattice dislocations near the interface, which can lead to the failure of a weak interface [28,29]. Various authors have reported the fragility of Al–Al4C3 composites [30]. The residual stresses are attributed to the mismatch of coefficient of thermal expansion (CTE) between the reinforcement and the Al matrix during the heating/cooling fabrication process and are directly related to the level of expansion coefficient mismatch between the matrix and reinforcement [31,32]. Previous investigations have reported various types of defects at the metal–ceramic interface, including edge and screw dislocations, planar defects such as twin boundaries and stacking faults, and low-angle twist boundaries, among others [33]. Other researchers have reported low-angle twist boundaries, which consist of a network of screw dislocations with the Burgers vector lying within the boundary plane [34,35,36].
From the analyses conducted using HRTEM and the GPA method near and at the nanorod interfaces, we observed strain field distributions primarily associated with partial screw dislocations accompanied by stacking faults. Additionally, edge dislocations with opposite signs, known as edge dislocation dipoles, were observed. The formation of edge dislocation dipoles is associated with the motion of screw dislocations containing dislocation jogs [37,38,39].
The HRTEM image analysis of the Al-22 sample revealed strain fields resulting from dislocations within the aluminum matrix near the nanorod (region A), as shown in Figure 4a,b. The image shows that the presence of these strain fields increased in areas near the nanorod interface. In the filtered image of Figure 4c, we observe typical dissociated screw dislocations composed of partial dislocations connected by an intrinsic stacking fault in the (111) plane. Figure 4d depicts the strain field corresponding to the filtered image, revealing the presence of dislocation dipoles.
Similar results were obtained from the HRTEM image analysis of the Al24 sample. In Figure 5b,c is observed the Fourier-filtered and strain fields of a specific area B, respectively. The filtered Fourier image (see Figure 5b) reveals the presence of dipoles in the Al phase near the nanorod, while Figure 5c illustrates the distribution of strain fields in this same region. Figure 5d and Figure 5e present magnified views of the filtered Fourier image and the strain fields in area B, respectively. The image details the presence of partial dislocations connected by a stacking fault. Figure 6 presents a comparative view of the Fourier-filtered and the strain field distribution images of the Al4C3 and Al phases at the Al–nanorod interface region of the Al-26 sample. In the filtered image of Figure 6b, there are virtually no defects observed in the atomic planes corresponding to the Al4C3 phase. In contrast, the Al phase region (Figure 6c) shows an intrinsic stacking fault in the (111) plane, resulting from dissociated screw dislocations. Figure 6d,e compare the strain fields in the Al4C3 and Al phases, respectively. A greater presence of deformation fields including dislocation dipoles is observed in the Al phase region. However, for the Al4C3 phase region, the strain fields are mainly located near the Al4C3-Al interface. Dislocation dipoles are better observed in the images of the strain field distribution. Dislocation dipoles were typically identified by a localized point of deformation, visible as a small blue and red area, connected by a thin red or orange band. In the strain field distribution, the green color in the strain images corresponds to the unstrained lattice plane, strains are positive and tensile in the red region, while the lattice is negative and compressive in the blue region.
These results are consistent with the parameter values derived from the CMWP adjustment. The experimental q parameter value, presented in Table 2, ranges between 1.03 and 1.58, while the calculated q, following the methodology described by T. Ungar et al., q = 1.31 is for pure screw dislocations and q = 0.33 for pure edge dislocations. These data lead to the interpretation that the predominant dislocation character within the samples is primarily of the screw type. Conversely, most samples exhibit an average M value of less than one, indicating a pronounced dipole character in the dislocations. This suggests a strong correlation with adjacent dislocations, leading to strain fields that are predominantly short-range due to the screening effect [15]. These results align with the analysis of the HRTEM images, in which closely correlated dipole dislocations are observed in close proximity to each other.
The evolution of dislocation density as a function of sintering temperature is clearly observed in both graphs. The green state samples show high dislocation density values due to the mechanical milling process, reaching an average of 28 × 1014 m−2 and 17 × 1014 m−2 for the samples with 1 wt.% and 2 wt.% of Mix, respectively. However, a significant decrease is observed after 2 h of thermal treatment, attributed to recrystallization and restoration processes, with dislocation density dropping to approximately 5 × 10¹⁴ m−2 for both samples. These values remain practically unchanged after 4 and 6 h of sintering. This outcome is attributed to the competition between recrystallization and grain growth mechanisms, as well as the generation of dislocations caused by thermal mismatch between the matrix and the Al4C3 nanorods during sintering. On the other hand, as shown in both figures, for most of the samples in both the green and sintered states (1 and 2 wt.% of Mix), the dipole character parameter, M, is below 1, with values between 0.3 and 0.75 indicating a strong correlation between the dislocation dipoles in these samples. It has been reported by J.J. Gilman [37] that there is a direct relationship between dislocation dipole concentration and plastic strain, and that dipoles can also act as initiators of fracture. Also, the density of dislocation dipoles is often very high, which can significantly impact the mechanical properties of crystalline materials [40]. Therefore, the reported fragility of Al–Al4C3 composites may be related to the arrangement of dislocations (M). Samples that show an M < 1 indicate an accumulation of dislocation dipoles with a strongly screened strain field at the Al/Al4C3 nanorod interface, resulting in brittle behavior of the composite. On the other hand, the sample sintered for 6 h (Al-16 sample) showed a notable increase in the M value to 1.4 (see Figure 9a), suggesting that the dislocation dipoles are no longer closely correlated and instead display random dispersion and may exhibit reduced brittleness. This occurs because, under these conditions, the dislocation dipoles lack close correlation and are randomly dispersed at the Al/Al4C3 nanorod interface. This finding aligns with Gilman’s observation that the generation of dislocation dipoles causes hardening, while the annihilation of these dipoles leads to recovery.
Accordingly, achieving high hardening values in the aluminum matrix can be important for certain technological applications. Nevertheless, it is essential to emphasize the importance of developing Al/Al4C3 composites with reduced brittleness, without compromising their strength, for use in applications that demand such performance characteristics. Table 4 compares the mechanical properties (maximum tensile stress and microhardness) of the Al–Al4C3 composites obtained in this work with those reported by other authors in the literature. The results clearly indicate that the amount of Al4C3 nanoparticles dispersed in the Al matrix depends on the type of heat treatment, the amount of carbon, and the C phase employed. For example, when 7.5 wt.% of both C and fullerene were used, the carbon in the Al/fullerene composite was completely transformed into Al4C3, resulting in a microhardness of 292 HV. In contrast, the Al/graphite composite achieved a hardness of 188 HV, as the transformation to Al4C3 was only partial. In our work, the precipitation of Al4C3 nanoparticles was promoted because the initial powder mix (Mix) contained very fine, irregular Al4C3 particles. These particles were introduced into the aluminum matrix through mechanical milling (MM) and subsequently transformed into Al4C3 nanorods after relatively short sintering times.

5. Conclusions

Al–Al4C3 nanocomposites were synthesized through high-energy ball milling followed by a sintering process. The study found that a minimal concentration of Al4C3 and a brief sintering time were sufficient to effectively reinforce the aluminum matrix. The key findings of this study include:
-
The strengthening effect, as determined from the CMWP and Taylor equations for the green state samples:
The strengthening contributions to the aluminum matrix from grain size and dislocation density were calculated based on microstructural analysis using X-ray diffraction (XRD) with the CMWP method. The contribution from particle precipitation was estimated as a residual effect. According to the results, in green state samples, dislocation density is the primary factor in the hardening of the Al matrix, followed by crystallite size, with particle dispersion contributing negligibly.
-
The strengthening effect for samples sintered for 2, 4, and 6 h was evaluated using the CMWP and Taylor equations:
For samples sintered for 2 h, the primary strengthening mechanism is attributed to the nucleation and growth of Al4C3 nanorods (particle precipitation), along with increased dislocation density, leading to an approximate 75% increase in hardness. However, samples sintered for 4 and 6 h exhibited a significant decline in mechanical properties, primarily due to the excessive growth of the nanorods.
-
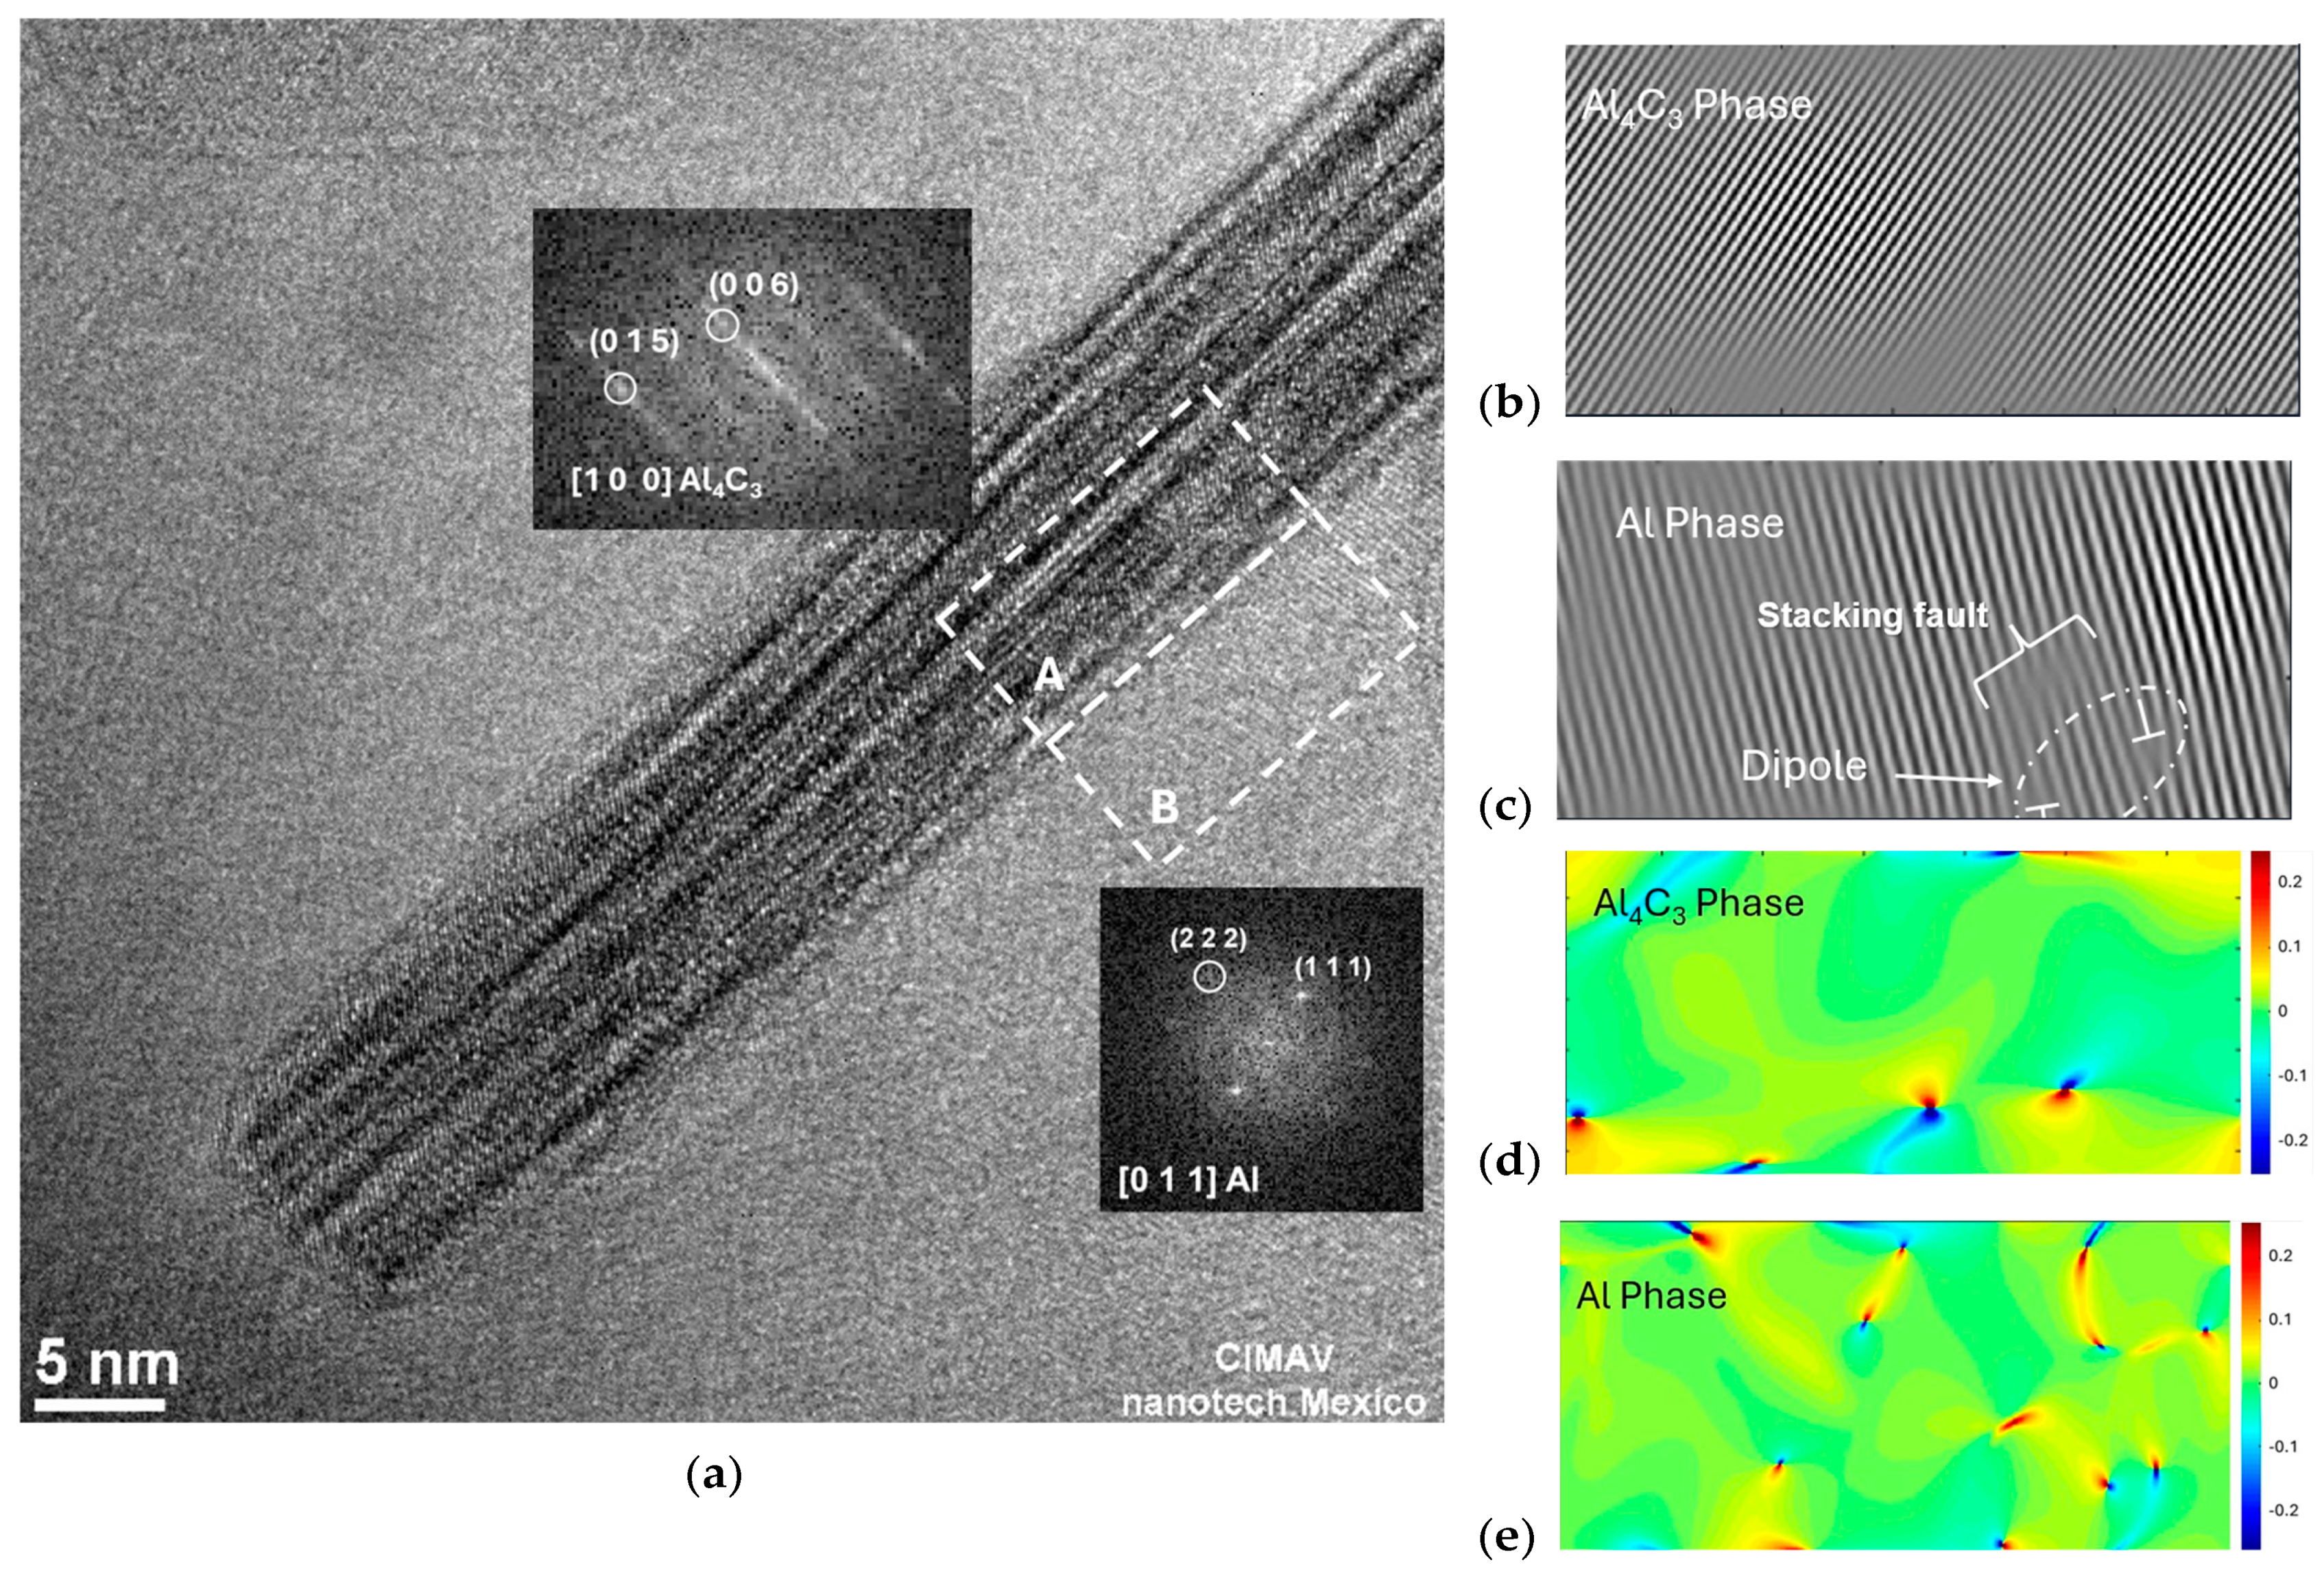
HRTEM analysis combined with geometric phase analysis (GPA):
Analyses of the Al–nanorod interface revealed strain field distributions, primarily composed of edge dislocation dipoles formed by the movement of screw dislocations with jogs through the crystal lattice. The study found that screw dislocations were the dominant type within the samples, with closely correlated dipole dislocations located in close proximity to one another.
-
Microstructural parameters determined from CMWP program:
Results from HRTEM and GPA analyses are consistent with the microstructural parameters, q (dislocation character, edge vs. screw) and M (dislocation arrangement), obtained from the analysis of X-ray diffraction patterns using the CMWP method. For most samples, the q parameter indicates that the dislocations are predominantly of screw character, while the M parameter showed values < 1, suggesting that the dislocation arrangement primarily consists of closely correlated dipoles. These findings imply that most Al/Al4C3 composites fabricated may exhibit high brittleness. However, samples with a lower weight percentage of the mix and longer sintering times, such as the Al-16 sample, exhibited an M parameter > 1, indicating that under these conditions, the dislocation dipoles are no longer closely correlated, which could result in reduced brittleness in Al/Al4C3 composites.

Author Contributions

A.S.B.: Preparation, creation and/or presentation of the published work by those from the original research group, specifically critical review, commentary or revision—including pre- or post-publication stages; V.G.O.: Preparation, creation and/or presentation of the published work, specifically writing the initial draft (including substantive translation); M.S.B.: Conducting a research and investigation process, specifically performing the experiments, or data/evidence collection; H.M.P.: Conducting a research and investigation process, specifically performing the experiments, or data/evidence collection. I.E.G.: Conducting a research and investigation process, specifically performing the experiments, or data/evidence collection. C.G.O.: Conducting a research and investigation process, specifically performing the experiments, or data/evidence collection; R.M.S.: Oversight and leadership responsibility for the research activity planning and execution, including mentorship external to the core team. All authors have read and agreed to the published version of the manuscript.

Funding

This research received no external funding.

Institutional Review Board Statement

Not applicable.

Informed Consent Statement

Not applicable.

Data Availability Statement

The original contributions presented in the study are included in the article, further inquiries can be directed to the corresponding author.

Conflicts of Interest

The authors declare no conflict of interest.

References

  1. Pan, S.; Wang, T.; Jin, K.; Cai, X. Understanding and designing metal matrix nanocomposites with high electrical conductivity: A review. J. Mater. Sci. 2022, 57, 6487–6523. [Google Scholar] [CrossRef]
  2. Saboori, A.; Moheimani, S.K.; Dadkhah, M.; Pavese, M.; Badini, C.; Fino, P. An Overview of Key Challenges in the Fabrication of Metal Matrix Nanocomposites Reinforced by Graphene Nanoplatelets. Metals 2018, 8, 172. [Google Scholar] [CrossRef]
  3. Rohatgi, P.K.; M., A.D.; Schultz, B.F.; Ferguson, J.B. Synthesis and Properties of Metal Matrix Nanocomposites (MMNCS), Syntactic Foams, Self Lubricating and Self-Healing Metals. In Proceedings of the 8th Pacific Rim International Congress on Advanced Materials and Processing; Marquis, F., Ed.; Springer: Cham, Switzerland, 2013. [Google Scholar] [CrossRef]
  4. Patro, L. Role of mechanical milling on the synthesis and ionic transport properties of fast fluoride ion conducting materials. J. Solid State Electrochem. 2020, 24, 2219–2232. [Google Scholar] [CrossRef]
  5. Sambathkumar, M.; Gukendran, R.; Mohanraj, T.; Karupannasamy, D.K.; Natarajan, N.; Christopher, D.S. A Systematic Review on the Mechanical, Tribological, and Corrosion Properties of Al 7075 Metal Matrix Composites Fabricated through Stir Casting Process. Adv. Mater. Sci. Eng. 2023, 2023, 5442809. [Google Scholar] [CrossRef]
  6. Anuar, N.F.B.W.; Salleh, M.S.; Omar, M.Z.; Zamri, W.F.H.W.; Ali, A.M.; Samat, S. Wear properties of graphene-reinforced aluminium metal matrix composite: A review. Rev. Adv. Mater. Sci. 2023, 62, 20220326. [Google Scholar] [CrossRef]
  7. Velgosová, O.; Besterci, M.; Balloková, B. Influence of Al4C3 nanophase on structural stability and mechanical properties of Al-Al4C3 composites after thermal exposure. Metall. Res. Technol. 2018, 115, 606. [Google Scholar] [CrossRef]
  8. Zhou, W.; Zhou, Z.; Kubota, K.; Ono, H.; Nomura, N.; Kawasaki, A. Design of high-performance Al4C3/Al matrix composites for electric conductor. Mater. Sci. Eng. A 2020, 798, 140331. [Google Scholar] [CrossRef]
  9. Hernández, F.R.; Calderon, H. Nanostructured Al/Al4C3 composites reinforced with graphite or fullerene and manufactured by mechanical milling and spark plasma sintering. Mater. Chem. Phys. 2012, 132, 815–822. [Google Scholar] [CrossRef]
  10. Kulkov, S.N.; Vorozhtsov, S.A. Structure and mechanical behavior of Al–Al4C3 composites. Russ. Phys. J. 2011, 53, 1153–1157. [Google Scholar] [CrossRef]
  11. Vorozhtsov, S.; Vorozhtsov, A.; Kulkov, S. The structure, phase composition and mechanical properties of hot metal matrix nanocomposites Al-Al4C3. TMS Light Metals 2014, 2014, 1431–1435. [Google Scholar] [CrossRef]
  12. Zhang, Z.; Ódor, É.; Farkas, D.; Jóni, B.; Ribárik, G.; Tichy, G.; Nandam, S.-H.; Ivanisenko, J.; Preuss, M.; Ungár, T. Dislocations in Grain Boundary Regions: The Origin of Heterogeneous Microstrains in Nanocrystalline Materials. Met. Mater. Trans. A 2020, 51, 513–530. [Google Scholar] [CrossRef]
  13. Pinate, S.; Ghassemali, E.; Zanella, C. Strengthening mechanisms and wear behavior of electrodeposited Ni–SiC nanocomposite coatings. J. Mater. Sci. 2022, 57, 16632–16648. [Google Scholar] [CrossRef]
  14. Ståhlkrantz, A.; Hedström, P.; Sarius, N.; Borgenstam, A. Influence of Austempering Conditions on Hardness and Microstructure of Bainite in Low-Alloyed Steel. Met. Mater. Trans. A 2024, 55, 209–217. [Google Scholar] [CrossRef]
  15. Ribárik, G.; Jóni, B.; Ungár, T. The Convolutional Multiple Whole Profile (CMWP) Fitting Method, a Global Optimization Procedure for Microstructure Determination. Crystals 2020, 10, 623. [Google Scholar] [CrossRef]
  16. Ungár, T.; Dragomir, I.; Révész, Á.; Borbély, A. The contrast factors of dislocations in cubic crystals: The dislocation model of strain anisotropy in practice. J. Appl. Crystallogr. 1999, 32, 992–1002. [Google Scholar] [CrossRef]
  17. Borbély, A.; Dragomir-Cernatescu, J.; Ribárik, G.; Ungár, T. Computer program ANIZC for the calculation of diffraction contrast factors of dislocations in elastically anisotropic cubic, hexagonal and trigonal crystals. J. Appl. Crystallogr. 2003, 36, 160–162. [Google Scholar] [CrossRef]
  18. Wilkens, M. The determination of density and distribution of dislocations in deformed single crystals from broadened X-ray diffraction profiles. Phys. Status Solidi 1970, 2, 359–370. [Google Scholar] [CrossRef]
  19. Santos-Beltrán, A.; Goytia-Reyes, R.; Morales-Rodriguez, H.; Gallegos-Orozco, V.; Santos-Beltrán, M.; Baldenebro-Lopez, F.; Martínez-Sánchez, R. Characterization of Al–Al4C3 nanocomposites produced by mechanical milling. Mater. Charact. 2015, 106, 368–374. [Google Scholar] [CrossRef]
  20. Klinger, M. CrysTBox—Crystallographic Toolbox; Institute of Physics of the Czech Academy of Sciences: Prague, Czechia, 2015; ISBN 978-80-905962-3-8. Available online: http://www.fzu.cz/~klinger/crystbox.pdf (accessed on 26 June 2023).
  21. Hÿtch, M.; Snoeck, E.; Kilaas, R. Quantitative measurement of displacement and strain fields from HREM micrographs. Ultramicroscopy 1998, 74, 131–146. [Google Scholar] [CrossRef]
  22. Ungár, T.; Gubicza, J.; Ribárik, G.; Borbély, A. Crystallite size distribution and dislocation structure determined by diffraction profile analysis: Principles and practical application to cubic and hexagonal crystals. J. Appl. Crystallogr. 2001, 34, 298–310. [Google Scholar] [CrossRef]
  23. Cahn, R.W.; Haasen, P.; Argon, A.S. Physical metallurgy. In Mechanical Properties of Single-Phase Crystalline Media, Deformation at Low Temperature, 4th ed.; Elsevier Science B.V.: Amsterdam, The Netherlands, 1996; pp. 1878–1955. [Google Scholar]
  24. Orozco, V.G.; Beltrán, A.S.; Beltrán, M.S.; Prieto, H.M.; Orozco, C.G.; Guel, I.E. Effect on Microstructure and Hardness of Reinforcement in Al–Cu with Al4C3 Nanocomposites. Metals 2021, 11, 1203. [Google Scholar] [CrossRef]
  25. Feijoo, I.; Pena, G.; Cristóbal, M.J.; Cabeza, M.; Rey, P. Effect of Carbon Nanotube Content and Mechanical Milling Conditions on the Manufacture of AA7075/MWCNT Composites. Metals 2022, 12, 1020. [Google Scholar] [CrossRef]
  26. Lee, W.-R.; Kim, M.G.; Choi, J.-R.; Park, J.-I.; Ko, S.J.; Oh, S.J.; Cheon, J. Redox−Transmetalation Process as a Generalized Synthetic Strategy for Core−Shell Magnetic Nanoparticles. J. Am. Chem. Soc. 2005, 127, 16090–16097. [Google Scholar] [CrossRef]
  27. Ferguson, J.B.; Lopez, H.; Kongshaug, D.; Schultz, B.; Rohatgi, P. Revised Orowan Strengthening: Effective Interparticle Spacing and Strain Field Considerations. Met. Mater. Trans. A 2012, 43, 2110–2115. [Google Scholar] [CrossRef]
  28. Kim, J.; Ghaffarian, H.; Kang, K. The lattice dislocation trapping mechanism at the ferrite/cementite interface in the Isaichev orientation relationship. Sci. Rep. 2021, 11, 9324. [Google Scholar] [CrossRef] [PubMed]
  29. Charleston, J.; Agrawal, A.; Mirzaeifar, R. Effect of interface configuration on the mechanical properties and dislocation mechanisms in metal graphene composites. Comput. Mater. Sci. 2020, 178, 109621. [Google Scholar] [CrossRef]
  30. Jayaseelan, J.; Pazhani, A.; Michael, A.X.; Paulchamy, J.; Batako, A.; Guruswamy, P.K.H. Characterization Studies on Graphene-Aluminium Nano Composites for Aerospace Launch Vehicle External Fuel Tank Structural Application. Materials 2022, 15, 5907. [Google Scholar] [CrossRef]
  31. Hou, Y.N.; Yang, K.M.; Song, J.; Wang, H.; Liu, Y.; Fan, T.X. A crystal plasticity model for metal matrix composites considering thermal mismatch stress induced dislocations and twins. Sci. Rep. 2021, 11, 16053. [Google Scholar] [CrossRef]
  32. Wong, C.S.; Pramanik, A.; Basak, A.K. Residual stress generation in metal matrix composites after cooling. Mater. Sci. Technol. 2018, 34, 1388–1400. [Google Scholar] [CrossRef]
  33. Tochigi, E.; Nakamura, A.; Shibata, N.; Ikuhara, Y. Dislocation Structures in Low-Angle Grain Boundaries of α-Al2O3. Crystals 2018, 8, 133. [Google Scholar] [CrossRef]
  34. Föll, H.; Ast, D. TEM observations on grain boundaries in sintered silicon. Philos. Mag. A 1979, 40, 589–610. [Google Scholar] [CrossRef]
  35. Belov, A.; Scholz, R.; Scheerschmidt, K. Dissociation of screw dislocations in (001) low-angle twist boundaries: A source of the 30 o partial dislocations in silicon. Philos. Mag. Lett. 1999, 79, 531–538. [Google Scholar] [CrossRef]
  36. Zhang, Z.; Liu, M.P.; Da Yu, Y.; Skaret, P.C.; Roven, H.J. Microstructural Characterization of an Al-Mg-Si Aluminum Alloy Processed by Equal Channel Angular Pressing. Mater. Sci. Forum 2013, 745–746, 303–308. [Google Scholar] [CrossRef]
  37. Gilman, J.J. Influence of dislocation dipoles on physical properties. Discuss. Faraday Soc. 1964, 38, 123–137. [Google Scholar] [CrossRef]
  38. Cao, Y.; Zhu, P.; Yang, Y.; Shi, W.; Qiu, M.; Wang, H.; Xie, P. Dislocation Mechanism and Grain Refinement of Surface Modification of NV E690 Cladding Layer Induced by Laser Shock Peening. Materials 2022, 15, 7254. [Google Scholar] [CrossRef] [PubMed]
  39. Ni, K.; Wang, H.; Guo, Q.; Wang, Z.; Liu, W.; Huang, Y. The Construction of a Lattice Image and Dislocation Analysis in High-Resolution Characterizations Based on Diffraction Extinctions. Materials 2024, 17, 555. [Google Scholar] [CrossRef] [PubMed]
  40. Kroupa, F. Dislocation Dipoles and Dislocation Loops. J. Phys. Colloq. 1966, 27, C3-154–C3-167. [Google Scholar] [CrossRef]
  41. Meyers, M.A.; Mishra, A.; Benson, D.J. Mechanical properties of nanocrystalline materials. Prog. Mater. Sci. 2006, 51, 427–556. [Google Scholar] [CrossRef]
Figure 1. (a) TEM bright image with corresponding inset SAD pattern and (b) dark field image showing the distribution of the Al4C3 phase into the Al matrix.
Materials 17 04818 g001
Figure 2. Bright-field TEM micrograph showing the Al4C3 nanorod dispersion on Al matrix (nanorods are indicated by white arrows) for (a) Al-22, (b) Al-24 and (c) Al26 samples.
Materials 17 04818 g002
Figure 3. Nanorod size distribution histograms and fitting lognormal curve for (a) Al-22 sample, (b) Al-24 sample and (c) Al-26 sample.
Materials 17 04818 g003
Figure 4. (a) High-Resolution Transmission Electron Microscopy (HRTEM) image of the Al-22 sample, highlighting selected area A, (b) distribution of strain fields within the specified region of selected area A, (c) amplified strain field distribution from selected area B and (d) Fourier-filtered image of selected area B, revealing only the fringes associated with the (111) lattice plane.
Materials 17 04818 g004
Figure 5. (a) HRTEM image of the Al-24 sample, highlighting selected area A and their corresponding digital diffraction pattern, (b) Fourier-filtered image of selected area A, revealing only the fringes associated with the (111) lattice plane, (c) distribution of strain fields within the specified region of selected area A, and (d,e) Enhanced view of Fourier-filtered and strain fields of specific area B.
Materials 17 04818 g005
Figure 6. (a) HRTEM image of the Al-26 sample, highlighting selected areas A and B, and their corresponding diffraction patterns, (b) Fourier-filtered image of selected area A, revealing only the fringes associated with the (015) lattice plane of the Al4C3 phase, (c) Fourier-filtered image of selected area B, revealing only the fringes associated with the (101) lattice plane of the Al phase, (d) distribution of strain fields within the specified region of selected area A (Al4C3 phase) and (e) distribution of strain fields within the specified region of selected area B (Al phase).
Materials 17 04818 g006
Figure 7. Log-normal grain size distribution from X-ray diffraction at 0, 2, 4 and 6 h of sintering time, for (a) Al-1 wt.% M and (b) Al-2 wt.% Mix composites.
Materials 17 04818 g007
Figure 8. Calculated contribution microhardness HL, HC, HD, and HP as a function of composition and sintering time in samples containing 1 and 2 wt.% of Mix.
Materials 17 04818 g008
Figure 9. Results of dislocation density and the dipole character parameter at different sintering times for (a) 1 wt.% of Mix and (b) 2 wt.% of Mix.
Materials 17 04818 g009
Table 1. Compositions for studied Al–Al4C3 and samples nomenclature (in wt.%).
NomenclatureAl (wt.%)Mix, Mixture Powder
(wt.%)
Sintering Time
(h)
Al-109910
Al-129912
Al-149914
A-169916
Al-209820
Al-229822
Al-249824
Al-269826
Table 2. Microstructural parameters (r, M, Re, <x> area, m and sLN) obtained from the X-ray diffraction patterns using CMWP.
CompositionDislocations ρ (1014 m−2)<x>area (nm)m (nm)σqMRe
(nm)
Al-1028.655.341.10.341.410.448.26
Al-124.7172.521.00.911.560.4420.33
Al-142.9154.036.10.761.110.3420.02
A1-161.8184.355.00.691.581.37102.38
Al-2017.148.640.20.271.100.7618.34
Al-224.6139.234.20.751.550.3114.50
Al-244.16199.353.70.721.030.3416.81
Al-263.87271.8101.50.621.290.3819.72
Table 3. HL, HC, HD, HP and HEXP values in Vicker hardness (VH) for all samples.
SampleHLHCHDHL + HC + HDHP
HEXP − (HL + HC + HD)
HEXPStd Dev.
A1-1029.423.679.6132.64.03129.224.4
Al-1225.37.532.465.2−0.02224.38.7
Al-1425.38.425.559.22.6115.812.3
Al-1625.37.119.952.357.1115.325.7
Al-2029.426.861.6117.844.3143.87.8
Al-2225.39.332.166.721.5297.72.0
Al-2425.36.530.462.243.3165.33.4
Al-2625.34.829.359.455.3109.123.2
Table 4. Comparisons of mechanical properties of Al–Al4C3 composites with those from the literature.
CompositionTensile Strength σmax (Mpa)Microhardness (VH)MethodRefs.
Al-1/2 wt.% of Mix ~224/~298MM and sinteringThis work
Al-4 wt.% of Al4C3~295~40.2MM and extrusion[7]
Al-0.2/0.4 wt.% of Al4C3166.2/183.1~40/~45SPS and Hot extrusion[8]
Al~7.5 wt.% of C and 7.5 wt.% of Fullerene ~188/~292SPS and MM[9]
Al-5/10 wt.% of Al4C3~190/300~63 */~100 *Hot pressing[10]
Al-5/10 wt.% of C400/600~130 */~200 *Hot pressing[11]
* Calculated microhardness (VH) σmax/3 [41].
Disclaimer/Publisher’s Note: The statements, opinions and data contained in all publications are solely those of the individual author(s) and contributor(s) and not of MDPI and/or the editor(s). MDPI and/or the editor(s) disclaim responsibility for any injury to people or property resulting from any ideas, methods, instructions or products referred to in the content.

