
Effect of In Situ Polymerization of Super Absorbent Polymers on the Protection of Earthen Heritage Sites in Semi-Arid Regions

Abstract
:1. Introduction
2. Characteristics of Geological Conditions
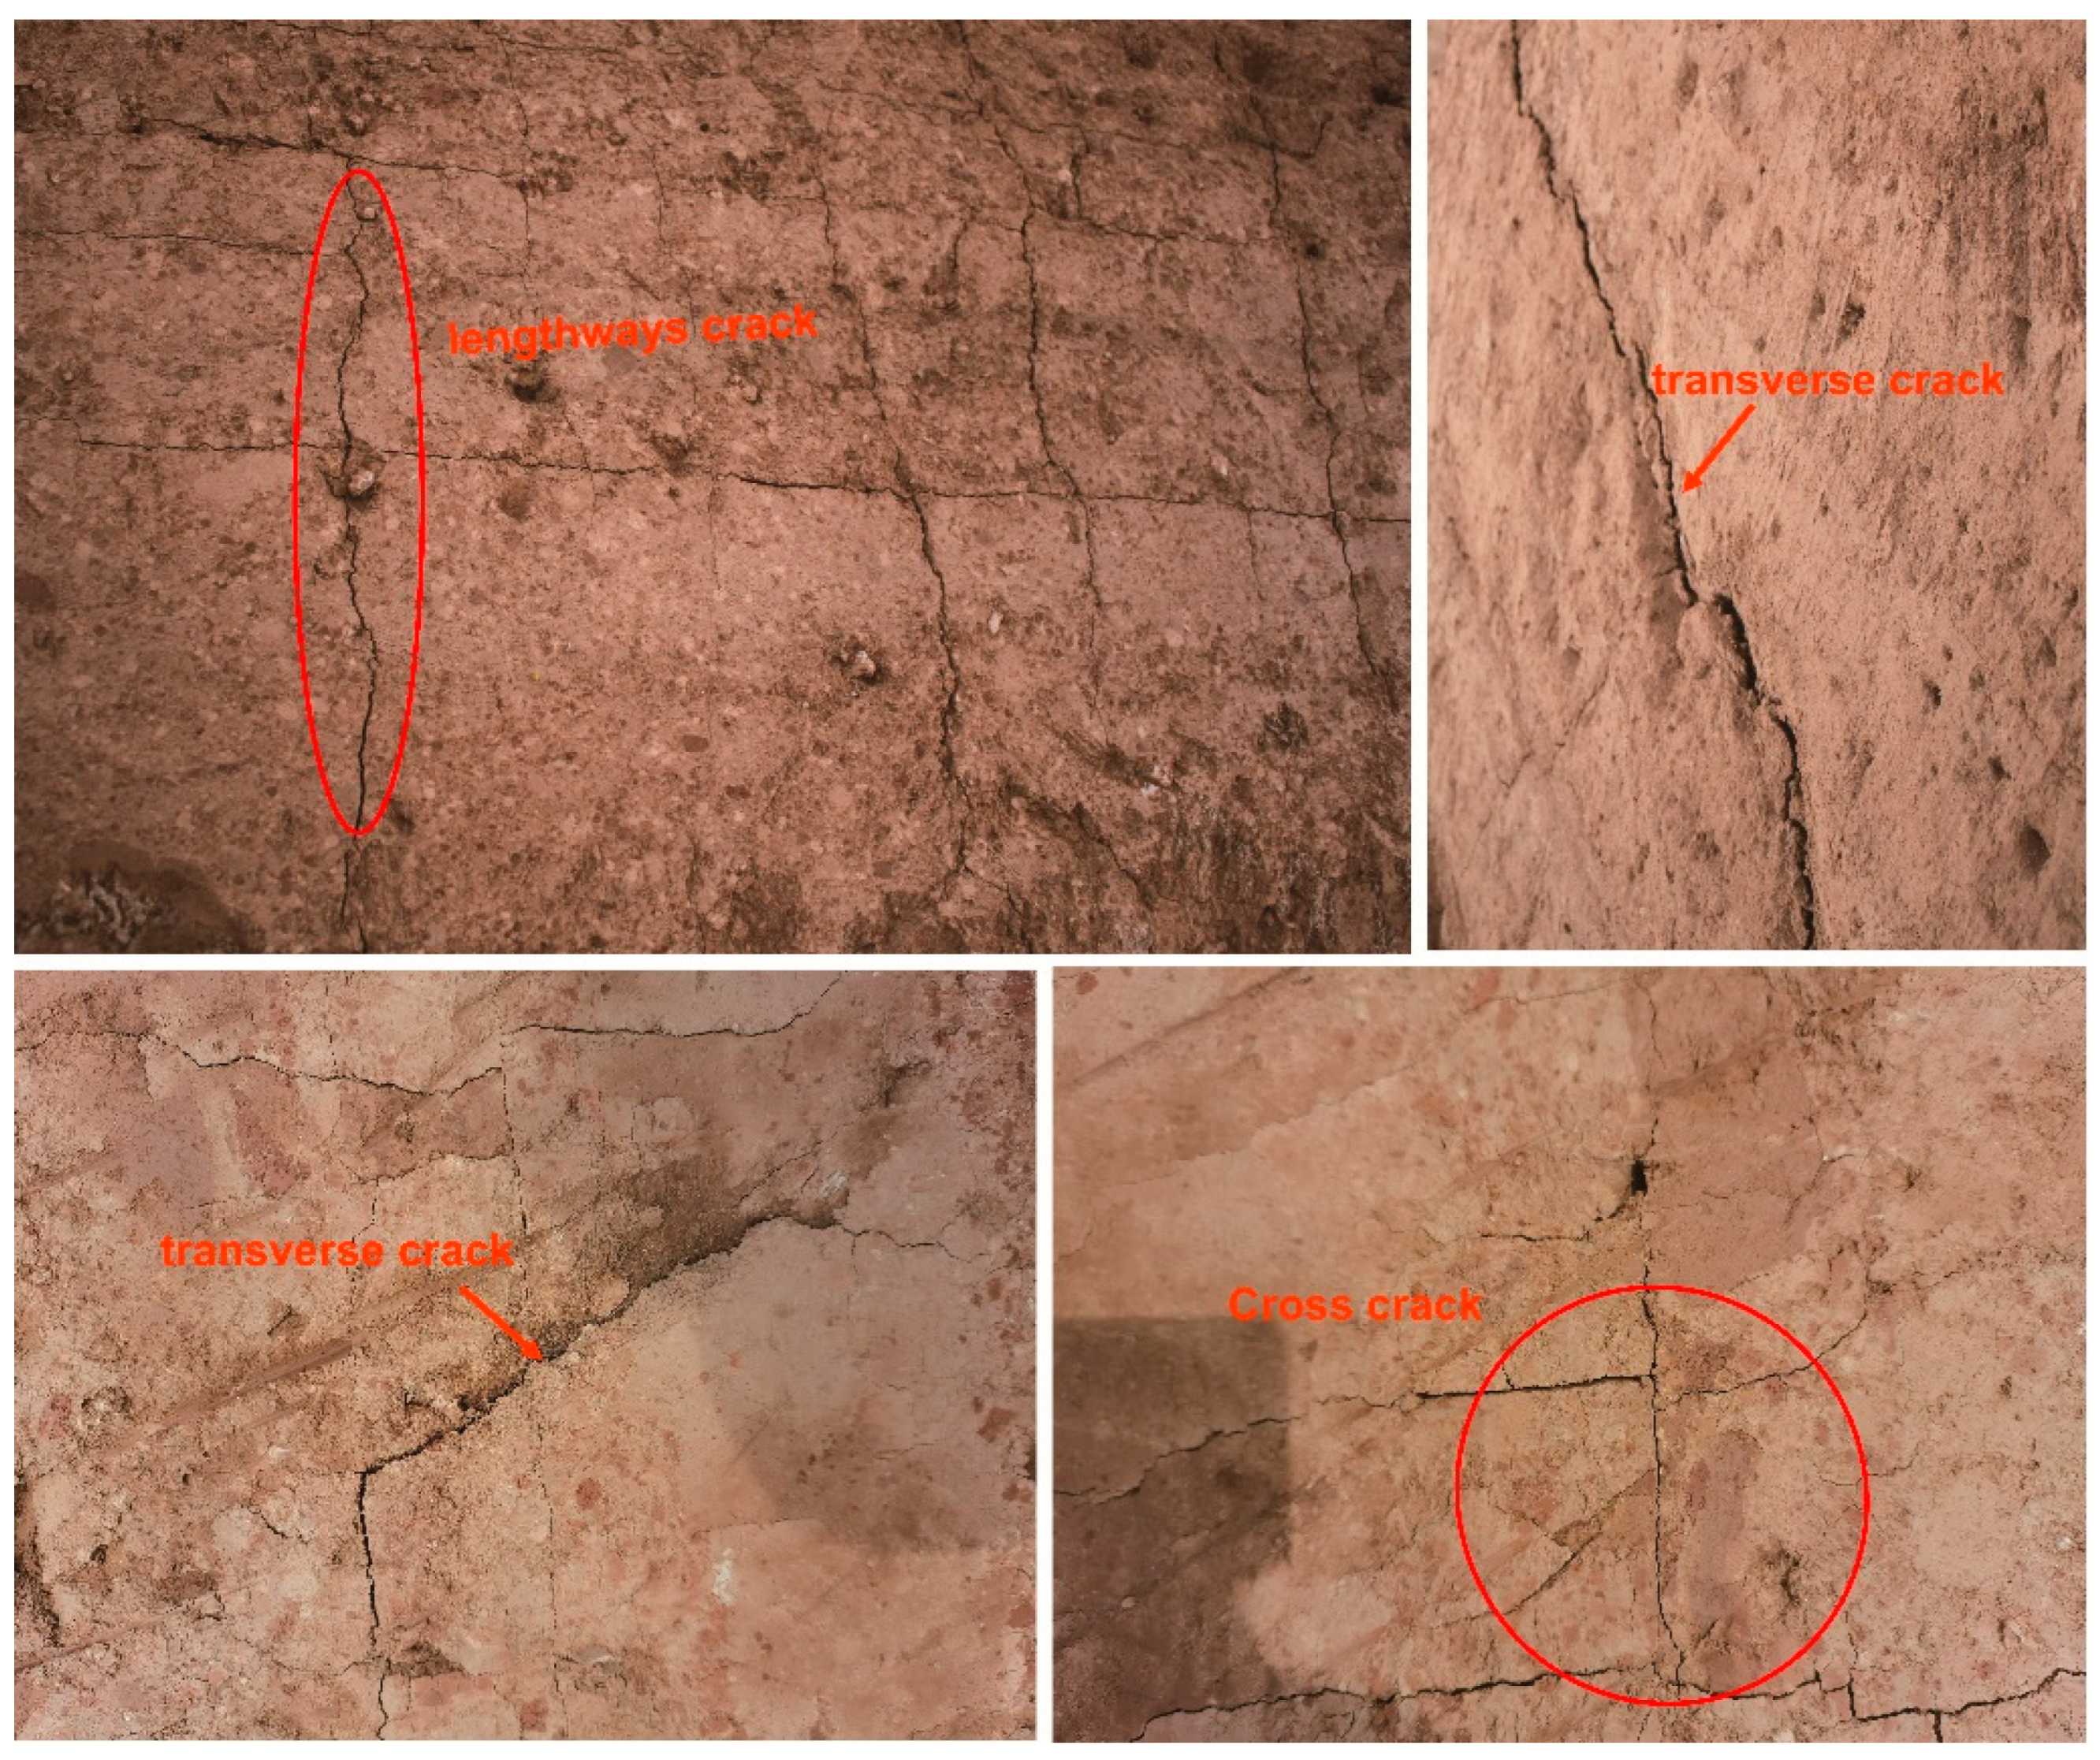
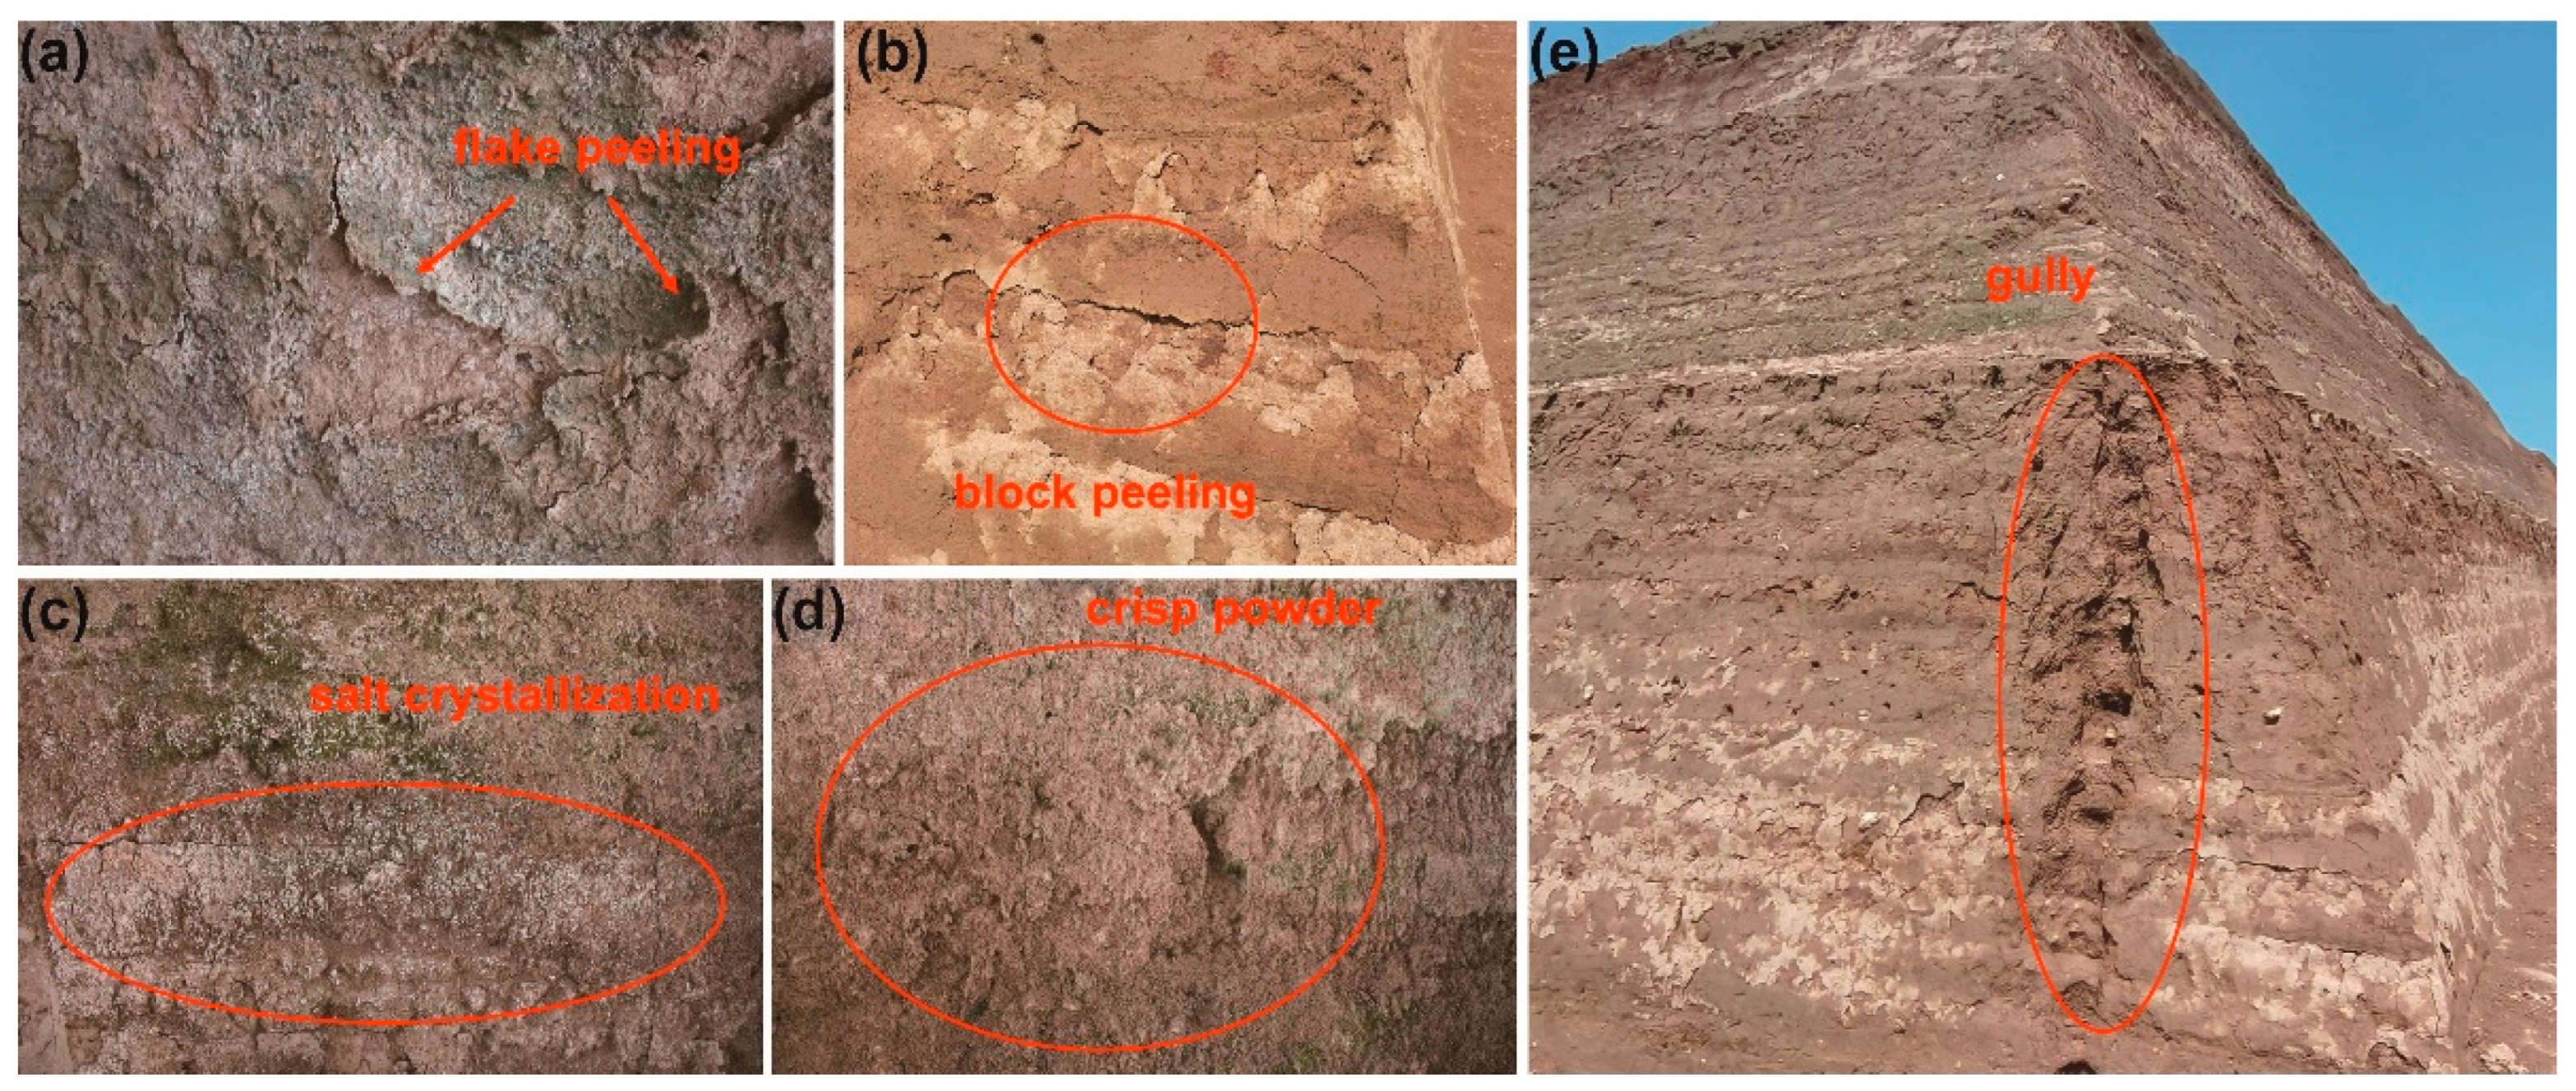
2.1. Deterioration Characteristics
2.2. Basic Properties of the Site’s Soil
2.2.1. Basic Physical Properties of Soil
2.2.2. Elemental Composition of Soil
2.2.3. Soluble Salt Analysis
2.3. Experimental Area Selection
3. Experimental Materials and Methods
3.1. Experimental Materials
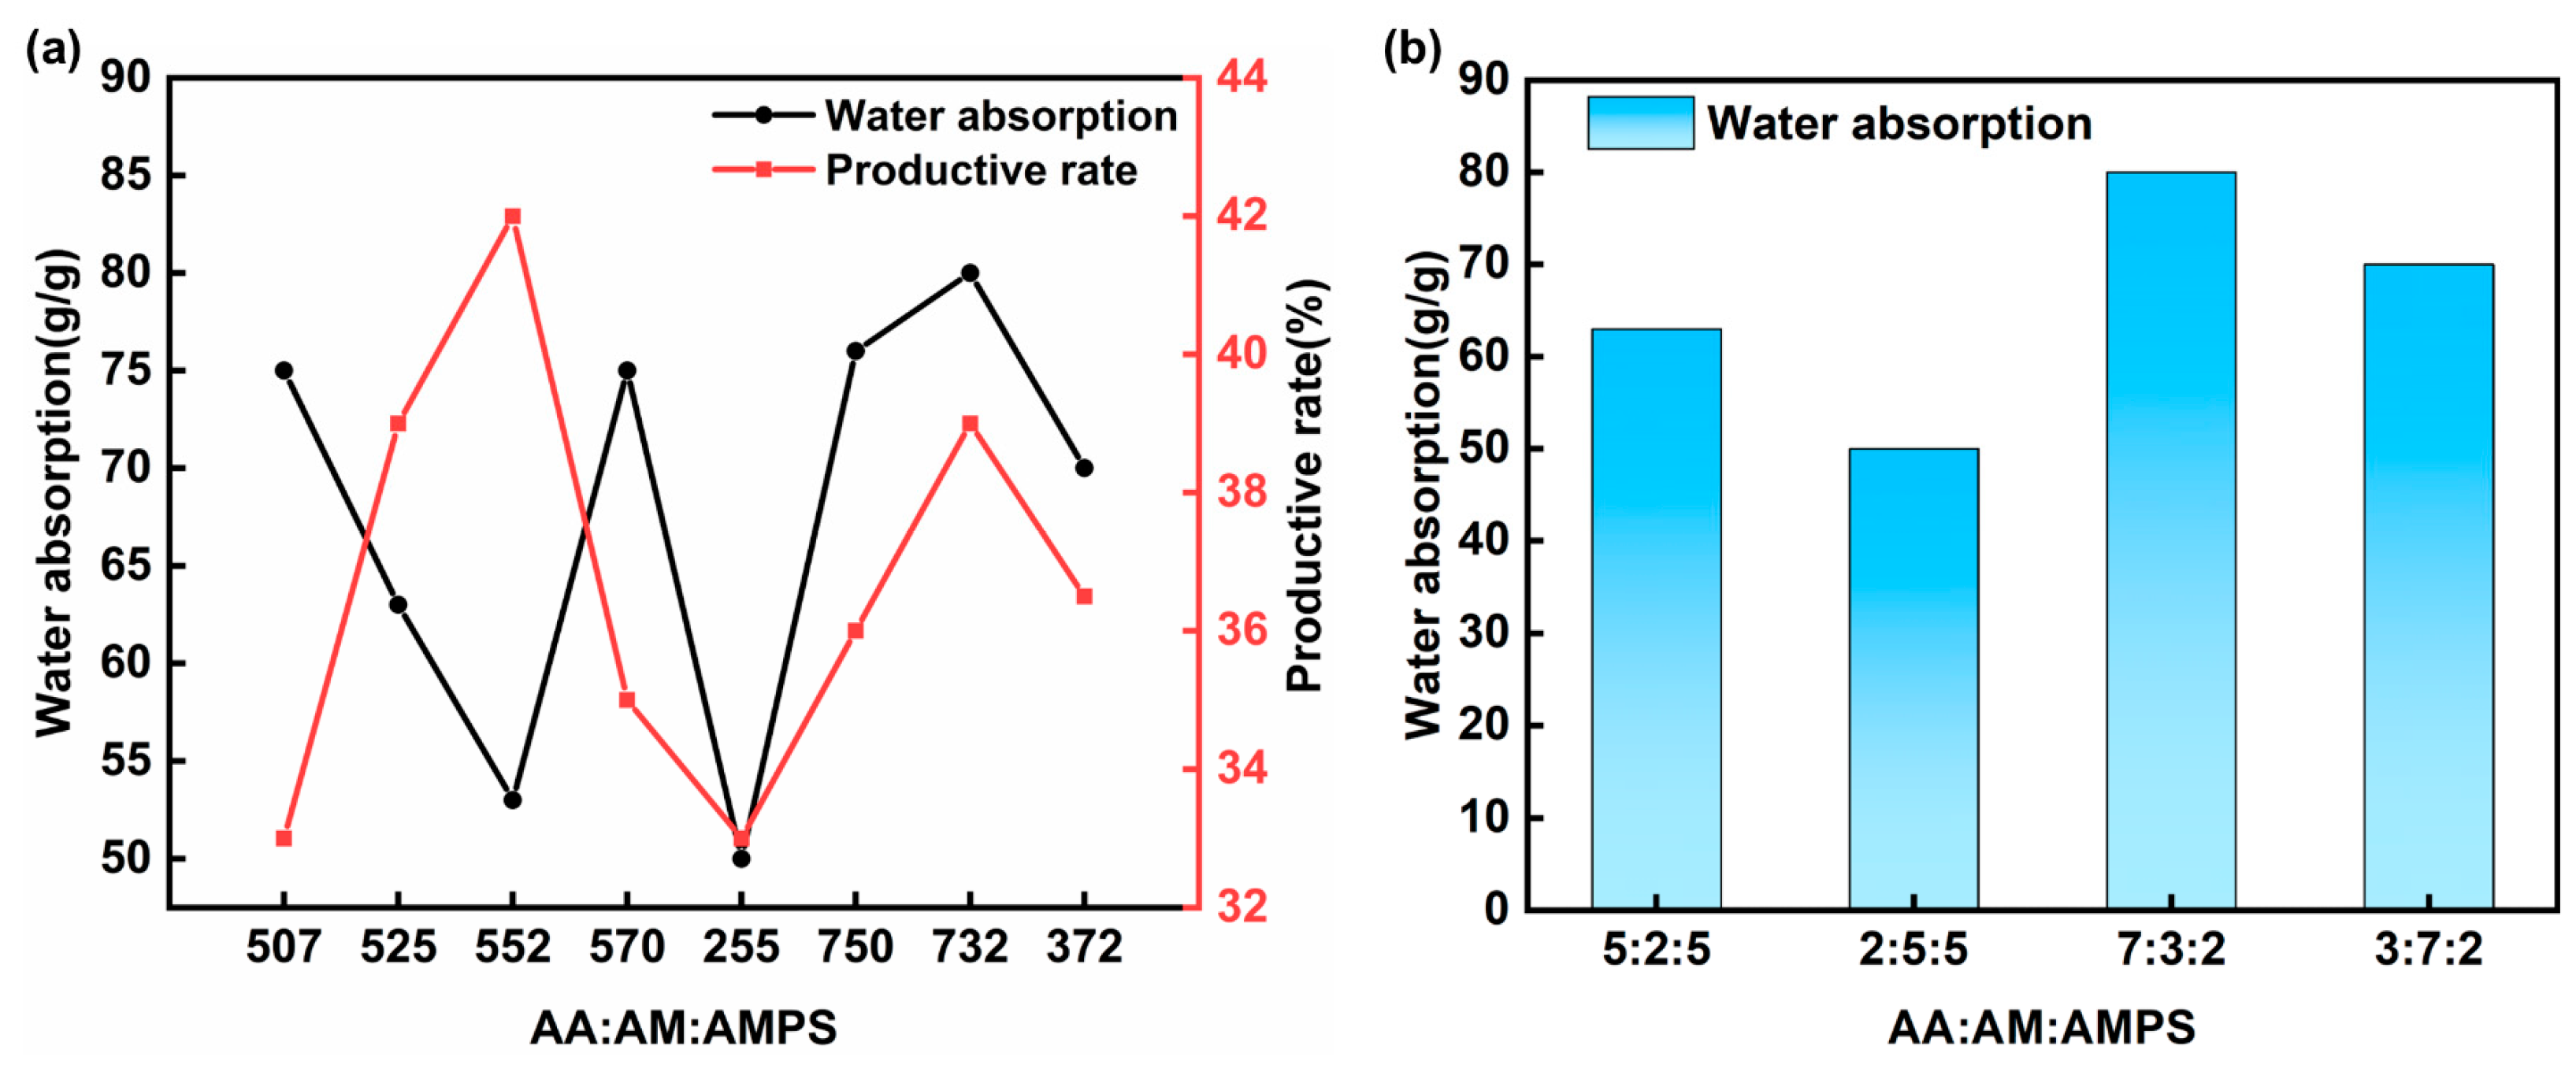
3.2. Formulation Selection
3.3. Experimental Methods
3.4. Curing Methods
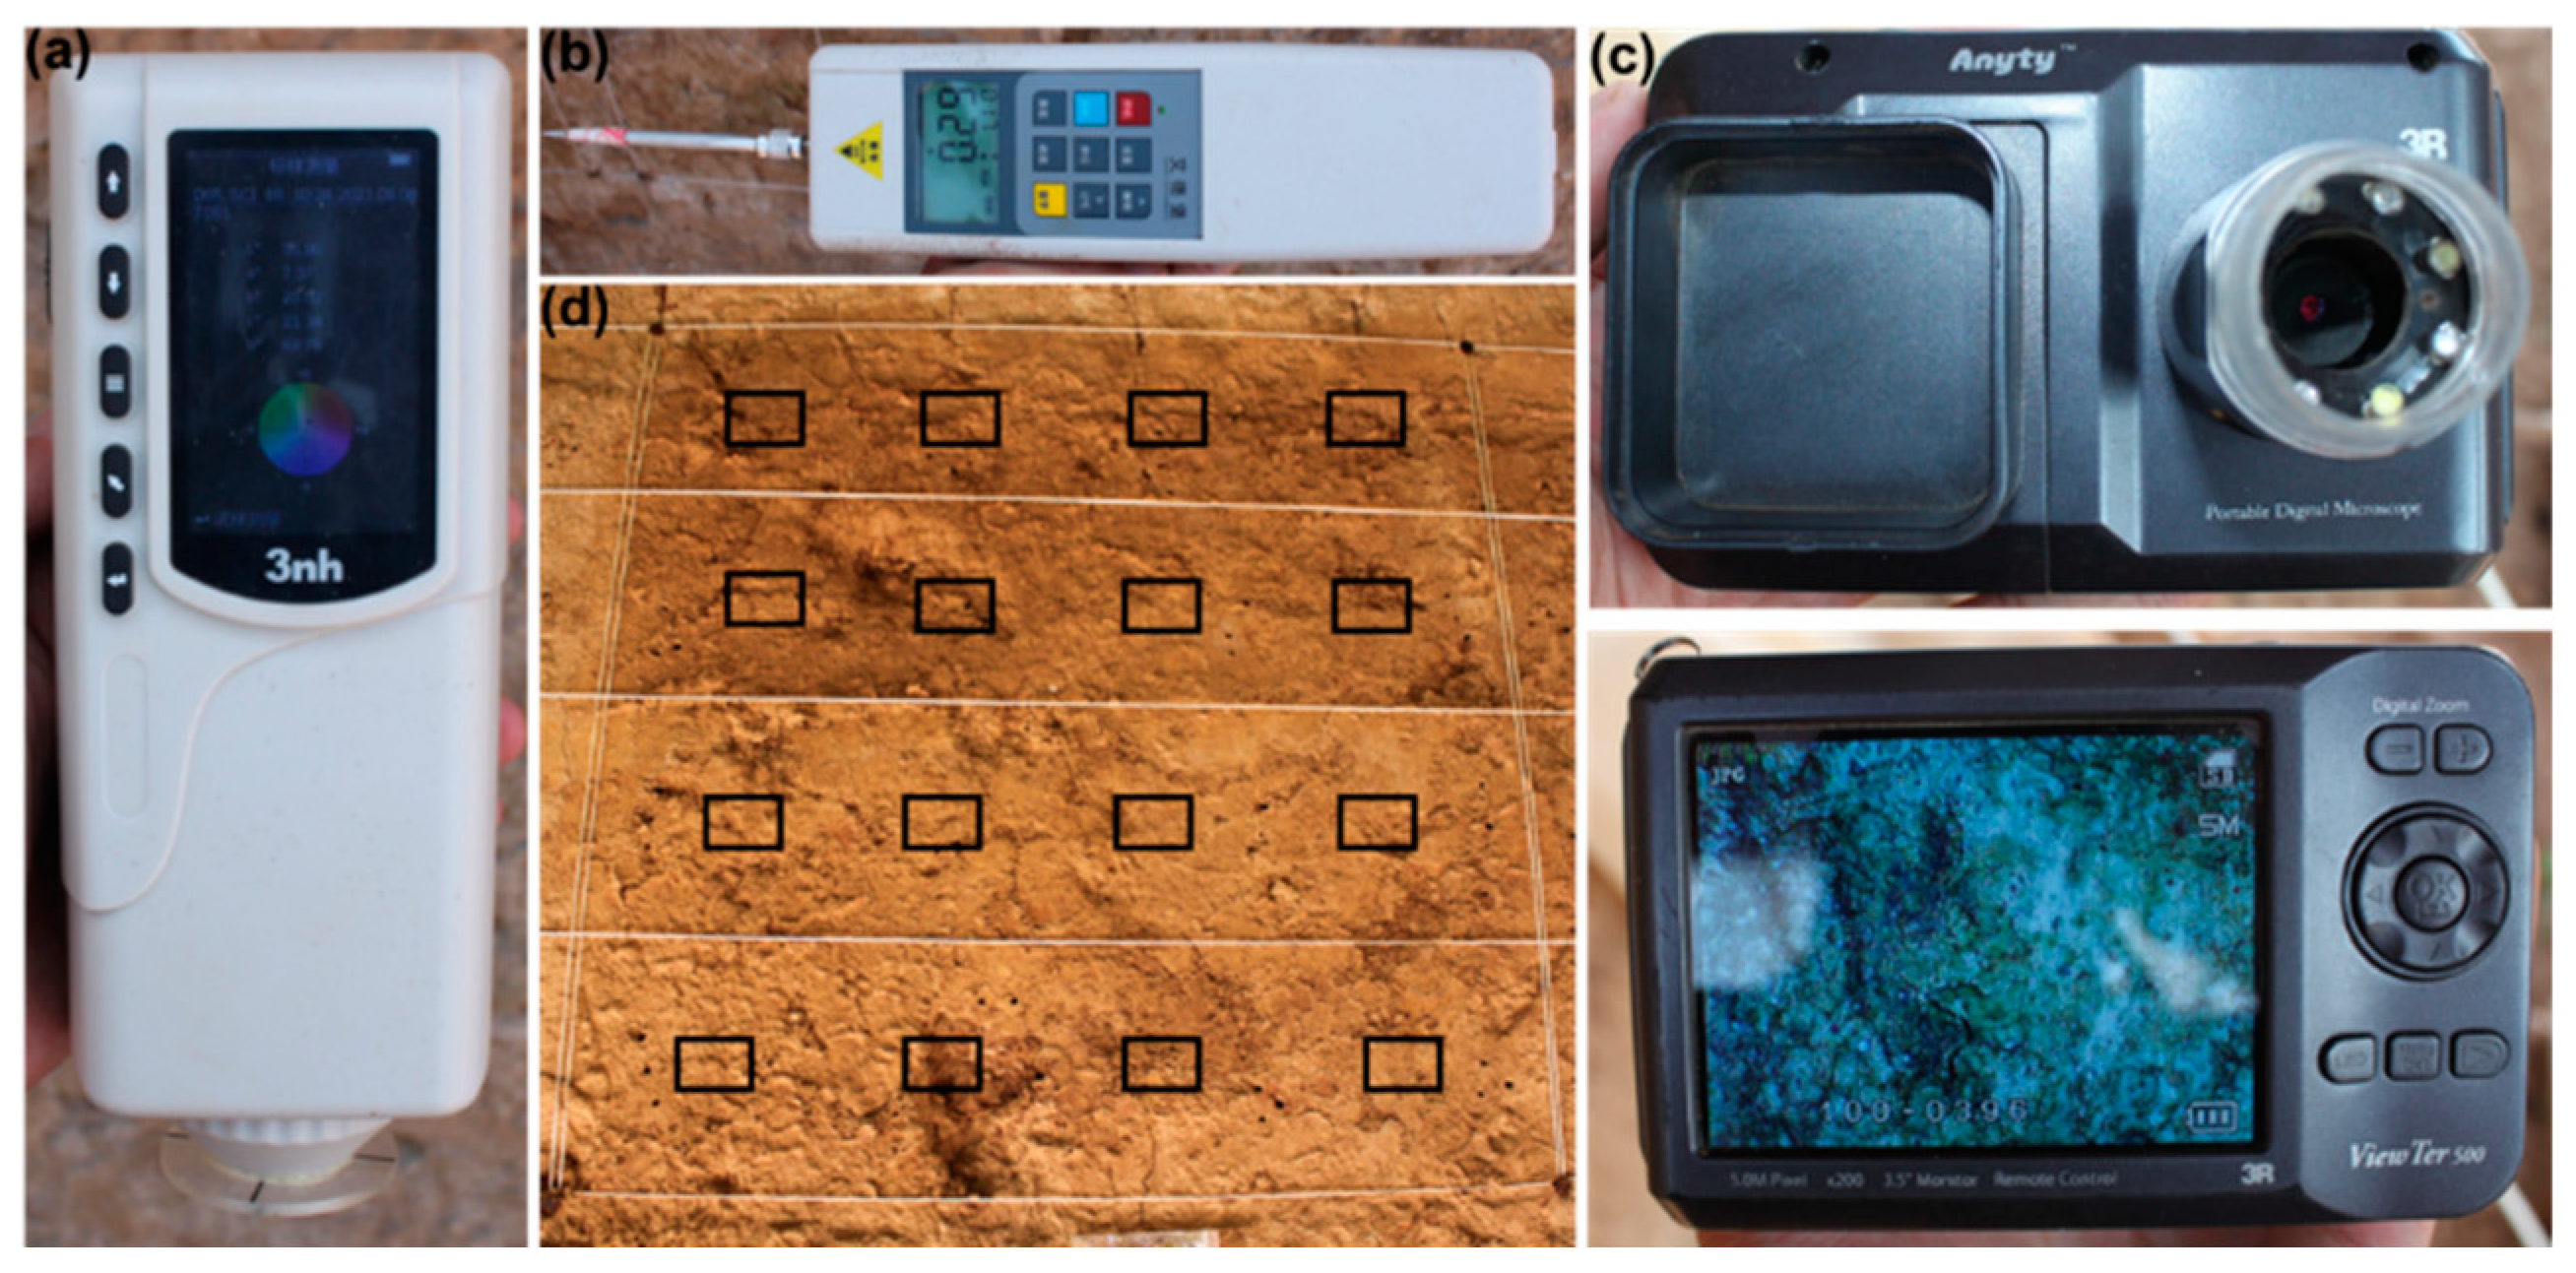
3.5. Test Method
Surface Hardness Analysis
4. Results and Discussion
4.1. Phase Analysis
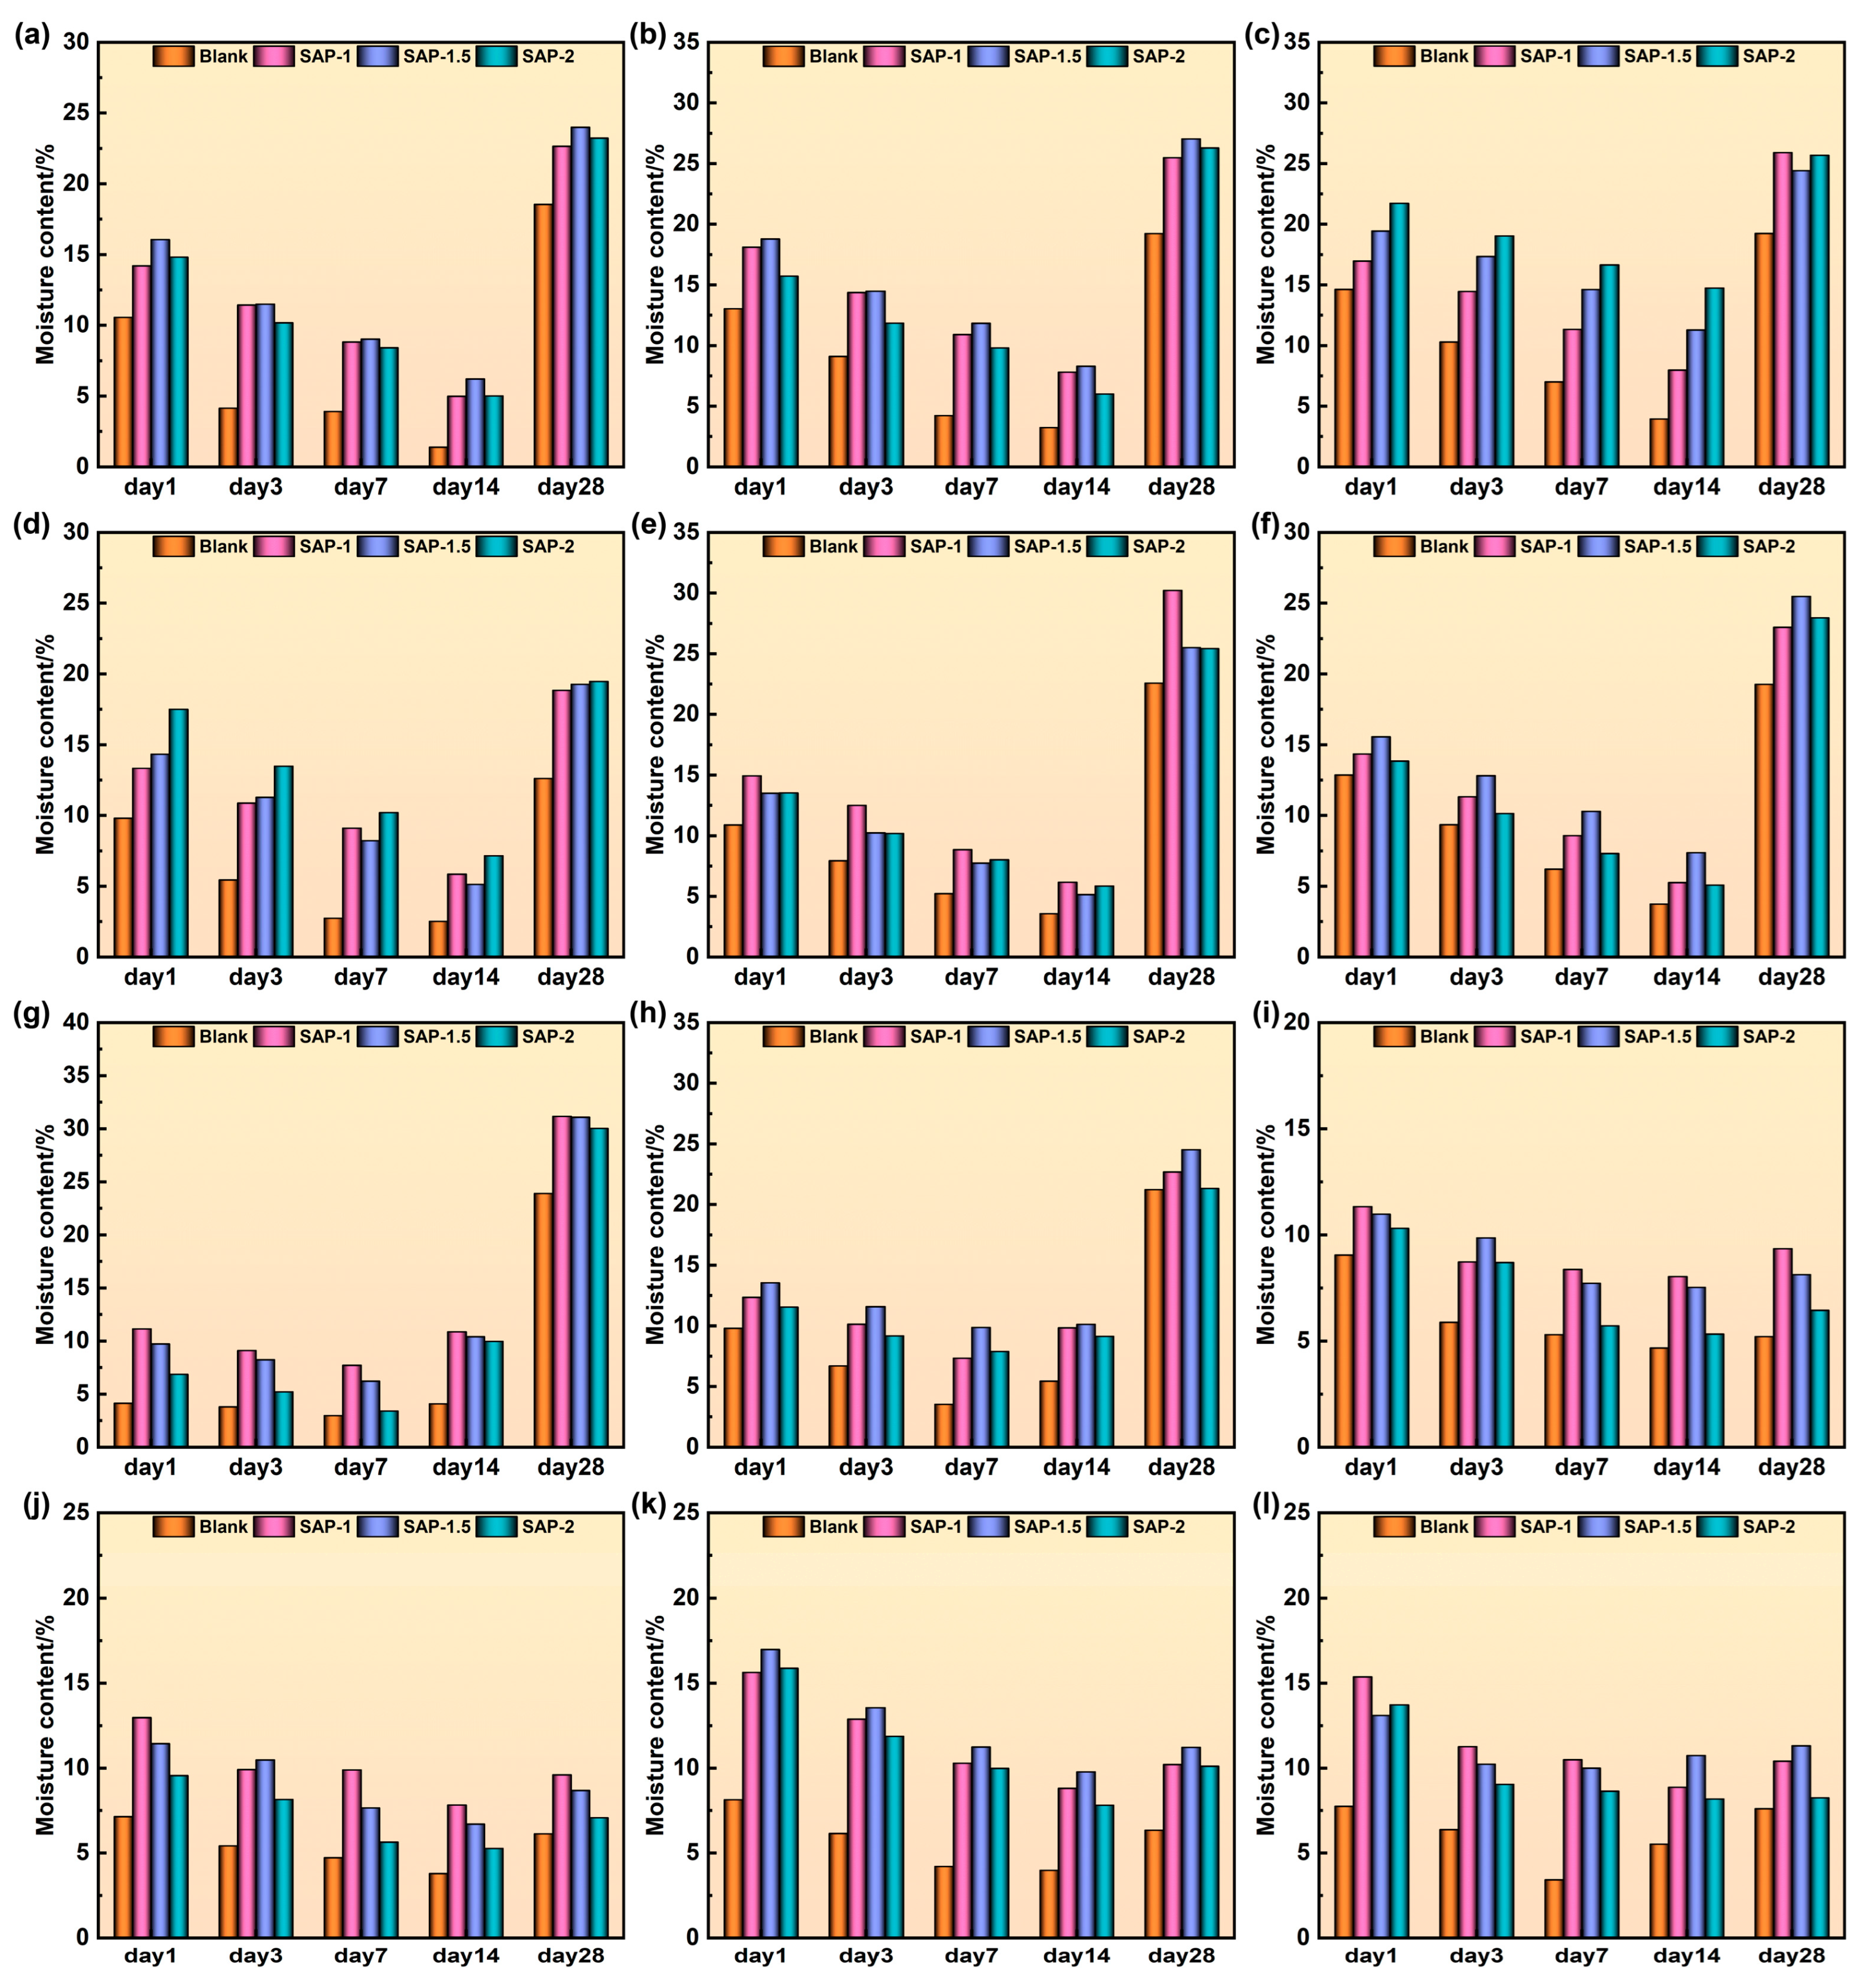
4.2. Moisture Content
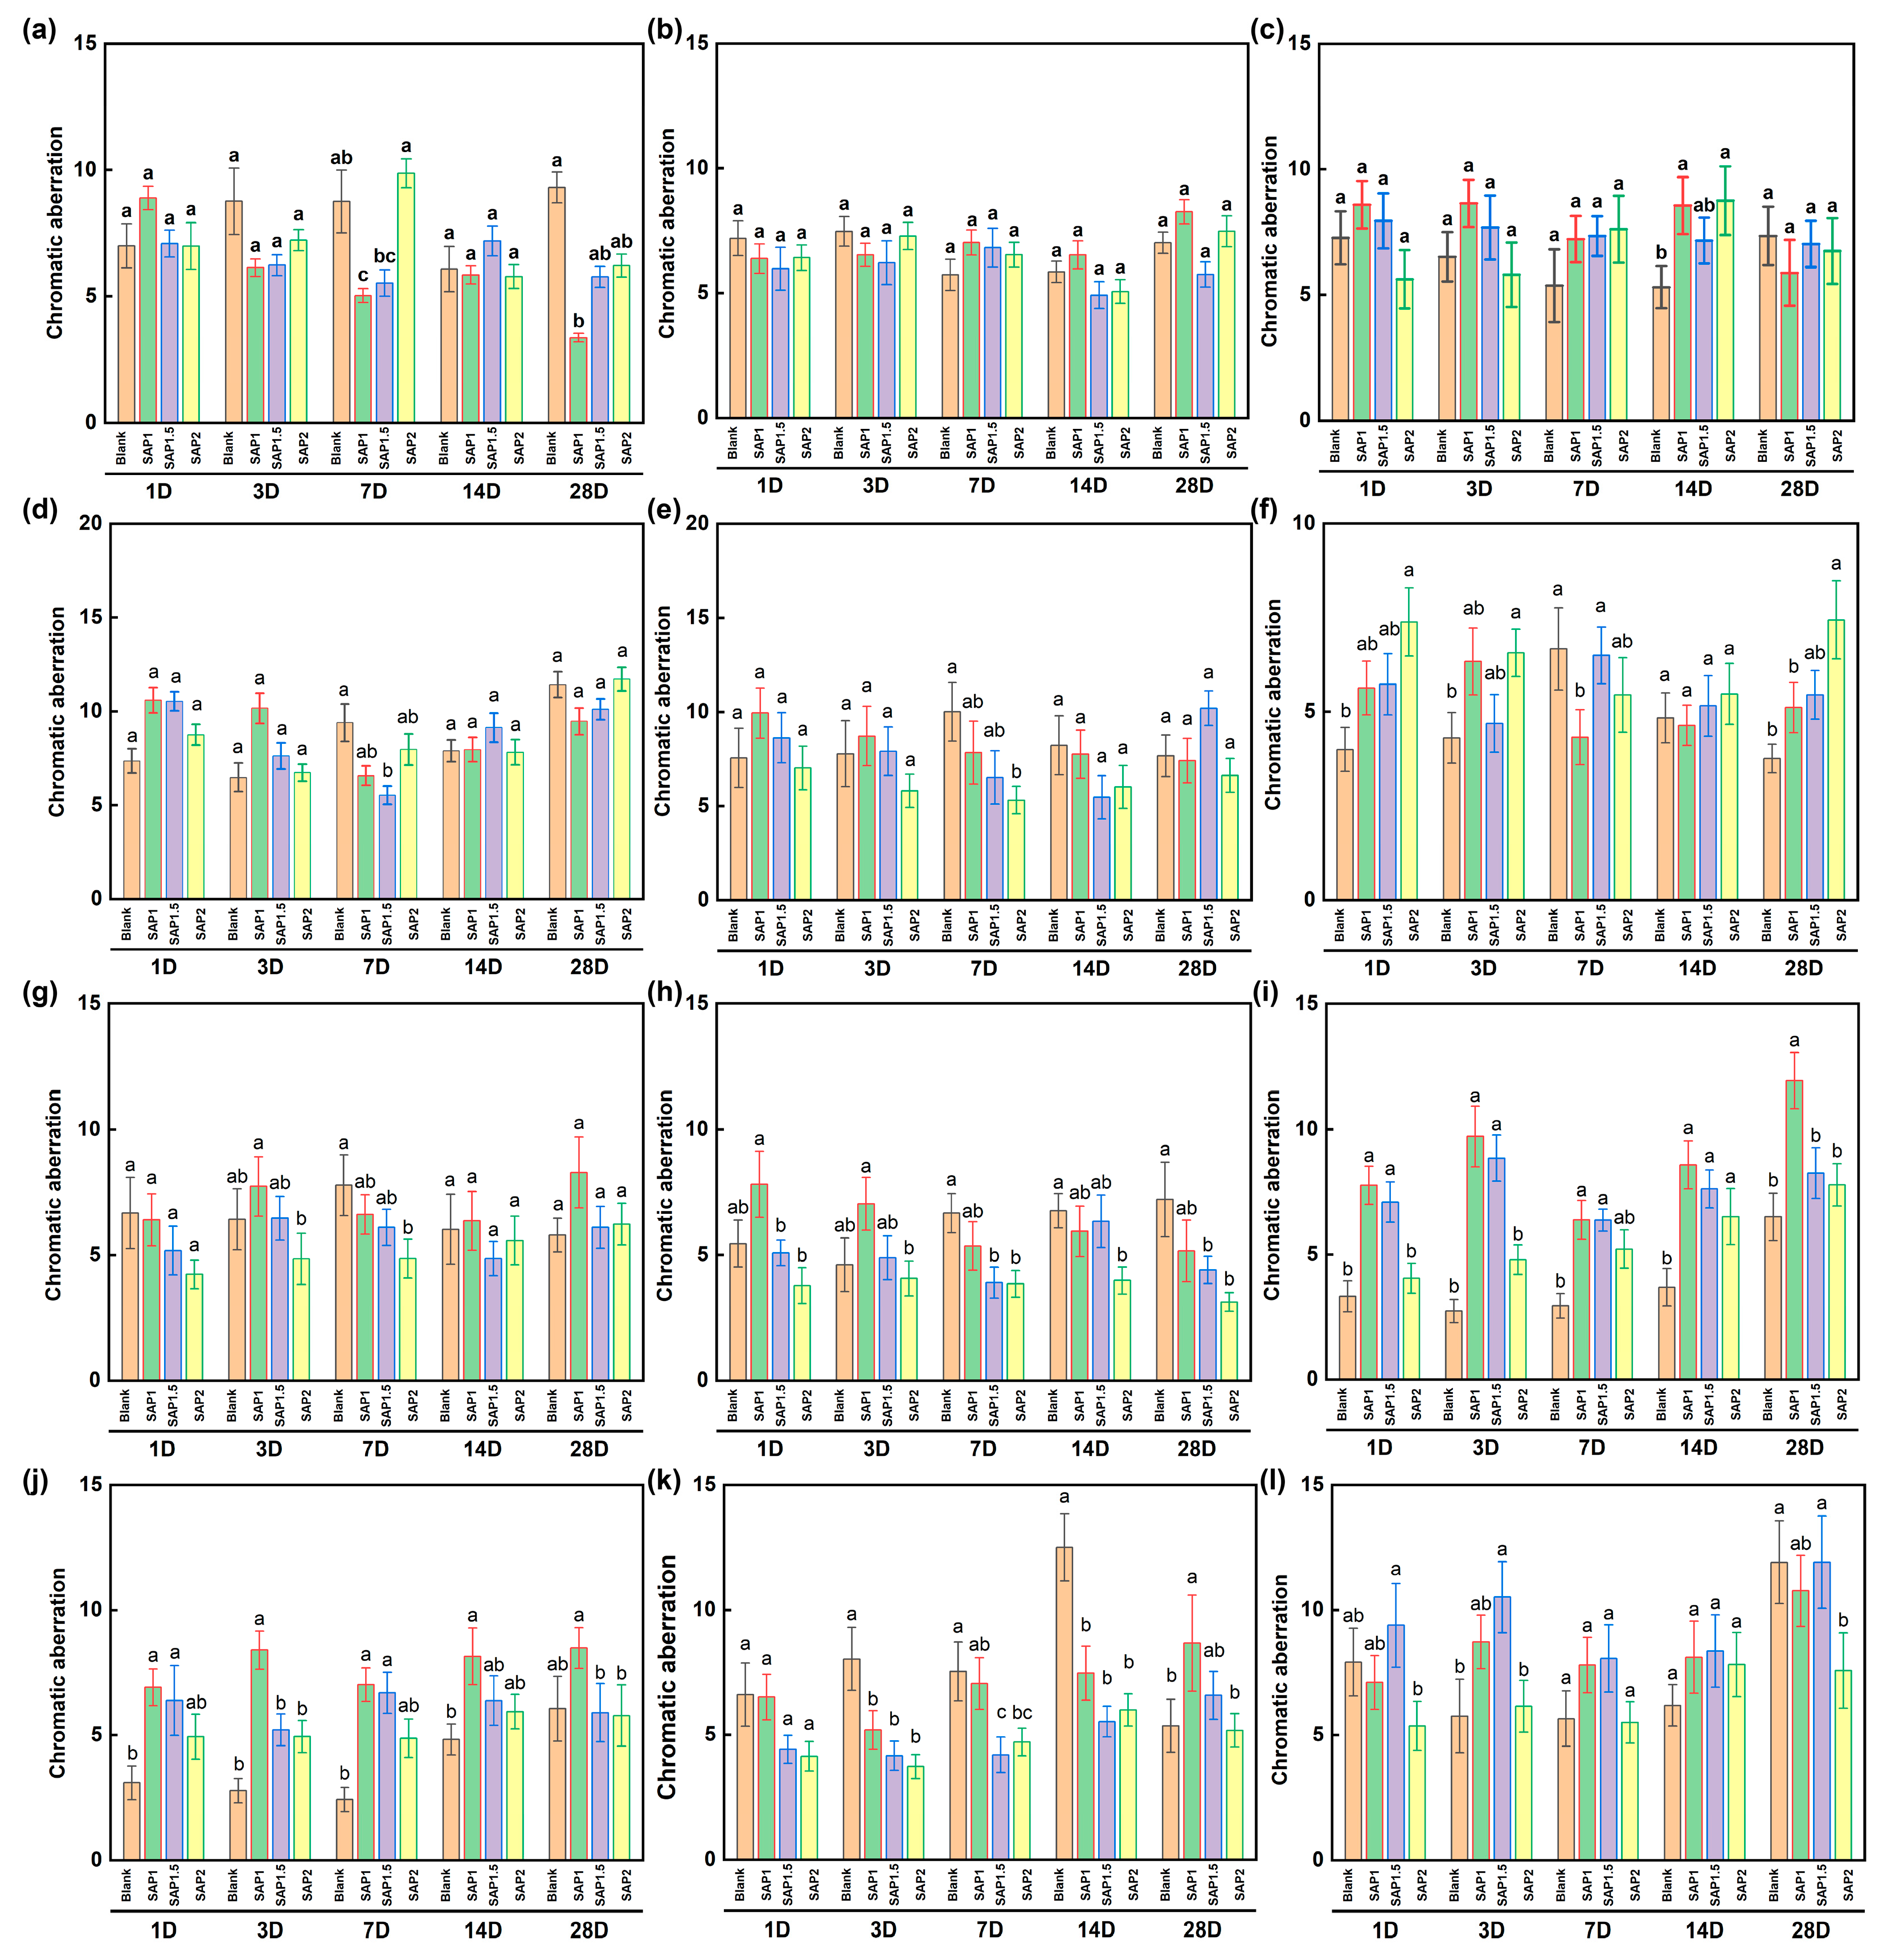
4.3. Color Difference Compatibility Analysis
4.4. Strength Analysis
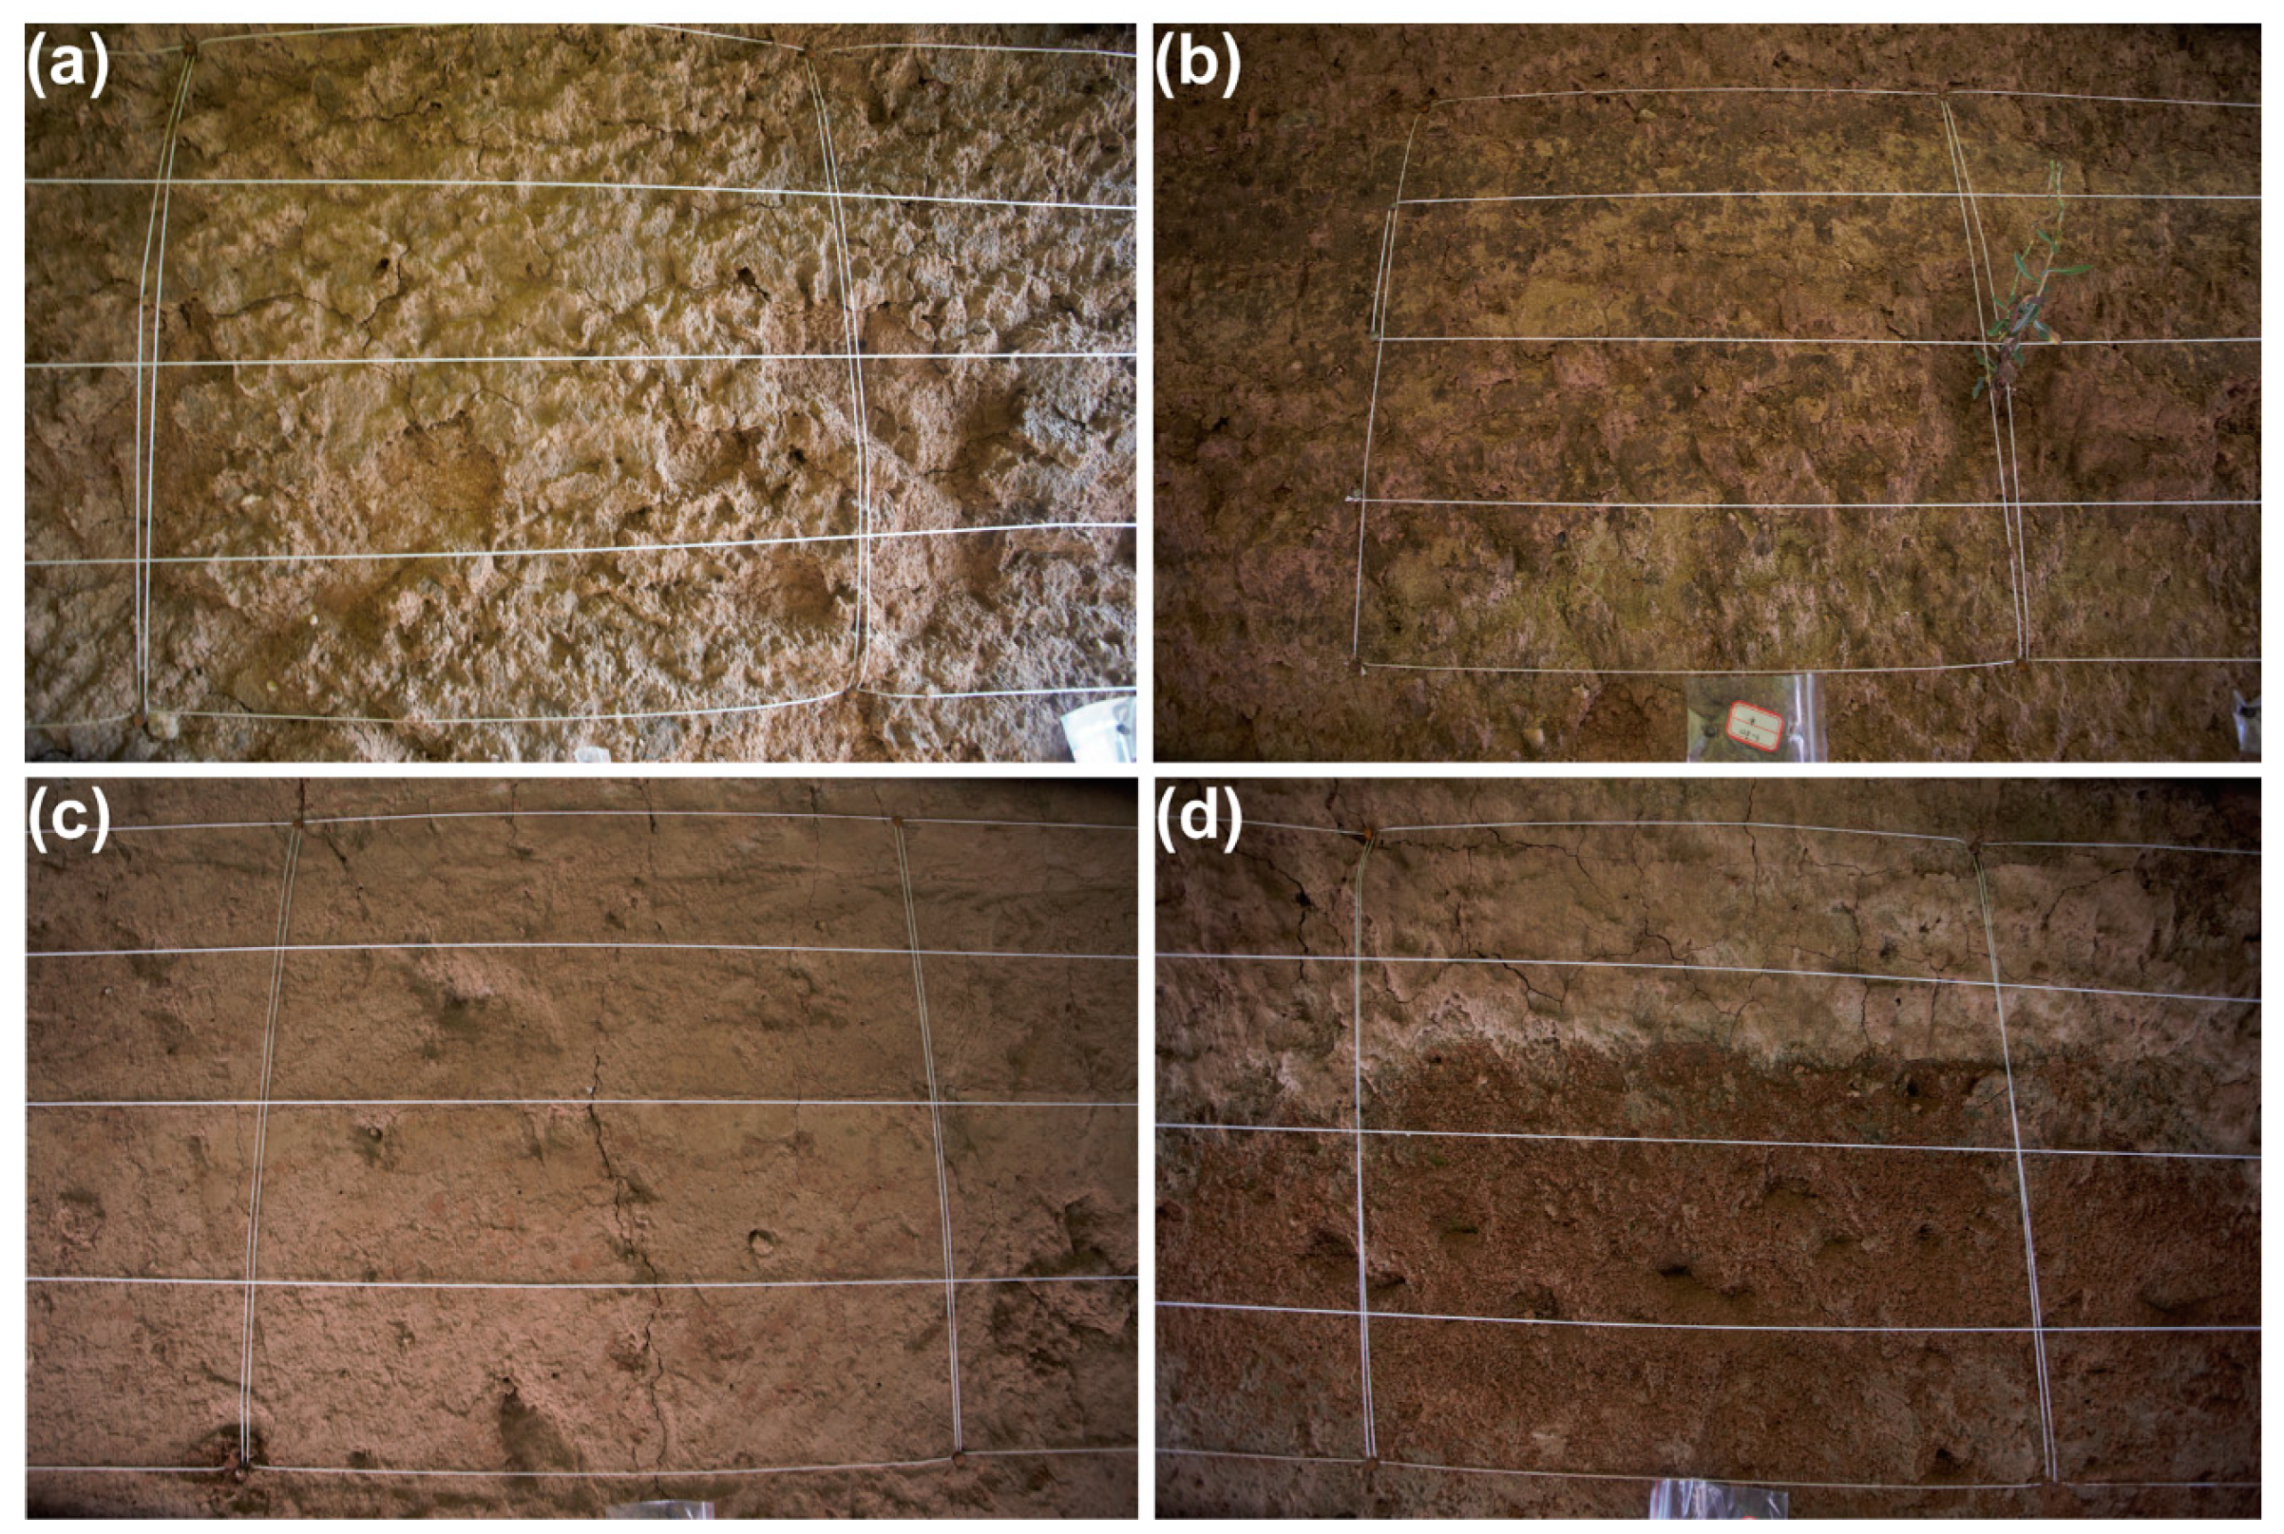
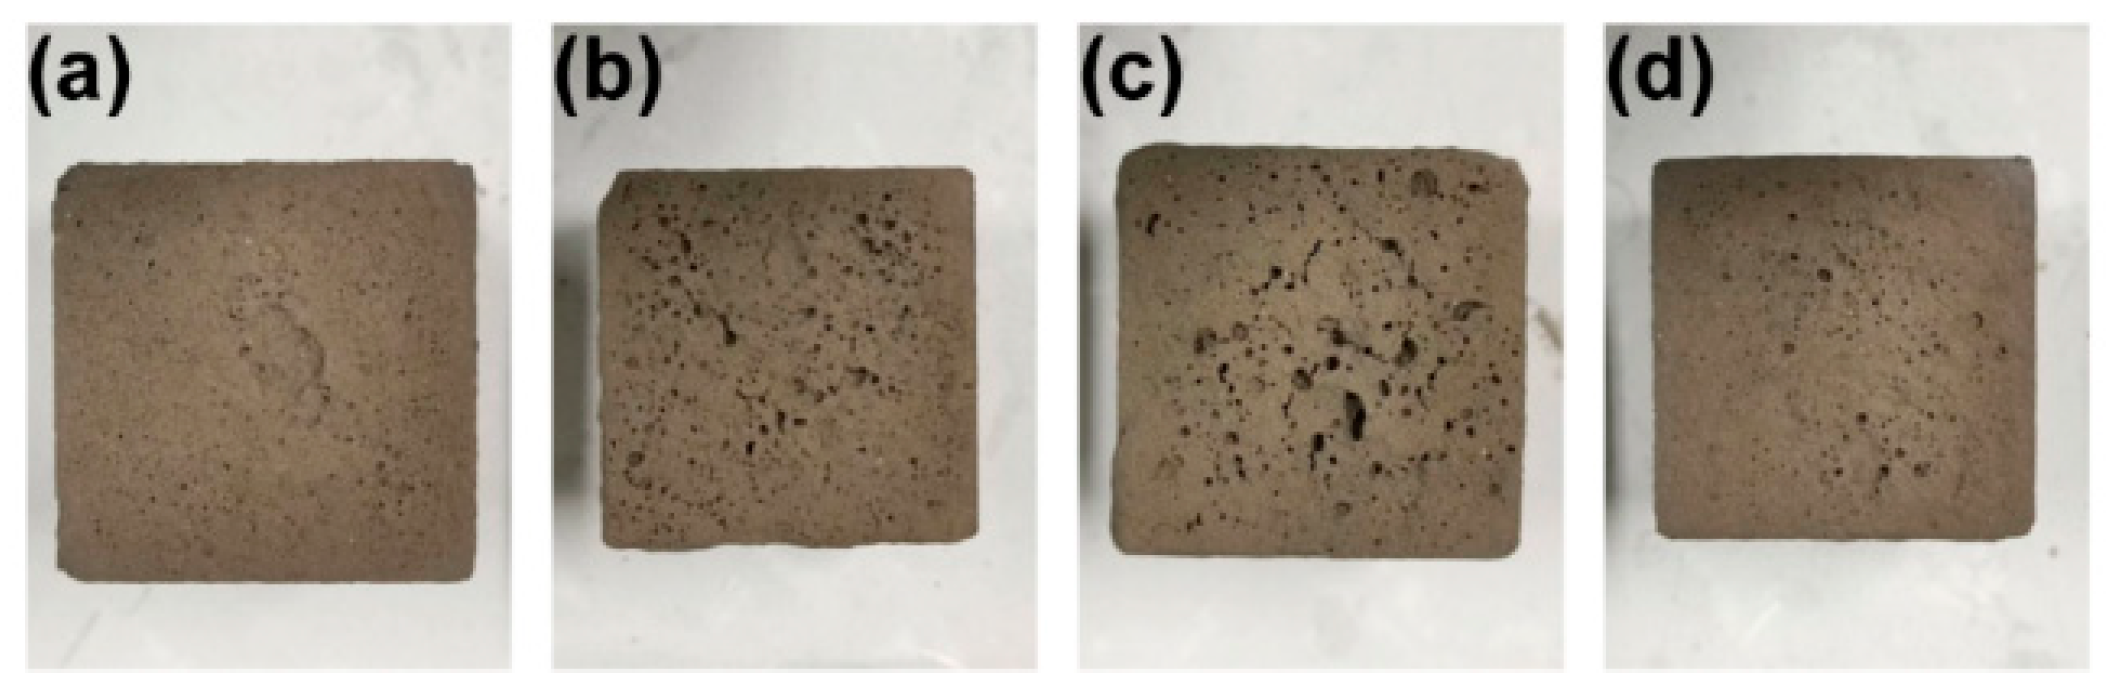
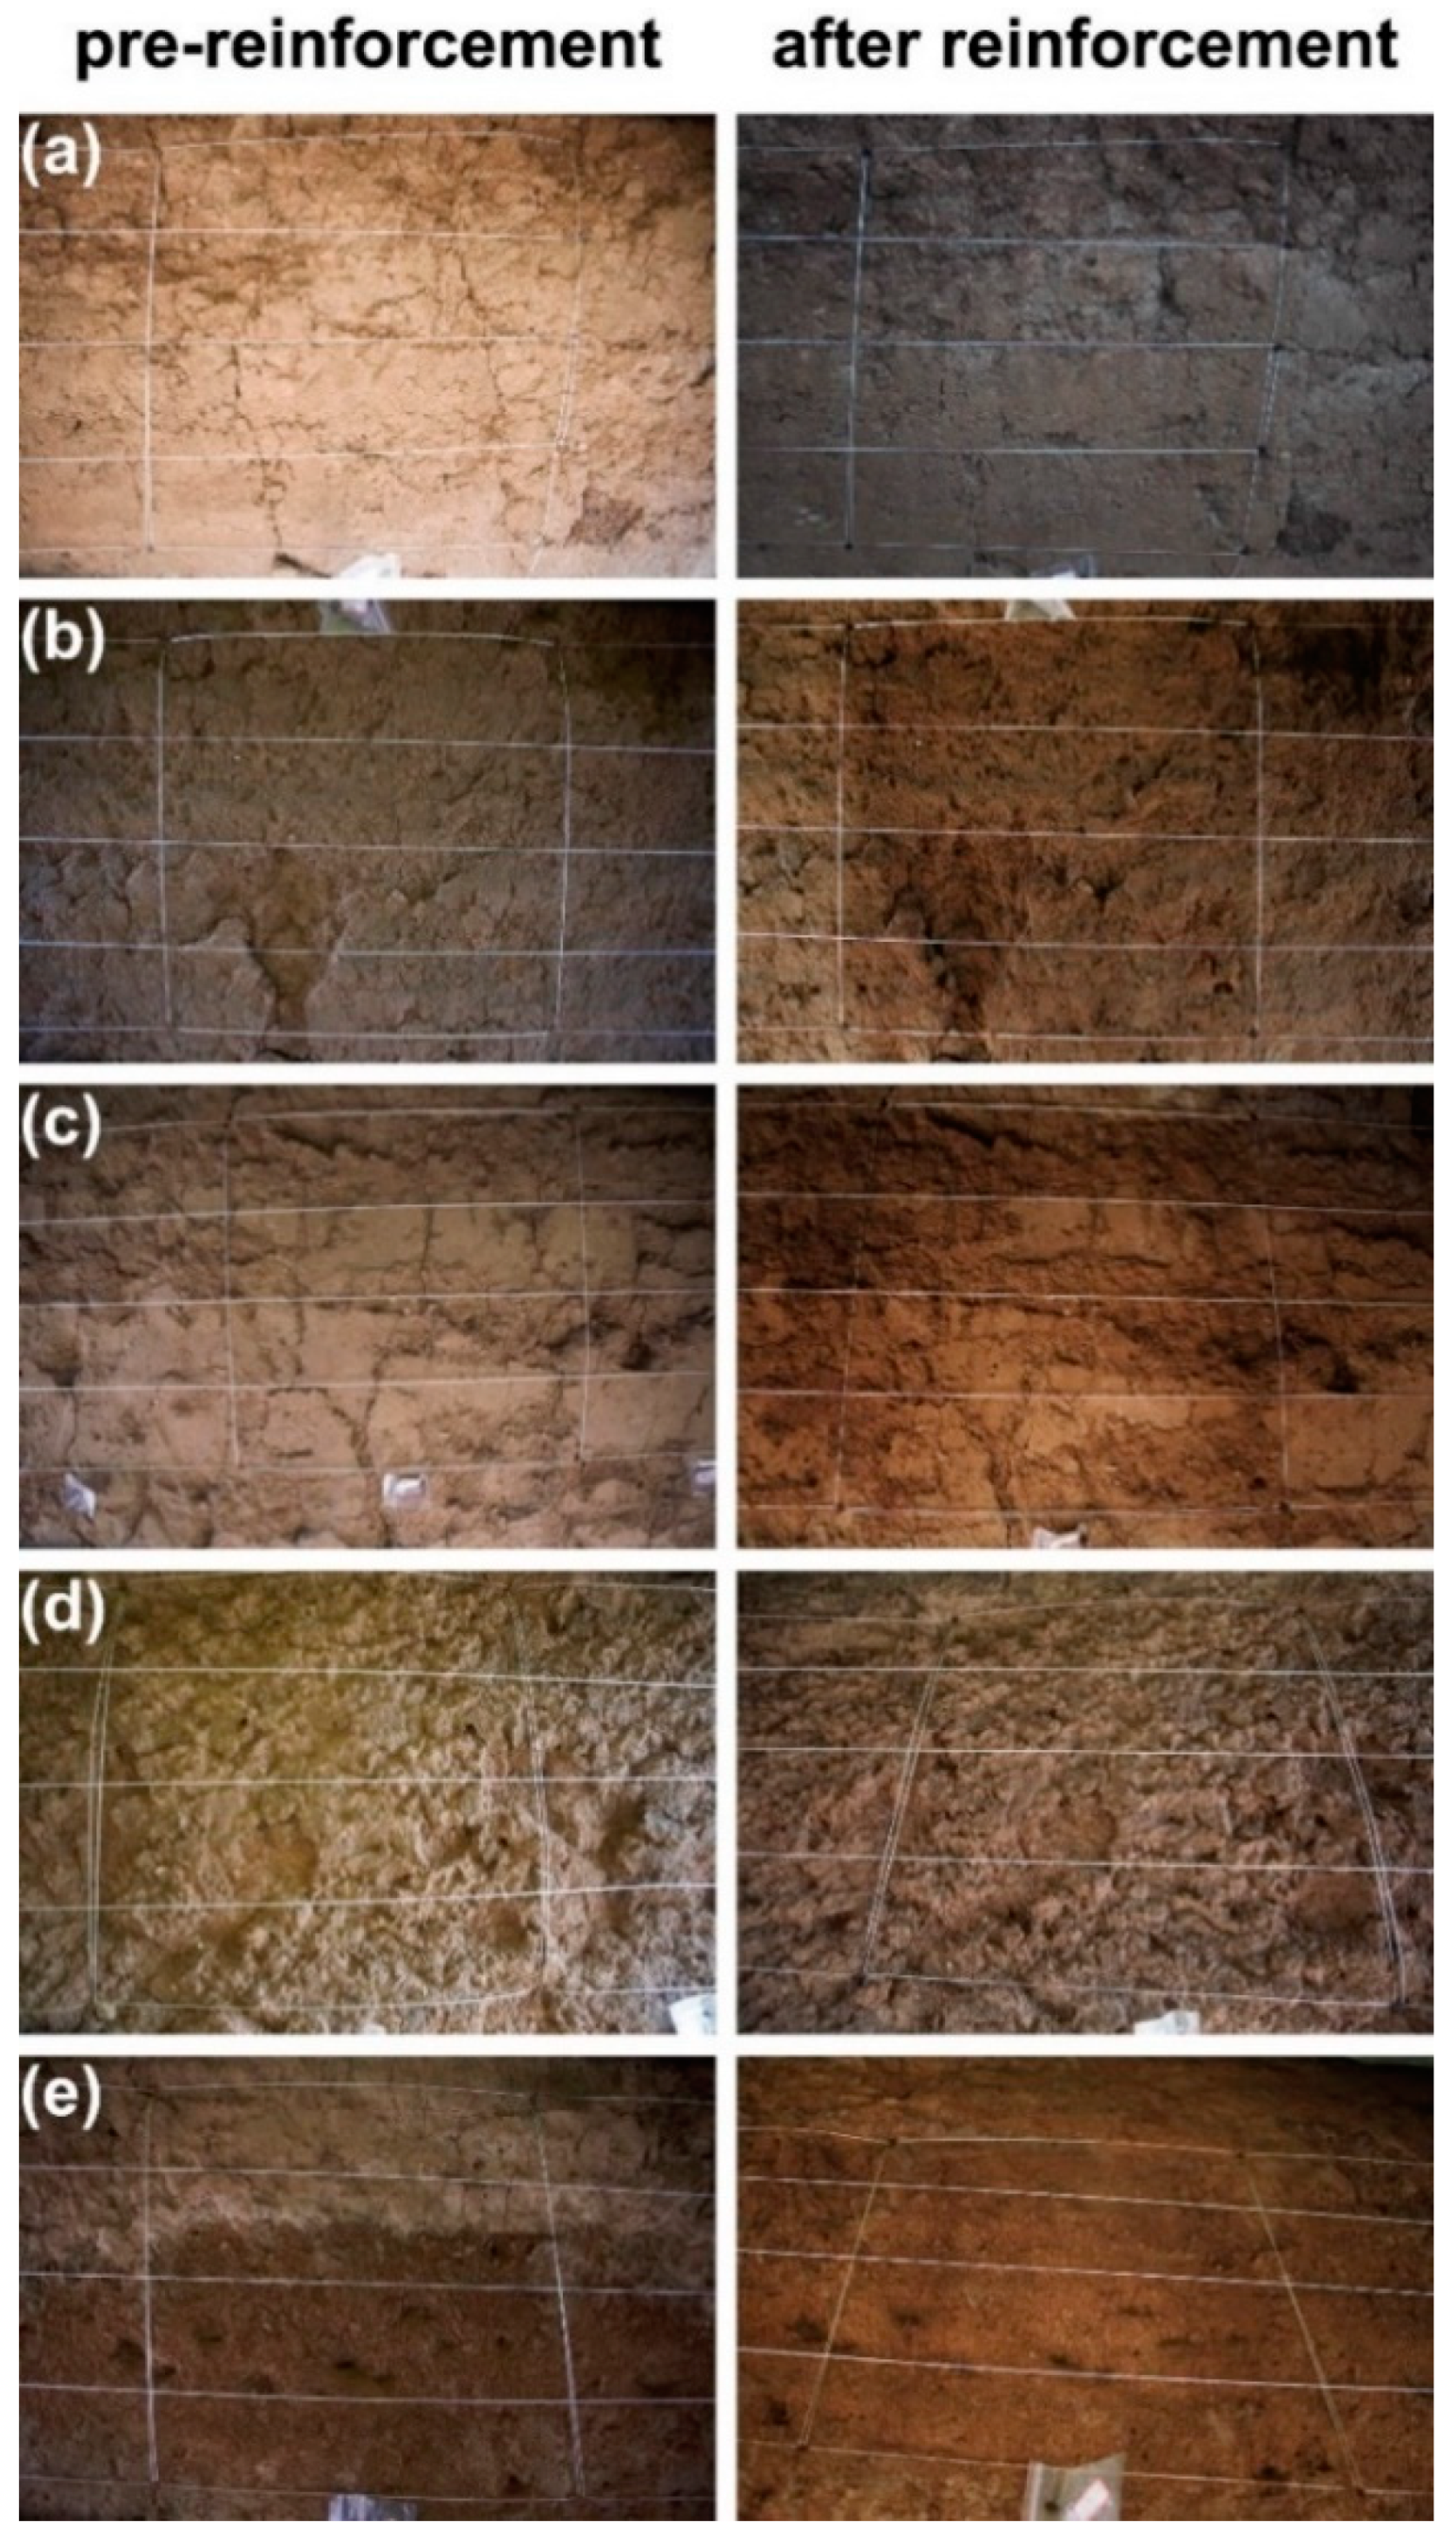
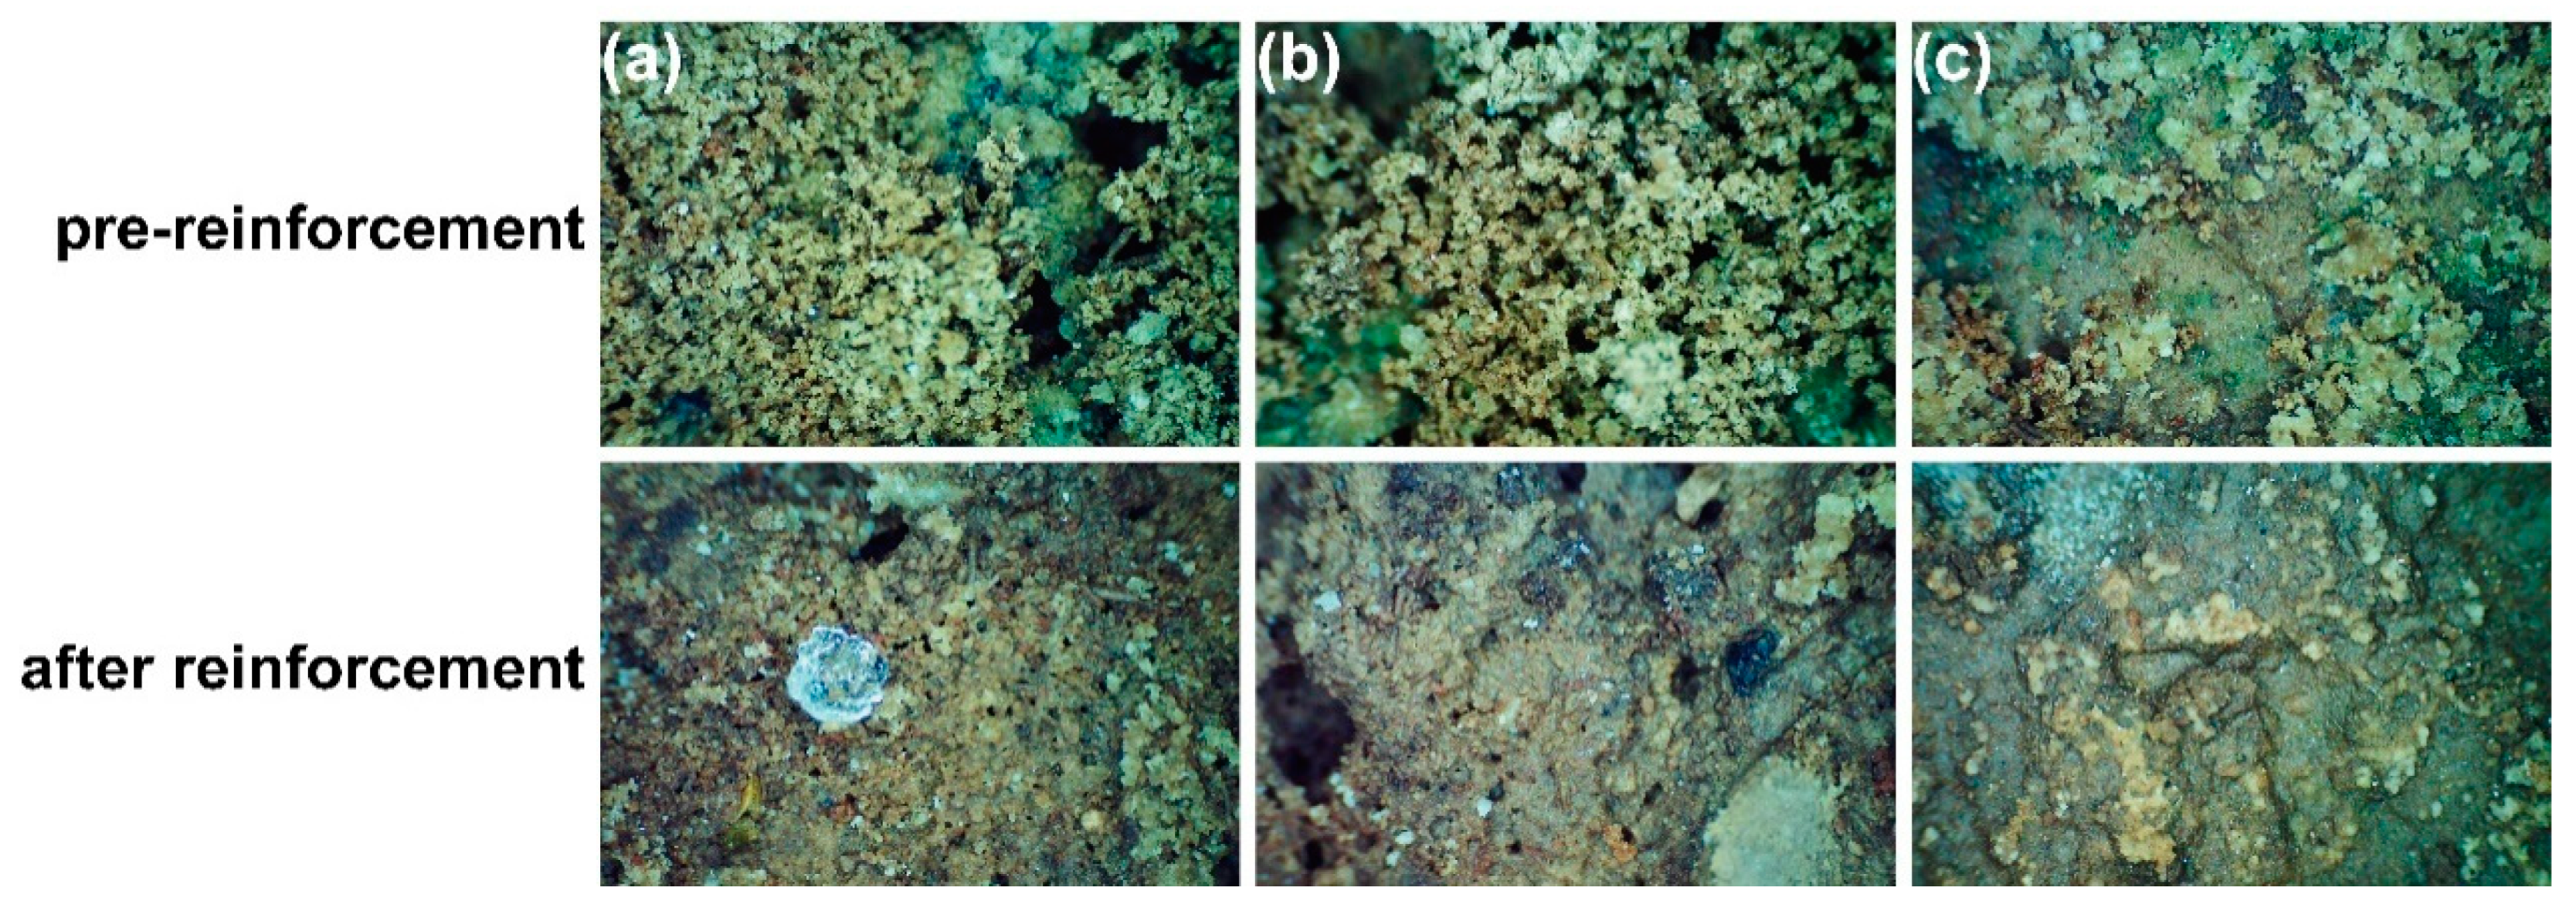
4.5. Macroscopic and Microscopic Morphology Analysis
5. Conclusions
Author Contributions
Funding
Institutional Review Board Statement
Informed Consent Statement
Data Availability Statement
Acknowledgments
Conflicts of Interest
References
- Li, Z.; Wang, X.; Sun, M.; Chen, W.; Guo, Q.; Zhang, H. Conservation of Jiaohe ancient earthen site in China. J. Rock Mech. Geotech. Eng. 2011, 3, 270–281. [Google Scholar] [CrossRef]
- Efthimiou, N.; Psomiadis, E.; Panagos, P. Fire severity and soil erosion susceptibility mapping using multi-temporal earth observation data: The case of mati fatal wildfire in eastern attica, greece. Catena 2020, 187, 104320. [Google Scholar] [CrossRef]
- Lan, H.X.; Zhao, X.X.; Macciotta, R.; Peng, J.B.; Li, L.P.; Wu, Y.M.; Zhu, Y.B.; Liu, X.; Zhang, N.; Liu, S.J.; et al. The cyclic expansion and contraction characteristics of a loess slope and implications for slope stability. Sci. Rep. 2021, 11, 2250. [Google Scholar] [CrossRef]
- Wen-wu, C.; Na, S.; Guang, Y. Effect of wind field on sapping quantity of earthen architecture ruins along ridge of semi-humid areas. Chin. J. Geotech. Eng. 2016, 38, 305–310. [Google Scholar]
- Lv, J.; Zhou, T.H.; Du, Q.; Wu, H.H. Experimental investigation on properties of gypsum-quicklime-soil grout material in the reparation of earthen site cracks. J. Constr. Build. Mater. 2017, 157, 253–262. [Google Scholar] [CrossRef]
- Martins da Silva, R.; Schueremans, L.; Oliveira, D. In Grouting as a repair/strengthening solution for earth constructions. In 1st WTA International PhD Symposium; WTA Publications: Leuven, Belgium, 2009. [Google Scholar]
- Xinjun, C.; Chunfeng, H.; Jiewen, Y.; Yansheng, G.; Chenxi, R. Unconfined compression strength of Tianluoshan relic soils solidified by Methyl Acrylic Acid Resin. J. Adv. Mater. Res. 2012, 594, 594–597. [Google Scholar]
- García-Vera, V.E.; Tenza-Abril, A.J.; Lanzón, M. The effectiveness of ethyl silicate as consolidating and protective coating to extend the durability of earthen plasters. J. Constr. Build. Mater. 2020, 236, 117445. [Google Scholar] [CrossRef]
- Kong, R.; Zhang, F.; Wang, G.; Peng, J. Stabilization of Loess Using Nano-SiO2. Materials 2018, 11, 1014. [Google Scholar] [CrossRef] [PubMed]
- Zhang, Q.; Chen, W.; Yuan, P. Experimental study on impregnation and consolidation effects of modified polyvinyl alcohol solution for coarse-grained soils: A case study on the Subashi Buddhist Temple Ruins of China. J. Bull. Eng. Geol. Environ. 2020, 79, 1487–1500. [Google Scholar] [CrossRef]
- Lanzón, M.; Madrid, J.A.; Martínez-Arredondo, A.; Mónaco, S. Use of diluted Ca(OH)2 suspensions and their transformation into nanostructured CaCO3 coatings: A case study in strengthening heritage materials (stucco, adobe and stone). J. Appl. Surf. Sci. 2017, 424, 20–27. [Google Scholar] [CrossRef]
- García-Vera, V.E.; Tenza-Abril, A.J.; Solak, A.M.; Lanzón, M. Calcium hydroxide nanoparticles coatings applied on cultural heritage materials: Their influence on physical characteristics of earthen plasters. J. Appl. Surf. Sci. 2020, 504, 144195. [Google Scholar] [CrossRef]
- Maravelaki-Kalaitzaki, P.; Kallithrakas-Kontos, N.; Agioutantis, Z.; Maurigiannakis, S.; Korakaki, D. A comparative study of porous limestones treated with silicon-based strengthening agents. Prog. Org. Coat. 2008, 62, 49–60. [Google Scholar] [CrossRef]
- Kim, E.K.; Won, J.; Do, J.Y.; Kim, S.D.; Kang, Y.S. Effects of silica nanoparticle and GPTMS addition on TEOS-based stone consolidants. J. Cult. Herit. 2009, 10, 214–221. [Google Scholar] [CrossRef]
- Biscontin, G.; Maravelaki, P.; Zendri, E.; Glisenti, A. Siliconic and acrylic resins dispersed in water as protectives for stone surface. J. MRS Online Proc. Libr. 1992, 267, 935. [Google Scholar] [CrossRef]
- Carretti, E.; Dei, L. Physicochemical characterization of acrylic polymeric resins coating porous materials of artistic interest. J. Prog. Org. Coat. 2004, 49, 282–289. [Google Scholar] [CrossRef]
- Zhang, F.; Li, J.; Lei, Y.; Luo, P. Effects of super absorbent polymer on retention properties of soil water and nutrient. J. Basic Sci. Eng. 2010, 18, 120–128. [Google Scholar]
- Yazdani, F.; Allahdadi, I.; Akbari, G.A. Impact of superabsorbent polymer on yield and growth analysis of soybean (Glycine max L.) under drought stress condition. Pak. J. Biol. Sci. 2007, 10, 4190–4196. [Google Scholar] [CrossRef] [PubMed]
- Bai, W.; Zhang, H.; Liu, B.; Wu, Y.; Song, J. Effects of super-absorbent polymers on the physical and chemical properties of soil following different wetting and drying cycles. Soil Use Manag. 2010, 26, 253–260. [Google Scholar] [CrossRef]
- Zheng, T.; Liang, Y.H.; Ye, S.H.; He, Z.Y. Superabsorbent hydrogels as carriers for the controlled-release of urea: Experiments and a mathematical model describing the release rate. Biosyst. Eng. 2009, 102, 44–50. [Google Scholar] [CrossRef]
- Cao, Y.B.; Wang, B.T.; Guo, H.Y.; Xiao, H.J.; Wei, T.T. The effect of super absorbent polymers on soil and water conservation on the terraces of the loess plateau. Ecol. Eng. 2017, 102, 270–279. [Google Scholar] [CrossRef]
- Wu, S.; Wu, P.; Feng, H.; Bu, C. Influence of amendments on soil structure and soil loss under simulated rainfall China’s loess plateau. Afr. J. Biotechnol. 2010, 9, 6116–6121. [Google Scholar]
- NY/T 886-2022; Agricultural and Forestry Absorbent Polymer. Ministry of Agriculture and Rural Affairs of the People’s Republic of China: Beijing, China, 2022.
- NY/T 2271-2016; Soil Conditioner Evaluation General Requirements for Effect Testing and Assessment. Ministry of Agriculture and Rural Affairs of the People’s Republic of China: Beijing, China, 2016.
- Lin, Y.T.; Mao, W.J.; Deng, K.; Kang, H.Y.; Shi, M.Y.; Sun, M.L. Interpreting the initial growth process of surface peeling: Microstructural evolutions of soil deterioration on archaeological sites. Int. J. Archit. Herit. 2024, 1–14. [Google Scholar] [CrossRef]
- GB/T 50123-2019; Standard for Geotechnical Testing Method. Ministry of Ecology and Environment: Beijing, China; State Administration for Market Regulation: Beijing, China, 2019; p. 717.
- Chen, W.W.; Zhang, Y.M.; Zhang, J.K.; Dai, P.F. Consolidation effect of composite materials on earthen sites. Constr. Build. Mater. 2018, 187, 730–737. [Google Scholar] [CrossRef]
- Zhao, D.; Lu, W.; Wang, Y.; Mao, X.; Ai, Y.; Jiang, H. Experimental studies on earthen architecture sites consolidated with BS materials in arid regions. J. Adv. Mater. Sci. Eng. 2016, 2016, 6836315. [Google Scholar] [CrossRef]
- Kong, W.; Li, Q.; Li, X.; Su, Y.; Yue, Q.; Gao, B. A biodegradable biomass-based polymeric composite for slow release and water retention. J. Environ. Manag. 2019, 230, 190–198. [Google Scholar] [CrossRef] [PubMed]
- Zhao, W.J.; Cao, T.H.; Dou, P.X.; Sheng, J.; Luo, M.Q. Effect of various concentrations of superabsorbent polymers on soil particle-size distribution and evaporation with sand mulching. Sci. Rep. 2019, 9, 3511. [Google Scholar] [CrossRef] [PubMed]
- Camerini, R.; Chelazzi, D.; Giorgi, R.; Baglioni, P. Hybrid nano-composites for the consolidation of earthen masonry. J. Colloid Interface Sci. 2019, 539, 504–515. [Google Scholar] [CrossRef]
- Elert, K.; Pardo, E.S.; Rodriguez-Navarro, C. Alkaline activation as an alternative method for the consolidation of earthen architecture. J. Cult. Herit. 2015, 16, 461–469. [Google Scholar] [CrossRef]
- Rodrigues, J.D.; Grossi, A. Indicators and ratings for the compatibility assessment of conservation actions. J. Cult. Herit. 2007, 8, 32–43. [Google Scholar] [CrossRef]
- Bahmani, M.; Noorzad, A.; Hamedi, J.; Sali, F. The role of bacillus pasteurii on the change of parameters of sands according to temperatur compresion and wind erosion resistance. J. CleanWAS 2017, 1, 1–5. [Google Scholar] [CrossRef]
- Yang, Q.Y.; Li, C.W. Research on the Impact of Drying and Wetting Cycle of Capillary Water on Weathering of Soil Sites. Chin. J. Undergr. Space Eng. 2012, 8, 517–525. [Google Scholar]
- Zhang, Y.; Zhong, X.; Lin, J.; Zhao, D.; Jiang, F.; Wang, M.-K.; Ge, H.; Huang, Y. Effects of fractal dimension and water content on the shear strength of red soil in the hilly granitic region of southern China. J. Geomorphol. 2020, 351, 106956. [Google Scholar] [CrossRef]
- Gerard, C. The influence of soil moisture, soil texture, drying conditions, and exchangeable cations on soil strength. Soil Sci. Soc. Am. J. 1965, 29, 641–645. [Google Scholar] [CrossRef]
- Matsushi, Y.; Matsukura, Y. Cohesion of unsaturated residual soils as a function of volumetric water content. J. Bull. Eng. Geol. Environ. 2006, 65, 449–455. [Google Scholar] [CrossRef]
- Bian, X.; Cao, Y.P.; Wang, Z.F.; Ding, G.Q.; Lei, G.H. Effect of super-absorbent polymer on the undrained shear behavior of cemented dredged clay with high water content. J. Mater. Civ. Eng. 2017, 29, 04017023. [Google Scholar] [CrossRef]
- Zhang, J.; Chen, W.; He, F.; Li, Z.; Sun, M. Field experimental study on anchorage perfromance of gfrp at conservation earthen sites. J. Eng. Geol. 2014, 22, 804–810. [Google Scholar]
- Yulan, W.; Jian, G.; Weixi, Z.; Fan, L. Experimental research on the performance of a novel geo-filament anchor for an earthen architectural site. J. Herit. Sci. 2023, 11, 34. [Google Scholar] [CrossRef]
- Zhang, Q.; Chen, W.; Han, N.; Cai, T.; Du, Y. Feasibility of polyvinyl alcohol-treated soil in a mud state as the anti-weathering material for earthen sites. Int. J. Archit. Herit. 2021, 17, 486–499. [Google Scholar] [CrossRef]
- Liu, J.; Li, G.; Li, X.A. Geotechnical engineering properties of soils solidified by microbially induced CaCO3 precipitation (MICP). Adv. Civ. Eng. 2021, 2021, 6683930. [Google Scholar] [CrossRef]
- Shu, M.; Yu, Y.; Yin, M.; Wang, J.; Bandala, E.R.; Rodrigo-Comino, J. Super absorbent polymer (sap) on water-salt transport in saline alkali soil: Effects of dosage, height and thickness. Eur. J. Soil Sci. 2024, 75, e13500. [Google Scholar] [CrossRef]


| Natural Water Content (%) | Specific Gravity | Dry Density (g/cm3) | Porosity (%) | Liquid Limit (%) | Plastic Limit (%) | Plasticity Index (IP) | Organic Matter Content (g/kg) |
|---|---|---|---|---|---|---|---|
| 6.4 ± 1.05 | 2.71 | 1.49 ± 0.06 | 35.57 | 34.15 | 14.3 | 19.85 | 16.8 |
| Elements | SiO2 | Al2O3 | CaO | Fe2O3 | K2O | MgO | Na2O | P2O5 | SO3 | Cl |
|---|---|---|---|---|---|---|---|---|---|---|
| Content (%) | 49.20 | 13.37 | 12.98 | 4.01 | 3.77 | 2.72 | 3.12 | 4.16 | 5.62 | 0.43 |
| Cation Content (mg/g) | Anion Content (mg/g) | Total (mg/g) | ||||||
|---|---|---|---|---|---|---|---|---|
| Ca2+ | Mg2+ | Na+ | K+ | NO3− | CO32− | SO42− | Cl− | |
| 0.1280 | 0.0426 | 0.4415 | 0.0201 | 0.0135 | 0.0605 | 0.4237 | 0.0245 | 1.1544 |
| Reinforcement Area | Maximum Saturation Sr (%) | Infiltration Volume (L) |
|---|---|---|
| The first layer platform | 85 | 2.8 |
| The second layer platform | 65 | 2.1 |
| The third layer platform | 45 | 1.5 |
Disclaimer/Publisher’s Note: The statements, opinions and data contained in all publications are solely those of the individual author(s) and contributor(s) and not of MDPI and/or the editor(s). MDPI and/or the editor(s) disclaim responsibility for any injury to people or property resulting from any ideas, methods, instructions or products referred to in the content. |
© 2024 by the authors. Licensee MDPI, Basel, Switzerland. This article is an open access article distributed under the terms and conditions of the Creative Commons Attribution (CC BY) license (https://creativecommons.org/licenses/by/4.0/).
Share and Cite
Zheng, Y.; Liu, S.; Zhang, Y.; Du, Z.; Li, M.; Luo, H.; Zhu, J. Effect of In Situ Polymerization of Super Absorbent Polymers on the Protection of Earthen Heritage Sites in Semi-Arid Regions. Materials 2024, 17, 4839. https://doi.org/10.3390/ma17194839
Zheng Y, Liu S, Zhang Y, Du Z, Li M, Luo H, Zhu J. Effect of In Situ Polymerization of Super Absorbent Polymers on the Protection of Earthen Heritage Sites in Semi-Arid Regions. Materials. 2024; 17(19):4839. https://doi.org/10.3390/ma17194839
Chicago/Turabian StyleZheng, Yao, Senbiao Liu, Yifan Zhang, Zhilin Du, Miao Li, Hongjie Luo, and Jianfeng Zhu. 2024. "Effect of In Situ Polymerization of Super Absorbent Polymers on the Protection of Earthen Heritage Sites in Semi-Arid Regions" Materials 17, no. 19: 4839. https://doi.org/10.3390/ma17194839