
Boron Removal in Aqueous Solutions Using Adsorption with Sugarcane Bagasse Biochar and Ammonia Nanobubbles


Abstract
:
1. Introduction
2. Materials and Methods
2.1. Materials
2.2. Adsorbent Preparation Methods
2.2.1. Preparation Method for Char A
2.2.2. Preparation Method for Char B, B1, B2, and B3
2.3. Preparation Method for NH3 with N2 Nanobubbles
2.4. Analysis Methods
2.5. Adsorption Experiments
3. Results and Discussion
3.1. Material Characterization
3.1.1. Thermogravimetric Analysis
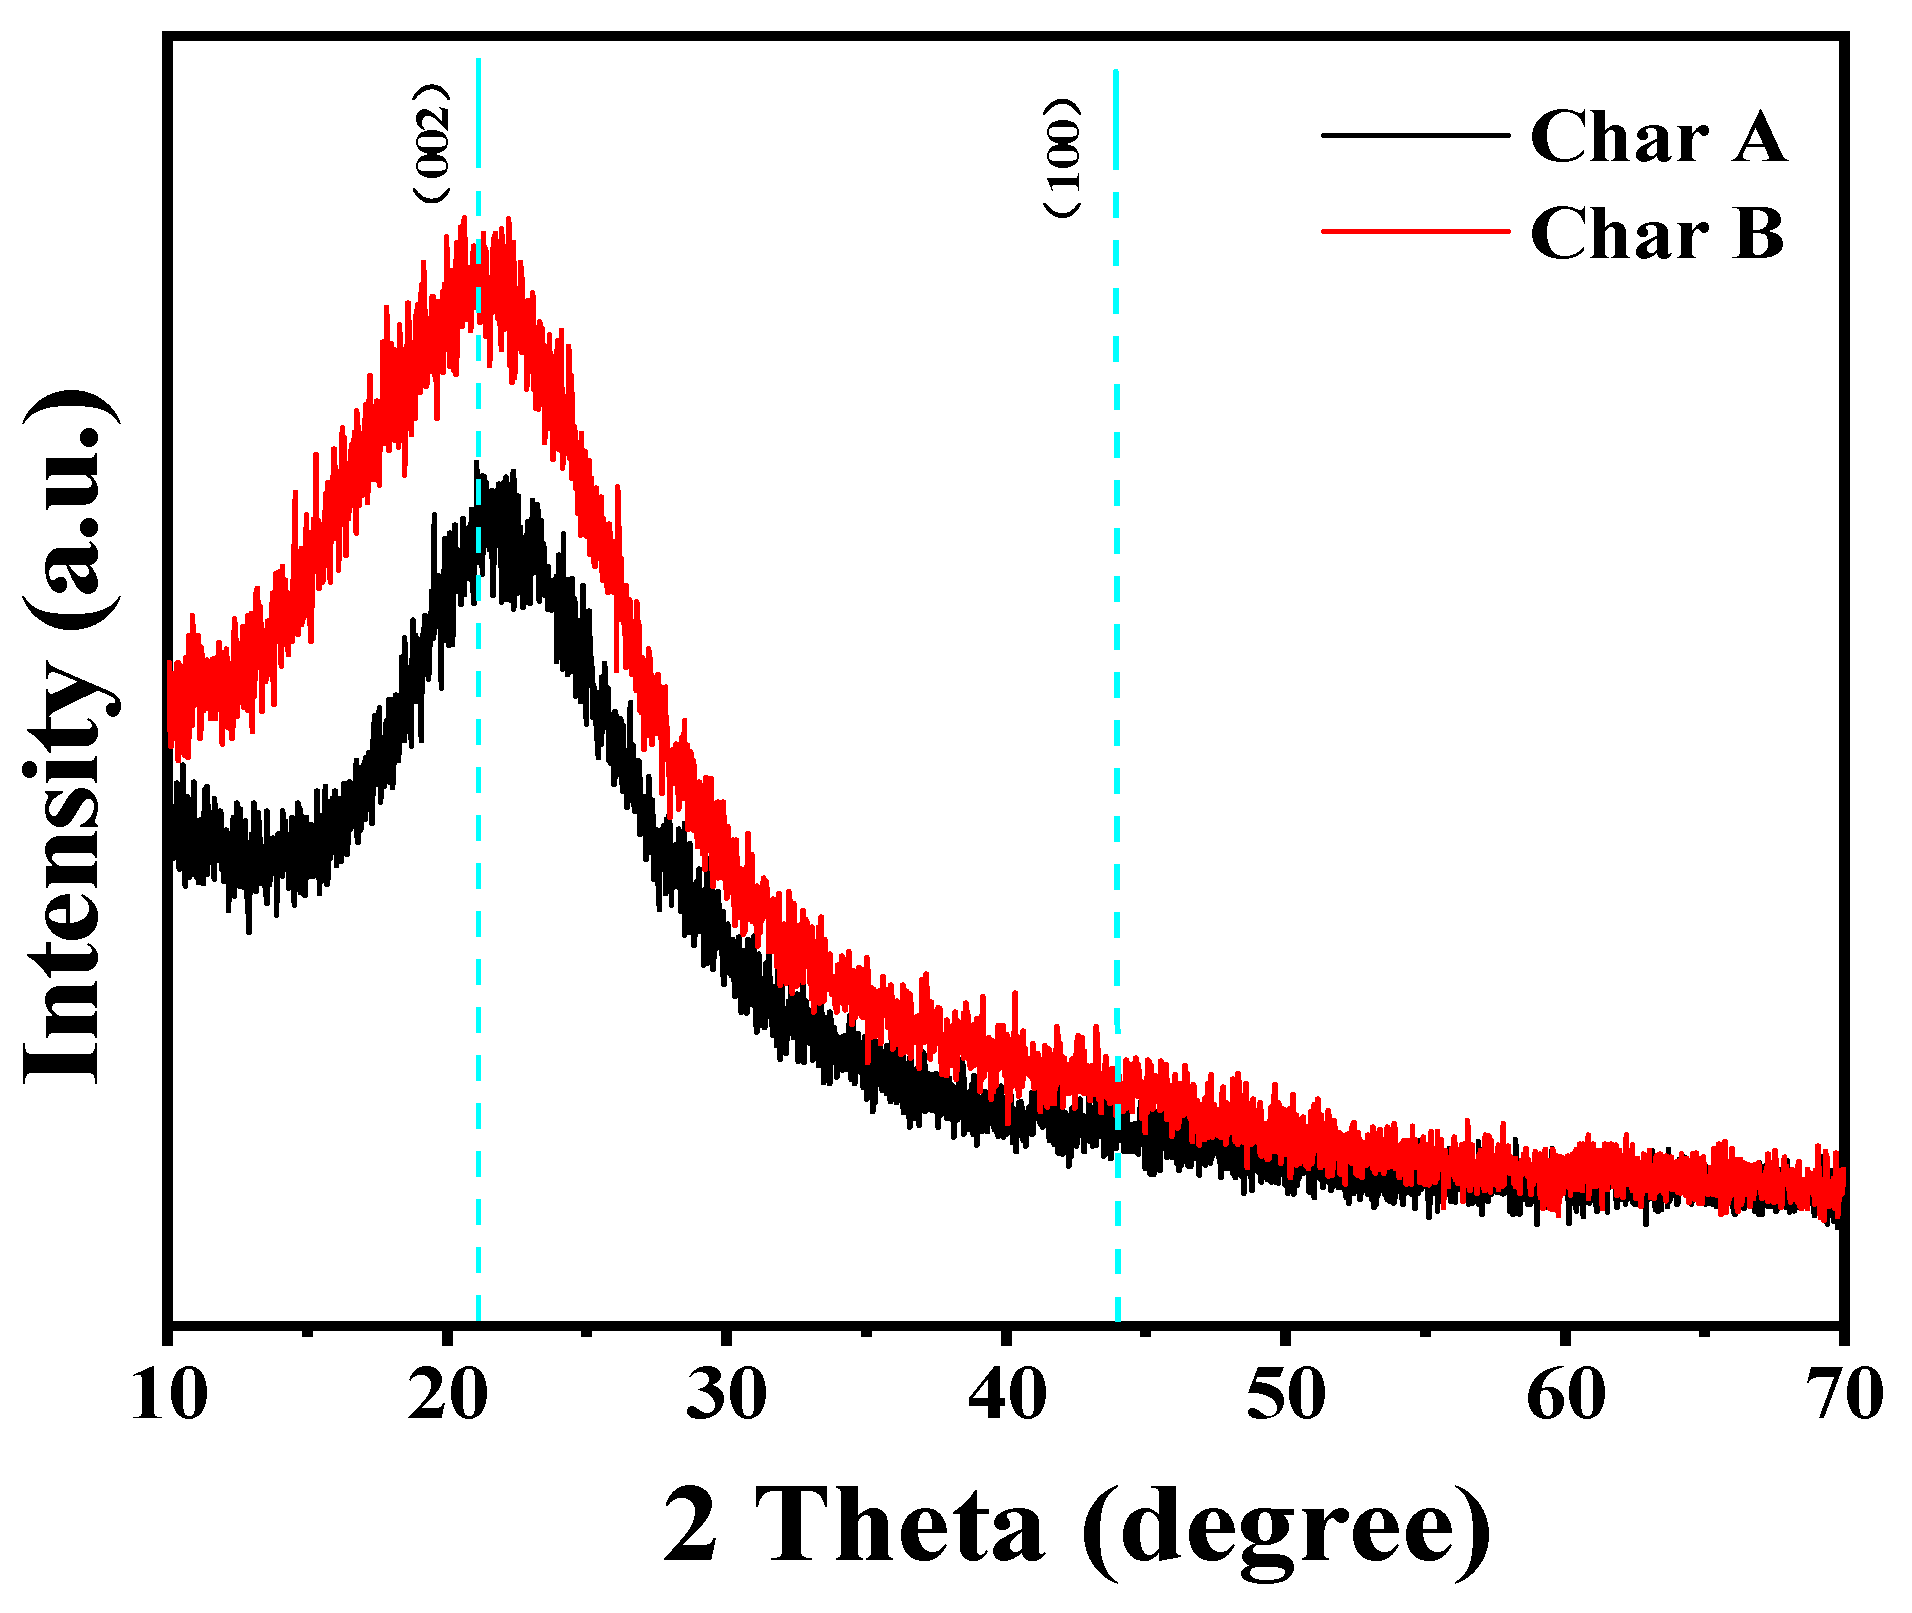
3.1.2. XRD Analysis
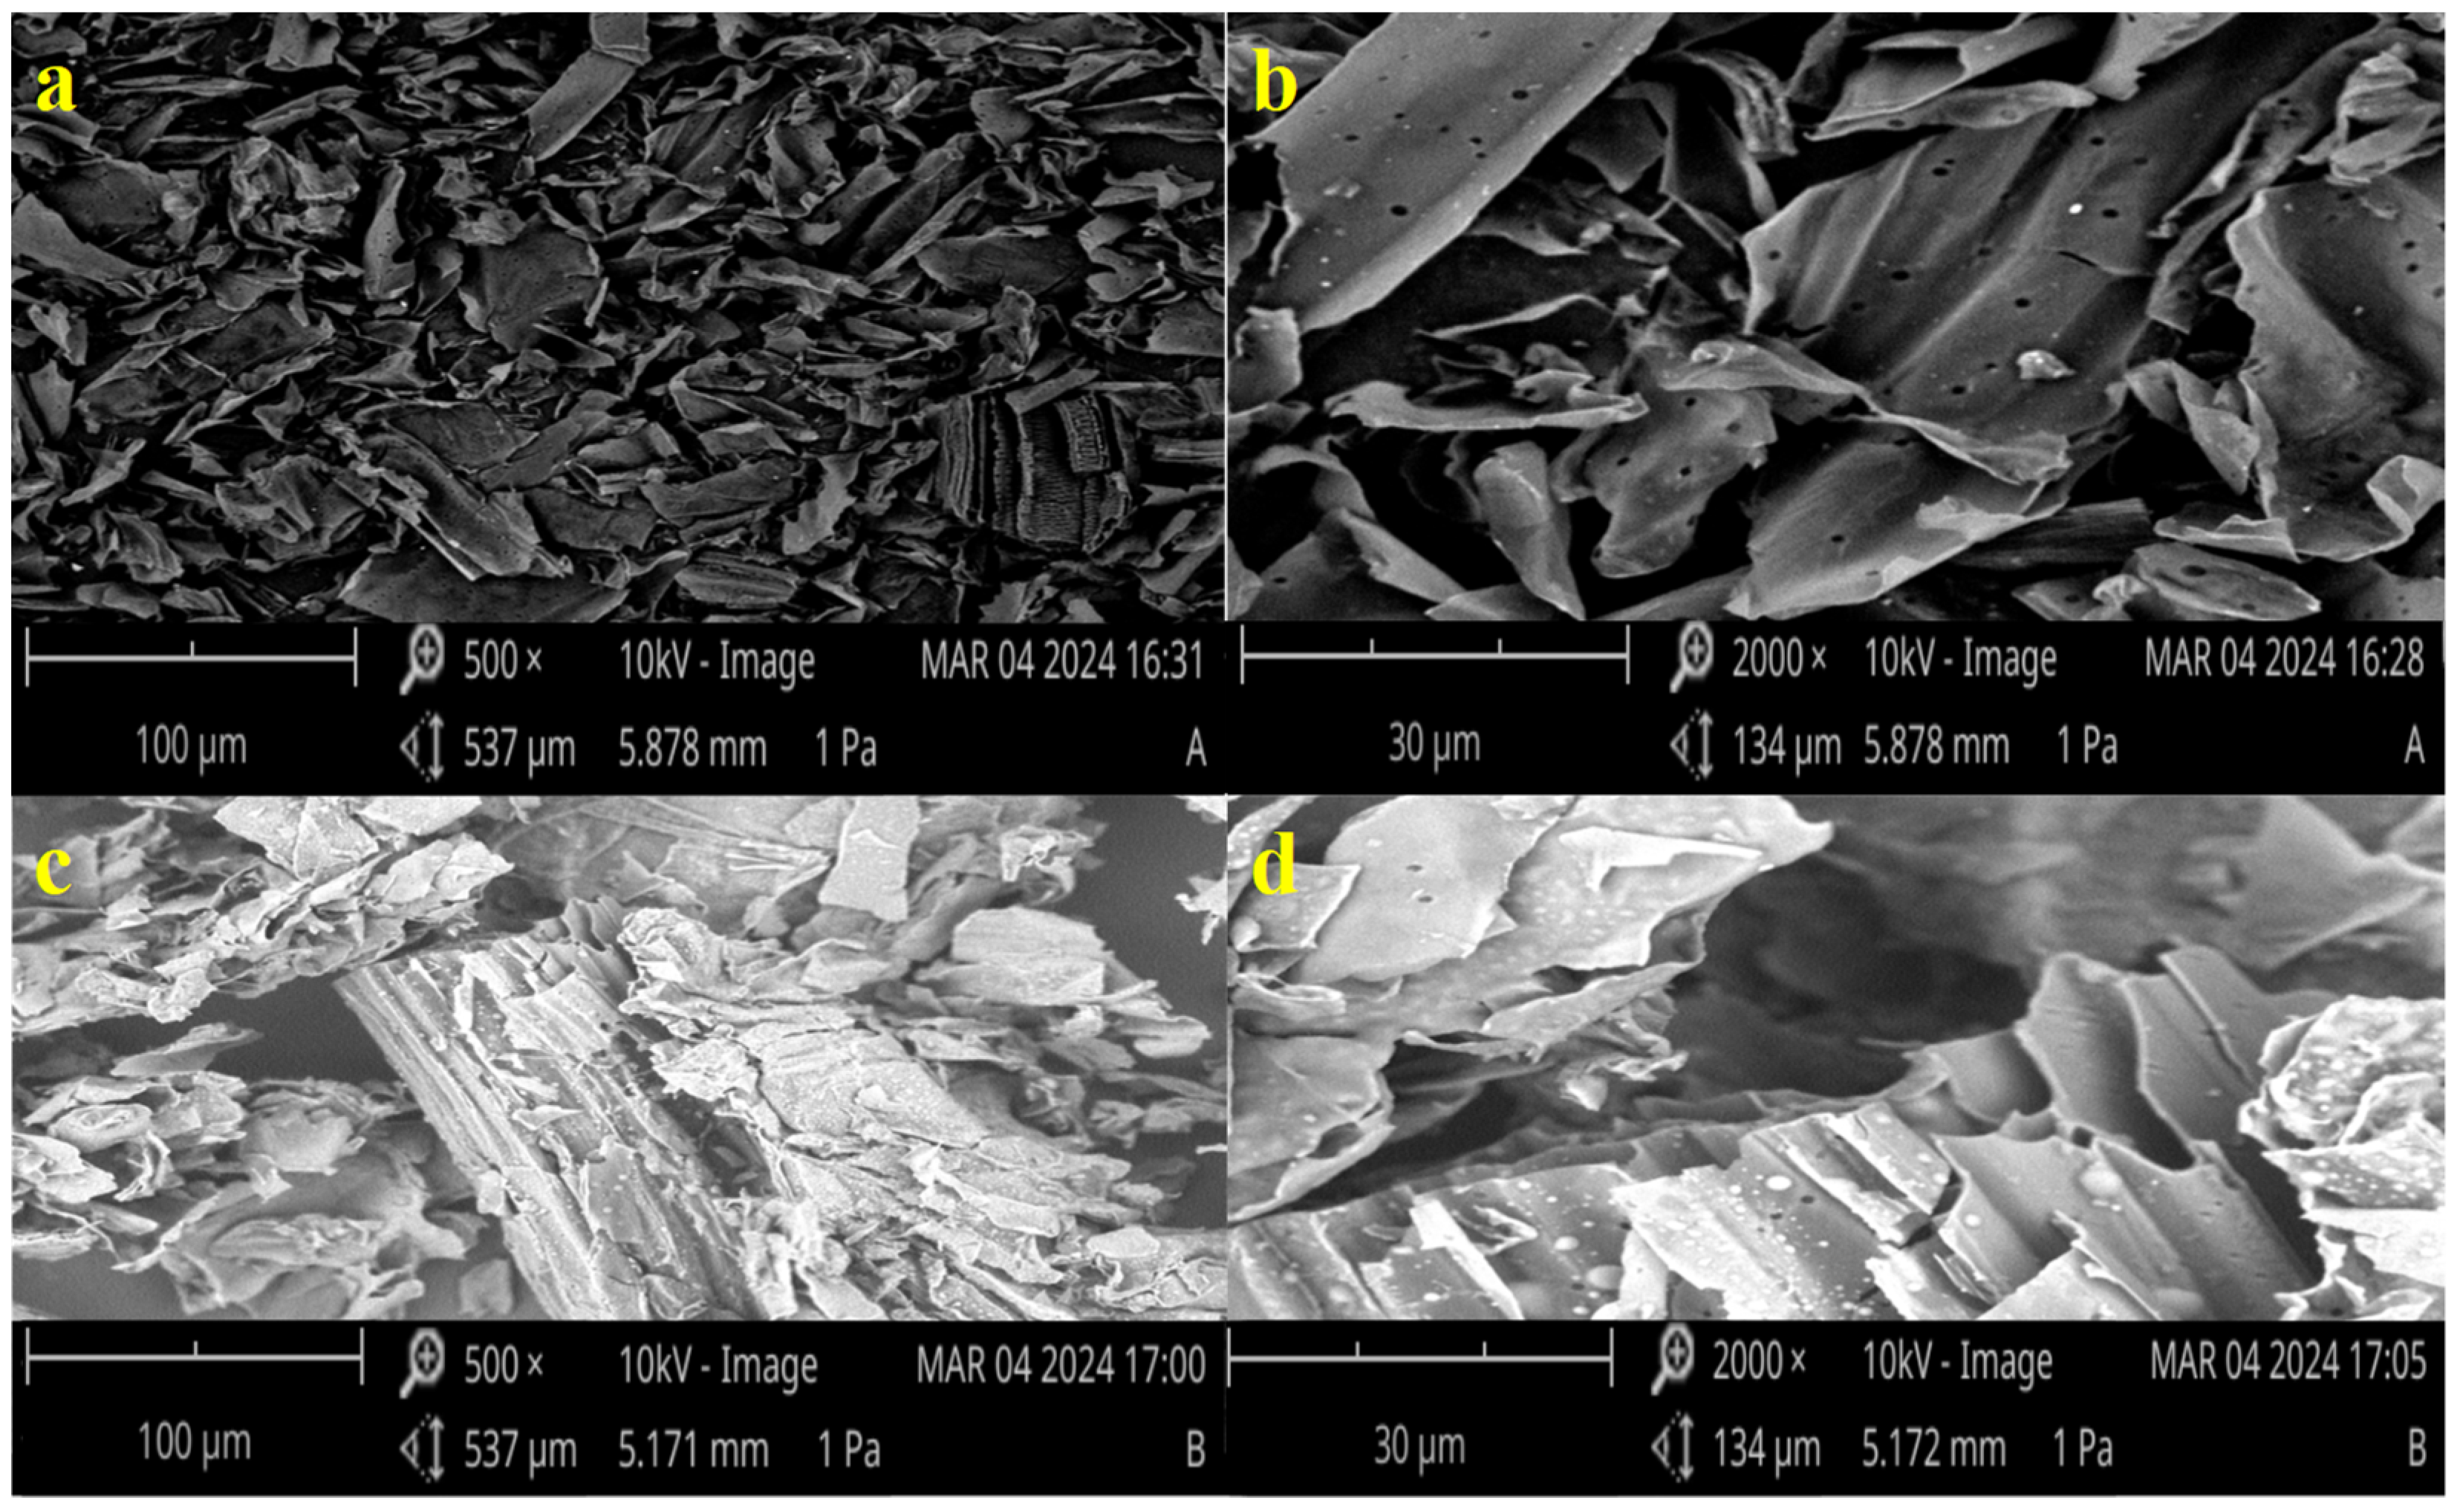
3.1.3. SEM Analysis
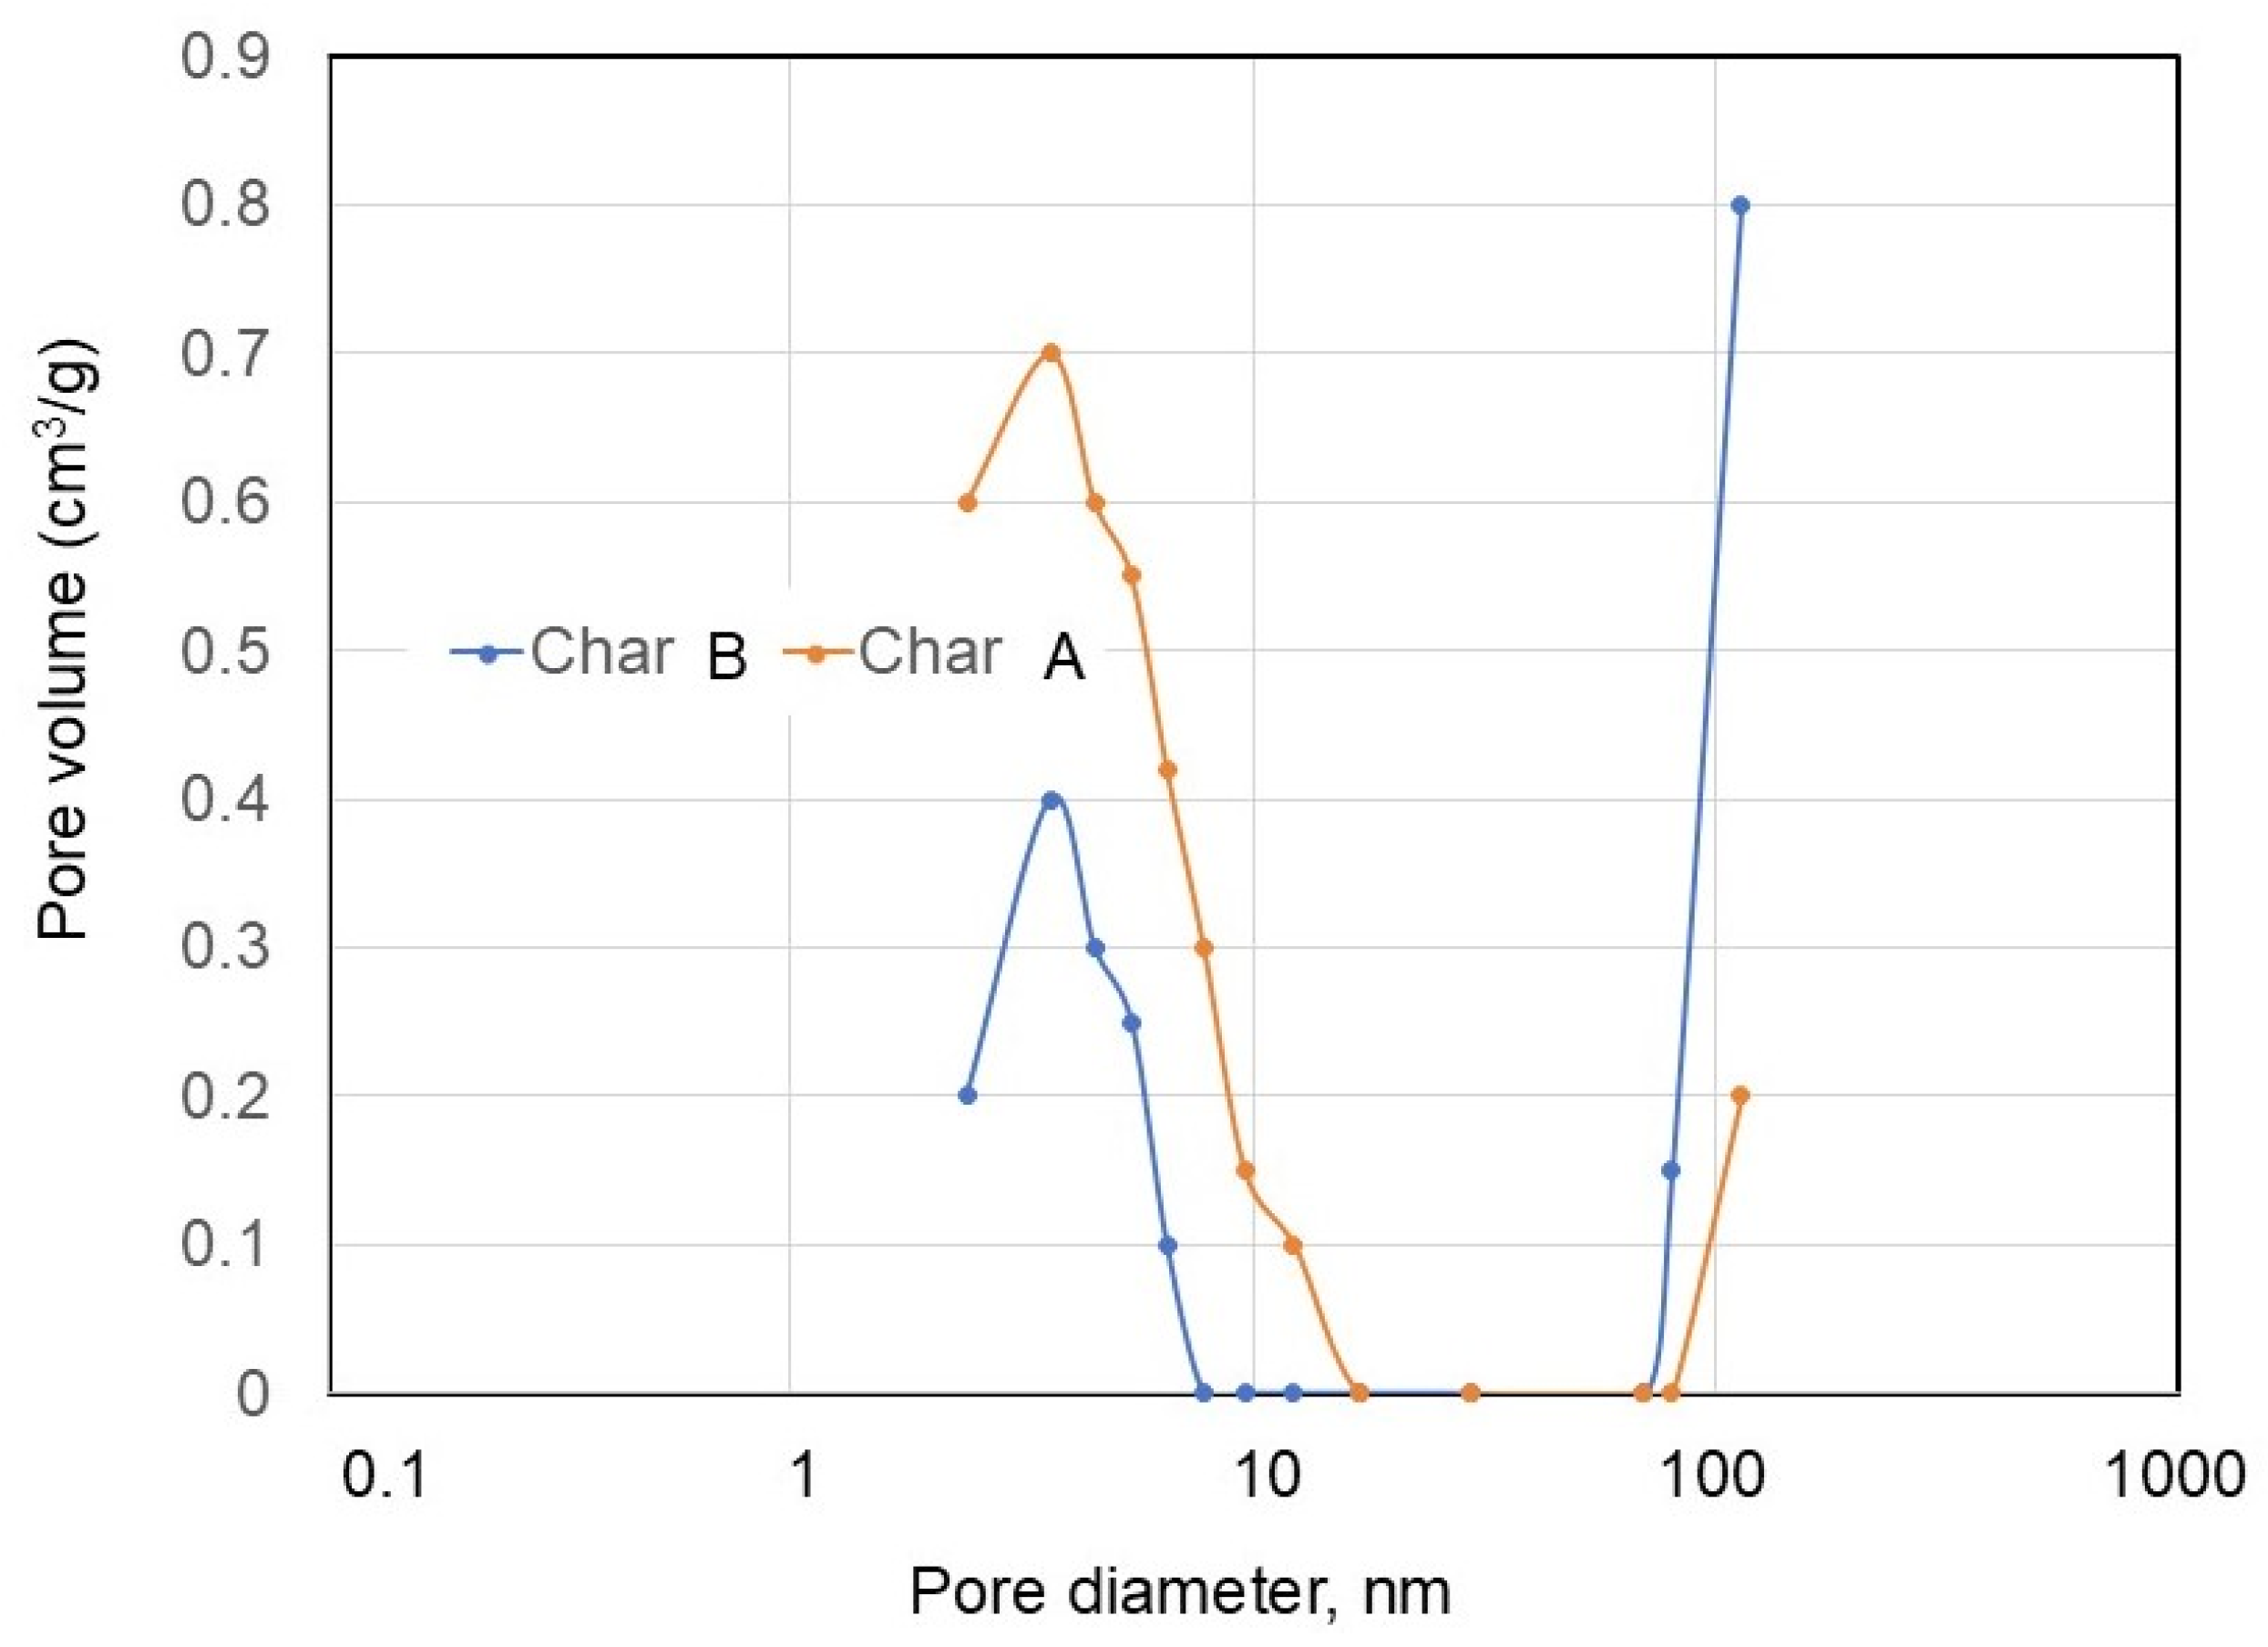
3.1.4. Specific Surface Area and Porosity
3.1.5. Nanoparticle Size and Stability
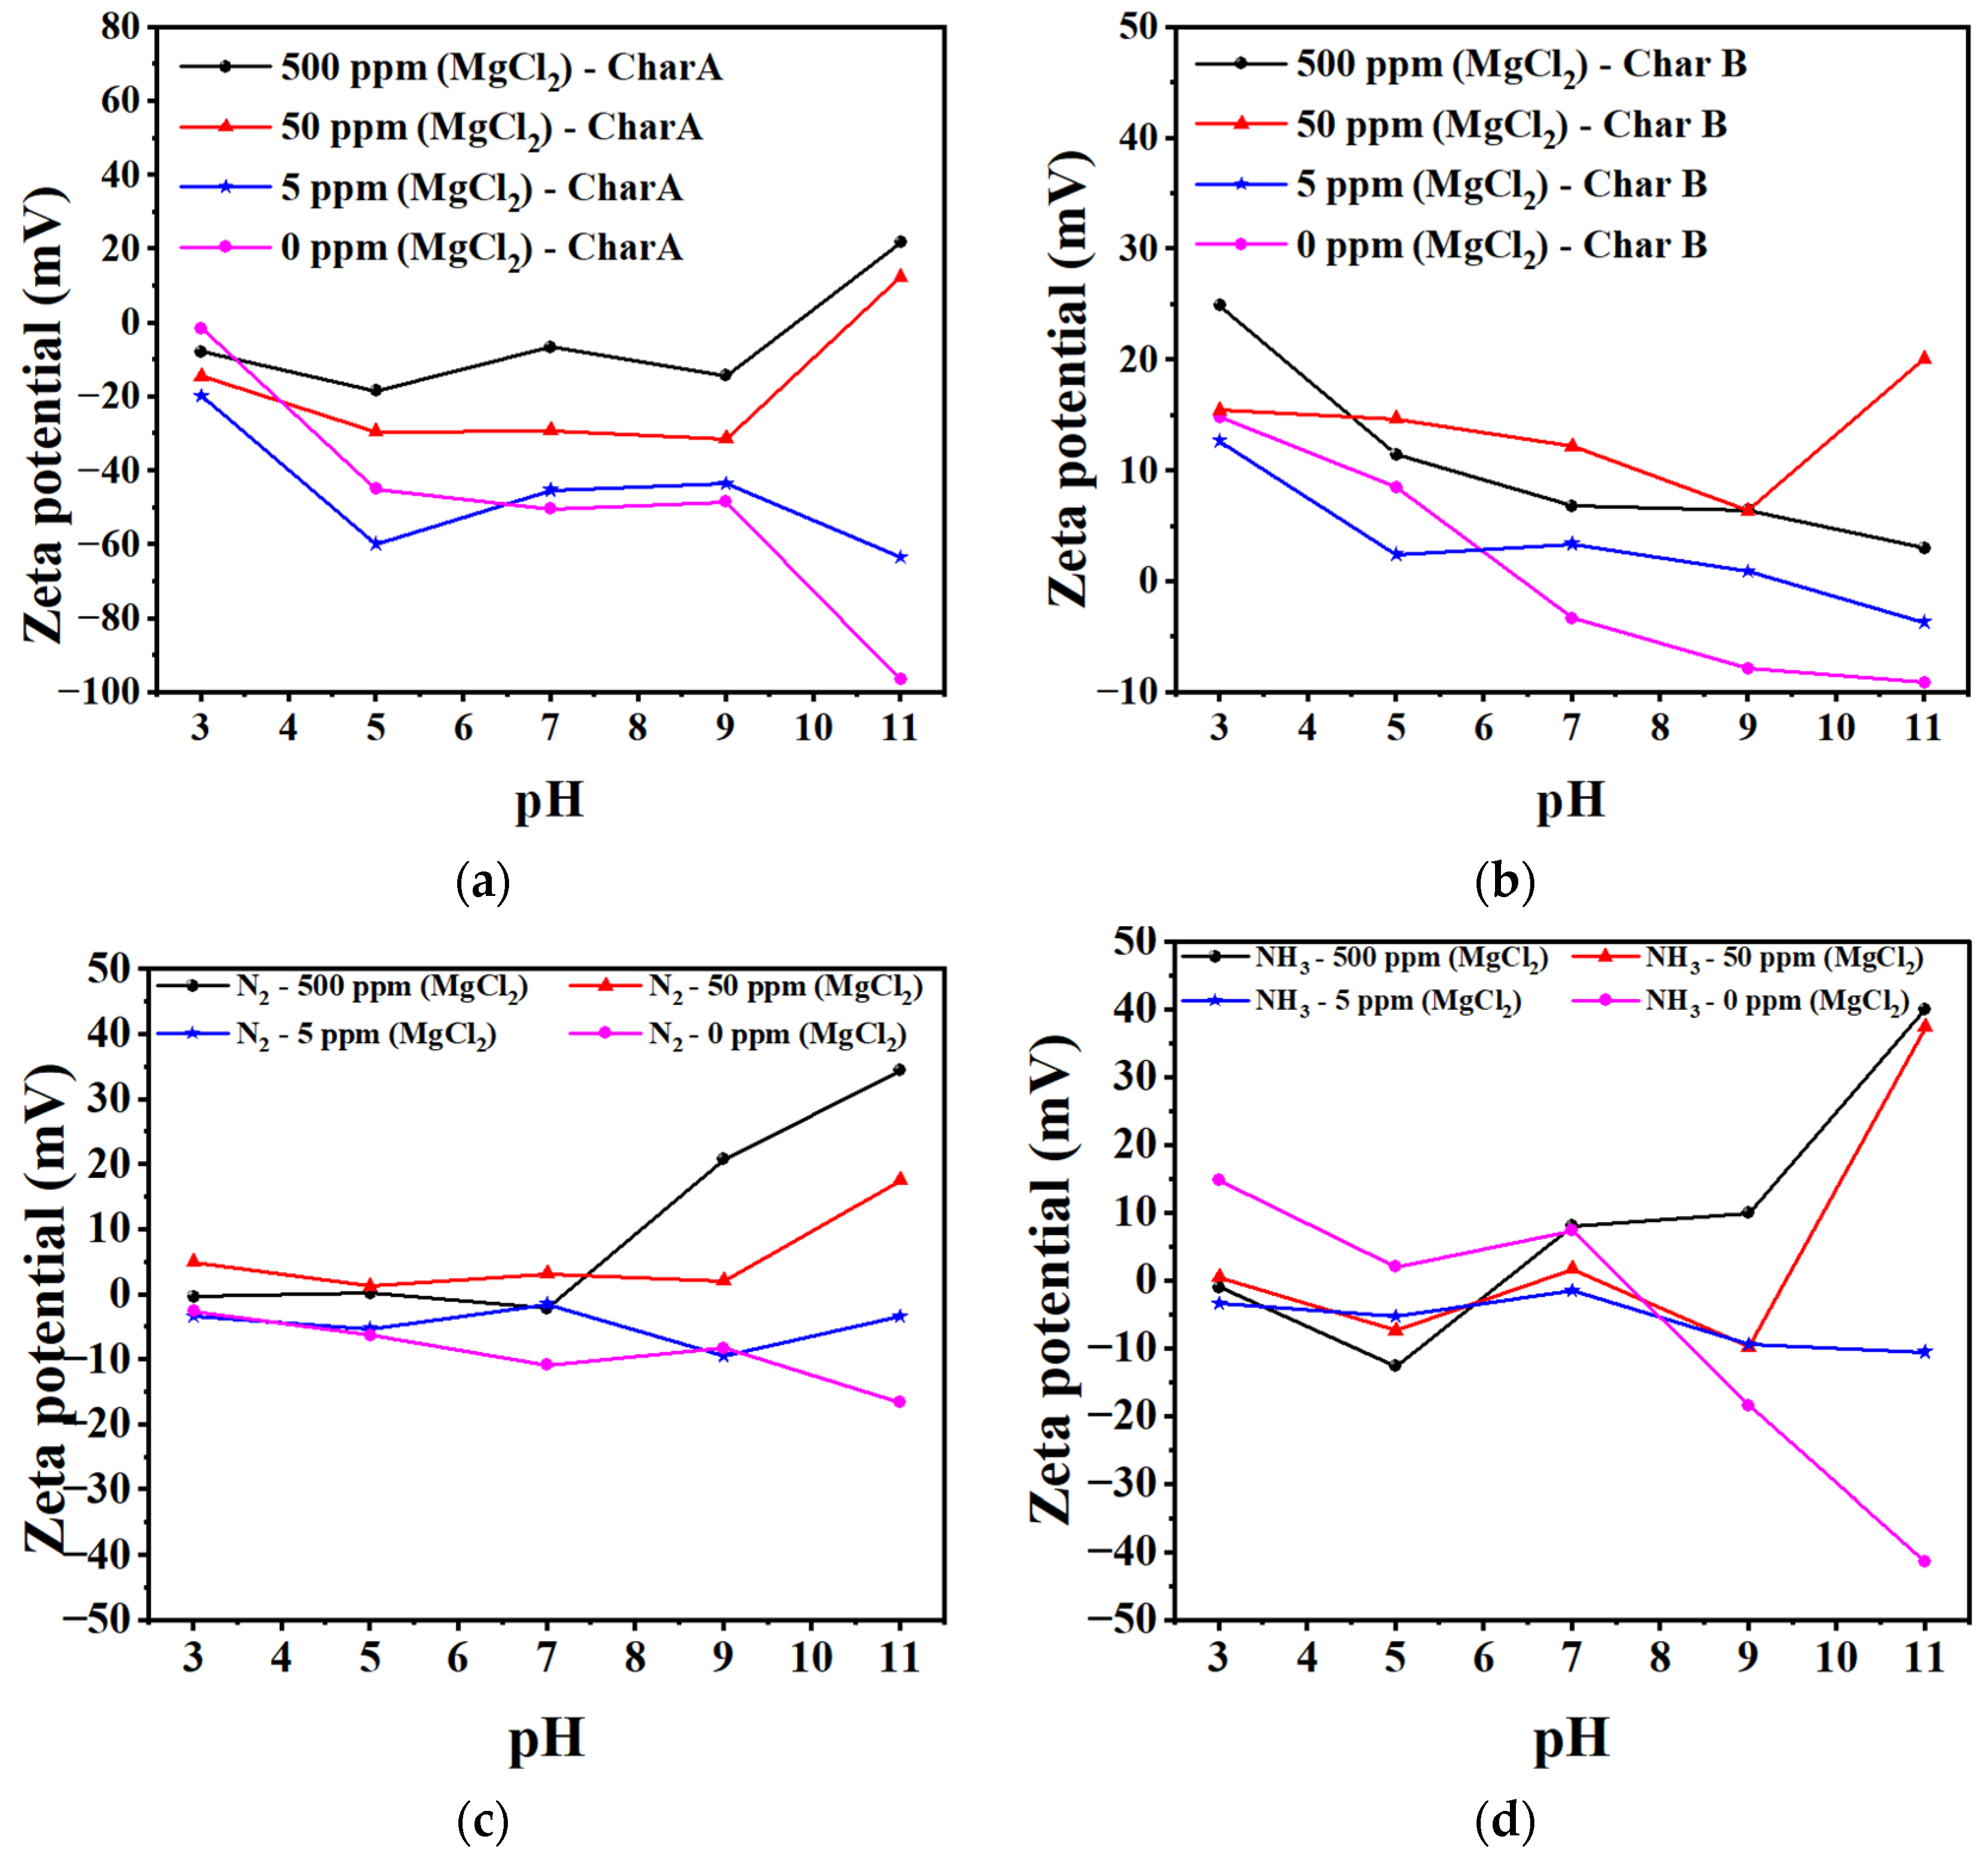
3.1.6. Zeta Potential of Char and Nanobubbles
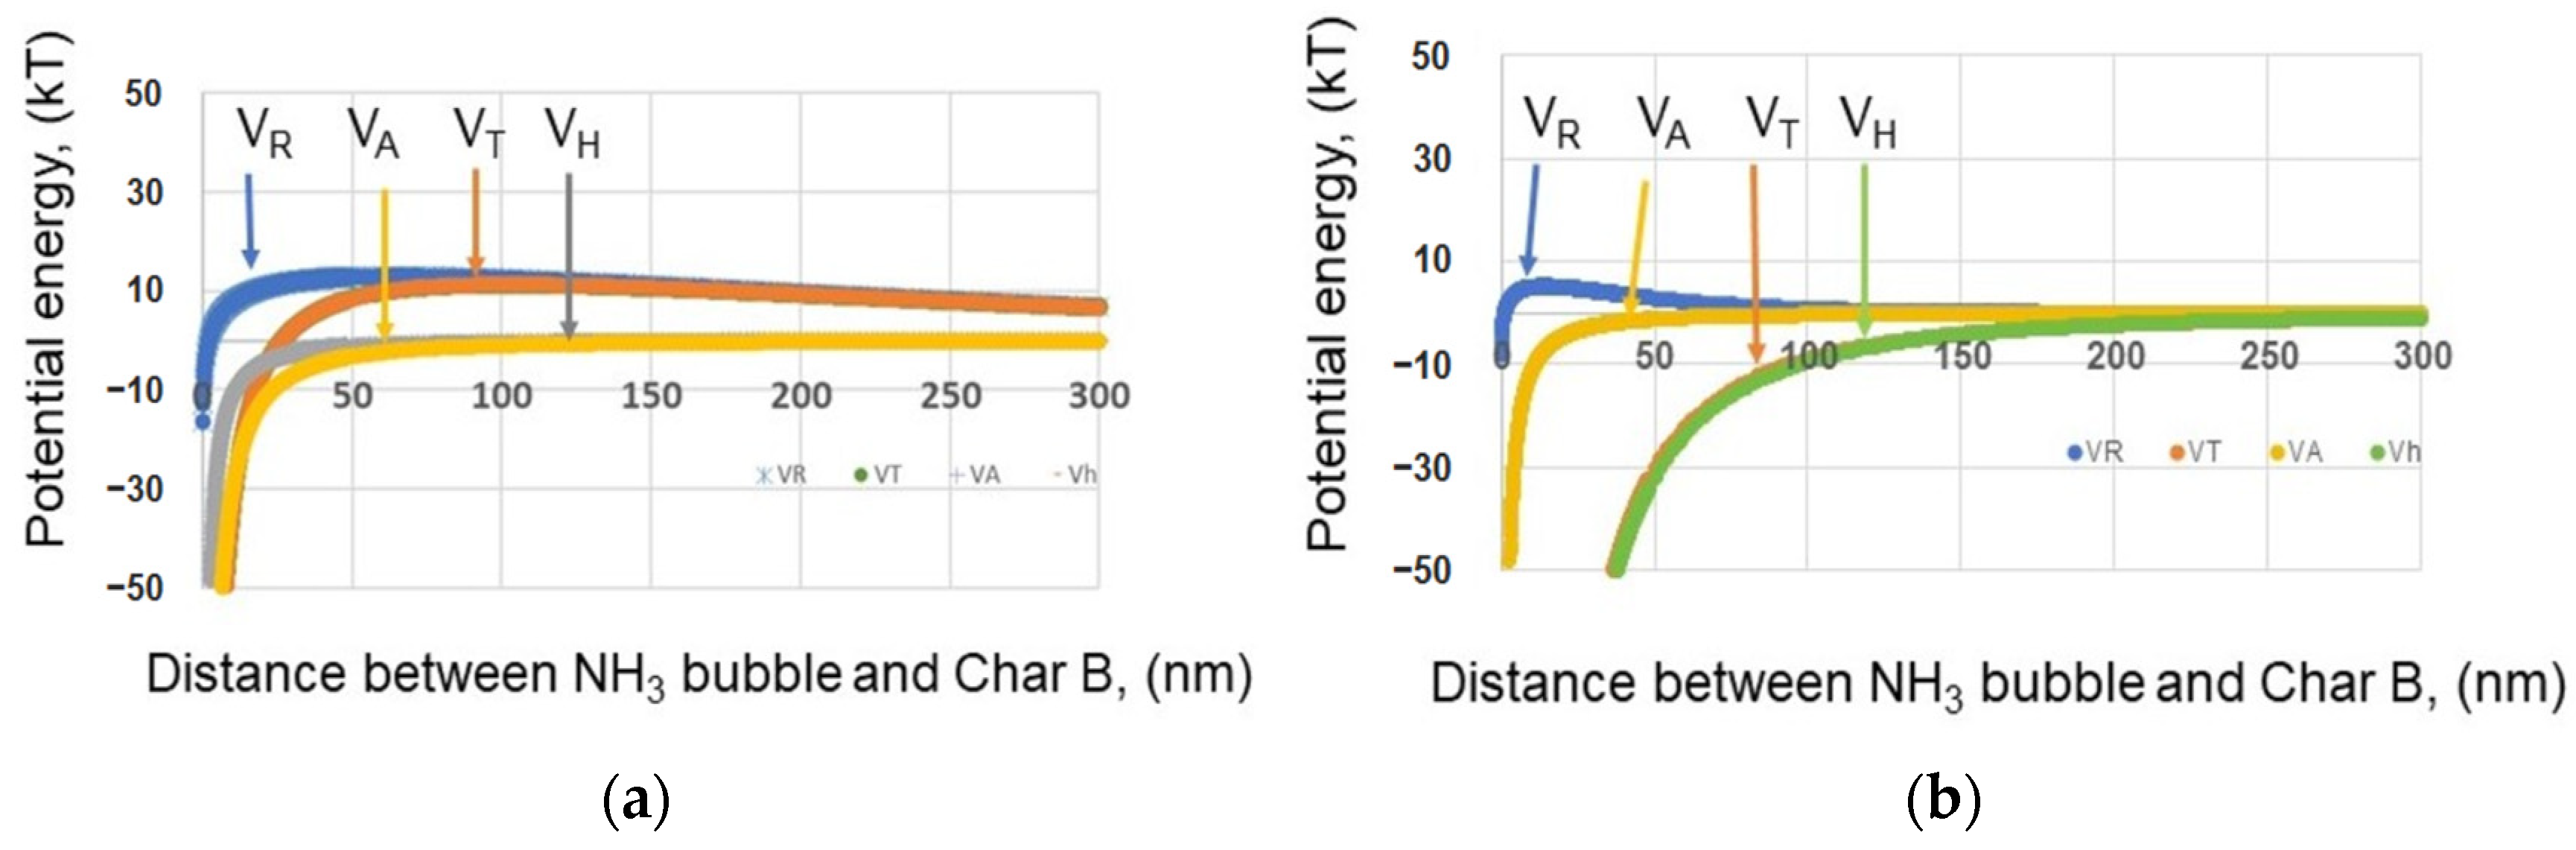
3.1.7. Interaction with Char and Nanobubbles
3.2. Boron Adsorption
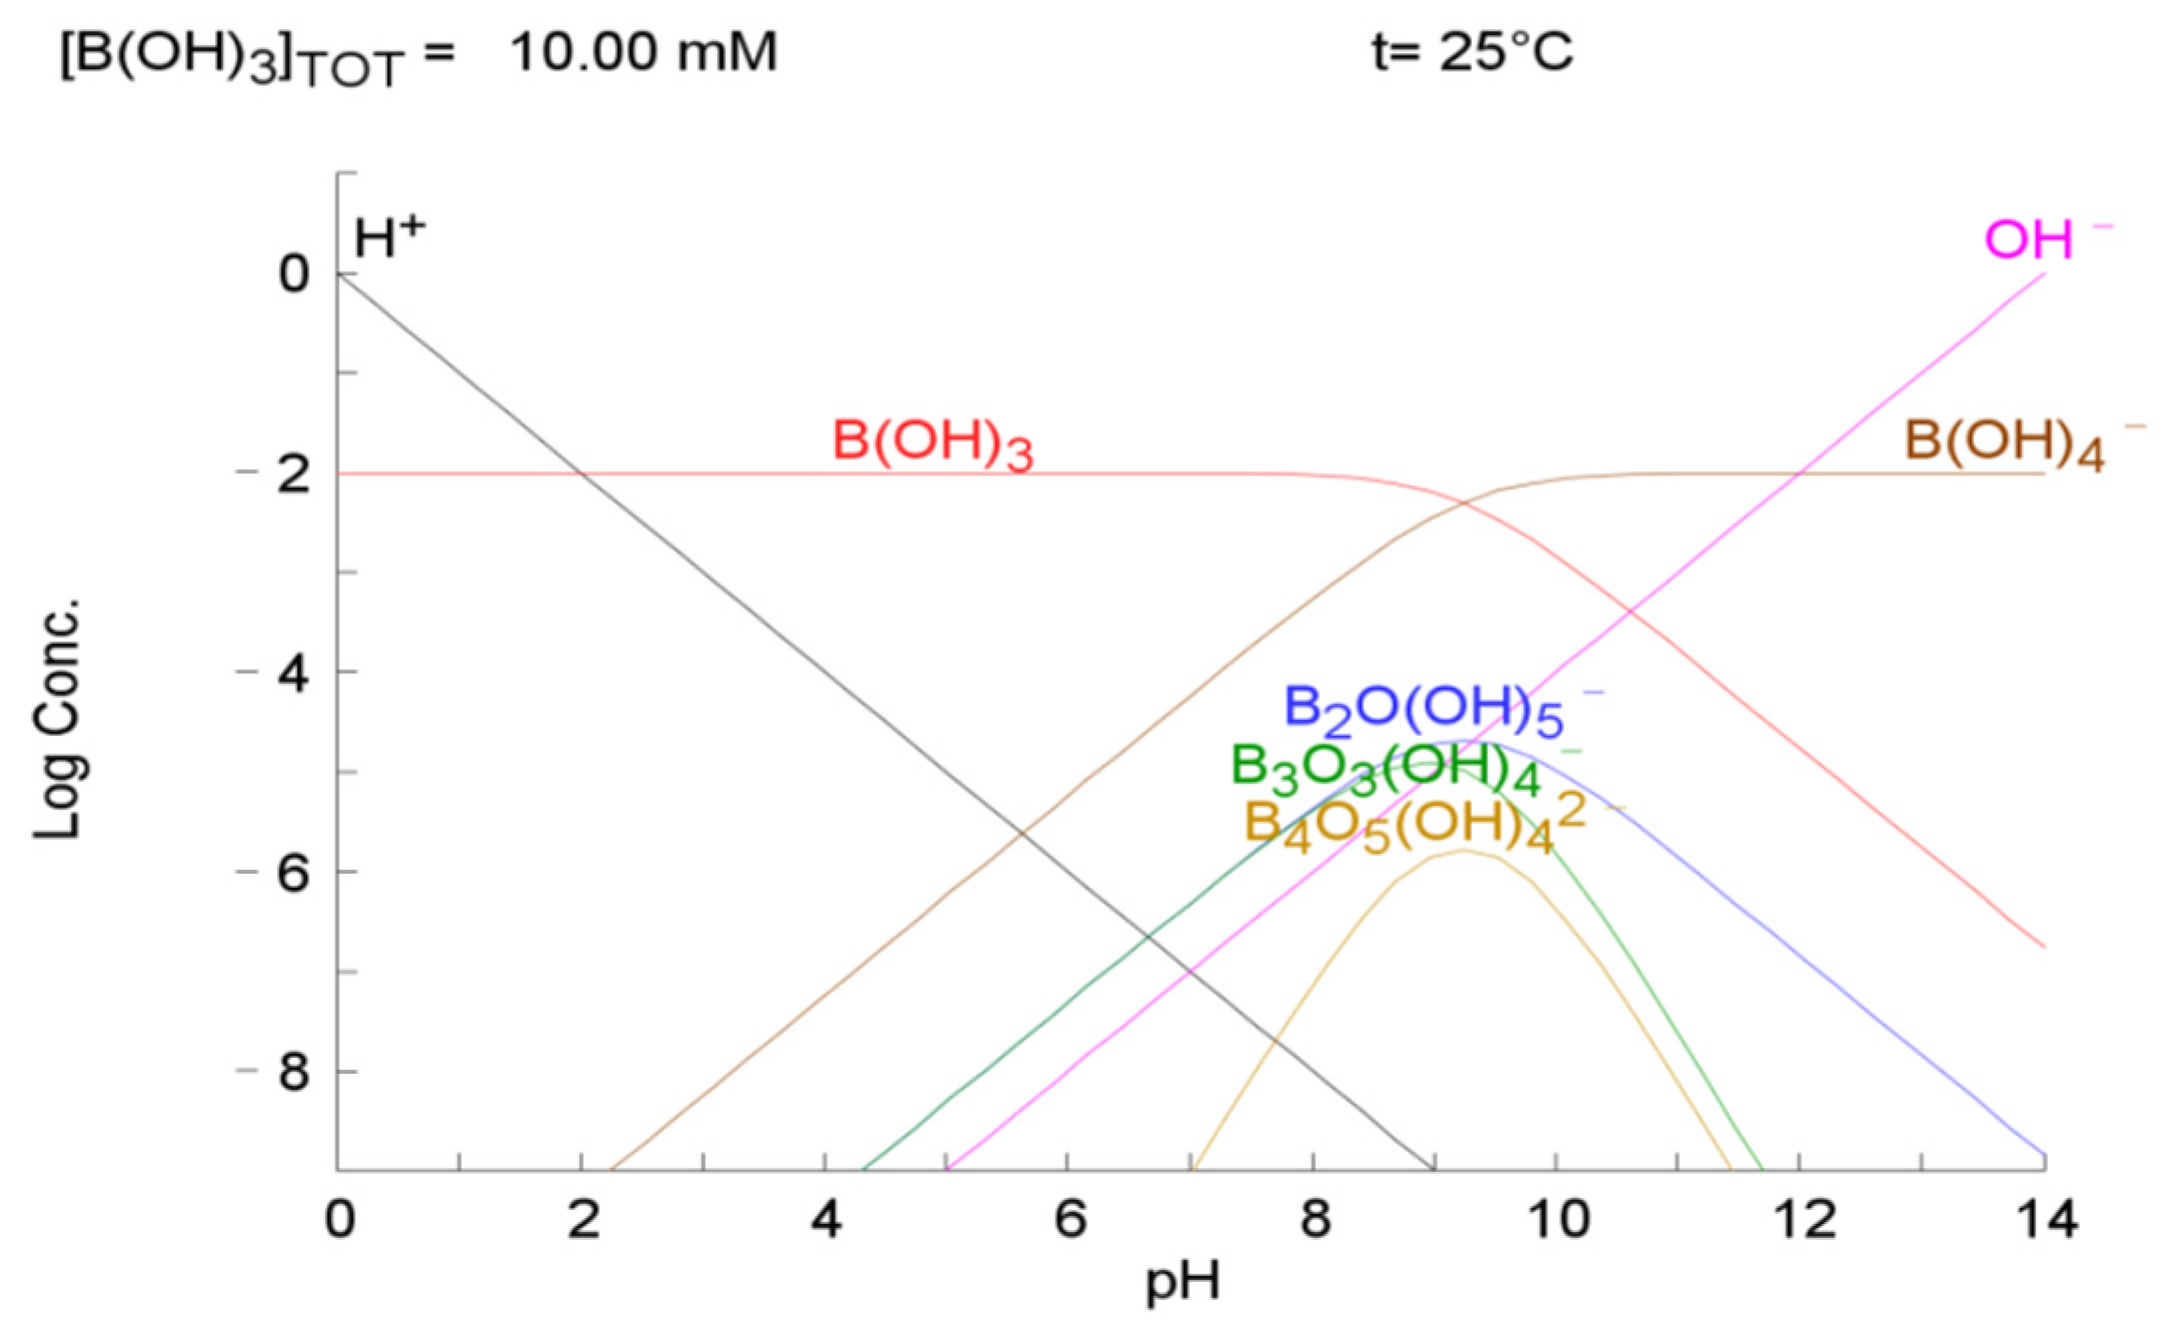
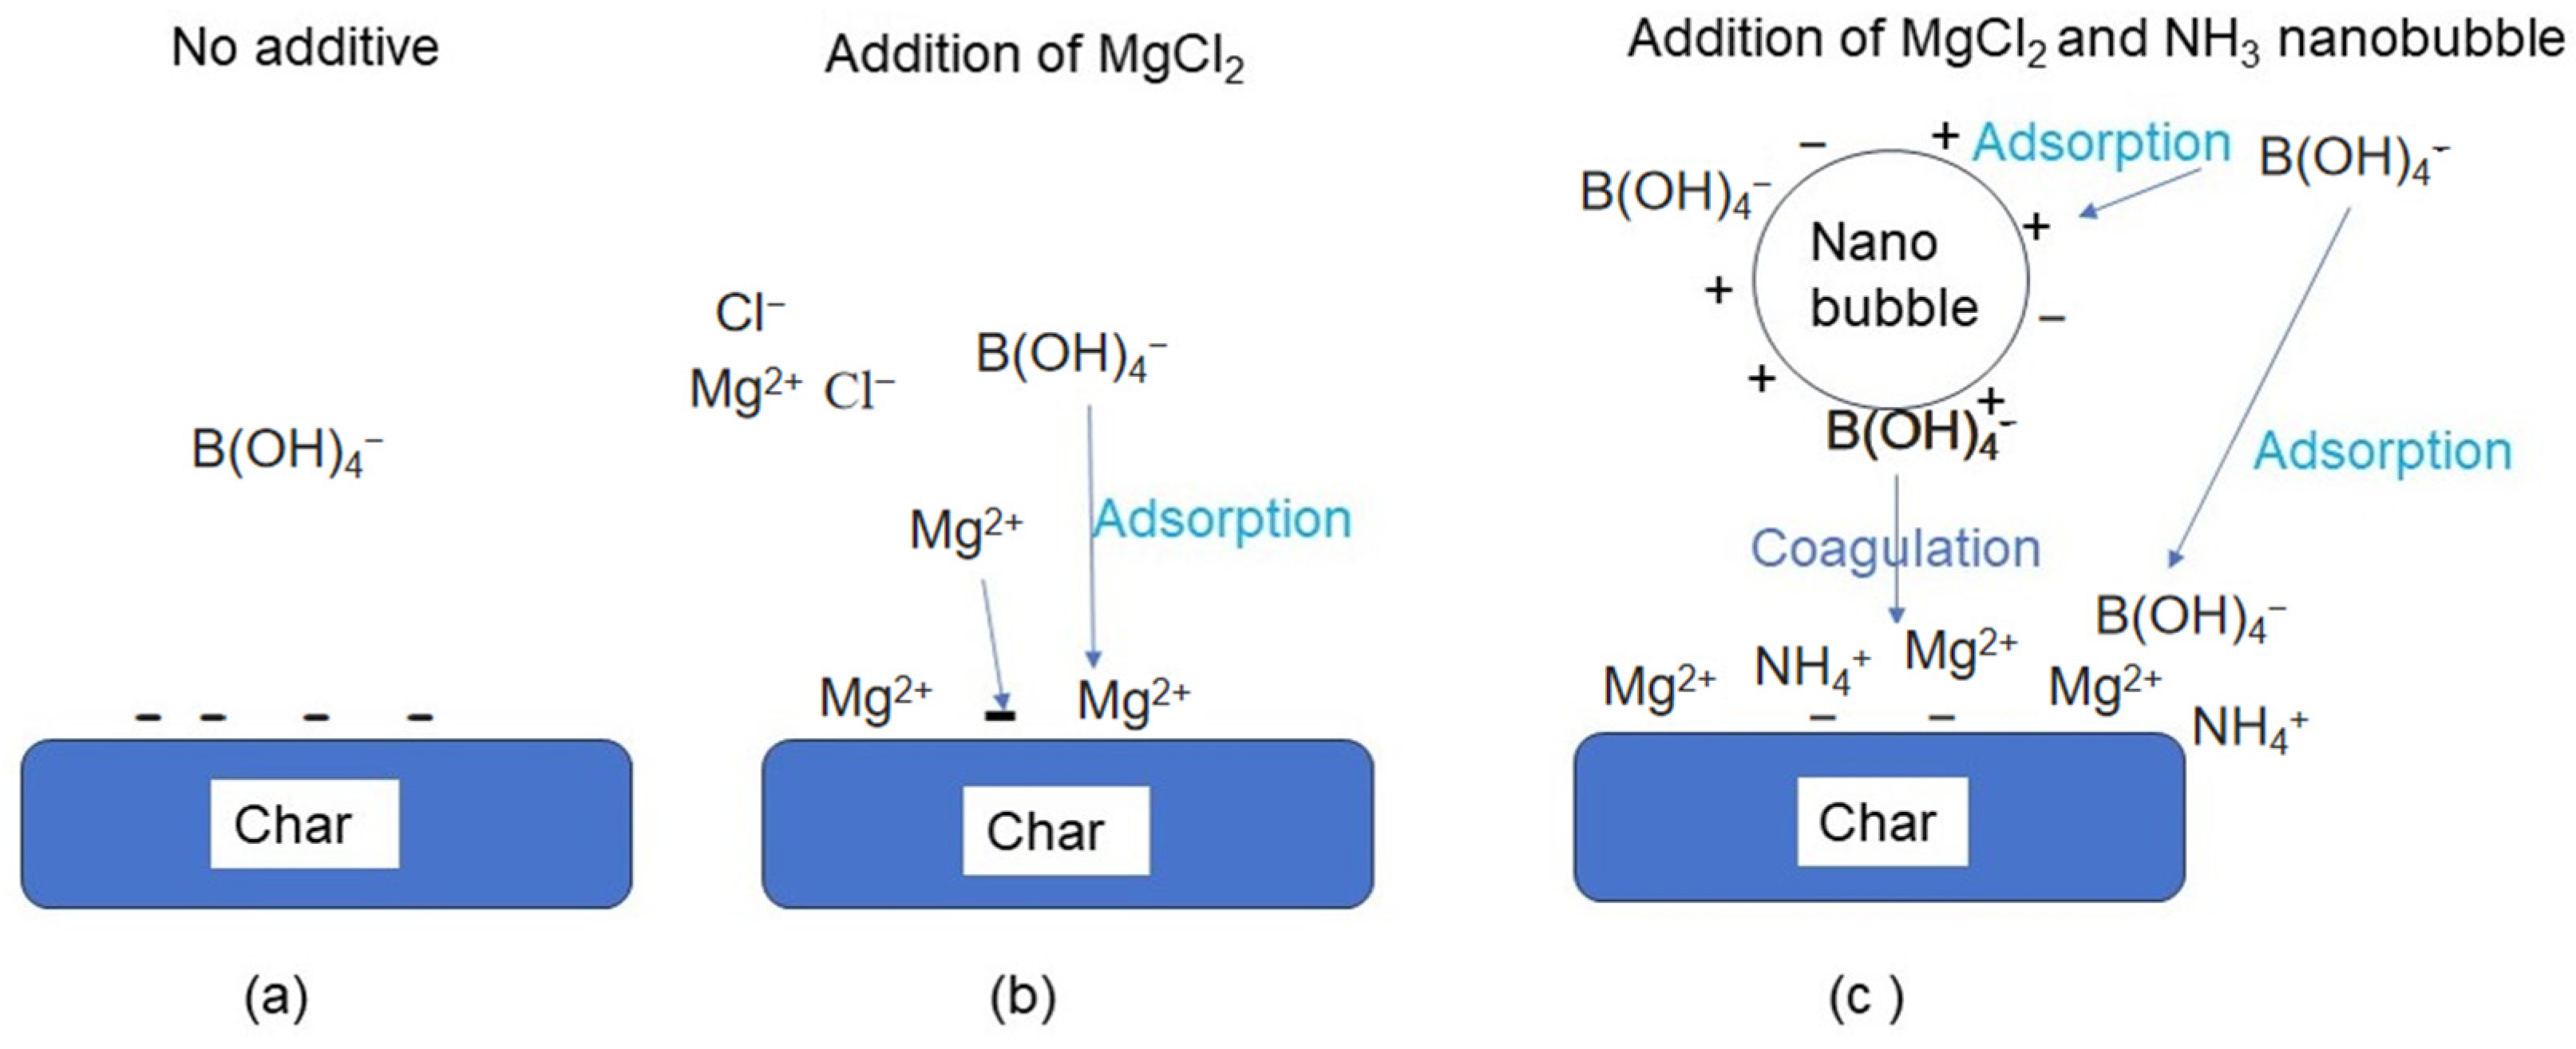
3.2.1. Concept of Boron Adsorption Using Adsorbent and Nanobubbles
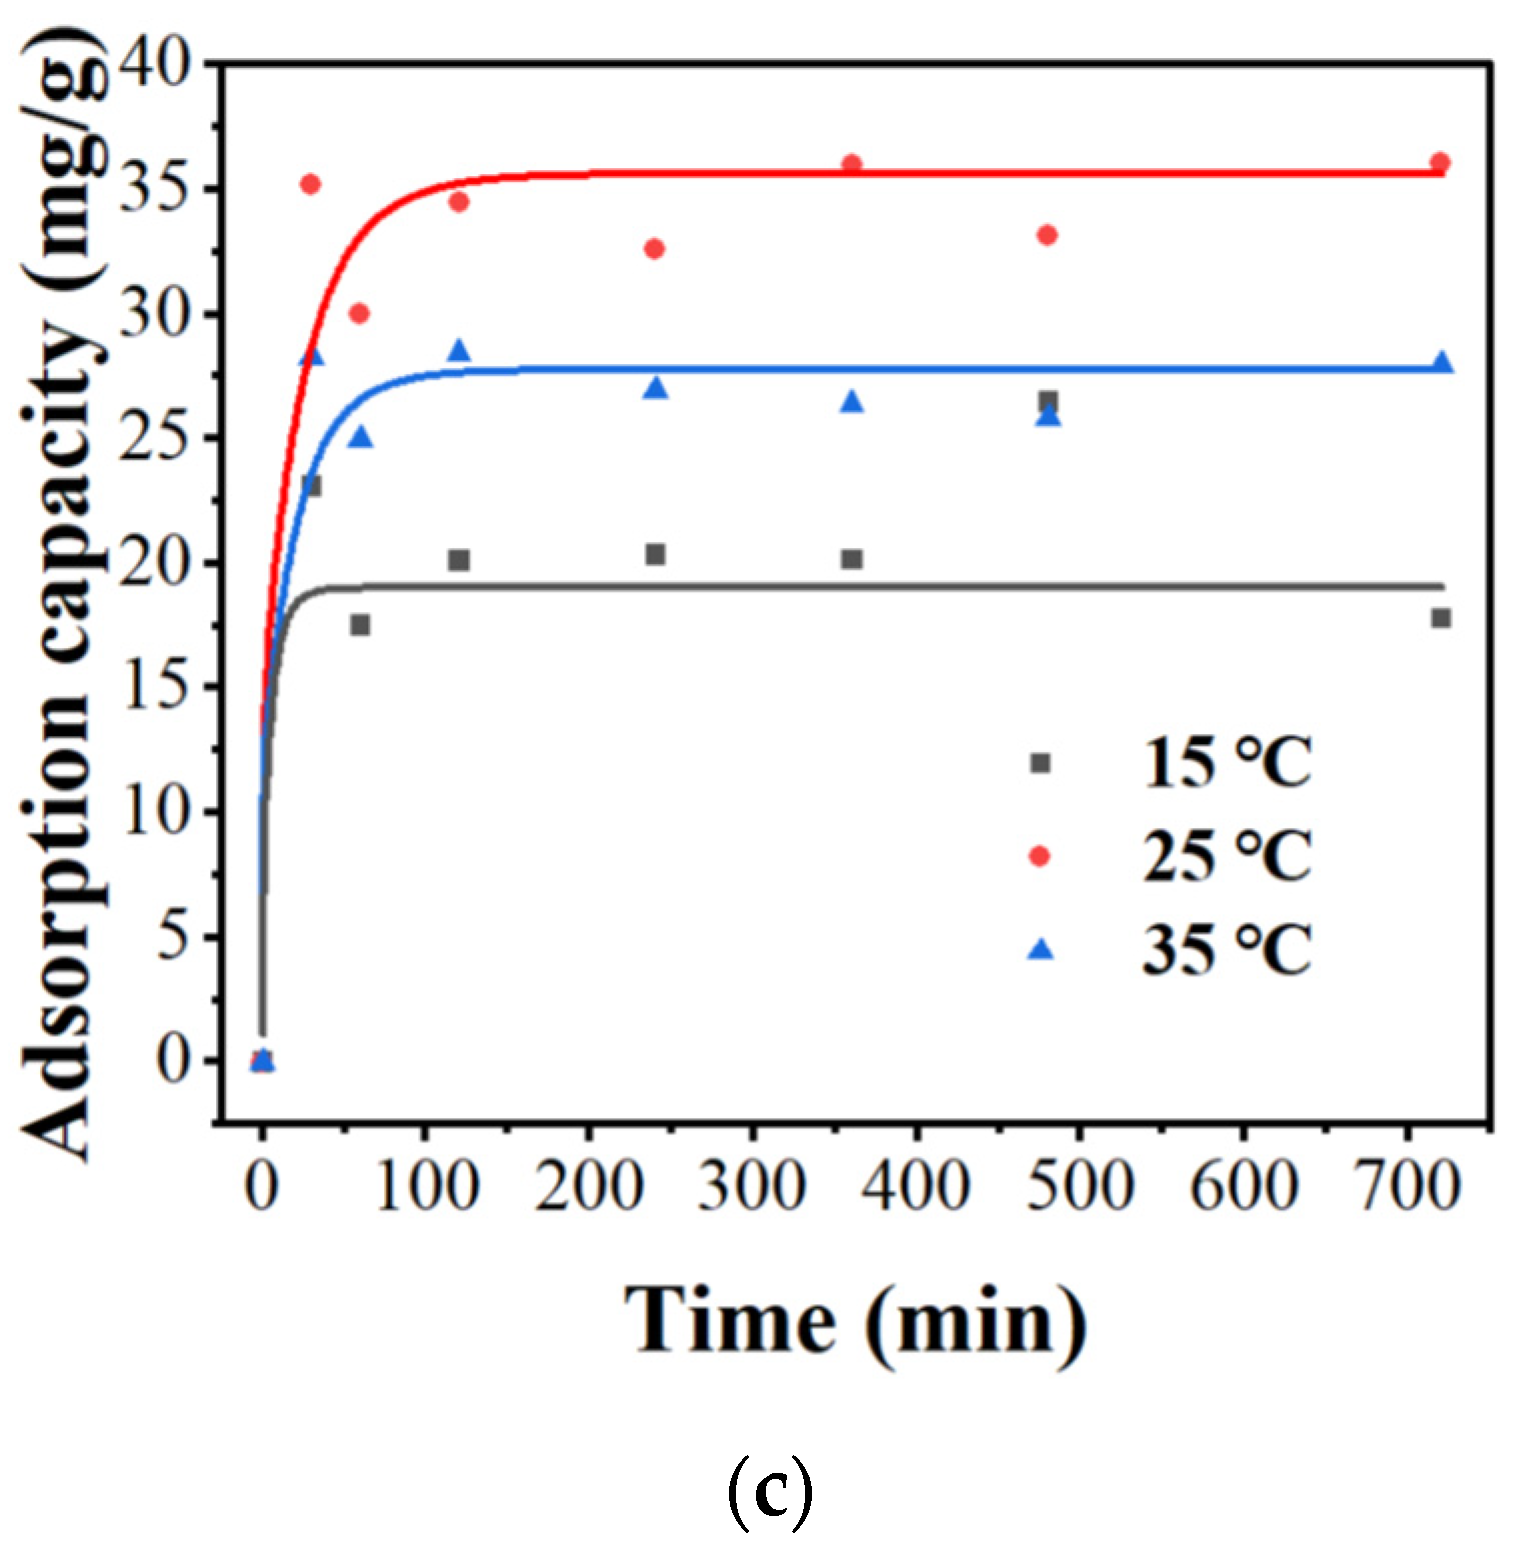
3.2.2. Effects of pH, Different Adsorption Amounts, Contact Time, and Temperature
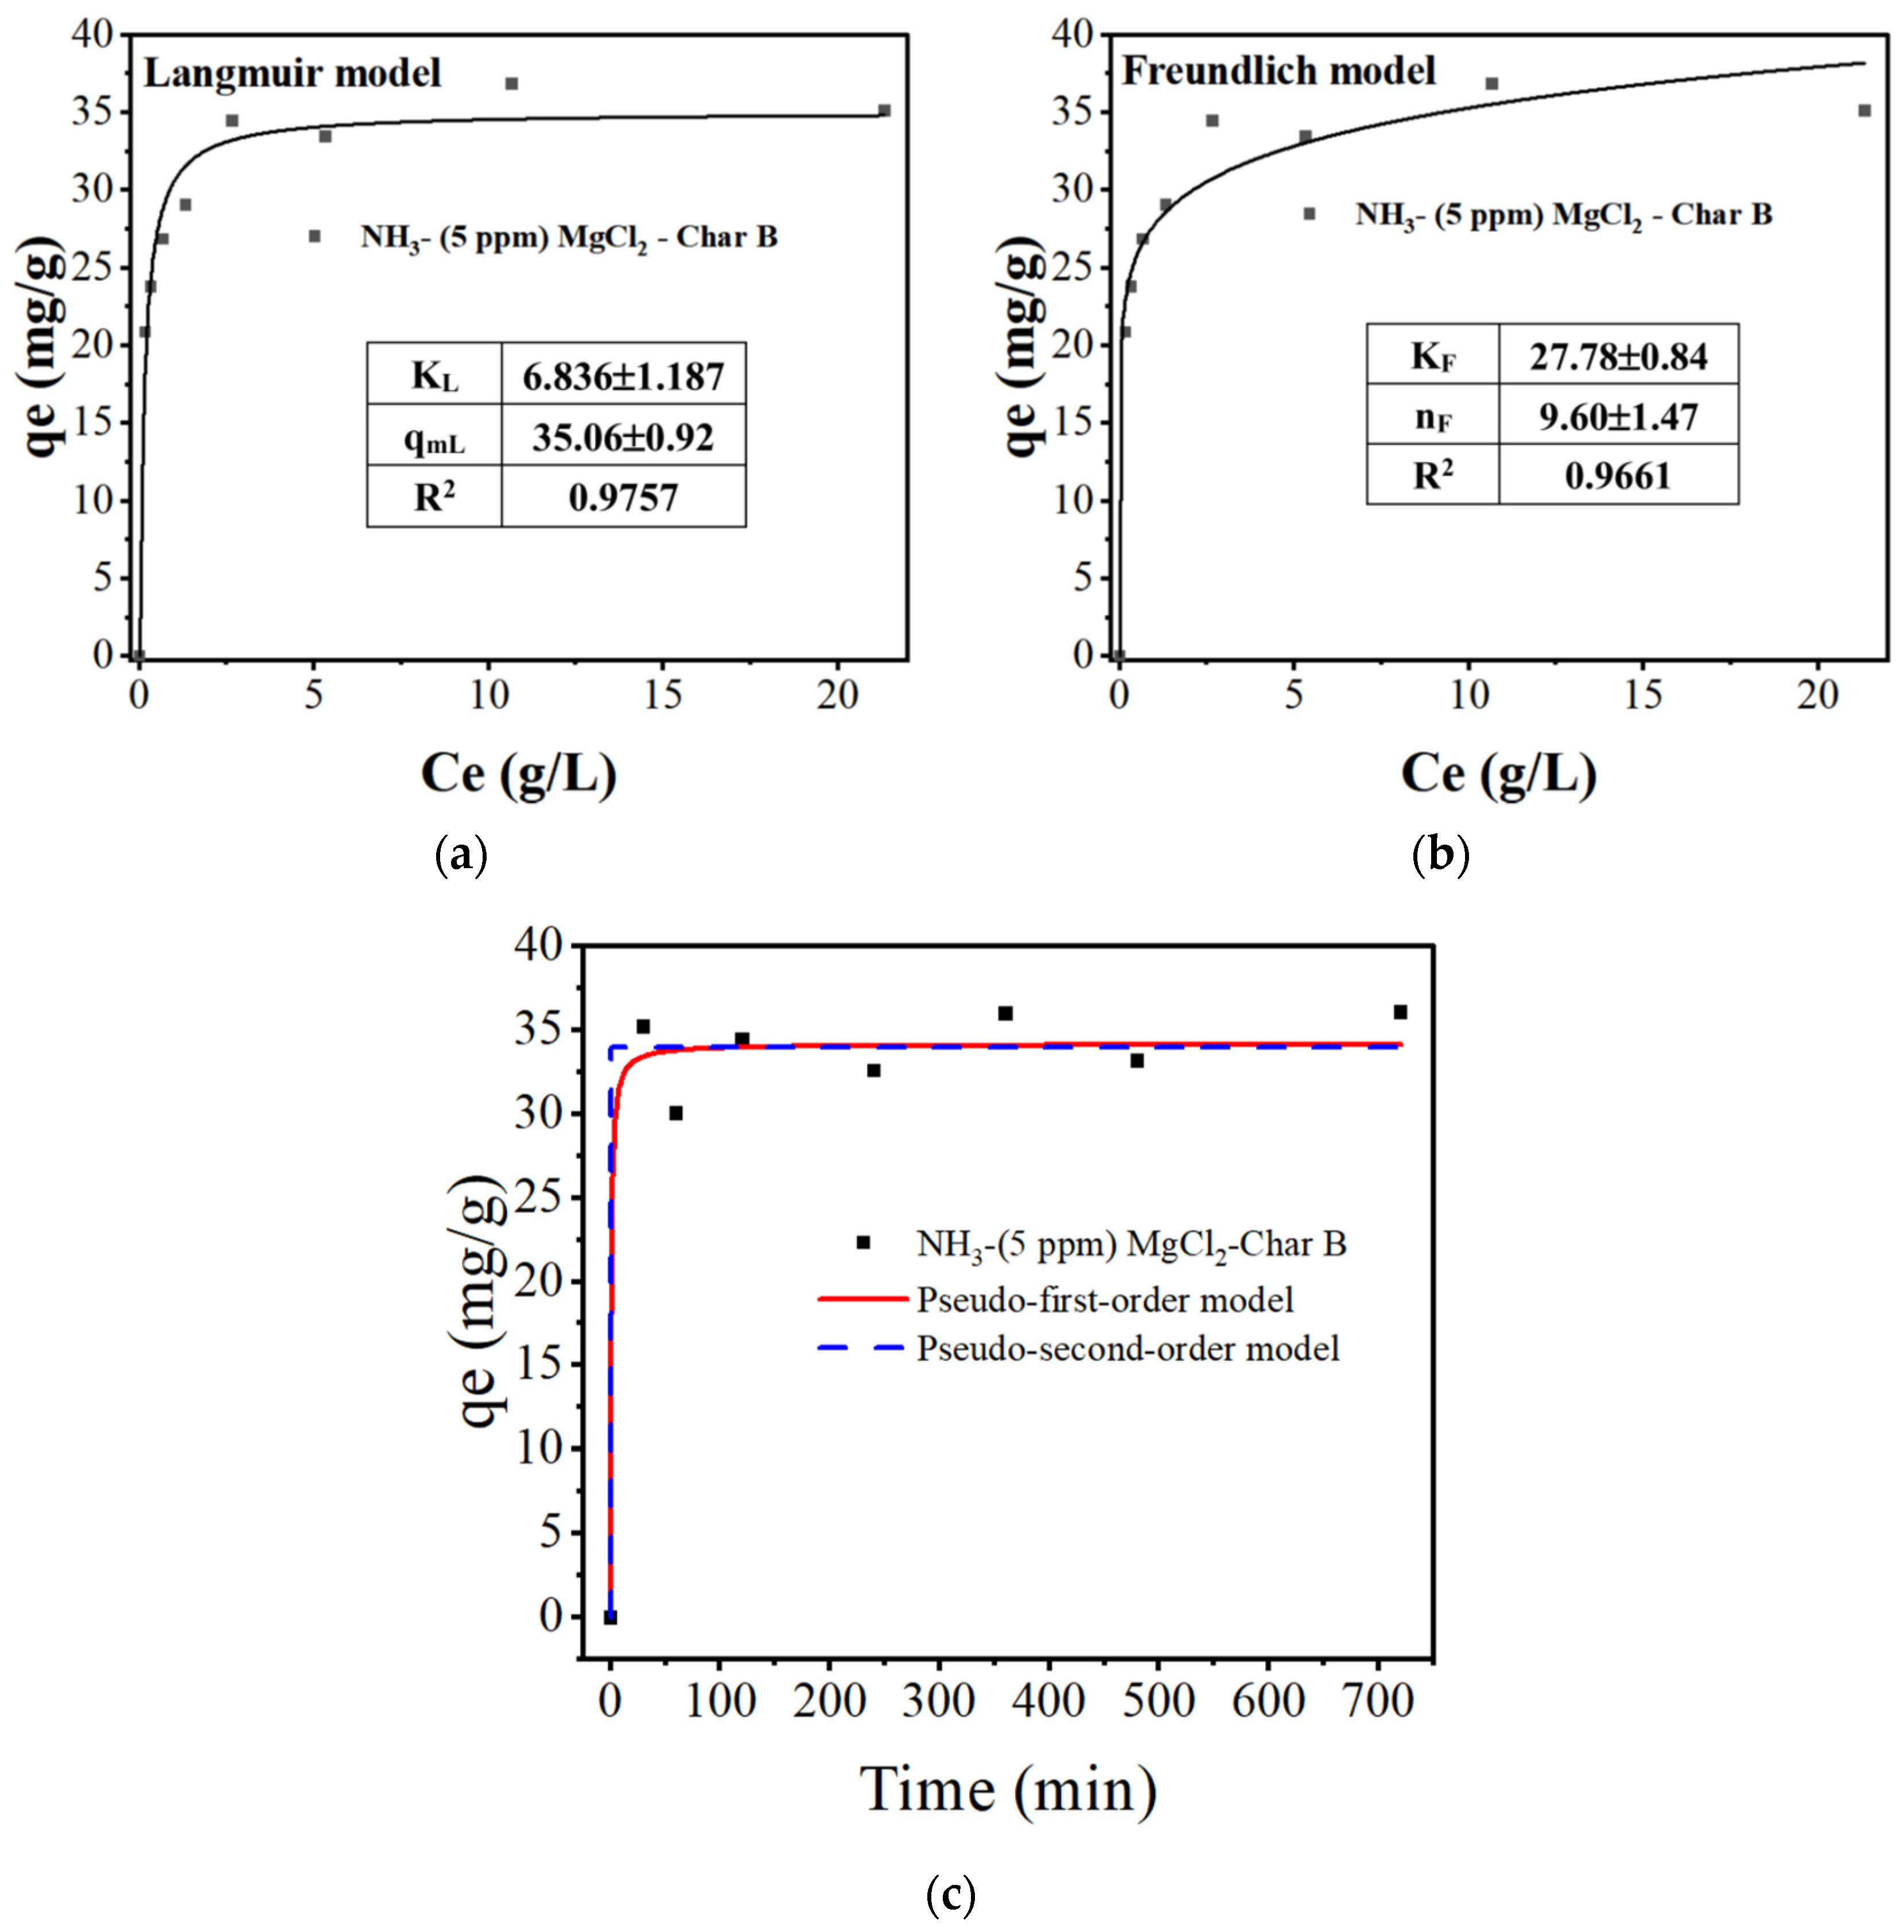
3.2.3. Adsorption Isotherm and Adsorption Kinetics Study
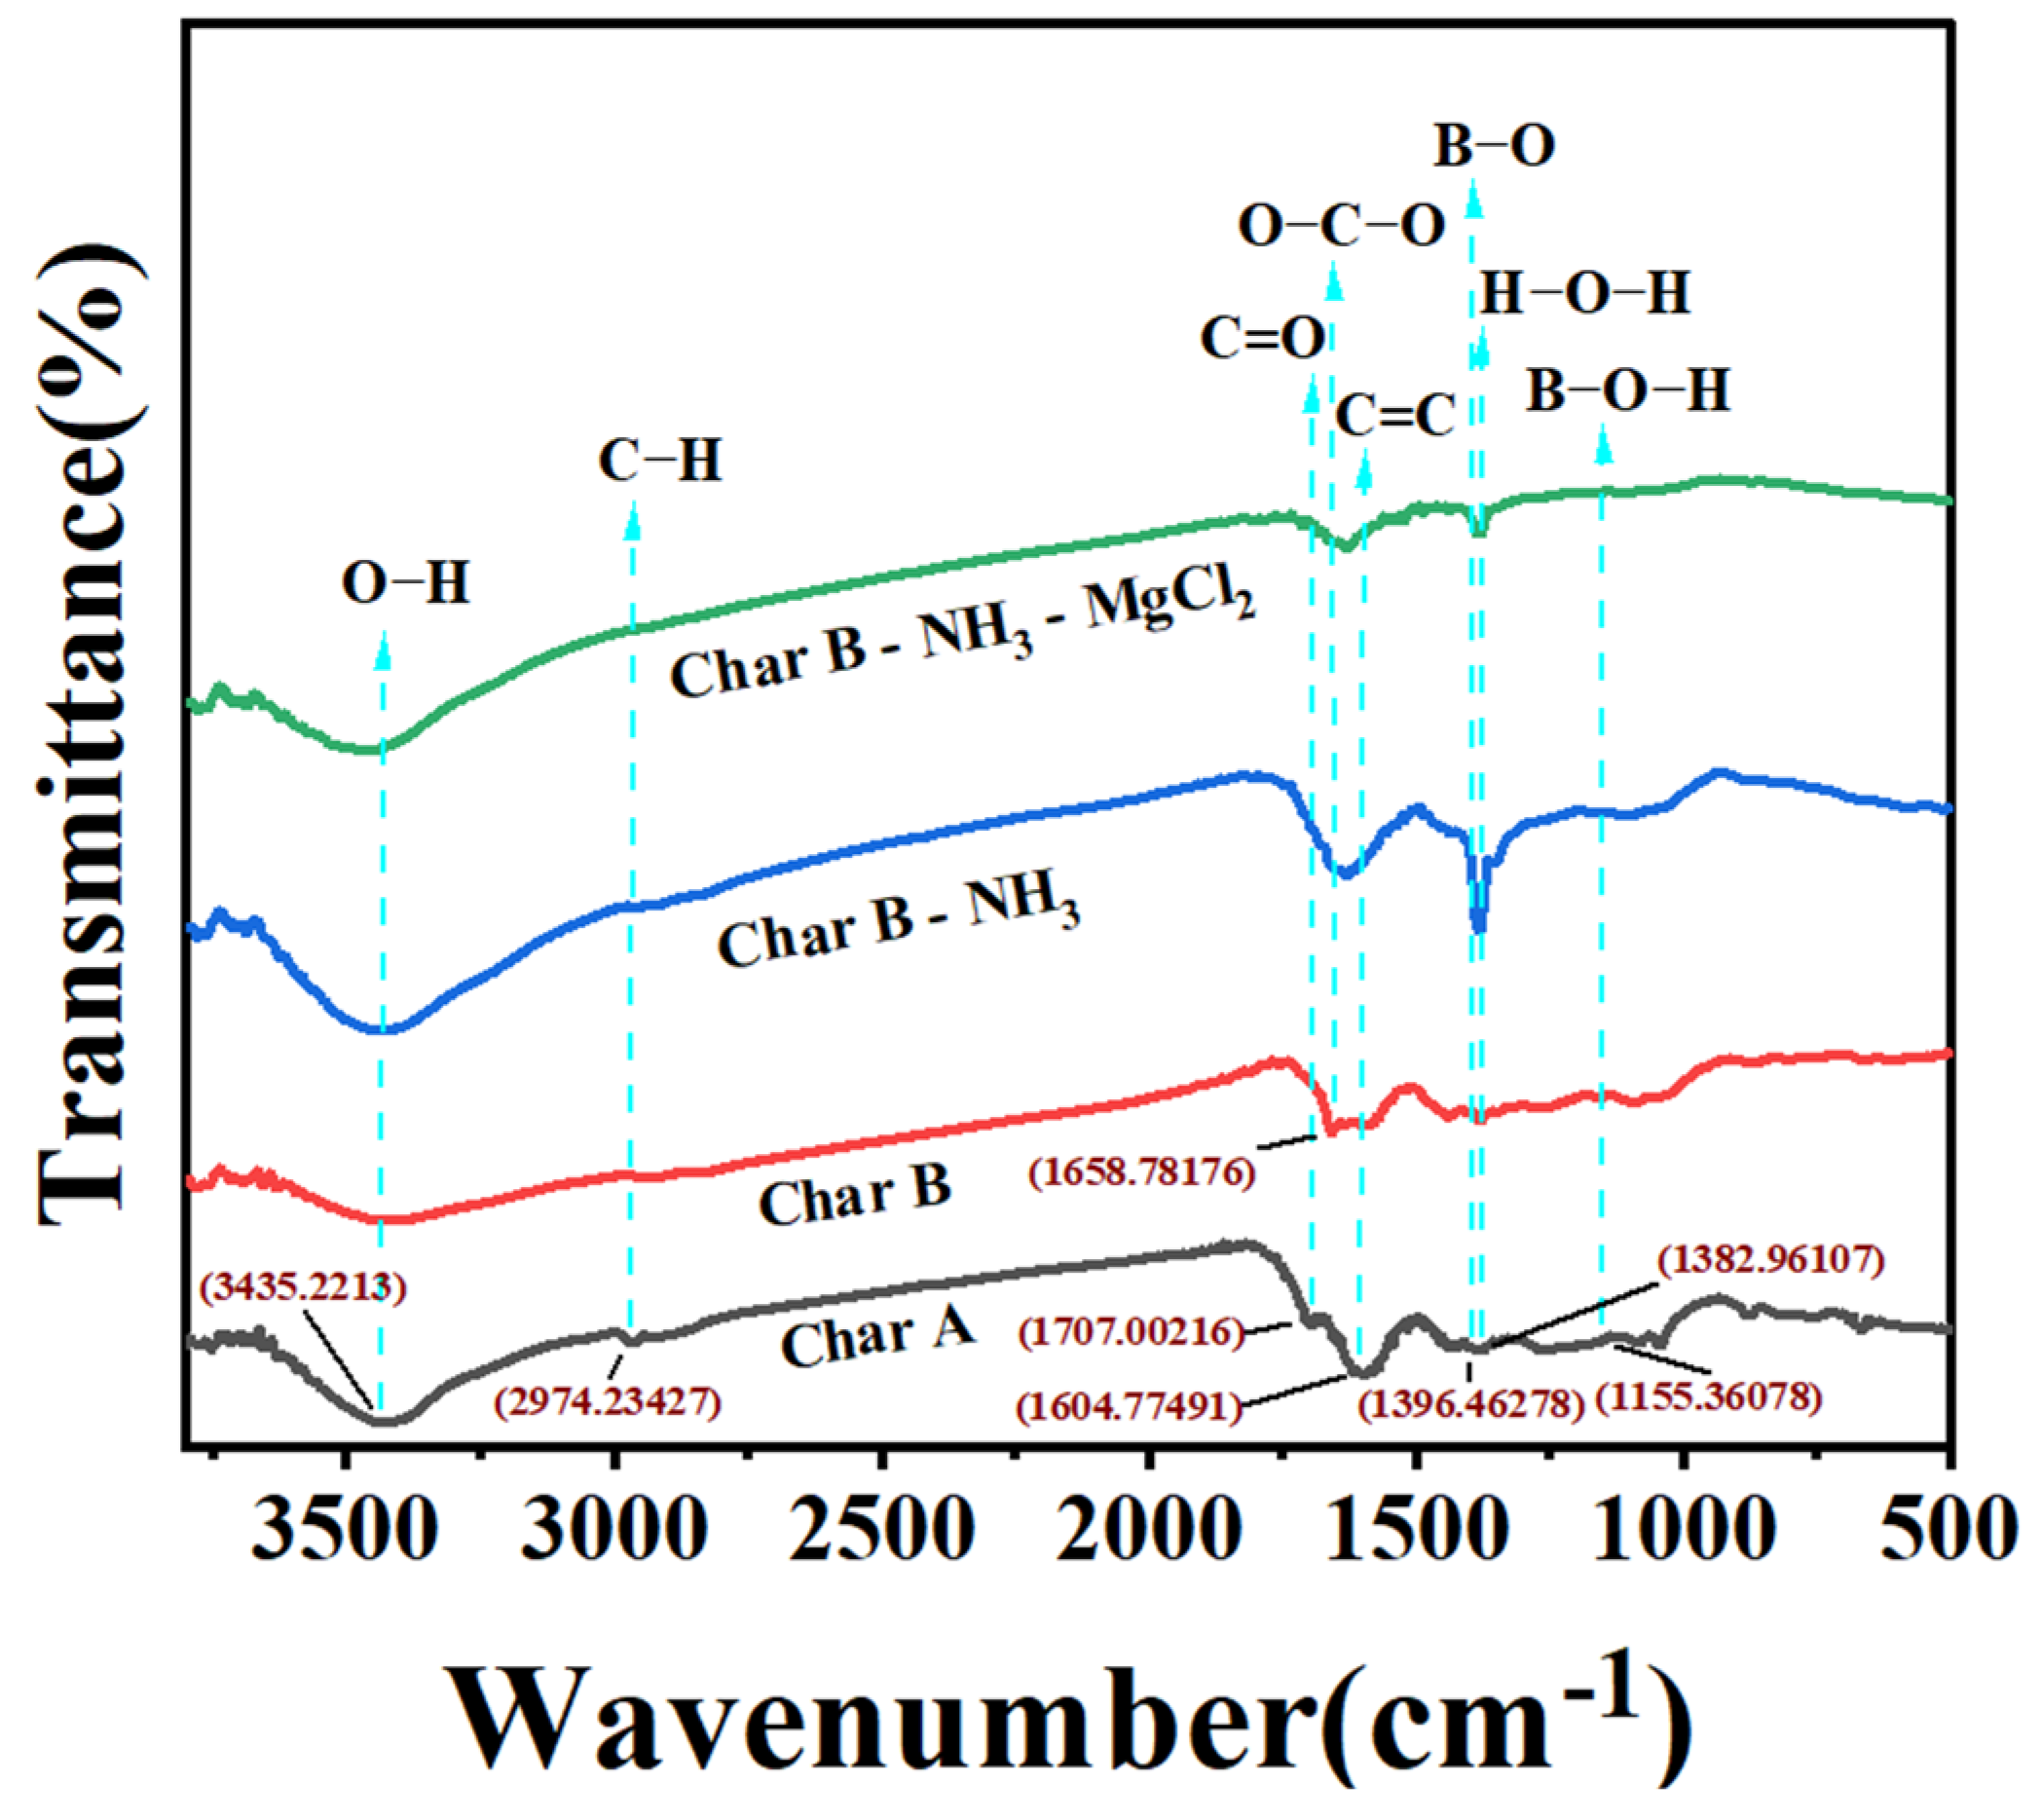
3.2.4. FT-IR Analysis
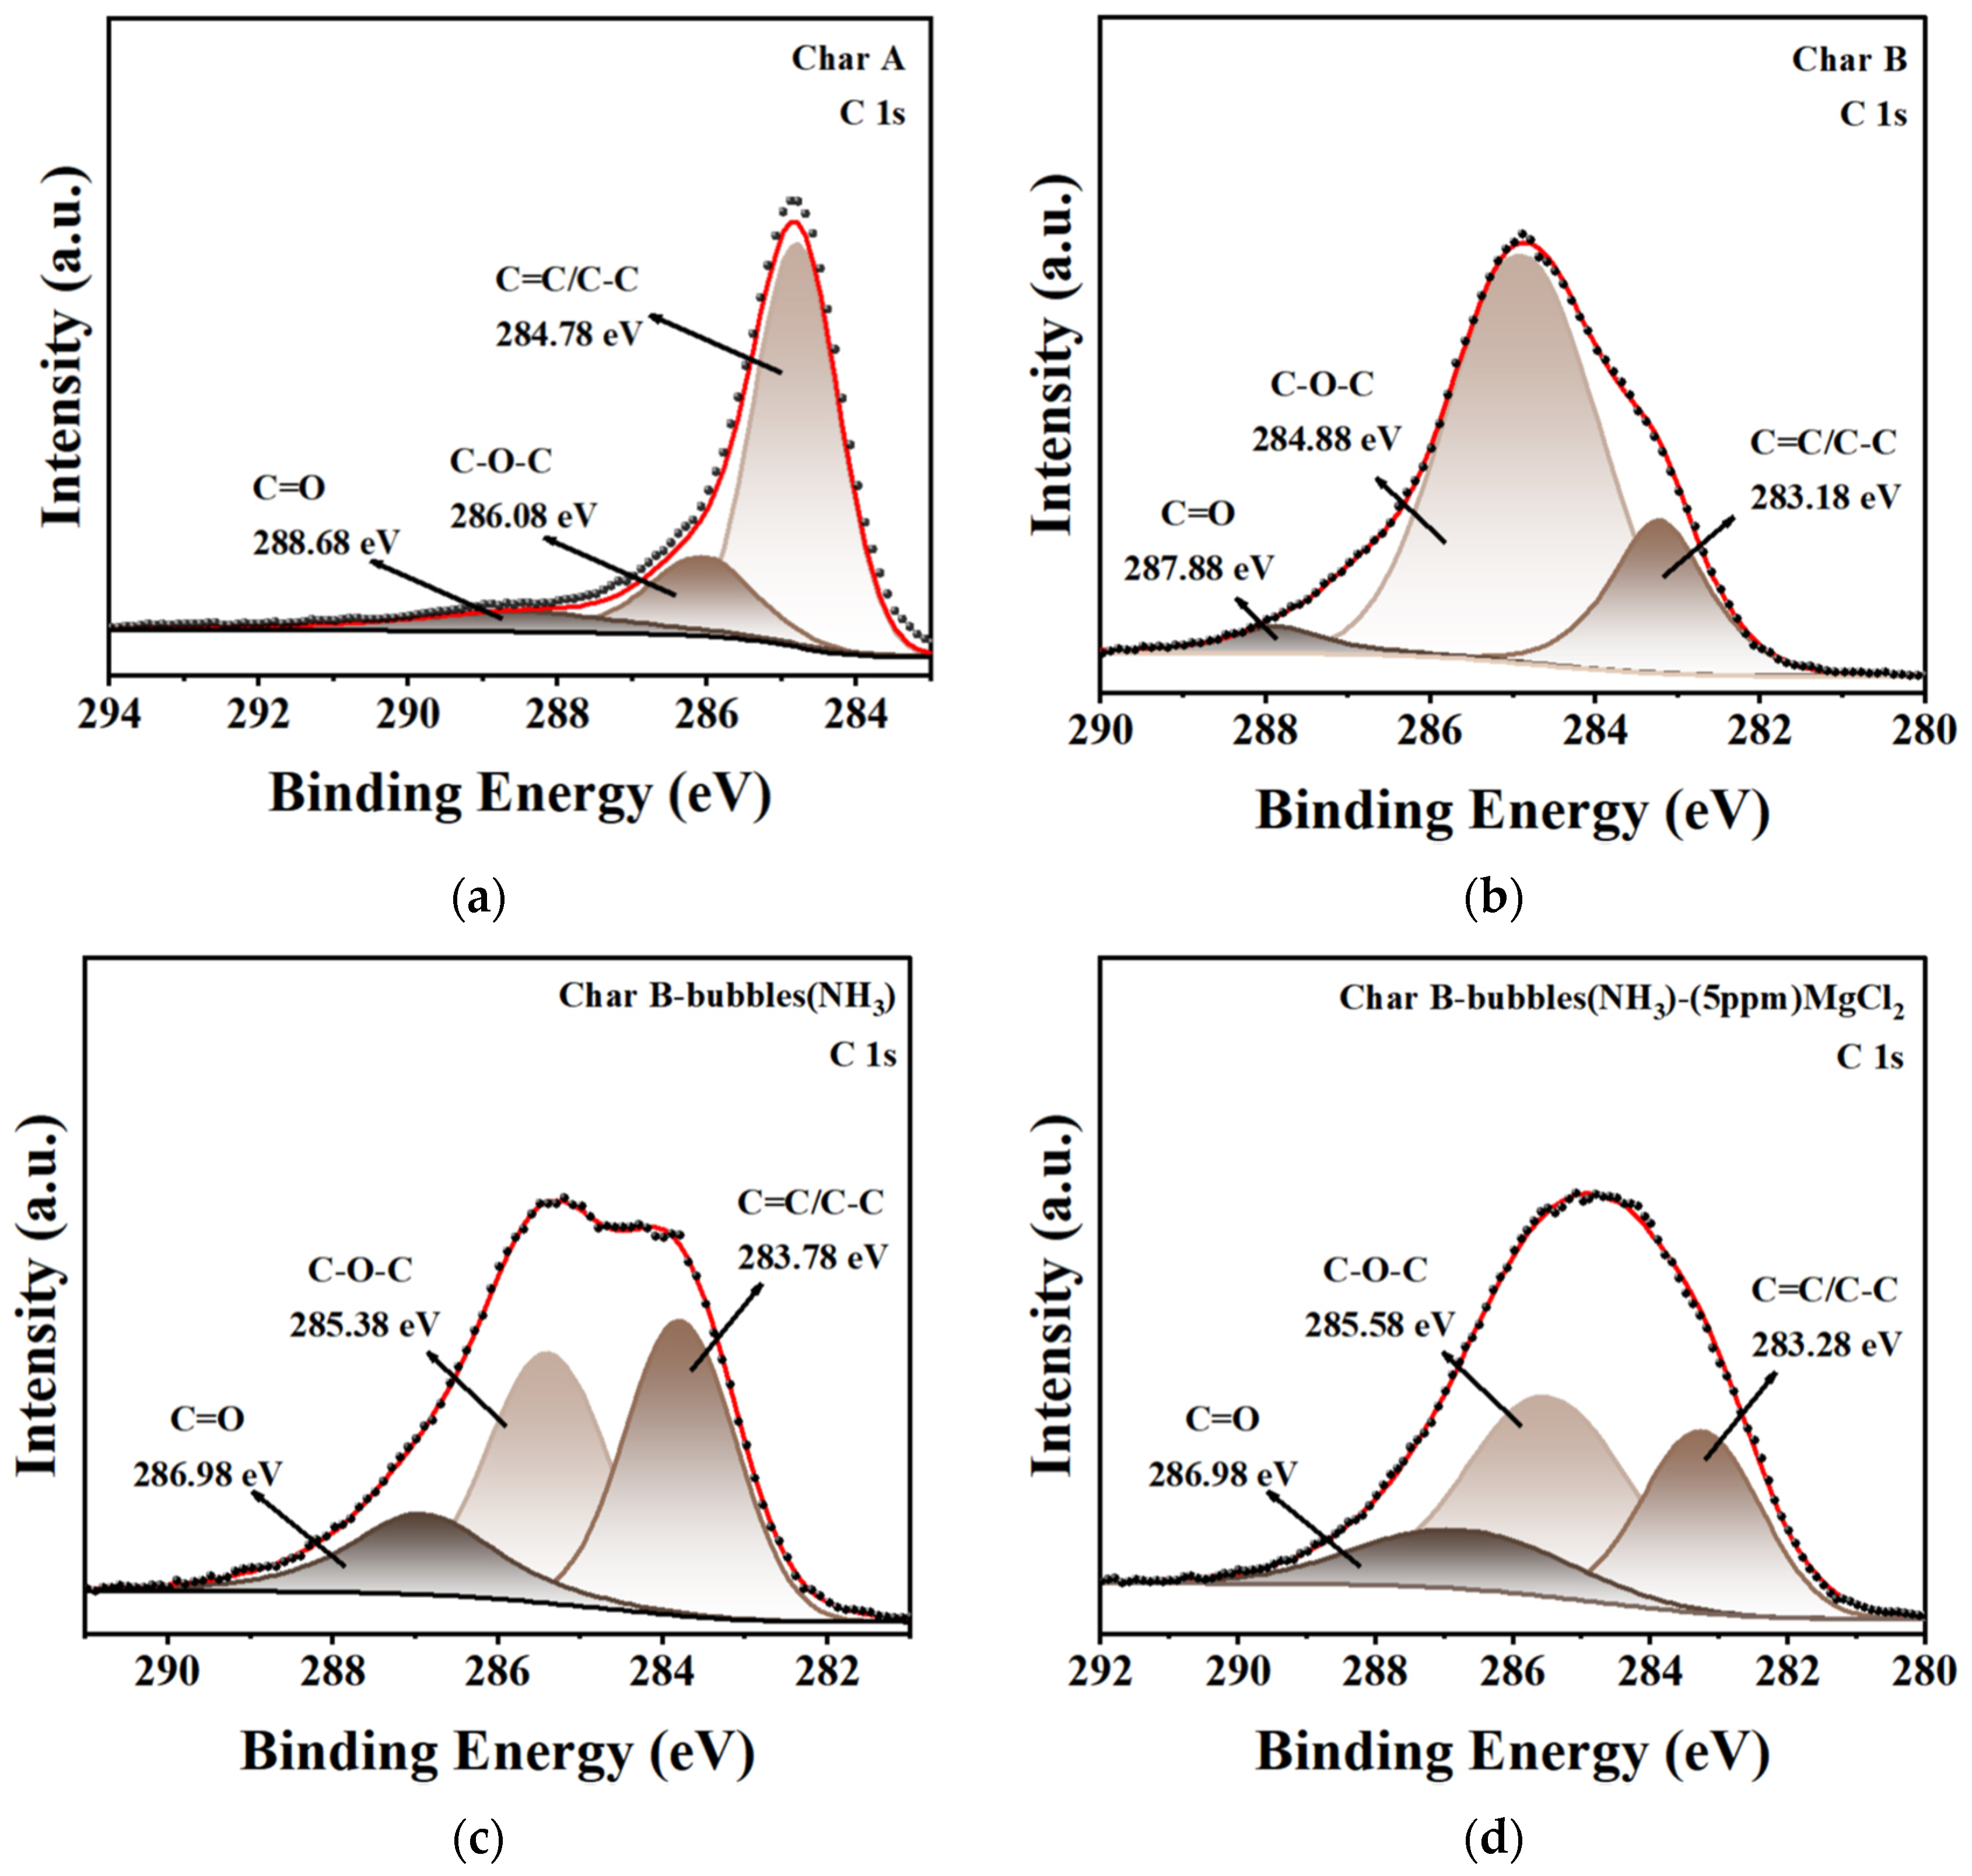
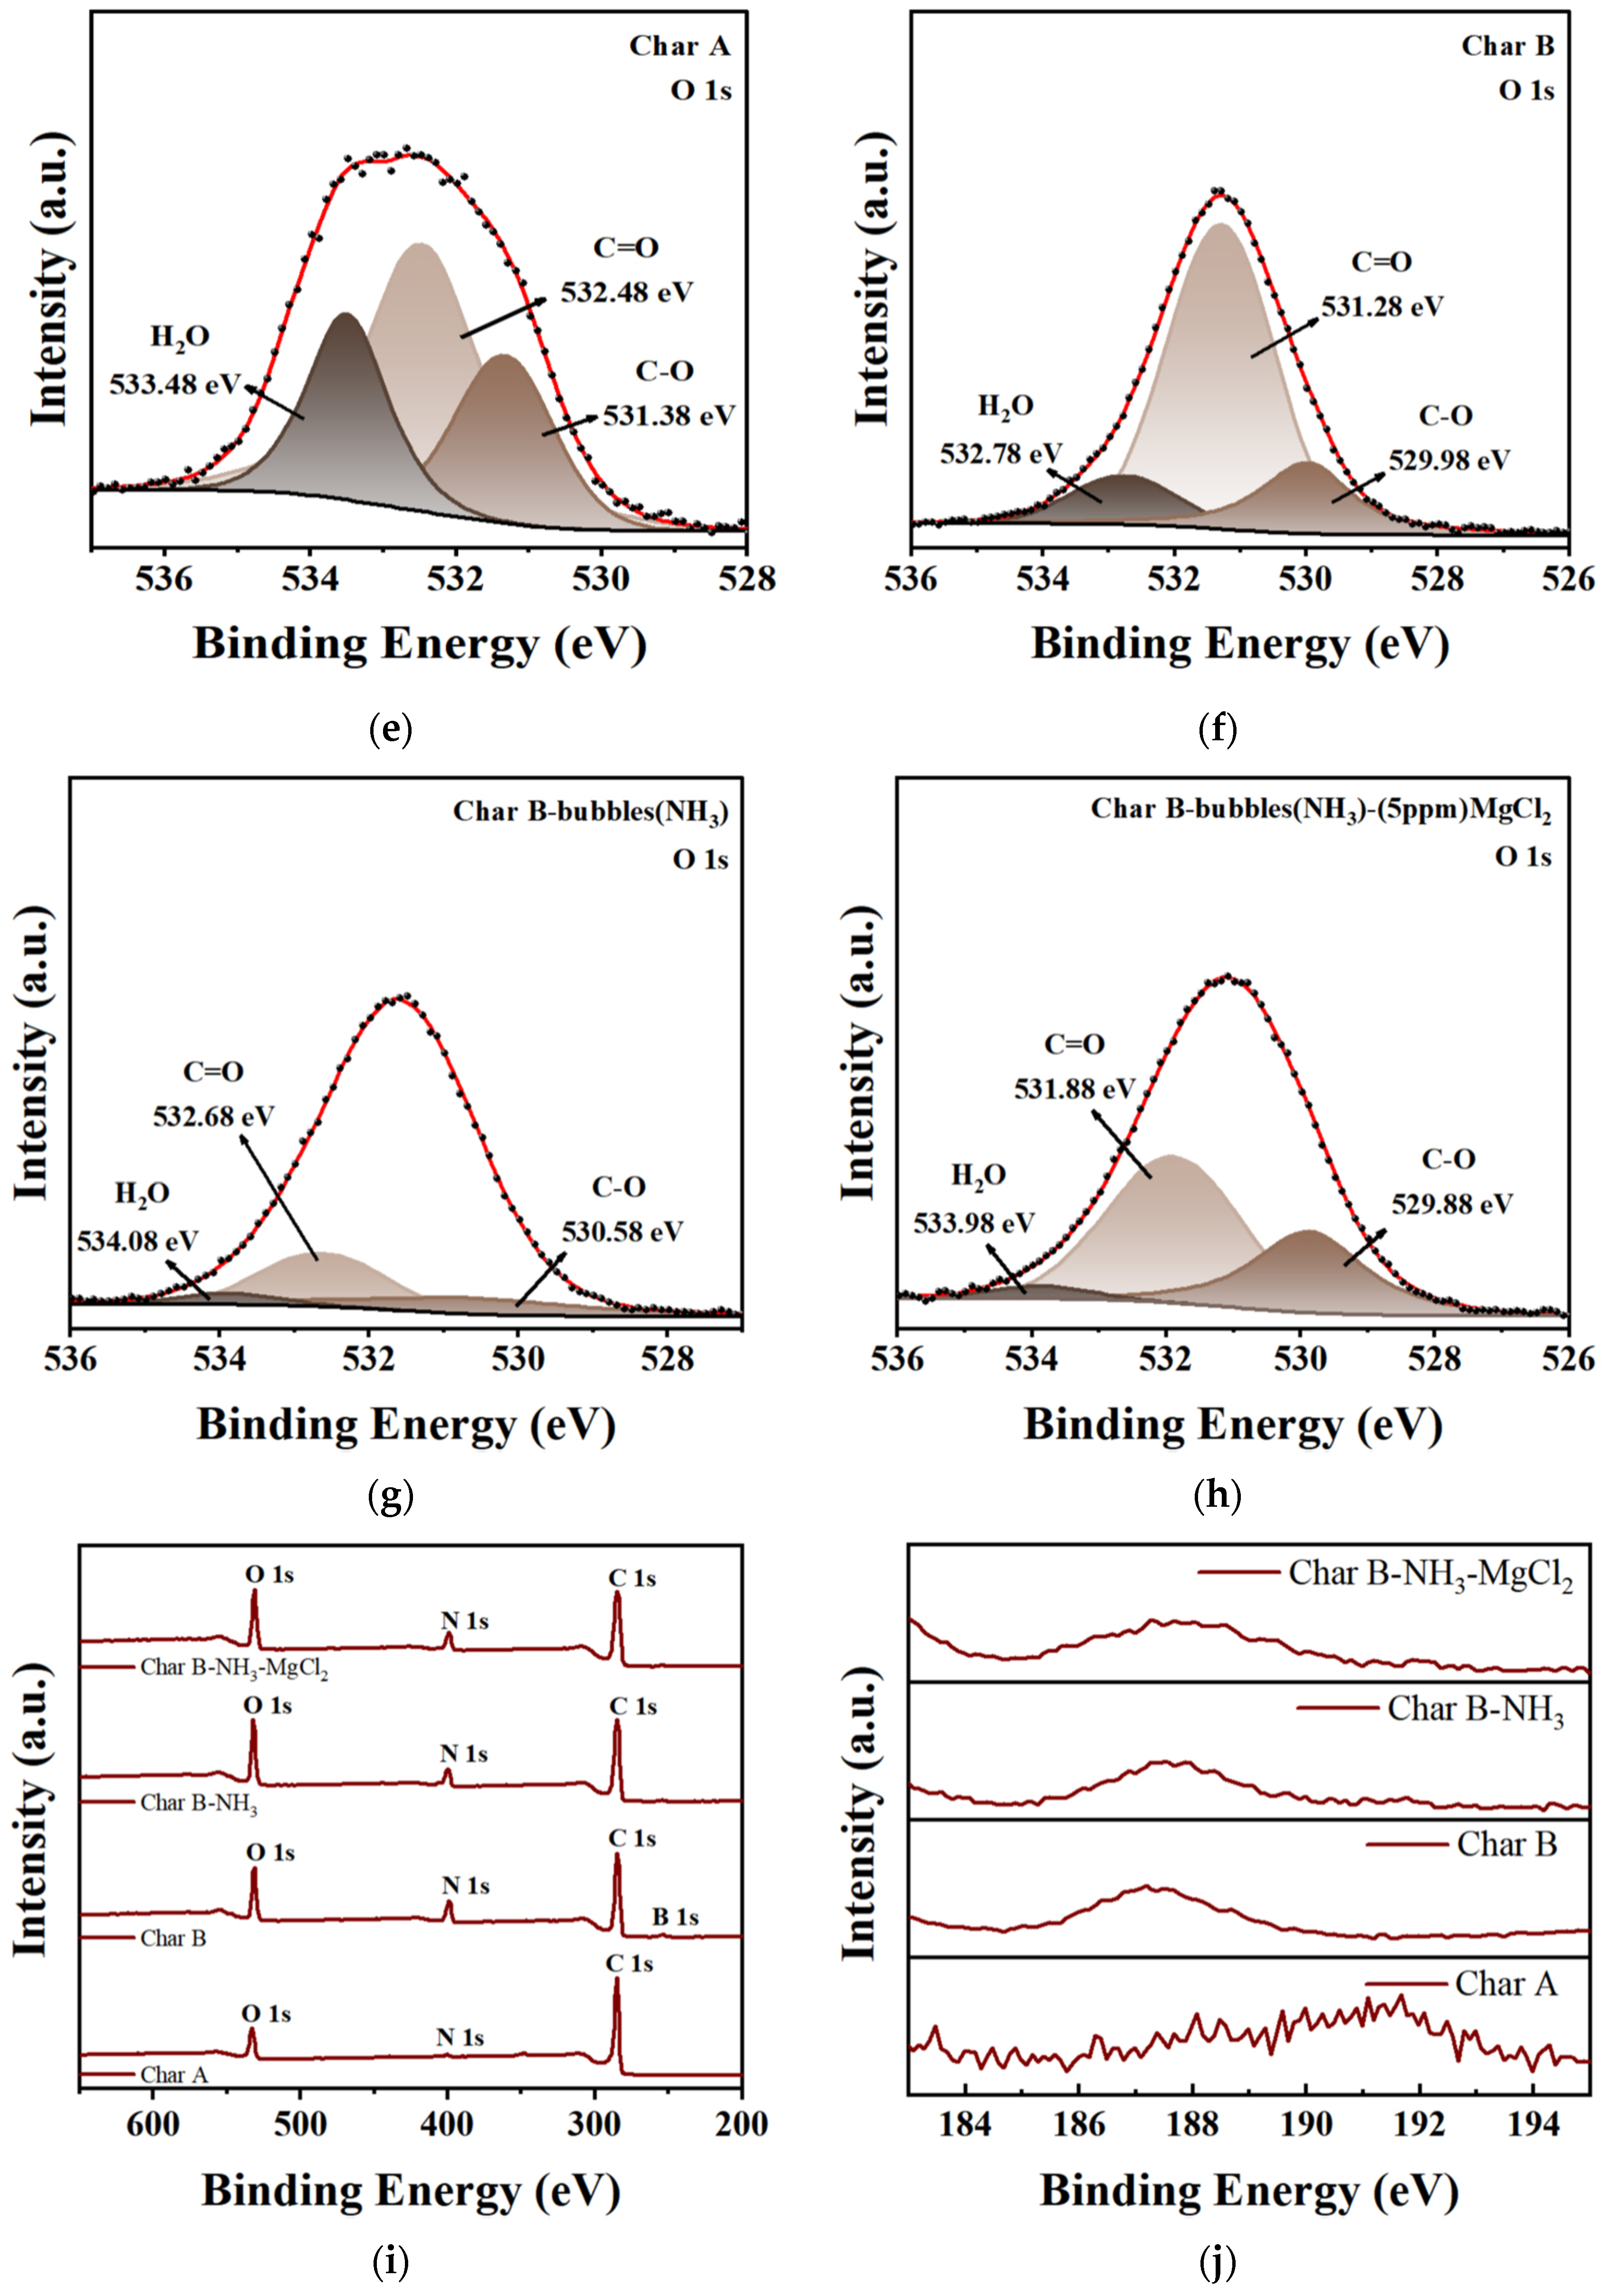
3.2.5. XPS Analysis
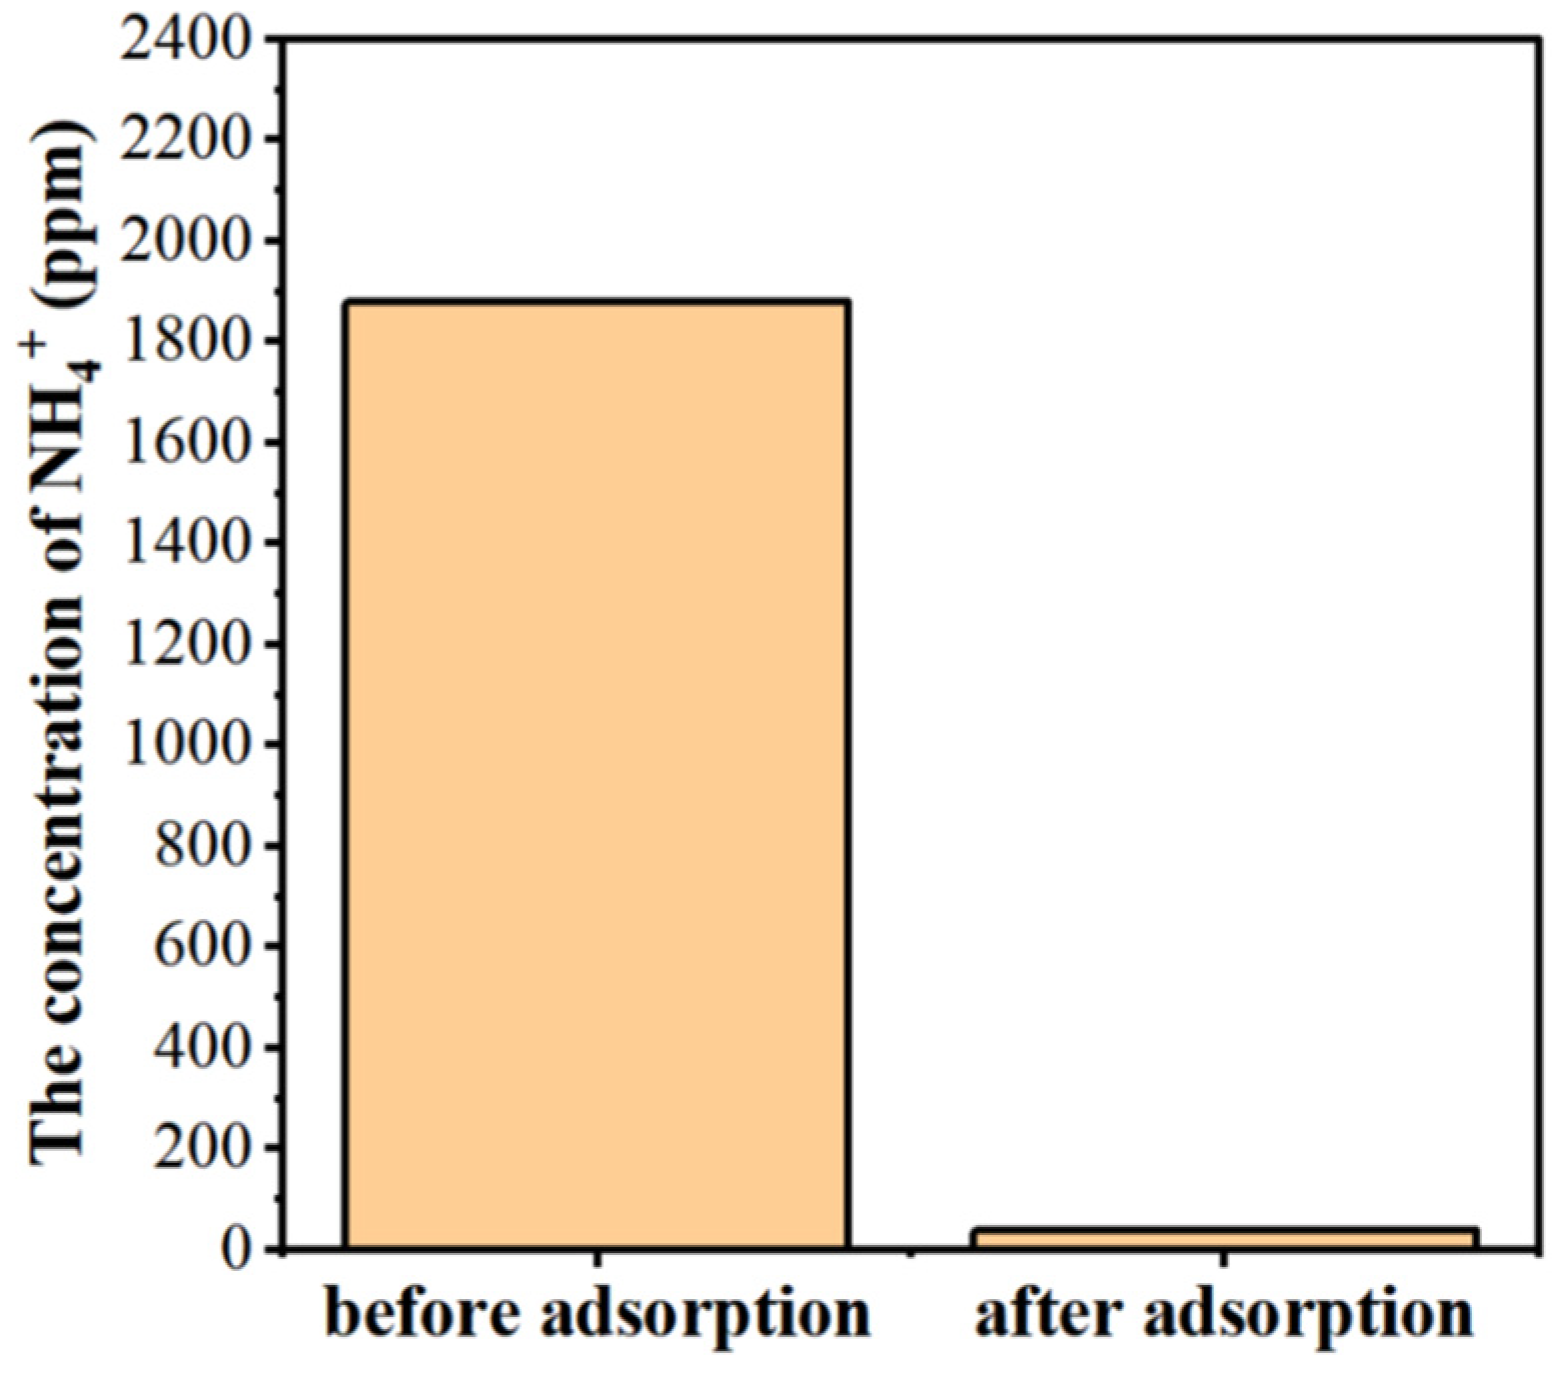
3.2.6. Removal of NH4+ Ions
4. Conclusions
Author Contributions
Funding
Institutional Review Board Statement
Informed Consent Statement
Data Availability Statement
Acknowledgments
Conflicts of Interest
References
- de Lucena, I.O.; de Gois, J.S.; Cassella, R.J. Graphene oxide functionalized with N-methyl-D-glucamine as a novel sorbent for boron removal from produced and formation waters. RSC Adv. 2024, 14, 5319–5330. [Google Scholar] [CrossRef]
- Cui, R.X.; Il Kwak, J.; An, Y.J. Understanding boron toxicity in aquatic plants (Salvinia natans and Lemna minor) in the presence and absence of EDTA. Aquat. Toxicol. 2024, 269, 106886. [Google Scholar] [CrossRef]
- Shireen, F.; Nawaz, M.A.; Chen, C.; Zhang, Q.K.; Zheng, Z.H.; Sohail, H.; Sun, J.Y.; Cao, H.S.; Huang, Y.; Bie, Z.L. Boron: Functions and Approaches to Enhance Its Availability in Plants for Sustainable Agriculture. Int. J. Mol. Sci. 2018, 19, 1856. [Google Scholar] [CrossRef] [PubMed]
- Acar, Ü.; Inanan, B.E.; Zemheri, F.; Kesbiç, O.S.; Yilmaz, S. Acute exposure to boron in Nile tilapia (Oreochromis niloticus): Median-lethal concentration (LC50), blood parameters, DNA fragmentation of blood and sperm cells. Chemosphere 2018, 213, 345–350. [Google Scholar] [CrossRef] [PubMed]
- Bustos-Obregón, E.; Olivares, C. Boron as Testicular Toxicant in Mice (Mus domesticus). Int. J. Morphol. 2012, 30, 1106–1114. [Google Scholar] [CrossRef]
- Korkmaz, M.; Özmetin, C.; Özmetin, E.; Süzen, Y. Modelling of boron removal from solutions by ion exchange for column reactor design in boron mine wastewater treatment. Desalination Water Treat. 2020, 179, 63–74. [Google Scholar] [CrossRef]
- Li, D.; Jiang, H.; Luo, Z.; Geng, W.; Zhu, J. Preparation and Adsorption Performance of Boron Adsorbents Derived from Modified Waste Feathers. Polymers 2024, 16, 1365. [Google Scholar] [CrossRef] [PubMed]
- Abbasi, A.; Yahya, W.Z.N.; Nasef, M.M.; Moniruzzaman, M.; Ghumman, A.S.M.; Afolabi, H.K. Boron removal by glucamine-functionalized inverse vulcanized sulfur polymer. React. Funct. Polym. 2022, 177, 105311. [Google Scholar] [CrossRef]
- Luo, Q.L.; He, L.; Wang, X.Y.; Huang, H.; Wang, X.F.; Sang, S.H.; Huang, X.L. Cyclodextrin derivatives used for the separation of boron and the removal of organic pollutants. Sci. Total Environ. 2020, 749, 141487. [Google Scholar] [CrossRef]
- Luo, Q.L.; Zeng, M.T.; Wang, X.Y.; Huang, H.; Wang, X.F.; Liu, N.; Huang, X.L. Glycidol-functionalized macroporous polymer for boron removal from aqueous solution. React. Funct. Polym. 2020, 150, 104543. [Google Scholar] [CrossRef]
- Yan, G.; Fu, L.; Lu, X.; Xie, Y.T.; Zhao, J.Y.; Tang, J.Q.; Zhou, D.D. Microalgae tolerant of boron stress and bioresources accumulation during the boron removal process. Environ. Res. 2022, 208, 112639. [Google Scholar] [CrossRef] [PubMed]
- Bai, S.Q.; Han, J.; Du, C.; Li, J.X.; Ding, W. Removal of boron and silicon by a modified resin and their competitive adsorption mechanisms. Environ. Sci. Pollut. Res. 2020, 27, 30275–30284. [Google Scholar] [CrossRef]
- Buoso, S.; Pagliari, L.; Musetti, R.; Fornasier, F.; Martini, M.; Loschi, A.; Fontanella, M.C.; Ermacora, P. With or Without You: Altered Plant Response to Boron-Deficiency in Hydroponically Grown Grapevines Infected by Grapevine Pinot Gris Virus Suggests a Relation Between Grapevine Leaf Mottling and Deformation Symptom Occurrence and Boron Plant Availability. Front. Plant Sci. 2020, 11, 226. [Google Scholar] [CrossRef] [PubMed]
- Abdelnour, S.A.; Abd El-Hack, M.E.; Swelum, A.A.; Perillo, A.; Losacco, C. The vital roles of boron in animal health and production: A comprehensive review. J. Trace Elem. Med. Biol. 2018, 50, 296–304. [Google Scholar] [CrossRef]
- García-Sánchez, F.; Simón-Grao, S.; Martínez-Nicolás, J.J.; Alfosea-Simón, M.; Liu, C.G.; Chatzissavvidis, C.; Pérez-Pérez, J.G.; Cámara-Zapata, J.M. Multiple stresses occurring with boron toxicity and deficiency in plants. J. Hazard. Mater. 2020, 397, 122713. [Google Scholar] [CrossRef]
- Li, Y.H.; Wang, S.H.; Song, X.X.; Zhou, Y.; Shen, H.M.; Cao, X.Z.; Zhang, P.; Gao, C.J. High boron removal polyamide reverse osmosis membranes by swelling induced embedding of a sulfonyl molecular plug. J. Membr. Sci. 2020, 597, 117716. [Google Scholar] [CrossRef]
- Liu, L.F.; Xie, X.; Qi, S.R.; Li, R.H.; Zhang, X.; Song, X.X.; Gao, C.J. Thin film nanocomposite reverse osmosis membrane incorporated with UiO-66 nanoparticles for enhanced boron removal. J. Membr. Sci. 2019, 580, 101–109. [Google Scholar] [CrossRef]
- Liu, J.J.; Barrientos, A. Transcriptional Regulation of Yeast Oxidative Phosphorylation Hypoxic Genes by Oxidative Stress. Antioxid. Redox Signal. 2013, 19, 1916–1927. [Google Scholar] [CrossRef] [PubMed]
- Ezechi, E.H.; Isa, M.H.; Kutty, S.R.M.; Yaqub, A. Boron removal from produced water using electrocoagulation. Process Saf. Environ. 2014, 92, 509–514. [Google Scholar] [CrossRef]
- Isa, M.H.; Ezechi, E.H.; Ahmed, Z.; Magram, S.F.; Kutty, S.R.M. Boron removal by electrocoagulation and recovery. Water Res. 2014, 51, 113–123. [Google Scholar] [CrossRef] [PubMed]
- Sari, M.A.; Chellam, S. Mechanisms of boron removal from hydraulic fracturing wastewater by aluminum electrocoagulation. J. Colloid Interface Sci. 2015, 458, 103–111. [Google Scholar] [CrossRef] [PubMed]
- Kartikaningsih, D.; Huang, Y.H.; Shih, Y.J. Electro-oxidation and characterization of nickel foam electrode for removing boron. Chemosphere 2017, 166, 184–191. [Google Scholar] [CrossRef] [PubMed]
- Polat, H.; Vengosh, A.; Pankratov, I.; Polat, M. A new methodology for removal of boron from water by coal and fly ash. Desalination 2004, 164, 173–188. [Google Scholar] [CrossRef]
- Hsui, C.Y. The optimal allocating pumping rate of a multi-well system for a brackish water desalination plant. Desalination 2008, 221, 215–224. [Google Scholar] [CrossRef]
- Güler, E.; Kabay, N.; Yüksel, M.; Yigit, N.Ö.; Kitis, M.; Bryjak, M. Integrated solution for boron removal from seawater using RO process and sorption-membrane filtration hybrid method. J. Membr. Sci. 2011, 375, 249–257. [Google Scholar] [CrossRef]
- Cengeloglu, Y.; Arslan, G.; Tor, A.; Kocak, I.; Dursun, N. Removal of boron from water by using reverse osmosis. Sep. Purif. Technol. 2008, 64, 141–146. [Google Scholar] [CrossRef]
- Kir, E.; Gurler, B.; Gulec, A. Boron removal from aqueous solution by using plasma-modified and unmodified anion-exchange membranes. Desalination 2011, 267, 114–117. [Google Scholar] [CrossRef]
- Morisada, S.; Rin, T.; Ogata, T.; Kim, Y.H.; Nakano, Y. Adsorption removal of boron in aqueous solutions by amine-modified tannin gel. Water Res. 2011, 45, 4028–4034. [Google Scholar] [CrossRef]
- Iizuka, A.; Takahashi, M.; Nakamura, T.; Yamasaki, A. Boron Removal Performance of a Solid Sorbent Derived from Waste Concrete. Ind. Eng. Chem. Res. 2014, 53, 4046–4051. [Google Scholar] [CrossRef]
- Melnik, L.A.; Babak, Y.V.; Goncharuk, V.V.; Chepurnaya, I.K. Application potential of boron-selective sorbents of different nature for water conditioning in terms of the boron content. J. Water Chem. Technol. 2015, 37, 25–31. [Google Scholar] [CrossRef]
- Ikeda, K.; Umeno, D.; Saito, K.; Koide, F.; Miyata, E.; Sugo, T. Removal of Boron Using Nylon-Based Chelating Fibers. Ind. Eng. Chem. Res. 2011, 50, 5727–5732. [Google Scholar] [CrossRef]
- Wei, Y.T.; Zheng, Y.M.; Chen, J.P. Functionalization of Regenerated Cellulose Membrane via Surface Initiated Atom Transfer Radical Polymerization for Boron Removal from Aqueous Solution. Langmuir 2011, 27, 6018–6025. [Google Scholar] [CrossRef]
- Isaacs-Paez, E.D.; Leyva-Ramos, R.; Jacobo-Azuara, A.; Martinez-Rosales, J.M.; Flores-Cano, J.V. Adsorption of boron on calcined AlMg layered double hydroxide from aqueous solutions. Mechanism and effect of operating conditions. Chem. Eng. J. 2014, 245, 248–257. [Google Scholar] [CrossRef]
- Zhang, X.; Wang, J.W.; Chen, S.F.; Bao, Z.B.; Xing, H.B.; Zhang, Z.G.; Su, B.G.; Yang, Q.W.; Yang, Y.W.; Ren, Q.L. A spherical -methyl-D-glucamine-based hybrid adsorbent for highly efficient adsorption of boric acid from water. Sep. Purif. Technol. 2017, 172, 43–50. [Google Scholar] [CrossRef]
- Recepoglu, Y.K.; Kabay, N.; Ipek, I.Y.; Arda, M.; Yüksel, M.; Yoshizuka, K.; Nishihama, S. Packed bed column dynamic study for boron removal from geothermal brine by a chelating fiber and breakthrough curve analysis by using mathematical models. Desalination 2018, 437, 1–6. [Google Scholar] [CrossRef]
- Nasef, M.M.; Nallappan, M.; Ujang, Z. Polymer-based chelating adsorbents for the selective removal of boron from water and wastewater: A review. React. Funct. Polym. 2014, 85, 54–68. [Google Scholar] [CrossRef]
- Guler, E.; Kaya, C.; Kabay, N.; Arda, M. Boron removal from seawater: State-of-the-art review. Desalination 2015, 356, 85–93. [Google Scholar] [CrossRef]
- Wolska, J.; Bryjak, M. Methods for boron removal from aqueous solutions—A review. Desalination 2013, 310, 18–24. [Google Scholar] [CrossRef]
- Kameda, T.; Oba, J.; Yoshioka, T. New treatment method for boron in aqueous solutions using Mg-Al layered double hydroxide: Kinetics and equilibrium studies. J. Hazard. Mater. 2015, 293, 54–63. [Google Scholar] [CrossRef]
- Kameda, T.; Oba, J.; Yoshioka, T. Use of Mg-Al oxide for boron removal from an aqueous solution in rotation: Kinetics and equilibrium studies. J. Environ. Manag. 2016, 165, 280–285. [Google Scholar] [CrossRef] [PubMed]
- Kameda, T.; Oba, J.; Yoshioka, T. Removal of boron and fluoride in wastewater using Mg-Al layered double hydroxide and Mg-Al oxide. J. Environ. Manag. 2017, 188, 58–63. [Google Scholar] [CrossRef] [PubMed]
- García-Soto, M.M.D.; Camacho, E.M. Boron removal by means of adsorption processes with magnesium oxide—Modelization and mechanism. Desalination 2009, 249, 626–634. [Google Scholar] [CrossRef]
- García-Soto, M.D.D.; Camacho, E.M. Boron removal by means of adsorption with magnesium oxide. Sep. Purif. Technol. 2006, 48, 36–44. [Google Scholar] [CrossRef]
- Kipçak, I.; Özdemir, M. Removal of boron from aqueous solution using calcined magnesite tailing. Chem. Eng. J. 2012, 189, 68–74. [Google Scholar] [CrossRef]
- Sasaki, K.; Moriyama, S. Effect of calcination temperature for magnesite on interaction of MgO-rich phases with boric acid. Ceram. Int. 2014, 40, 1651–1660. [Google Scholar] [CrossRef]
- Sasaki, K.; Qiu, X.; Moriyama, S.; Tokoro, C.; Ideta, K.; Miyawaki, J. Characteristic Sorption of H3BO3/B(OH)4 on Magnesium Oxide. Mater. Trans. 2013, 54, 1809–1817. [Google Scholar] [CrossRef]
- Gao, Z.S.; Xie, S.L.; Zhang, B.; Qiu, X.H.; Chen, F.X. Ultrathin Mg-Al layered double hydroxide prepared by ionothermal synthesis in a deep eutectic solvent for highly effective boron removal. Chem. Eng. J. 2017, 319, 108–118. [Google Scholar] [CrossRef]
- Demirçivi, P.; Saygili, G.N. Response surface modeling of boron adsorption from aqueous solution by vermiculite using different adsorption agents: Box-Behnken experimental design. Water Sci. Technol. 2017, 76, 515–530. [Google Scholar] [CrossRef]
- Demirçivi, P.; Saygili, G.N. Comparative study of modified expanded perlite with hexadecyltrimethylammonium-bromide and gallic acid for boron adsorption. J. Mol. Liq. 2018, 254, 383–390. [Google Scholar] [CrossRef]
- Kabay, N.; Güler, E.; Bryjak, M. Boron in seawater and methods for its separation—A review. Desalination 2010, 261, 212–217. [Google Scholar] [CrossRef]
- Meng, J.Q.; Yuan, J.; Kang, Y.L.; Zhang, Y.F.; Du, Q.Y. Surface glycosylation of polysulfone membrane towards a novel complexing membrane for boron removal. J. Colloid Interface Sci. 2012, 368, 197–207. [Google Scholar] [CrossRef]
- Nasef, M.M.; Ting, T.M.; Abbasi, A.; Layeghi-Moghaddam, A.; Alinezhad, S.S.; Hashim, K. Radiation grafted adsorbents for newly emerging environmental applications. Radiat. Phys. Chem. 2016, 118, 55–60. [Google Scholar] [CrossRef]
- Ting, T.M.; Nasef, M.M.; Hashim, K. Tuning-methyl-D-glucamine density in a new radiation grafted poly (vinyl benzyl chloride)/nylon-6 fibrous boron-selective adsorbent using the response surface method. RSC Adv. 2015, 5, 37869–37880. [Google Scholar] [CrossRef]
- Ivanov, N.P.; Dran’kov, A.N.; Shichalin, O.O.; Lembikov, A.O.; Buravlev, I.Y.; Mayorov, V.Y.; Balanov, M.I.; Rogachev, K.A.; Kaspruk, G.D.; Pisarev, S.M.; et al. Composite magnetic sorbents based on magnetic FeO coated by Zn and Al layered double hydroxide for U(VI) removal from aqueous media. J. Radioanal. Nucl. Chem. 2024, 333, 1213–1230. [Google Scholar] [CrossRef]
- Shichalin, O.O.; Yarusova, S.B.; Ivanov, N.P.; Papynov, E.K.; Belov, A.A.; Azon, S.A.; Buravlev, I.Y.; Myagchilov, A.V.; Fedorets, A.N.; Rastorguev, V.L.; et al. Calcium silicate solid-state matrices from boric acid production waste for Co removal and immobilization by spark plasma sintering. J. Water Process Eng. 2024, 59, 105042. [Google Scholar] [CrossRef]
- Wanapat, M.; Suriyapha, C.; Dagaew, G.; Prachumchai, R.; Phupaboon, S.; Sommai, S.; Matra, M. The recycling of tropical fruit peel waste-products applied in feed additive for ruminants: Food manufacturing industries, phytonutrient properties, mechanisms, and future applications. J. Agric. Food Res. 2024, 17, 101234. [Google Scholar] [CrossRef]
- Fioranelli, A.; Bizzo, W.A. Generation of surplus electricity in sugarcane mills from sugarcane bagasse and straw: Challenges, failures and opportunities. Renew. Sustain. Energ. Rev. 2023, 186, 113647. [Google Scholar] [CrossRef]
- Liu, H.; Wang, Y.; Cai, T.; He, K.; Tian, X.; Chen, Z.; Yin, Y.; Cui, Z. Integrated management to achieve synergy in sugarcane production and quality in China. Field Crops Res. 2024, 317, 109552. [Google Scholar] [CrossRef]
- Hao, L.L.; Zheng, T.; Jiang, J.P.; Zhang, G.S.; Wang, P. Removal of As (III) and As (V) from water using iron doped amino functionalized sawdust: Characterization, adsorptive performance and UF membrane separation. Chem. Eng. J. 2016, 292, 163–173. [Google Scholar] [CrossRef]
- Raj, V.; Chauhan, M.S.; Pal, S.L. Potential of sugarcane bagasse in remediation of heavy metals: A review. Chemosphere 2022, 307, 135825. [Google Scholar] [CrossRef] [PubMed]
- Zhou, Y.; Han, Z.; He, C.; Feng, Q.; Wang, K.; Wang, Y.; Luo, N.; Dodbiba, G.; Wei, Y.; Otsuki, A.; et al. Long-Term Stability of Different Kinds of Gas Nanobubbles in Deionized and Salt Water. Materials 2021, 14, 1808. [Google Scholar] [CrossRef] [PubMed]
- Guidelines for Drinking-Water Quality, 4th ed.; World Health Organization: Geneva, Switzerland, 2011; ISBN 978924154815.
- Qiu, H.; Liang, C.; Yu, J.H.; Zhang, Q.R.; Song, M.X.; Chen, F.H. Preferable phosphate sequestration by nano-La (III) (hydr)oxides modified wheat straw with excellent properties in regeneration. Chem. Eng. J. 2017, 315, 345–354. [Google Scholar] [CrossRef]
- Appl, M. Ammonia. In Ullmann’s Encyclopedia of Industrial Chemistry; Verlag Chemie: Hoboken, NJ, USA, 2006. [Google Scholar]
- Abdel-Galil, E.A.; Eid, M.A.; Shahr El-Din, A.M. Adsorptive removal of PAR and Arsenazo-III from radioactive waste solutions by modified sugarcane bagasse as eco-friendly sorbent. Radiochim. Acta 2020, 108, 785–798. [Google Scholar] [CrossRef]
- Alvarenga, A.D.; Correa, D.S. Composite nanofibers membranes produced by solution blow spinning modified with CO2-activated sugarcane bagasse fly ash for efficient removal of water pollutants. J. Clean. Prod. 2021, 285, 125376. [Google Scholar] [CrossRef]
- de Carvalho Neto, A.G.V.; Ganzerli, T.A.; Cardozo, A.L.; Fávaro, S.L.; Pereira, A.G.B.; Girotto, E.M.; Radovanovic, E. Development of composites based on recycled polyethylene/sugarcane bagasse fibers. Polym. Compos. 2013, 35, 768–774. [Google Scholar] [CrossRef]
- da Silva, C.G.; de Oliveira, F.; Frollini, E. Sugarcane Bagasse Fibers Treated and Untreated: Performance as Reinforcement in Phenolic-Type Matrices Based on Lignosulfonates. Waste Biomass Valorization 2018, 10, 3515–3524. [Google Scholar] [CrossRef]
- Cazetta, A.L.; Zhang, T.; Silva, T.L.; Almeida, V.C.; Asefa, T. Bone char-derived metal-free N- and S-co-doped nanoporous carbon and its efficient electrocatalytic activity for hydrazine oxidation. Appl. Catal. B Environ. 2018, 225, 30–39. [Google Scholar] [CrossRef]
- Che, H.X.; Wei, G.T.; Fan, Z.D.; Zhu, Y.L.; Zhang, L.Y.; Wei, Z.Z.; Huang, X.L.; Wei, L.R. Super facile one-step synthesis of sugarcane bagasse derived N-doped porous biochar for adsorption of ciprofloxacin. J. Environ. Manag. 2023, 335, 117566. [Google Scholar] [CrossRef] [PubMed]
- Wang, H.Z.; Guo, W.Q.; Liu, B.H.; Wu, Q.L.; Luo, H.C.; Zhao, Q.; Si, Q.S.; Sseguya, F.; Ren, N.Q. Edge-nitrogenated biochar for efficient peroxydisulfate activation: An electron transfer mechanism. Water Res. 2019, 160, 405–414. [Google Scholar] [CrossRef]
- Amin, N.; Ul Hasan, M.S.; Majeed, Z.; Latif, Z.; Nabi, M.A.U.; Mahmood, K.; Ali, A.; Mehmood, K.; Fatima, M.; Akhtar, M.; et al. Structural, electrical, optical and dielectric properties of yttrium substituted cadmium ferrites prepared by Co-Precipitation method. Ceram. Int. 2020, 46, 20798–20809. [Google Scholar] [CrossRef]
- Ighalo, J.O.; Iwuozor, K.O.; Igwegbe, C.A.; Adeniyi, A.G. Verification of pore size effect on aqueous-phase adsorption kinetics: A case study of methylene blue. Colloids Surf. A 2021, 626, 127119. [Google Scholar] [CrossRef]
- Iwuozor, K.O.; Ighalo, J.O.; Ogunfowora, L.A.; Adeniyi, A.G.; Igwegbe, C.A. An empirical literature analysis of adsorbent performance for methylene blue uptake from aqueous media. J. Environ. Chem. Eng. 2021, 9, 105658. [Google Scholar] [CrossRef]
- Liu, S.Q.; Xu, M.; Yu, T.L.; Han, D.; Peng, J.; Li, J.Q.; Zhai, M.L. Radiation synthesis and performance of novel cellulose-based microsphere adsorbents for efficient removal of boron (III). Carbohydr. Polym. 2017, 174, 273–281. [Google Scholar] [CrossRef] [PubMed]
- Sariçicek, E.N.; Tugaç, M.M.; Özdemir, V.T.; Ipek, I.Y.; Arar, Ö. Removal of boron by boron selective resin-filled electrodeionization. Environ. Technol. Innov. 2021, 23, 101742. [Google Scholar] [CrossRef]
- Luo, Q.L.; Cheng, Z.F.; He, L.L.; Wang, X.Y.; Li, K.H.; Huang, X.L. Glucose and glycidol grafted polyacrylonitrile particles by hydrothermal synthesis for enriched boron from aqueous solution. Colloids Surf. A 2021, 612, 125976. [Google Scholar] [CrossRef]
- Altinbas, B.F.; Yüksel, A. Synthesis of a novel cellulose-based adsorbent from olive tree pruning waste for removal of boron from aqueous solution. Biomass Convers. Biorefinery 2023, 14, 20117–20127. [Google Scholar] [CrossRef]
- Yetgin, A.G.; Dündar, O.A.; Çakmakçi, E.; Arar, Ö. Removal of boron from aqueous solution by modified cellulose. Biomass Convers. Biorefinery 2023, 13, 13081–13090. [Google Scholar] [CrossRef]
- Ting, T.M.; Nasef, M.M.; Aravindan, D.; Rosslan, I.F.N.; Ruslan, N. Selective removal of boron from industrial wastewater containing high concentration of ammonia by radiation grafted fibrous adsorbent in fixed bed column. J. Environ. Chem. Eng. 2021, 9, 104993. [Google Scholar] [CrossRef]
- Mozaffari Majd, M.; Kordzadeh-Kermani, V.; Ghalandari, V.; Askari, A.; Sillanpää, M. Adsorption isotherm models: A comprehensive and systematic review (2010−2020). Sci. Total Environ. 2022, 812, 151334. [Google Scholar] [CrossRef] [PubMed]
- Kaewyai, J.; Noophan, P.; Cruz, S.G.; Okabe, S. Influence of biochar derived from sugarcane bagasse at different carbonization temperatures on anammox granular formation. Int. Biodeterior. Biodegrad. 2023, 185, 105678. [Google Scholar] [CrossRef]
- Li, Q.Y.; Hou, Y.Q.; Wang, J.C.; Liu, Y.J.; Xiang, N.; Huang, Z.G. Superiority of Raw Biomass and Potassium Hydroxide in Preparation of Ultrahigh Nitrogen Doping of Carbon for NH-SCR Reaction. ACS Sustain. Chem. Eng. 2020, 8, 11308–11316. [Google Scholar] [CrossRef]
- Iwuozor, K.O.; Emenike, E.C.; Abdulkadir, M.; Samuel, O.; Adeniyi, A.G. Effect of Salt Modification on Biochar Obtained from the Thermochemical Conversion of Sugarcane Bagasse. Sugar Tech 2023, 25, 223–233. [Google Scholar] [CrossRef]
- Hoang, L.; Nguyen, T.M.P.; Van, H.T.; Yilmaz, M.; Hoang, T.K.; Nguyen, Q.T.; Vi, T.M.H.; Nga, L.T.Q. Removal of Tetracycline from aqueous solution using composite adsorbent of ZnAl layered double hydroxide and bagasse biochar. Environ. Technol. Innov. 2022, 28, 102914. [Google Scholar] [CrossRef]
- Peak, D.; Luther, G.W.; Sparks, D.L. ATR-FTIR spectroscopic studies of boric acid adsorption on hydrous ferric oxide. Geochim. Cosmochim. Acta 2003, 67, 2551–2560. [Google Scholar] [CrossRef]
- Lefèvre, G. Determination of isotopic ratio of boron in boric acid solutions by ATR-FTIR spectroscopy. J. Radioanal. Nucl. Chem. 2023, 332, 337–342. [Google Scholar] [CrossRef]
- Zhang, C.C.J.; Gao, X.T.; Yilmaz, B. Development of FTIR Spectroscopy Methodology for Characterization of Boron Species in FCC Catalysts. Catalysts 2020, 10, 1327. [Google Scholar] [CrossRef]
- Ates, A.; Aydemir, B.; Oeksuez, K.E. Investigation of physicochemical and biological properties of boron-doped biochar. Biomass Convers. Biorefinery 2023, 2190-6823. [Google Scholar] [CrossRef]
- Liu, G.; Lin, Y.; Zhang, L.; Zhang, M.; Gu, C.; Li, J.; Zheng, T.; Chai, J. Preparation of NaA zeolite molecular sieve based on solid waste fly ash by high-speed dispersion homogenization-assisted alkali fusion-hydrothermal method and its performance of ammonia-nitrogen adsorption. J. Sci. Adv. Mater. Devices 2024, 9, 100673. [Google Scholar] [CrossRef]


| Sample | BET Surface Area | Pore Diameter |
|---|---|---|
| (m2/g) | (nm) | |
| Char A | 42.56 | 1.24 |
| Char B | 1.59 | 4.87 |
| Adsorbent | Char B–MgCl2 (5 ppm)–NH3 Nanobubbles | Electrocoagulation [18] | Nylon-Based Chelating Fibers [31] |
|---|---|---|---|
| Adsorption capacity | 36 mg/g | 10 mg/g | 12 mg/g |
| Pseudo-First-Order Model | ||
| K1 (min−1) | qe (mg/g) | R2 |
| 6.836 ± 1.187 | 35.06 ± 0.92 | 0.9757 |
| Pseudo-Second-Order Model | ||
| K2 (min−1) | qe (mg/g) | R2 |
| 4.061 3.076 | 34.35 3.08 | 0.6418 |
Disclaimer/Publisher’s Note: The statements, opinions and data contained in all publications are solely those of the individual author(s) and contributor(s) and not of MDPI and/or the editor(s). MDPI and/or the editor(s) disclaim responsibility for any injury to people or property resulting from any ideas, methods, instructions or products referred to in the content. |
© 2024 by the authors. Licensee MDPI, Basel, Switzerland. This article is an open access article distributed under the terms and conditions of the Creative Commons Attribution (CC BY) license (https://creativecommons.org/licenses/by/4.0/).
Share and Cite
Liao, L.; Chen, H.; He, C.; Dodbiba, G.; Fujita, T. Boron Removal in Aqueous Solutions Using Adsorption with Sugarcane Bagasse Biochar and Ammonia Nanobubbles. Materials 2024, 17, 4895. https://doi.org/10.3390/ma17194895
Liao L, Chen H, He C, Dodbiba G, Fujita T. Boron Removal in Aqueous Solutions Using Adsorption with Sugarcane Bagasse Biochar and Ammonia Nanobubbles. Materials. 2024; 17(19):4895. https://doi.org/10.3390/ma17194895
Chicago/Turabian StyleLiao, Lianying, Hao Chen, Chunlin He, Gjergj Dodbiba, and Toyohisa Fujita. 2024. "Boron Removal in Aqueous Solutions Using Adsorption with Sugarcane Bagasse Biochar and Ammonia Nanobubbles" Materials 17, no. 19: 4895. https://doi.org/10.3390/ma17194895