
Effect of Donor Nb(V) Doping on the Surface Reactivity, Electrical, Optical and Photocatalytic Properties of Nanocrystalline TiO2

 , and
, and 
Abstract
1. Introduction
2. Materials and Methods
3. Results and Discussion
3.1. Study of Optical Properties
3.2. Study of Electrical Properties
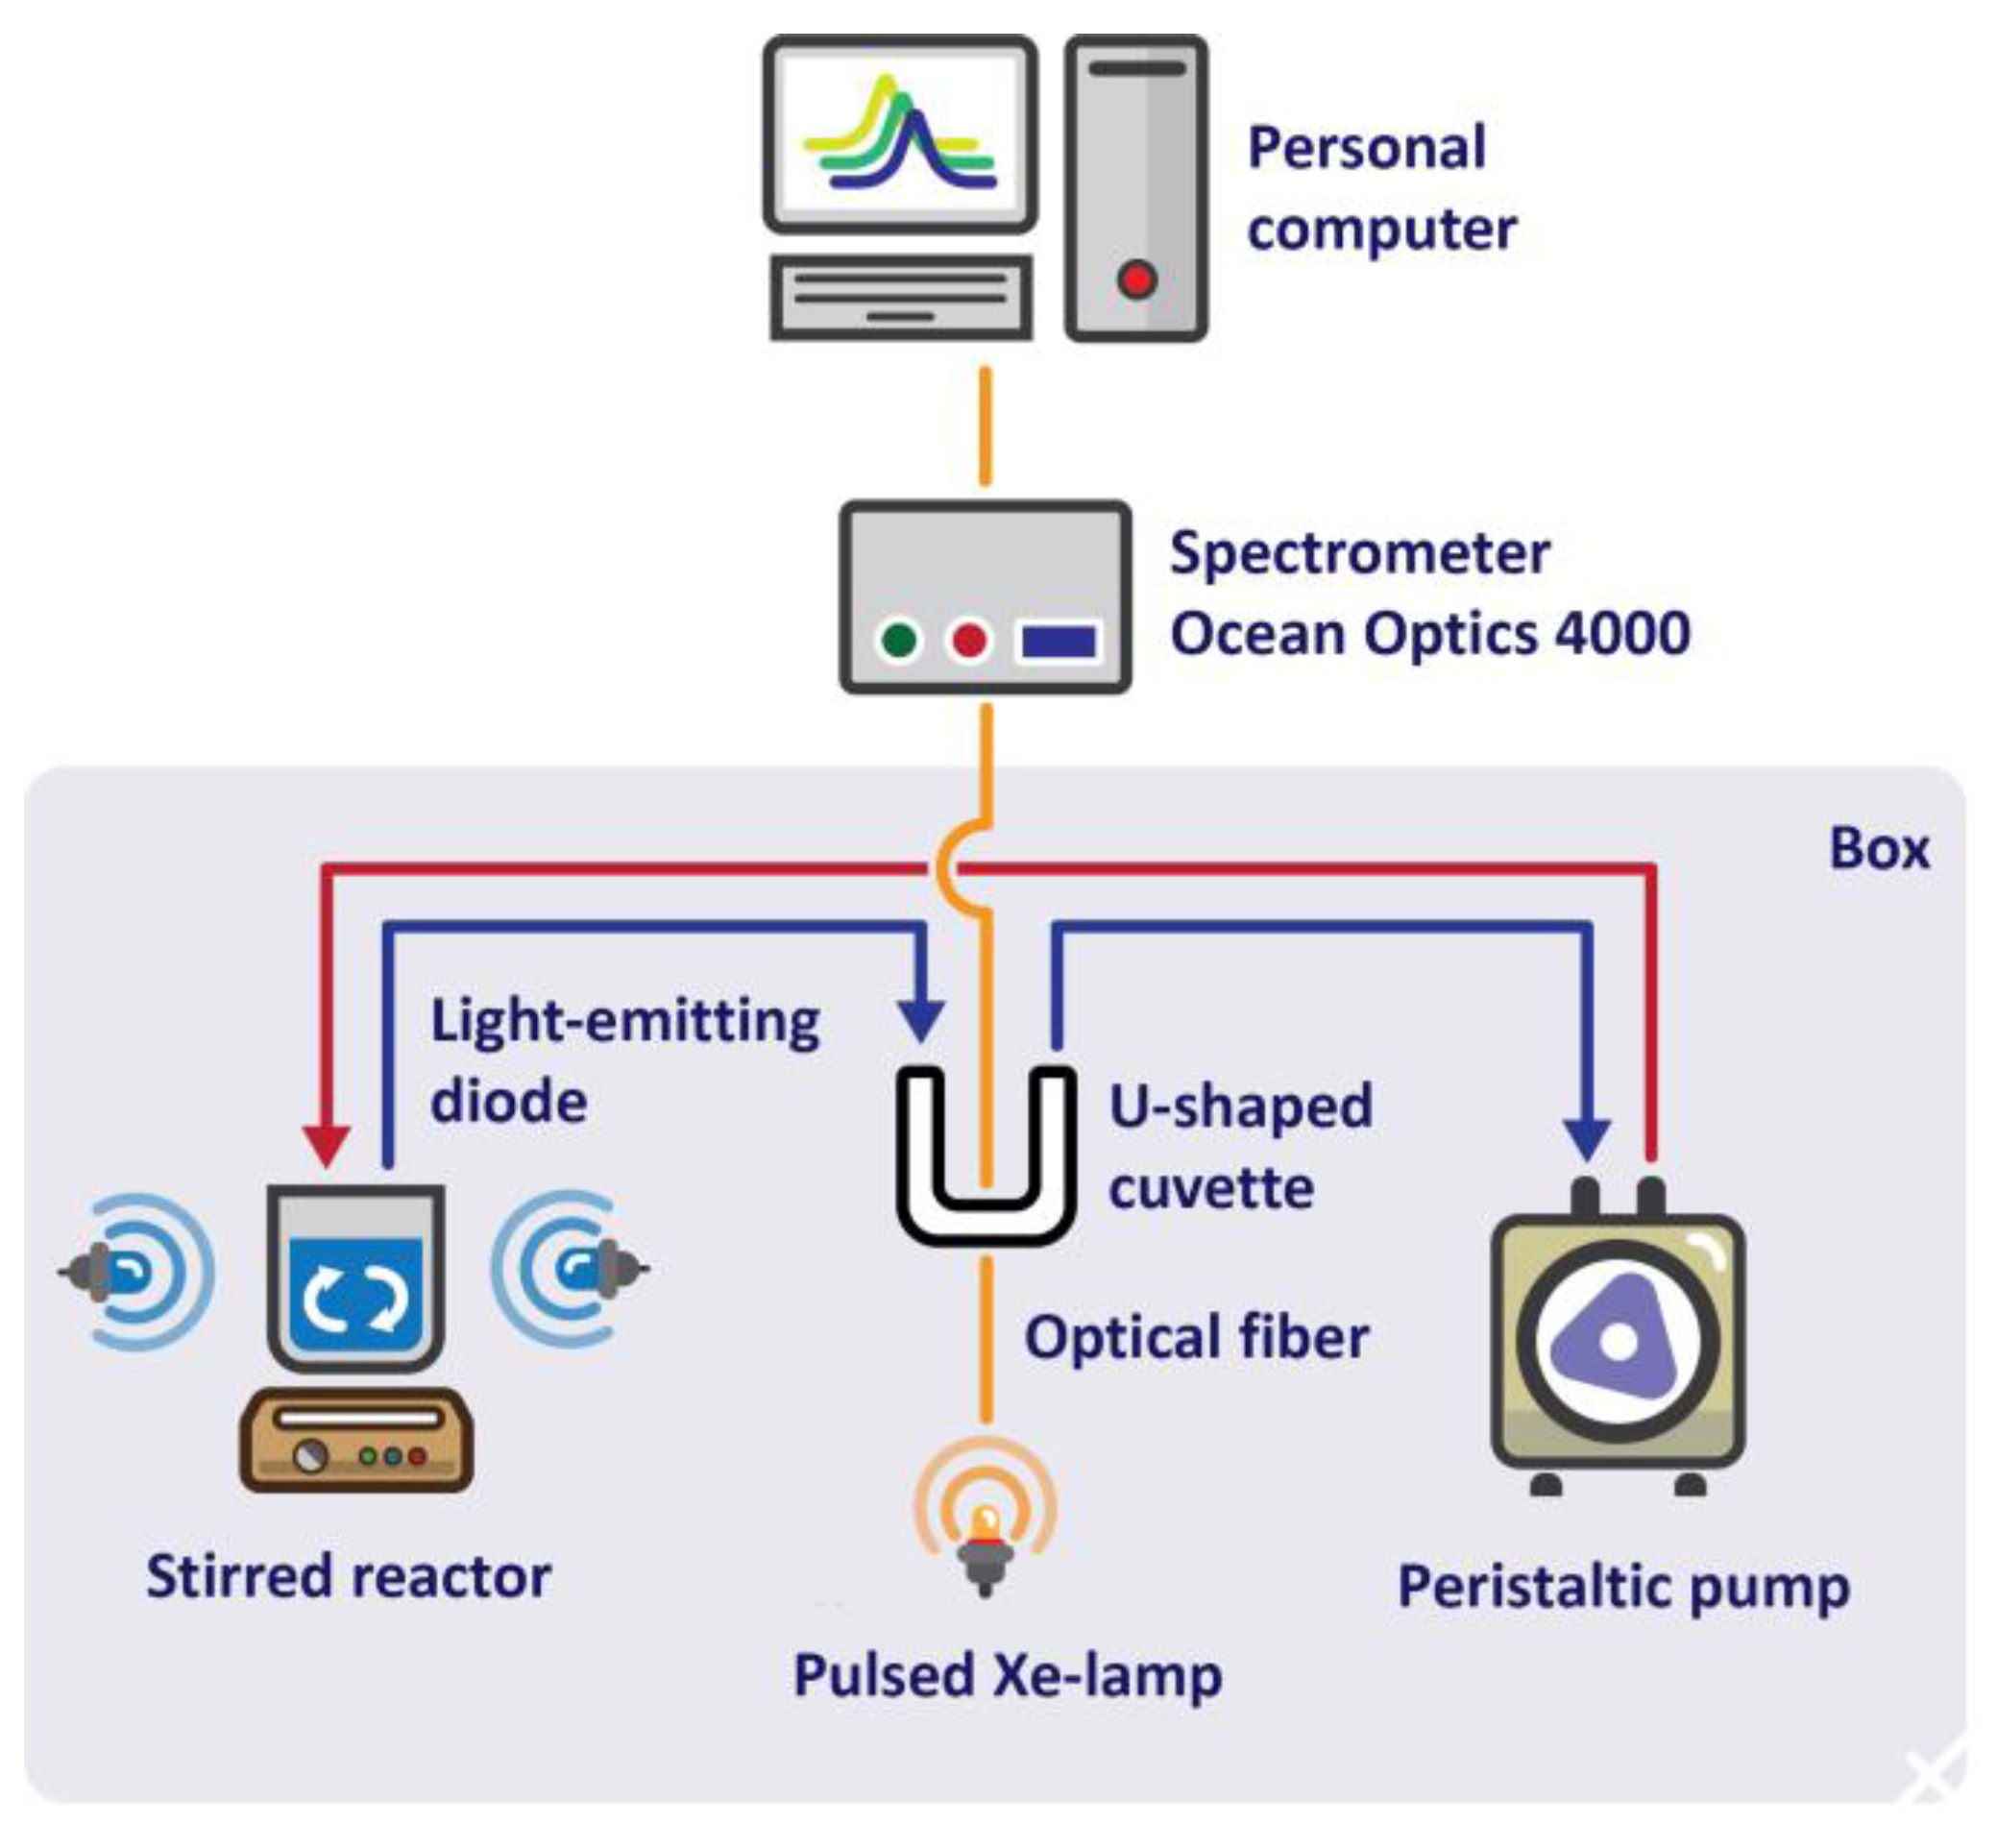
3.3. Conducting a Photocatalytic Experiment
3.4. Study of Catalytic Properties of Materials
4. Conclusions
Supplementary Materials
Author Contributions
Funding
Institutional Review Board Statement
Informed Consent Statement
Data Availability Statement
Acknowledgments
Conflicts of Interest
References
- Scirè, S.; Fiorenza, R.; Bellardita, M.; Palmisano, L. 21—Catalytic Applications of TiO2. In Metal Oxides; Parrino, F., Palmisano, L., Eds.; Elsevier: Amsterdam, The Netherlands, 2021; pp. 637–679. ISBN 978-0-12-819960-2. [Google Scholar]
- Lee, V.J. Catalysis on Wide-Band-Gap Semiconductors. J. Chem. Phys. 2003, 55, 2905–2913. [Google Scholar] [CrossRef]
- Armaković, S.J.; Savanović, M.M.; Armaković, S. Titanium Dioxide as the Most Used Photocatalyst for Water Purification: An Overview. Catalysts 2023, 13, 26. [Google Scholar] [CrossRef]
- Li, Y.; Chen, F.; He, R.; Wang, Y.; Tang, N. Semiconductor Photocatalysis for Water Purification. In Nanoscale Materials in Water Purification: Micro and Nano Technologies; Elsevier: Amsterdam, The Netherlands, 2019. [Google Scholar]
- Hunge, Y.M.; Yadav, A.A.; Kang, S.-W.; Mohite, B.M. Role of Nanotechnology in Photocatalysis Application. Recent Pat. Nanotechnol. 2023, 17, 5–7. [Google Scholar] [CrossRef] [PubMed]
- Schneider, J.; Matsuoka, M.; Takeuchi, M.; Zhang, J.; Horiuchi, Y.; Anpo, M.; Bahnemann, D.W. Understanding TiO2 Photocatalysis: Mechanisms and Materials. Chem. Rev. 2014, 114, 9919–9986. [Google Scholar] [CrossRef] [PubMed]
- Hunge, Y.M.; Yadav, A.A.; Kang, S.W.; Kim, H. Photocatalytic Degradation of Tetracycline Antibiotics Using Hydrothermally Synthesized Two-Dimensional Molybdenum Disulfide/Titanium Dioxide Composites. J. Colloid Interface Sci. 2022, 606, 454–463. [Google Scholar] [CrossRef] [PubMed]
- Bharti, B.; Kumar, S.; Lee, H.-N.; Kumar, R. Formation of Oxygen Vacancies and Ti3+ State in TiO2 Thin Film and Enhanced Optical Properties by Air Plasma Treatment. Sci. Rep. 2016, 6, 32355. [Google Scholar] [CrossRef]
- Kumaravel, V.; Rhatigan, S.; Mathew, S.; Michel, M.C.; Bartlett, J.; Nolan, M.; Hinder, S.J.; Gascó, A.; Ruiz-Palomar, C.; Hermosilla, D. Mo Doped TiO2: Impact on Oxygen Vacancies, Anatase Phase Stability and Photocatalytic Activity. J. Phys. Mater. 2020, 3, 25008. [Google Scholar] [CrossRef]
- Teleki, A.; Bjelobrk, N.; Pratsinis, S.E. Flame-Made Nb- and Cu-Doped TiO2 Sensors for CO and Ethanol. Sens. Actuators B Chem. 2008, 130, 449–457. [Google Scholar] [CrossRef]
- Michalow, K.A.; Flak, D.; Heel, A.; Parlinska-Wojtan, M.; Rekas, M.; Graule, T. Effect of Nb Doping on Structural, Optical and Photocatalytic Properties of Flame-Made TiO2 Nanopowder. Environ. Sci. Pollut. Res. 2012, 19, 3696–3708. [Google Scholar] [CrossRef]
- Liang, Y.; Sun, S.; Deng, T.; Ding, H.; Chen, W.; Chen, Y. The Preparation of TiO2 Film by the Sol-Gel Method and Evaluation of Its Self-Cleaning Property. Materials 2018, 11, 450. [Google Scholar] [CrossRef]
- Liu, R.; Ren, Y.; Wang, J.; Wang, Y.; Jia, J.; Zhao, G. Preparation of Nb-Doped TiO2 Films by Sol-Gel Method and Their Dual-Band Electrochromic Properties. Ceram. Int. 2021, 47, 31834–31842. [Google Scholar] [CrossRef]
- Han, X.; Li, C.; Tang, P.; Feng, C.; Yue, X.; Zhang, W. Solid-Phase Synthesis of Titanium Dioxide Micro-Nanostructures. ACS Omega 2022, 7, 35538–35544. [Google Scholar] [CrossRef] [PubMed]
- Zaitsev, S.V.; Moon, J.; Takagi, H.; Awano, M. Preparation and Characterization of Nanocrystalline Doped TiO2. Adv. Powder Technol. 2000, 11, 211–220. [Google Scholar] [CrossRef]
- Tolek, W.; Khruechao, K.; Pongthawornsakun, B.; Mekasuwandumrong, O.; Aires, F.J.C.S.; Weerachawanasak, P.; Panpranot, J. Flame Spray-Synthesized Pt-Co/TiO2 Catalysts for the Selective Hydrogenation of Furfural to Furfuryl Alcohol. Catal. Commun. 2021, 149, 106246. [Google Scholar] [CrossRef]
- Kuranov, D.; Platonov, V.; Khmelevsky, N.; Bozhev, I.; Maksimov, S.; Rumyantseva, M.; Krivetskiy, V. Effect of Nb(V) Doping on the Structure and Oxygen Chemisorption on Nanocrystalline TiO2. ChemistrySelect 2022, 7, e202202644. [Google Scholar] [CrossRef]
- Krivetskiy, V.; Zamanskiy, K.; Beltyukov, A.; Asachenko, A.; Topchiy, M.; Nechaev, M.; Garshev, A.; Krotova, A.; Filatova, D.; Maslakov, K. Effect of AuPd Bimetal Sensitization on Gas Sensing Performance of Nanocrystalline SnO2 Obtained by Single Step Flame Spray Pyrolysis. Nanomaterials 2019, 9, 728. [Google Scholar] [CrossRef] [PubMed]
- Dorow-Gerspach, D.; Mergel, D.; Wuttig, M. Effects of Different Amounts of Nb Doping on Electrical, Optical and Structural Properties in Sputtered TiO2−x Films. Crystals 2021, 11, 301. [Google Scholar] [CrossRef]
- Kuranov, D.; Platonov, V.; Konstantinova, E.; Grebenkina, A.; Rumyantseva, M.; Polomoshnov, S.; Krivetskiy, V. Gas Sensing with Nb(V) Doped Nanocrystalline TiO2: Sensitivity and Long-Term Stability Study. Sens. Actuators B Chem. 2023, 396, 134618. [Google Scholar] [CrossRef]
- Marikutsa, A.; Novikova, A.; Rumyantseva, M.; Khmelevsky, N.; Gaskov, A. Comparison of Au-Functionalized Semiconductor Metal Oxides in Sensitivity to VOC. Sens. Actuators B Chem. 2021, 326, 128980. [Google Scholar] [CrossRef]
- Alalwan, H.; Alminshid, A. An In-Situ DRIFTS Study of Acetone Adsorption Mechanism on TiO2 Nanoparticles. Spectrochim. Acta Part A Mol. Biomol. Spectrosc. 2020, 229, 117990. [Google Scholar] [CrossRef]
- Kong, L.; Wang, C.; Wan, F.; Li, L.; Zhang, X.; Liu, Y. Transparent Nb-Doped TiO2 Films with the [001] Preferred Orientation for Efficient Photocatalytic Oxidation Performance. Dalt. Trans. 2017, 46, 15363–15372. [Google Scholar] [CrossRef] [PubMed]
- Stefik, M.; Heiligtag, F.J.; Niederberger, M.; Grätzel, M. Improved Nonaqueous Synthesis of TiO2 for Dye-Sensitized Solar Cells. ACS Nano 2013, 7, 8981–8989. [Google Scholar] [CrossRef] [PubMed]
- Lü, X.; Mou, X.; Wu, J.; Zhang, D.; Zhang, L.; Huang, F.; Xu, F.; Huang, S. Improved-Performance Dye-Sensitized Solar Cells Using Nb-Doped TiO2 Electrodes: Efficient Electron Injection and Transfer. Adv. Funct. Mater. 2010, 20, 509–515. [Google Scholar] [CrossRef]
- Das, C.; Roy, P.; Yang, M.; Jha, H.; Schmuki, P. Nb Doped TiO2 Nanotubes for Enhanced Photoelectrochemical Water-Splitting. Nanoscale 2011, 3, 3094–3096. [Google Scholar] [CrossRef] [PubMed]
- Yang, M.; Kim, D.; Jha, H.; Lee, K.; Paul, J.; Schmuki, P. Nb Doping of TiO2 Nanotubes for an Enhanced Efficiency of Dye-Sensitized Solar Cells. Chem. Commun. 2011, 47, 2032–2034. [Google Scholar] [CrossRef]
- Su, H.; Huang, Y.-T.; Chang, Y.-H.; Zhai, P.; Hau, N.Y.; Cheung, P.C.H.; Yeh, W.-T.; Wei, T.-C.; Feng, S.-P. The Synthesis of Nb-Doped TiO2 Nanoparticles for Improved-Performance Dye Sensitized Solar Cells. Electrochim. Acta 2015, 182, 230–237. [Google Scholar] [CrossRef]
- Chandiran, A.K.; Sauvage, F.; Casas-Cabanas, M.; Comte, P.; Zakeeruddin, S.M.; Graetzel, M. Doping a TiO2 Photoanode with Nb5+ to Enhance Transparency and Charge Collection Efficiency in Dye-Sensitized Solar Cells. J. Phys. Chem. C 2010, 114, 15849–15856. [Google Scholar] [CrossRef]
- Emeline, A.V.; Furubayashi, Y.; Zhang, X.; Jin, M.; Murakami, T.; Fujishima, A. Photoelectrochemical Behavior of Nb-Doped TiO2 Electrodes. J. Phys. Chem. B 2005, 109, 24441–24444. [Google Scholar] [CrossRef]
- Yang, S.-L.; Wu, J.-M. Effects of Nb2O5 in (Ba, Bi, Nb)-Added TiO2 Ceramic Varistors. J. Mater. Res. 1995, 10, 345–352. [Google Scholar] [CrossRef]
- Khan, S.; Cho, H.; Kim, D.; Han, S.S.; Lee, K.H.; Cho, S.-H.; Song, T.; Choi, H. Defect Engineering toward Strong Photocatalysis of Nb-Doped Anatase TiO2: Computational Predictions and Experimental Verifications. Appl. Catal. B Environ. 2017, 206, 520–530. [Google Scholar] [CrossRef]
- Chung, F.H. Quantitative Interpretation of X-Ray Diffraction Patterns of Mixtures. I. Matrix-Flushing Method for Quantitative Multicomponent Analysis. J. Appl. Crystallogr. 1974, 7, 519–525. [Google Scholar] [CrossRef]
- Kubelka, P.; Munk, F. A Contribution to the Optics of Pigments. Z. Tech. Phys 1931, 12, 593–599. [Google Scholar]
- López, R.; Gómez, R. Band-Gap Energy Estimation from Diffuse Reflectance Measurements on Sol–Gel and Commercial TiO2: A Comparative Study. J. Sol-Gel Sci. Technol. 2012, 61, 1–7. [Google Scholar] [CrossRef]
- Atherton, K.; Newbold, G.; Hockey, J.A. Infra-Red Spectroscopic Studies of Zinc Oxide Surfaces. Discuss. Faraday Soc. 1971, 52, 33–43. [Google Scholar] [CrossRef]
- Socrates, G. Infrared and Raman Characteristic Group Frequencies: Tables and Charts; John Wiley & Sons: Hoboken, NJ, USA, 2004; ISBN 0470093072. [Google Scholar]
- Nakamoto, K. Infrared and Raman Spectra of Inorganic and Coordination Compounds, Part B: Applications in Coordination, Organometallic, and Bioinorganic Chemistry; John Wiley & Sons: Hoboken, NJ, USA, 2009; ISBN 0470405872. [Google Scholar]
- Seki, T.; Chiang, K.-Y.; Yu, C.-C.; Yu, X.; Okuno, M.; Hunger, J.; Nagata, Y.; Bonn, M. The Bending Mode of Water: A Powerful Probe for Hydrogen Bond Structure of Aqueous Systems. J. Phys. Chem. Lett. 2020, 11, 8459–8469. [Google Scholar] [CrossRef]
- Bansal, J.; Tabassum, R.; Swami, S.K.; Bishnoi, S.; Vashishtha, P.; Gupta, G.; Sharma, S.N.; Hafiz, A.K. Performance Analysis of Anomalous Photocatalytic Activity of Cr-Doped TiO2 Nanoparticles [Cr(X)TiO2(1 − X)]. Appl. Phys. A 2020, 126, 363. [Google Scholar] [CrossRef]
- Stošić, D.; Bennici, S.; Pavlović, V.; Rakić, V.; Auroux, A. Tuning the Acidity of Niobia: Characterization and Catalytic Activity of Nb2O5–MeO2 (Me = Ti, Zr, Ce) Mesoporous Mixed Oxides. Mater. Chem. Phys. 2014, 146, 337–345. [Google Scholar] [CrossRef]
- Loudon, R. The Raman Effect in Crystals. Adv. Phys. 2001, 50, 813–864. [Google Scholar] [CrossRef]
- Verma, R.; Mantri, B.; Kumar Srivastava, A. Shape Control Synthesis, Characterizations, Mechanisms and Optical Properties of Larg Scaled Metal Oxide Nanostructures of ZnO and TiO2. Adv. Mater. Lett. 2015, 6, 324–333. [Google Scholar] [CrossRef]
- Bersani, D.; Lottici, P.P.; Ding, X.-Z. Phonon Confinement Effects in the Raman Scattering by TiO2 Nanocrystals. Appl. Phys. Lett. 1998, 72, 73–75. [Google Scholar] [CrossRef]
- Zhang, W.F.; Zhang, M.S.; Yin, Z.; Chen, Q. Photoluminescence in Anatase Titanium Dioxide Nanocrystals. Appl. Phys. B 2000, 70, 261–265. [Google Scholar] [CrossRef]
- Mazza, T.; Barborini, E.; Piseri, P.; Milani, P.; Cattaneo, D.; Bassi, A.L.; Bottani, C.E.; Ducati, C. Raman Spectroscopy Characterization of TiO2 Rutile Nanocrystals. Phys. Rev. B 2007, 75, 45416. [Google Scholar] [CrossRef]
- Dias, J.A.; Freire, A.L.F.; Girotto, I.; Del Roveri, C.; Mastelaro, V.R.; Paris, E.C.; Giraldi, T.R. Phase Evolution and Optical Properties of Nanometric Mn-Doped TiO2 Pigments. Mater. Today Commun. 2021, 27, 102295. [Google Scholar] [CrossRef]
- Saha, M.; Ghosh, S.; Paul, S.; Dalal, B.; De, S.K. Nb-Dopant-Induced Tuning of Optical and Electrical Property of Anatase TiO2 Nanocrystals. ChemistrySelect 2018, 3, 6654–6664. [Google Scholar] [CrossRef]
- Vos, K.; Krusemeyer, H.J. Low Temperature Electroreflectance of TiO2. Solid State Commun. 1974, 15, 949–952. [Google Scholar] [CrossRef]
- Pankove, J.I. Optical Processes in Semiconductors; Courier Corporation: Gloucester, MA, USA, 1975; ISBN 0486602753. [Google Scholar]
- Guang-Lei, T.; Hong-Bo, H.E.; Jian-Da, S. Effect of Microstructure of TiO2 Thin Films on Optical Band Gap Energy. Chin. Phys. Lett. 2005, 22, 1787. [Google Scholar] [CrossRef]
- Mulmi, D.D.; Sekiya, T.; Kamiya, N.; Kurita, S.; Murakami, Y.; Kodaira, T. Optical and Electric Properties of Nb-Doped Anatase TiO2 Single Crystal. J. Phys. Chem. Solids 2004, 65, 1181–1185. [Google Scholar] [CrossRef]
- Khomenko, V.M.; Langer, K.; Rager, H.; Fett, A. Electronic Absorption by Ti3+ Ions and Electron Delocalization in Synthetic Blue Rutile. Phys. Chem. Miner. 1998, 25, 338–346. [Google Scholar] [CrossRef]
- Bally, A. Electronic Properties of Nano-Crystalline Titanium Dioxide Thin Films. EPFL 1999, 2094, 140. [Google Scholar]
- Nakamura, I.; Negishi, N.; Kutsuna, S.; Ihara, T.; Sugihara, S.; Takeuchi, K. Role of Oxygen Vacancy in the Plasma-Treated TiO2 Photocatalyst with Visible Light Activity for NO Removal. J. Mol. Catal. A Chem. 2000, 161, 205–212. [Google Scholar] [CrossRef]
- Prabhakarrao, N.; Rao, T.S.; Lakshmi, K.V.D.; Divya, G.; Jaishree, G.; Raju, I.M.; Alim, S.A. Enhanced Photocatalytic Performance of Nb Doped TiO2/Reduced Graphene Oxide Nanocomposites over Rhodamine B Dye under Visible Light Illumination. Sustain. Environ. Res. 2021, 31, 37. [Google Scholar] [CrossRef]
- Wang, H.-Y.; Chen, J.; Xiao, F.-X.; Zheng, J.; Liu, B. Doping-Induced Structural Evolution from Rutile to Anatase: Formation of Nb-Doped Anatase TiO2 Nanosheets with High Photocatalytic Activity. J. Mater. Chem. A 2016, 4, 6926–6932. [Google Scholar] [CrossRef]
- Silva, A.; Muche, D.; Dey, S.; Hotza, D.; Castro, R. Photocatalytic Nb2O5-Doped TiO2 Nanoparticles for Glazed Ceramic Tiles. Ceram. Int. 2015, 42, 5113–5122. [Google Scholar] [CrossRef]
- Li, X.D.; Han, X.J.; Wang, W.Y.; Liu, X.H.; Wang, Y.; Liu, X.R. Synthesis, Characterization and Photocatalytic Activity of Nb-Doped TiO2 Nanoparticles. Adv. Mater. Res. 2012, 455–456, 110–114. [Google Scholar] [CrossRef]
- Gunawan, P.; Mei, L.; Teo, J.; Ma, J.; Highfield, J.; Li, Q.; Zhong, Z. Ultrahigh Sensitivity of Au/1D α-Fe2O3 to Acetone and the Sensing Mechanism. Langmuir 2012, 28, 14090–14099. [Google Scholar] [CrossRef] [PubMed]
- Zaki, M.I.; Hasan, M.A.; Al-Sagheer, F.A.; Pasupulety, L. Surface Chemistry of Acetone on Metal Oxides: IR Observation of Acetone Adsorption and Consequent Surface Reactions on Silica—Alumina versus Silica and Alumina. Langmuir 2000, 16, 430–436. [Google Scholar] [CrossRef]
- Zaki, M.I.; Hasan, M.A.; Pasupulety, L. Surface Reactions of Acetone on Al2O3, TiO2, ZrO2, and CeO2: IR Spectroscopic Assessment of Impacts of the Surface Acid—Base Properties. Langmuir 2001, 17, 768–774. [Google Scholar] [CrossRef]
- Smith, B.C. The C=O Bond, Part IV: Acid Anhydrides. Spectroscopy 2018, 33, 16–20. [Google Scholar]
- Hadjiivanov, K.I.; Klissurski, D.G. Surface Chemistry of Titania (Anatase) and Titania-Supported Catalysts. Chem. Soc. Rev. 1996, 25, 61–69. [Google Scholar] [CrossRef]
- Hadjiivanov, K. Identification and Characterization of Surface Hydroxyl Groups by Infrared Spectroscopy. In Advances in Catalysis; Elsevier: Amsterdam, The Netherlands, 2014; Volume 57, pp. 99–318. ISBN 0360-0564. [Google Scholar]
- Rumyantseva, M.N.; Makeeva, E.A.; Badalyan, S.M.; Zhukova, A.A.; Gaskov, A.M. Nanocrystalline SnO2 and In2O3 as Materials for Gas Sensors: The Relationship between Microstructure and Oxygen Chemisorption. Thin Solid Films 2009, 518, 1283–1288. [Google Scholar] [CrossRef]
- Jeong, N.C.; Lee, J.S.; Tae, E.L.; Lee, Y.J.; Yoon, K.B. Acidity Scale for Metal Oxides and Sanderson’s Electronegativities of Lanthanide Elements. Angew. Chemie Int. Ed. 2008, 47, 10128–10132. [Google Scholar] [CrossRef] [PubMed]


| Material | χXRF (Nb) [mol%] | χXPS (Nb) [mol%] | dXRD ± 2 [nm] | Normal Particle Size Distribution (TEM, nm) | Anatase/ Rutile Ratio | Sspec, m2/g | Agglomer. Degree, dBET/dXRD | Osurf/ Olatt (XPS) | |
|---|---|---|---|---|---|---|---|---|---|
| Anatase | Rutile | ||||||||
| TiO2 | 0 | 0 | 21 | 23 | 14 ± 7 | 6.9 | 34 ± 2 | 2.1 | 0.14 |
| TiO2-Nb-1 | 1.3 ± 0.1 | 0.7 | 21 | 26 | - | 8.7 | 41 ± 3 | 1.7 | 0.19 |
| TiO2-Nb-2 | 2.4 ± 0.2 | 1.6 | 20 | 28 | - | 12.0 | 49 ± 3 | 1.4 | 0.20 |
| TiO2-Nb-4 | 4.7 ± 0.4 | 3.4 | 21 | 26 | 13 ± 5 | 12.7 | 66 ± 5 | 1.0 | 0.21 |
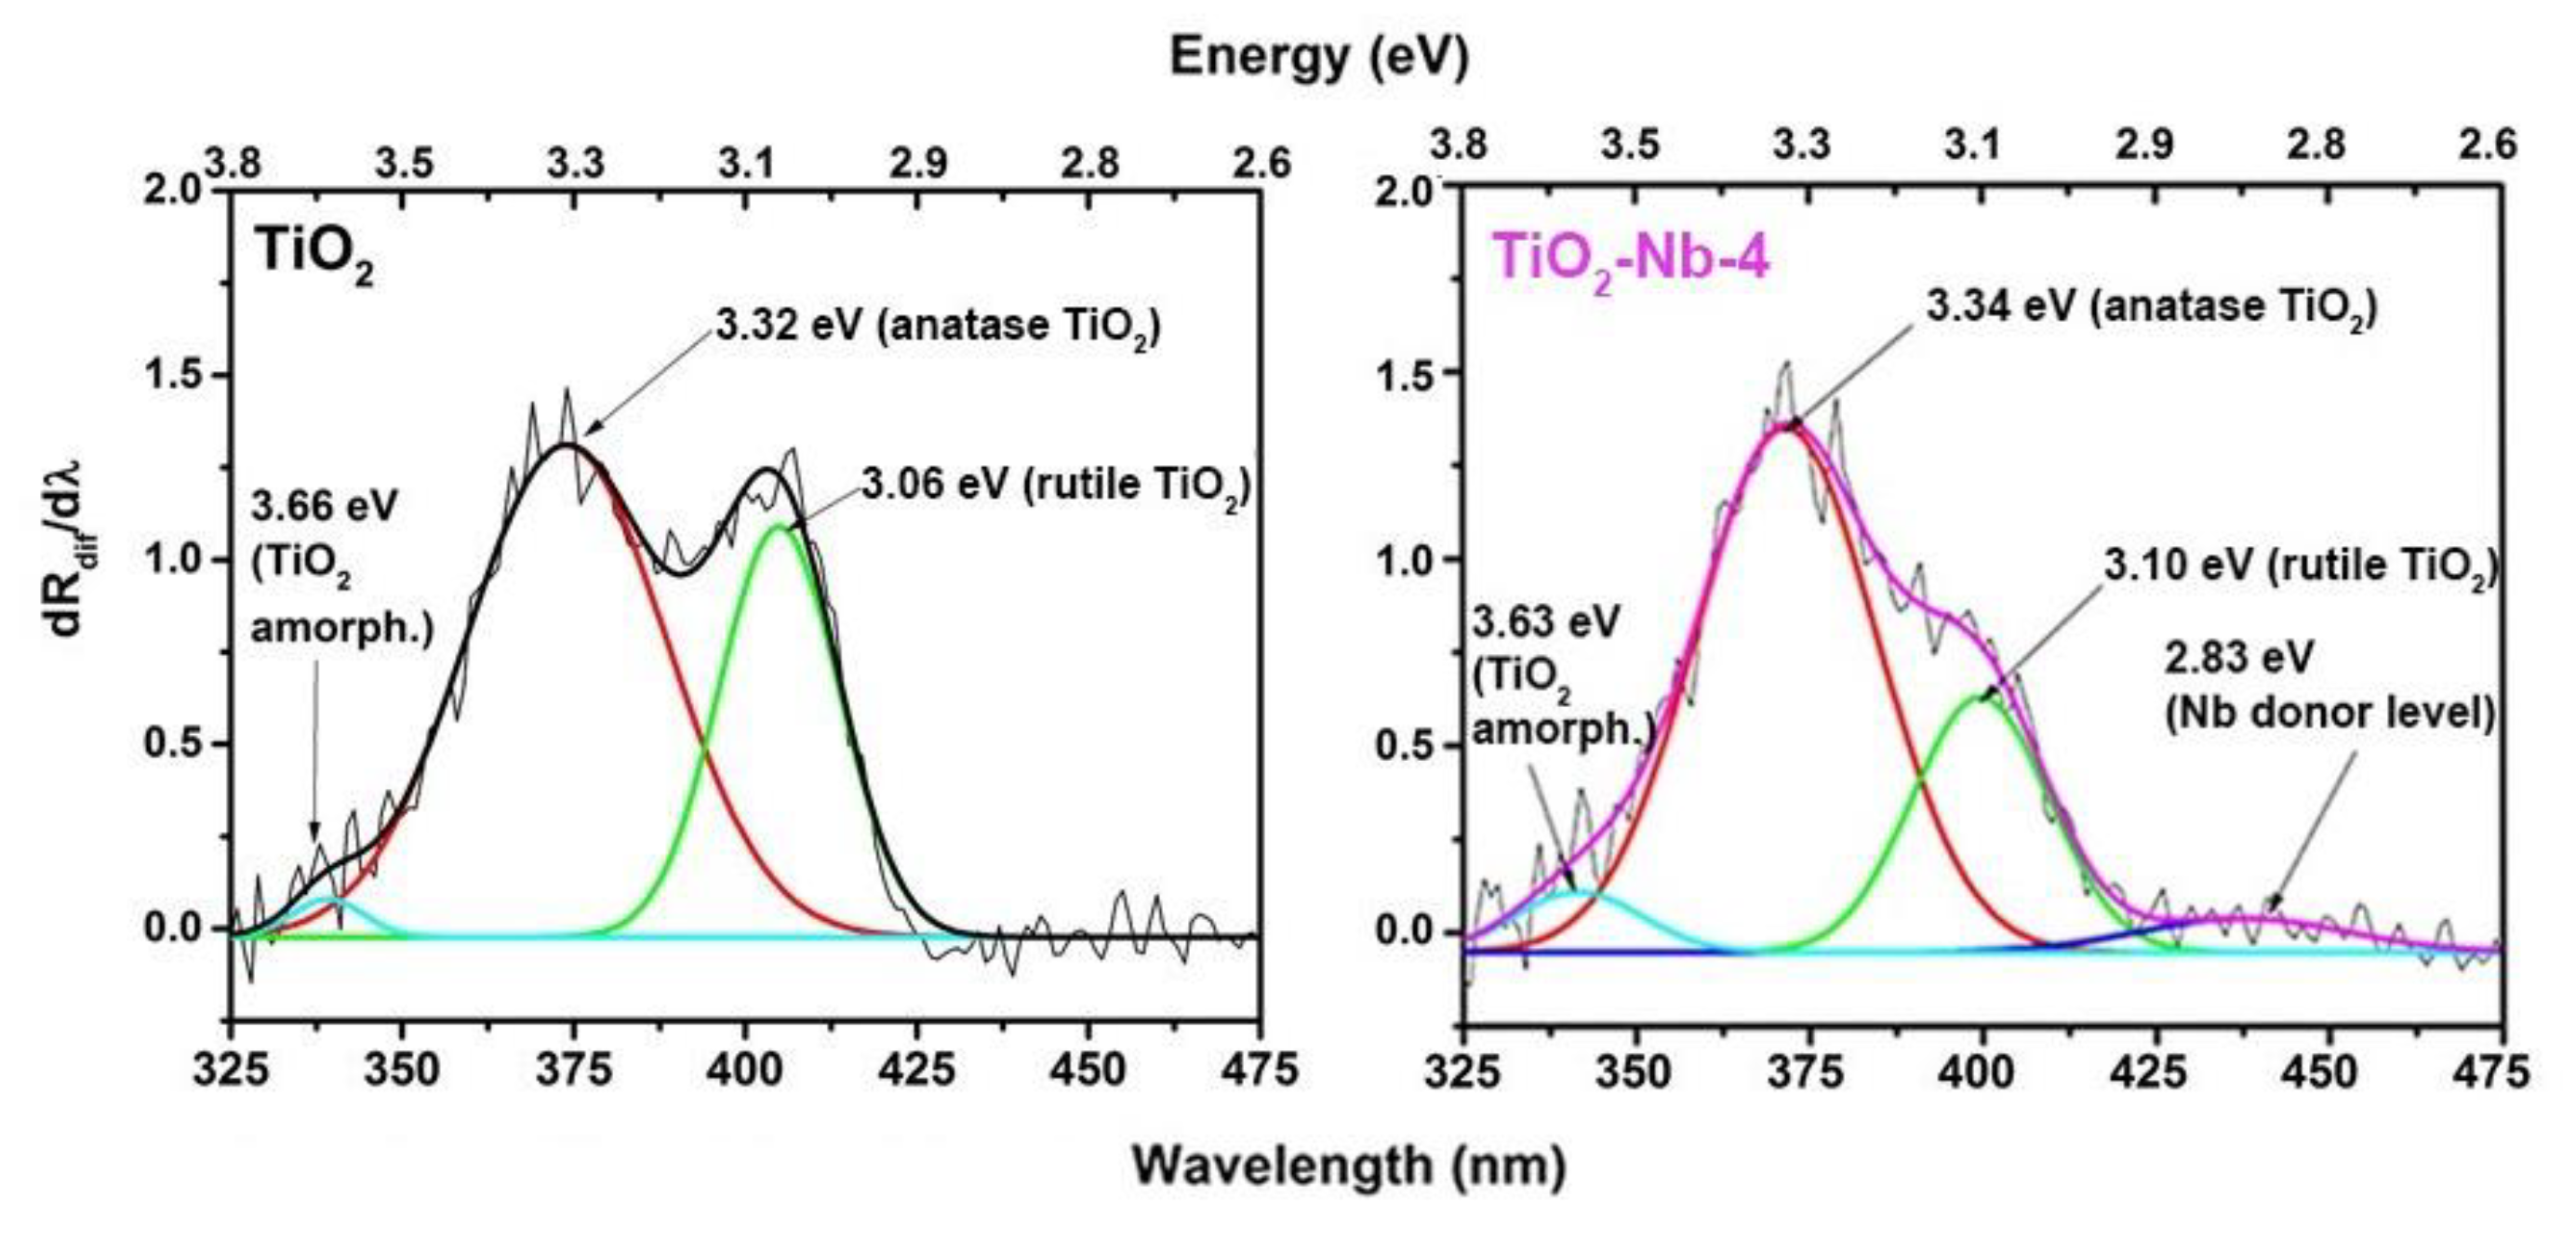
| Optical Transition (eV) | TiO2 | TiO2-Nb-1 | TiO2-Nb-2 | TiO2-Nb-4 |
|---|---|---|---|---|
| E1 (amorph) | 3.66 ± 0.01 | 3.63 ± 0.01 | 3.64 ± 0.01 | 3.63 ± 0.01 |
| E2 (anatase) | 3.32 ± 0.02 | 3.33 ± 0.02 | 3.33 ± 0.02 | 3.33 ± 0.02 |
| E3 (rutile) | 3.06 ± 0.04 | 3.10 ± 0.04 | 3.11 ± 0.04 | 3.10 ± 0.04 |
| E4 (donor level) | - | 2.83 ± 0.05 | 2.83 ± 0.05 | 2.83 ± 0.05 |
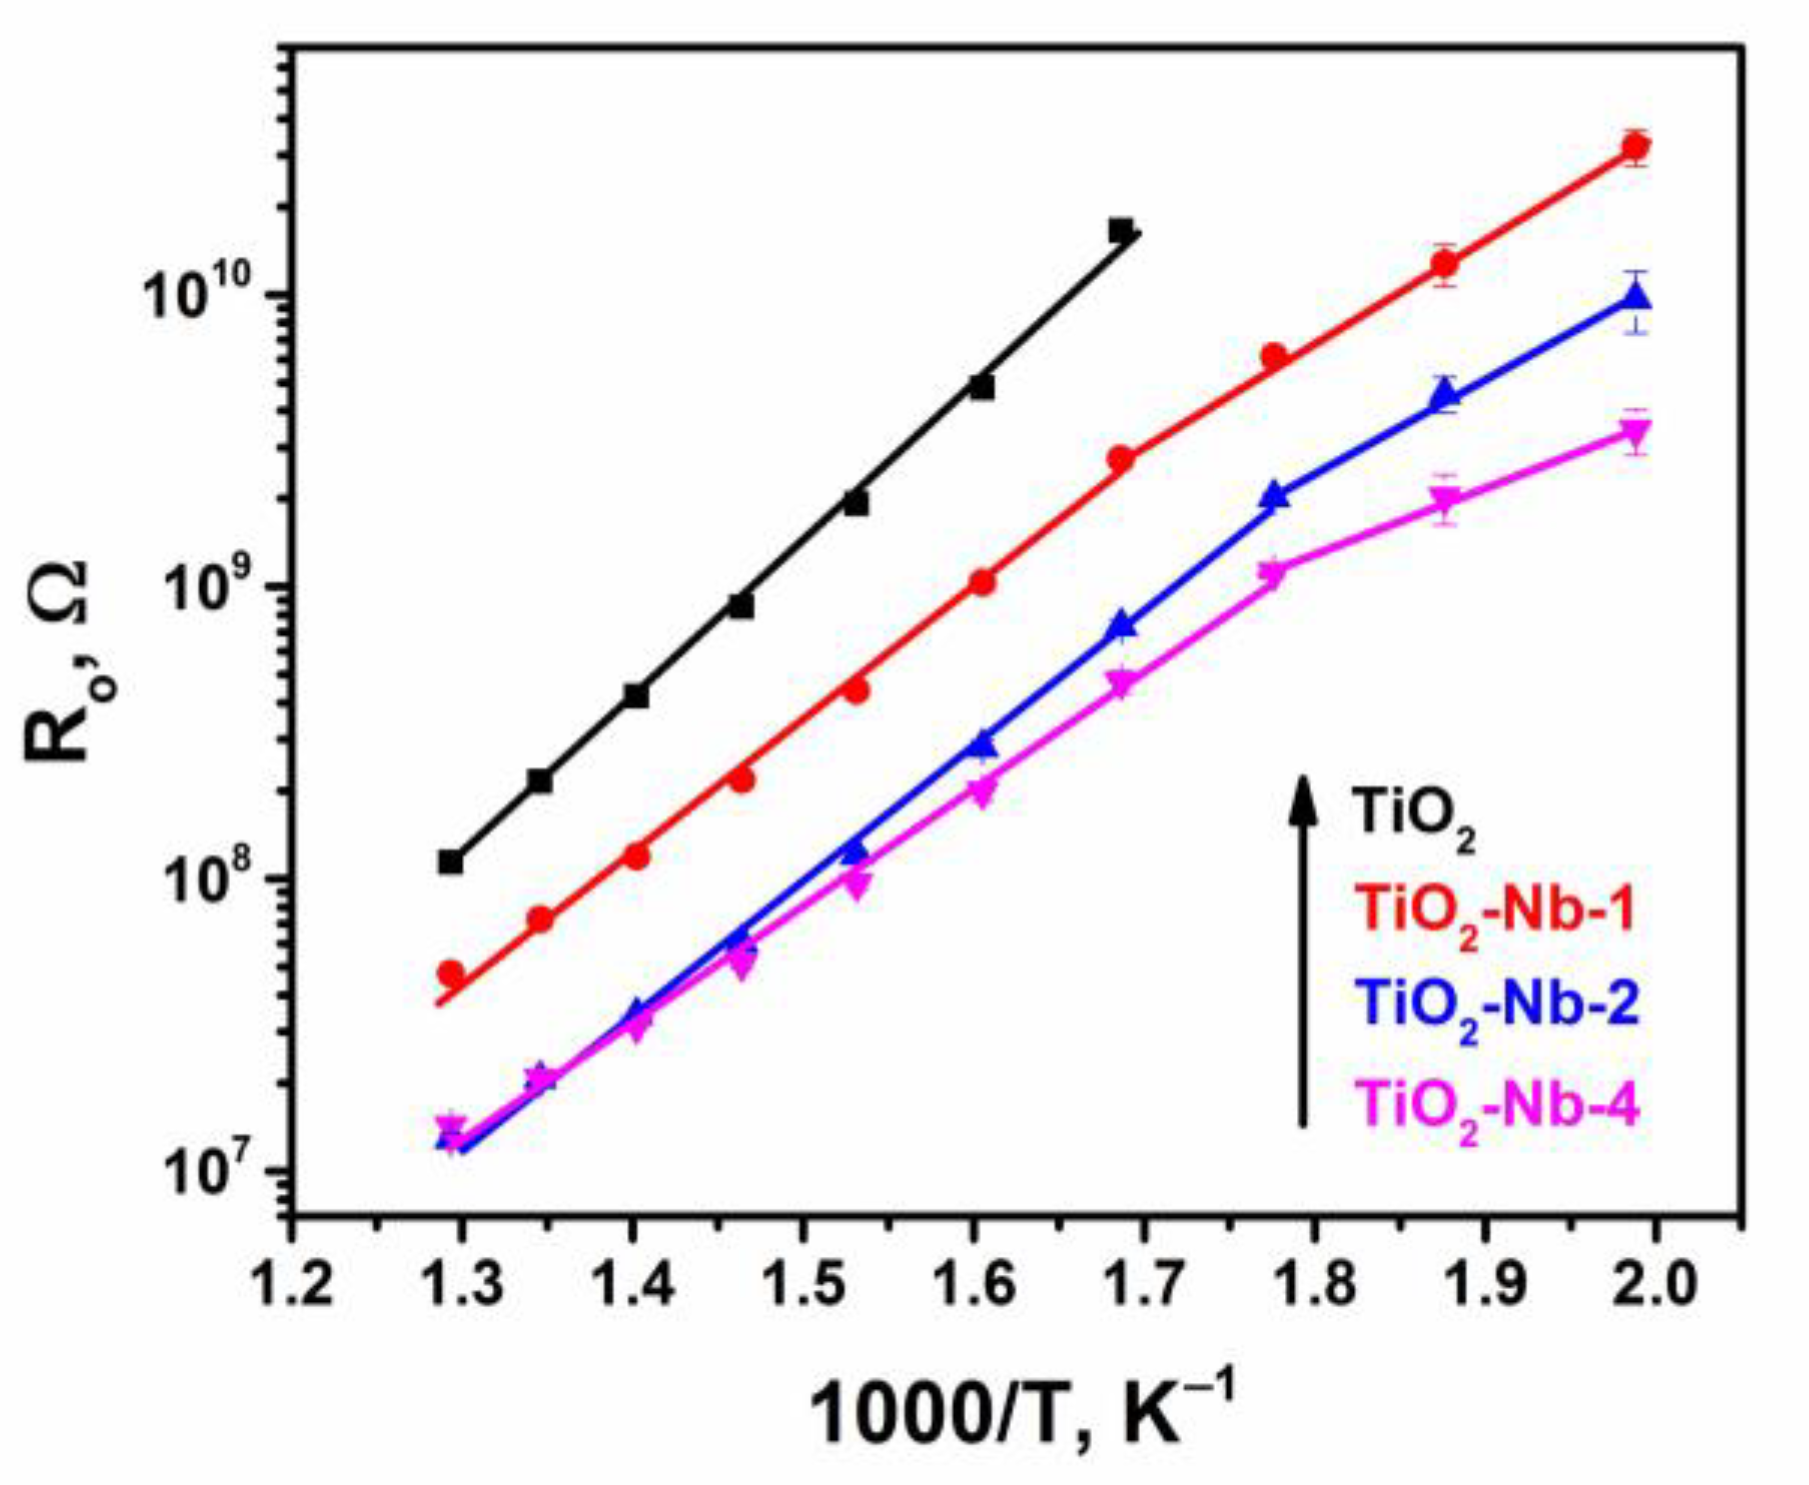
| Material | Eact, eV | |
|---|---|---|
| 280–500 °C | 200–280 °C | |
| TiO2 | 0.90 ± 0.03 | - |
| TiO2-Nb-1 | 0.75 ± 0.01 | 0.62 ± 0.02 |
| TiO2-Nb-2 | 0.75 ± 0.01 | 0.58 ± 0.01 |
| TiO2-Nb-4 | 0.68 ± 0.03 | 0.40 ± 0.01 |
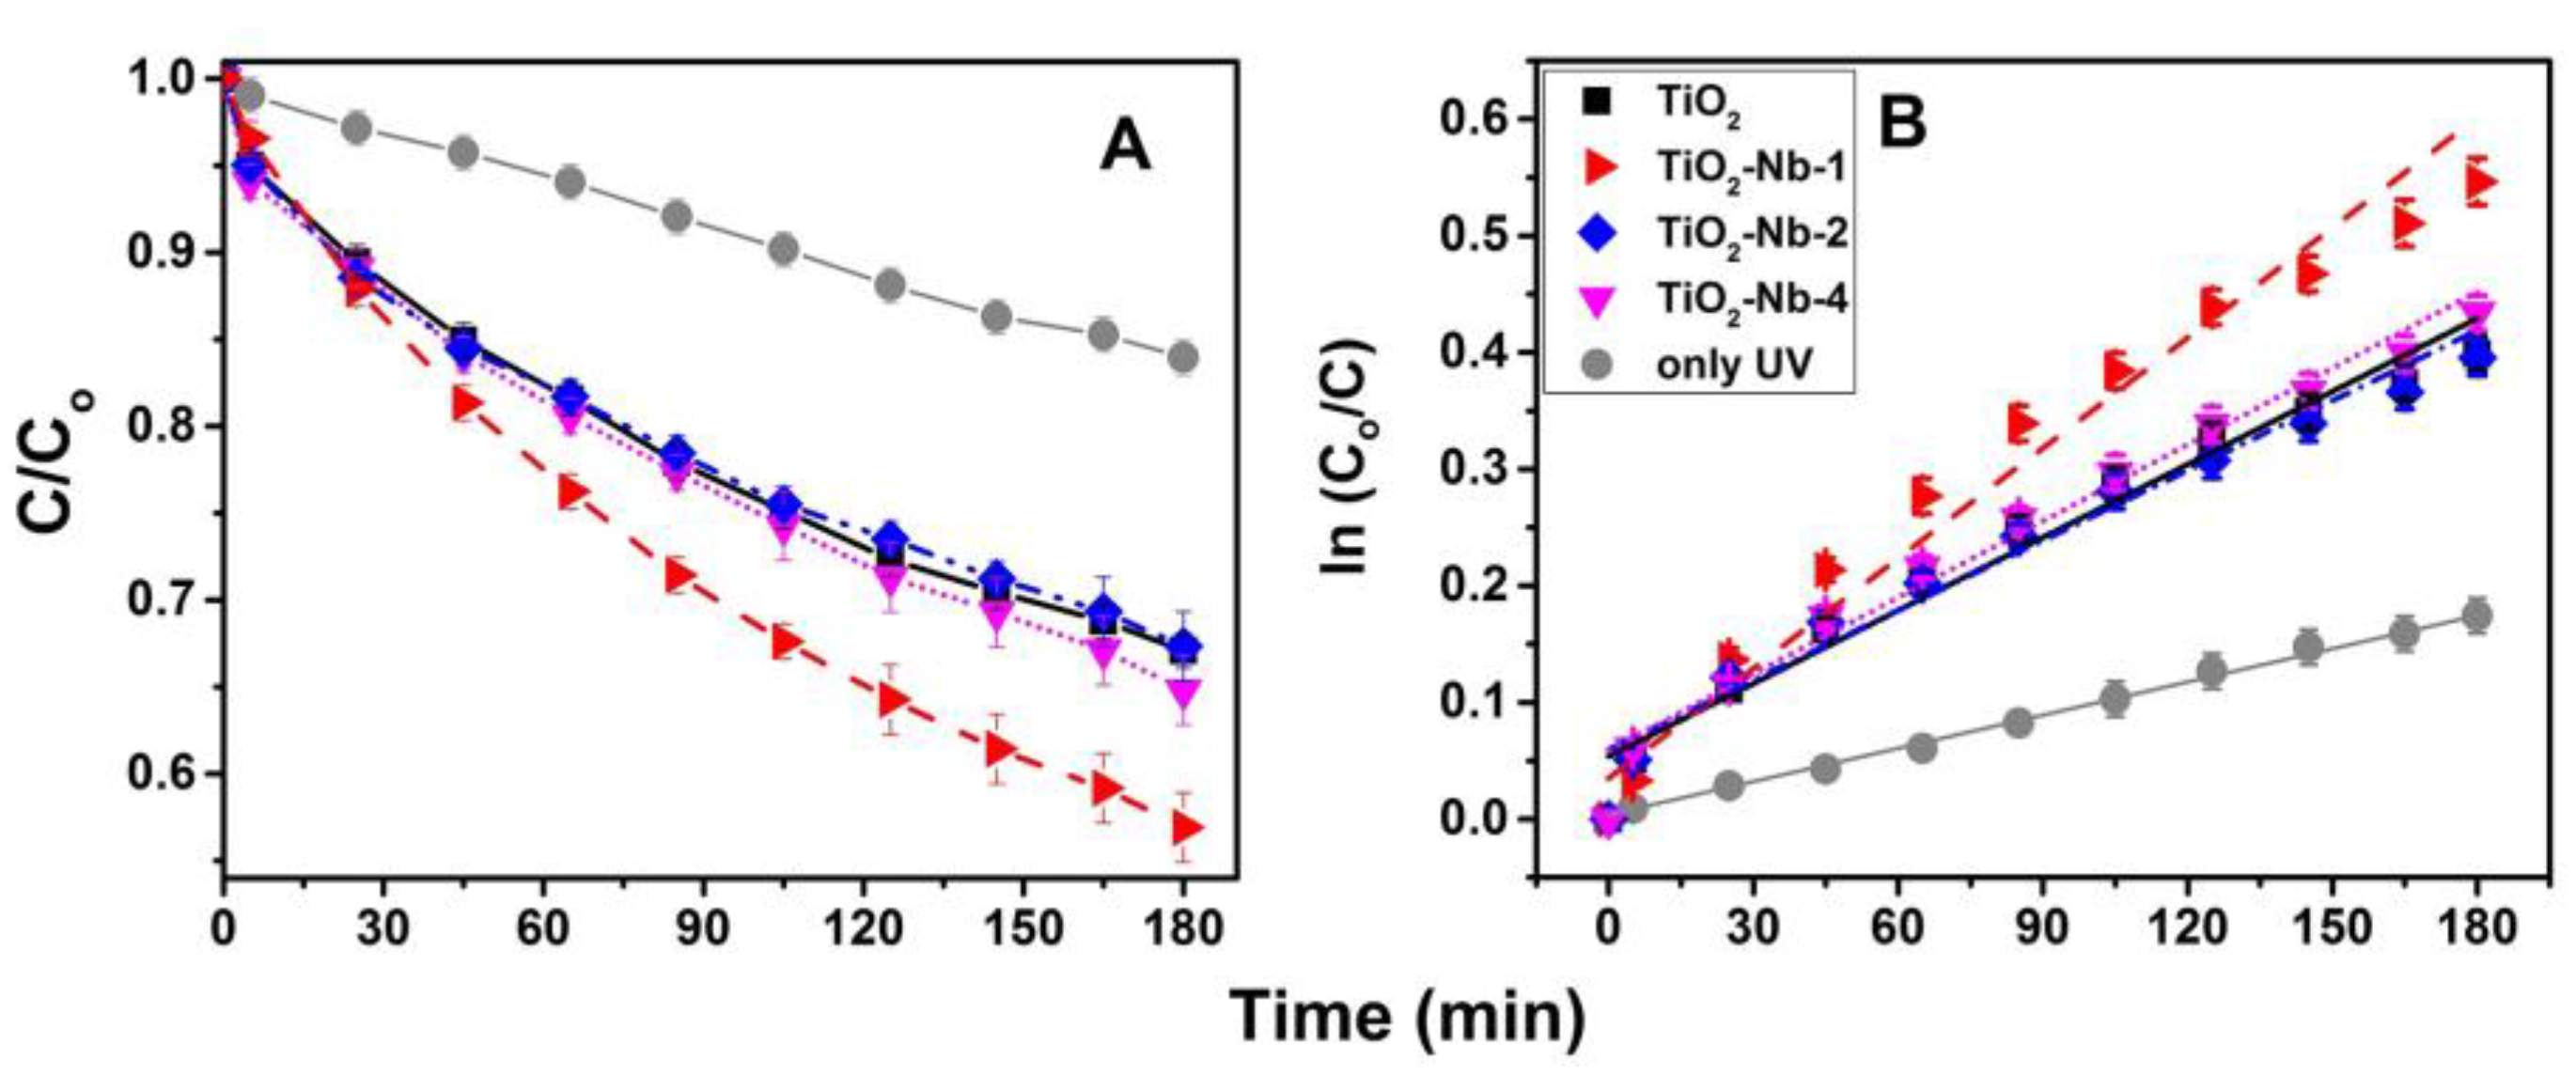
| Material | (1) Slope × 10−3 | (2) Ki/KUV | (3) t½ = ln2/ki |
|---|---|---|---|
| only UV | 0.97 ± 0.02 | - | 715 |
| TiO2 | 2.08 ± 0.12 | 2.15 | 333 |
| TiO2-Nb-1 | 2.93 ± 0.17 | 2.99 | 237 |
| TiO2-Nb-2 | 2.02 ± 0.12 | 2.08 | 343 |
| TiO2-Nb-4 | 2.22 ± 0.16 | 2.28 | 312 |
| Material, Synthesis Method, Morphology and Concentration | K, min−1 | Degradation Value (per Time, % min−1) | Stability Data | Model Dye | Ref. |
|---|---|---|---|---|---|
| TiO2-Nb-C, sol–gel, 30 ± 2 nm, spherical (25 mgL−1) | 3.0–4.0 × 10⁻⁴ | 20% per 90 min−1 | Slight reduction in the degree of photobleaching after five cycles | Rhodamine B (2 mgL−1) | [56] |
| TiO2-Nb-1, hydrothermal synthesis, nanorods up to 1 μm (1000 mgL−1) | Not mentioned | 50% per 50 min−1 | Not mentioned | Rhodamine B (20 ppm) | [57] |
| TiO2-Nb-1, coprecipitation, 9 nm, spherical (0.17 gL−1) | Not mentioned | 70% per 60 min−1 | Not mentioned | Methylene blue (10 µmol) | [58] |
| TiO2:1 at.% Nb, one-step FSS, 30 nm (0.4 mg cm−3) | 2.0 × 10⁻³ | 20% per 200 min−1 | Not mentioned | Methylene blue (5.13 × 10⁻⁵ M) | [11] |
| TiO2:5 at.% Nb, sol–gel, 500 nm agglomerates, spherical (concentration is not specified) | 2.8 × 10⁻³ | 15% per 60 min−1 | Not mentioned | Methyl orange (10 mgL−1) | [59] |
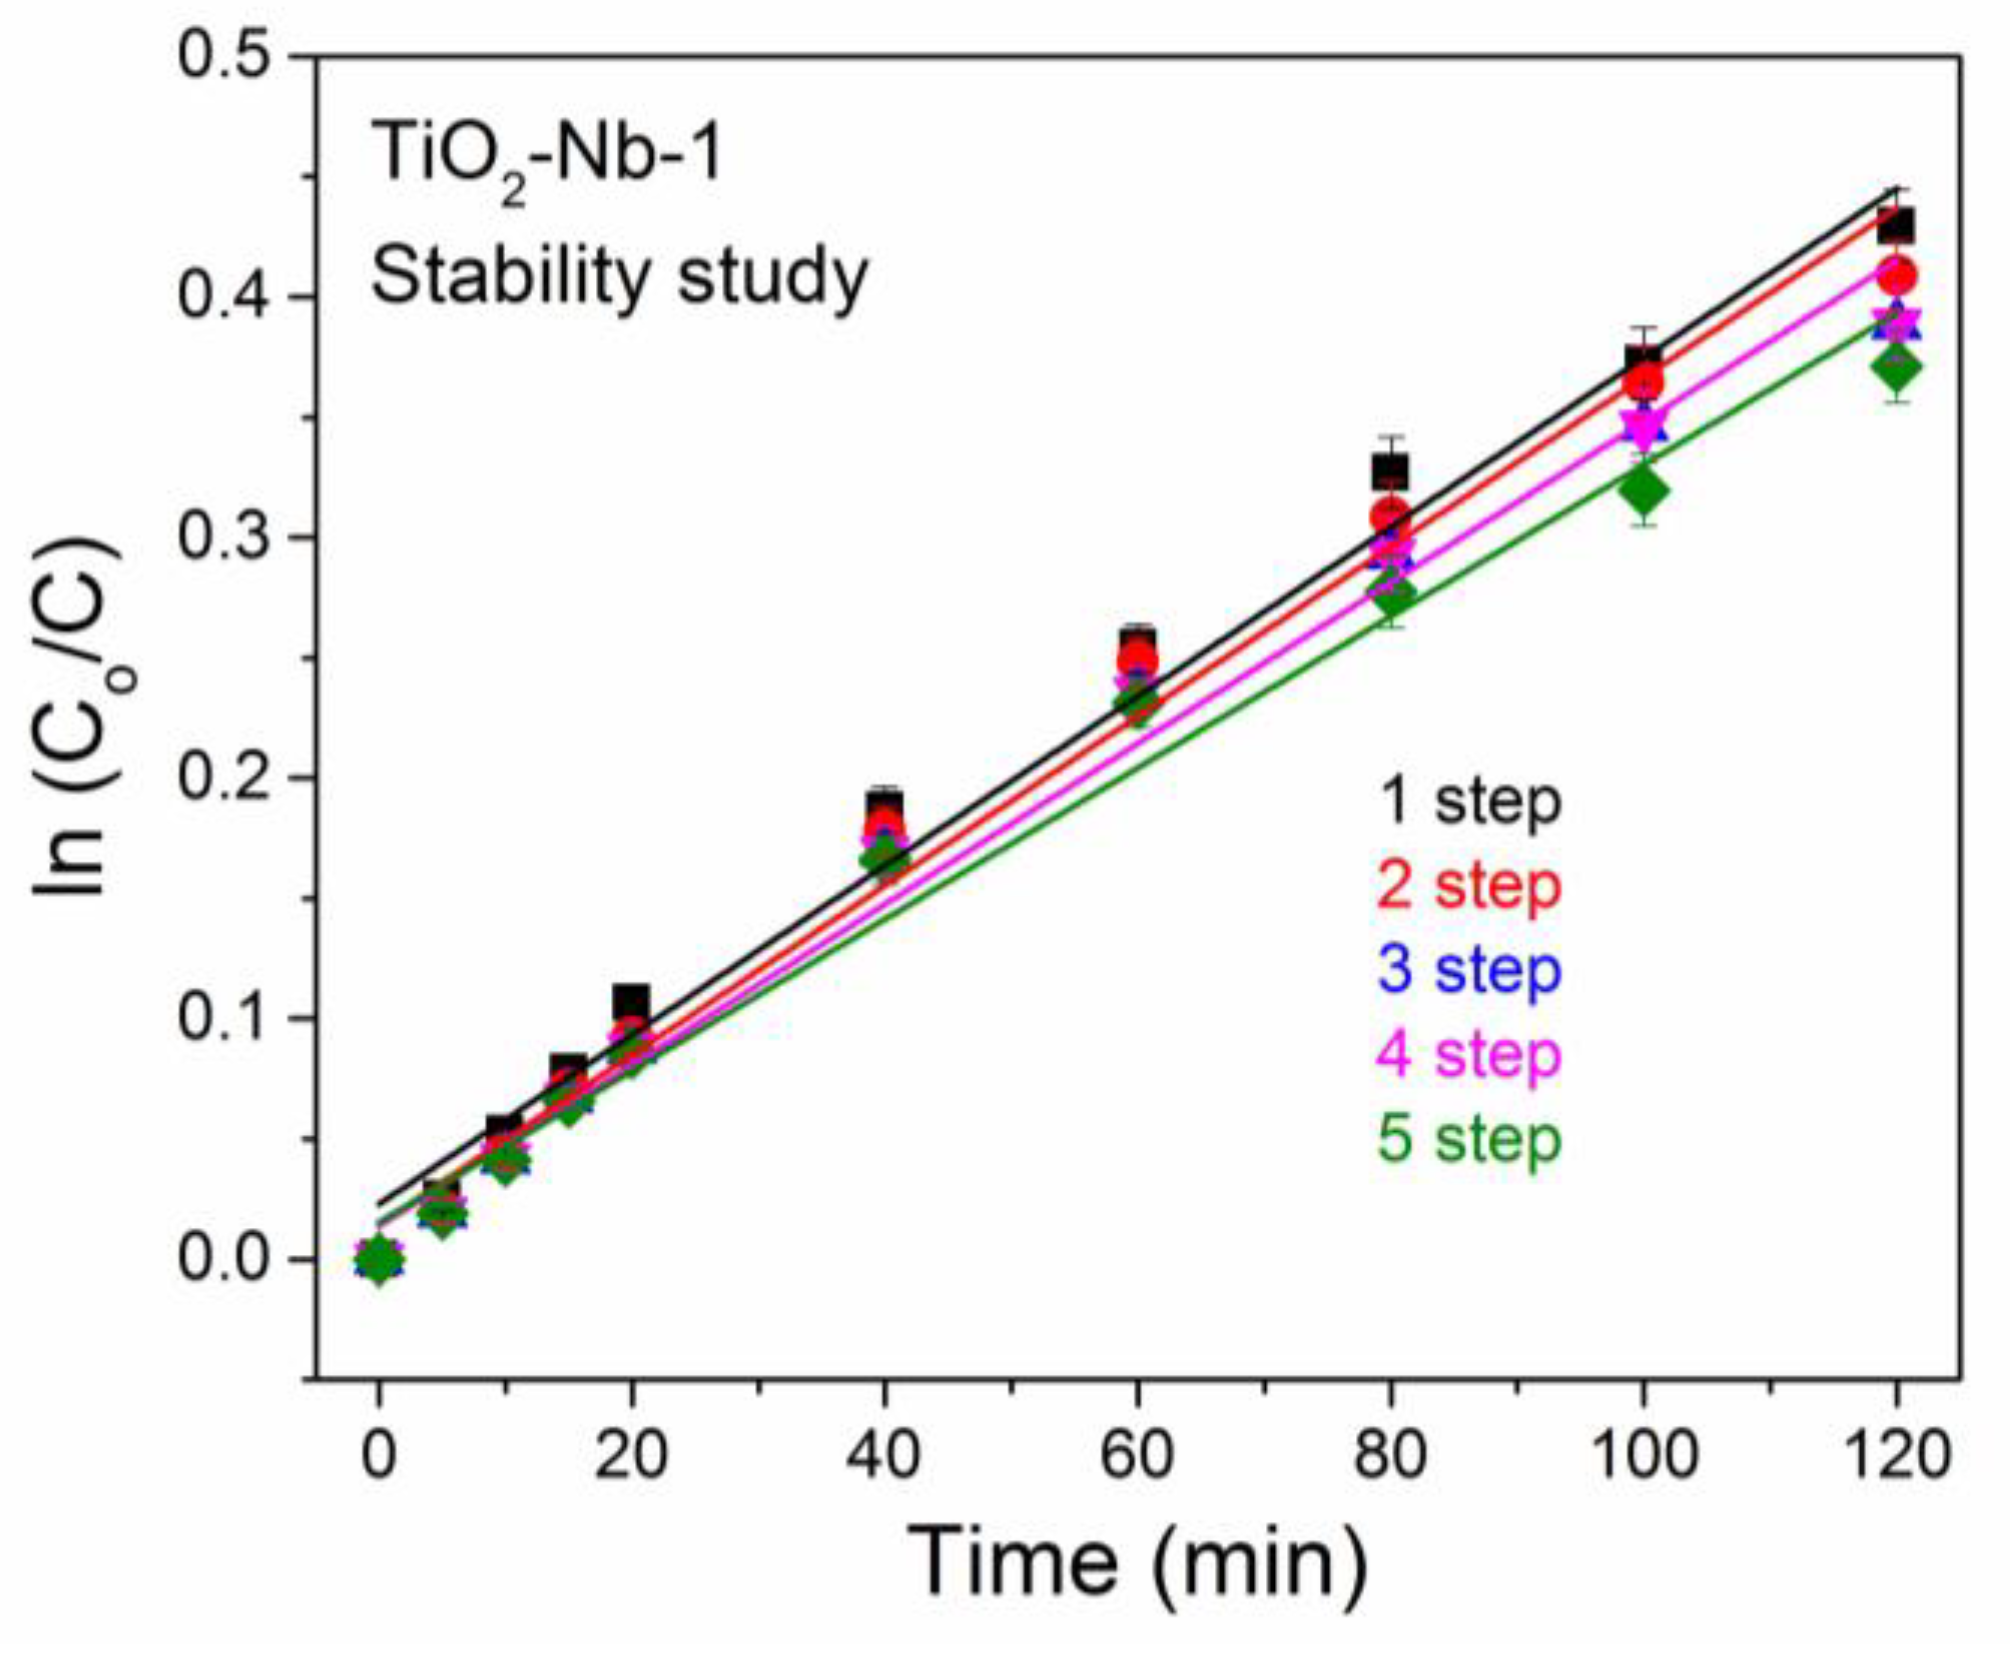
| TiO2-Nb-1, FSP, 20 ± 2 nm, spherical (0.2 gL−1) | 2.93 ± 0.17 × 10⁻³ | 40% per 180 min−1 | Slight reduction in the degree of photobleaching after five cycles | Methylene blue (0.01 gL−1) | This work |
Disclaimer/Publisher’s Note: The statements, opinions and data contained in all publications are solely those of the individual author(s) and contributor(s) and not of MDPI and/or the editor(s). MDPI and/or the editor(s) disclaim responsibility for any injury to people or property resulting from any ideas, methods, instructions or products referred to in the content. |
© 2024 by the authors. Licensee MDPI, Basel, Switzerland. This article is an open access article distributed under the terms and conditions of the Creative Commons Attribution (CC BY) license (https://creativecommons.org/licenses/by/4.0/).
Share and Cite
Kuranov, D.; Grebenkina, A.; Bogdanova, A.; Platonov, V.; Polomoshnov, S.; Krivetskiy, V.; Rumyantseva, M. Effect of Donor Nb(V) Doping on the Surface Reactivity, Electrical, Optical and Photocatalytic Properties of Nanocrystalline TiO2. Materials 2024, 17, 375. https://doi.org/10.3390/ma17020375
Kuranov D, Grebenkina A, Bogdanova A, Platonov V, Polomoshnov S, Krivetskiy V, Rumyantseva M. Effect of Donor Nb(V) Doping on the Surface Reactivity, Electrical, Optical and Photocatalytic Properties of Nanocrystalline TiO2. Materials. 2024; 17(2):375. https://doi.org/10.3390/ma17020375
Chicago/Turabian StyleKuranov, Dmitriy, Anastasia Grebenkina, Alexandra Bogdanova, Vadim Platonov, Sergey Polomoshnov, Valeriy Krivetskiy, and Marina Rumyantseva. 2024. "Effect of Donor Nb(V) Doping on the Surface Reactivity, Electrical, Optical and Photocatalytic Properties of Nanocrystalline TiO2" Materials 17, no. 2: 375. https://doi.org/10.3390/ma17020375
APA StyleKuranov, D., Grebenkina, A., Bogdanova, A., Platonov, V., Polomoshnov, S., Krivetskiy, V., & Rumyantseva, M. (2024). Effect of Donor Nb(V) Doping on the Surface Reactivity, Electrical, Optical and Photocatalytic Properties of Nanocrystalline TiO2. Materials, 17(2), 375. https://doi.org/10.3390/ma17020375