Article

Composition and Surface Optical Properties of GaSe:Eu Crystals before and after Heat Treatment

1
Faculty of Physics and Engineering, Moldova State University, 60 Alexei Mateevici Str., MD-2009 Chisinau, Moldova
2
Functional Nanomaterials, Faculty of Engineering, Institute for Materials Science, Kiel University, Kaiserstr. 2, D-24143 Kiel, Germany
3
Multicomponent Materials, Institute for Materials Science, Kiel University, Kaiserstr. 2, D-24143 Kiel, Germany
4
Center for Nanotechnology and Nanosensors, Department of Microelectronics and Biomedical Engineering, Technical University of Moldova, 168, Stefan cel Mare Av., MD-2004 Chisinau, Moldova
5
Department of Physics, University of Central Florida, Orlando, FL 32816-2385, USA
6
Faculty of Physics, Alexandru Ioan Cuza University of Iasi, 11 Carol I, 700506 Iasi, Romania
7
Science Research Department, Institute of Interdisciplinary Research, Research Center in Environmental Sciences for the North-Eastern Romanian Region (CERNESIM), Alexandru Ioan Cuza University of Iasi, 11 Carol I, 700506 Iasi, Romania
*
Authors to whom correspondence should be addressed.
Materials 2024, 17(2), 405; https://doi.org/10.3390/ma17020405
Submission received: 28 November 2023 / Revised: 10 January 2024 / Accepted: 11 January 2024 / Published: 13 January 2024
(This article belongs to the Special Issue Facile Synthesis and Applications of Doped Metal Oxide Nanomaterials)

Abstract

:
This work studies the technological preparation conditions, morphology, structural characteristics and elemental composition, and optical and photoluminescent properties of GaSe single crystals and Eu-doped β–Ga2O3 nanoformations on ε–GaSe:Eu single crystal substrate, obtained by heat treatment at 750–900 °C, with a duration from 30 min to 12 h, in water vapor-enriched atmosphere, of GaSe plates doped with 0.02–3.00 at. % Eu. The defects on the (0001) surface of GaSe:Eu plates serve as nucleation centers of β–Ga2O3:Eu crystallites. For 0.02 at. % Eu doping, the fundamental absorption edge of GaSe:Eu crystals at room temperature is formed by n = 1 direct excitons, while at 3.00 at. % doping, Eu completely shields the electron–hole bonds. The band gap of nanostructured β–Ga2O3:Eu layer, determined from diffuse reflectance spectra, depends on the dopant concentration and ranges from 4.64 eV to 4.87 eV, for 3.00 and 0.05 at. % doping, respectively. At 0.02 at. % doping level, the PL spectrum of ε–GaSe:Eu single crystals consists of the n = 1 exciton band, together with the impurity band with a maximum intensity at 800 nm. Fabry–Perrot cavities with a width of 9.3 μm are formed in these single crystals, which determine the interference structure of the impurity PL band. At 1.00–3.00 at. % Eu concentrations, the PL spectra of GaSe:Eu single crystals and β–Ga2O3:Eu nanowire/nanolamellae layers are determined by electronic transitions of Eu2+ and Eu3+ ions.

1. Introduction

Gallium monoselenide (GaSe) is one of the outstanding representatives of group III–VI lamellar, quasi-two-dimensional (2D) materials, with a direct band gap of 2.00 eV and pronounced anisotropy of mechanical, electrical and optical properties [1,2,3].
Its single crystals exhibit a typical layered structure, each layer being composed of elementary stratified Se–Ga–Ga–Se (Chalcogen–Metal–Metal–Chalcogen) packages, with predominantly covalent bonding inside a package and weak polarizational bonds, of the van der Waals type, between the packages [4,5,6]. Depending on the mutual arrangement of elementary planar packages along the C6 axis, several polytypes are distinguished: ε, β and δ, displaying hexagonal lattice, and γ, with rhombohedral crystal lattice. In crystals obtained by the Bridgman–Stockbarger technique, ε polytype is reported to be predominant [1,4]. The weak bonds between planar packages facilitate obtaining 2D ultrathin lamellae, which exhibit special optoelectronic properties [7,8]. Based on GaSe nanolayers, a broadband photodetector with a photoresponse of 4.5 A/W at ~120 °C was fabricated [8].
As demonstrated in works [9,10,11,12], doping with isovalent elements (Al, In, Er and Tm) of ε–GaSe crystals leads to significant deformation of their hexagonal crystal lattice and also influences their optical and luminescence properties. Aluminum, in small amounts (c ≈ 0.01–0.05 at. %), is able to liquidate the vacancies in the gallium sublattice, thus contributing to the increase of the absorption coefficient in the center of n = 1 exciton band; whilst, at higher concentrations (c ≥ 0.2 at. %), the defects induced by dopant shield the exciton bonds, which is manifested by the decrease in the intensity of the exciton absorption band. Indium as a dopant engenders structural defects in ε–GaSe which, together with the shielding of electron–hole bonds, lead to the formation of donor–acceptor pairs and of the impurity PL band [10]. Also, the rare earth elements (Er and Tm) are able to occupy gallium vacancies [11,12]. By doping GaSe with Tm3+, luminescence centers are formed in the near-IR region, while Er, in low concentrations, can form localized states within the GaSe bandgap, responsible for its red PL.
The surface of GaSe plates, kept for a long time in a normal atmosphere, is covered with a nanosized gallium oxide layer [13], while as a result of the heat treatment in an atmosphere enriched with oxygen and water vapor, a layer of β–Ga2O3 nanoformations is formed on the surface of GaSe plates [14,15,16]. Under the presence of water vapor and ultraviolet (UV) radiation, the formation of Ga2O3 and SeO2 oxides on thin GaSe plates’ surface is stimulated [16,17]. Since the valence bonds are practically closed at the (0001) surface of GaSe plates, the formation process of β–Ga2O3 oxide is initiated on the edge or in high surface defect density regions of GaSe plates.
In [18], Eu-doped β–Ga2O3 nanowires were obtained by consecutive heat treatments, at temperatures of 1500 °C and 1350 °C, of nanowires obtained from the vapor phase. As a characteristic feature, the cathodoluminescence spectrum of β–Ga2O3:Eu3+ nanowires contains the Eu3+ emission band with a maximum intensity at 610 nm. In the works [19,20], Chen and co-authors obtained, appealing to the PLD technique and using a mixture of β–Ga2O3 and Eu as evaporation material, β–Ga2O3:Eu thin films exhibiting intense red and violet luminescence, determined by radiative transitions of Eu3+ and Eu2+ ions, respectively.
The β–Ga2O3 is an n–type semiconductor with an ultra-wide energy band gap (4.80–4.90 eV) and moderate concentration of majority charge carriers [21,22]. Since undoped GaSe is a p–type semiconductor, through heat treatment in a water vapor-rich atmosphere (AVH2O), nanoscale n/p β–Ga2O3/GaSe heterostructures can be obtained.
This paper studies the surface photoluminescence (PL) of the GaSe plates doped with Eu, and the composition and optical properties of the β–Ga2O3:Eu3+ layer formed on the surface of GaSe:Eu plates following the heat treatment in an AVH2O at temperatures below the melting point.

2. Materials and Methods

Undoped and Eu-doped GaSe single crystals with doping concentrations of 0.02, 0.05, 0.50, 1.00 and 3.00 at. % were grown using the Bridgman–Stockbarger technique [23]. Ga (5N) and Se (5N), in stoichiometric proportions, were used as primary chemical elements, while Eu (5N), as a dopant. The synthesis and growth of single crystal samples were carried out in one cycle, in a three-zone furnace. Quartz ampoules with an internal diameter of 14–15 mm were used. To avoid material contamination, the internal surface of ampoules was covered with a graphite layer, obtained through high-temperature acetone pyrolysis. In this way, single crystals with a diameter of 14–15 mm and a mass of ~20 g were obtained. By mechanical splitting in a direction perpendicular to the C6 axis, from undoped GaSe single crystals and those doped with Eu, in concentrations lower than 0.05 at. %, plates with thicknesses in submicrometer to millimeter range, smooth surfaces and without microscopic defects, were obtained. Single crystal GaSe:Eu plates were subjected to heat treatment at temperatures of 750, 850 and 900 °C, with durations from 30 min to 12 h, in humid air. It was observed that following heat treatments at 850 and 900 °C, the surfaces of GaSe:Eu plates are covered with a white oxide layer, which strongly diffuses white light. As a result of the heat treatment at 750 °C, it is observed that the white oxide layer is formed only on the edges of GaSe:Eu plates.
The crystal structure and surface morphology of heat-treated samples were studied via X-ray diffraction (XRD), using a Sefert 300TT diffractometer (wavelength λCuKα = 1.54060 Å, 40 kV, 40 μA) and scanning electron microscopy (SEM) (Remzeitss type apparatus at 7 kV and of 8 mA), respectively; elemental and structural composition of β–Ga2O3:Eu layer was studied using XPS (X-ray photon spectroscopy) technique, with an Omicron-Nano-Technologic GmbH spectrometer with aluminum anticathode and micro-Raman (Witec alpha300 RA)-integrated Raman/AFM microscope. The calibration of the collected electric charge was carried out according to the C1s carbon line located at 284.80 eV. The XPS spectra were analyzed using the Casa XPS program, version 2.3.23. The photoluminescence of the samples was studied with spectrophotometric equipment based on an MDR-2 type monochromator, with a diffraction of 600 mm−1. The energy resolution at 500 nm and 800 nm wavelengths was 2.00 meV and 1.00 meV, respectively. Photoluminescence of β–Ga2O3:Eu nanowire and nanoribbon assemblies was excited with a UV-light band covering the wavelength range between 248 and 260 nm, centered at 253.5 nm, selected from the emission spectrum of a 500 W mercury vapor lamp, using a quartz prism monochromator with a linear dispersion of 3.0 nm/mm at 257.6 nm wavelength. Photoluminescence of undoped GaSe crystals, at 293 K, was excited with a 405 nm (3.00 eV) laser radiation (power density of 150 µW/cm2), while PL excitation of Eu-doped GaSe crystals was performed by means of an N2 laser [337.4 nm (3.67 eV)], with a power density of ~1.5 × 10³ W/cm2. The PL intensity was recorded using a photomultiplier with multi-alkali [(Na2K)Sb + Cs] photocathode.

3. Results and Discussion

Figure 1 shows XRD diagrams for undoped (a) and Eu-doped [0.05 at. % (b), 1.00 at. % (c) and 3.00 at. % (d)] GaSe single crystals. In the 2θ angular range of 20–90°, reflections from the (002), (004), (008), (202) and (0012) atomic planes are emphasized in recorded diffractograms, which, according to PDF card no. 00-037-0931, correspond to the ε–GaSe polytype-hexagonal lattice (space group P63/mmc) with parameters a = 3.749 Å, c = 15.907 Å and γ = 120.00°.
As shown in Figure 1b, in the XRD plot of GaSe crystals doped with Eu in concentrations up to 0.05 at. %, the characteristic reflections of the undoped material are present. In the XRD diagram of GaSe:Eu (1.00 at. %) single crystals (Figure 1c), together with the intense diffraction lines of GaSe (hexagonal lattice), low-intensity reflections are shown at 2θ angles of 29.71, 36.83 and 50.62°. As can be seen by comparing the diagrams in Figure 1c,d, the intensity of these lines is increasing together with the increase in Eu concentration from 1.00 to 3.00 at. %. At the same time, in Figure 1d, reflections positioned at 48.00 and 51.81° are clearly emphasized, which according to PDF card no. 01-070-2524, correspond to the EuGa2Se4 compound with orthorhombic crystal lattice (space group Fddd) with parameters a = 21.579 Å, b = 21.336 Å, c = 12.736 Å and α = β = γ = 90°. Therefore, in materials with Eu concentrations of 0.05, 1.00 and 3.00 at. %, GaSe single crystals with hexagonal lattice also contain EuGa2Se4 crystallites, with orthorhombic structure.
As a result of heat treatment (at 900 °C, for 12 h) in AVH2O, on the surface of GaSe:Eu plates, a white layer is formed, which intensely diffuses the incident light. Figure 1e shows the X-ray diffractogram of the material obtained using a GaSe:Eu (3.00 at. %) plate, ~120 μm thick, as the primary material. For 2θ angles ranging from 20 to 90°, two reflections are emphasized, that can be ascribed to (004) and (008) crystal planes of GaSe, hexagonal lattice (PDF card no. 00-037-0931). Several diffraction lines corresponding to β–Ga2O3 (PDF card no. 43-1012), with monoclinic lattice (space group C2/m and lattice parameters a = 12.23 Å, b = 3.04 Å, c = 5.800 Å and β = 103.7°) were also identified. At the same time, this diagram exhibits a series of low-intensity lines, located at 26.78, 26.82, 32.20, 53.15 and 55.80°. These reflections are characteristic of europium–gallium garnet (Eu3Ga5O12), formed in the growth process of β–Ga2O3:Eu (3.00 at. %) crystal fibers [24].
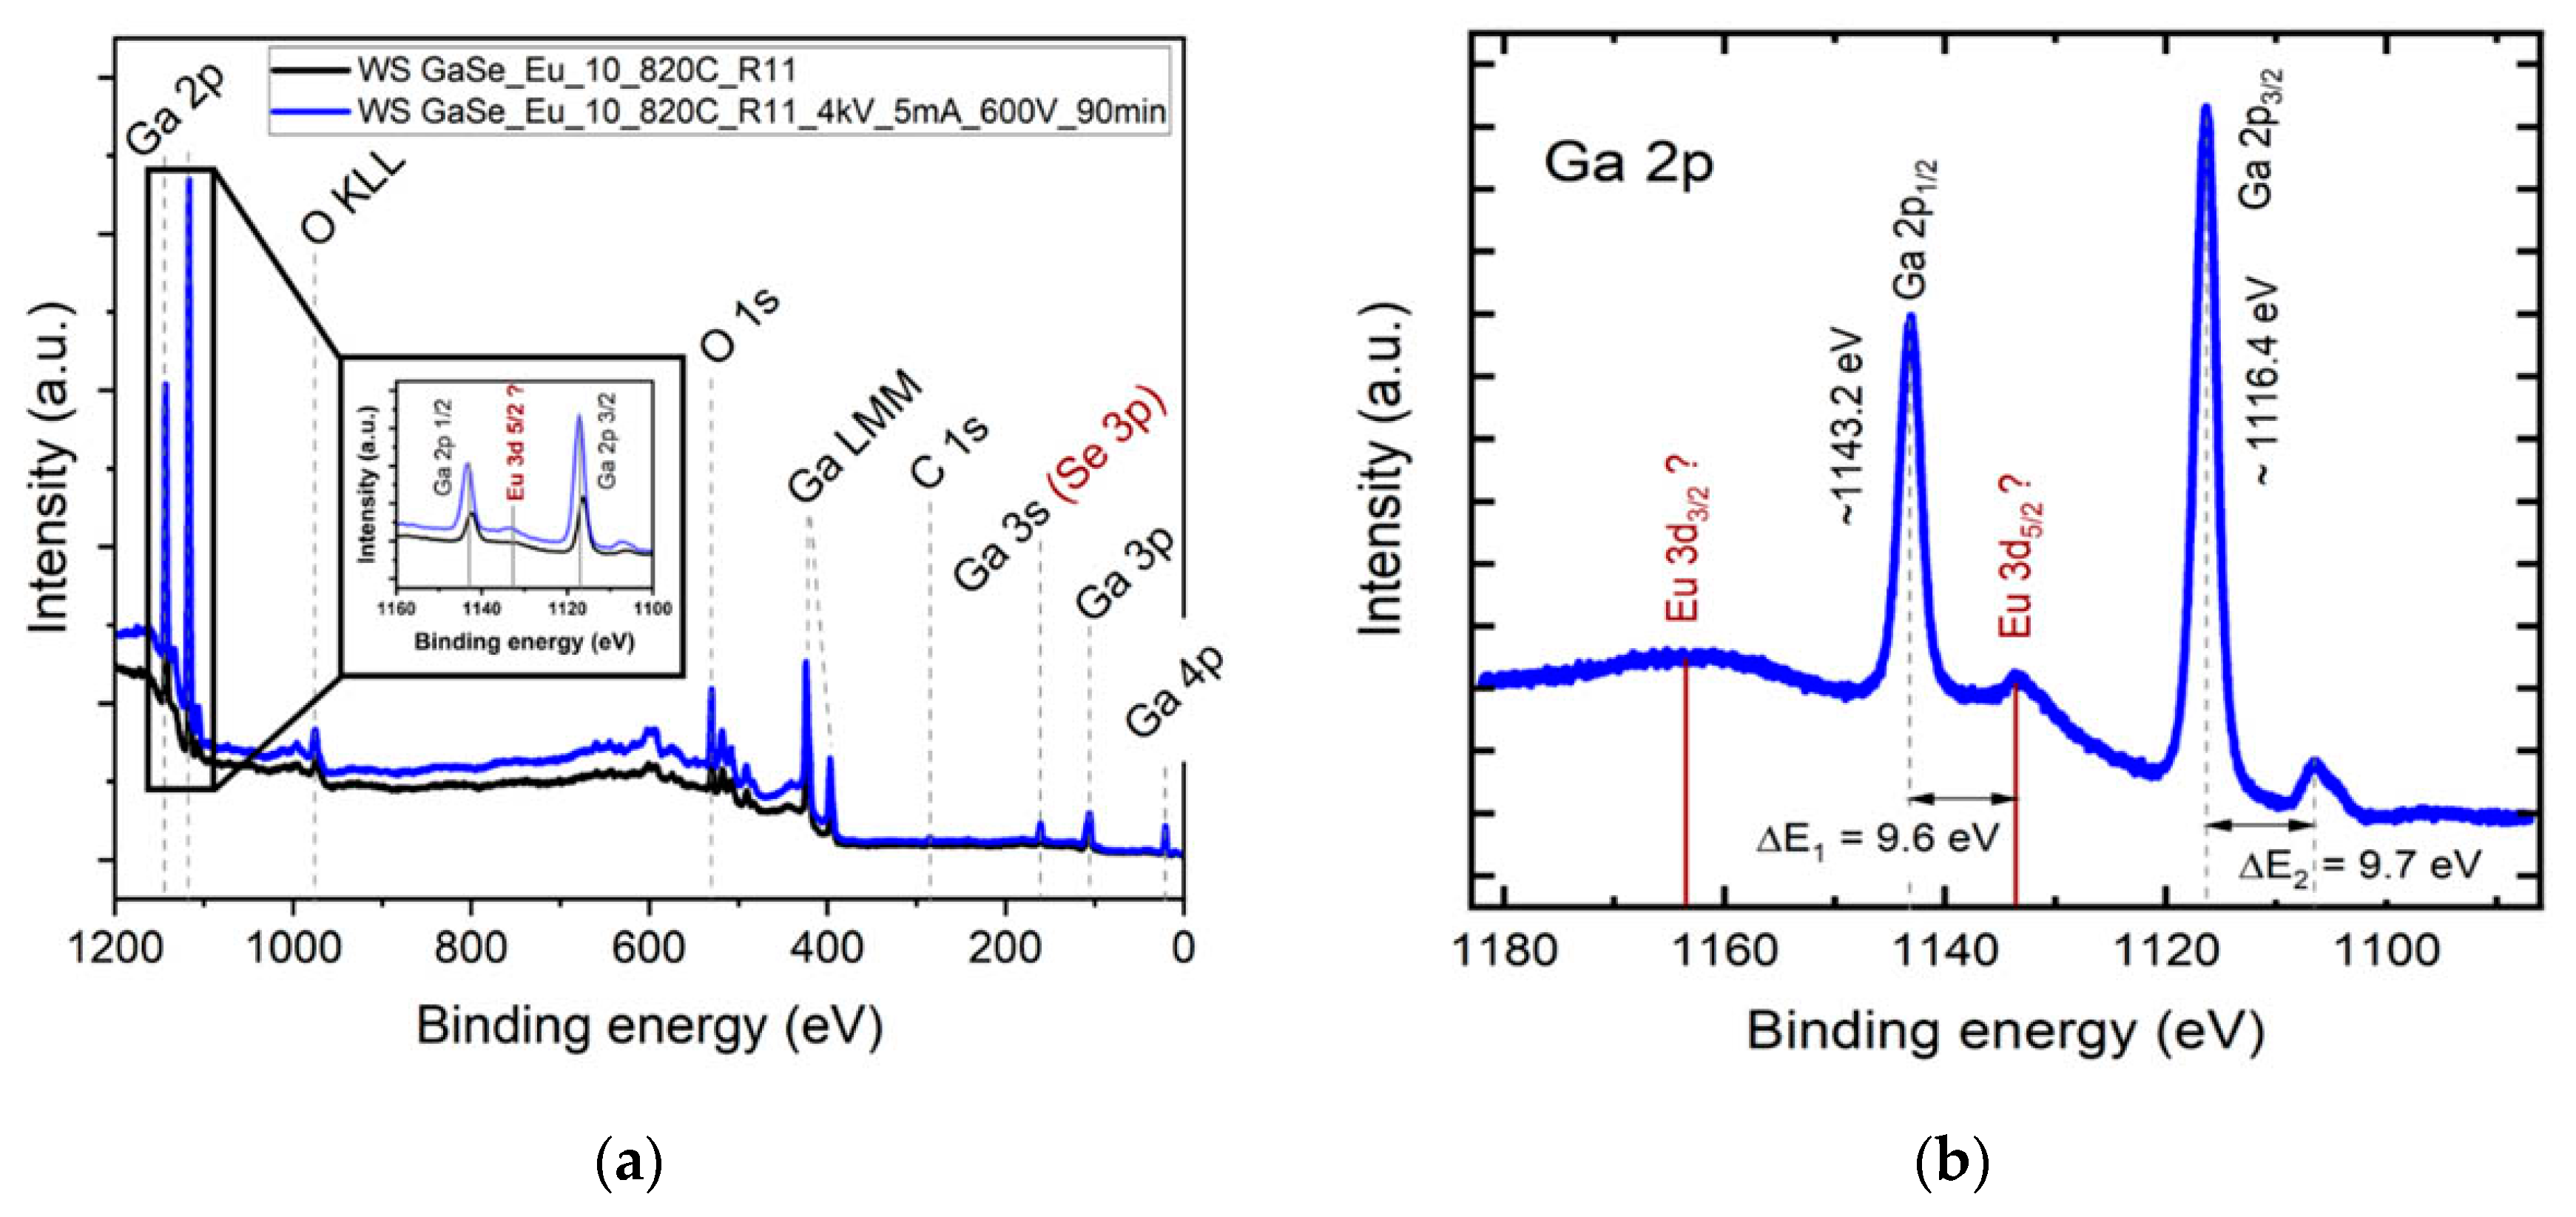
The elemental surface composition of the layer obtained via heat treatment of GaSe plates doped with 3.00 at. % Eu, at a temperature of 850 °C, in a water vapor-enriched atmosphere, for 6 h, was studied through XPS spectroscopy. A 300 W Al anticathode tube (EAlka = 1486.6 eV) was used as an X-ray source (λAlka = 8.3402 Å). The XPS spectrum was analyzed with CasaXPS processing software (version 2.3.23). Previously, the sample surface was cleaned with an Ar ion beam (5 mA, 4 kV), at a focusing voltage of 600 V. In Figure 2a, the XPS spectrum of heat-treated GaSe:Eu, at photon energy from 0 to 1200 eV is shown. Within this energy range, the following emission lines were found to be present: galium—Ga 2p, Ga LMM, Ga 3s, Ga 3p, Ga 4p; oxygen—O KLL and O 1s; it is also worth noting that small peaks of Eu 3d3/2 and Eu 3d5/2 emission lines were present. In Figure 2b, the 1100–1180 eV region of the high-resolution spectrum is presented, in which a peak located at 1133.6 eV is well emphasized; according to the studies reported in [25], it could be interpreted as an Eu 3d5/2 signal originating from the Eu3+ ion in Eu2O3.
As can be seen from Figure 2b, at energies corresponding to Eu3+ 3d5/2 emission, a poorly outlined peak is emphasized in the high-resolution XPS spectrum. The low peak intensity of this line is probably determined by the low Eu3+ concentration in the surface layer of the sample. In [26], the XPS spectrum of Eu3+ ions in ZnO nanoparticles is analyzed, from which it can be clearly seen that the Eu3+ 3d3/2 signal is ~2 times smaller compared to that of Eu3+ 3d5/2. At the same time, the emission lines of carbon are well emphasized in the recorded XPS spectrum, which are probably caused by the sample adsorption of hydrocarbons from the atmosphere.
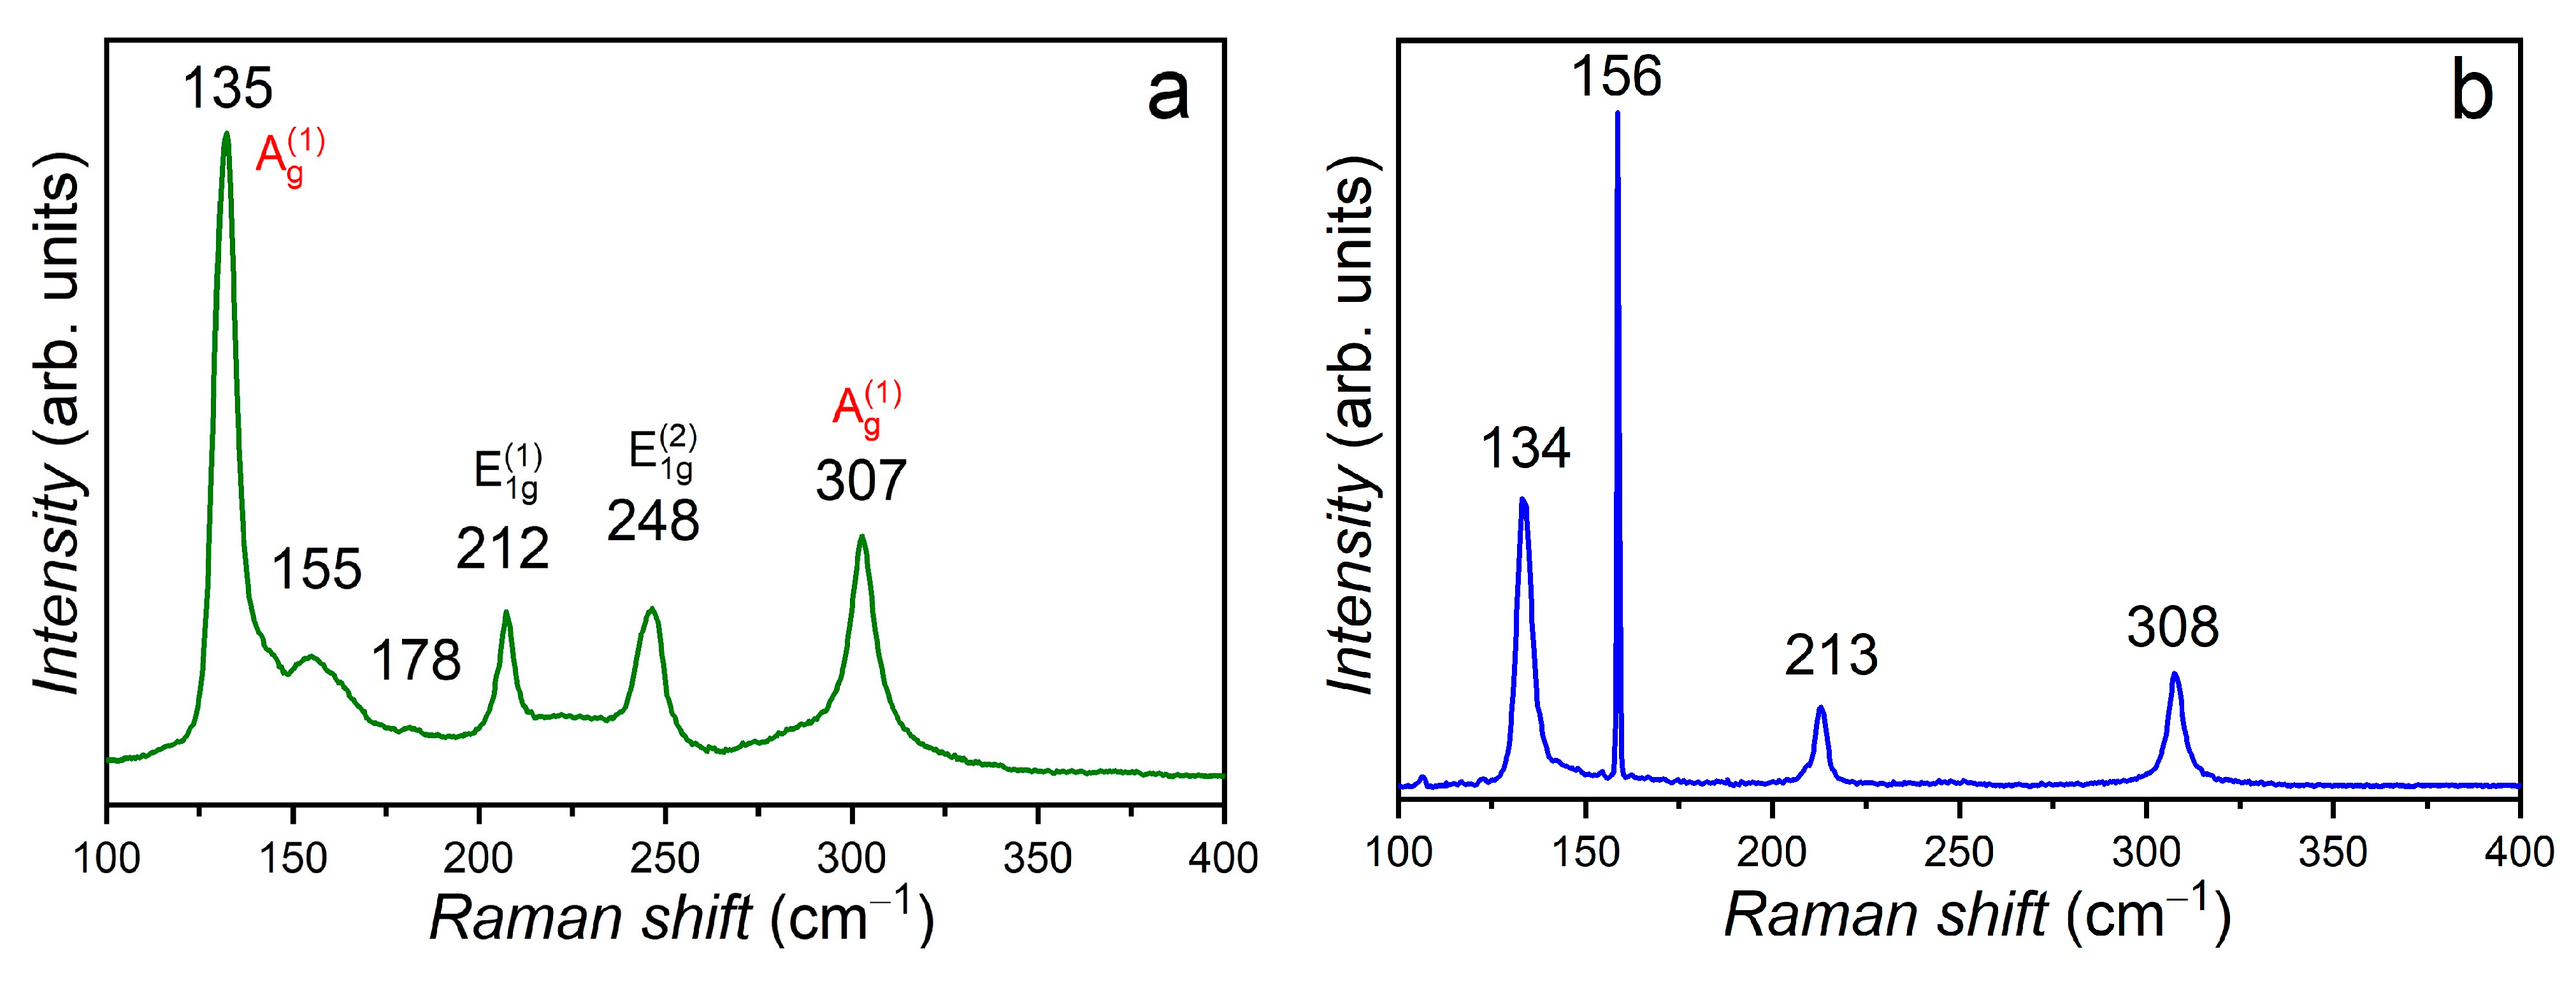
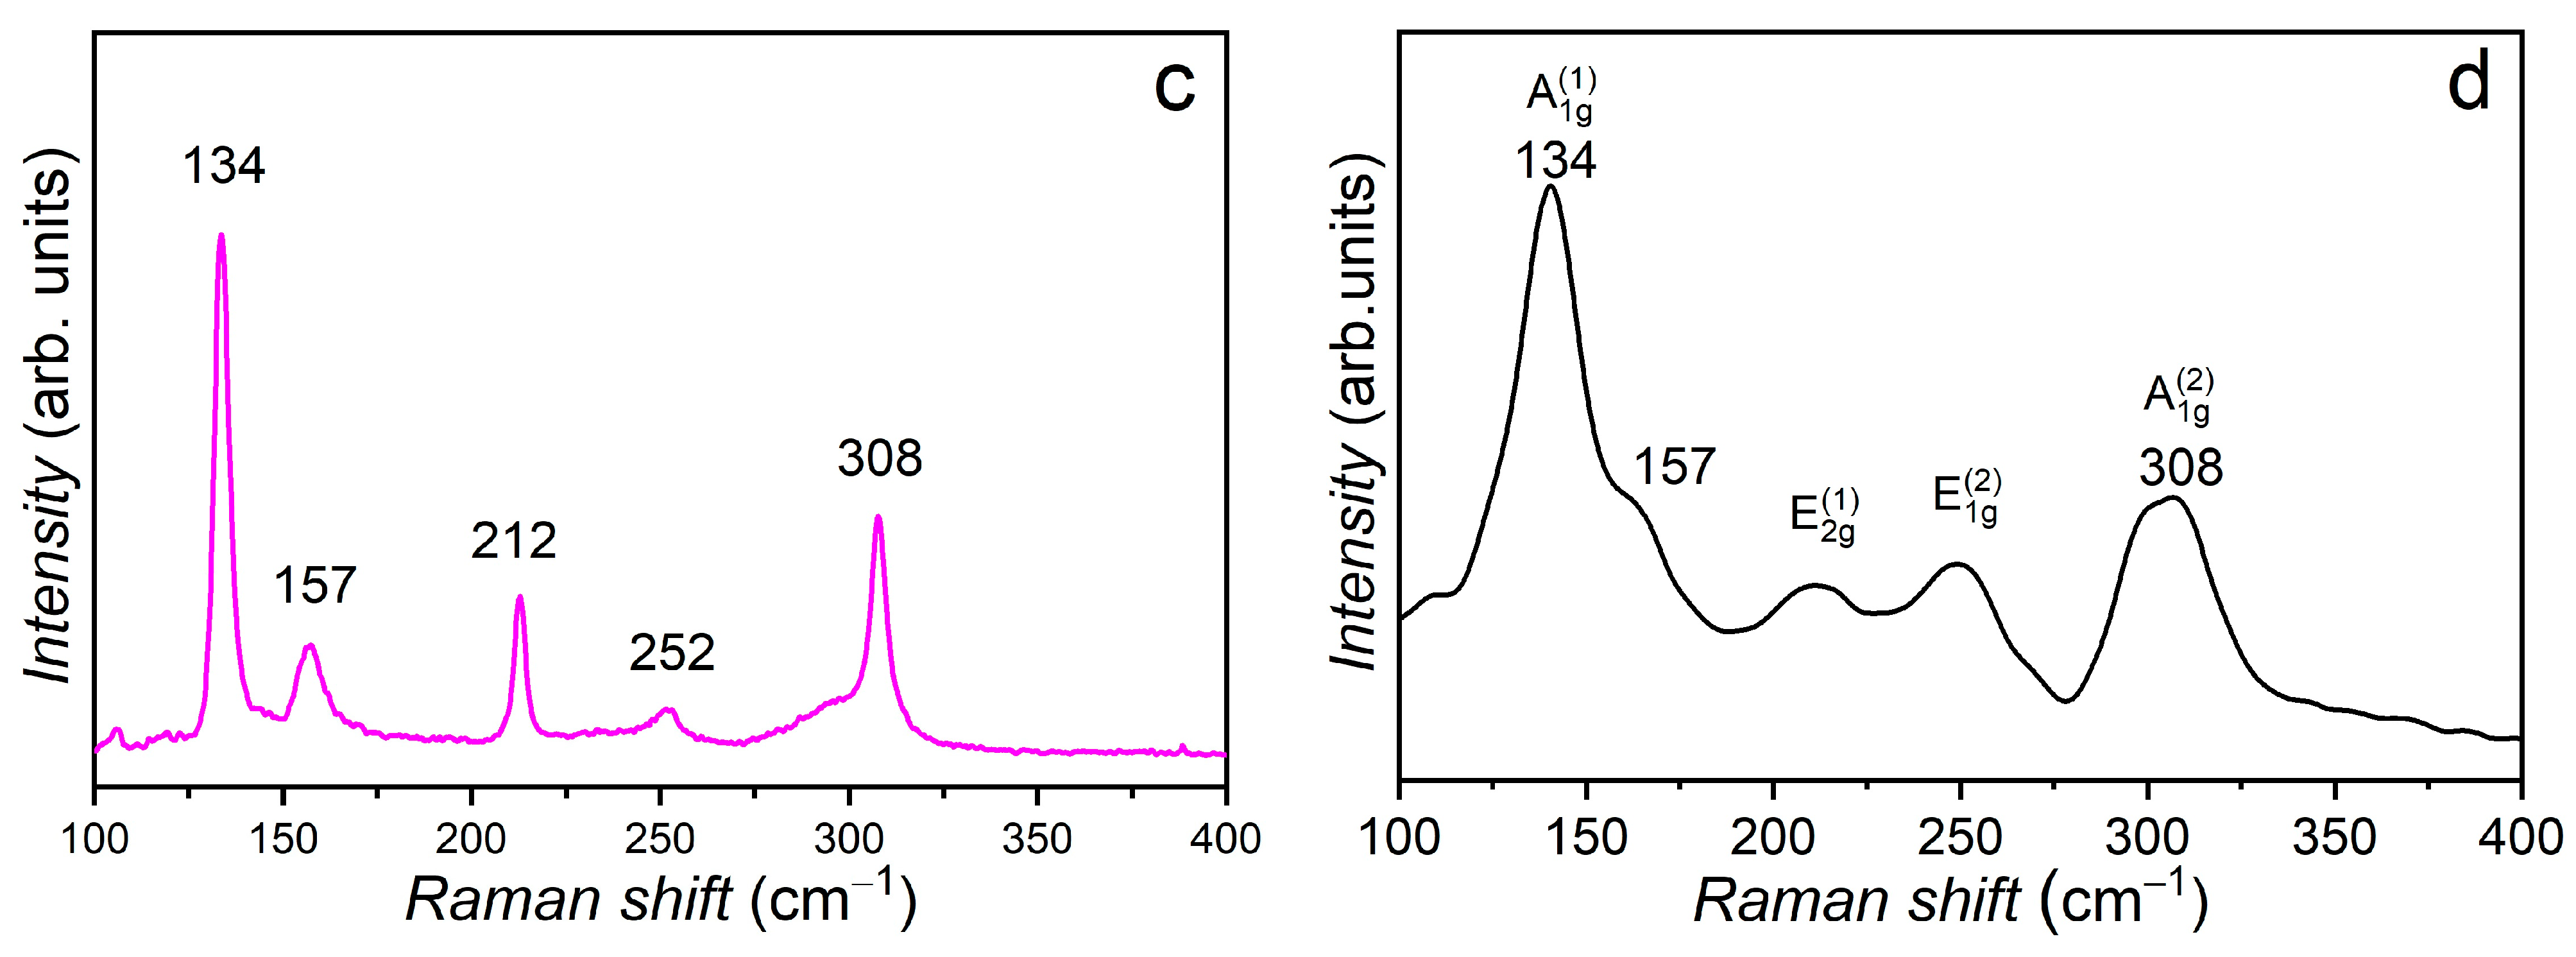
Valuable complementary information on the surface composition of GaSe:Eu plates, for doping concentrations between 0.02 and 3.00 at. %, can be obtained from the analysis of Raman spectra (Figure 3). The ε–GaSe polytype is a typical representative of the point group D3h, displaying 12 vibration modes. The planar vibrations E′ and E″ and non-planar vibrations A1′ and A2″ are known to be active in Raman spectra [26,27].
At 480 nm excitation wavelength of Raman spectra, the absorption coefficient (α) in GaSe crystals is equal to ~104 cm−1 (Figure 4). Therefore, one can assume that the thickness of the excited GaSe layer in Raman spectra does not exceed ~2 μm.
Figure 3a shows the Raman spectrum of the GaSe plate doped with 0.02 at. % Eu, in which four intense peaks located at 135 cm−1 [A1g(1)], 212 cm−1 [E2g(1)], 248 cm−1 [E1g(2)] and 307 cm−1 [A1g(2)] are present; these are consistent with the Raman vibration modes in hexagonal GaSe single crystals, as reported in [7,28,29]. In the Raman spectrum of GaSe:Eu (0.02 at. %) sample (Figure 3a), together with the characteristic vibration peaks of GaSe (hexagonal lattice) with the symmetries A1g(1), E2g(1), E1g(2) and A1g(2), a low-intensity peak with a broad contour is also present, with maximum peak located at 178 cm−1. This peak has been also observed in the Raman spectra of Eu2O3 [30]. The peak positioned at 155 cm−1 correlates well with the LO vibration mode in EuSe [31]. It is likely that oxygen could be introduced in the synthesis process of the compound together with metallic Eu, since the Eu(OH)3 hydroxide can be formed at room temperature in the atmosphere [32]. At high temperatures, this hydroxide decomposes into Eu2O3 and water [ 2 E u O H 3 300 400   ° C E u 2 O 3 + 3 H 2 O ].
The Raman spectra of GaSe plates doped with 0.05, 1.00 and 3.00 at. % Eu display a similar structure (Figure 3b–d).
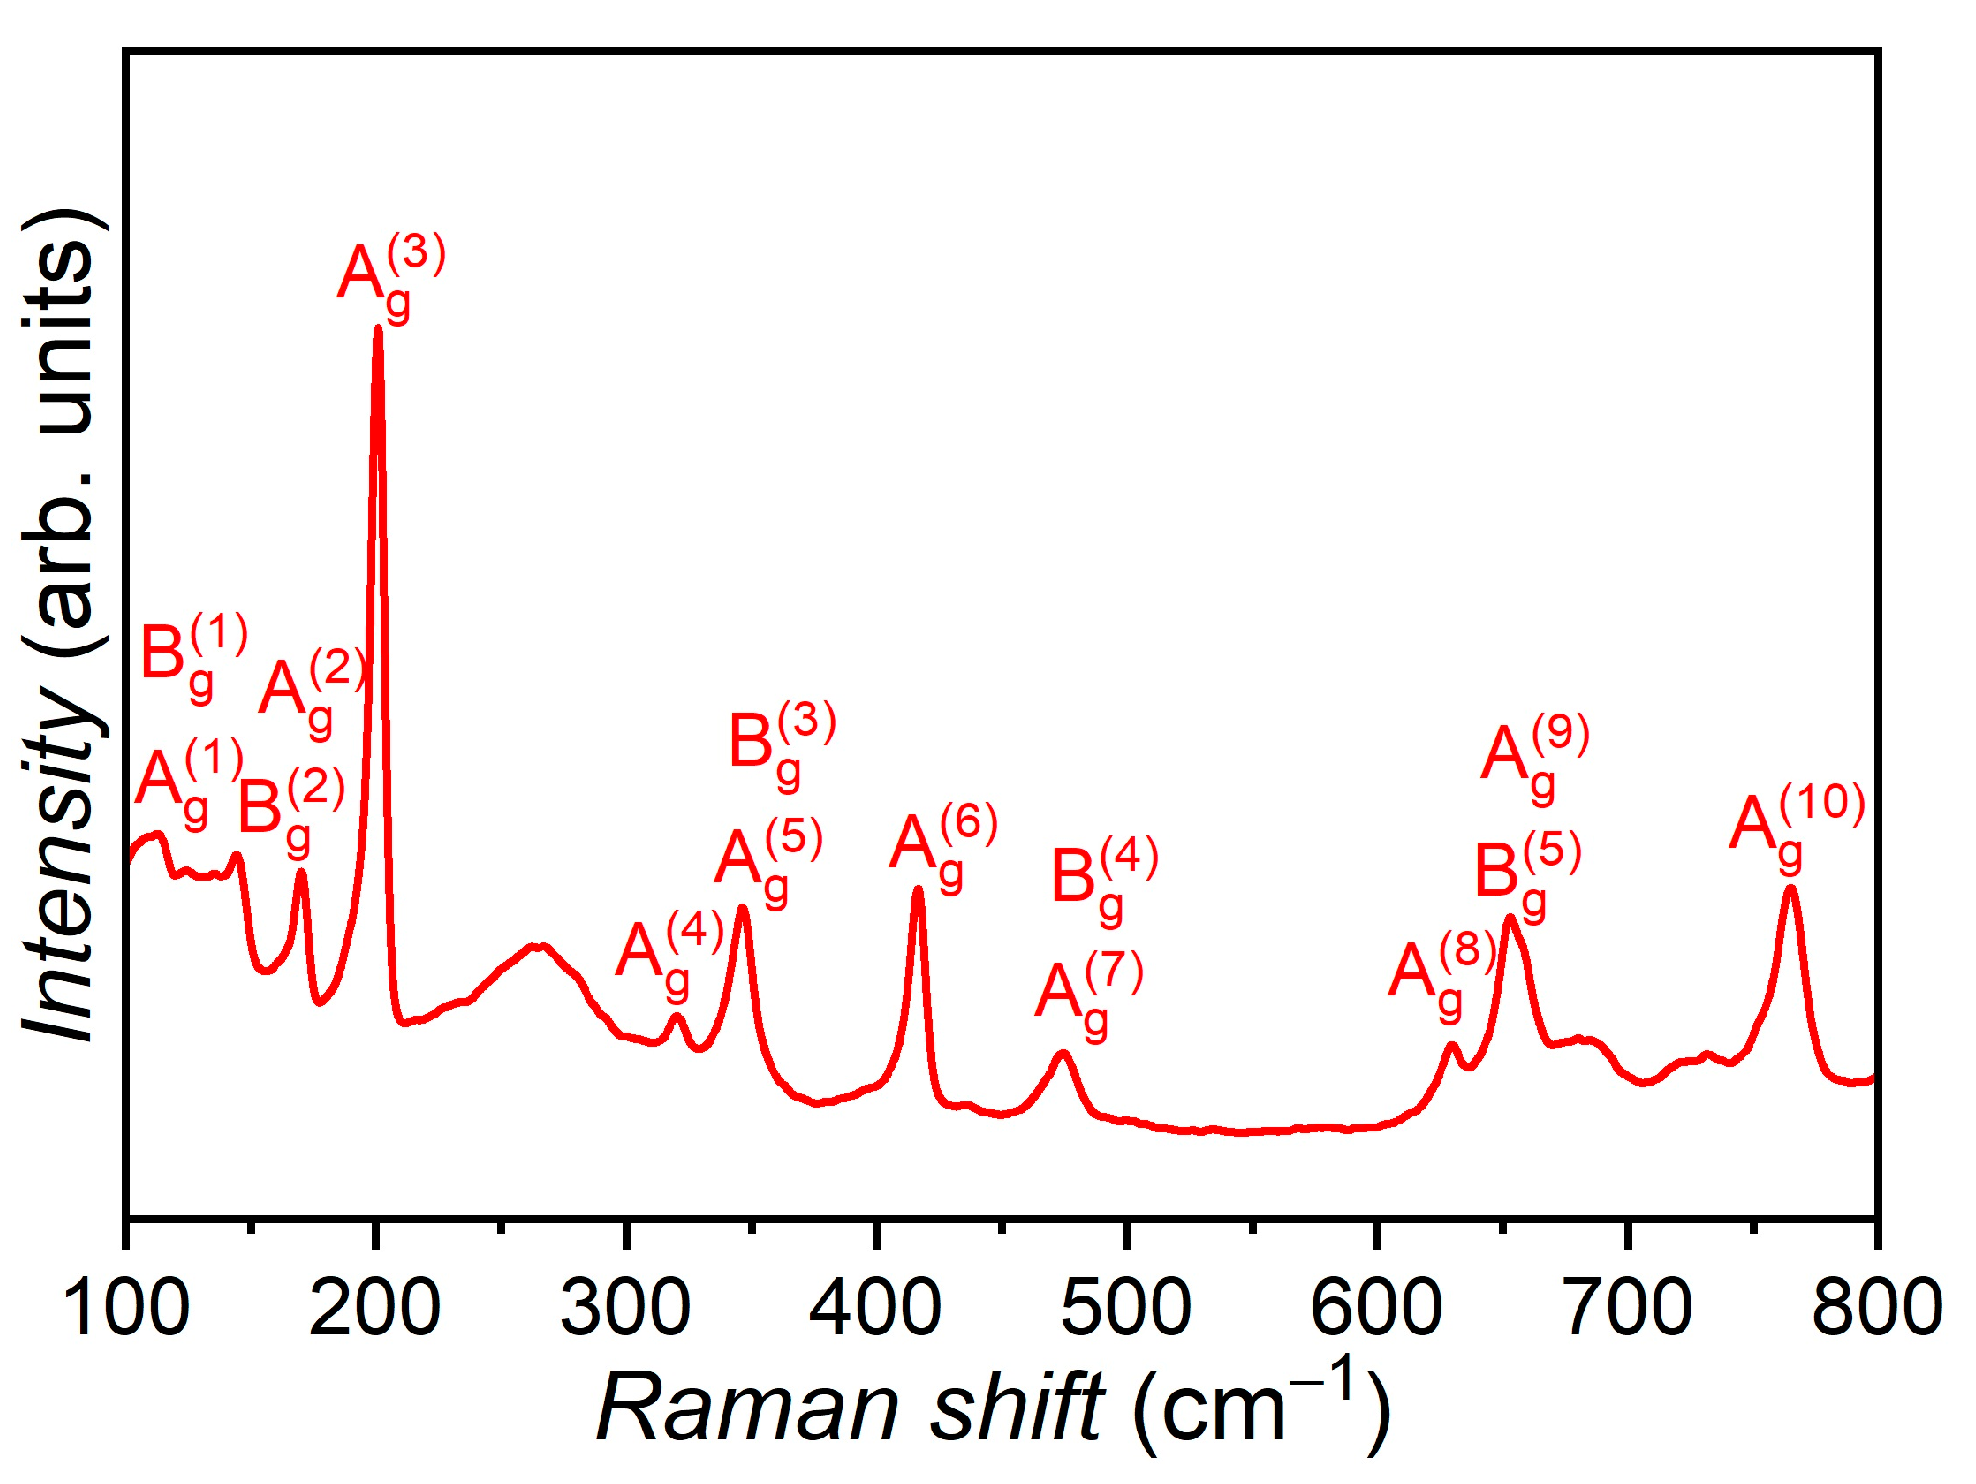
The intense peaks in these spectra correspond to the lattice vibrations of ε–GaSe (hexagonal structure), and the presence of Eu dopant is manifested by two low-intensity peaks, positioned at 119 and 155 cm−1, which can be associated with the lattice vibrations of Eu2O3 and cubic EuSe [31,32,33]. In the wavenumber ranging between 100 and 800 cm−1, the Raman spectrum of single crystal GaSe plate doped with 3.00 at. % Eu, subjected to heat treatment in a humid atmosphere at 900 °C for 6 h, contains 11 peaks located at 114, 132, 148, 201, 318, 348, 416, 468, 628, 654 and 764 cm−1 (Figure 4). The mentioned structure of the Raman spectrum can be attributed to the monoclinic β–Ga2O3 lattice [34,35,36,37].
The oxidation process of ε–GaSe plates at temperatures below the melting point, in the presence of oxygen or in an oxygen and water vapor-enriched inert gas atmosphere can be described by the reactions [9,10,17]:
[ 6 G a S e + 3 O 2 G a 2 S e 3 + 2 G a 2 O 3 + 3 S e ] [ G a 2 S e 3 + 3 / 2 O 2 G a 2 O 3 + 3 S e ] [ 2 G a S e + 3 H 2 O + 5 / 2 O 2 G a 2 O 3 + H 2 S e O 3 + 2 H 2 O ] [ H 2 S e O 3 H 2 O + S e + O 2 ]
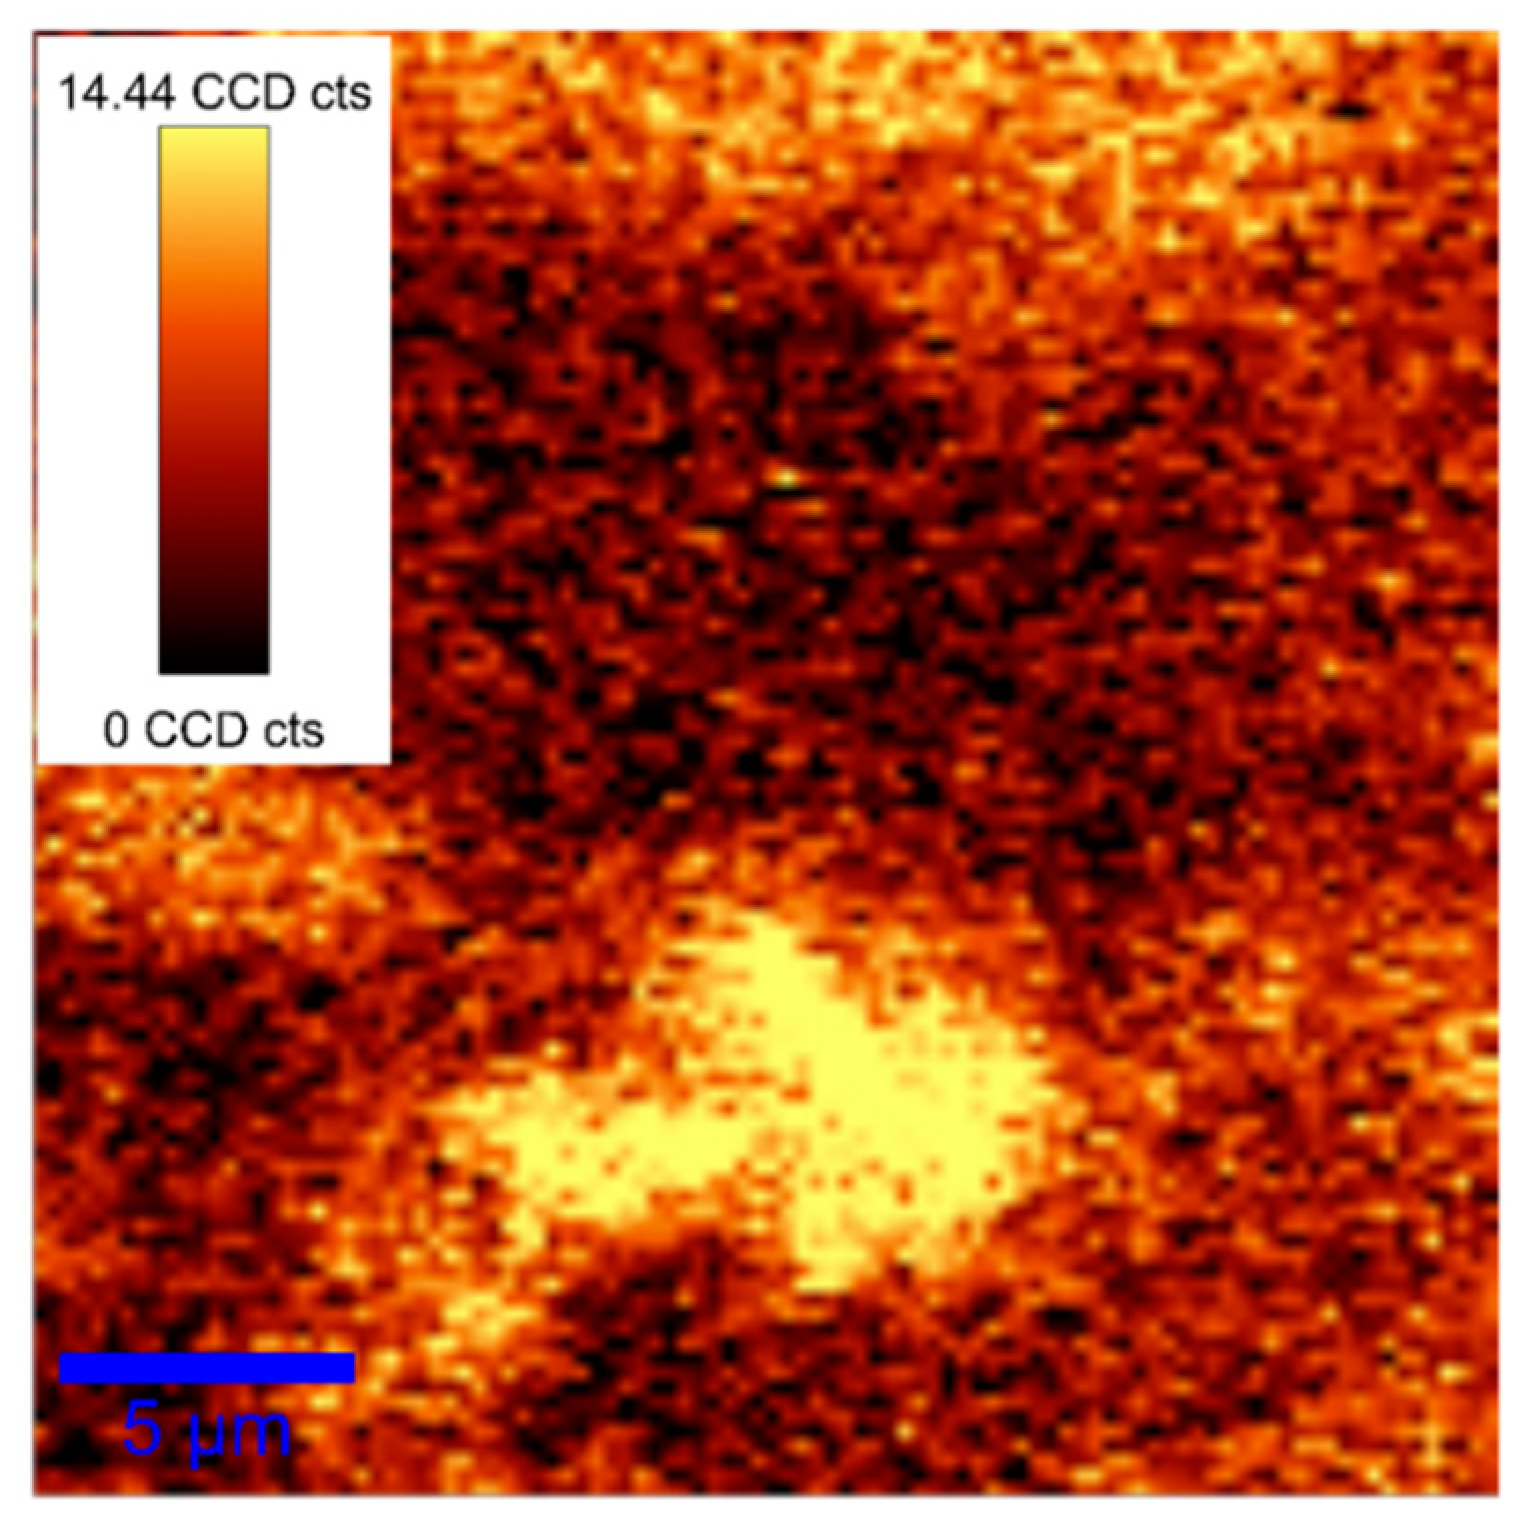
As can be seen from the microscopy image (Figure 5), as a result of heat treatment in a humid atmosphere, at 900 °C for 6 h, an island layer of β–Ga2O3 is formed on the surface of GaSe:Eu (3.00 at. %) plate, in accordance to the fact that the surface defects of GaSe:Eu plate can serve as growth centers of β–Ga2O3 crystallites.
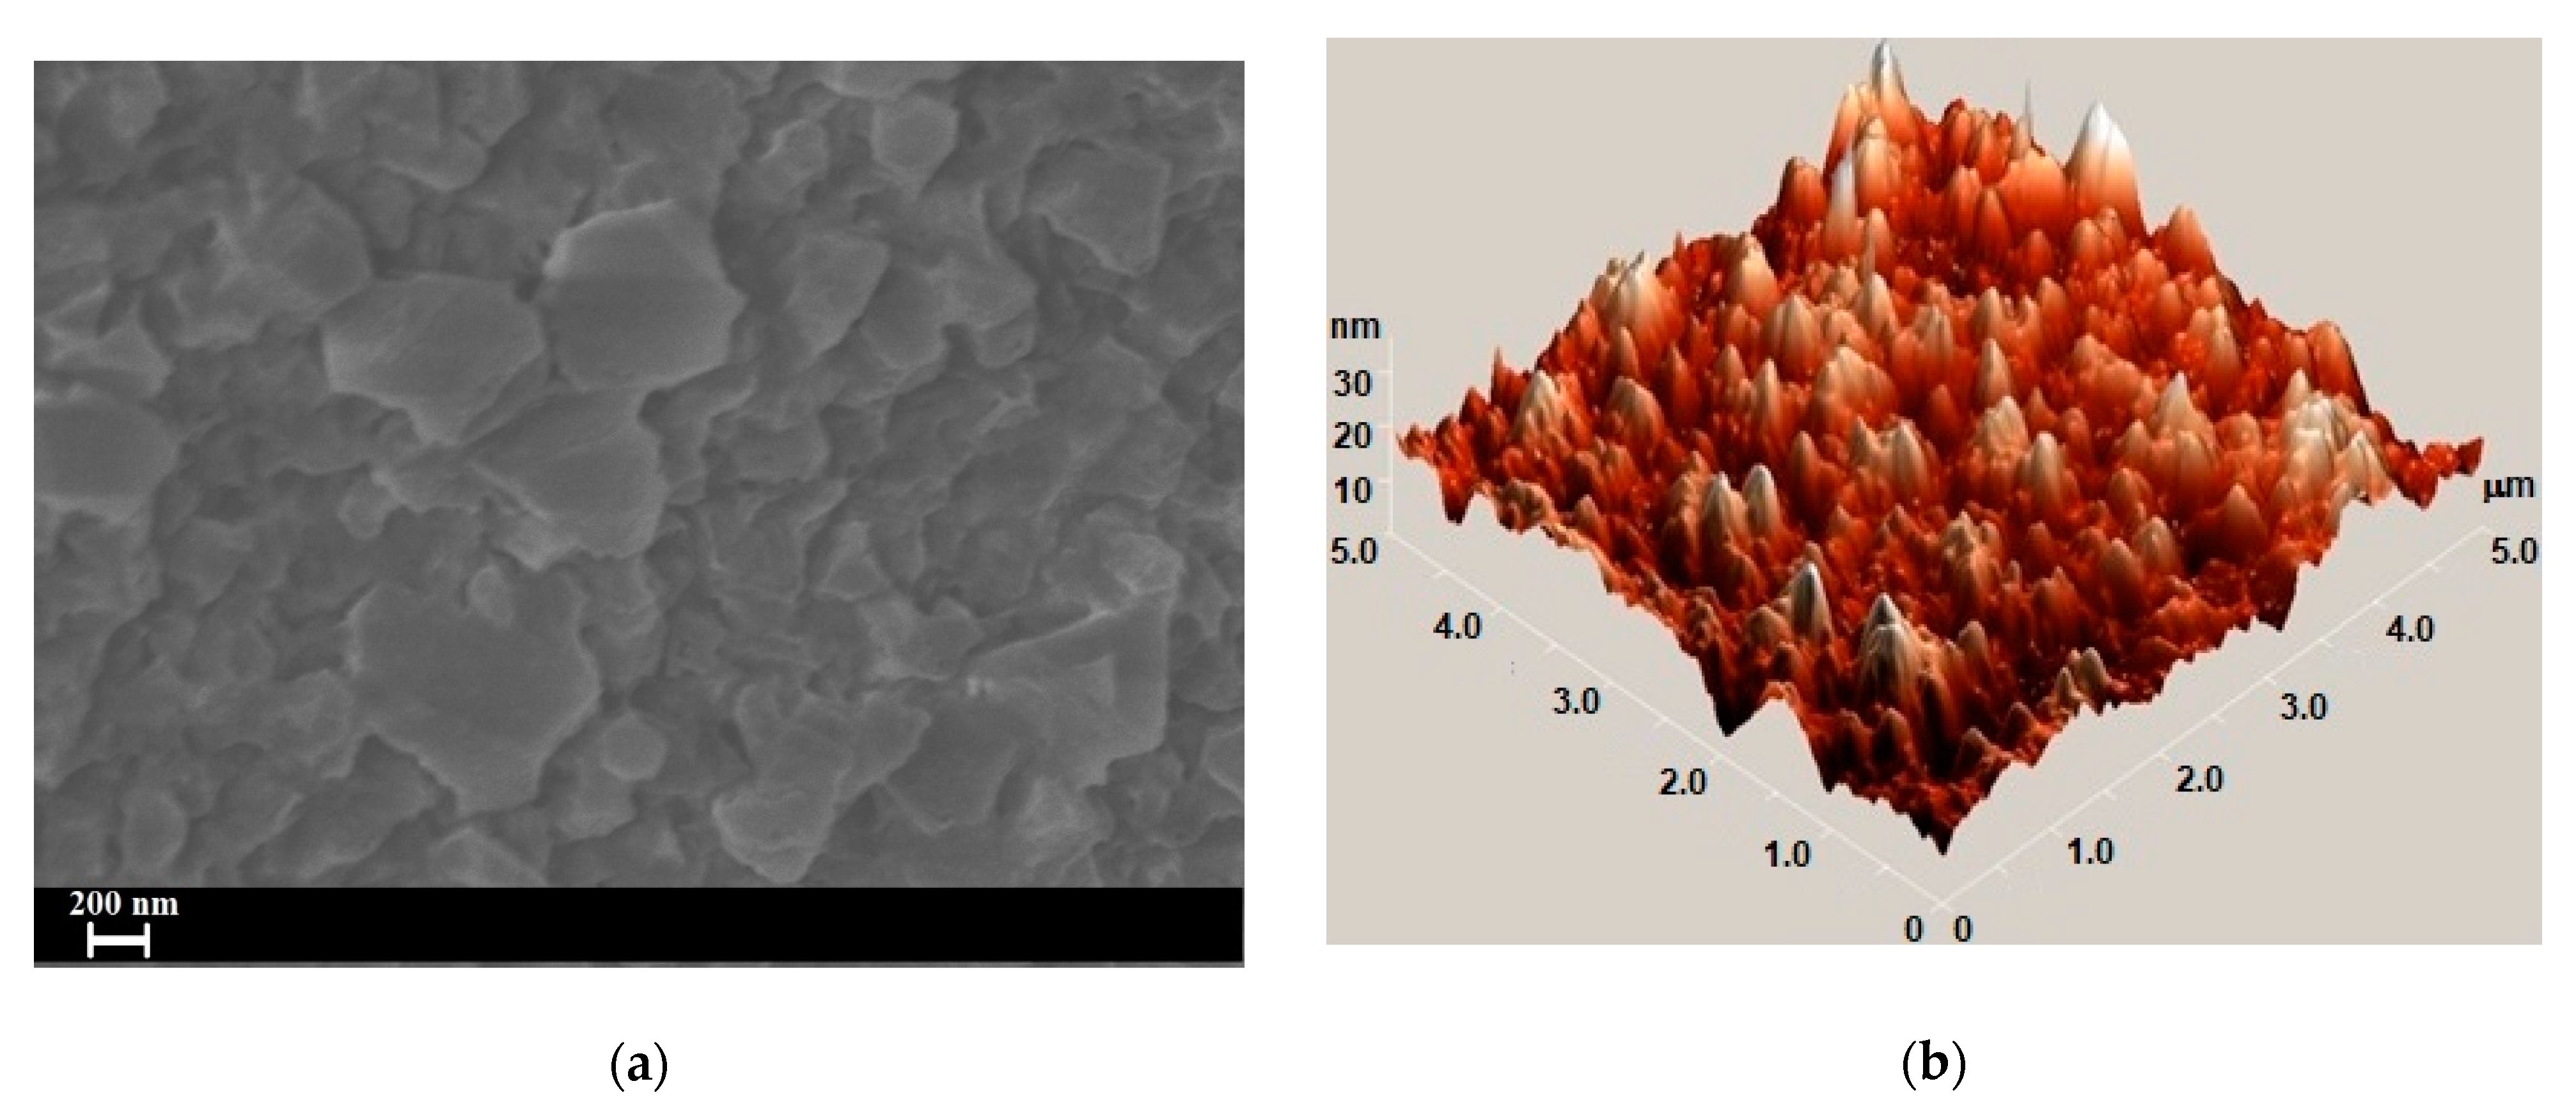
The micrometer-island structure of β–Ga2O3:Eu layer is well emphasized in the SEM micrograph of the GaSe plate, doped with 1.00 at. % Eu, subjected to heat treatment in a humid atmosphere, at 850 °C, for 6 h (Figure 6a). As can be seen from the AFM image (Figure 6b), β–Ga2O3:Eu formations are tower- and cone-shaped and exhibit submicrometric bases.
The fundamental absorption edge of ε–GaSe single crystals is well studied and is determined by the excitonic absorption mechanism [38,39,40]. The absorption coefficient (α) of radiation with wavelength λ, in both specially undoped and 3.00 at. % Eu-doped ε–GaSe single crystals, was determined from measurements of the transmittance (t) and Fresnel reflection coefficient (R) of the sample surface using the relation [41]:
T = (1 − R)2 exp(−αd)/[1 − R2 exp(−2αd)],
where d is the thickness of the plane-parallel sample.
Since the layer formed on the surface of Eu-doped GaSe plates after heat treatment at 900 °C (β–Ga2O3:Eu) is microgranular and strongly diffuses the incident light, the absorption in the vicinity of the fundamental absorption edge of this layer was determined from measurements of the diffuse reflectance (Rd), using the Kubelka–Munk function [42]:
F(Rd)·(1 − Rd)2/(2Rd) = α/S
where α is the absorption coefficient, and S is the radiation scattering factor (diffusion coefficient), which for grain sizes greater than the incident light wavelength is a constant quantity. Therefore, one can write:
α = F(Rd)·S
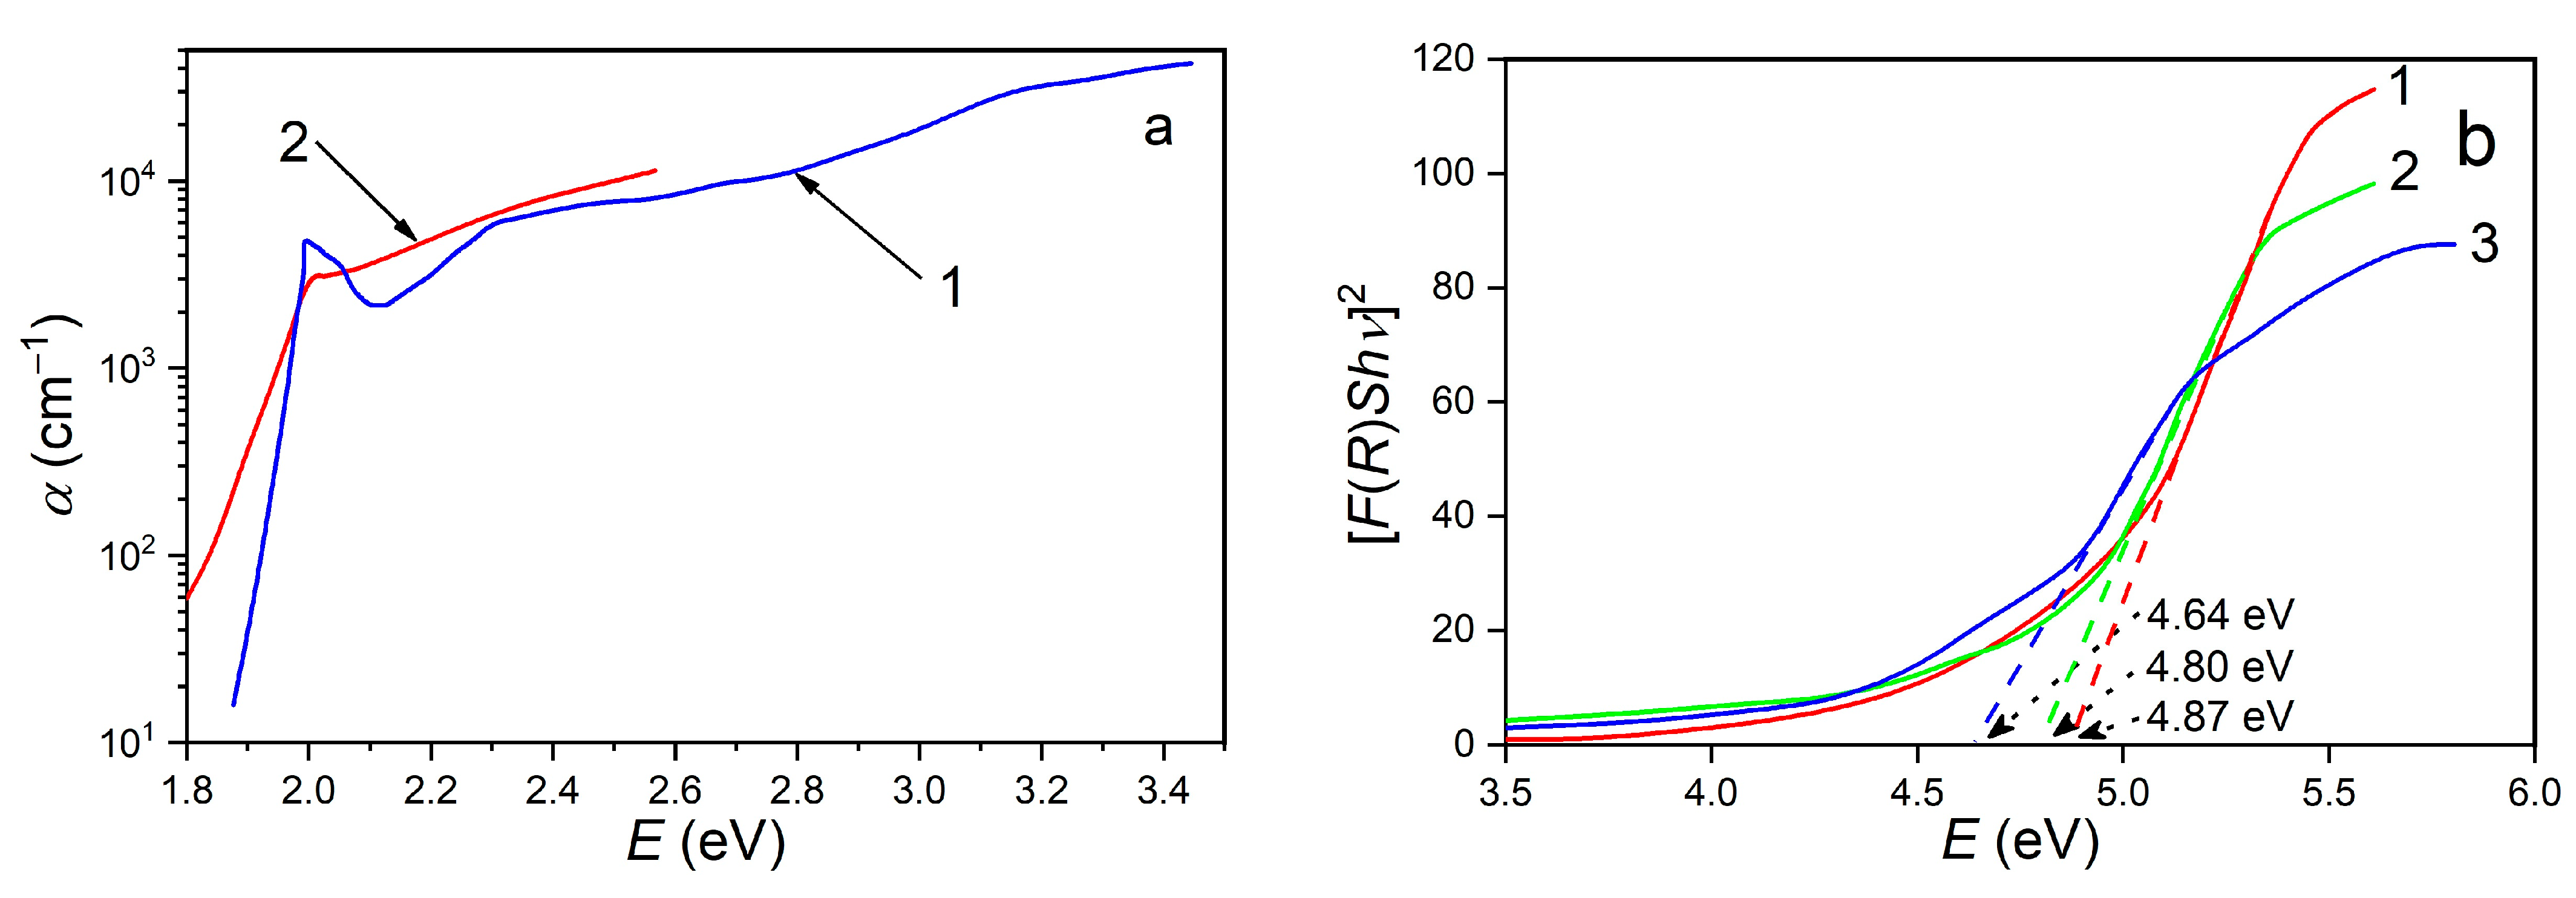
In Figure 7a, absorption spectra of GaSe crystals doped with 0.02 and 3.00 at. % Eu are presented. In the region of the fundamental absorption edge of GaSe:Eu (0.02 at %) crystals, the absorption peak with the formation of n = 1 exciton, located at 1.999 eV (photon energy), is well emphasized. The direct band gap of GaSe crystals, at 293 K, is equal to 2.020 eV [43].
The binding energy of the electron–hole pair in undoped GaSe crystals is 20.6 meV [38], indicating that at room temperature, the excitons are partially ionized. As can be seen from Figure 7a, curve 2, Eu, as a dopant with a concentration of 3.00 at. %, is able to effectively shield the exciton bonds in GaSe:Eu. At the same time, from curve 1, it can be seen that in the photon energy range from 2.30 eV to 3.50 eV, the absorption coefficient in the depth of the fundamental absorption band of GaSe doped with a low Eu concentration (0.02 at. %) increases slowly together with photon energy, from 6 × 10³ to 4 × 104 cm−1. The comparison with the results of previous research reported in [40] demonstrates that the spectral distribution of the absorption coefficient in the depth of the fundamental absorption band of GaSe single crystals weakly depends on the presence of Eu, for moderate concentrations.
In [44], the influence of Al impurities on the absorption spectrum in the region of the fundamental absorption band of GaSe single crystals is studied, from which the absence of excitonic peak by 2.00 eV for 1.00 at. % Al is revealed. The shielding effect of exciton (electron–hole) bonds in ε–GaSe crystals is enhanced in the case of rare-earth doping. The exciton bonds are completely shielded at a doping level of 0.098 at. % Eu in GaSe crystals [45].
As can be seen from the SEM images of β–Ga2O3:Eu layers on GaSe:Eu substrate (Figure 6), the grains producing the light diffusion exhibit submicrometer sizes. Therefore, in the wavelength region λ ≤ 300 μm, one can consider in formula (2) that α~F(R) and, consequently, the direct band gap of β–Ga2O3:Eu layer can be determined by extrapolating the Kubelka–Munk function to zero (Figure 7b), using the relation [46]:
[F(R)hν]2 = A(hν − Eg).
Here, A denotes a constant that is independent of photon energy. As shown in Figure 7b, the direct band gap decreases from 4.87 eV, for β–Ga2O3 on GaSe:Eu (0.05 at. %) to 4.64 eV for β–Ga2O3:Eu on GaSe:Eu (3.00 at. %). The magnitude of the energy band gap of micro- and nanostructured β–Ga2O3 layers depends on many factors, such as manufacturing technology, dopant type and concentration, and substrate nature [47,48,49,50].
The photoluminescence of undoped and Eu-doped (0.02, 0.05, 0.50, 1.00 and 3.00 at. %) GaSe single crystals was excited with laser radiation (wavelength λ = 405 nm and power density P = 5 mW/cm2) at room temperature (293 K). The thickness of the excited layer, of ~2 μm, was estimated by taking into account the value of the absorption coefficient at this wavelength, which was equal to ~1 × 104 cm−1 (Figure 7a) (within this layer thickness, the radiation intensity is attenuated by ~9 times).
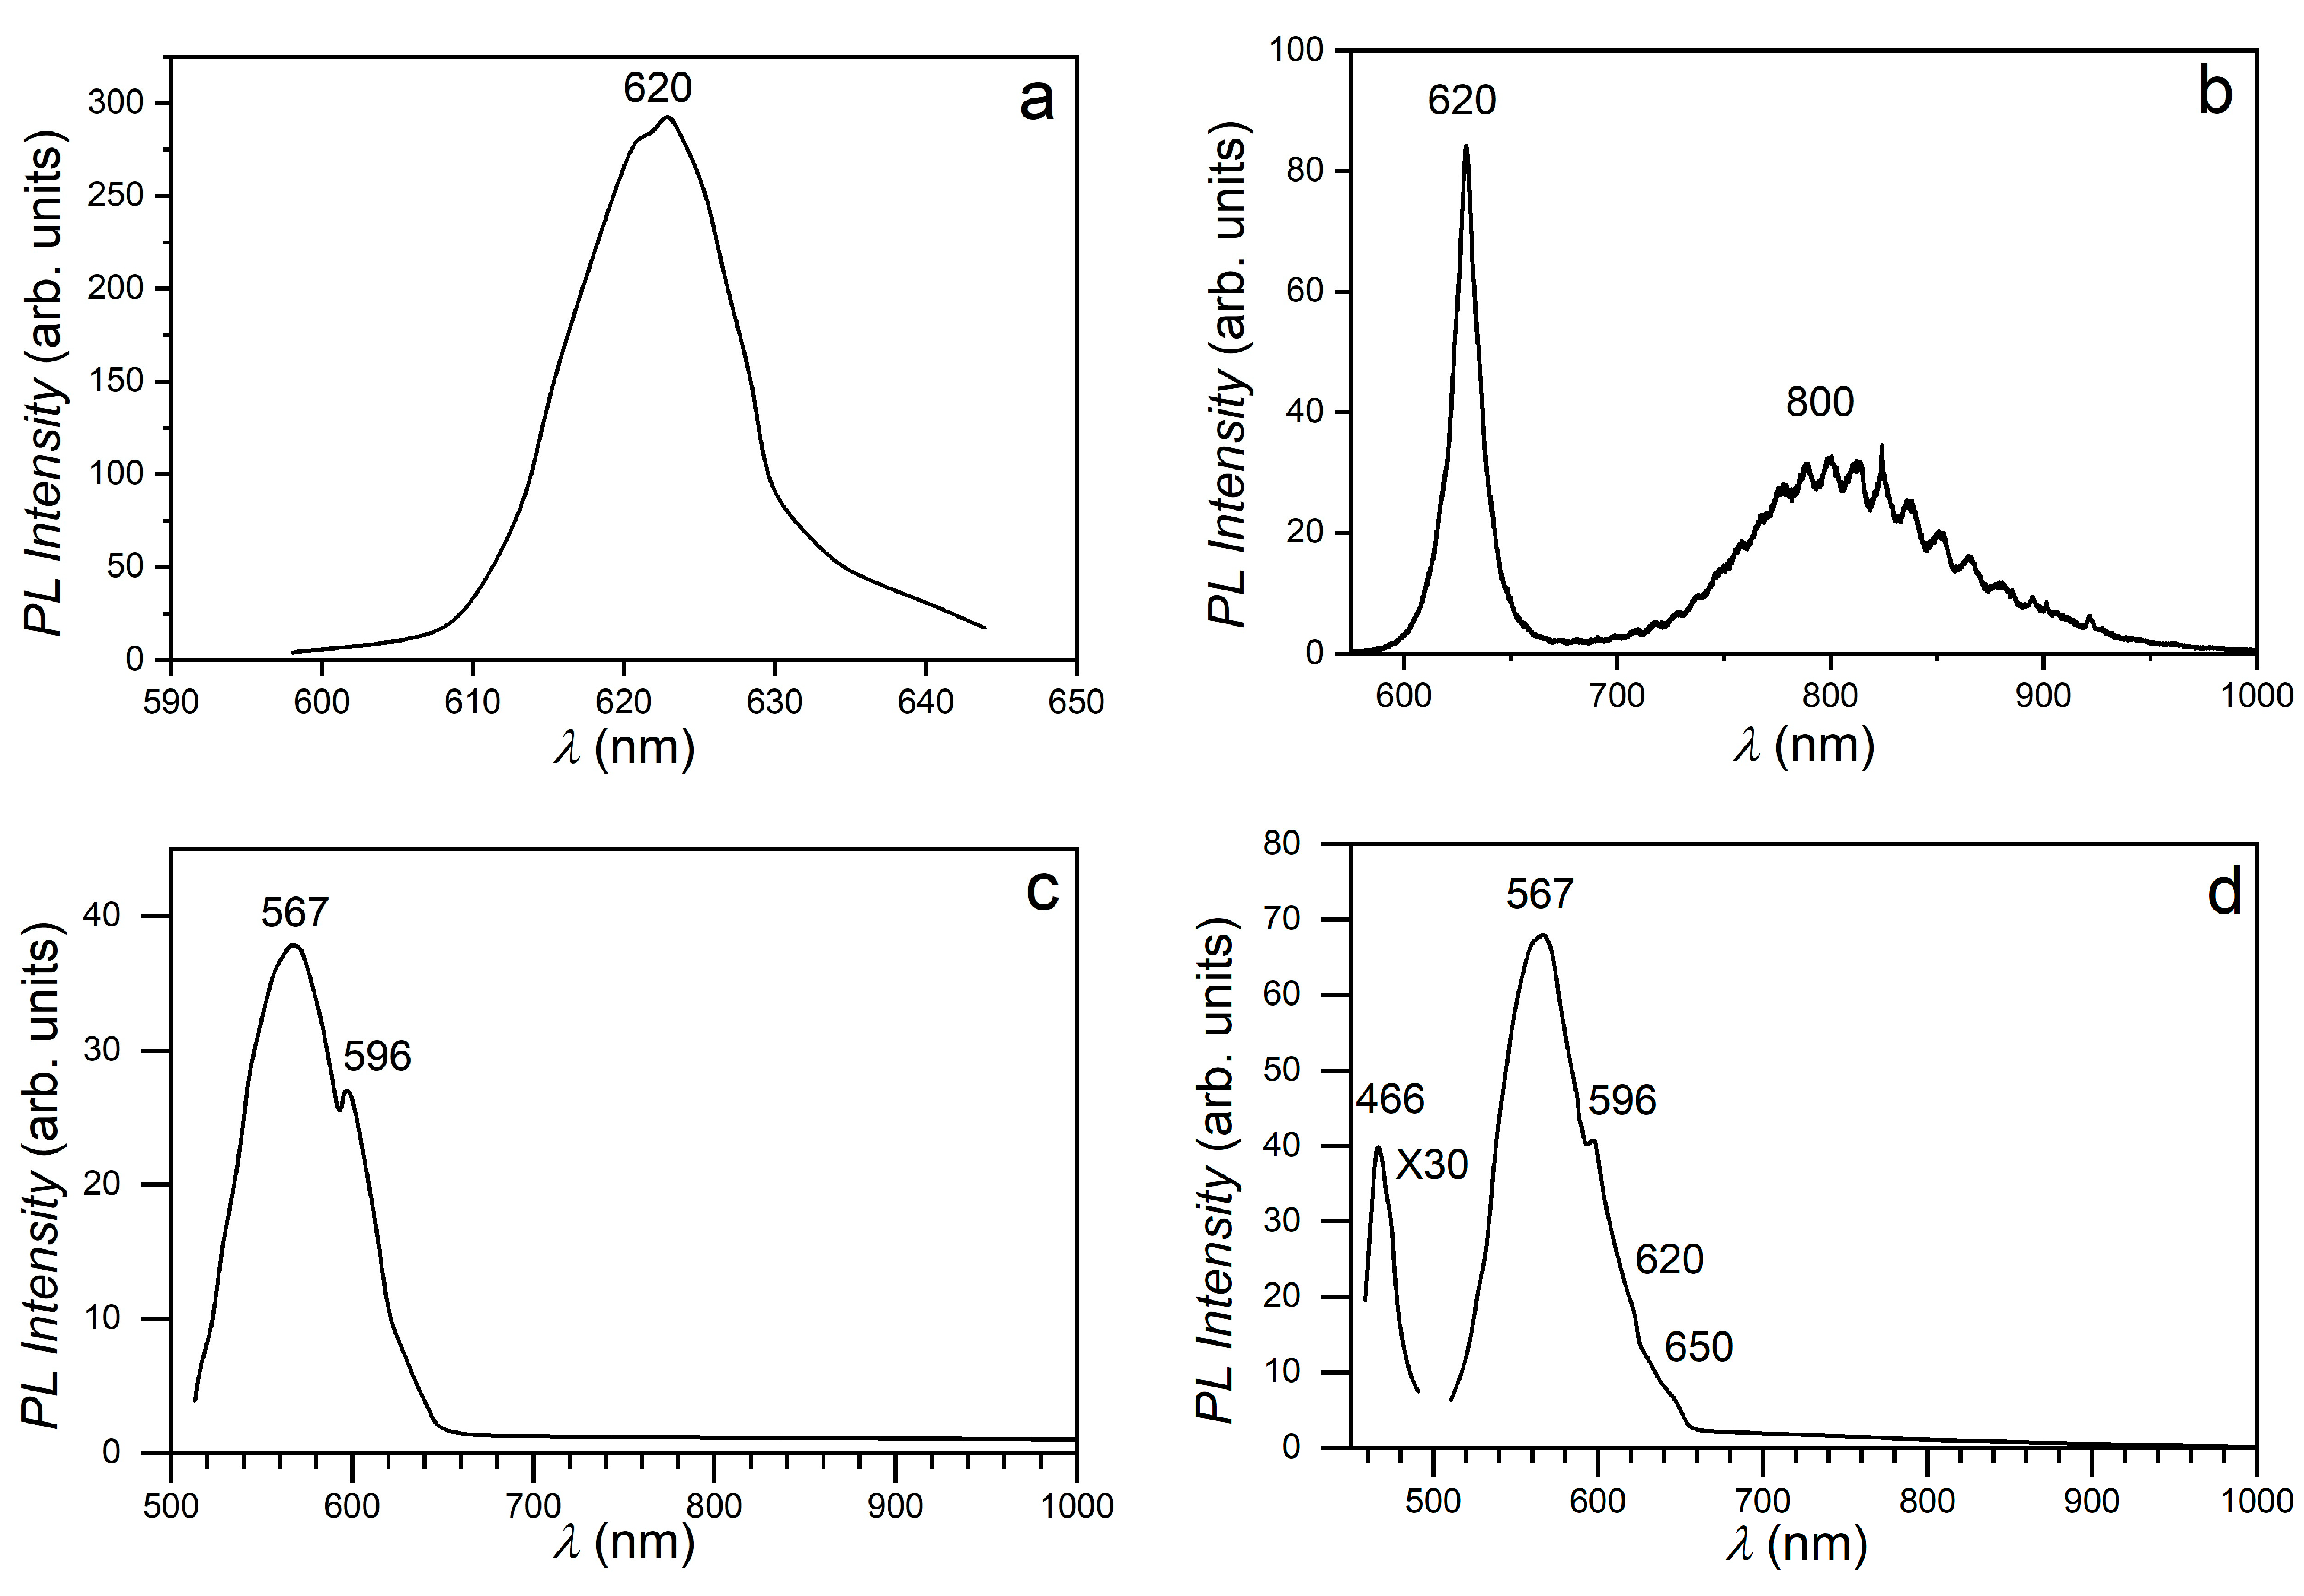
Figure 8a shows the PL spectrum of the single crystalline GaSe plate, which reveals that upon 405 nm excitation, a band with a narrow contoured and maximum peak located at 620 nm (2.00 eV) is formed.
This PL band is probably formed by merging the n = 1 exciton emission band (Figure 7a) with the recombination PL band of nonequilibrium charge carriers in the conduction band with holes in the valence band. An analogous spectrum with a maximum of 2.00 eV was obtained in the PL spectrum of GaSe nanosheets grown from the vapor phase on a Si substrate [51,52].
The PL spectrum of GaSe:Eu crystals (0.02 at. %) (Figure 8) is composed of two bands: one with a narrow contour, of excitonic nature, with maximum photon energy of 2.00 eV, and another with a broad contour and oscillatory structure, with maximum photon energy at ~1.54 eV. Probably by doping the sample with 0.02 at. % Eu, in GaSe crystals, ionized centers are formed to which the excitons can be bound, forming complexes with a binding energy of ~10 meV. The presence of the intense room temperature PL band, with a narrow contoured and maximum peak at 620 nm (2.00 eV), is indicative of the high perfection of GaSe single crystals doped with 0.025 at. % Eu. One can admit that Eu, in concentrations of 0.025 at. %, is able to occupy gallium vacancies (VGa). Since the ionic radius of Eu3+ (0.96 Å) [53] is greater than that of the Ga3+ (0.62 Å), in the VGa region the deformation of the crystal lattice occurs, with a disturbance of Ga and Se positions.
According to its shape, the PL band with maximum intensity at 1.54 eV is of donor–acceptor type.
The low electrical conductivity of GaSe crystals grown via the Bridgman–Stockbarger technique is determined by the fact that they are strongly compensated [54]. The surface donor level in this material is located at ~12 meV with respect to the n = 1 excitonic level [55,56], which contributes to the excessive exciton peak broadening at room temperature (Figure 7a). Taking into account that the exciton binding energy is 20.60 meV, in order to interpret the PL band with maximum intensity at 1.54 eV, it is necessary to admit that at low concentrations, Eu engenders a deep acceptor level in the band gap of GaSe:Eu crystals, located at ~0.447 eV above the top of the valence band. Furthermore, deep acceptor levels can be also formed in the band gap of GaSe single crystals by lanthanides such as Er, Gd [57,58] and isovalent elements In and Al [59].
The parallelism and surface perfection of GaSe plates are necessary requirements for the formation of Fabry–Perrot (FP) cavities, in which interference of photoluminescent radiation may occur. In [52], the PL interference effect was demonstrated in elementary layer assemblies of gallium selenide. Besides, the PL interference effect was observed in FP microcavities in Mn-doped ZnSe nanofibers [10,60]. As can be seen from Figure 8b,h, in the case of near-infrared (NIR) PL band of single crystalline GaSe:Eu (0.02 at %) plates, the interference fringes covering the wavelength ranging from 690 nm up to ~950 nm are well emphasized. The size of the FP cavities can be determined from measurements of the wavelengths λ1 and λ2 for two consecutive maxima/minima (Figure 8h) and of the average refractive index (n) over this wavelength range, using the equation [41]:
l = (1/2n)[(λ1·λ2)/(λ1λ2)].
For a refractive index of GaSe crystals, in the spectral range between 780 and 850 nm, equal to 2.83 [61] and the wavelengths of the interference maxima (minima) in this range, from the above formula, a distance of 9.3 μm is obtained between the reflecting surfaces of the FP cavity.
The fringe contrast factor,
γ = lmax/lmin,
in the center of the PL band, is equal to 1.25. If we neglect the absorbance inside the FP cavity, then the contrast factor depends only on the reflection coefficient (r) of the cavity surface and is given by the expression [62]:
γ = [(1 + r)/(1 − r)]2.
The reflection coefficient, within the frame of this model, is given by:
r = [(n1/n2 − 1)/(n1/n2 + 1)]2.
For γ = 1.25, from (7) and (8), n1n2 =1.64 is obtained. The refractive index of GaSe crystals, at the wavelength λ ≈ 800 nm, is n = 2.86. Therefore, the refractive index of the medium in the FP cavity is equal to 1.74.
When increasing the Eu concentration in the doped GaSe crystals to 0.05 at. %, the PL spectrum transforms into a broad band with a maximum intensity at 567 nm (2.187 eV), located in the region of the fundamental absorption edge of GaSe crystals (Figure 8c), with a threshold at 621 nm (1.998 eV) and a small peak at 596 nm (2.080 eV). Increasing the Eu concentration up to 0.50 at. % leads to an increase in the PL intensity of the 567 nm band by ~5 times; besides, a low-intensity PL band appears in the blue region, with a maximum intensity at 466 nm (2.61 eV) (Figure 8d); when increasing the Eu concentration in GaSe to 1.00 at. % and further, up to 3.00 at. %, the intensity of the yellow band increases, maintaining the peculiarities at 596 nm and 621 nm (Figure 8e). At the same time, the intensity of the blue band increases and its maximum intensity is found to blueshift, located at 452 nm (Figure 8e,f).
The luminescence inside the absorption band of GaSe crystals can be explained if Eu can be found in Eu1+ and Eu2+ at doping concentrations in the range of 0.05–3.00 at. %. The energies of Eu+ ion levels lay in the range of 2.95–3.38 eV [63]. The electron transitions of this ion may correspond to the PL band with a maximum intensity at 452/467 nm. The green-yellow band can be attributed to the electron transitions of the Eu2+. Depending on the crystal lattice in which the Eu2+ ion is found, emission bands with maxima at wavelengths of 555–565 nm can be obtained [64,65,66].
In the PL spectrum of the GaSe:Eu plates subjected to heat treatment in humid air, at 900 °C, for 6–12 h, through which nanostructured β–Ga2O3:Eu3+ layers are formed, new peculiarities appear. As seen from Figure 8f,g, upon excitation with radiation corresponding to the fundamental absorption edge of β–Ga2O3 (λex = 260 nm), the PL spectrum contains, in addition to the PL band with a broad contoured and maximum peak at 550 nm (2.254 eV), two narrow-contour bands with maxima at 590 nm (2.101 eV) and 618 nm (2.006 eV), a plateau by 660 nm (1.878 eV), and a low-intensity broad band with maximum intensity at 709 nm (1.749 eV).
The band with a maximum intensity at 550 nm can be associated with the emission of β–Ga2O3 micro- and nanocrystallites, while the set of bands in the wavelength range from 590 to 750 nm can be interpreted as radiative transitions of Eu3+ ion. The structure of the emission spectrum of Eu3+ ion in β–Ga2O3 is well revealed in the PL spectrum excited with λ = 405 nm (3.06 eV) radiation (Figure 8g). According to the energy level diagram of Eu3+ [64], the PL bands with maxima at wavelengths of 590, 616, 660 and 709 nm are determined by electron transitions from the excited Eu3+ state, 5D0, to the ground state, 7Fj, with j = 1–4. Previously, in the works [20,67,68], fibers and thin films of β–Ga2O3 doped with Eu were prepared, in which the emission spectrum of Eu3+ ions is in good agreement with the PL spectra of actual β–Ga2O3:Eu nanoformations obtained through heat treatment, in humid atmosphere, of GaSe single crystals doped with 3.00 at. % Eu, shown in Figure 8g.

4. Conclusions

Through the Bridgman–Stockbarger technique, single crystals of GaSe doped with 0.02, 0.05, 0.50, 1.00 and 3.00 at. % Eu were obtained.
The fundamental absorption edge in crystals with low Eu concentration (c ≤ 0.025 at. %) is formed by excitons in the n = 1 state.
Europium, in small amounts (c ≈ 0.025 at. %), together with the liquidation of Ga vacancies in the gallium sublattice, forms micrometer-sized resonant cavities in single crystalline GaSe plates, filled with an IR transparent material with a refractive index of ~1.74.
Europium as a dopant, in amounts greater than 0.05 at. %, effectively shields the exciton bonds. For these concentrations, Eu is able to form EuSe and Eu2O3 crystallites in hexagonal GaSe crystals.
Heat treatment of GaSe:Eu plates at 900 °C for 12 h, in a humid atmosphere, leads to the formation of a nanostructured β–Ga2O3 layer doped with Eu on the plates’ surface.
At doping concentrations from 0.05 at. % to 3.00 at. %, Eu can be found in Eu+ and Eu2+ states, while in the nanostructured β–Ga2O3 layer formed on GaSe:Eu (3.00 at. %) substrate, Eu3+ ionized state is active.
The direct band gap in β–Ga2O3:Eu layers depends on the dopant (Eu) concentration and is decreasing from 4.87 eV, for an Eu concentration of 0.05 at. %, up to 4.64 eV, at 3.00 at. % concentration.

Author Contributions

Conceptualization, V.S., O.L., C.A., L.L. and M.C; methodology, H.Q. and T.T.; software, A.C. and D.U.; validation, C.A. and R.A.; formal analysis, S.G.; investigation, V.S., O.L., R.A. and M.C.; resources, H.Q.; data curation, T.T. and O.L.; writing—original draft preparation, V.S., M.C., H.Q., T.T., O.L. and L.L.; writing—review and editing, L.L.; visualization, A.C., S.G. and D.U.; supervision, M.C.; project administration, V.S.; funding acquisition, S.G. All authors have read and agreed to the published version of the manuscript.

Funding

This work was supported by the Ministry of Research, Innovation and Digitization, CNCS–UEFISCDI, project number PN-III-P1-1.1-PD-2021-0208, PD 53, within PNCDI III. VS and MC gratefully acknowledge the support provided by the National Agency for Research and Development and the Moldova State University through grant number 20.80009.7007.05. We acknowledge funding from the—SulfurSilicon Batteries (SuSiBaBy) Project from the EUSH and EFRE in SH (LPW-E/3.1.1/1801). The German Research Foundation (DFG—Deutsche For-schungsgemeinschaft) provided additional support through various schemes, including Project-ID 434434223-SFB 1461, Project-ID 286471992-SFB 1261 project A2, GRK 2154 project P4 and AD 183/16-1.

Institutional Review Board Statement

Not applicable.

Informed Consent Statement

Not applicable.

Data Availability Statement

Data are contained within the article.

Acknowledgments

Authors are thankful to Romanian Ministry of Research, Innovation and Digitization, within Program 1—Development of the national RD system, Subprogram 1.2—Institutional Performance—RDI excellence funding projects, Contract no.11PFE/30.12.2021, for financial support.

Conflicts of Interest

The authors declare no conflicts of interest.

References

  1. Kuhn, A.; Chevy, A.; Chevalier, R. Crystal structure and interatomic distances in GaSe. Phys. Status Solidi A 1975, 31, 469–475. [Google Scholar] [CrossRef]
  2. Plucinski, L.; Johnson, R.L.; Kowalski, B.J.; Kopalko, K.; Orlowski, B.A.; Kovalyuk, Z.D.; Lashkarev, G.V. Electronic band structure of GaSe (0001): Angle-resolved photoemission and ab initio theory. Phys. Rev. B 2003, 68, 125304. [Google Scholar] [CrossRef]
  3. Balakrishnan, N.; Steer, E.D.; Smith, E.F.; Kudrynskyi, Z.R.; Kovalyuk, Z.D.; Eaves, L.; Patanè, A.; Beton, P.H. Epitaxial growth of γ–InSe and α, β, and γ–In2Se3 on ε–GaSe. 2D Mater. 2018, 5, 035026. [Google Scholar] [CrossRef]
  4. Hopkinson, D.G.; Zólyomi, V.; Rooney, A.P.; Clark, N.; Terry, D.J.; Hamer, M.; Lewis, D.J.; Allen, C.S.; Kirkland, A.I.; Andreev, Y.; et al. Formation and healing of defects in atomically thin GaSe and InSe. ACS Nano 2019, 13, 5112–5123. [Google Scholar] [CrossRef] [PubMed]
  5. Mooser, E.; Schluter, M. The band-gap excitons in GaSe. Nuovo Cim. B 1973, 18, 164–208. [Google Scholar] [CrossRef]
  6. Schlüter, M. The electronic structure of GaSe. Nuovo Cim. B 1973, 13, 313–360. [Google Scholar] [CrossRef]
  7. Hu, P.; Wen, Z.; Wang, L.; Tan, P.; Xiao, K. Synthesis of few-layer GaSe nanosheets for high performance photodetectors. ACS Nano 2012, 6, 5988–5994. [Google Scholar] [CrossRef]
  8. Sorifi, S.; Moun, M.; Kaushik, S.; Singh, R. High-temperature performance of a GaSe nanosheet-based broadband photodetector. ACS Appl. Electron. Mater. 2020, 2, 670–676. [Google Scholar] [CrossRef]
  9. Guo, J.; Xie, J.-J.; Zhang, L.-M.; Kokh, K.; Andreev, Y.; Izaak, T.; Lanskii, G.; Shaĭduko, A.; Svetlichnyi, V. Characterization of optical quality of GaSe:Al crystals by exciton absorption peak parameters. J. Mater. Sci. Mater. Electron. 2014, 25, 1757–1760. [Google Scholar] [CrossRef]
  10. Cui, Y.; Dupere, R.; Burger, A.; Johnstone, D.; Mandal, K.C.; Payne, S.A. Acceptor levels in GaSe:In crystals investigated by deep-level transient spectroscopy and photoluminescence. J. Appl. Phys. 2008, 103, 013710. [Google Scholar] [CrossRef]
  11. Hsu, Y.-K.; Chang, C.-S.; Hsieh, W.-F. Photoluminescence study of GaSe doped with Er. Jpn. J. Appl. Phys. 2003, 42, 4222. [Google Scholar] [CrossRef]
  12. Kim, C.-D.; Jang, K.-W.; Lee, Y.-I. Optical properties of Tm-doped GaSe single crystals. Solid State Commun. 2004, 130, 701–704. [Google Scholar] [CrossRef]
  13. Drapak, S.I.; Gavrylyuk, S.V.; Kovalyuk, Z.D.; Lytvyn, O.S. Native oxide emerging of the cleavage surface of gallium selenide due to prolonged storage. Semiconductors 2008, 42, 414–421. [Google Scholar] [CrossRef]
  14. Balitskii, O.A.; Savchyn, V.P. Thermodynamic study of AIIIBVI compounds oxidation. Mater. Sci. Semicond. Process. 2004, 7, 55–58. [Google Scholar] [CrossRef]
  15. Filippo, E.; Siciliano, M.; Genga, A.; Micocci, G.; Tepore, A.; Siciliano, T. Single crystalline β-Ga2O3 nanowires synthesized by thermal oxidation of GaSe layer. Mater. Res. Bull. 2013, 48, 1741–1744. [Google Scholar] [CrossRef]
  16. Kowalski, B.M.; Manz, N.; Bethke, D.; Shaner, E.A.; Serov, A.; Kalugin, N.G. Role of humidity in oxidation of ultrathin GaSe. Mater. Res. Express 2019, 6, 085907. [Google Scholar] [CrossRef]
  17. Beechem, T.E.; Kowalski, B.M.; Brumbach, M.T.; McDonald, A.E.; Spataru, C.D.; Howell, S.W.; Ohta, T.; Pask, J.A.; Kalugin, N.G. Oxidation of ultrathin GaSe. Appl. Phys. Lett. 2015, 107, 173103. [Google Scholar] [CrossRef]
  18. Nogales, E.; Lopez, I.; Mendez, B.; Piqueras, J.; Lorenz, K.; Alves, E.; Garcia, J.A.; Teherani, F.H.; Look, D.; Rogers, D.J. Doped gallium oxide nanowires for photonics. In Proceedings of the International Society for Optics and Photonics (SPIE OPTO), San Francisco, CA, USA, 21–26 January 2012. [Google Scholar]
  19. Chen, Z.; Wang, X.; Zhang, F.; Noda, S.; Saito, K.; Tanaka, T.; Nishio, M.; Guo, Q. Temperature dependence of luminescence spectra in europium doped Ga2O3 film. J. Lumin. 2016, 177, 48–53. [Google Scholar] [CrossRef]
  20. Chen, Z.; Saito, K.; Tanaka, T.; Nishio, M.; Arita, M.; Guo, Q. Low temperature growth of europium doped Ga2O3 luminescent films. J. Cryst. Growth 2015, 430, 28–33. [Google Scholar] [CrossRef]
  21. Late, D.J.; Liu, B.; Luo, J.; Yan, A.; Matte, H.S.S.R.; Grayson, M.; Rao, C.N.R.; Dravid, V.P. GaS and GaSe ultrathin layer transistors. Adv. Mater. 2012, 24, 3549–3554. [Google Scholar] [CrossRef]
  22. Kumar, S.; Singh, R. Nanofunctional gallium oxide (Ga2O3) nanowires/nanostructures and their applications in nanodevices. Phys. Status Solidi Rapid Res. Lett. 2013, 7, 781–792. [Google Scholar] [CrossRef]
  23. Wang, T.; Li, J.; Zhao, Q.; Yin, Z.; Zhang, Y.; Chen, B.; Xie, Y.; Jie, W. High-quality GaSe single crystal grown by the Bridgman method. Materials 2018, 11, 186. [Google Scholar] [CrossRef]
  24. Santos, N.F.; Rodrigues, J.; Fernandes, A.J.S.; Alves, L.C.; Alves, E.; Costa, F.M.; Monteiro, T. Optical properties of LFZ grown β-Ga2O3:Eu3+ fibres. Appl. Surf. Sci. 2012, 258, 9157–9161. [Google Scholar] [CrossRef]
  25. Kumar, S.; Prakash, R.; Choudhary, R.J.; Phase, D.M. Structural, XPS and magnetic studies of pulsed laser deposited Fe doped Eu2O3 thin film. Mater. Res. Bull. 2015, 70, 392–396. [Google Scholar] [CrossRef]
  26. Mesaros, A.; Toloman, D.; Nasui, M.; Mos, R.B.; Petrisor, T.; Vasile, B.S.; Surdu, V.A.; Perhaita, I.; Biris, A.; Pana, O. A valence states approach for luminescence enhancement by low dopant concentration in Eu-doped ZnO nanoparticles. J. Mater. Sci. 2015, 50, 6075–6086. [Google Scholar] [CrossRef]
  27. Du, H.; Tu, M.; Luo, S.; Liu, Y.; Qiu, X.; Lu, H.; Li, S.; Yuan, S.; Huang, W.; Jie, W.; et al. Reversible transition between bipolar resistive switching and threshold switching in 2D layered III–VI semiconductor GaSe. Appl. Phys. Lett. 2020, 116, 253102. [Google Scholar] [CrossRef]
  28. Zappia, M.I.; Bianca, G.; Bellani, S.; Serri, M.; Najafi, L.; Oropesa-Nuñez, R.; Martín-García, B.; Bouša, D.; Sedmidubský, D.; Pellegrini, V.; et al. Solution-Processed GaSe Nanoflake-Based Films for Photoelectrochemical Water Splitting and Photoelectrochemical-Type Photodetectors. Adv. Funct. Mater. 2020, 30, 1909572. [Google Scholar] [CrossRef]
  29. Afaneh, T.; Fryer, A.; Xin, Y.; Hyde, R.H.; Kapuruge, N.; Gutiérrez, H.R. Large-area growth and stability of monolayer gallium monochalcogenides for optoelectronic devices. ACS Appl. Nano Mater. 2020, 3, 7879–7887. [Google Scholar] [CrossRef]
  30. Hoff, R.M.; Irwin, J.C.; Lieth, R.M.A. Raman scattering in GaSe. Can. J. Phys. 1975, 53, 1606–1614. [Google Scholar] [CrossRef]
  31. Yu, J.; Cui, L.; He, H.; Yan, S.; Hu, Y.; Wu, H. Raman spectra of RE2O3 (RE = Eu, Gd, Dy, Ho, Er, Tm, Yb, Lu, Sc and Y): Laser-excited luminescence and trace impurity analysis. J. Rare Earths 2014, 32, 1–4. [Google Scholar] [CrossRef]
  32. Ousaka, Y.; Sakai, O.; Tachiki, M. Theory of Raman scattering in magnetically ordered phases of EuSe and EuTe. Solid State Commun. 1977, 23, 589–592. [Google Scholar] [CrossRef]
  33. Rau, R.C.; Glover, W.J., Jr. Thermal decomposition of europium hydroxide. J. Am. Ceram. Soc. 1964, 47, 382–387. [Google Scholar] [CrossRef]
  34. Silberstein, R.P.; Safran, S.A.; Dresselhaus, M.S. First-and second-order Raman scattering in EuSe near TN. J. Magn. Magn. Mater. 1979, 11, 408–411. [Google Scholar] [CrossRef]
  35. Dohy, D.; Lucazeau, G.; Revcolevschi, A. Raman spectra and valence force field of single-crystalline β-Ga2O3. J. Solid State Chem. 1982, 45, 180–192. [Google Scholar] [CrossRef]
  36. Chen, Z.; Wang, X.; Saito, K.; Tanaka, T.; Nishio, M.; Guo, Q. The impact of growth temperature on the structural and optical properties of catalyst-free β-Ga2O3 nanostructures. Mater. Res. Express 2016, 3, 025003. [Google Scholar] [CrossRef]
  37. Filippo, E.; Tepore, M.; Baldassarre, F.; Siciliano, T.; Micocci, G.; Quarta, G.; Calcagnile, L.; Tepore, A. Synthesis of β-Ga2O3 microstructures with efficient photocatalytic activity by annealing of GaSe single crystal. Appl. Surf. Sci. 2015, 338, 69–74. [Google Scholar] [CrossRef]
  38. Pearton, S.J.; Yang, J.; Cary, P.H., IV; Ren, F.; Kim, J.; Tadjer, M.J.; Mastro, M.A. A review of Ga2O3 materials, processing, and devices. App. Phys. Rev. 2018, 5, 011301. [Google Scholar] [CrossRef]
  39. Zalamai, V.V.; Syrbu, N.N.; Stamov, I.G.; Beril, S.I. Wannier-Mott excitons in GaSe single crystals. J. Opt.-UK 2020, 22, 085402. [Google Scholar] [CrossRef]
  40. Gnatenko, Y.P.; Skubenko, P.A. Exciton absorption of GaSe crystals in the indirect transition region. Phys. Status Solidi B 1981, 105, K9–K12. [Google Scholar] [CrossRef]
  41. Bassou, A. Optical properties of GaSe, characterization and simulation. Mater. Today Proc. 2021, 37, 3789–3792. [Google Scholar] [CrossRef]
  42. Pankove, J.I. Optical Processes in Semiconductors, 1st ed.; Prentice-Hall: Hoboken, NJ, USA, 1971. [Google Scholar]
  43. Boldish, S.I.; White, W.B. Optical band gaps of selected ternary sulfide minerals. Am. Mineral. 1998, 83, 865–871. [Google Scholar] [CrossRef]
  44. Forney, J.J.; Maschke, K.; Mooser, E. Influence of stacking disorder on Wannier excitons in layered semiconductors. J. Phys. C Solid State Phys. 1977, 10, 1887–1894. [Google Scholar] [CrossRef]
  45. Andreev, Y.M.; Vaitulevich, E.A.; Kokh, K.A.; Lanskii, G.V.; Losev, V.F.; Lubenko, D.M.; Svetlichnyi, V.A.; Soldatov, A.N.; Shaiduko, A.V. Optimal doping of GaSe crystals for nonlinear optics applications. Russ. Phys. J. 2014, 56, 1250–1257. [Google Scholar] [CrossRef]
  46. Feng, Z.-S.; Guo, J.; Xie, J.-J.; Zhang, L.-M.; Gao, J.-Y.; Andreev, Y.M.; Izaak, T.I.; Kokh, K.A.; Lanskii, G.V.; Shaiduko, A.V.; et al. GaSe: Er3+ crystals for SHG in the infrared spectral range. Opt. Commun. 2014, 318, 205–211. [Google Scholar] [CrossRef]
  47. Murphy, A.B. Band-gap determination from diffuse reflectance measurements of semiconductor films, and application to photoelectrochemical water-splitting. Sol. Energy Mater. Sol. Cells 2007, 91, 1326–1337. [Google Scholar] [CrossRef]
  48. Hou, Y.; Wu, L.; Wang, X.; Ding, Z.; Li, Z.; Fu, X. Photocatalytic performance of α-, β-, and γ-Ga2O3 for the destruction of volatile aromatic pollutants in air. J. Catal. 2007, 250, 12–18. [Google Scholar] [CrossRef]
  49. Kumar, S.; Tessarek, C.; Christiansen, S.; Singh, R. A comparative study of β–Ga2O3 nanowires grown on different substrates using CVD technique. J. Alloys Compd. 2014, 587, 812–818. [Google Scholar] [CrossRef]
  50. Alema, F.; Hertog, B.; Osinsky, A.; Mukhopadhyay, P.; Toporkov, M.; Schoenfeld, W.V. Fast growth rate of epitaxial β–Ga2O3 by close coupled showerhead MOCVD. J. Cryst. Growth 2017, 475, 77–82. [Google Scholar] [CrossRef]
  51. Zhang, F.; Li, H.; Cui, Y.-T.; Li, G.-L.; Guo, Q. Evolution of optical properties and band structure from amorphous to crystalline Ga2O3 films. AIP Adv. 2018, 8, 045112. [Google Scholar] [CrossRef]
  52. Tan, L.; Liu, Q.; Ding, Y.; Lin, X.; Hu, W.; Cai, M.-Q.; Zhou, H. Effective shape-controlled synthesis of gallium selenide nanosheets by vapor phase deposition. Nano Res. 2020, 13, 557–563. [Google Scholar] [CrossRef]
  53. Shyama, P.S. Europium; Springer: Heidelberg, Germany, 1968; p. 30. [Google Scholar]
  54. Quan, S.; Wang, Y.; Liang, Y.; Jiang, J.; Zhong, B.; Yu, K.; Zhang, H.; Kan, G. Interference effect on photoluminescence intensity in GaSe up to 200 layers. J. Phys. Chem. C 2020, 124, 10185–10191. [Google Scholar] [CrossRef]
  55. Schmid, P.; Voitchovsky, J.P.; Mercier, A. Impurity effects on low temperature photoluminescence of GaSe. Phys. Status Solidi A 1974, 21, 443–450. [Google Scholar] [CrossRef]
  56. Bernier, G.; Jandl, S.; Provencher, R. Spontaneous and stimulated photoluminescence of GaSe in the energy range 2.075–2.125 eV. J. Lumin. 1986, 35, 289–300. [Google Scholar] [CrossRef]
  57. Capozzi, V.; Montagna, M. Optical spectroscopy of extrinsic recombinations in gallium selenide. Phys. Rev. B Condens. Matter 1989, 40, 3182–3190. [Google Scholar] [CrossRef] [PubMed]
  58. Hsu, Y.-K.; Chang, C.-S.; Huang, W.-C. Electrical properties of GaSe doped with Er. J. Appl. Phys. 2004, 96, 1563–1567. [Google Scholar] [CrossRef]
  59. Gürbulak, B.; Yildirim, M.; Tüzemen, S.; Efeoǧlu, H.; Yoǧurtçu, Y.K. Temperature dependence of galvanomagnetic properties for Gd doped and undoped p-type GaSe. J. Appl. Phys. 1998, 83, 2030–2034. [Google Scholar] [CrossRef]
  60. Zhou, W.; Liu, R.; Tang, D.; Zou, B. The effect of dopant and optical micro-cavity on the photoluminescence of Mn-doped ZnSe nanobelts. Nanoscale Res. Lett. 2013, 8, 314. [Google Scholar] [CrossRef]
  61. Zhou, W.; Liu, R.; Tang, D.; Wang, X.; Fan, H.; Pan, A.; Zhang, Q.; Wan, Q.; Zou, B. Luminescence and local photonic confinement of single ZnSe: Mn nanostructure and the shape dependent lasing behavior. Nanotechnology 2013, 24, 055201. [Google Scholar] [CrossRef]
  62. Le Toullec, R.; Piccioli, N.; Mejatty, M.; Balkanski, M. Optical constants of ε-GaSe. Nuovo Cim. B 1977, 38, 159–167. [Google Scholar] [CrossRef]
  63. Natanovich, Z.A.; Vsevolodovna, O.G.; Isaevich, O.Y. Technique and Practice of Spectroscopy; Nauka: Moscow, Russia, 1972; p. 169. (In Russian) [Google Scholar]
  64. Sinha, S.P. Europium; Springer: New York, NY, USA, 1967. [Google Scholar]
  65. Peters, T.E.; Baglio, J.A. Luminescence and structural properties of thiogallate phosphors Ce+3 and Eu+2—Activated Phosphors. Part I. J. Electrochem. Soc. 1972, 119, 230. [Google Scholar] [CrossRef]
  66. Hidaka, C.; Yamagishi, E.; Takizawa, T. Preparation of Ca(1-x)EuxGa2S4 crystals and their photoluminescence, absorption and excitation spectra. J. Phys. Chem. Solids 2005, 66, 2058–2060. [Google Scholar] [CrossRef]
  67. Georgobiani, A.N.; Sturov, V.V.; Tyutyunnikov, V.I.; Tagiev, B.G.; Tagiev, O.B.; Djabborov, R.B. Radical-recombination luminescence, ion-luminescence and photoluminescence of CaGa2S4:Eu. J. Phys. Chem. Solids 2003, 64, 1519–1524. [Google Scholar] [CrossRef]
  68. Zhao, J.; Zhang, W.; Xie, E.; Ma, Z.; Zhao, A.; Liu, Z. Structure and photoluminescence of β–Ga2O3: Eu3+ nanofibers prepared by electrospinning. Appl. Surf. Sci. 2011, 257, 4968–4972. [Google Scholar] [CrossRef]
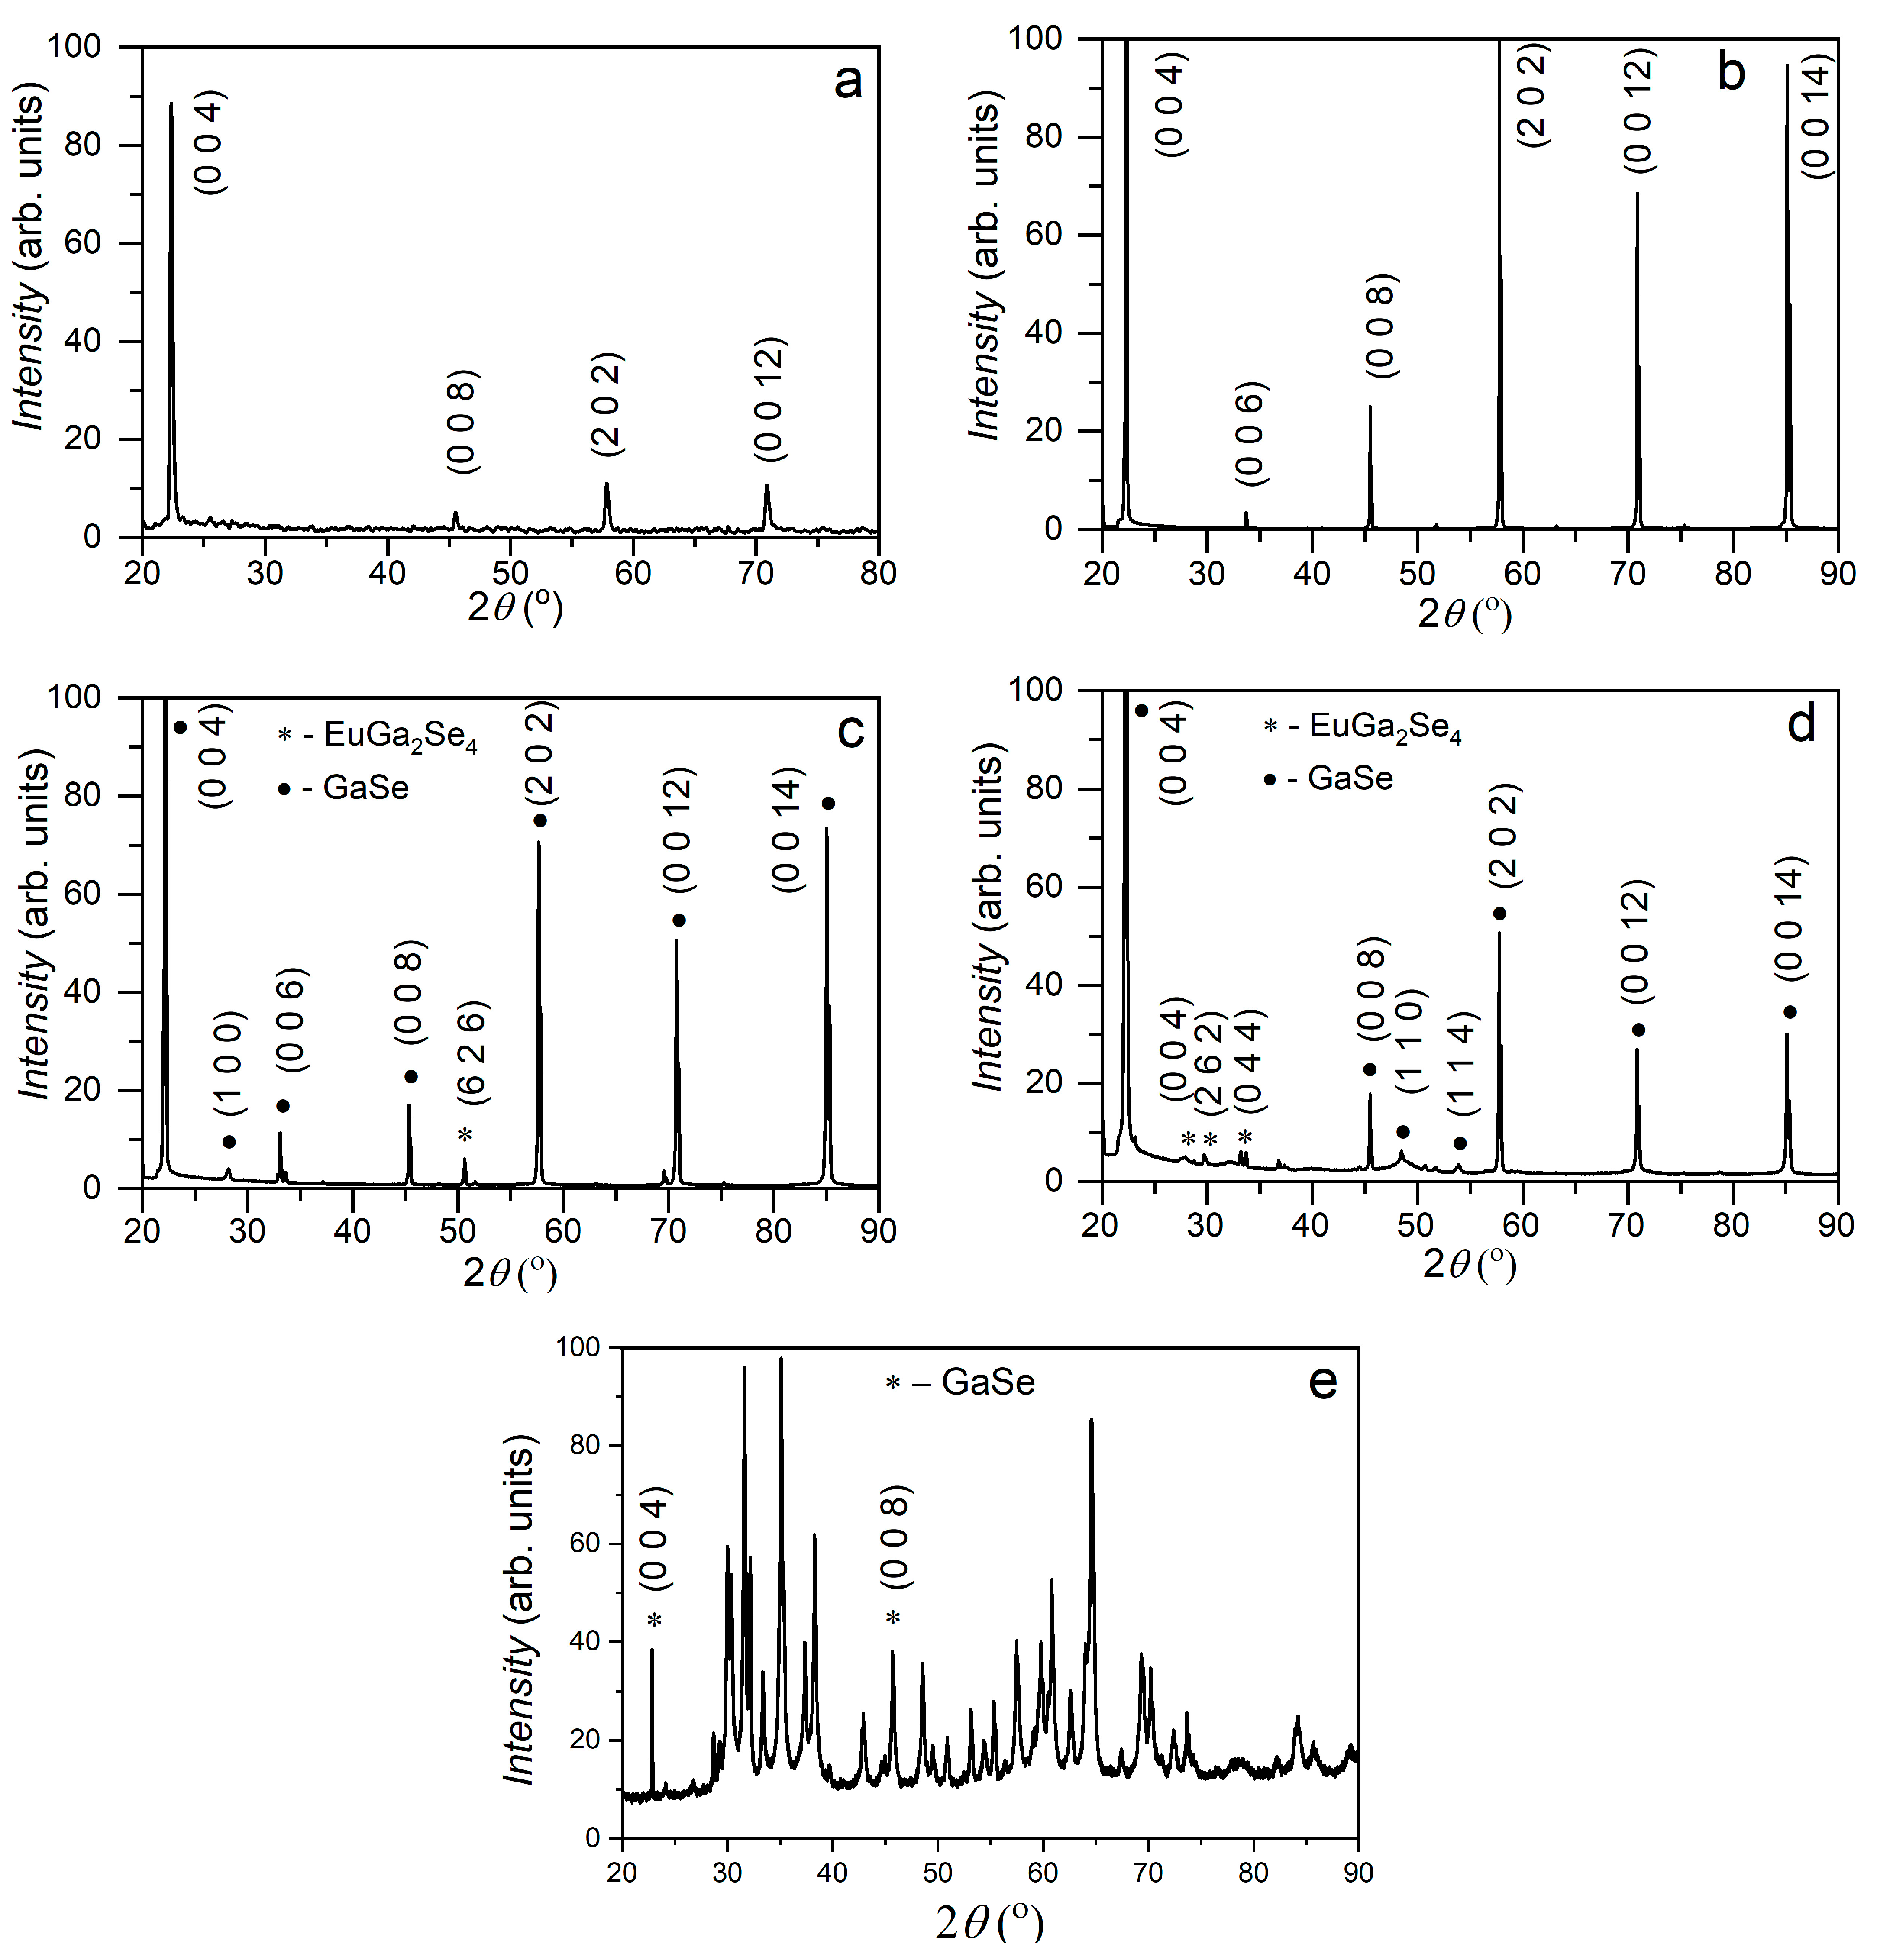
Figure 1. XRD plots of GaSe single crystals, undoped (a) and Eu-doped with different concentrations: 0.05 at. % (b), 1.00 at. % (c), 3.00 at. % (d); material obtained through 12 h heat treatment, at 900 °C, in water vapor-enriched atmosphere, of GaSe:Eu (3.00 at. %) plates (e).
Materials 17 00405 g001
Figure 2. (a) XPS survey spectra of the heat-treated GaSe:Eu sample before and after a total of 90 min of Ar cleaning, indicating the presence of O, C and Ga at the sample surface. The inset graph shows the Ga 2p region (higher resolution). A slight increase in the intensity of Eu-related lines can be observed after Ar cleaning. (b) High-resolution scan of the Ga 2p signal with Eu 3d as a reference, according to [6]. ΔE1 and ΔE2 shifts, with respect to the main peaks, are emphasized.
Materials 17 00405 g002
Figure 3. Raman spectra of GaSe:Eu single crystals for doping concentrations: (a) 0.02 at. %, (b) 0.05 at. %, (c) 1.00 at. % and (d) 3.00 at. %.
Materials 17 00405 g003aMaterials 17 00405 g003b
Figure 4. Raman spectra of GaSe:Eu (3.00 at. %) after annealing in a humid atmosphere at 900 °C for 6 h.
Materials 17 00405 g004
Figure 5. Filtered Raman image of GaSe:Eu (3.00 at. %) after annealing at 900 °C for 6 h, in terms of mode A g ( 3 ) (201 cm−1) of Ga2O3.
Materials 17 00405 g005
Figure 6. (a) SEM image of β–Ga2O3:Eu3+ layer formed on the surface of single crystalline GaSe plate doped with 1.00 at. % Eu; (b) AFM image of an island sector of β–Ga2O3:Eu3+ layer.
Materials 17 00405 g006
Figure 7. (a) Absorption spectra of GaSe:Eu crystals for doping concentrations: 1—0.02 at. % and 2—3.00 at. %. (b) Determining fundamental absorption edge of nanostructured β–Ga2O3:Eu layer on GaSe:Eu substrate for doping concentrations: 1—0.02 at. %; 2—0.50 at. % and 3—3.00 at. %.
Materials 17 00405 g007
Figure 8. PL spectra at room temperature upon λex = 405 nm wavelength (45 μW/cm2) excitation: (a) undoped GaSe; (b) GaSe:Eu (0.025 at. %); (c) GaSe:Eu (0.05 at. %); (d) GaSe:Eu (0.50 at. %); (e) GaSe:Eu (1.00 at. %) (curve 1) and the β–GaSe:Eu (3.00 at. %) (curve 2). Material obtained through heat treatment in the humid atmosphere of ε–GaSe:Eu (3.00 at. %) at 900 °C for 6 h (f) and 12 h (g), upon λex = 254 nm (f) and λex = 405 nm (g) excitation. Contour of the red PL band of GaSe:Eu (0.02 at. %) crystals at 23 °C and λex = 405 nm (1.2 mW/cm2) (h).
Materials 17 00405 g008aMaterials 17 00405 g008b
Disclaimer/Publisher’s Note: The statements, opinions and data contained in all publications are solely those of the individual author(s) and contributor(s) and not of MDPI and/or the editor(s). MDPI and/or the editor(s) disclaim responsibility for any injury to people or property resulting from any ideas, methods, instructions or products referred to in the content.