Article

Spectroscopic Properties of TmF3-Doped CaF2 Crystals

by
Carla Schornig
1,
Marius Stef
1,*,
Gabriel Buse
2,
Maria Poienar
2,
Philippe Veber
1 and
Daniel Vizman
2
1
Crystal Growth Laboratory, Faculty of Physics, West University of Timisoara, 4 Bd. Vasile Parvan, 300223 Timisoara, Romania
2
Institute of Advanced Environmental Research, ICAM, 4 Str. Oituz, 300086 Timisoara, Romania
*
Author to whom correspondence should be addressed.
Materials 2024, 17(20), 4965; https://doi.org/10.3390/ma17204965 (registering DOI)
Submission received: 23 August 2024 / Revised: 1 October 2024 / Accepted: 10 October 2024 / Published: 11 October 2024
(This article belongs to the Section Optical and Photonic Materials)

Abstract

:
In this study, we report the growth and comprehensive spectroscopic analysis of TmF3-doped CaF2 crystals, grown using the vertical Bridgman method. The optical absorption and photoluminescence properties of both trivalent (Tm3+) and divalent (Tm2+) thulium ions were investigated. Optical absorption spectra in the UV-VIS-NIR range reveal characteristic transitions of Tm3+ ions, as well as weaker absorption bands corresponding to Tm2+ ions. The Judd–Ofelt (JO) formalism was applied to determine the intensity parameters Ω2, Ω4, and Ω6, which were used to calculate radiative transition probabilities, branching ratios, and radiative lifetimes for the Tm3+ ions. The emission spectra showed concentration-dependent quenching effects, with significant emissions observed for the concentration of 0.1 mol% TmF3 under excitation at 260 nm and 353 nm for Tm3+ ions and at 305 nm for Tm2+ ions. A new UV emission associated with divalent Thulium is reported. The results indicate that higher TmF3 concentrations lead to increased non-radiative energy transfer, which reduces luminescence efficiency. These findings contribute to the understanding of the optical behavior of Tm-doped fluoride crystals, with implications for their application in laser technologies and radiation dosimetry.

1. Introduction

The spectroscopic properties of TmF3-doped CaF2 crystals have attracted significant interest due to their potential applications in laser technologies and optical materials [1,2,3,4]. Rare-earth (RE) ions dissolved in CaF2, excluding Sm, Eu, and Yb, typically exist in the trivalent state. However, it is known that a certain fraction of these RE3+ ions can be reduced to the divalent state through various methods: X-ray irradiation [5,6]; gamma irradiation [7], additive coloration [8], or directly in the as-grown crystals [9,10,11,12,13,14].
Tm3+-doped CaF2 crystals exhibit efficient near-infrared (NIR) emission, making them suitable for various laser applications [15,16,17,18,19]. Incorporating Tm3+ ions into fluoride hosts enhances their spectroscopic properties due to the low phonon energy environment, which reduces non-radiative losses. This makes Tm3+-doped CaF2 a promising material for developing efficient laser sources.
On the other hand, Tm2+-doped CaF2 crystals have been investigated especially for the red and near-infrared emission [5,8,20,21].
Previous studies have demonstrated that Tm3+-doped CaF2 crystals exhibit significant spectroscopic characteristics, including a broad emission band around 1.8 μm under excitation at 795 nm, which are essential for laser applications [16]. The clustering behavior of Tm3+ ions in CaF2 crystals has also been studied, revealing that clustering can affect the spectroscopic properties of the material [18,19,22]. The energy transfer mechanisms between Tm3+ ions in these crystals are crucial for optimizing their performance in laser applications.
The laser performance of Tm3+-doped CaF2 crystals has been extensively investigated. Studies have shown that these crystals can achieve high slope efficiencies and output powers when used as laser gain media [16,17,18]. Additionally, the co-doping of CaF2 crystal with other rare earth ions, such as La3+ [23], Y3+ [24] or Lu3+ [25], can further enhance the near-infrared luminescence performance by enabling efficient energy transfer processes.
Tm3+-doped CaF2 crystals also exhibit unique thermoluminescent properties, making them suitable for applications in radiation dosimetry [26]. The thermoluminescent response of these crystals under gamma radiation exposure indicates their potential for use in radiation monitoring and measurement.
Studies on Tm3+-doped CaF2 crystals also reveal their potential for self-Q-switched lasing, demonstrating their versatility in laser technology applications [4,27].
The optical properties of Tm3+-doped CaF2 have been further studied in different host materials, showing a significant influence of the host in luminescence characteristics [28,29,30,31]. Fluoride crystals with an ordered structure stand out among various host matrices due to their unique chemical, mechanical, and thermal properties. These crystals exhibit a large band gap, broad transparency spectra extending from the vacuum UV to the far-infrared regions, possess low phonon energies that enhance activator luminescence, and feature extended fluorescence lifetimes, among other advantageous characteristics [32,33,34,35,36,37,38]. In the cubic CaF2 crystal structure, the F ions are located at the corners of the cubes. Alternatively, these cubes are occupied with Ca2+ ions. Trivalent RE ions substitute for the Ca2+ ions and there is a need for charge compensation to maintain electrical neutrality. It has been shown that such charge compensation is enabled by F ions taking place in the interstitial positions of the empty cubes. At low dopant concentrations (<0.1 wt%), isolated Tm3+ ions can be found in several sites resulting from the possible positions for the compensating F ions in the rare earth ion vicinity. Strickland and Jones [22] identified three major centers in lightly doped 0.05% Tm3+:CaF2: one center consists of a trivalent ion without any local charge compensation (Oh symmetry) and two centers that involve F charge compensating ions, located as near neighbors or as next near neighbors, the symmetry of these centers being tetragonal (C4v) and trigonal (C3v), respectively. At slightly higher rare earth dopant concentrations, adjacent rare earth ions appear forming ion pairs (or dimers) and more complicated clusters such as trimers and tetramers depending on the size, nature, and concentration of the considered RE ion [19]. Such a diversity of sites has important consequences on the spectroscopic characteristics of the material, and the very low concentrated systems (<0.05 wt%) must be distinguished from the higher concentrated ones for which ion clusters may be predominant. Despite the fact that there are numerous examples of research on the spectroscopic properties of Tm3+ ions in different host materials, there are only a few, older studies on the spectral properties of Tm2+ ions in fluorite crystals [19]. A recent study shows the luminescence properties of the Tm2+ ions in fluorite crystals. It is reported that an emission in the 680–800 nm range corresponds to 4f-4f transitions of Tm2+ upon excitation by 450 nm laser radiation [20].
In this study, we investigate the spectroscopic properties of TmF3-doped CaF2 crystals in the UV-VIS spectral region, with a focus on both Tm3+ and Tm2+ ions, respectively. To achieve this goal, optical absorption and photoluminescence (PL) measurements were performed for both Tm3+ and Tm2+ ions, and the Judd–Ofelt (JO) model was used to obtain information on the spectroscopic properties of Tm3+:CaF2 crystals. We focused on the influence of TmF3 concentration on the optical absorption and UV-VIS luminescence behavior. Our investigation builds on previous research and aims to provide a comprehensive understanding of the mechanisms that govern the optical behavior of these doped crystals.

2. Materials and Methods

TmF3-doped CaF2 crystals were grown in our Crystal Growth Laboratory by the vertical Bridgman method using a shaped graphite furnace which ensures appropriate temperature distribution [39]. The mentioned dopant concentrations refer to the raw material concentration added to the melt. The crystals were grown under a vacuum of approximately 10−1 Pa in a graphite crucible. Suprapure grade (Merck) calcium fluoride and thulium fluoride were used as the starting materials. It is known that good charge conversion can be obtained in high deoxidization conditions during the growth process. The use of a graphite crucible during the synthesis can provide a reducing environment that influences the Tm3+ → Tm2+ charge conversion in the as-grown samples [40]. Figure 1 shows the typical preparation stages of the Bridgman setup.
The whole process takes place in four stages: (i) the heating stage to reach the melting temperature, Tm = 1381 °C (approximately 6 h). The nominal power to reach the melting temperature is P = 4.7 kW. (ii) The melting stage which is necessary to ensure that the entire amount of raw material is melted (approximately 3 h). In stage (iii) the crystal pulling process takes place at a pulling rate of 4 mm/h, at constant power and extends for almost 20 h (AB in Figure 1). The crystal growth begins by lowering the crucible in the temperature distribution in the furnace. The last stage (iv) corresponds to the crystal cooling stage with a cooling rate of approximately (3 ± 0.03) °C/min, which ensures a dislocation density of ~(1 ± 0.1) × 104 dislocations/cm2 [41]. The grown crystals are approximately 8 cm long and 10 mm in diameter. The accuracy in measuring the length and diameter of the crystal is 0.01 mm. The crystals were cleaved along the (111) crystallographic direction into several slices. For this study, crystals with thicknesses varying between 1.65 and 2.91 mm were used. They are transparent and free of any visible inclusions or cracks, as shown in the inset of Figure 1a–c. It is observed that with the increase in the concentration of TmF3 added in the melt, from 0.1 mol% TmF3 (Figure 1a) to 1 mol% TmF3 (Figure 1b) and 5 mol% TmF3 (Figure 1c), the crystals have an increasingly green color.
The room temperature optical absorption spectra in the UV-VIS-NIR spectral range were recorded using a Shimadzu 1650PC from Shimadzu, Kyoto, Japan and Nexus 470 FTIR spectrophotometer from Thermo Scientific, Cambridge, UK. The baseline correction was applied to the measured absorption spectra in order to eliminate distortions caused by instrument noise, reflectance losses, and stray light. Without this correction, the absorption data would be distorted, leading to overestimated absorption coefficients and inaccurate Judd–Ofelt (JO) analysis. This correction ensured that only the absorption due to the Tm3+ and Tm2+ ions was considered, providing a true representation of the material’s optical properties. The raw absorption spectra were first plotted, and baseline points were identified automatically based on the minimal absorption values. A linear fitting method was then applied to define the baseline across the spectrum, ensuring that both broad and narrow features were accounted for. The baseline was subtracted from the original data using the “Subtract” function in OriginLab 9.0, which allowed us to obtain the corrected absorption spectrum accurately representing the TmF3-doped CaF2 crystals’ true absorption characteristics. To measure the room temperature luminescence spectra, in the UV-VIS domain the PerkinElmer LS55 spectrofluorimeter was used. The luminescence spectra of Tm3+ ions were measured by excitation at two wavelengths, 260 and 353 nm respectively, which correspond to the 3H61D2 and 3H63P2 transition [42]. The branching ratios, the emission transition probabilities, and the radiative lifetimes were obtained using the JO analysis (Judd–Ofelt analysis) [43,44]. A comparison with results obtained by other authors was provided. The influence of Tm3+ ion concentration on the JO parameters and the radiative lifetime was also investigated. The emission spectra of Tm2+ ions were registered under excitation at 305 nm corresponding to the 4f–5d transitions.

3. Results

3.1. Optical Absorption Spectra

In Figure 2a, the absorption spectra of CaF2:x mol% TmF3 (where x = 0.1, 1, and 5 mol%) are presented, revealing multiple absorption bands corresponding to both trivalent and divalent thulium ions. To express the absorption spectra in absorption coefficient units, α ( λ ) , the Beer–Lambert law was applied: α ( λ ) = 2.303   l o g 10 ( I / I 0 ) d , where d is the thickness of the sample in cm and l o g 10 ( I / I 0 ) is the absorbance. In order to minimize errors due to optical losses, absorption baseline correction was applied. To be visible, the absorption spectrum corresponding to the concentration of 0.1 mol% TmF3 is multiplied by 10 (black line). The observed peaks are attributed to well-known transitions from the ground state, 3H6, of Tm3+ ions (on the basis of Hund’s rules) to the excited states 3P2 (256 nm) 3P1,0 (273 nm), 1D2 (353 nm), 1G4 (460 nm), 3F2 (650 nm), 3F3 (674 nm), 3H4 (766 nm), 3H5 (1207 nm) and 3H6 (1608 nm) of Tm3+ ions [42]. For a free Tm3+ ion, its electronic configuration is 4f12. Along with spectral absorption bands of Tm3+ ions in the CaF2 host a few weaker absorption bands which correspond to the 4f–5d transition of Tm2+ ions are observed, and they are indicated in Figure 2a. These bands are sensitive to the crystal field, which varies with the host lattice (CaF2, SrF2, BaF2), leading to shifts in the energy of the absorption peaks [20]. These maxima are centered around 305, 409, and 593 nm. A linear trend of increasing the absorption coefficient at 353 nm and 260 nm (associated with Tm3+ ions) and 305 nm (associated with Tm2+ ions) with the concentration of TmF3 was observed. To establish a definitive linear dependence, more measurements across a wider range of concentrations would be necessary. The correlation coefficients are shown in Figure 2b. Also, the error bars were added to each data point, representing the standard deviation from multiple measurements to illustrate the uncertainty in the absorption coefficient values at different TmF3 concentrations, thereby providing a clearer depiction of the data’s reliability and supporting the observed linear trends.

3.2. Judd–Ofelt Analysis

The standard Judd–Ofelt (JO) analysis was employed for CaF2 doped with 1 and 5 mol% TmF3 to calculate the spectroscopic parameters based on the optical absorption spectra for Tm3+ ions [42,43]. By analyzing six absorption bands corresponding to specific transitions of Tm3+ ions from the ground state 3H6 to excited states: 3F4, 3H5, 3H4, 2F2,3, 1G4, and 1D2, the JO intensity parameters Ω2, Ω4 and Ω6 were determined. Due to the very low intensity of the absorption bands in the CaF2 crystal doped with 0.1 mol% TmF3, the JO analysis could not be applied. The parameter Ω2 is highly sensitive to the local environment surrounding the doped ions and is related to the asymmetry and covalency of the rare-earth ion sites. The very large difference between the values of Ω2 can be explained by the cluster formation with the increase in TmF3 concentration. To obtain the JO parameters, Ωt (where t = 2, 4, 6), and the corresponding experimental line strengths (Table 1), a system of six equations was solved using the Levenberg–Marquardt algorithm, based on the six selected transitions. The experimental line strengths were calculated using the following expression:
S m e a s = 3 c 2 J + 1 n ( λ ) 8 π 3 N 0 λ m e a n e 2 9 n ( λ ) 2 + 2 2 α λ d λ
where J is the total angular momentum quantum number of the initial state, n(λ) is the refractive index, N0 is the Er3+ ions concentration (added to the melt), λmean is the mean wavelength of the specific absorption bands, Σ = α λ d λ is the integrated absorption coefficient as a function of λ, α(λ) is absorption coefficient, c is the vacuum speed of light and ħ is Planck’s constant. The refractive index, n, was determined from the Sellmeier dispersion equation [45]. The determination of the JO parameters involved solving a set of six equations for the transitions between the J and J′ manifolds using the experimental line strengths. This calculation is based on the Expression (1) and on the electric dipole (ed) line strength:
S J J e d = t = 2,4 , 6 Ω t S , L J U ( t ) S , L J 2
and the magnetic dipole (md) line strength given in [29]:
S J J m d = S , L J | | L + 2 S | | S , L J 2
where U t are the reduced matrix elements of rank t (t = 2, 4 and 6) of tensor operators between states characterized by the quantum numbers (S, L and J) and (S′, L′ and J′). For selected Tm3+ transitions, the values of the reduced matrix elements are those tabulated in Kaminskii’s paper [42]. The calculated JO parameters, by applying a least-squares fitting of Smeas and Scalc, and the spectroscopic quality factor, χ, are given in Table 2. A comparison of the obtained JO parameters, Ωt, with those reported by other authors [3,23,24,27].
The root mean square deviation, defined by Δ S rms = q p 1 S calc S meas 2 1 / 2 is a measure of the accuracy of the fitting procedure; q = 6 is the number of analyzed spectral bands and p = 3 is the number of sought parameters. In this case, ΔSrms = 0.298 × 10⁻²⁰ cm2 for CaF2:1 mol% TmF3 and ΔSrms = 0.267 × 10⁻²⁰ cm2 for CaF2:5 mol% TmF3 which are comparable with those obtained by other authors [3,23,24]. To calculate the radiative lifetime (τrad) for an excited state, J′, the relationship τrad = 1/ΣAJJ′ can be used, where:
A J J = 64 π 2 e 2 3 ( 2 J + 1 ) λ m e a n 3 n ( n 2 + 2 ) 2 9 S J J e d + n 2 S J J m d
is the spontaneous emission probability and the sum is taken over all final lower-lying states, S J J e d and S J J m d are defined by Equations (2) and (3). The calculation of fluorescence branching ratios, βJJ′ involves utilizing the expression βJJ′= AJJ′·τrad. Table 3 shows the values of the radiative emission probabilities, the branching ratios, and the radiative lifetimes for transitions where luminescence was observed (Figure 3). It should be mentioned that magnetic-dipole transition matters in transitions that obey the selection rules: ΔJ = 0 or ±1, ΔS = 0 and ΔL = 0. Taking absorption spectra into account S J J m d is non-zero for 3F23F3, 3F33F4, 3H43H5 and 3H53F6 transitions.
The results obtained using the JO theory suggest that the radiative transition probability of the 1D2 state is greater than that of other states, as shown in Table 2. This conclusion is in good agreement with Wang et al. [32]. The Judd–Ofelt parameters for different molar contents of TmF3, presented in Table 2, provide information on how the local environment of Tm3+ ions and the symmetry of the crystal field evolve with increasing TmF3 concentration. These parameters allow the evaluation of optical transition probabilities and radiative lifetimes of the material, which are directly related to the performance of Tm-doped CaF2 crystals in applications such as lasers and phosphors. As the mole fraction of TmF3 increases, we can observe changes in the values of Ω2, which is sensitive to the asymmetry of the crystal field, indicating how the local structure of Tm3+ ions evolves with concentration. The results obtained in this work are compared with those obtained by other authors to provide a basis for understanding how the optical properties of Tm3+ in CaF2 crystals vary depending on the dopant concentration. [3,23,24,27]. From Table 2, the values of Ωt indicate distinct differences between the samples doped with 1 mol% and 5 mol% TmF3. For the 1 mol% TmF3 sample, χ = 0.104, which suggests that higher-order transitions Ω6 dominate, reflecting a relatively symmetric local environment around the Tm3+ ions. In contrast, the 5 mol% TmF3 sample shows a significantly higher χ value of 0.857, indicating an increased contribution from moderate angular momentum transitions (Ω4), which may be attributed to increased distortion in the local symmetry due to higher dopant concentration. These results suggest that as the concentration of TmF3 increases, the local environment becomes more distorted, leading to changes in the relative strength of optical transitions.

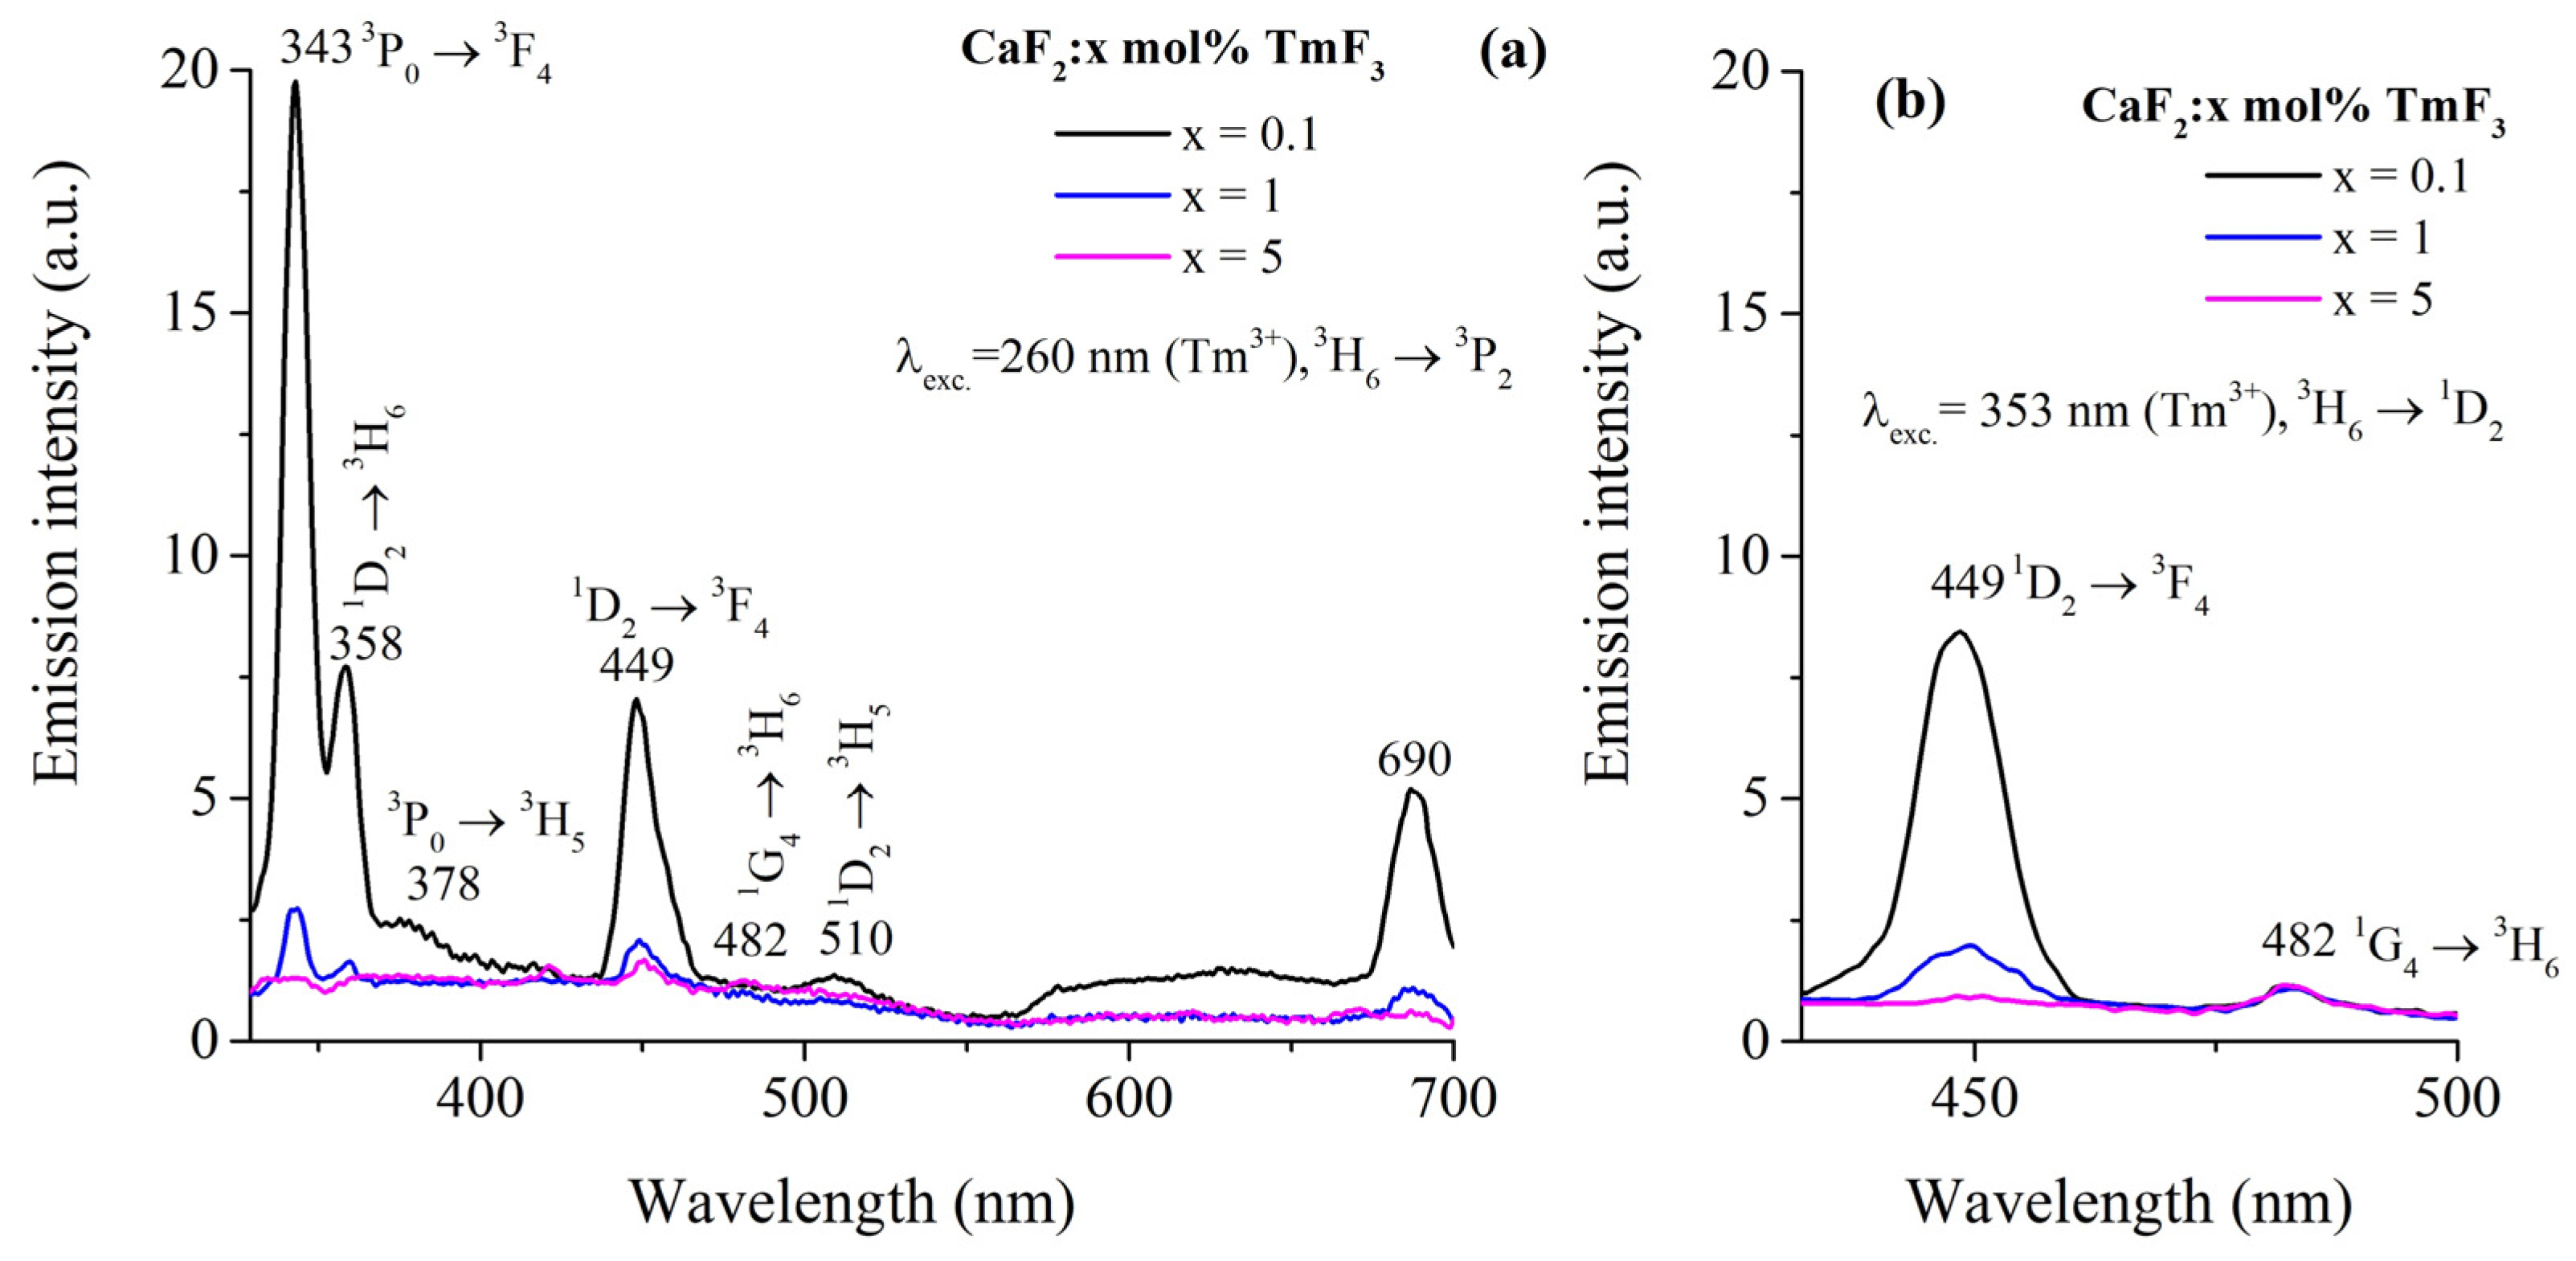
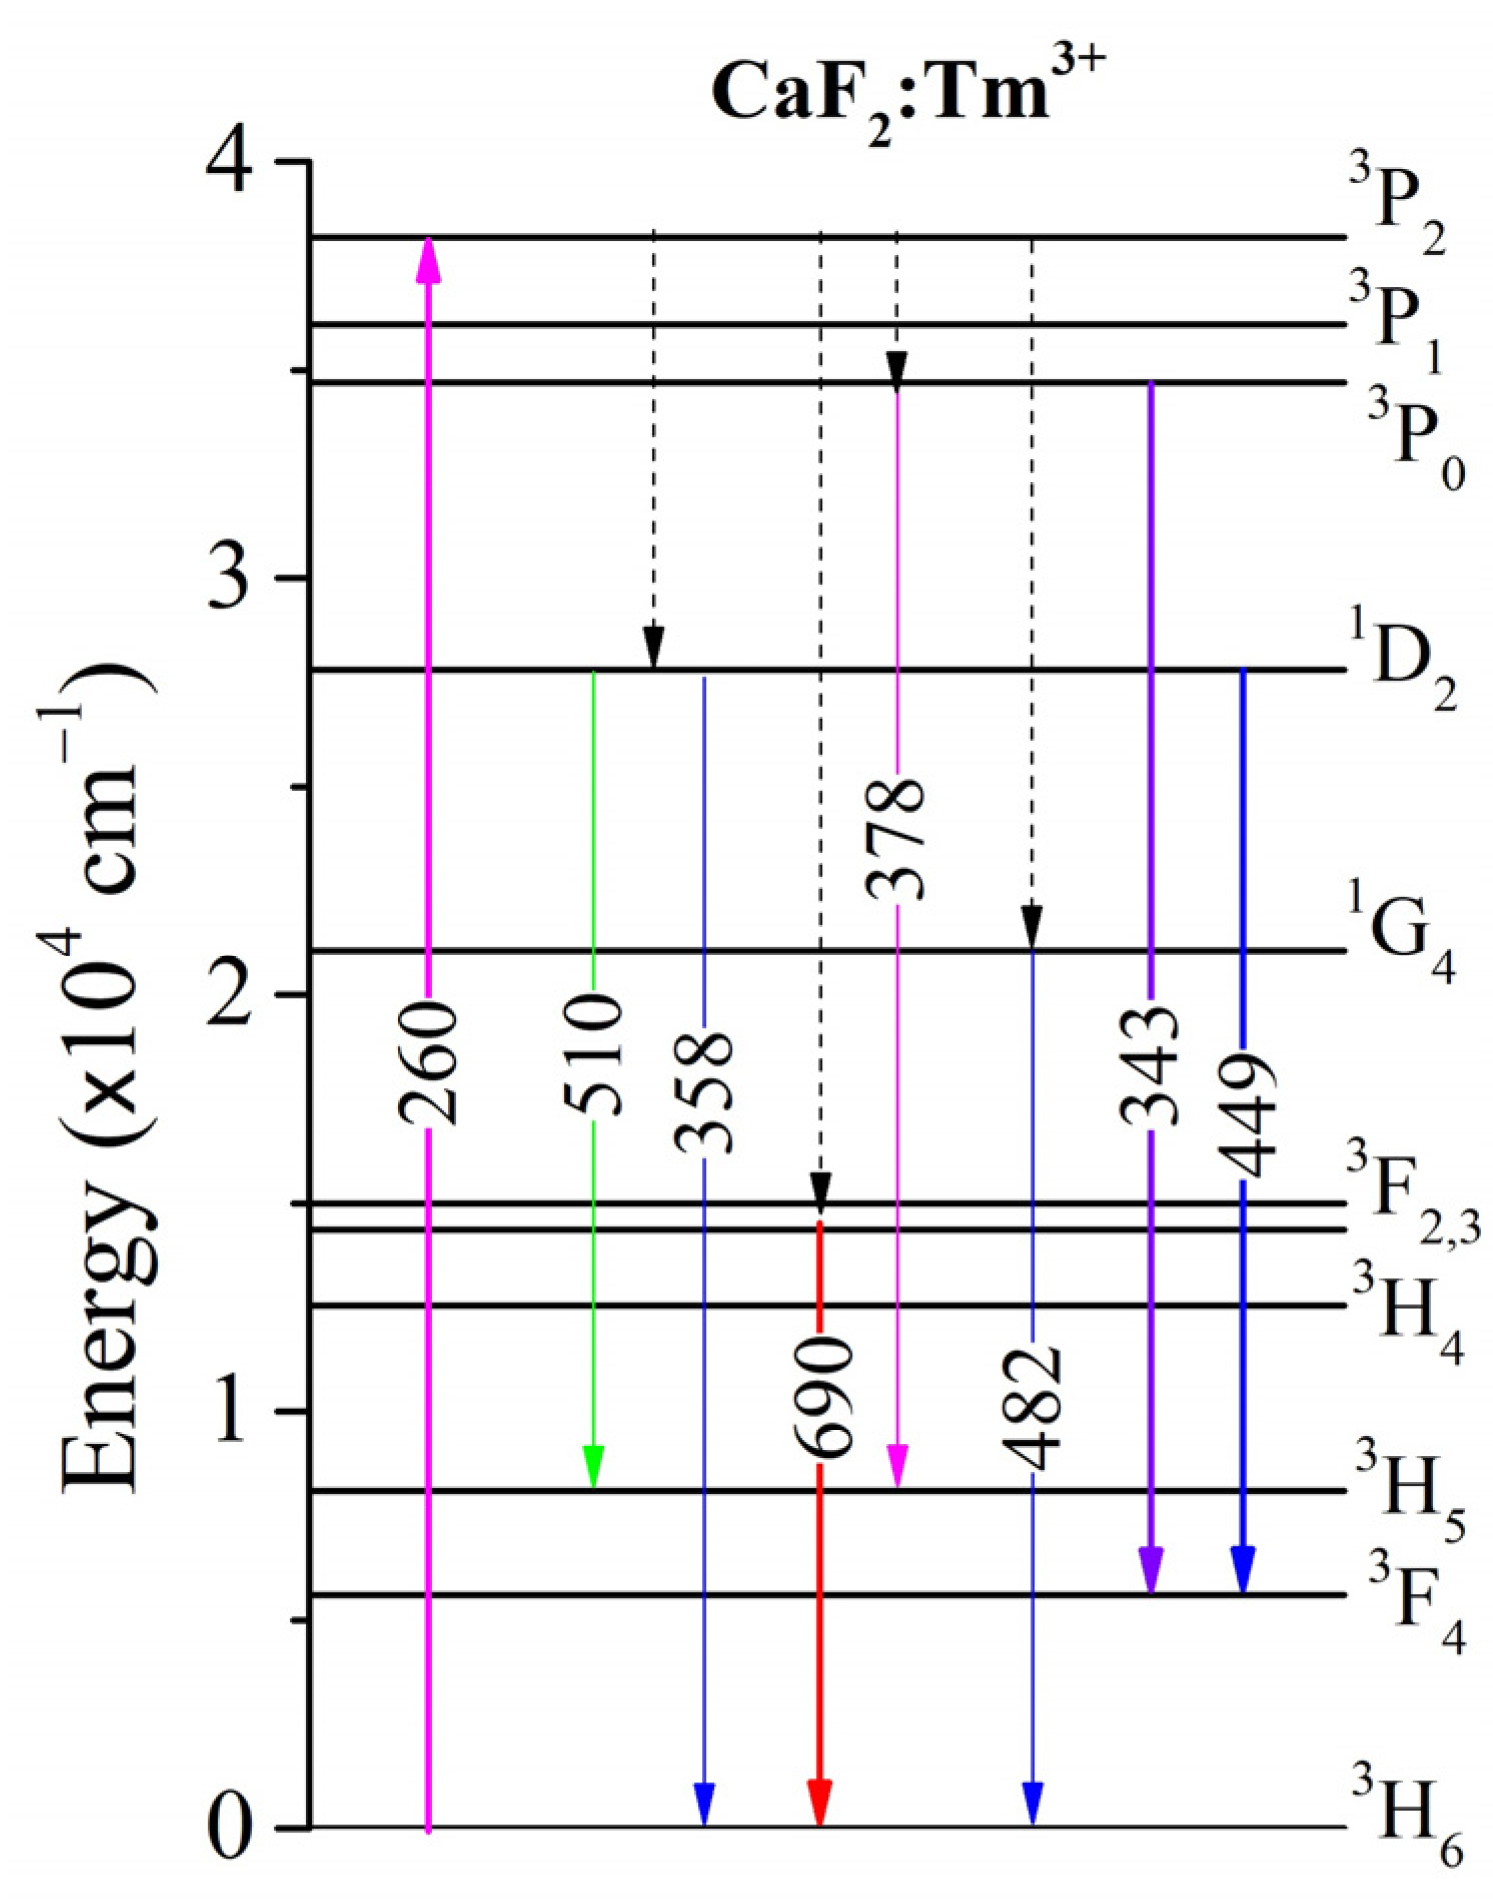
3.3. Emission Spectra of Tm3+ Ions

To obtain the room temperature emission spectra, two absorption bands were pumped, namely λexc. = 260 nm (corresponding to the 3H63P2 transition) and λexc. = 353 nm (3H61D2 transition). The emission spectra of the studied samples under 260 nm excitation are shown in Figure 3a,b. The emission peaks are observed at 343, 358, 378, 449, 482, 510 nm, and 690 nm. These peaks correspond to the following transitions: 3P03F4, 1D23H6, 3P03H5, 1D23F4, 1G43H6, 1D23H5, and 3F23H6. Two emission bands around 449 and 482 nm corresponding to the 1D23F4 and 1G43H6 are observed under excitation at 353 nm.
The energy level diagram, in Figure 4, provides a comprehensive overview of the electronic transitions that correspond to the emission spectra observed in Figure 3a,b. This diagram allows us to understand the mechanisms behind the different emission peaks and how they relate to the energy levels of the Tm3+ ions in the CaF2 crystal.
The International Commission on Illumination (CIE) chart of the CaF2:Tm3+ crystal corresponding to the visible emissions is shown in Figure 5a,b for both excitation wavelengths. The color coordinates are shown in Table 4. The results are in good agreement with those reported by Taikar et al. for La2O3:Tm3+ [1]. The calculated color coordinate nearly matched with National Television Standard Committee (NTSC) standard values for blue color. The CIE coordinates were obtained using Gocie V2 software [51].

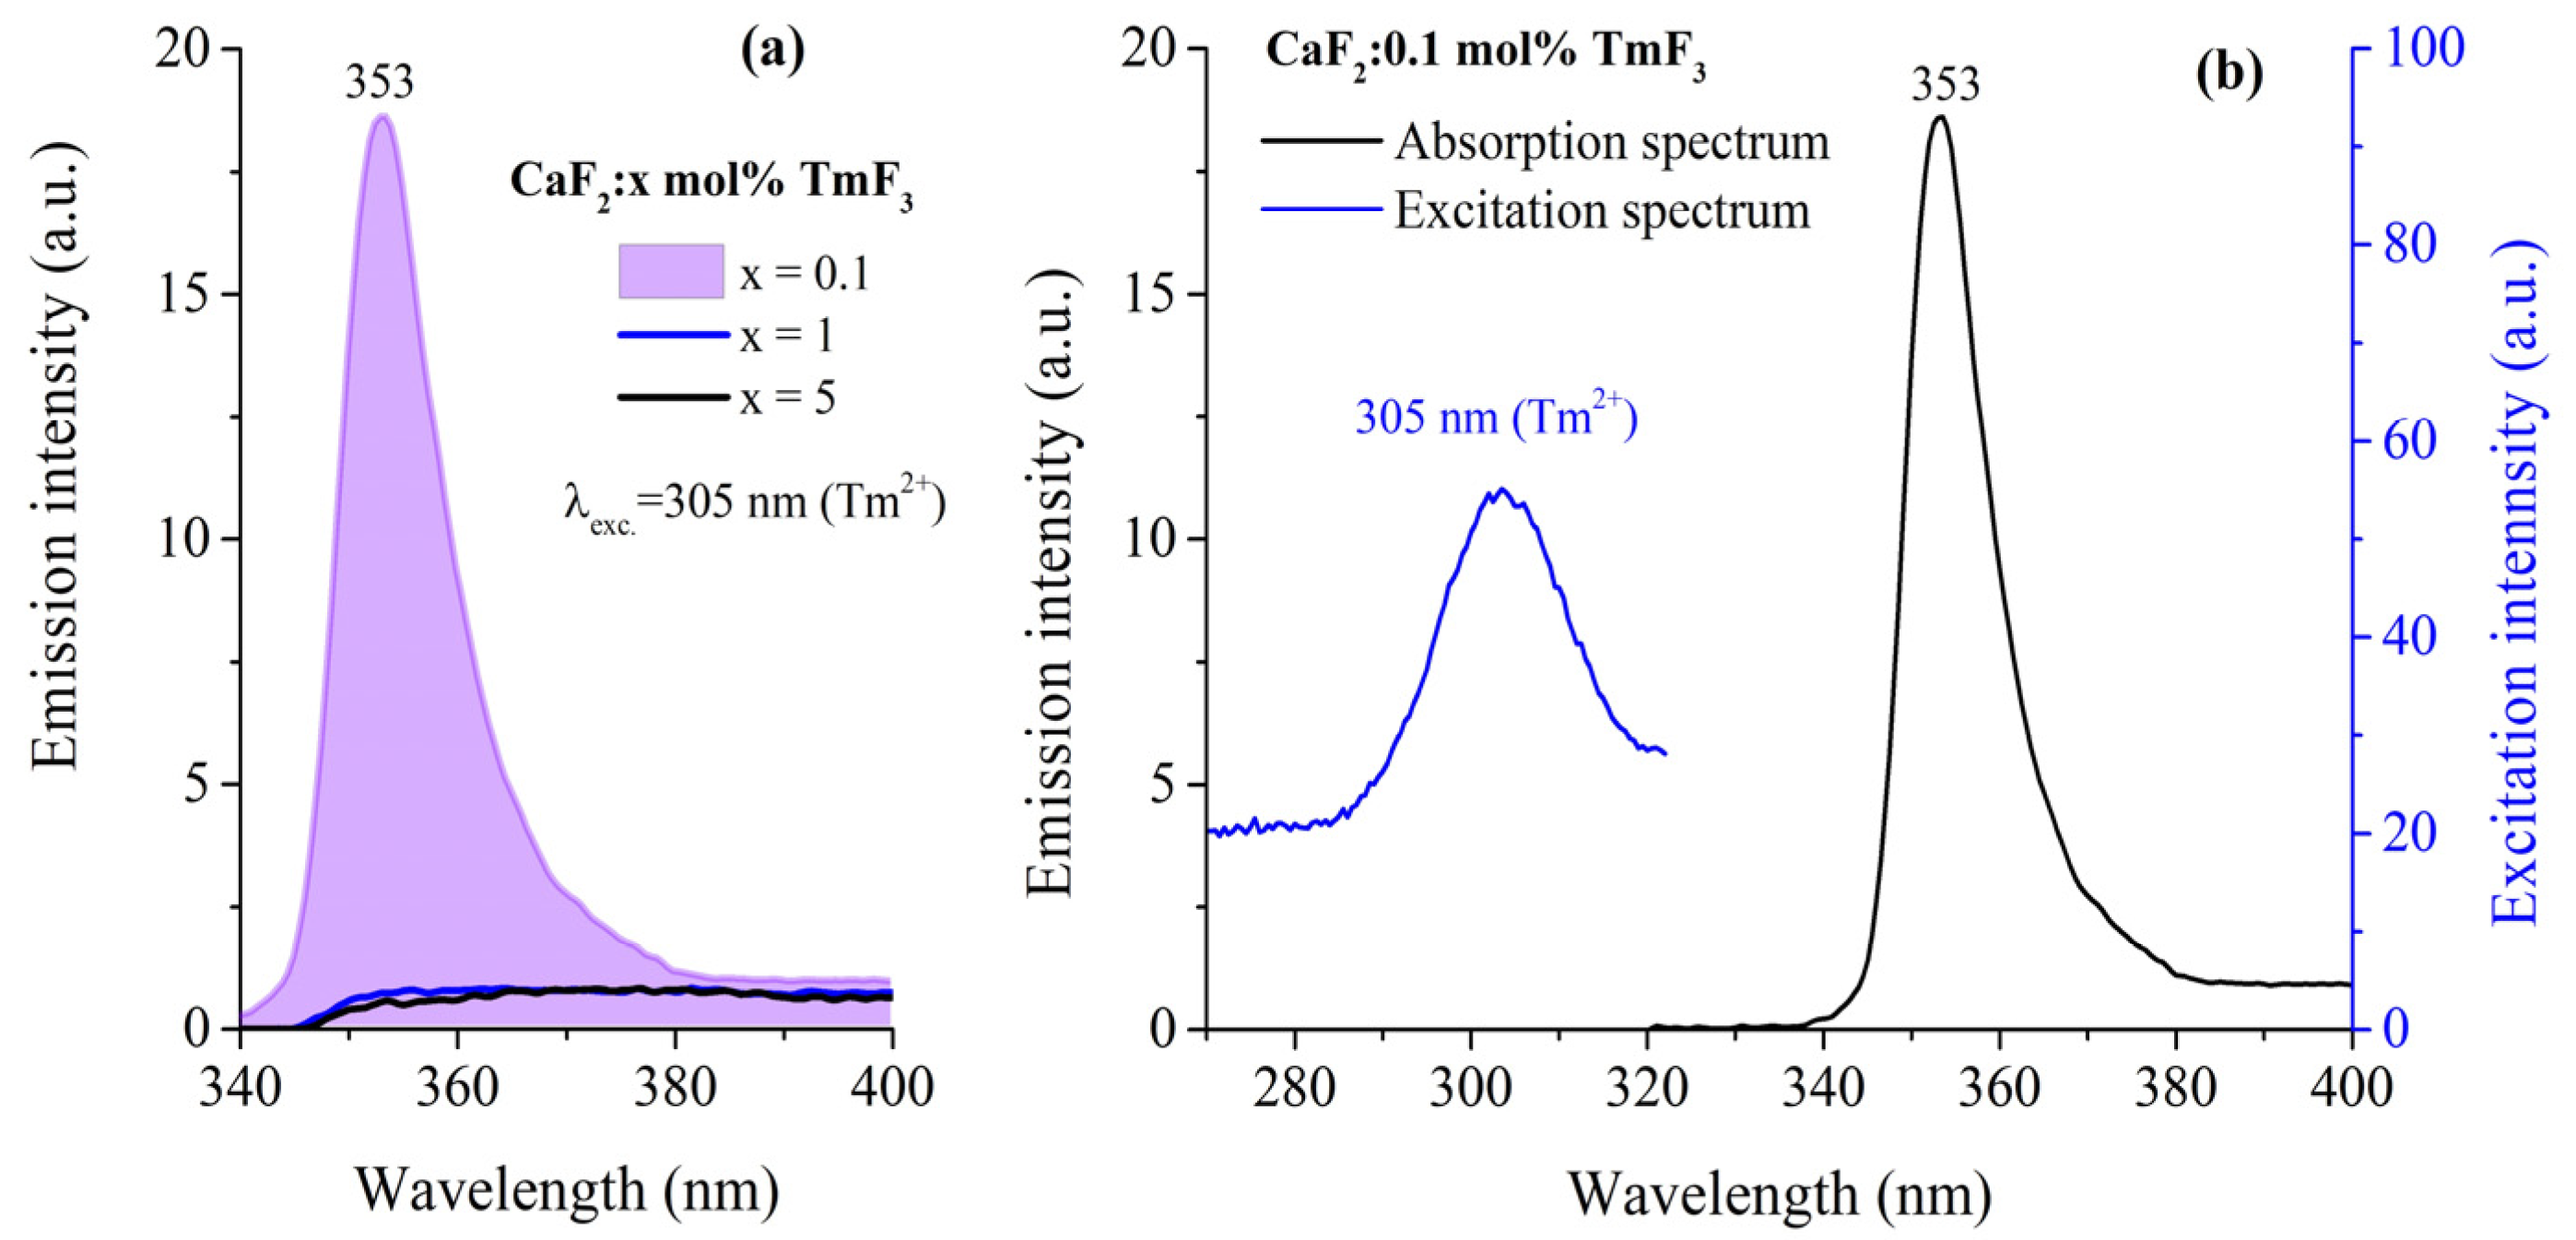
3.4. Emission Spectra of Tm2+ Ions

It is known that the spectroscopic behavior of Tm2+ ions is influenced by the host crystal’s structure, the local environment around the ion, and external factors like temperature and irradiation [5,7,20,21,35,37]. Emission spectra of Tm2+ ions were investigated in fluorite crystals, especially for the red emission, in the 680–800 nm region [20] under excitation at 450 nm, or infrared emission at 1116 nm [21] and 1250 nm [35]. Figure 6 shows the emission spectra of CaF2 crystals doped with various concentrations of TmF3 (0.1, 1, and 5 mol%) under 305 nm excitation, corresponding to the Tm2+ transitions. The prominent emission peak at 353 nm is observed, with the intensity drastically decreasing as the concentration of TmF3 increases.
Figure 6b presents the emission spectrum (black line) and the excitation spectrum (blue line) for CaF2 doped with 0.1 mol% TmF3. The excitation spectrum, which corresponds to monitoring the emission at 353 nm, shows a clear peak around 305 nm. This suggests that excitation at 305 nm effectively populates the energy levels that lead to the emission observed at 353 nm. The presence of the 305 nm excitation peak is indicative of Tm2+ ions, as this excitation wavelength aligns with known absorption bands of Tm2+ rather than Tm3+. Together, these spectra suggest that the 353 nm emission observed in the figure primarily originates from Tm2+ ions when excited at 305 nm, supporting the conclusion that the emission at 353 nm is due to transitions of Tm2+ ions.

4. Discussion

The absorption spectrum is a usual method for characterizing the transition properties from the ground state to all excited states of luminescent centers. Additionally, luminescent centers can be identified through their absorption spectra, as each specific center has distinct absorption peaks within a given host material. Figure 2 provides a comprehensive overview of the absorption properties of CaF2 crystals doped with various concentrations of TmF3, highlighting the distinct absorption behavior of Tm3+ and Tm2+ ions in the 250–1800 nm spectral region.
The absorption intensity generally increases with the concentration of TmF3, particularly evident in the higher concentration samples (x = 5 mol%), which show more pronounced absorption peaks. The spectra demonstrate the successful doping of TmF3 into the CaF2 matrix, with distinct absorption features consistent with Tm3+ and Tm2+ ions. The presence of Tm2+ bands suggests a partial reduction in Tm3+ during crystal growth, which could be of interest for further studies exploring the control of valence states in doped fluoride crystals [18,40]. Figure 2b provides a quantitative analysis of the absorption coefficients at three specific wavelengths: 353 nm (associated with 3H61D2 transition of Tm3+ ions), 260 nm (corresponding to the 3H63P2 transition of Tm3+ ions), and 305 nm (associated with Tm2+ ions). These absorption bands were selected for measuring the emission spectra (see Section 3.3 and Section 3.4). The graph suggests a linear trend between the absorption coefficient and the TmF3 concentration, with correlation coefficient values between 0.98 and 0.998. This linear trend can help to estimate the optical properties by adjusting the concentration of TmF3 in the host materials. On the other hand, the linearity observed suggests uniform incorporation of Tm ions into the CaF2 lattice and minimal clustering, which is essential for maintaining the optical quality of the material. The study of the distribution of trivalent and divalent thulium ions along the CaF2 crystals and the determination of the effective segregation coefficients corresponding to both ions in fluorite crystals will be analyzed in a separate paper. The strongest absorption at 674 nm for the highest concentration of TmF3 indicates that Tm3+ ions dominate the absorption features. On the other hand, the slower increase in the absorption coefficient at 305 nm for Tm2+ ions with TmF3 concentration suggests a relatively smaller Tm2+ ions population increase with TmF3 concentration This balance between Tm3+ and Tm2+ states could be exploited in designing materials for specific photonic applications, such as tunable lasers or optical amplifiers, where controlled absorption is desired.
The emission intensity is highest at the lowest doping concentration (x = 0.1 mol%), particularly for the 343 nm peak, which corresponds to the 3P03F4 transition. As the doping concentration increases, the emission intensity decreases significantly, indicating a concentration-quenching phenomenon. Taikar et al. [1] reported that after 1 mol% Tm2O3 was doped in La2O3, the emission intensity of Tm3+ ions decreases because of concentration quenching. In CaF2 crystals, the 1450 nm emission of Tm3+ ions is quenched for 1.34% TmF3 for which the clusters are predominant. At low doping concentrations (around 0.1 mol%), Tm3+ ions are mostly isolated, occupying different lattice sites due to the various possible positions of the compensating F ions. These isolated Tm3+ ions, which occupy distinct lattice sites with specific local symmetries, exhibit sharp and well-defined emission spectra because their luminescence is not significantly influenced by neighboring ions. As the concentration of Tm3+ ions increases beyond this low doping regime, adjacent Tm3+ ions start to form ion pairs (dimers) or more complex clusters (trimers, tetramers, hexamers, etc.). This proximity between Tm3+ ions facilitates energy transfer between them, which is one of the primary mechanisms of concentration quenching. This behavior is demonstrated by the experimentally observed fluorescence quenching reported by Renard et al. [19] and Camy et al. [18], which arises directly from these non-radiative processes.
The emission peaks of Tm3+ ions observed at 343, 358, 378, 449, 482, 510 nm, and 690 nm, corresponding to the 3P03F4, 1D23H6, 3P03H5, 1D23F4, 1G43H6, 1D23H5, and 3F23H6 transitions were reported previously in La2O3:Tm3+ [32]. To our knowledge, the intense emission band at 343 nm characteristic of the Tm3+ ions doped in the CaF2 crystal has not been reported before.
By excitation at 353 nm, the emission spectrum is characterized by two emission bands: one of them centered at 449 nm (Figure 3a) which corresponds to the 1D23F4 transition, and the other centered at 482 nm (with a much weaker intensity) corresponding to the 1G43H6 transition of Tm3+ ions.
In order to determine manifold-to-manifold radiative emission probabilities, radiative lifetimes and branching ratios the JO theory was applied to the room-temperature absorption spectra. A computer program was designed to perform the least squares fitting between measured and calculated electric dipole line strength of 6 transitions corresponding to the Tm3+ ions shown in Table 1. Due to the very low intensity of the absorption bands in the CaF2 crystal doped with 0.1 mol% TmF3 (see Figure 2), the JO analysis could not be applied. The differences between the theoretical and experimental values can be attributed to the fact that the theoretical values are based on the Judd–Ofelt (JO) theory, which involves certain approximations, such as the assumption of ideal local symmetry around the rare-earth ions (Oh site-symmetry) and homogeneous distribution of dopants within the crystal lattice. In reality, the local environment of Tm3+ ions may deviate from these ideal conditions due to lattice defects, clustering, or site distortions, leading to differences between calculated and measured values. At higher concentrations of Tm3+ ions, interactions such as cross-relaxation, energy transfer, and ion clustering become significant, affecting the measured transition probabilities. These effects are not typically included in the simplified theoretical calculations, leading to further discrepancies between theoretical and experimental values, especially for transitions like the 1G4 state. On the other hand, significant errors usually occur in the estimation of JO parameters because it is difficult to obtain accurate absorption line strengths in the case of broad and structured absorption bands (as in our case), and due to the JO model itself [52]. These large errors have also been reported in other papers [24,30] for Tm3+ ions.
The JO parameters are listed in Table 2 along with the JO parameters found in previous studies [3,23,24,27]. The results obtained suggest that the radiative transition probability of the 1D23F4 transition (~2049 s−1) is greater than that of other states, as shown in Table 2. This result is in good agreement with the emission spectrum under excitation at 353 m (Figure 3b). However, the strong emission around 343 nm under excitation at 260 nm (3H63P2) cannot be explained by JO analysis. Further investigations are needed to clarify this.
The UV emission spectra of Tm2+-doped CaF2 crystals under 305 nm excitation (Figure 6) show a pronounced peak at 353 nm for CaF2:0.1 mol% TmF3. To our knowledge, the UV emission of Tm2+ ions has not been reported before. The intensity of this peak decreases significantly with increasing TmF3 concentration, from 0.1 mol% to 5 mol%, suggesting the presence of concentration quenching. This quenching effect can be attributed to the increased probability of non-radiative energy transfer between Tm2+ and Tm2+/Tm3+ ions, which becomes more pronounced at higher doping levels. The observed spectral characteristics align with previous studies on Tm2+ in CaF2, which highlight the role of crystal field splitting and the importance of maintaining optimal doping concentrations to preserve luminescence efficiency [35]. These findings contribute to our understanding of the spectroscopic behavior of Tm2+ in fluoride hosts, with implications for their use as a luminescent material.

5. Conclusions

In this work, we successfully grew TmF3-doped CaF2 crystals using the vertical Bridgman method and investigated their spectroscopic properties. The optical absorption spectra revealed distinct transitions of both trivalent (Tm3+) and divalent (Tm2+) thulium ions, providing insights into the nature of the doped ions and their interactions within the host matrix. The application of the Judd–Ofelt theory enabled us to determine the spectroscopic parameters, including intensity parameters, radiative transition probabilities, branching ratios, and radiative lifetimes which are useful for understanding the luminescence mechanisms in these materials. Our photoluminescence studies demonstrated that TmF3-doped CaF2 crystals exhibit strong UV-VIS emissions, with significant emission quenching observed at higher dopant concentrations due to increased non-radiative energy transfer. This quenching effect highlights the importance of optimizing dopant concentrations to maximize the luminescence of Tm3+ and Tm2+ efficiency in CaF2 crystals. A new UV emission around 353 nm, associated with divalent Thulium, was reported. To our knowledge, the intense emission band at 343 nm characteristic of the Tm3+ ion doped in the CaF2 crystal has not been reported before. The observed luminescent properties, particularly the emission peaks associated with both ions, suggest that these materials hold great potential for applications in laser technologies. Overall, our findings provide an understanding of the spectroscopic behavior of TmF3-doped CaF2 crystals, contributing to the knowledge of the field of rare-earth-doped fluoride materials. Future work will focus on exploring the control of valence states in these crystals and optimizing their optical properties for specific photonic applications.

Author Contributions

Conceptualization, M.S., G.B. and D.V.; methodology, M.S, C.S., M.P. and P.V.; validation, M.S., C.S. and D.V.; formal analysis, M.S.; investigation, M.S., C.S., G.B., M.P. and P.V.; resources, P.V.; data curation, M.S., G.B., M.P. and P.V.; writing—original draft preparation, C.S.; writing—review and editing, M.S., G.B., P.V. and D.V.; visualization, M.S.; supervision, M.S.; project administration, P.V.; funding acquisition, P.V. All authors have read and agreed to the published version of the manuscript.

Funding

This research was funded by the European Commission within the framework of the National Recovery and Resilience Plan (PNRR), gran number 760080/23.05.2023, ESCARGOT project entitled “Enhanced Single Crystal Applications and Research in the Growth of new Optical rare earth-based compounds for sustainable and efficient Technologies”.

Institutional Review Board Statement

Not applicable.

Informed Consent Statement

Not applicable.

Data Availability Statement

The data presented in this study are available on request from the corresponding author. The data are not publicly available due to privacy reasons.

Acknowledgments

Authors would like to acknowledge Ioan Sîrbu for his involvement in the crystal growth process.

Conflicts of Interest

The authors declare no conflicts of interest.

References

  1. Taikar, D.R.; Taikar, R.N.; Nagde, K.R.; Sarve, S.R. Synthesis and luminescence study of n-UV excitable Tm3+-activated blue phosphor. Macromol. Symp. 2021, 400, 2100019. [Google Scholar] [CrossRef]
  2. Reiter, J.; Körner, J.; Pejchal, J.; Yoshikawa, A.; Hein, J.; Kaluza, M.C. Temperature dependent absorption and emission spectra of Tm: CaF2. Opt. Mater. Express 2020, 10, 2142–2158. [Google Scholar] [CrossRef]
  3. Loiko, P.; Doualan, J.L.; Guillemot, L.; Moncorgé, R.; Starecki, F.; Benayad, A.; Dunina, E.; Kornienko, A.; Fomicheva, L.; Braud, A.; et al. Emission properties of Tm3+-doped CaF2, KY3F10, LiYF4, LiLuF4 and BaY2F8 crystals at 1.5 μm and 2.3 μm. J. Lumin. 2020, 225, 117279. [Google Scholar] [CrossRef]
  4. Zu, Y.; Zong, M.; Wang, Y.; Zhang, Z.; Wu, A.; Liu, J.; Su, L. Self-Q-switched and broad wavelength-tunable lasing in Tm3+-doped CaF2 single-crystal fiber. Appl. Phys. Express 2020, 13, 102003. [Google Scholar] [CrossRef]
  5. Sizova, T.; Radzhabov, E.; Shendrik, R.; Egranov, A.; Myasnikova, A. Optical absorption spectra of X-ray irradiated alkaline earth fluoride crystals doped with divalent rare-earth ions studied by thermal bleaching. Radiat. Meas. 2019, 125, 25–28. [Google Scholar] [CrossRef]
  6. Shendrik, R.; Yu, Y.; Myasnikova, A.S.; Egranov, A.V.; Radzhabov, E.A. Divalent Cerium and Praseodymium ions in crystals of alkaline earth fluorides. Opt. Spectrosc. 2014, 116, 777–782. [Google Scholar] [CrossRef]
  7. McClure, D.S.; Kiss, Z. Survey of the spectra of the divalent rare-earth ions in cubic crystals. J. Chem. Phys. 1963, 39, 3251–3257. [Google Scholar] [CrossRef]
  8. Radzhabov, E.A. F3 molecular ions in fluoride crystals. Opt. Spectrosc. 2016, 120, 294–299. [Google Scholar] [CrossRef]
  9. Nicoara, I.; Stef, M. Study of Na+ ions influence on the charge compensating defects in CaF2: YbF3 crystals using dielectric relaxation. Eur. Phys. J. B 2012, 85, 180. [Google Scholar] [CrossRef]
  10. Nicoara, I.; Stef, M. Charge compensating defects study of YbF3-doped BaF2 crystals using dielectric loss. Phys. Status Solidi B 2016, 253, 397–403. [Google Scholar] [CrossRef]
  11. Stef, M.; Nicoara, I.; Vizman, D. Distribution of Yb3+ and Yb2+ ions along YbF3-Doped BaF2 crystals. Cryst. Res. Technol. 2018, 53, 1800186. [Google Scholar] [CrossRef]
  12. Nicoara, I.; Stef, M.; Pruna, A. Growth of YbF3-doped CaF2 crystals and characterization of Yb3+/Yb2+ conversion. J Cryst Growth 2008, 310, 1470–1475. [Google Scholar] [CrossRef]
  13. Stef, M.; Pruna, A.; Pecingina-Garjoaba, N.; Nicoara, I. Infuence of various impurities on the optical properties of YbF3-doped CaF2 crystals. Acta Phys. Pol. A 2007, 112, 1007–1012. [Google Scholar] [CrossRef]
  14. Buse, G.; Preda, E.; Stef, M.; Nicoara, I. Influence of Yb3+ ions on the optical properties of double-doped Er, Yb: CaF2 crystals. Phys. Scr. 2011, 83, 025604. [Google Scholar] [CrossRef]
  15. Carnall, W.T.; Fields, P.R.; Rajnak, K. Electronic energy levels in the trivalent lanthanide aquo ions. I. Pr3+, Nd3+, Pm3+, Sm3+, Dy3+, Ho3+, Er3+, and Tm3+. J. Chem. Phys. 1968, 49, 4424–4442. [Google Scholar] [CrossRef]
  16. Doroshenko, M.E.; Alimov, O.K.; Papashvili, A.G.; Martynova, K.A.; Konyushkin, V.A.; Nakladov, A.N.; Osiko, V.V. Spectroscopic and laser properties of Tm3+ optical centers in CaF2 crystal under 795 nm diode laser excitation. Laser Phys. Lett. 2015, 12, 125701. [Google Scholar] [CrossRef]
  17. Liu, J.; Zhang, C.; Zu, Y.; Fan, X.; Liu, J.; Guo, X.; Qian, X.; Su, L. Efficient continuous-wave, broadly tunable and passive Q-switching lasers based on a Tm3+:CaF2 crystal. Laser Phys. Lett. 2018, 15, 045803. [Google Scholar] [CrossRef]
  18. Camy, P.; Doualan, J.L.; Renard, S.; Braud, A.; Ménard, V.; Moncorgé, R. Tm3+:CaF2 for 1.9 lm laser operation. Opt. Commun. 2004, 236, 395–402. [Google Scholar] [CrossRef]
  19. Renard, S.; Camy, P.; Braud, A.; Doualan, J.L.; Moncorgé, R. CaF2 doped with Tm3+: A cluster model. J. Alloys Compd. 2008, 451, 71–73. [Google Scholar] [CrossRef]
  20. Radzhabov, E.; Shendrik, R.; Pankratov, V. Emission of Tm2+ in alkaline-earth fluoride crystals. J. Lumin. 2022, 252, 119271. [Google Scholar] [CrossRef]
  21. Duncan, R.C., Jr.; Kiss, Z.J. Continuously operating CaF2:Tm2+ optical maser. Appl. Phys. Lett. 1963, 3, 23–24. [Google Scholar] [CrossRef]
  22. Strickland, N.M.; Jones, G.D. Site-selective spectroscopy of Tm3+ centers in CaF2:Tm3+. Phys. Rev. B 1997, 56, 10916–10929. [Google Scholar] [CrossRef]
  23. Zhang, Z.; Guo, X.; Wang, J.; Zhang, C.; Liu, C.; Su, L. High-efficiency 2 μm continuous-wave laser in laser diode-pumped Tm3+, La3+: CaF2 single crystal. Opt. Lett. 2018, 43, 4300–4303. [Google Scholar] [CrossRef] [PubMed]
  24. Cao, X.; Dong, J.; Li, J.; Wu, M.; Song, Q.; Li, Q.; Wang, Q.; Xue, Y.; Xu, X.; Lin, H.; et al. Enhance and modulated near-infrared luminescence of Tm3+:CaF2 crystal by co-doping Y3+ ions. J. Lumin. 2023, 254, 119514. [Google Scholar] [CrossRef]
  25. Karel Veselský, K.; Sulc, J.; Jelínkov, H.; Doroshenko, M.E.; Konyushkin, V.A.; Pierpoint, K.A.; Prajzler, V. Spectroscopy and lasing of cryogenically cooled Tm3+, Lu3+: CaF2 crystal. J. Lumin. 2023, 255, 119563. [Google Scholar] [CrossRef]
  26. Vasconcelos, D.A.A.; Barros, V.S.M.; Khoury, H.J.; Azevedo, W.M.; Asfora, V.K.; Guzzo, P.L. Synthesis and thermoluminescent response of CaF2 doped with Tm3+. Radiat. Meas. 2014, 71, 51–54. [Google Scholar] [CrossRef]
  27. Wang, Y.; Wang, S.; Wang, J.; Zhang, Z.; Zhang, Z.; Rongrong, L.R.; Zu, Y.; Liu, J.; Su, L. High-efficiency ~2 μm CW laser operation of LD-pumped Tm3+:CaF2 single-crystal fibers. Opt. Express 2020, 28, 6684–6695. [Google Scholar] [CrossRef]
  28. Peijzel, P.S.; Vergeer, P.; Meijerink, A. 4f n−15d-4f n emission of Ce3+, Pr3+, Nd3+, Er3+, and Tm3+ in LiYF4 and YPO4. Phys. Rev. B 2005, 71, 045116. [Google Scholar] [CrossRef]
  29. Walsh, B.M.; Barnes, N.P.; Di Bartolo, B. Branching ratios, cross sections, and radiative lifetimes of rare earth ions in solids: Application to Tm3+ and Ho3+ ions in LiYF4. J. Appl. Phys. 1998, 83, 2772–2787. [Google Scholar] [CrossRef]
  30. Özen, G.; Demirata, B.; Övecoglu, M.L.; Genc, A. Thermal and optical properties of Tm3+ doped tellurite glasses. Spectrochim. Acta P A 2001, 57, 273–280. [Google Scholar] [CrossRef]
  31. Mattarelli, M.; Tikhomirov, V.K.; Seddon, A.B.; Montagna, M.; Moser, E.; Chiasera, A.; Chaussedent, S.; Nunzi Conti, G.; Pelli, S.; Righini, G.C.; et al. Tm3+-activated transparent oxy-fluoride glass–ceramics: Structural and spectroscopic properties. J. Non-cryst. Solids 2024, 345, 354–358. [Google Scholar] [CrossRef]
  32. Wang, S.; Ruan, Y.; Tsuboi, T.; Zhang, S.; Wang, Y.; Wu, Z.; Tong, H. Studies on the growth and optical characterization of Tm3+-doped BaY2F8 single crystals. Cryst. Res. Technol. 2012, 47, 928–938. [Google Scholar] [CrossRef]
  33. Schlesinger, M.; Szczurek, T. Spectroscopic studies of excited Tm3+ ions in alkaline-earth fluorides. Phys. Rev. B 1987, 35, 8341–8347. [Google Scholar] [CrossRef]
  34. Khenata, R.; Daoudi, B.; Sahnoun, M.; Baltache, H.; Rerat, M.; Reshak, A.H.; Bouhafs, B.; Abid, H.; Driz, M. Structural, electronic and optical properties of fluorite-type compounds. Eur. Phys. J. B 2005, 47, 63–70. [Google Scholar] [CrossRef]
  35. Kiss, Z.J. Energy Levels of Divalent Thulium in CaF2. Phis. Rev. 1962, 127, 718. [Google Scholar] [CrossRef]
  36. Anlsimov, F.; Vala, A.; Dagys, R. The Shielding of Crystal Field at Tm2+ in CaF2. Phys. Status Solidi (A) 1971, 6, K15–K17. [Google Scholar] [CrossRef]
  37. Hayes, W.; Smith, P.H.S. Paramagnetic resonance in ground and optically excited states of Tm2+ in alkaline earth fluorides. J. Phys. C Solid St. Phys. 1971, 4, 63–70. [Google Scholar] [CrossRef]
  38. Choh, S.H.; Yi, K.S. Point-charge approximation of trigonal Tm2+ and Yb3+ centres in crystals of CaF2 structure. J. Phys. C Solid State Phys. 1978, 11, 840–850. [Google Scholar] [CrossRef]
  39. Nicoara, D.; Nicoara, I. An improved Bridgman-Stockbarger crystal-growth system. Mat. Sci. Eng. A 1978, 102, 725–733. [Google Scholar] [CrossRef]
  40. Sarkisova, S.E.; Yusima, V.A.; Pisarevskya, Y.V. Study of the formation of radiation-stimulated impurity defects in CaF2 crystals activated by trivalent rare-earth ions. Crystallogr. Rep. 2023, 68, 79–87. [Google Scholar] [CrossRef]
  41. Nicoara, I.; Stef, M.; Vizman, D. Influence of growth conditions on the optical spectra of gamma irradiated BaF2 and CaF2 crystals. J. Cryst. Growth 2019, 525, 125188. [Google Scholar] [CrossRef]
  42. Kaminskii, A. Crystalline Lasers Physical Processes and Operating Schemes; CRC Press: Boca Raton, FL, USA, 1996; pp. 284–297. [Google Scholar]
  43. Judd, B.R. Optical absorption intensities of rare-earth ions. Phys. Rev. 1962, 127, 750–761. [Google Scholar] [CrossRef]
  44. Ofelt, G.S. Intensities of Crystal Spectra of Rare-Earth Ions. J. Chem. Phys. 1962, 37, 511–520. [Google Scholar] [CrossRef]
  45. Li, H.H. Refractive index of alkaline earth halides and its wavelenght and temperature derivatives. J. Phys. Chem. 1980, 9, 161–289. [Google Scholar] [CrossRef]
  46. Zhang, C.; Fu, Z.; Hong, F.; Dou, J.; Dong, T.; Zhang, Y.; Li, D.; Liu, G.; Dong, X.; Wang, J. Enhanced UV–Vis–NIR composite photocatalysis of NaBiF4:Yb3+, Tm3+ upconversion nanoparticles loaded on Bi2WO6 microspheres. J. Solid State Chem. 2021, 300, 122248. [Google Scholar] [CrossRef]
  47. Zhang, Y.; Chen, B.; Zhang, X.; Li, X.; Zhang, J.; Xu, S.; Wang, X.; Zhang, Y.; Wang, L.; Li, D.; et al. Full color white light, temperature self-monitor, and thermochromatic effect of Cu+ and Tm3+ codoped germanate glasses. J. Am. Ceram. Soc. 2021, 104, 350–360. [Google Scholar] [CrossRef]
  48. Li, X.; Yu, Y.; Guan, X.; Luo, P.; Chen, F.; Yu, M.; Jiang, L. Dual-emitting Tm3+/Mn2+ co-doped glass ceramic for wide-range optical thermometer. J. Alloys Compd. 2020, 836, 155507. [Google Scholar] [CrossRef]
  49. Zhou, J.; Song, B.; Qin, H.; Lu, W.; Zhao, G.; Huang, Z.M.; Han, G. Color-tunable and white emission of Tm3+ doped transparent zinc silicate glass-ceramics embedding ZnO nanocrystals. J. Am. Ceram. Soc. 2020, 103, 1010–1017. [Google Scholar] [CrossRef]
  50. Alvesa, R.T.; Rego-Filhoa, F.G.; Santosa, F.P.S.; Silvaa, A.C.A.; Dantasa, N.O.; Vermelhoa, M.V.D.; Gouveia-Netoa, A.S. Luminescence and Tm3+ to Dy3+ energy transfer in TeO2:ZnO glass under NIR/UV excitation. J. Lumin. 2019, 215, 116706. [Google Scholar] [CrossRef]
  51. Thomas, J.K.R. Group on Computational Imaging and Electromagnetics (GoCIE—CIE Plot Utility). Available online: https://faculty.iitr.ac.in/~krjt8fcy/gocie.html#fea (accessed on 20 July 2024).
  52. Racu, A.; Stef, M.; Buse, G.; Nicoara, I.; Vizman, D. Luminescence properties and Judd-Ofelt analysis of various ErF3 concentration-doped BaF2 crystals. Materials 2021, 14, 4221. [Google Scholar] [CrossRef]
Figure 1. Preparation stage of the Bridgman setup to reach the melting temperature in the graphite heater. The inset shows CaF2:x mol% TmF3, (a) x = 0.1; (b) x = 1; (c) x = 5.
Materials 17 04965 g001
Figure 2. (a) Absorption spectra of CaF2 doped with three concentrations of TmF3 (x = 0.1, 1, and 5 mol%) measured at room temperature. The spectral features correspond to transitions of Tm3+ and Tm2+ ions, with absorption peaks labelled according to their electronic transitions. The absorption spectrum corresponding to the concentration of 0.1 mol% TmF3 is multiplied by 10 (black line); (b) Linear fitting of the experimental data. The values of the correlation coefficients, r2, are indicated on the graph.
Materials 17 04965 g002
Figure 3. Room temperature emission spectra of CaF2 crystals doped with different concentrations of Tm3+ ions (0.1, 1, and 5 mol%) under excitation at (a) 260 nm, corresponding to the 3H63P2 transition, and (b) 353 nm, corresponding to the 3H61D2 transition.
Materials 17 04965 g003
Figure 4. Energy level diagram of Tm3+ ions in CaF2 crystal illustrating the observed electronic transitions corresponding to the emission peaks in the spectra. The diagram shows excitation processes (solid upward arrows) at 260 nm, leading to the population of the excited states. The subsequent radiative transitions (downward arrows) result in emission at various wavelengths.
Materials 17 04965 g004
Figure 5. CIE chromaticity diagram of CaF2:Tm3+ crystal under excitation (a) at 260 and (b) 356 nm.
Materials 17 04965 g005
Figure 6. (a) Emission spectra of CaF2 crystals doped with various concentrations of TmF3 (0.1, 1, and 5 mol%) under 305 nm excitation, corresponding to the Tm2+ transition. The prominent emission peak at 353 nm is observed, with the intensity significantly decreasing as the concentration of TmF3 increases; (b) Emission (black-line) and excitation spectrum (blue-line) of CaF2: 0.1 mol% TmF3.
Materials 17 04965 g006
Table 1. The transition, mean wavelength and the integrated absorption cross-section of the measured and calculated absorption line strengths of the selected absorption peaks of CaF2:TmF3 crystals.
SampleCaF2:1 mol% TmF3CaF2:5 mol% TmF3
Transition,
3H6
λm
[nm]
Σ
[×10−20 cm2·nm]
Smeas
[×10−20 cm2]
Scalc
[×10−20 cm2]
Σ
[×10−20 cm2·nm]
Smeas
[×10−20 cm2]
Scalc
[×10−20 cm2]
3F417874.0271.4371.21115.6050.9330.783
3H5123414.14281.2481.0938.1250.7020.885
3H47856.9600.9441.0986.8060.9230.978
2F2 + 2F36779.0891.4291.2679.1461.4361.148
1G44601.1480.2640.0871.4020.3230.089
1D23531.7220.5130.1811.6690.4980.368
ΔSrms = 0.298 × 10⁻²⁰ cm2 ΔSrms = 0.267 × 10⁻²⁰ cm2
Table 2. The Judd–Ofelt parameters, Ωt (expressed in 10−20 cm2) and the spectroscopic quality factors, χ.
Ωt
(10−20 cm2)
CaF2:1 mol% TmF3
(This Paper)
CaF2:5 mol% TmF3
(This Paper)
CaF2:
0.5 at.% TmF3 [24]
CaF2:1.5 at.% TmF3,
4 at.% YF3
[3]
CaF2:3 at.% TmF3,
2 at.% LaF3 [23]
CaF2:3 at.% TmF3,
2 at.% LaF3 [27]
Ω21.250430.202943.280.8911.4291.283
Ω40.150750.885040.991.2511.4851.323
Ω61.449991.032991.520.9591.1632.159
χ0.103970.856770.651.3041.2770.590
Table 3. The transitions corresponding to the wavelengths where luminescence was observed (Figure 3a,b), along with the calculated radiative lifetimes, radiative emission probabilities, and branching ratios.
Transitionλem.
(nm)
Ref.CaF2:1 mol% TmF3CaF2:5 mol% TmF3
τcalc.
(ms)
AJJ′
(s−1)
βJJ′τcalc.
(ms)
AJJ′
(s−1)
βJJ′
3F33H6690[3,32]0.8710100.87 ± 0.1730.95915.40.87 ± 0.129
1D23H5510[1,32]0.2078.70.02 ± 0.0030.2058.50.01 ± 0.002
1G43H6482[1,3,32,46,47,48,49,50]0.83175.70.15 ± 0.0301.23157.50.22 ± 0.033
1D23F4449[1,3,32,46,47,48,49,50,51]0.202048.80.41 ± 0.0810.201137.60.23 ± 0.034
3P03H5378[32]0.780.10-0.950.10-
1D23H6358[3,46]0.201508.80.30 ± 0.0600.203074.30.63 ± 0.093
3P03F4343[32]0.7811.40.01 ± 0.0020.9566.80.06 ± 0.009
Table 4. The CIE coordinates chart of the CaF2:Tm3+ crystal corresponding to the observed visible emissions under excitation at 260 and 356 nm.
CaF2:x mol% TmF3λexc.
(nm)
X-CoordinateY-Coordinateλexc.
(nm)
X-CoordinateY-Coordinate
x = 0.12600.280.203560.180.10
x = 10.250.220.180.16
x = 50.250.240.170.19
Disclaimer/Publisher’s Note: The statements, opinions and data contained in all publications are solely those of the individual author(s) and contributor(s) and not of MDPI and/or the editor(s). MDPI and/or the editor(s) disclaim responsibility for any injury to people or property resulting from any ideas, methods, instructions or products referred to in the content.

