
Large Room-Temperature Electrocaloric Effect in Lead-Free Relaxor Ferroelectric Ceramics with Wide Operation Temperature Range


Abstract
1. Introduction
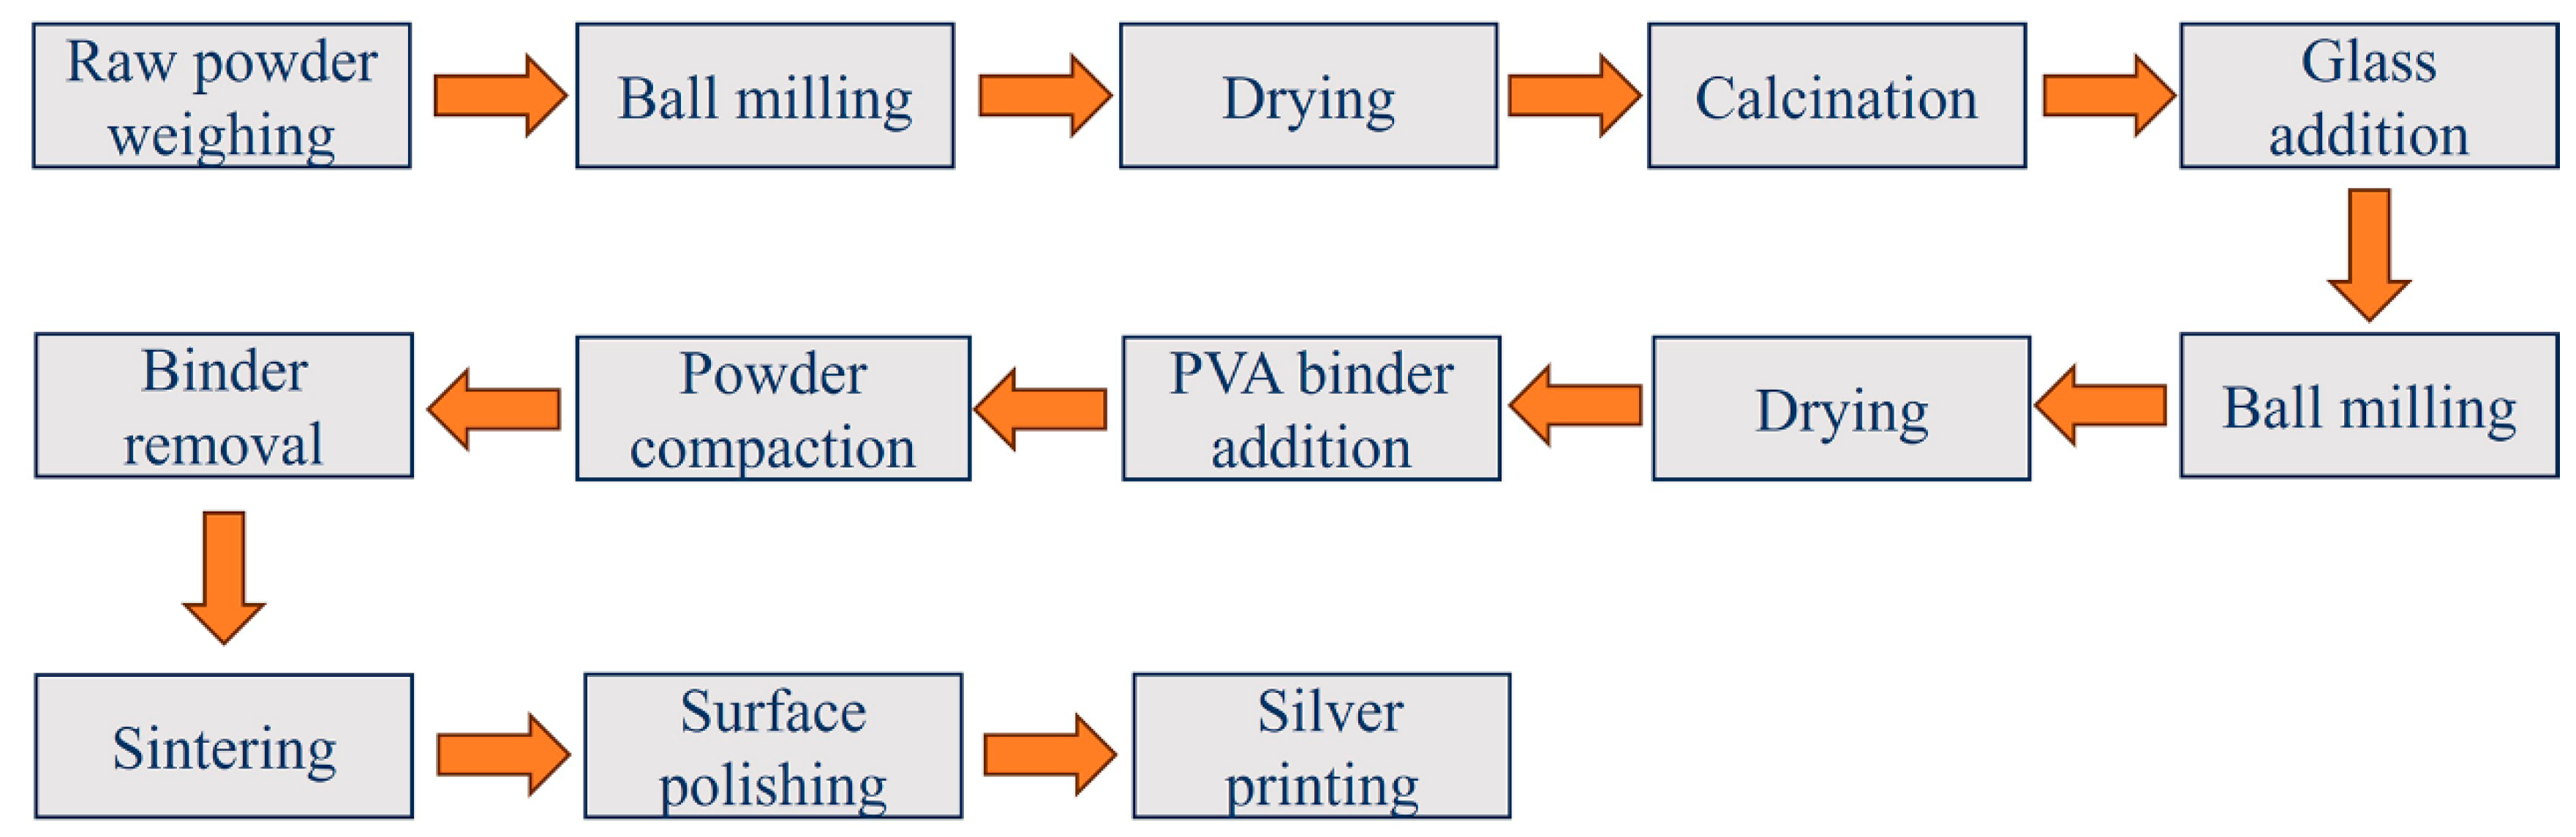
2. Experimental
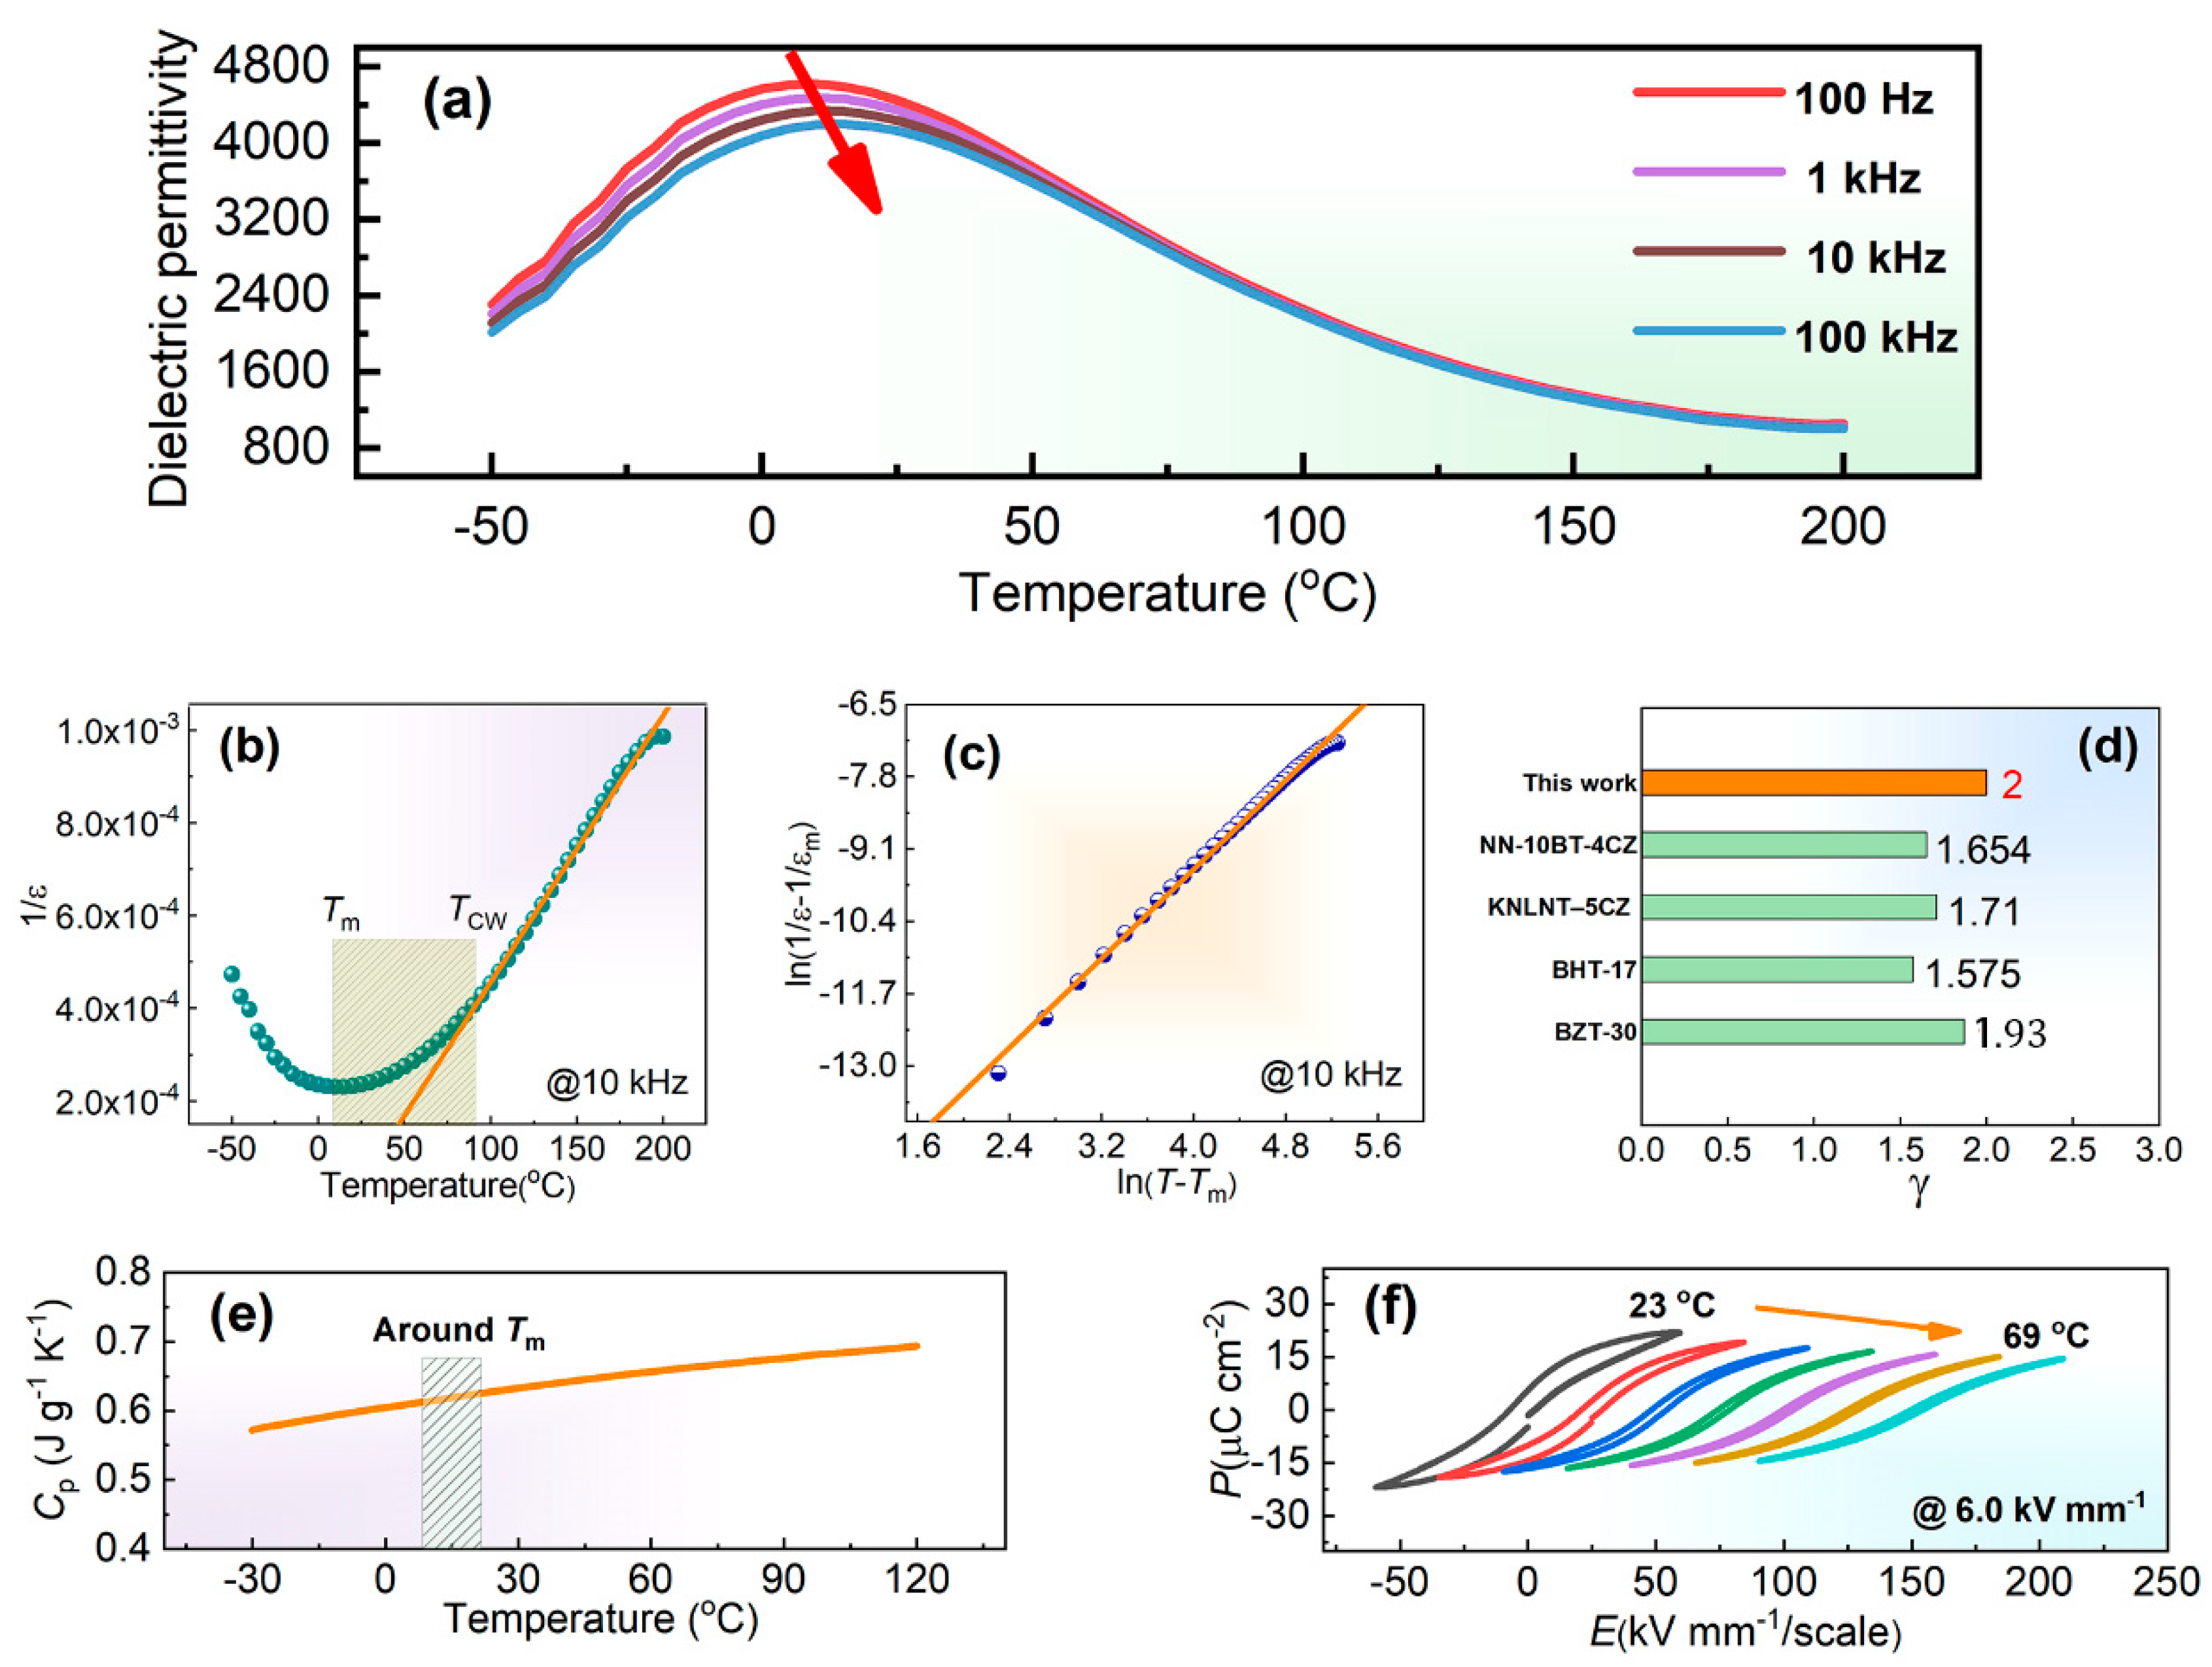
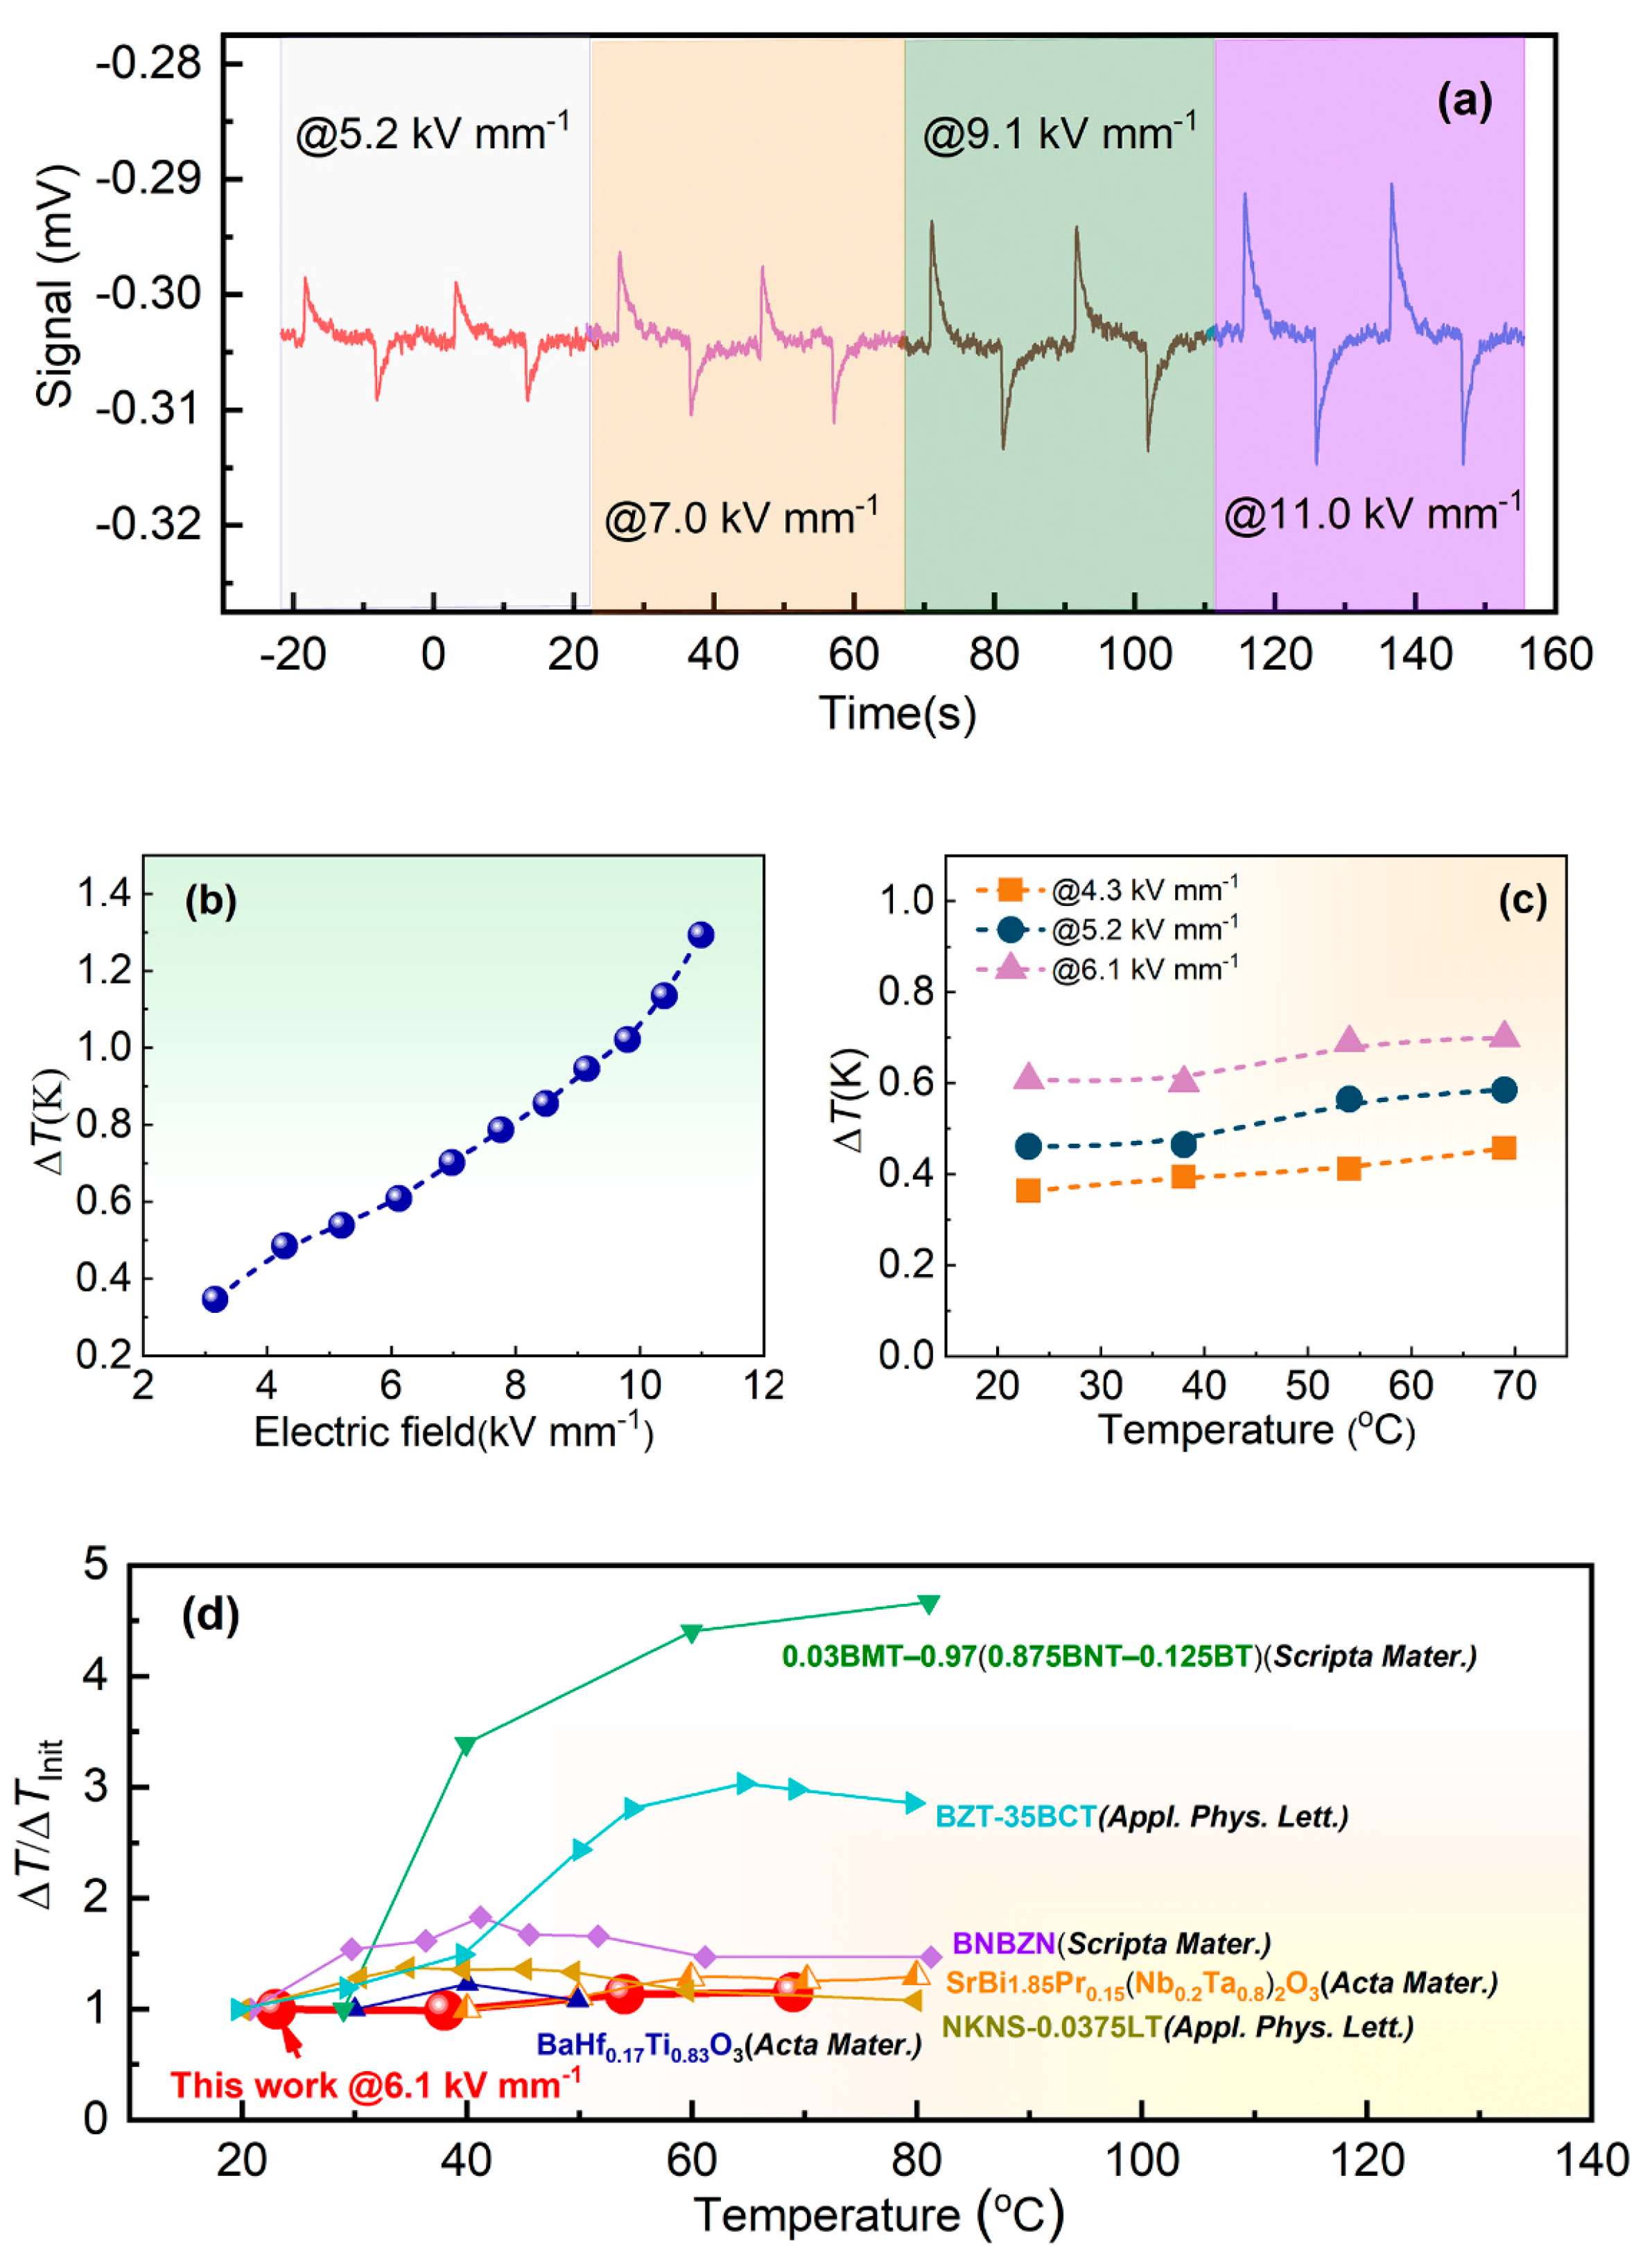
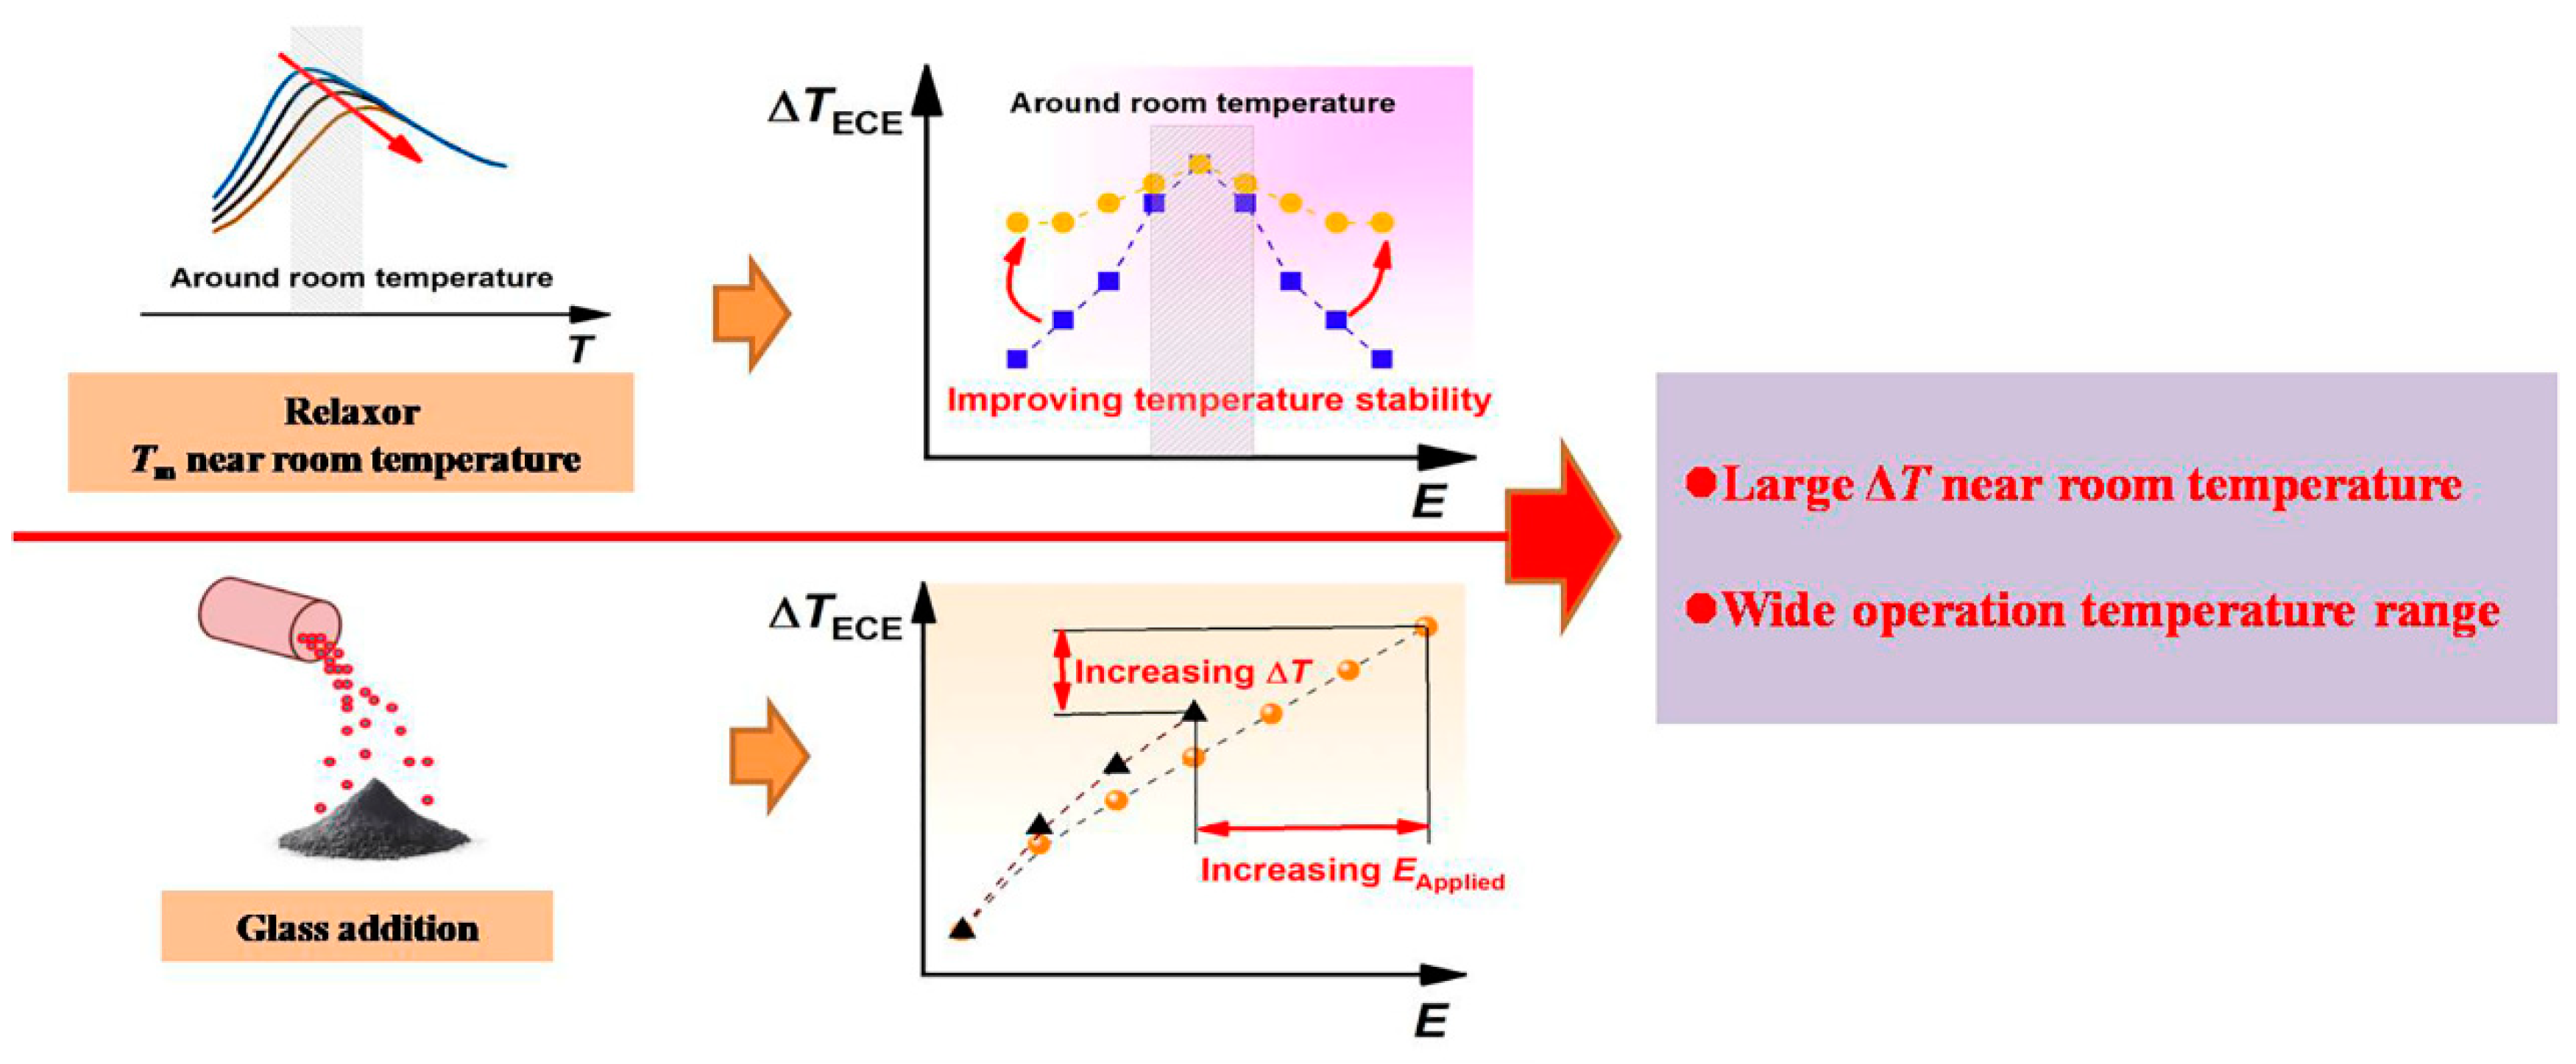
3. Results and Discussion

| Composition | ΔT(ECE) (K) | Etest (kV mm−1) | T (oC) | Measurement Method | Journal | Reference | Publication Year |
|---|---|---|---|---|---|---|---|
| NN-24BT+glass | 1.3 | 11.0 | 23 | Direct | This work | / | 2023 |
| NN-BT-0.05BZ | 0.27 | 3.0 | 30 | Direct | J Mater. Chem. A | [26] | 2021 |
| BZT-35BCT | 0.11 | 2.0 | 20 | Direct | Appl. Phys. Lett | [27] | 2015 |
| KNN-STO | 1.2 | 15.9 | 27 | Direct | Appl. Phys. Lett | [28] | 2015 |
| NKNS-0.0357LT | 0.21 | 2.0 | 20 | Direct | Appl. Phys. Lett | [13] | 2016 |
| SBPNT | 0.14 | 5.5 | 40 | Direct | Acta Mater. | [20] | 2017 |
| BaHf0.17Ti0.83O3 | 0.26 | 1.0 | 30 | Direct | Acta Mater. | [14] | 2016 |
| BNT-BT-0.08SBT | 0.40 | 6.0 | 27 | Direct | J. Eur. Ceram. Soc. | [29] | 2017 |
| KNN-0.05BNZ | 0.16 | 3.5 | 30 | Direct | J. Am. Ceram. Soc. | [30] | 2019 |
| BNT-0.06BT | 0.25 | 4.0 | 24 | Direct | Appl. Phys. Lett | [12] | 2017 |
| BT-0.07CZ-BS | 0.30 | 1.5 | 40 | Direct | J Mater. Chem. C | [31] | 2021 |
| BNBZN | 0.89 | 5.0 | 30 | Direct | Scripta Mater. | [32] | 2019 |
4. Conclusions
Supplementary Materials
Author Contributions
Funding
Institutional Review Board Statement
Informed Consent Statement
Data Availability Statement
Conflicts of Interest
References
- Scott, J.F. Applications of modern ferroelectrics. Science 2007, 315, 954–959. [Google Scholar] [CrossRef]
- Li, L.; Wang, S.; Li, X.; Sha, Y.; Liu, Z.; Liu, L.; Zhang, J.; Zhang, S.-T.; Wang, Y. Large pyroelectricity via engineered ferroelectric-relaxor phase boundary. J. Am. Ceram. Soc. 2022, 105, 5230–5239. [Google Scholar] [CrossRef]
- Mischenko, A.S.; Zhang, Q.; Scott, J.F.; Whatmore, R.W.; Mathur, N.D. Giant electrocaloric effect in thin-film PbZr0.95Ti0.05O3. Science 2006, 311, 1270–1271. [Google Scholar] [CrossRef] [PubMed]
- Neese, B.; Chu, B.; Lu, S.-G.; Wang, Y.; Furman, E.; Zhang, Q.M. Large electrocaloric effect in ferroelectric polymers near room temperature. Science 2008, 321, 821–823. [Google Scholar] [CrossRef]
- Torelló, A.; Defay, E. Electrocaloric coolers: A review. Adv. Electron. Mater. 2022, 8, 2101031. [Google Scholar] [CrossRef]
- Su, X.; Li, J.; Hou, Y.; Yin, R.; Li, J.; Qin, S.; Su, Y.; Qiao, L.; Liu, C.; Bai, Y. Large electrocaloric effect over a wide temperature span in lead-free bismuth sodium titanate-based relaxor ferroelectrics. J. Mater. 2023, 9, 289–298. [Google Scholar] [CrossRef]
- Li, J.; Li, Z.; He, J.; Hou, Y.; Su, Y.; Qiao, L.; Bai, Y. Near-room-temperature large electrocaloric effect in barium titanate single crystal based on the electric field–temperature phase diagram. Phys. Status Solidi RRL 2021, 15, 210025. [Google Scholar] [CrossRef]
- Zhang, G.; Li, Q.; Gu, H.; Jiang, S.; Han, K.; Gadinski, M.R.; Haque, M.A.; Zhang, Q.; Wang, Q. Ferroelectric polymer nanocomposites for room-temperature electrocaloric refrigeration. Adv. Mater. 2015, 27, 1450–1454. [Google Scholar] [CrossRef]
- Molin, C.; Sanlialp, M.; Shvartsman, V.V.; Lupascu, D.C.; Neumeister, P.; Schönecker, A.; Gebhardt, S. Effect of dopants on the electrocaloric effect of 0.92Pb(Mg1/3Nb2/3)O3–0.08PbTiO3 ceramics. J. Eur. Ceram. Soc. 2015, 35, 2065–2071. [Google Scholar] [CrossRef]
- Lu, B.; Yao, Y.; Jian, X.; Tao, T.; Liang, B.; Zhang, Q.M.; Lu, S.-G. Enhancement of the electrocaloric effect over a wide temperature range in PLZT ceramics by doping with Gd3+ and Sn4+ ions. J. Eur. Ceram. Soc. 2019, 39, 1093–1102. [Google Scholar] [CrossRef]
- Ma, X.; Shi, W.; Yang, Y.; Alikin, D.O.; Shur, Y.Y.; Gao, J.; Wei, X.; Liu, G.; Du, H.; Jin, L. Giant electrocaloric effect and high-field electrostrictive properties in Ba(Ti1−xSnx)O3 ceramics. Ceram. Int. 2023, 49, 18517–18524. [Google Scholar] [CrossRef]
- Li, F.; Chen, G.; Liu, X.; Zhai, J.; Shen, B.; Li, S.; Li, P.; Yang, K.; Zeng, H.; Yan, H. Type–I pseudo–first–order phase transition induced electrocaloric effect in lead–free Bi0.5Na0.5TiO3–0.06BaTiO3 ceramics. Appl. Phys. Lett. 2017, 110, 182904. [Google Scholar] [CrossRef]
- Li, J.; Bai, Y.; Qin, S.; Fu, J.; Zuo, R.; Qiao, L. Direct and indirect characterization of electrocaloric effect in (Na,K)NbO3 based lead-free ceramics. Appl. Phys. Lett. 2016, 109, 162902. [Google Scholar] [CrossRef]
- Li, J.; Zhang, D.; Qin, S.; Li, T.; Wu, M.; Wang, D.; Bai, Y.; Lou, X. Large room-temperature electrocaloric effect in lead-free BaHfxTi1-xO3 ceramics under low electric field. Acta Mater. 2016, 115, 58–67. [Google Scholar] [CrossRef]
- Qi, H.; Xie, A.; Tian, A.; Zuo, R. Superior Energy-Storage Capacitors with Simultaneously Giant Energy Density and Efficiency Using Nanodomain Engineered BiFeO3-BaTiO3-NaNbO3 Lead-Free Bulk Ferroelectrics. Adv. Energy Mater. 2020, 10, 1903338. [Google Scholar] [CrossRef]
- Huang, Y.H.; Wu, Y.J.; Qiu, W.J.; Li, J.; Chen, X.M. Enhanced energy storage density of Ba0.4Sr0.6TiO3–MgO composite prepared by spark plasma sintering. J. Eur. Ceram. Soc. 2015, 35, 1469–1476. [Google Scholar] [CrossRef]
- Wang, D.; Fan, Z.; Zhou, D.; Khesro, A.; Murakami, S.; Feteira, A.; Zhao, Q.; Tan, X.; Reaney, I.M. Bismuth ferrite-based lead-free ceramics and multilayers with high recoverable energy density. J. Mater. Chem. A 2018, 6, 4133–4144. [Google Scholar] [CrossRef]
- Deng, G.; Hao, H.; Yao, Z.; Cao, M.; Liu, H. Microstructure and dielectric properties of (Ba, Sr)TiO3 ceramics with alkali-free glasses. J. Mater. Sci. Mater. Electron. 2023, 34, 1375. [Google Scholar] [CrossRef]
- Xu, H.; Liu, J.; Luo, P.; Zeng, M. Low temperature sintering and energy storage properties of 0.8Ba0.2Sr0.8TiO3–0.2Bi(Mg0.5Zr0.5)O3 ceramic with additive of SrO–B2O3–ZnO glass. J. Mater. Sci. Mater. Electron. 2023, 34, 1048. [Google Scholar] [CrossRef]
- Axelsson, A.-K.; Goupil, F.L.; Valant, M.; Alford, N.M. Electrocaloric effect in lead-free Aurivillius relaxor ferroelectric ceramics. Acta Mater. 2017, 124, 120–126. [Google Scholar] [CrossRef]
- Lei, C.; Bokov, A.A.; Ye, Z.-G. Ferroelectric to relaxor crossover and dielectric phase diagram in the BaTiO3–BaSnO3 system. J. Appl. Phys. 2007, 101, 084105. [Google Scholar] [CrossRef]
- Arshad, M.; Huiling, D.; Sufyan, J.M.; Maqsood, A.; Ashraf, I.; Hussain, S.; Ma, W.; Ran, H. Fabrication, structure, and frequency-dependent electrical and dielectric properties of Sr-doped BaTiO3 ceramics. Ceram. Int. 2020, 46, 2238–2246. [Google Scholar] [CrossRef]
- Tang, X.G.; Chew, K.-H.; Chan, H.L.W. Diffuse phase transition and dielectric tunability of Ba(ZryTi1−y)O3 relaxor ferroelectric ceramics. Acta Mater. 2004, 52, 5177–5183. [Google Scholar] [CrossRef]
- Yang, J.; Zhao, Y.; Lou, X.; Wu, J.; Hao, X. Synergistically optimizing electrocaloric effects and temperature span in KNN-based ceramics utilizing a relaxor multiphase boundary. J. Mater. Chem. C 2020, 8, 4030–4039. [Google Scholar] [CrossRef]
- Tao, H.; Yang, J.; Lv, X.; Hao, X.; Wu, J. Electrocaloric behavior and piezoelectric effect in relaxor NaNbO3-based ceramics. J. Am. Ceram. Soc. 2019, 102, 2578–2586. [Google Scholar] [CrossRef]
- Zhang, T.; Zhao, C.; Zheng, T.; Wu, J. Large electrocaloric response with superior temperature stability in NaNbO3-based relaxor ferroelectrics benefiting from the crossover region. J. Mater. Chem. A 2021, 9, 2806–2814. [Google Scholar] [CrossRef]
- Sanlialp, M.; Shvartsman, V.V.; Acosta, M.; Dkhil, B.; Lupascu, D.C. Strong electrocaloric effect in lead-free 0.65Ba(Zr0.2Ti0.8)O3-0.35(Ba0.7Ca0.3)TiO3 ceramics obtained by direct measurements. Appl. Phys. Lett. 2015, 106, 062901. [Google Scholar] [CrossRef]
- Koruza, J.; Rožič, B.; Cordoyiannis, G.; Malič, B.; Kutnjak, Z. Large electrocaloric effect in lead-free K0.5Na0.5NbO3-SrTiO3 ceramics. Appl. Phys. Lett. 2015, 106, 202905. [Google Scholar] [CrossRef]
- Li, F.; Chen, G.; Liu, X.; Zhai, J.; Shen, B.; Zeng, H.; Li, S.; Li, P.; Yang, K.; Yan, H. Phase–composition and temperature dependence of electrocaloric effect in lead–free Bi0.5Na0.5TiO3–BaTiO3–(Sr0.7Bi0.2)TiO3 ceramics. J. Eur. Ceram. Soc. 2017, 37, 4732–4740. [Google Scholar] [CrossRef]
- Yang, J.; Hao, X. Electrocaloric effect and pyroelectric performance in (K,Na) NbO3-based lead-free ceramics. J. Am. Ceram. Soc. 2019, 102, 6817–6826. [Google Scholar] [CrossRef]
- Wei, X.; Zhao, C.; Zheng, T.; Wu, J. Decoding the relationship between the electrocaloric strength and phase structure in perovskite ferroelectrics towards high performance. J. Mater. Chem. C. 2021, 9, 20632072. [Google Scholar] [CrossRef]
- Wei, Q.; Zhu, M.; Zheng, M.; Hou, Y.; Li, J.; Bai, Y. Large electrocaloric effect near room temperature in lead–free Bi0.5Na0.5TiO3-based ergodic relaxor observed by differential scanning calorimetry. Scr. Mater. 2019, 171, 10–15. [Google Scholar] [CrossRef]
- Vrabelj, M.; Ursic, H.; Kutnjak, Z.; Rozic, B.; Drnovsek, S.; Bencan, A.; Bobnar, V.; Fulanovic, L.; Malic, B. Large electrocaloric effect in grain-size-engineered 0.9Pb(Mg1/3Nb2/3)O3–0.1PbTiO3. J. Eur. Ceram. Soc. 2016, 36, 75–80. [Google Scholar] [CrossRef]
- Yan, X.; Zhu, M.; Wei, Q.; Lu, S.-G.; Zheng, M.; Hou, Y. Large electrocaloric effect in tetragonal perovskite 0.03Bi(Mg1/2Ti1/2)O3–0.97(0.875Bi1/2Na1/2TiO3–0.125BaTiO3) lead-free ferroelectric ceramics. Scr. Mater. 2019, 162, 256–260. [Google Scholar] [CrossRef]
- Bai, Y.; Han, X.; Zheng, X.C.; Qiao, L. Both high reliability and giant electrocaloric strength in BaTiO3 ceramics. Sci. Rep. 2013, 3, 2895. [Google Scholar] [CrossRef]

Disclaimer/Publisher’s Note: The statements, opinions and data contained in all publications are solely those of the individual author(s) and contributor(s) and not of MDPI and/or the editor(s). MDPI and/or the editor(s) disclaim responsibility for any injury to people or property resulting from any ideas, methods, instructions or products referred to in the content. |
© 2024 by the authors. Licensee MDPI, Basel, Switzerland. This article is an open access article distributed under the terms and conditions of the Creative Commons Attribution (CC BY) license (https://creativecommons.org/licenses/by/4.0/).
Share and Cite
Zhao, X.; Zhou, Z.; Liang, B.; Lu, S. Large Room-Temperature Electrocaloric Effect in Lead-Free Relaxor Ferroelectric Ceramics with Wide Operation Temperature Range. Materials 2024, 17, 5241. https://doi.org/10.3390/ma17215241
Zhao X, Zhou Z, Liang B, Lu S. Large Room-Temperature Electrocaloric Effect in Lead-Free Relaxor Ferroelectric Ceramics with Wide Operation Temperature Range. Materials. 2024; 17(21):5241. https://doi.org/10.3390/ma17215241
Chicago/Turabian StyleZhao, Xiaobo, Zhiyong Zhou, Bo Liang, and Shengguo Lu. 2024. "Large Room-Temperature Electrocaloric Effect in Lead-Free Relaxor Ferroelectric Ceramics with Wide Operation Temperature Range" Materials 17, no. 21: 5241. https://doi.org/10.3390/ma17215241
APA StyleZhao, X., Zhou, Z., Liang, B., & Lu, S. (2024). Large Room-Temperature Electrocaloric Effect in Lead-Free Relaxor Ferroelectric Ceramics with Wide Operation Temperature Range. Materials, 17(21), 5241. https://doi.org/10.3390/ma17215241