
Evaluation and Optimization of Cement Slurry Systems for Ultra-Deep Well Cementing at 220 °C


 ,
,
Abstract
1. Introduction
2. Materials and Experimental Routines
2.1. Raw Materials
2.2. Slurry and Set Cement Preparation
3. Testing Equipment and Methods
3.1. Thickening Time Test
3.2. Fluid Loss Test
3.3. Sedimentation Stability Test
3.4. Mechanical Strength Test
3.5. Water Permeability Test
3.6. Mercury Intrusion Porosimetry Test
3.7. Thermogravimetry Analysis
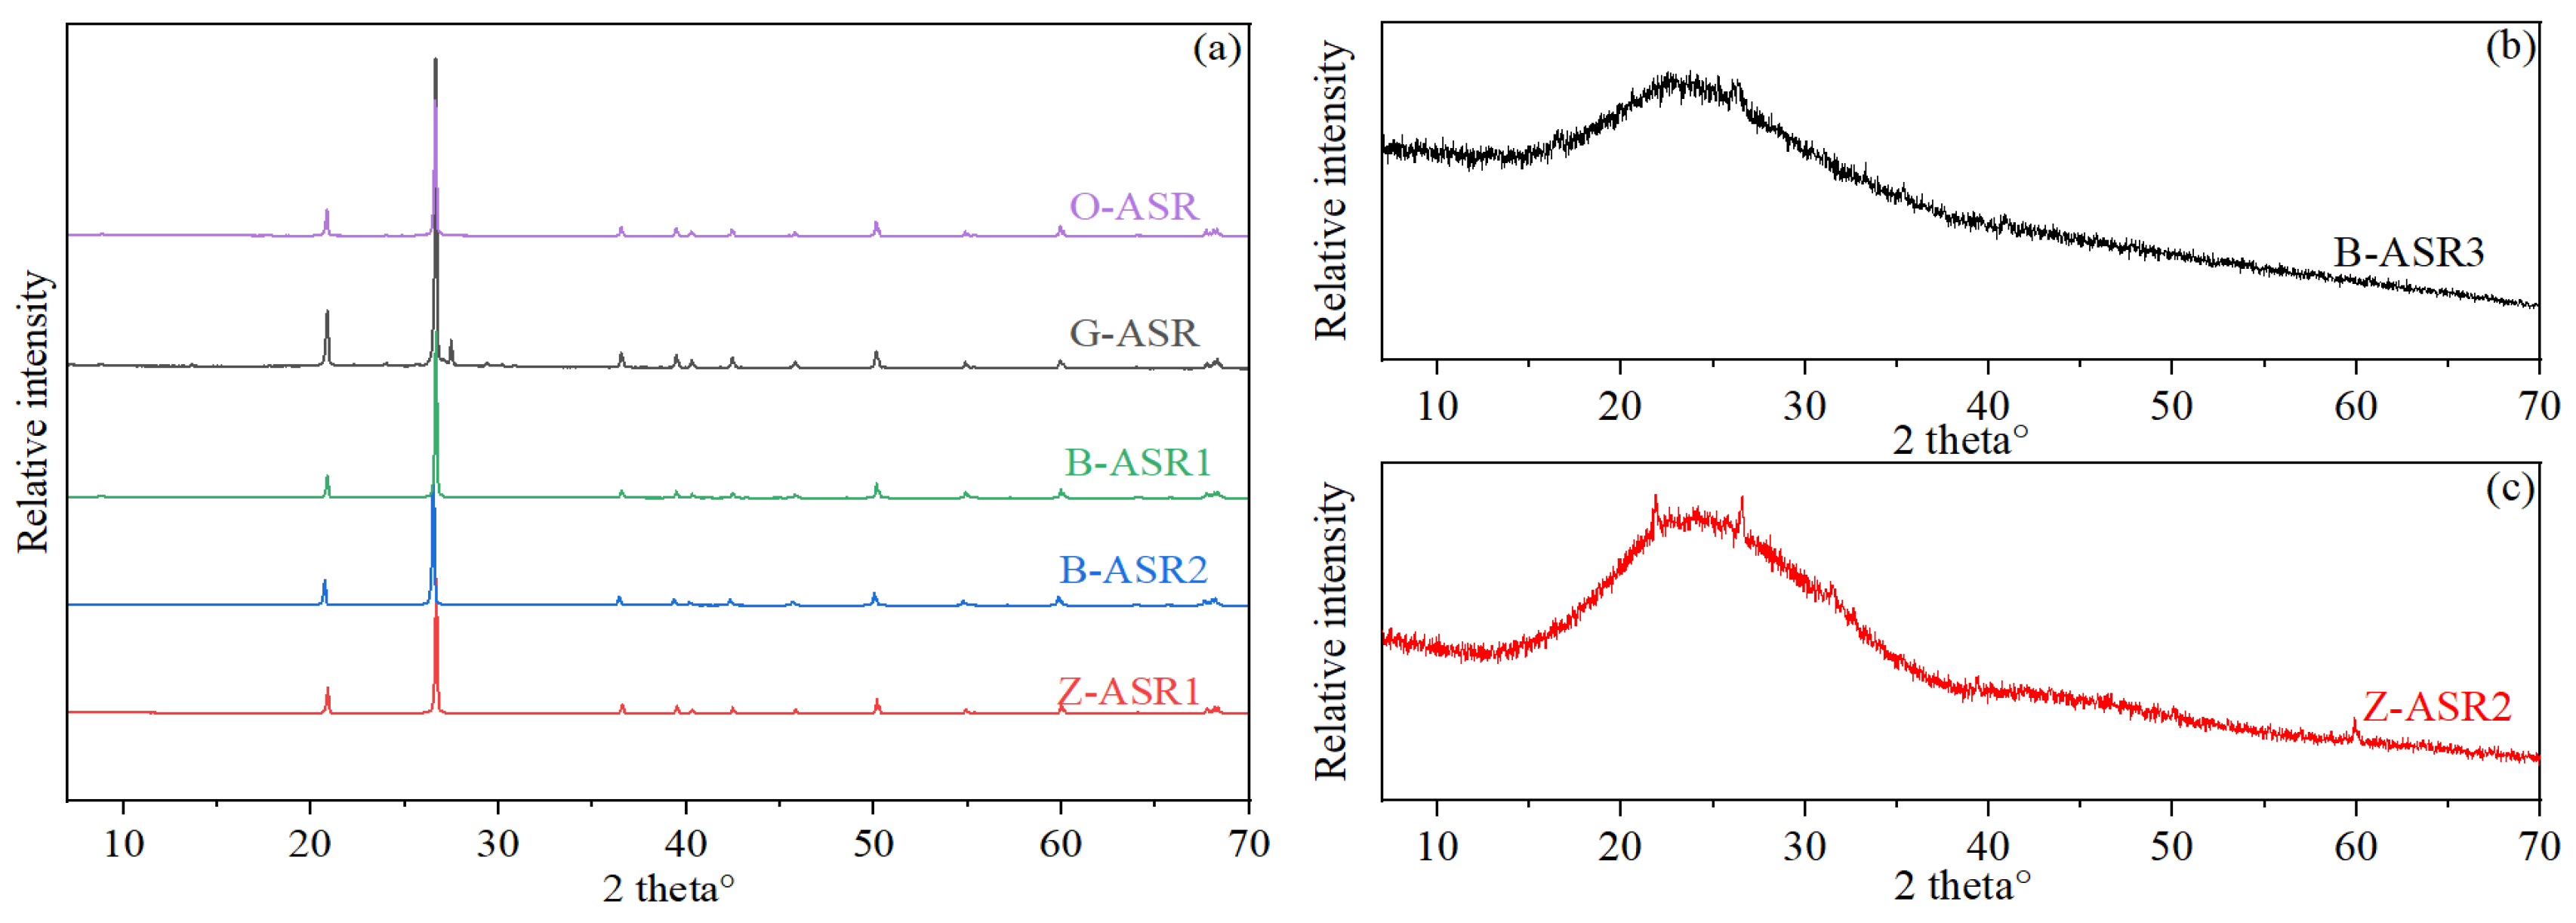
3.8. X-Ray Diffraction Analysis
4. Comparison of Cementing Systems of Different Service Providers
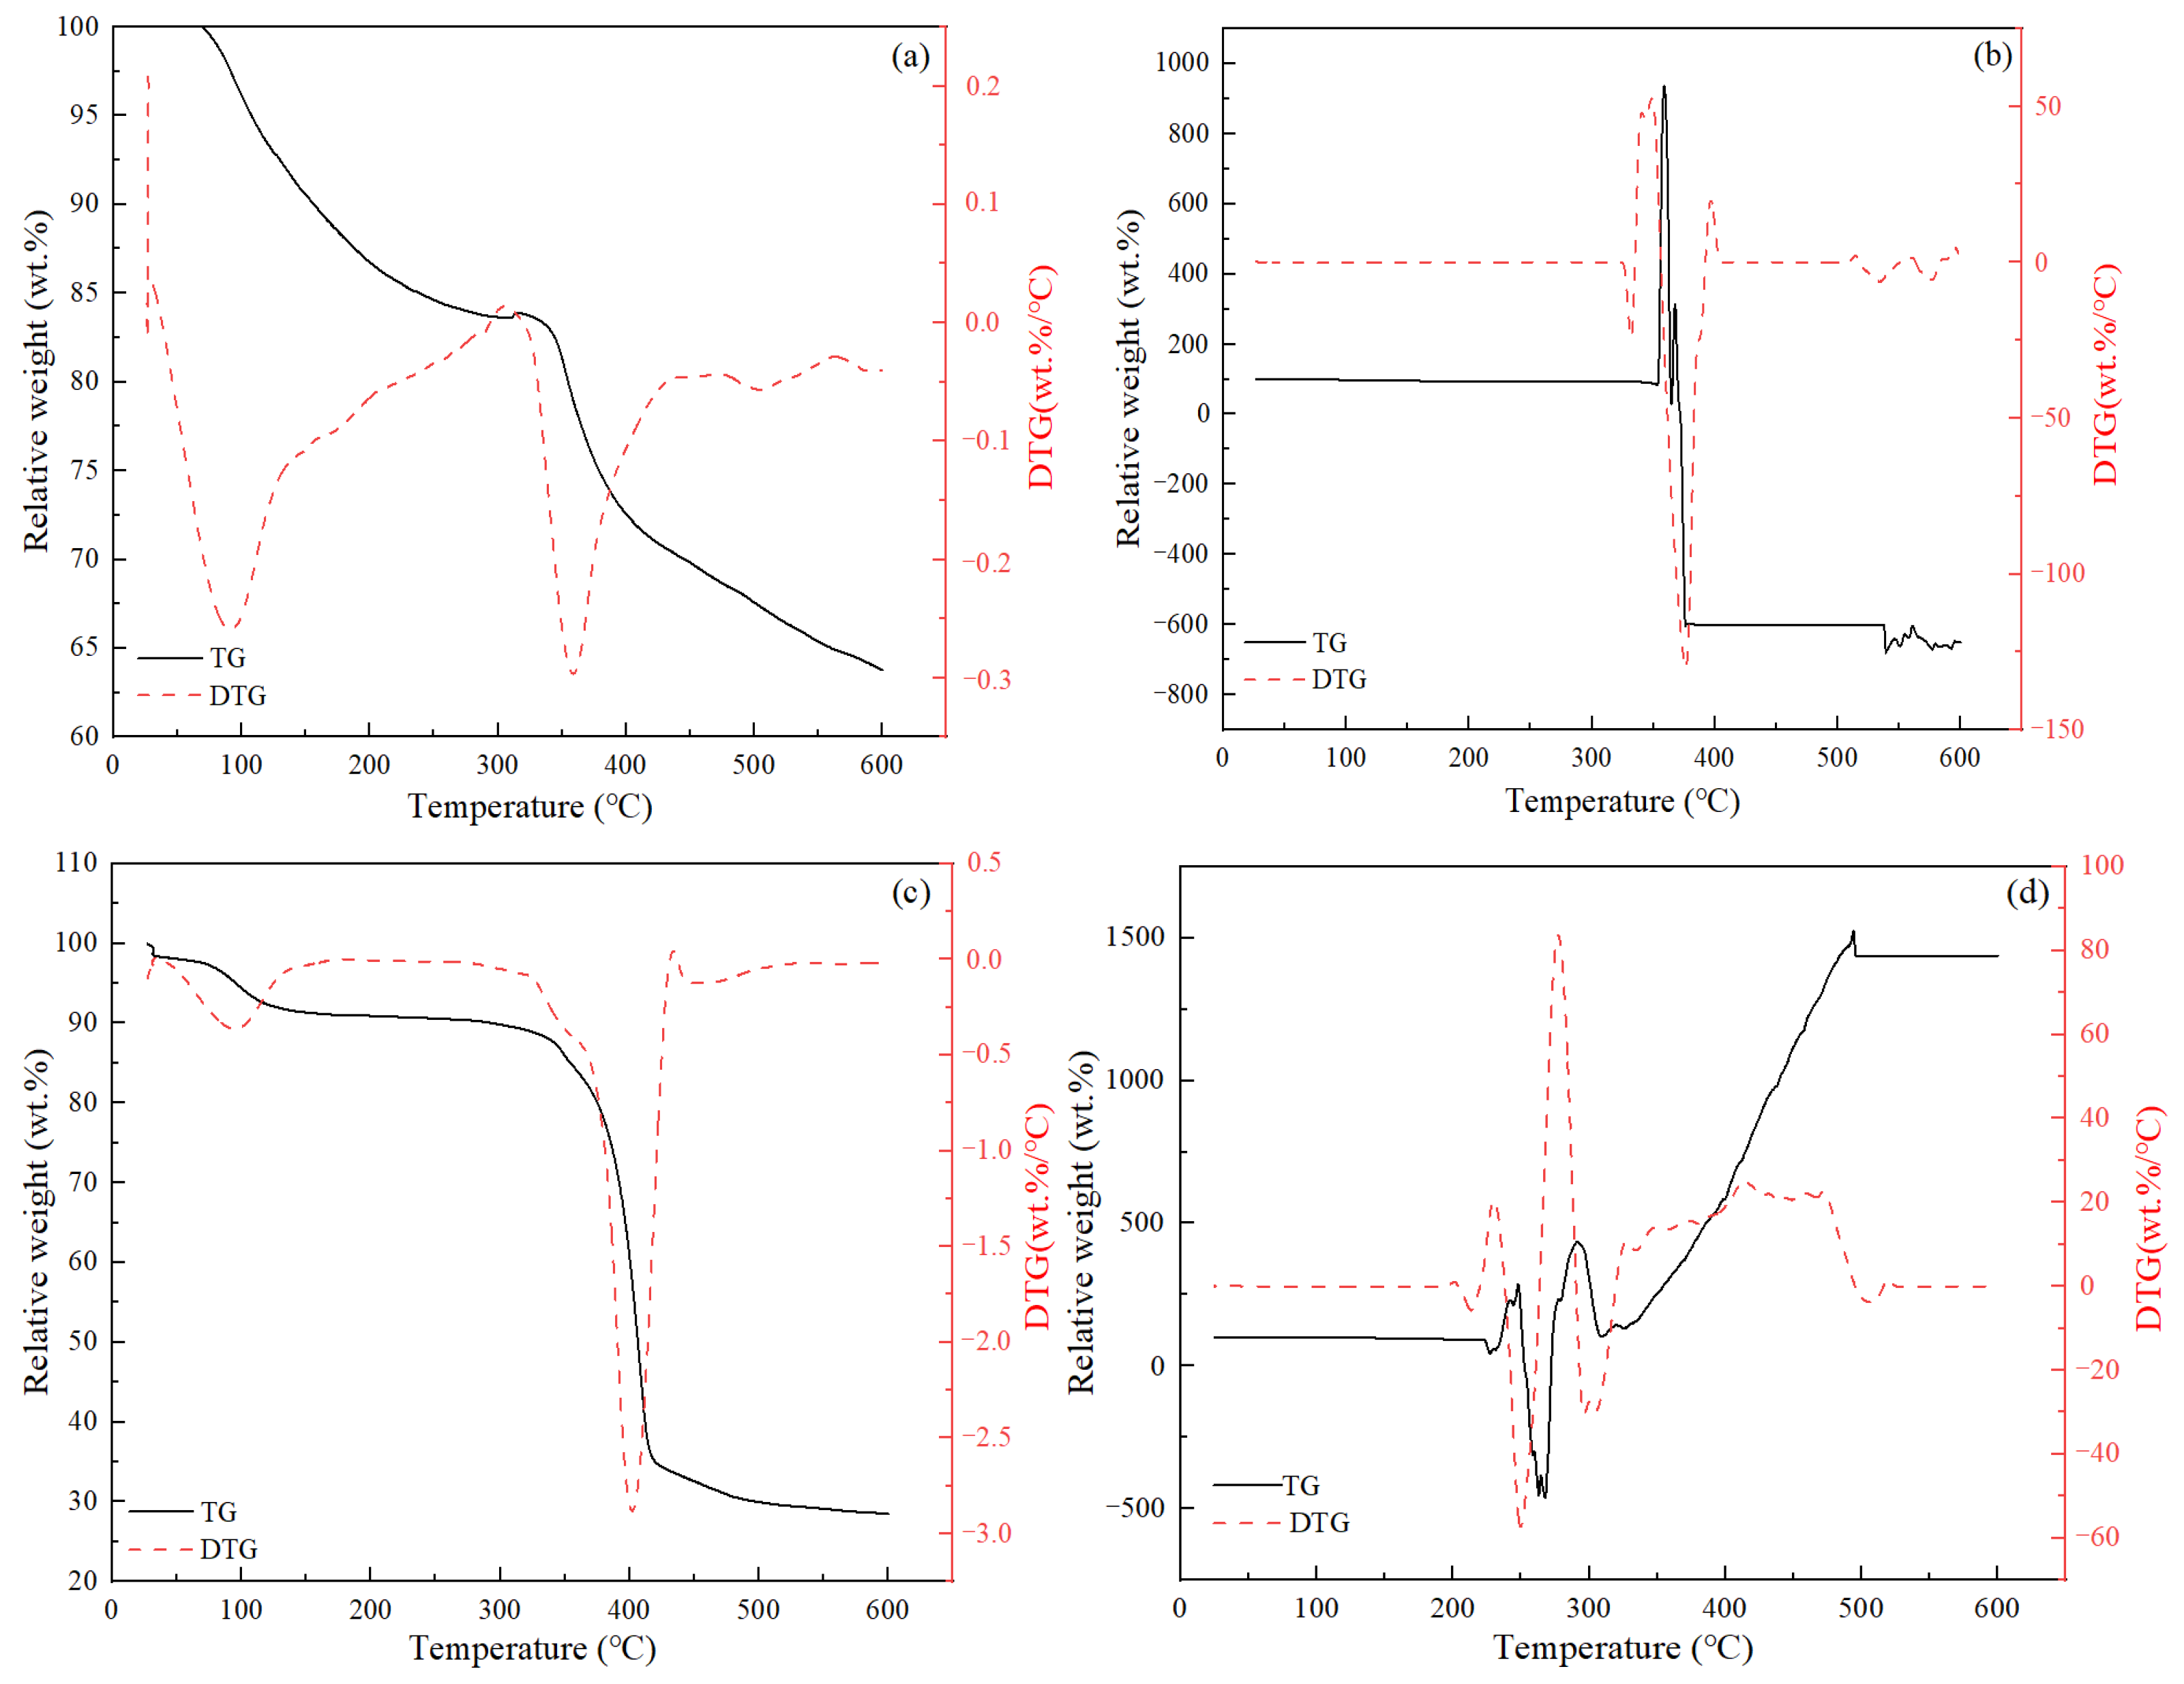
4.1. TGA Test Results of Cement Additives
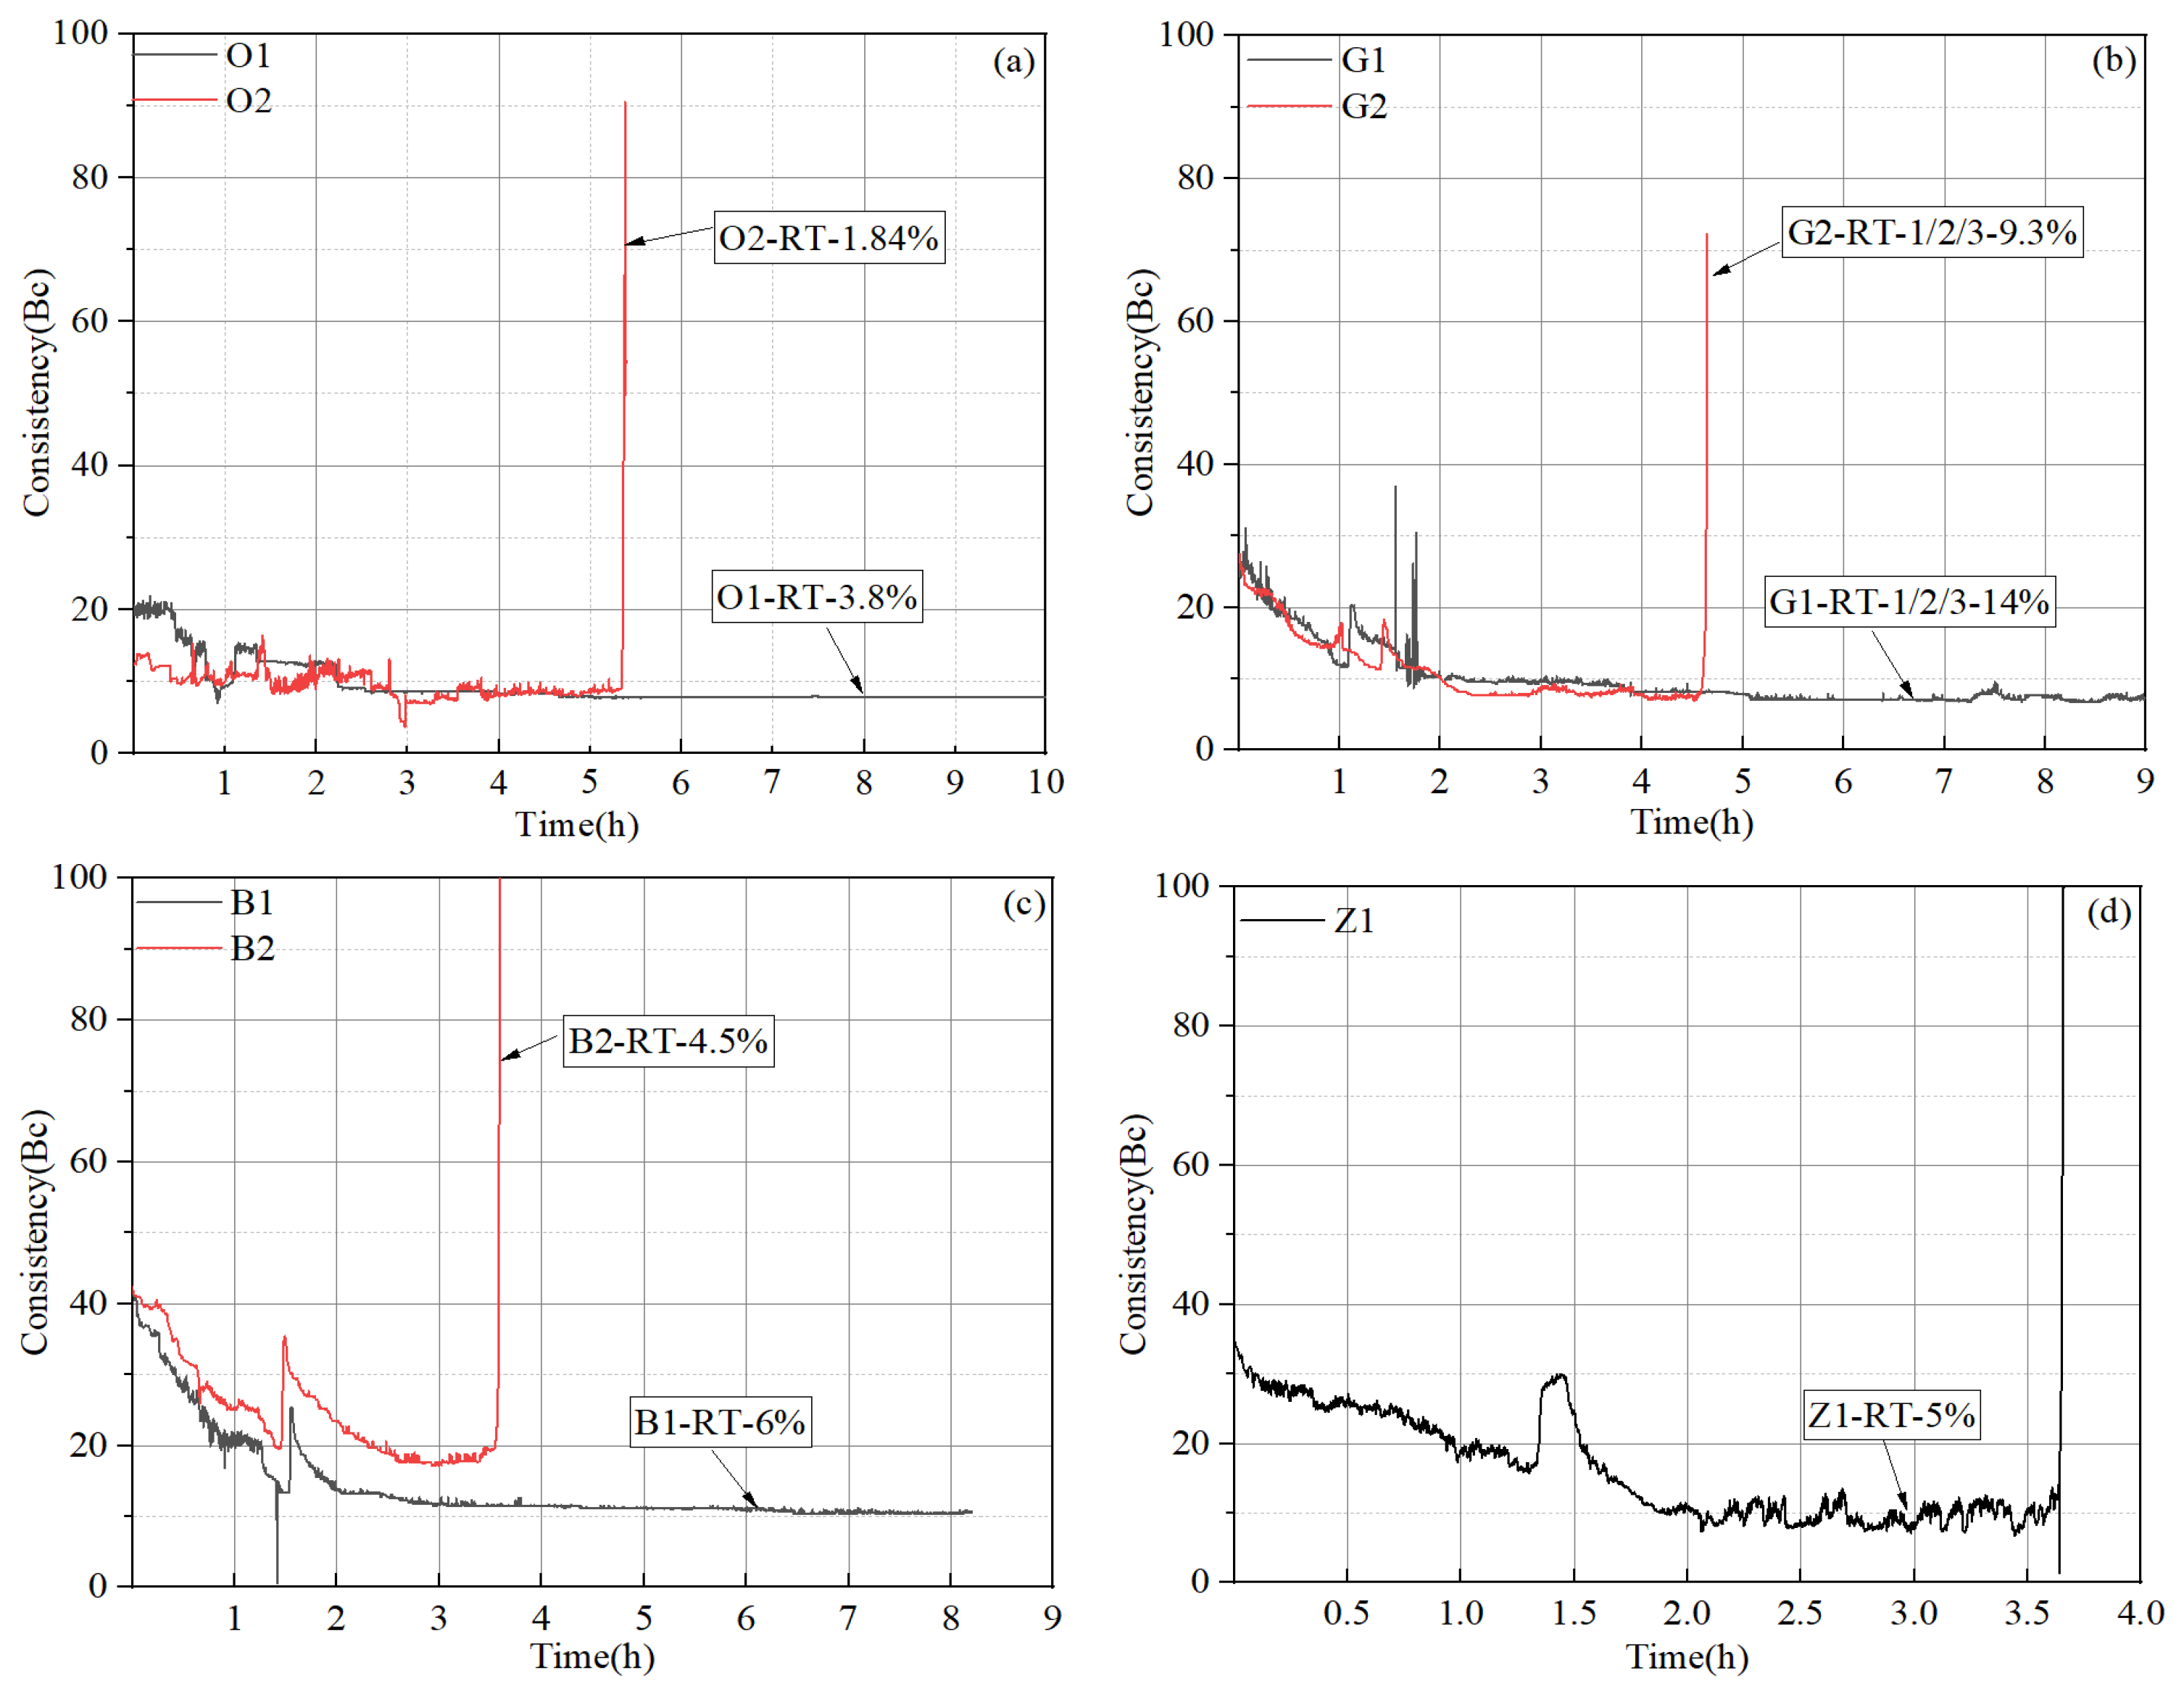
4.2. Cement Slurry Thickening Time Test Results of Preliminary Designs
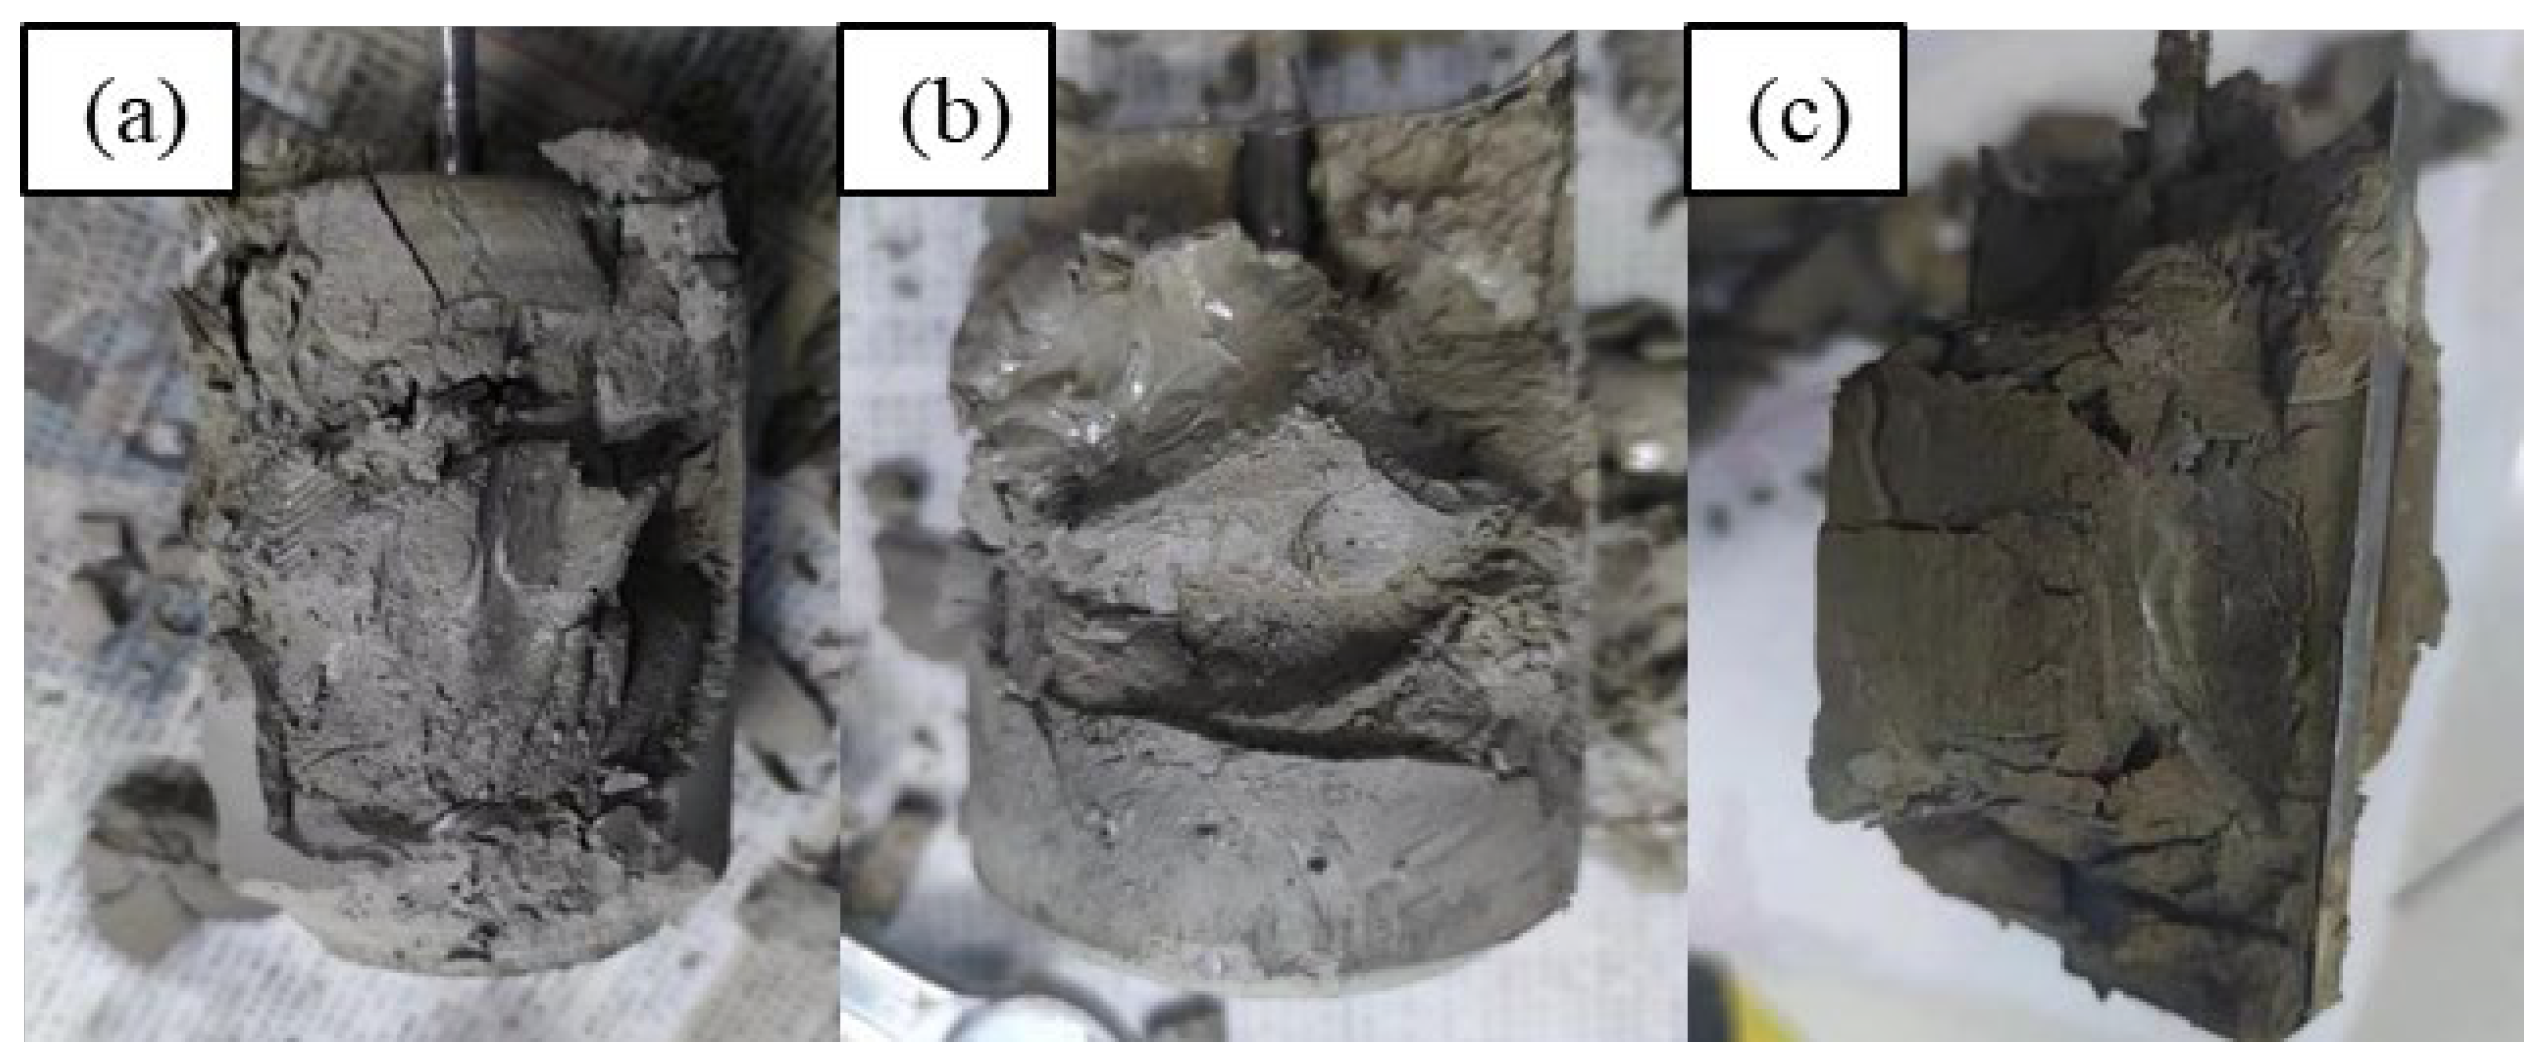
4.3. Set Cement Sedimentation Test Results of Preliminary Designs
4.4. Set Cement Physical and Mechanical Property Test Results of Preliminary Designs
4.5. Cement Slurry Fluid Loss Test Results of Preliminary Designs
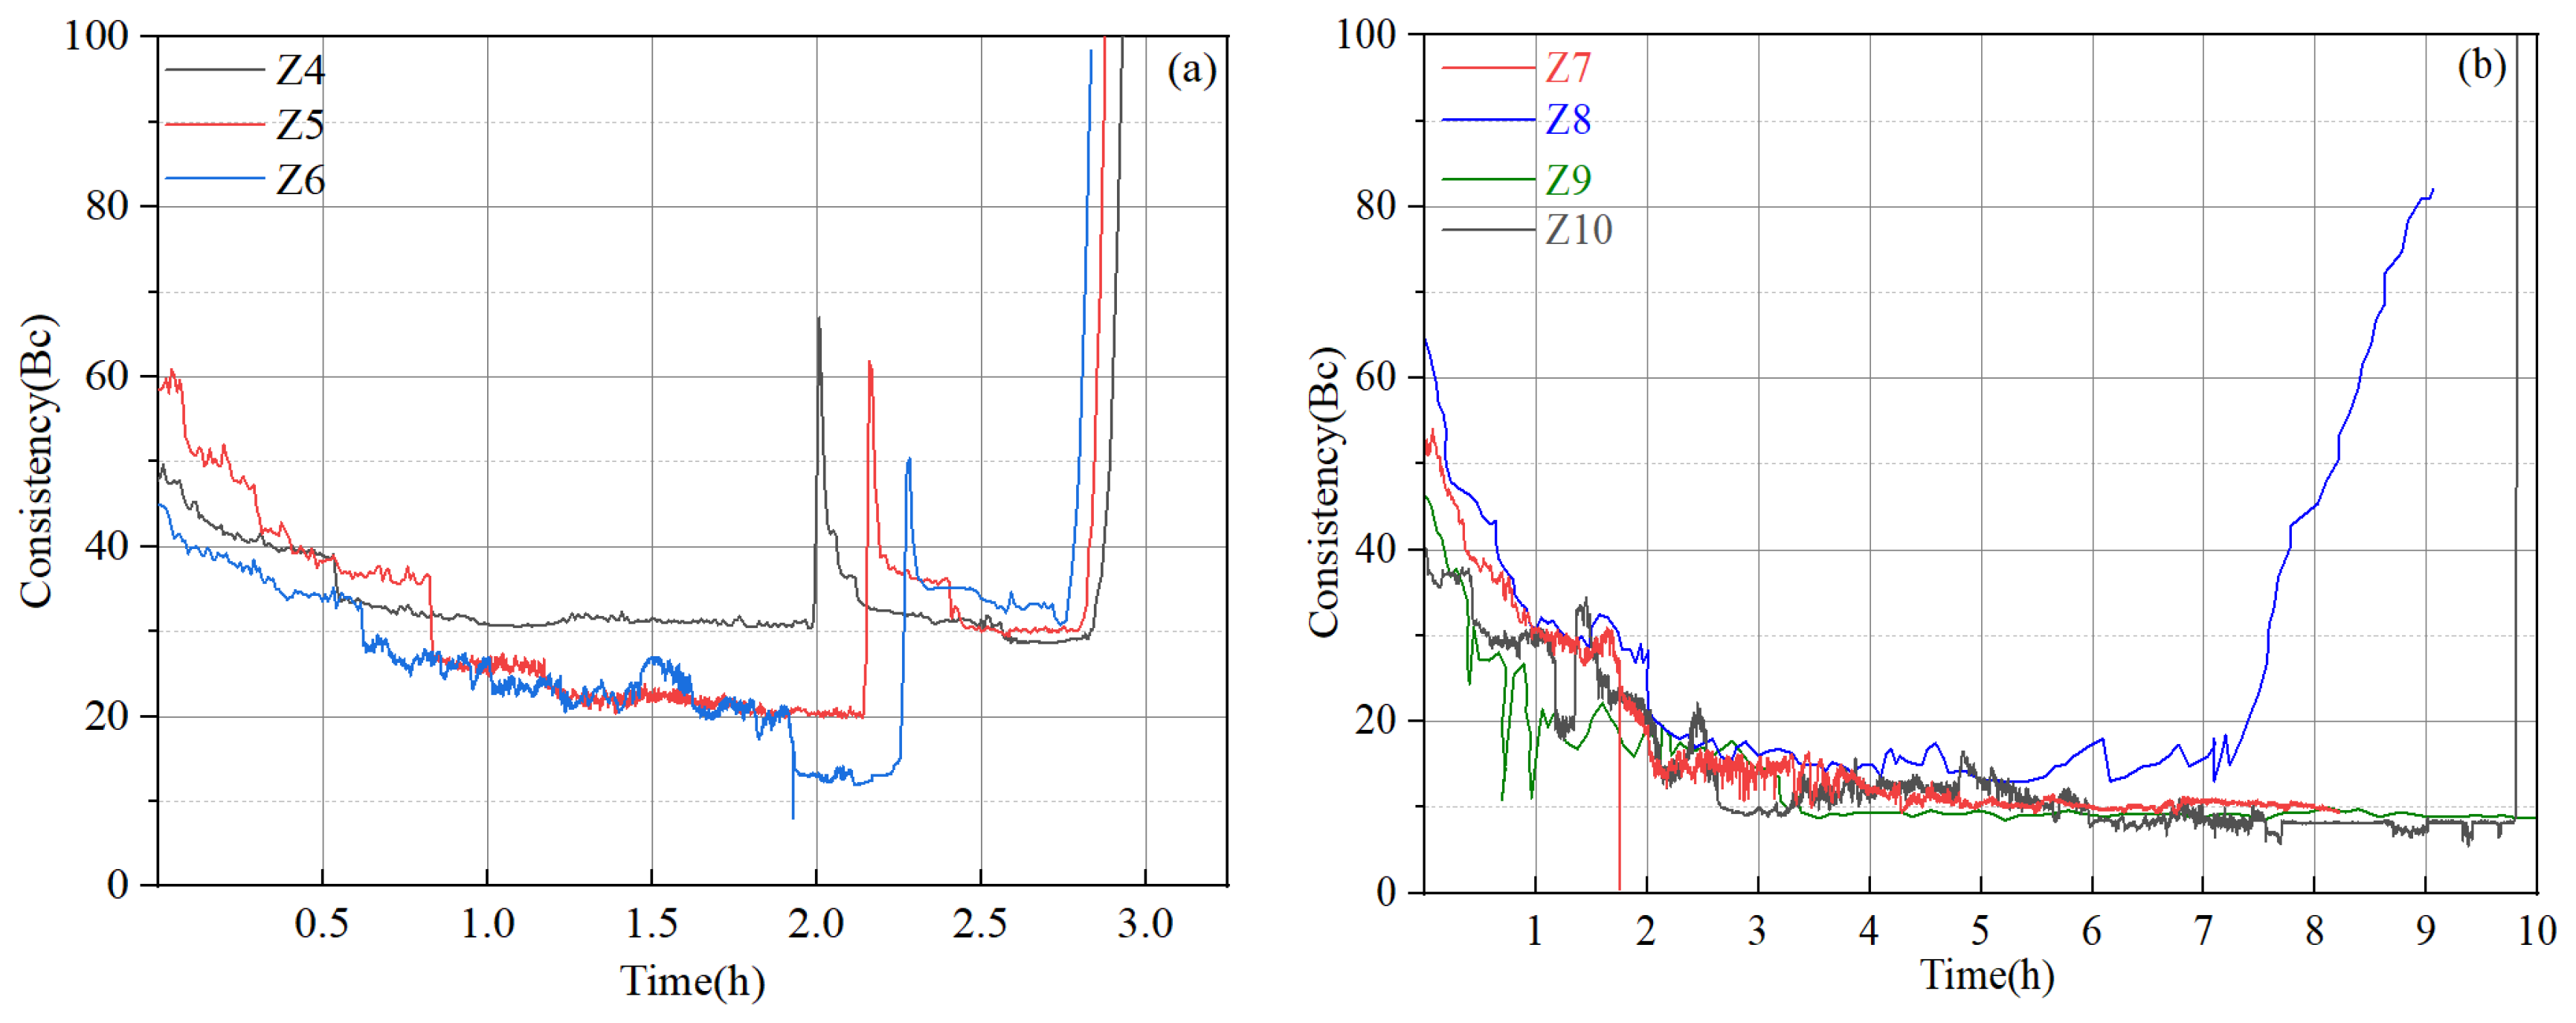
4.6. Abnormal Gelation of Cement Slurries
5. Evaluation of Finally Optimized Cementing Systems
5.1. Formulation Optimization and Cement Slurry Properties of Final Designs
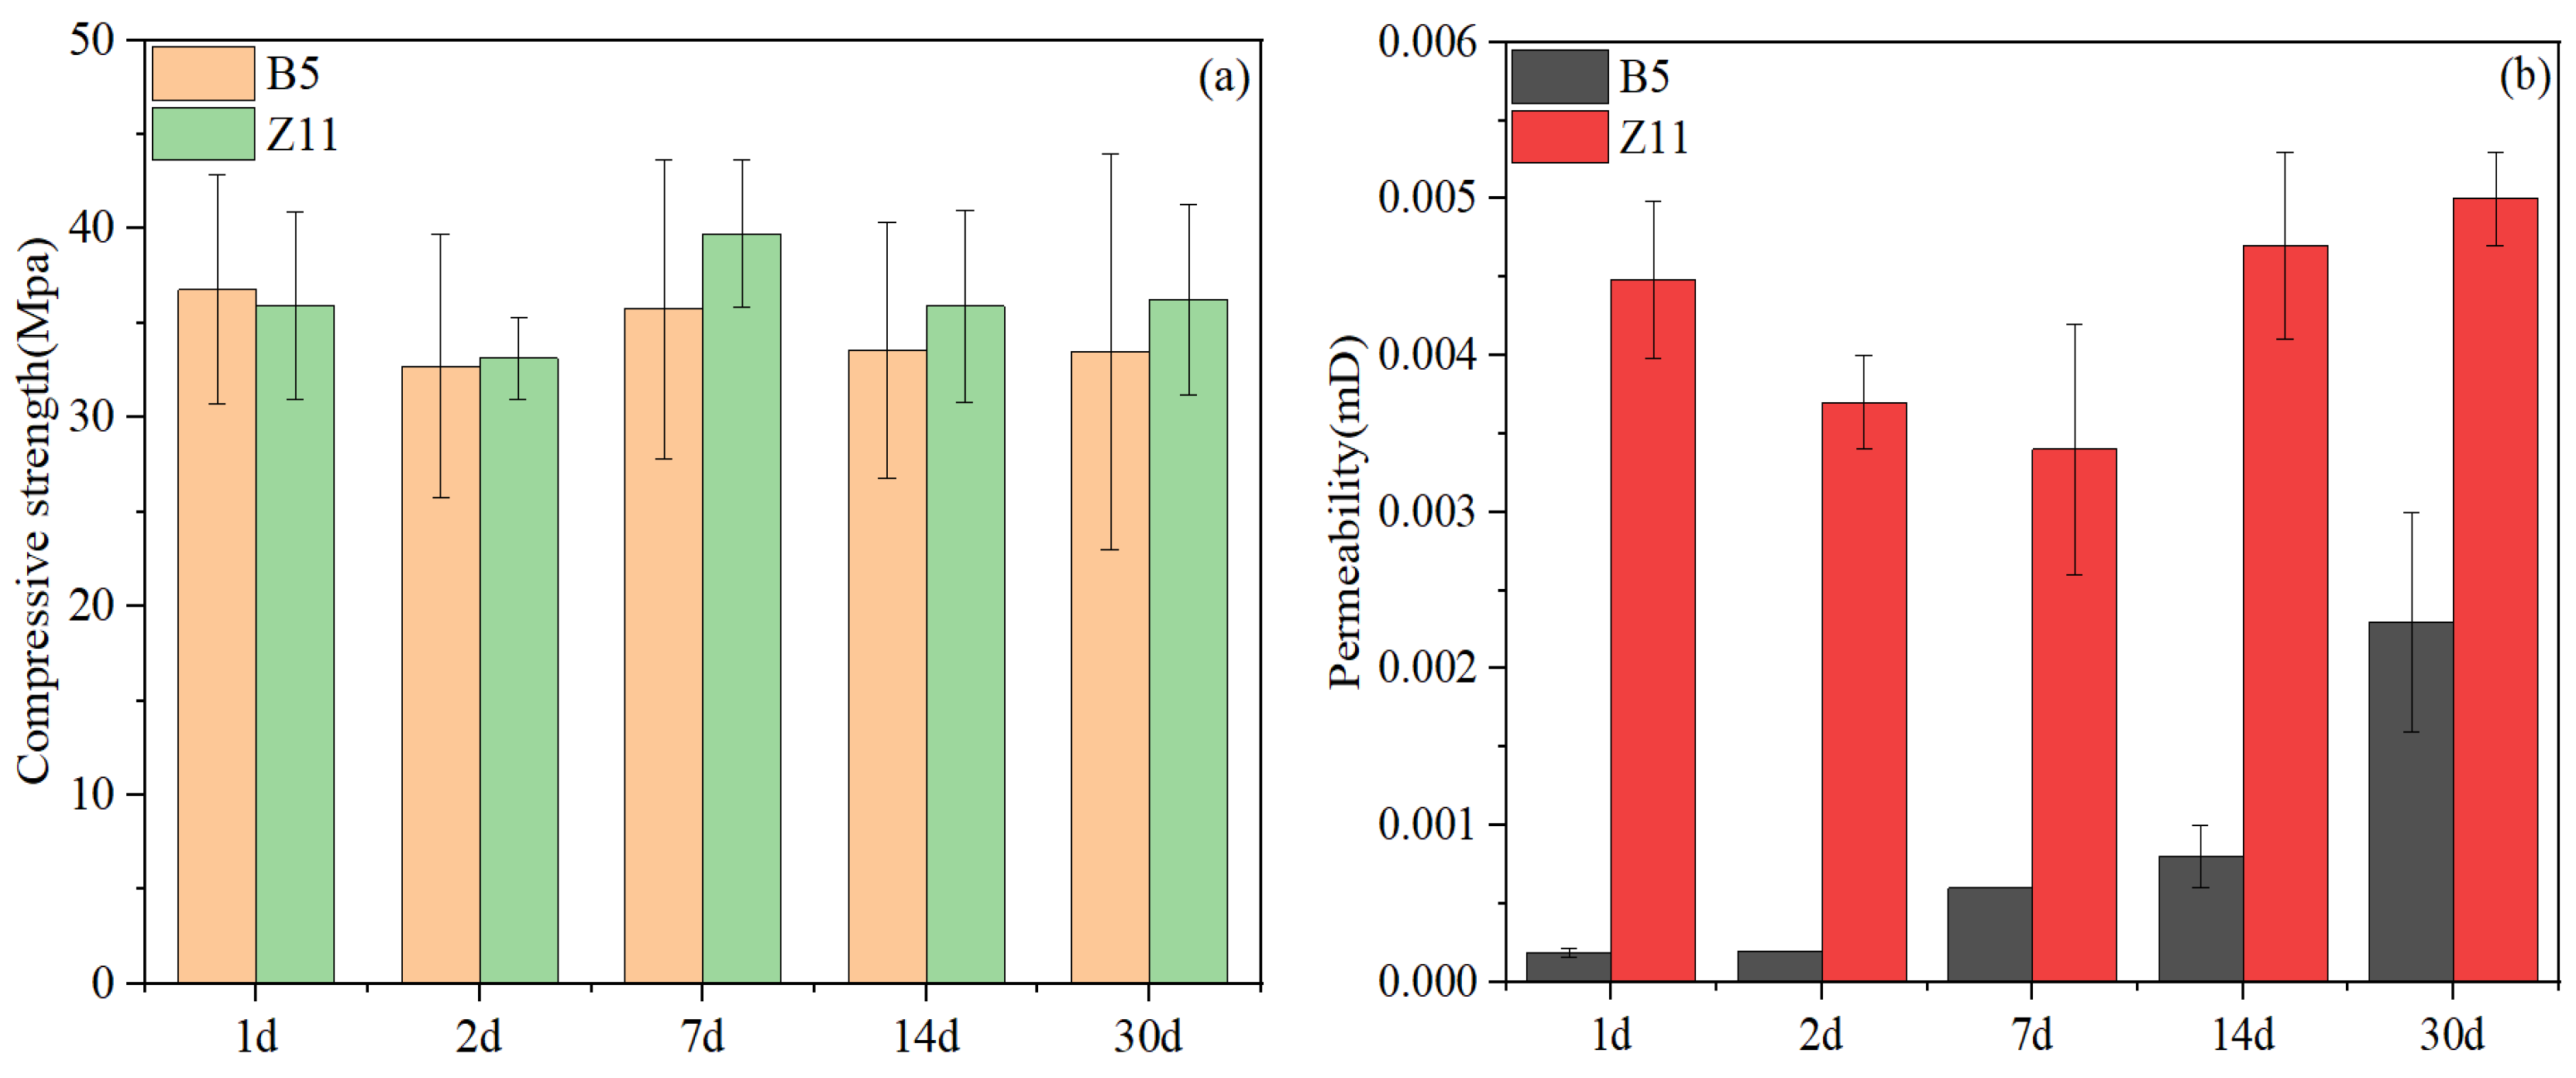
5.2. Set Cement Physical and Mechanical Property Test Results of Final Designs
5.3. Set Cement Microstructure and Composition Analysis of Final Designs
6. Conclusions
Author Contributions
Funding
Institutional Review Board Statement
Informed Consent Statement
Data Availability Statement
Conflicts of Interest
References
- Wang, H.; Huang, H.; Bi, W.; Ji, G.; Zhou, B.; Zhuo, L. Deep and ultra-deep oil and gas well drilling technologies: Progress and prospect. Nat. Gas Ind. B 2022, 9, 141–157. [Google Scholar] [CrossRef]
- Lei, Q.; Xu, Y.; Yang, Z.; Cai, B.; Wang, X.; Zhou, L.; Liu, H.; Xu, M.; Wang, L.; Li, S. Progress and development directions of stimulation techniques for ultra-deep oil and gas reservoirs. Pet. Explor. Dev. 2021, 48, 221–231. [Google Scholar] [CrossRef]
- Yu, J.; Zheng, M.; Li, J.; Wu, X.; Guo, Q. Resource potential, exploration prospects, and favorable direction for natural gas in deep formations in China. J. Nat. Gas Geosci. 2018, 3, 311–320. [Google Scholar] [CrossRef]
- Wang, H.; Huang, H.; Bi, W.; Ji, G.; Zhou, B.; Zhou, L. PetroChina Deep, Ultra-deep and Horizontal Well Drilling and Completion Technology Progress and Challenges. China Pet. Explor. 2023, 28, 1–11. [Google Scholar]
- Zhao, J.; Yong, R.; Hu, D.; Yu, Z.; Fu, Y.; Wu, J.; Jiang, T.; Zhou, B.; Lin, R. Deep and ultra-deep shale gas fracturing in China: Problems, challenges and directions. Acta Pet. Sin. 2024, 45, 295. [Google Scholar]
- Guo, X.; Hu, D.; Li, Y.; Duan, J.; Zhang, X.; Fan, X.; Duan, H.; Li, W. Theoretical progress and key technologies of onshore ultra-deep oil/gas exploration. Eng. Chem. Res. 2019, 5, 458–470. [Google Scholar] [CrossRef]
- Chen, D.; Jiao, Y.; Yang, F.; Liu, C.; Yang, M.; Artieda, J.L.; Yu, W. Effect of Cross-Well Natural Fractures and Fracture Network on Production History Match and Well Location Optimization in an Ultra-Deep Gas Reservoir. Processes 2024, 12, 1085. [Google Scholar] [CrossRef]
- Szymczak, P.D. CNPC. Sinopec Drill Ultra Deep in Search of Energy Security. J. Pet. Technol. 2023, 75, 20–25. [Google Scholar] [CrossRef]
- Song, X.; Li, G.; Huang, Z.; Shi, Y.; Wang, G.; Song, G.; Xu, F. Review of high-temperature geothermal drilling and exploitation technologies. Gondwana Res. 2023, 122, 315–330. [Google Scholar] [CrossRef]
- Wang, C.; Feng, S.; Zhang, Z.; Zhou, B.; Lv, X.; Zhou, B. Key technologies of drilling design of Well Tac 1 in deep ground. Pet. Drill. Tech. 2024, 52, 78–86. [Google Scholar]
- Davoodi, S.; Al-Shargabi, M.; Wood, D.A.; Rukavishnikov, V.S. Recent advances in polymers as additives for wellbore cementing applications: A review. Fuel 2024, 357, 129692. [Google Scholar] [CrossRef]
- Pang, X.; Qin, J.; Sun, L.; Zhang, G.; Wang, H. Long-term strength retrogression of silica-enriched oil well cement: A comprehensive multi-approach analysis. Cem. Concr. Res. 2021, 144, 106424. [Google Scholar] [CrossRef]
- Qin, J.; Pang, X.; Cheng, G.; Bu, Y.; Liu, H. Influences of different admixtures on the properties of oil well cement systems at HPHT conditions. Cem. Concr. Compos. 2021, 123, 104202. [Google Scholar] [CrossRef]
- Qin, J.; Pang, X.; Li, H.; Zhang, Z. Mechanism of long-term strength retrogression of silica-enriched Portland cement assessed by quantitative X-ray diffraction analysis. Front. Mater. 2022, 9, 982192. [Google Scholar]
- Liu, H.; Qin, J.; Zhou, B.; Liu, Z.; Yuan, Z.; Zhang, Z.; Ai, Z.; Pang, X.; Liu, X. Effects of curing pressure on the long-term strength retrogression of oil well cement cured under 200 °C. Energies 2022, 15, 6071. [Google Scholar] [CrossRef]
- Cheng, G.D.; Pang, X.Y.; Sun, J.S.; Qiu, Z.S.; Wang, C.C.; Qin, J.K.; Li, N. Combined use of fly ash and silica to prevent the long-term strength retrogression of oil well cement set and cured at HPHT conditions. Pet. Sci. 2023, 21, 1122–1134. [Google Scholar] [CrossRef]
- Qin, J.; Pang, X.; Santra, A.; Cheng, G.; Li, H. Various admixtures to mitigate the long-term strength retrogression of Portland cement cured under high pressure and high temperature conditions. J. Rock Mech. Geotech. Eng. 2023, 15, 191–203. [Google Scholar] [CrossRef]
- Pang, X.; Qin, J.; Wang, Z.; Ye, S.; Zhao, Z. Formula of cementing slurry system for ultra-high temperature conditions of deep wells and its strength retrogression mechanism. Nat. Gas Ind. 2023, 43, 90–100. [Google Scholar]
- Cheng, G.; Pang, X.; Wang, H.; Sun, J.; Qiu, Z. Anti-strength retrogression cementing materials for deep and ultra-deep wells. Constr. Build. Mater. 2024, 411, 134407. [Google Scholar] [CrossRef]
- Guo, Z.; Liu, Z.; Liao, K.; Yang, X. Research status of synthetic oil well cement retarder. Recent Pat. Eng. 2021, 15, 53–59. [Google Scholar]
- Broni-Bediako, E.; Joel, O.F.; Ofori-Sarpong, G. Oil well cement additives: A review of the common types. Oil Gas Res. 2016, 2, 1–7. [Google Scholar] [CrossRef]
- Tiemeyer, C.; Plank, J. Working mechanism of a high temperature (200 °C) synthetic cement retarder and its interaction with an AMPS®-based fluid loss polymer in oil well cement. J. Appl. Polym. Sci. 2012, 124, 4772–4781. [Google Scholar] [CrossRef]
- Xin, T.; Xuzeng, H.; Haodong, W. Preparation and characterization of a novel amphoteric polymer for oil well cementing with superior performances. Polym. Polym. Compos. 2021, 29, 29–39. [Google Scholar] [CrossRef]
- Davoodi, S.; Al-Shargabi, M.; Wood, D.A.; Rukavishnikov, V.S.; Minaev, K.M. Thermally stable and salt-resistant synthetic polymers as drilling fluid additives for deployment in harsh sub-surface conditions: A review. J. Mol. Liq. 2023, 371, 121117. [Google Scholar] [CrossRef]
- Wang, W.; Wan, X.; Tang, K. Synthesis of a copolymerization and the anti-high temperature property in oil well cement slurry fluid. In Proceedings of the MATEC Web of Conferences, Tianjin, China, 23–24 April 2022; EDP Sciences: Les Ulis, France, 2022. [Google Scholar]
- Chen, X.; Wang, C.; Wang, Y.; Wang, H.; Wang, R. Prevention strategy of cement slurry sedimentation under high temperature. Part 1: A polymer with continuous thermo-thickening behavior from 48 to 148 C. J. Phys. Chem. C 2019, 123, 18573–18584. [Google Scholar] [CrossRef]
- Zhang, C.; Jin, J.; Xu, W.; Yang, J.; Li, M. Synthesis and characterization of SSS/MA/NVCL copolymer as high temperature oil well cement retarder. J. Dispers. Sci. Technol. 2022, 43, 1405–1415. [Google Scholar] [CrossRef]
- Tiemeyer, C.; Plank, J. Synthesis, characterization, and working mechanism of a synthetic high temperature (200 °C) fluid loss polymer for oil well cementing containing allyloxy-2-hydroxy propane sulfonic (AHPS) acid monomer. J. Appl. Polym. Sci. 2013, 128, 851–860. [Google Scholar] [CrossRef]
- Chang, Q.; Liu, G.; Dong, Z.; Miao, X.; Hu, M.; Guo, J. Effect of poly (AMPS/DMAA/IA/SSS) intercalated Mg/Al layered double hydroxides on reducing fluid loss at 240 °C and improving early strength of oil well cement. Appl. Clay Sci. 2022, 229, 106658. [Google Scholar] [CrossRef]
- Salami, O.T.; Plank, J. Preparation and properties of a dispersing fluid loss additive based on humic acid graft copolymer suitable for cementing high temperature (200 °C) oil wells. J. Appl. Polym. Sci. 2013, 129, 2544–2553. [Google Scholar] [CrossRef]
- Plank, J.; Tiemeyer, C.; Bülichen, D.; Lummer, N.R. A review of synergistic and antagonistic effects between oilwell cement additives. In Proceedings of the SPE International Conference on Oilfield Chemistry, The Woodlands, TX, USA, 8–10 April 2013. [Google Scholar]
- Cao, L.; Guo, J.; Tian, J.; Hu, M.; Guo, C.; Xu, Y.; Wang, M.; Fan, J. The ability of sodium metasilicate pentahydrate to adjust the compatibility between synthetic Fluid Loss Additives and Retarders applying in oil well cement. Constr. Build. Mater. 2018, 158, 835–846. [Google Scholar] [CrossRef]
- Jiang, B.; Li, M.; Zhang, W.; Yang, Y.; Yang, M. Synthesis and properties of AMPS/MA/HEMA terpolymer retarder for oil well cement. J. Dispers. Sci. Technol. 2024, 1–8. [Google Scholar] [CrossRef]
- Peng, Z.; Li, C.; Feng, Q.; Zheng, Y. Research on surface modification of polypropylene fiber and its application evaluation in oil well cement. Constr. Build. Mater. 2024, 421, 135728. [Google Scholar] [CrossRef]
- Feng, Q.; Li, L.; Peng, Z.; Zheng, Y. Study on synthesis of temperature-resistant polycarboxylic acid dispersant and its application in oil well cement. J. Sol-Gel Sci. Technol. 2024, 109, 878–895. [Google Scholar] [CrossRef]
- GB/T176-2017; Methods for Chemical Analysis of Cement. Quality Supervision Inspection and Quarantine of the People’s Republic of China and Standardization Administration of the People’s Republic China: Beijing, China, 2017.
- API 10B-2; Recommended Practice for Testing Well Cements, Second Edition. American Petroleum Institute: Washington, DC, USA, 2013.
- GB/T 19139-2012; Test Method for Oil Well Cement. General Administration of Quality Supervision IAQO. Standards Press: Beijing, China, 2012.
- Sun, L.; Pang, X.; Ghabezloo, S.; Wang, H.; Sun, J. Hydration kinetics and strength retrogression mechanism of silica-cement systems in the temperature range of 110 °C–200 °C. Cem. Concr. Res. 2023, 167, 107120. [Google Scholar] [CrossRef]
- Frías, M.; Martínez-Ramírez, S.; de la Villa, R.V.; García-Giménez, R.; de Rojas, M.S. New scientific evidence of the effect of high temperatures and long curing times on MK-blended cement paste mineralogy. Cem. Concr. Res. 2021, 152, 106657. [Google Scholar] [CrossRef]


| Additive | Supplier O | Supplier G | Supplier B | Supplier Z |
|---|---|---|---|---|
| Anti-strength retrogression material | O-ASR | G-ASR | B-ASR1, B-ASR2, B-ASR3 | Z-ASR1, Z-ASR2 |
| Retarder | O-RT | G-RT1, G-RT2, G-RT3 | B-RT | Z-RT1, Z-RT2 |
| Suspension aid | O-SA | G-SA | B-SA | Z-SA1, Z-SA2, Z-SA3 |
| Fluid loss additive | O-FL | G-FL | B-FL | Z-FL |
| Friction reducer | O-FR1, O-FR2 | B-FR | Z-FR1, Z-FR2 | |
| Reinforcing agent | B-RFA | Z-RFA1, Z-RFA2 | ||
| O-DFM | B-DFM | Z-DFM | ||
| Elastomer | Z-ELS |
| Oxide Name | G-ASR | B-ASR3 | Z-ASR2 | B-ASR1 | B-ASR2 | Cement |
|---|---|---|---|---|---|---|
| CaO | 2.87 | 9.58 | 15.45 | 1.45 | 0.019 | 65.69 |
| SiO2 | 89.29 | 60.98 | 46.89 | 95.41 | 96.32 | 19.18 |
| Fe2O3 | 0.66 | 6.53 | 0.26 | 0.87 | 0.06 | 5.69 |
| SO3 | 0.24 | 0.41 | 0.21 | 0.21 | 0.08 | 3.35 |
| Al2O3 | 3.03 | 14.52 | 18.75 | 1.03 | 1.31 | 2.96 |
| MgO | 0.95 | 1.19 | 0.59 | - | 0.06 | 1.75 |
| K2O | 1.91 | 1.89 | 0.05 | 0.06 | 0.15 | 0.65 |
| Na2O | 0.30 | 1.08 | 9.27 | 0.19 | 0.94 | 0.19 |
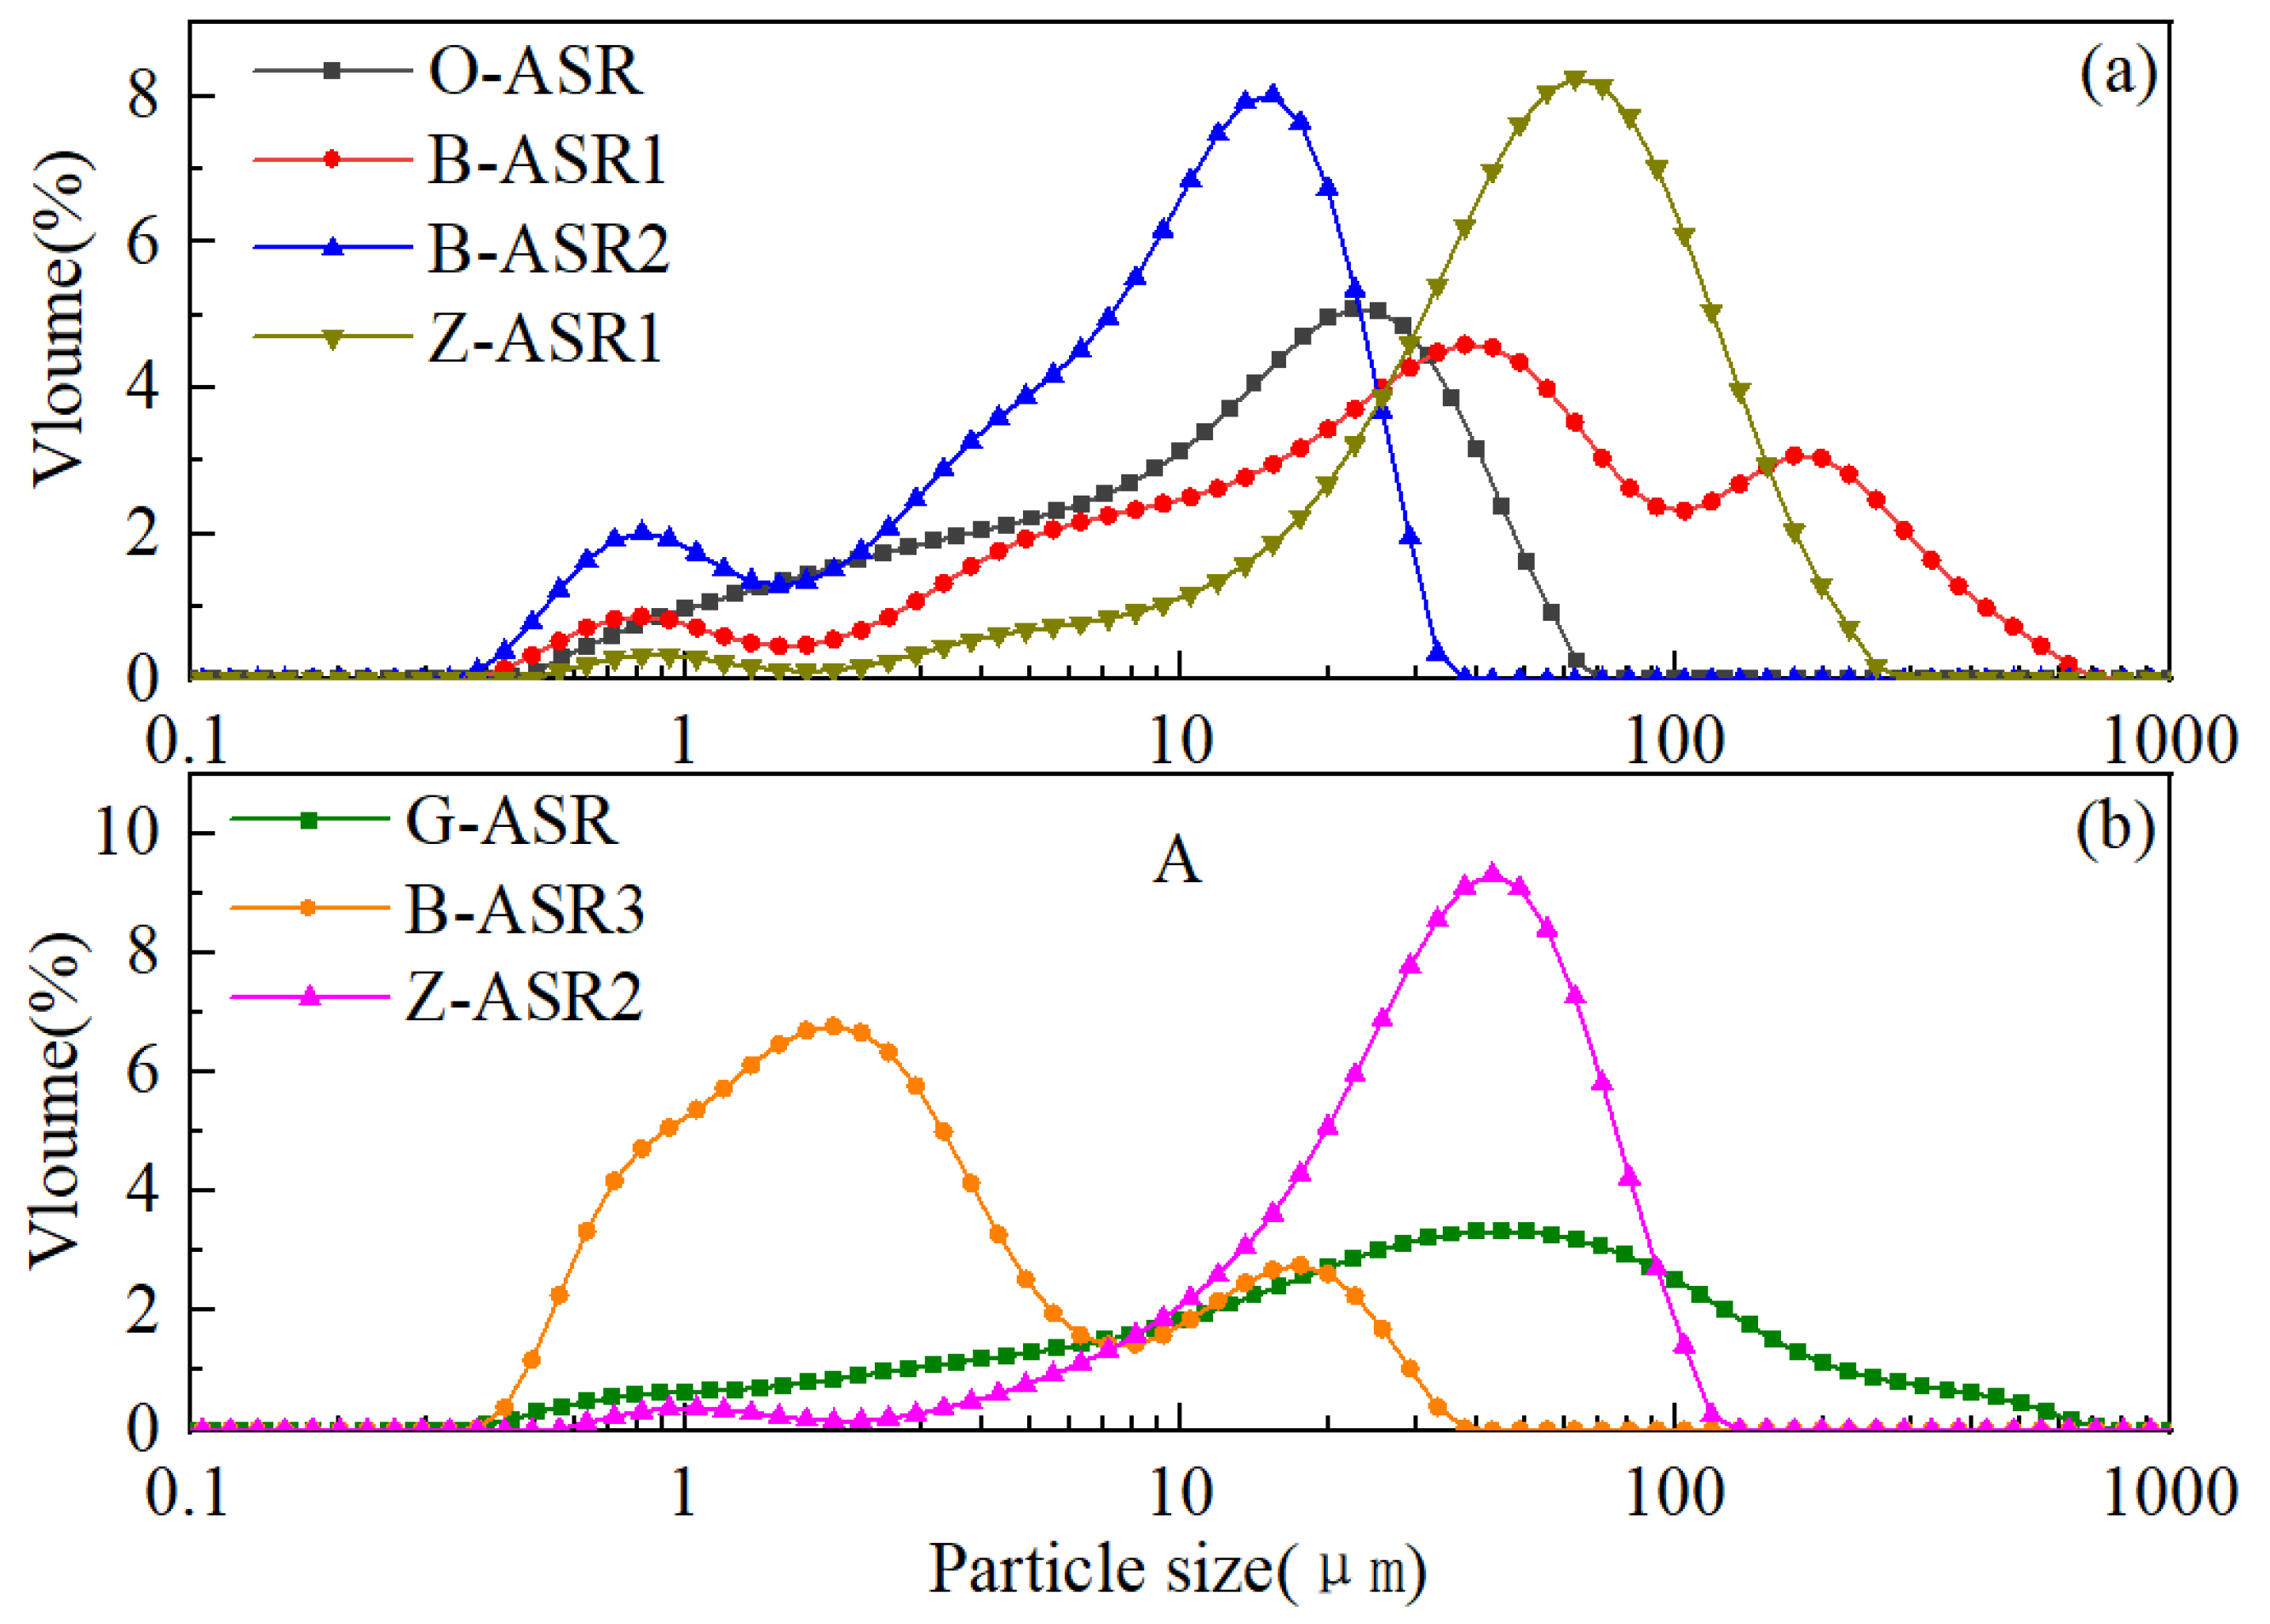
| Parameter | Cement | O- ASR | G- ASR | B- ASR1 | B- ASR2 | B- ASR3 | Z- ZSR1 | Z- ASR2 |
|---|---|---|---|---|---|---|---|---|
| D(10) μm | 1.04 | 1.74 | 2.47 | 3.72 | 1.15 | 0.782 | 12.5 | 9.66 |
| D(50) μm | 15.39 | 12.49 | 28.65 | 33.6 | 2.20 | 2.20 | 53.1 | 34.10 |
| D(90) μm | 48.05 | 33.73 | 143.05 | 217 | 15.5 | 15.50 | 124 | 70.40 |
| Additive | Temp. (1) (°C) | Additive | Temp. (1) (°C) | Additive | Temp. (1) (°C) | Additive | Temp. (1) (°C) |
|---|---|---|---|---|---|---|---|
| O-RT | 80/330 | G-RT1 | 231 | B-RT | 215 | Z-RT | 338 |
| O-SA | 114/240/464 | G-RT2 | 286 | B-SA | 89/331 | Z-SA | 84/290 |
| O-FL | 283 | G-RT3 | 407 | B-FL | 221 | Z-FL | 352 |
| O-FR1 | 95/360 | G-SA | 94/288 | B-FR | 98/386 | Z-FR | 167/358 |
| O-FR2 | 400 | G-FL | 336 | Z-RFA | 450 | ||
| G-FR | 116/354 |
| Comp. (1) | O1 | O2 | Comp. (1) | G1 | G2 | Comp. (1) | B1 | B2 | Comp. (1) | Z1 |
|---|---|---|---|---|---|---|---|---|---|---|
| Cement | 100 | 100 | Cement | 100 | 100 | Cement | 100 | 100 | Cement | 100 |
| O-ASR | 60 | 60 | G-ASR | 40 | 40 | G-ASR | 40 | 40 | G-ASR | 40 |
| O-RT | 3.8 | 1.84 | G-RT1 | 7 | 4.7 | B-RT | 6 | 4.5 | Z-RT | 5 |
| O-SA | 0.8 | 0.8 | G-SA | 0.7 | 0.7 | B-SA | 4 | 4 | Z-SA | 1.8 |
| O-FL | 6.5 | 6.5 | G-FL | 4.2 | 4.2 | B-FL | 6 | 6 | Z-FL | 5 |
| O-FR1 | 1 | 1 | G-RT2 | 5.6 | 3.7 | B-FR | 5.5 | 5.5 | Z-FR | 1 |
| O-FR2 | 2 | 2 | G-RT3 | 1.4 | 0.9 | - | - | - | Z-RFA | 3 |
| O-AGM | 0.5 | 0.5 | - | - | - | - | - | - | - | - |
| O-DFM | 0.1 | 0.1 | Z-DFM | 0.5 | 0.5 | Z-DFM | 0.5 | 0.5 | Z-DFM | 0.5 |
| Water | 53.47 | 53.47 | Water | 44.5 | 49 | Water | 43 | 44 | Water | 50.4 |
| TT (2) | >750 (3) | 335 | >539 (3) | 278 | >493 (3) | 215 | 219 |
| Comp. (1) | O3 | Comp. (1) | G3 | G4 | G5 | Comp. (1) | B3 | B4 | Comp. (1) | Z2 | Z3 |
|---|---|---|---|---|---|---|---|---|---|---|---|
| Cement | 100 | Cement | 100 | 100 | 100 | Cement | 100 | 100 | Cement | 100 | 100 |
| O-ASR | 60 | G-ASR | 40 | 60 | 0 | G-ASR | 40 | 0 | G-ASR | 40 | 0 |
| O-RT | 1.8 | O-ASR | 0 | 0 | 60 | O-ASR | 0 | 60 | O-ASR | 0 | 60 |
| O-SA | 3 | G-RT1 | 4.7 | 7.5 | 5 | B-RT | 6 | 4.5 | Z-RT1 | 5 | 6 |
| O-FL | 6.5 | G-RT2 | 3.7 | 6 | 4 | B-SA | 4 | 3 | Z-SA1 | 2 | 2 |
| O-FR1 | 1 | G-RT3 | 0.9 | 1.5 | 1 | B-FL | 6 | 6 | Z-FL | 5 | 5 |
| O-FR2 | 2 | G-SA | 3 | 1.5 | 1.5 | B-FR | 5.5 | 5.5 | Z-FR1 | 1 | 1 |
| O-AGM | 0.5 | G-FL | 4.2 | 5 | 5 | - | - | Z-RFA1 | 3 | 3 | |
| O-DFM | 0.1 | Z-DFM | 0.5 | 1 | 1 | Z-DFM | 0.5 | 1 | Z-DFM | 0.5 | 1 |
| Water | 53.5 | Water | 44.5 | 43.5 | 49.8 | Water | 44 | 51.2 | Water | 49.4 | 57.3 |
| Slurry Composition | Slurry No. | ||||||
|---|---|---|---|---|---|---|---|
| Z4 | Z5 | Z6 | Z7 | Z8 | Z9 | Z10 | |
| Cement | 100 | 100 | 100 | 100 | 100 | 100 | 100 |
| O-ASR | 60 | 60 | 60 | 60 | 60 | 60 | 60 |
| Z-RT | 4.5 | 4.5 | 4 | 6 | 5 | 4.7 | 4.5 |
| Z-SA | 2 | 2 | 2 | 2 | 2 | 2 | 2 |
| Z-FL | 12 | 12 | 10 | 12 | 12 | 10 | 10 |
| Z-FR | 1 | 1.5 | 2 | 1 | 1.5 | 2 | 2 |
| Z-RFA | 5 | 5 | 3 | 5 | 5 | 3 | 3 |
| Z-DFM | 1 | 1 | 1 | 1 | 1 | 1 | 1 |
| Water | 52.95 | 52.6 | 53.8 | 51.9 | 51.95 | 53.3 | 53.4 |
| TT (1) | 175 | 172 | 170 | >495 (2) | 546 | >570 (2) | 588 |
| Composition | Z11 | Composition | B5 |
|---|---|---|---|
| Cement | 100 | Cement | 100 |
| Z-ASR1 (silica) | 40 | B-ASR1 (silica) | 30 |
| Z-ASR2 | 35 | B-ASR2 (silica) | 30 |
| Z-RT2 | 4 | B-ASR3 | 17.5 |
| Z-SA2 (L58) | 3 | B-RT | 4.1 |
| Z-SA3 (DRK-4L) | 4 | B-SA | 2.3 |
| Z-FL | 4.5 | B-FL | 6 |
| Z-FR1 | 2.4 | B-FR | 5 |
| Z-FR2 | 0.8 | B-RFA | 1.13 |
| Z-RFA1 | 4 | B-DFM | 0.1 |
| (XWY)Z-RFA2 | 2 | Water | 59.3 |
| Z-ELS | 2 | ||
| Z-DFM | 1 | ||
| Water | 65 |
Disclaimer/Publisher’s Note: The statements, opinions and data contained in all publications are solely those of the individual author(s) and contributor(s) and not of MDPI and/or the editor(s). MDPI and/or the editor(s) disclaim responsibility for any injury to people or property resulting from any ideas, methods, instructions or products referred to in the content. |
© 2024 by the authors. Licensee MDPI, Basel, Switzerland. This article is an open access article distributed under the terms and conditions of the Creative Commons Attribution (CC BY) license (https://creativecommons.org/licenses/by/4.0/).
Share and Cite
Zhang, Z.; Ai, Z.; Yang, L.; Zhang, Y.; Pang, X.; Yuan, Z.; Liu, Z.; Sun, J. Evaluation and Optimization of Cement Slurry Systems for Ultra-Deep Well Cementing at 220 °C. Materials 2024, 17, 5246. https://doi.org/10.3390/ma17215246
Zhang Z, Ai Z, Yang L, Zhang Y, Pang X, Yuan Z, Liu Z, Sun J. Evaluation and Optimization of Cement Slurry Systems for Ultra-Deep Well Cementing at 220 °C. Materials. 2024; 17(21):5246. https://doi.org/10.3390/ma17215246
Chicago/Turabian StyleZhang, Zhi, Zhengqing Ai, Lvchao Yang, Yuan Zhang, Xueyu Pang, Zhongtao Yuan, Zhongfei Liu, and Jinsheng Sun. 2024. "Evaluation and Optimization of Cement Slurry Systems for Ultra-Deep Well Cementing at 220 °C" Materials 17, no. 21: 5246. https://doi.org/10.3390/ma17215246
APA StyleZhang, Z., Ai, Z., Yang, L., Zhang, Y., Pang, X., Yuan, Z., Liu, Z., & Sun, J. (2024). Evaluation and Optimization of Cement Slurry Systems for Ultra-Deep Well Cementing at 220 °C. Materials, 17(21), 5246. https://doi.org/10.3390/ma17215246