Article

Morphology and Mechanics of Star Copolymer Ultrathin Films Probed by Atomic Force Microscopy in the Air and in Liquid

by
Cristiano Albonetti
1,2,*,
Lorella Izzo
3,4,
Giovanni Vigliotta
4,
Matilde Sublimi Saponetti
5,
Fabiola Liscio
6 and
Fabrizio Bobba
2,5
1
Consiglio Nazionale delle Ricerche, Istituto Per lo Studio dei Materiali Nanostrutturati (CNR-ISMN), Via P. Gobetti 101, 40129 Bologna, Italy
2
Consiglio Nazionale delle Ricerche, Istituto Superconduttori, Materiali Innovativi e Dispositivi (CNR-SPIN), Via Giovanni Paolo II, 132, 84084 Fisciano, SA, Italy
3
Dipartimento di Biotecnologie e Scienze della Vita, Università degli Studi Dell’insubria, Via J.H. Dunant, 3, 21100 Varese, Italy
4
Dipartimento di Chimica e Biologia “A. Zambelli”, Università degli Studi di Salerno, Via Giovanni Paolo II, 132, 84084 Fisciano, SA, Italy
5
Dipartimento di Fisica “E.R. Caianiello”, Università degli Studi di Salerno, Via Giovanni Paolo II, 132, 84084 Fisciano, SA, Italy
6
Consiglio Nazionale delle Ricerche, Istituto per la Microelettronica e i Microsistemi (CNR-IMM), Via P. Gobetti 101, 40129 Bologna, Italy
*
Author to whom correspondence should be addressed.
Materials 2024, 17(3), 592; https://doi.org/10.3390/ma17030592
Submission received: 19 December 2023 / Revised: 22 January 2024 / Accepted: 23 January 2024 / Published: 25 January 2024
(This article belongs to the Special Issue Polymer Materials: Research, Development and Application)

Abstract

:
Star copolymer films were produced by using spin-coating, drop-casting, and casting deposition techniques, thus obtaining ultrathin and thick films, respectively. The morphology is generally flat, but it becomes substrate-dependent for ultrathin films where the planarization effect of films is not efficient. The indentation hardness of films was investigated by Force Volume Maps in both the air and liquid. In the air, ultrathin films are in the substrate-dominated zone and, thus, the elastic modulus E is overestimated, while E reaches its bulk value for drop-casted ultrathin and thick films. In liquid (water), E follows an exponential decay for all films with a minimum soaked time t0 of 0.37 and 2.65 h for ultrathin and drop-casted ultrathin and thick films, respectively. After this time, E saturates to a value on average 92% smaller than that measured in the air due to film swelling. Such results support the role of film morphology in the antimicrobial activity envisaged in the literature, suggesting also an additional role of film hardness.

1. Introduction

Branched, star-like copolymers have the ability to form films with physical properties modulated by their topology [1,2,3], albeit those films are usually amorphous or semi-crystalline due to the low degree of crystallinity of star copolymers [2,4]. Among their possible applications, biomedical uses are intensely investigated to date [5]. For instance, the antimicrobial activity of films was recently increased by synthesizing protonable, novel star copolymers [6,7], surpassing the drop in the capacity to kill bacteria over time obtained with other antimicrobial strategies [8,9]. In this case, star-like structures, compared to the linear one, showed higher antimicrobial activity and the best results were obtained with a two-branch copolymer, namely m-PEG-P(MMA-ran-DMAEMA)2, insoluble in water and containing ≈40% in mol of non-quaternized 2-(dimethylamino)ethyl methacrylate (DMAEMA), from which films were prepared. Such efficient antimicrobial activity was mainly attributed to enhanced protonation of DMAEMA pendants sustained by the dimerization of vicinal ammonium/amino groups [6,7,10,11,12]. In fact, due to the somewhat limited conformational freedom in the linear structure, mainly DMAEMA groups that are first, or second neighbors, can form the dimers (−N(CH3)2−H+---N(CH3)2−), while in a star-like structure, the formation of dimers can occur both intra- and inter-chain; the latter within the same macromolecules due to the vicinity of the branches in the region close to the junction (see the molecular structure in Supplementary Materials). Experimentally, star-like structures showed a higher density of surface charges with respect to linear ones, as indirectly confirmed by the measurement of the interaction between polymeric films and benzoate, being the charge density responsible for antimicrobial efficiency [6].
The authors also suggest a possible morphological explanation for the increased charge density, ascribable to the presence of a cavity or channel due to the star-like structure that, allowing the infiltration of water, favored the protonation of the DMAEMA amino pendant groups. The latter idea was supported by the water uptake data and by the glass transition temperature (Tg) values measured after sorption of water, indicating a less compactness of the two-branch structure [6]. Since most of the inherently antimicrobial polymers are cationic and contact-killing, and they do not induce serious microbial drug resistance as they produce physical damage to bacterial cells [12,13], morphological changes induced might be of importance for the rational design of novel antimicrobial, non-inducing resistance materials.
In this scenario, film morphology is pivotal. This work aims to investigate the morphology of m-PEG-P(MMA-ran-DMAEMA)2 films in both the air and water, i.e., an environment similar to those used in antimicrobial tests. When immersed in water, polymer films experience swelling [14] and their morphological and mechanical properties change [15]. In accordance, the morphology is statistically investigated in plane and by one-dimensional analysis, while the mechanics are investigated in terms of indentation hardness, measuring the Young modulus and the viscoelastic behavior of films [16,17]. Since the equilibrium swelling is not influenced by film thickness [18], m-PEG-P(MMA-ran-DMAEMA)2 films are prepared ultrathin on substrates with a different morphology. The experimental results are always compared to thick films as prepared in Refs. [6,7].

2. Materials and Methods

2.1. Polymeric Materials

The star copolymer m-PEG-(MMA-ran-DMAEMA)n with n = 2 was synthesized at 70 °C in toluene [6]. A 50 mL glass flask was charged, under nitrogen atmosphere, with 0.1 g of m-PEG-Br2 macroinitiator and 15 mL of dry toluene. After the dissolution of the macroinitiator, 0.03 g of CuBr, 0.05 g of bpy, 5 mL of MMA, and 2.5 mL of DMAEMA were added. All chemicals used in synthesis process were purchased from Aldrich (St. Louis, MO, USA) and used without any further purification. The mixture, maintained at 70 °C, was magnetically stirred for 18 h and then the reaction was stopped with n-hexane. The copolymer was recovered, dissolved in the minimum amount of chloroform, and passed over a column of activated Al2O3 to remove the catalyst. The solution was dried in vacuum; the copolymer was recovered, washed with cold methanol, and then dried in vacuum. As measured by Gel Permeation Chromatography (Waters S.p.A., Milano, Italy), the copolymer molecular weight, Mn, and its polydispersity index, PDI, were 89 kDa and 1.4, respectively.
From now on, m-PEG-P(MMA-ran-DMAEMA)2 is briefly termed A(BC)2 where the block A, m-PEG, is bound to the two blocks BC composed of methylmethacrylate (MMA) and non-quaternized 2-(dimethylamino)ethyl methacrylate (DMAEMA).
The A(BC)2 powder was dissolved in chloroform (CHCl3) in order to obtain two solutions with concentrations c of 1 and 4 mg·mL−1 and polymer mass fraction wt.% of 0.067 and 0.268, respectively (see Supplementary Materials).

2.2. Silicon Substrates

Substrates were ≈1 × 1 cm2 chips prepared by cleaving manually a Si (111) wafer coated with native SiOx (p-type, ρ = 10 Ω·cm) [19]. Both sides of the Si wafer were mechanically polished (MP), obtaining optically specular surfaces. Finally, one side was finished by chemical mechanical polishing (CMP), obtaining an atomically flat defect-free surface [20]. Before their use, substrates were cleaned by acetone vapors to remove possible physical/chemical contaminants.

2.3. Preparation of Ultrathin Polymeric Films by Spin-Coating

Ultrathin polymeric films were prepared by spin-coating 300 µL of A(BC)2 solution (c = 1 mg·mL−1) on silicon substrates. The spin process consists of two steps: (i) The solution was deposited on the substrate by using a mechanical air-cushion pipette (100–1000 µL, Eppendorf Research, Stevenage, UK) placed near the substrate surface (≈2 cm). In order to obtain a homogeneous fluid film on the substrate surface, the solution was deposited after the acceleration stage of the spin-coater when the final rotational speed ω was reached (specifically, ω is 3000, 3200, 3500, 3750, and 4000 rpm) [21]. (ii) The fluid film was gradually thinned up to its final thickness hw by keeping the rotational speed ω for additional 10 s.
Spin-coated samples were closed within plastic Petri dishes and placed under a chemical hood for 20 h at room temperature to evaporate completely CHCl3 from the fluid film. Once dried, ultrathin films are solid, transparent, and insoluble (in water) [22].
The final solid thickness hf increases with c and decreases with ω, depending also on the adopted solvent [23]. Since c was assumed constant during the spin-coating process, hf can be evaluated by using Meyerhofer’s equation [24]:
h f = w t % · h w = w t % · 3 η 0 2 ρ · k 1 w t % 1 / 3 · ω 2 / 3 ,
where k is the mass transfer coefficient, i.e., the amount of polymer transferred from the solution to the substrate [25], η0 (in cgs, cP = 10−2 g·cm−1·s−1) is the solution viscosity, and ρ (in g·cm−3) is its density.
The high rotational speeds adopted herein (ω ≥ 3000 rpm) should produce ultrathin films with hf almost independent of ω [26]. To confirm this, additional physical parameters characterizing the A(BC)2 solution are necessary to calculate hf from Equation (1) (see Table 1). Since η0 and ρ are unknown for A(BC)2, they are assumed equal to those obtained for the polymer MEH-PV, which has similar Mn, 86 kDa, and PDI, 1.52 (MEH-PV is also dissolved in CHCl3) [26]. Specifically, the A(BC)2 solution has ρ = 0.99 g·cm−3 and η0 ≈ 0.61 cP = 0.61 × 10⁻² g·cm−1·s−1 for wt.% = 0.067 (see Supplementary Materials). The first term in the cube root of Equation (1), i.e., 3η0/2ρ, is ≈0.92 × 10⁻² cm2·s−1, while the second term k is ≈1.25 × 10⁻⁹ cm·s−½ (calculated from Equation (8) of Ref. [27] with data from Table 1), so the cube root of Equation (1) is ≈ 2.3 × 10⁻⁴ cm·s−½. Accordingly, hf ranges from ≈11 to ≈9 nm for ω = 3000 and 4000 rpm, respectively (rpm was expressed in Hz for dimensional analysis by using the equivalence 1 rpm = 1/60 Hz). These calculated thicknesses confirm the slight dependence of hf vs. ω for high rotational speeds.

2.4. Preparation of Ultrathin and Thick Polymer Films by Drop-Casting and Casting

Ultrathin and thick polymeric films were prepared by drop-casting [30] and casting [22], respectively. Ultrathin films drop-casted, ≈20 nm thick, were obtained by depositing 1 mL of solution on a TEM grid (mesh 300) placed on the CMP substrate. Prepared samples were placed within a Teflon Petri dish under a chemical hood for 24 h so as to evaporate completely CHCl3 at room temperature. Once dried, the TEM grid was gently removed obtaining a polymeric solid film composed of square polymeric regions spaced out by 30 µm regions exposing the CMP substrate. In order to measure the thickness of ultrathin films, cross-section profiles across these two regions were performed on topographic images obtained by atomic force microscopy (AFM). The thickness measured by AFM was (16 ± 3) nm (see Supplementary Materials). Thick films, ≈400 μm thick, were self-standing films prepared by dissolving 200 mg of copolymer in 50 mL of CHCl3 at room temperature, i.e., c = 4 mg·mL−1. The solution was cast in a Teflon Petri dish (diameter 3 cm), and the solvent was evaporated at room temperature. The film was removed from the Petri dish and stored in a vacuum oven at 30 °C for three days [7]. Self-standing polymeric films were prepared in the same way reported in the literature [12] and used as reference sample. The average thickness of self-standing films was measured by calipers as (400 ± 25) µm.

2.5. X-ray Reflectivity Measurements

X-ray reflectivity (XRR) measurements were performed using a SmartLab-Rigaku (Assing S.P.A., Roma, Italy) diffractometer equipped with a rotating anode (Cu Kα, λ = 1.54180 Å), followed by a parabolic mirror to collimate the incident beam and a series of variable slits (placed before and after the sample position) to reach an acceptance of 0.01°.

2.6. Atomic Force Microscopy Imaging

The microscope used for all measurements was a JPK Nanowizard III equipped with Vortex electronics (Bruker Nano GmbH, Berlin, Germany). Polymeric films were first topographically investigated by using the amplitude modulation atomic force microscopy technique (AM-AFM) under ambient conditions. All three available MikroMash NSC35 (Innovative Solutions Bulgaria Ltd., Sofia, Bulgaria) cantilevers with nominal resonant frequency ω0 of ≈150, ≈200, and ≈300 kHz and correspondent nominal spring constant k of ≈6, ≈9, and ≈16 N·m−1 were employed for AM-AFM (when necessary, the real k was calculated through the Sader method [31]).
The mechanical properties of the polymeric films were evaluated by Force Volume Maps (FVM) obtained by using the Quantitative Imaging (QI) mode developed by JPK Instruments [32]. In FVM mode, multiple force curves were acquired at points (pixel, px) of a defined grid pattern (in our case, 128 × 128 px2). The interactions between the tip and sample were measured locally and mapped point-by-point through force−distance curves. In particular, the tip was moved toward (approach curve) and away from (retraction curve) the sample surface at each point of the grid pattern, while the cantilever deflection (in V) was continually registered with respect to the position of the piezoelectric actuator (in µm, termed “height”) [33]. Prior to measurements, the elastic constant k of the cantilever was calibrated in air on bare thermal SiO2 substrate by performing a force curve on a single point of the SiO2 surface [34]. The slope of the linear part after the jump-to-contact point was reciprocal to the cantilever sensitivity s (in nm·V−1) and it was used to convert in nm the cantilever deflection measured from the photodiode (in V). Once s was measured, k was calculated by using the thermal tune method (see Supplementary Materials of Ref. [35]). FVMs were obtained by fixing the maximum applied force Fmax (in nN) calculated from Hook’s law k·U·s, where the cantilever deflection U (in V) was kept constant at 0.5 V for all measurements [36]. Force curves composing the FVM had a fixed maximum path length of 50 nm, which was traveled in 200 ms (approach and retraction paths). QI experiments were performed in both air (ambient temperature Ta = (27 ± 2) °C and relative humidity RH = (62 ± 5)% [37,38]) and liquid (mQ water). In liquid measurements, the sample was placed in the center of a homemade pool built by fixing a polypropylene tube 5 mm long (outer diameter Ø = 24 mm, inner Ø = 23 mm) on a glass microscope slide. Both the tube and sample were fixed on the glass slide by using the JPK bio-compatible glue [39]. The total volume of the pool was about 1.5 mL, which granted up to 8 h of consecutive measurements (for longer measurements the pool was refilled). QI measurements employed Bruker RTESP, LTESP (Bruker Nano GmbH, Berlin, Germany), and MikroMash NSC35 (Innovative Solutions Bulgaria Ltd., Sofia, Bulgaria) silicon cantilevers with ω0 ≈ 180, 190, and ≈290 kHz, respectively, and calibrated elastic constants k of ≈35, ≈46, and ≈32 N·m−1.
Topographic images were analyzed with the software Gwyddion (version 2.40) [40], while QI images were analyzed by the JPK Data Processing software (version spm-5.1.8).

3. Results and Discussions

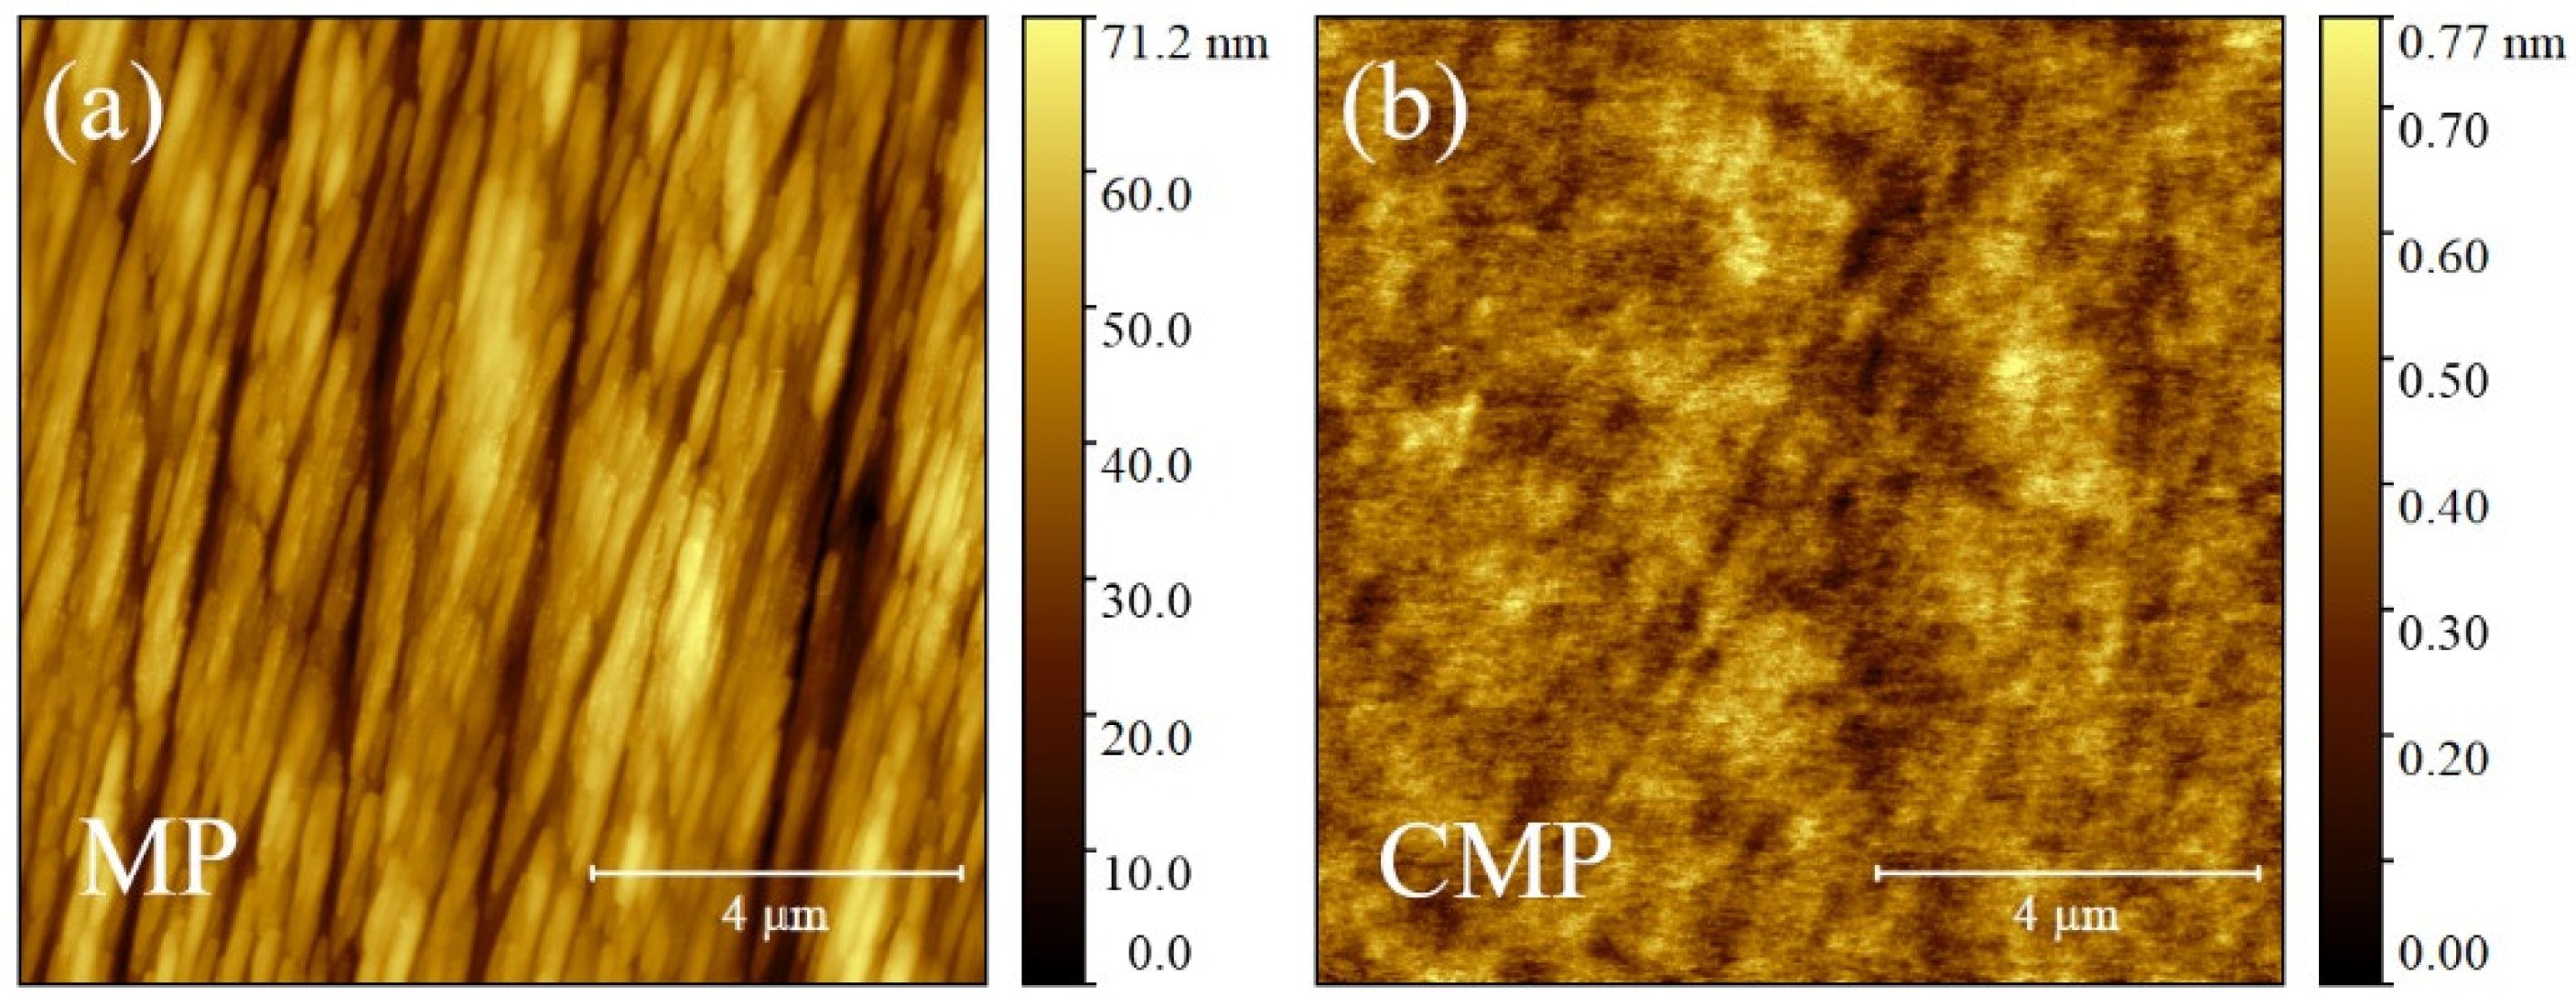
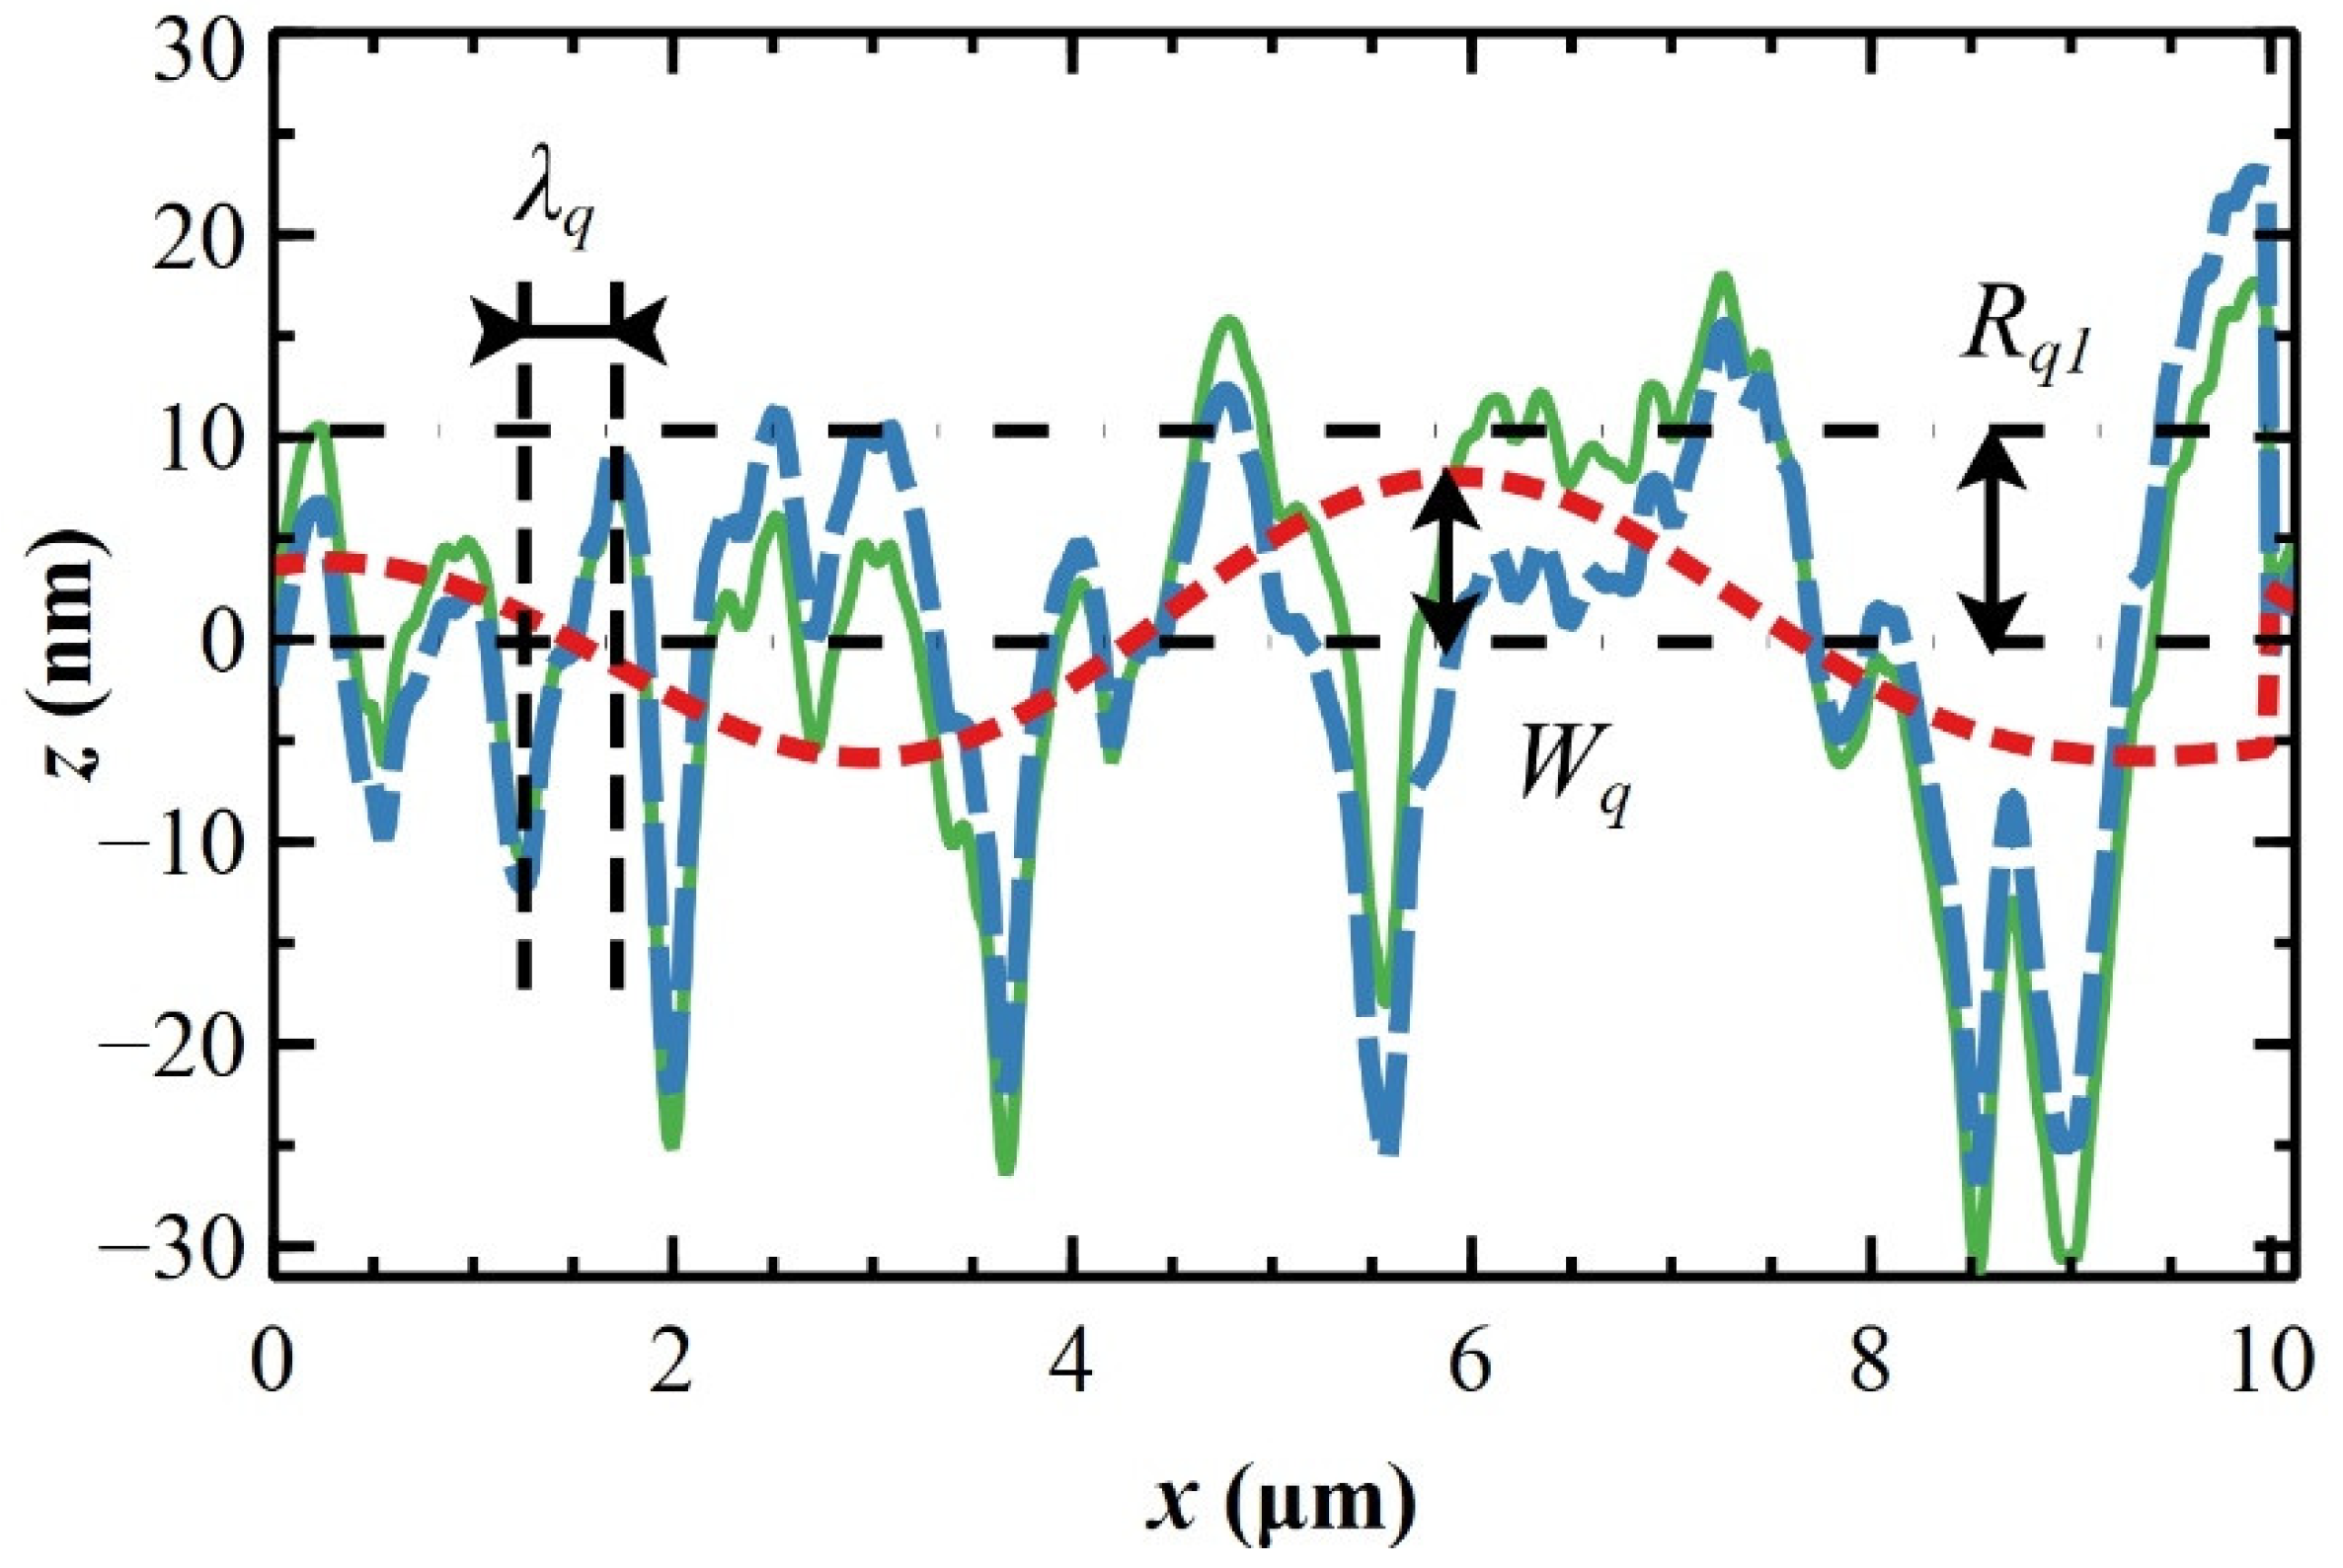
3.1. Morphological Characterization of Silicon Substrates

The morphology of wafer side surfaces, i.e., mechanical polished (MP) and chemical mechanical polished (CMP), are characterized by AM-AFM. The MP surface shows features in the order of tens of nm due to mechanical finishing (see Figure 1a), while the CMP surface is flat with details below a nm (see Figure 1b). Accordingly, the root mean square roughness Rq reduces from (10.7 ± 1.2) to (0.10 ± 0.025) nm for MP and CMP, respectively.
Such Rq values are comparable to those reported in the literature [41] where CMP wafers were polished with different abrasive SiC papers and velvet rugs imbued with Al2O3 slurry, assessing the progressive evolution of roughness parameters vs. finer polishing. The Rq value of the MP side is consistent with a surface polished by SiC papers with a grit higher than 400 (possibly 1200 [42]), while the CMP side has an Rq value even lower than the one reported in the literature and defined “not machined surfaces” [41] (due to higher surface cleanliness—compare Figure 1b,d of Ref. [41]).
To evaluate the roughness parameters of the MP surface, a one-dimensional analysis of averaged topographic profiles is used [40,43]. The average profile is obtained by averaging 90 adjacent profile lines along the direction orthogonal to the polishing features. The one-dimensional analysis splits the averaged topographic profile into waviness (low-frequency components, corresponding to the polynomial background of the image) and roughness (high-frequency components) [44]. Through this analysis, hidden surface oscillations with specific amplitudes and wavelengths emerge even if, in principle, the MP surface should not have them (see Supplementary Materials). The splitting procedure depends critically on the cut-off C that, set to 0.0098, correctly splits the MP surface profile (see Figure 2 and C calculations in Supplementary Materials).
The profile of the surface roughness obtained by one-dimensional analysis on 10 × 10 µm2 topographic images (blue dashed line in Figure 2) has a roughness Rq1 of (8.5 ± 0.1) nm and a root mean square wavelength λq, i.e., the average peak-to-valley distance [45], of (0.72 ± 0.03) µm. The waviness is characterized by a root mean square amplitude Wq of (1.8 ± 0.6) nm (red dashed line in Figure 2). The sum of Wq and Rq1 is (10.3 ± 0.7) nm, which is equal, within experimental error, to the roughness Rq calculated from height distribution [46].

3.2. X-ray Characterization of Ultrathin Polymeric Films

Two distinct behaviors are clearly visible in the XRR curves on the MP and CMP substrates (see Figure 3). The polymeric films deposited on the CMP substrates, at ω = 3000 and 3200 rpm, exhibit Kiessig fringes generated by the constructive interference of the reflected X-ray beam by both the polymeric film surface and the film/substrate interface [47]. Such fringes are indicative of a smooth film surface and a smooth film/substrate interface, in agreement with data obtained by AFM. The thickness of the polymeric films can be measured from Kiessig periodicity, obtaining a thickness range of [10,12] nm for both films [48,49]. Notably, such values are similar to those theoretically calculated in Section 2.3. The reduction in Kiessig amplitude intensity for the film deposited at ω = 3000 rpm indicates an increased roughness of the film surface with respect to that deposited at ω = 3200 rpm, in line with the smoothing effect expected for increasing ω on films deposited on CMP substrates. Conversely, the XRR curves of polymeric films deposited on MP substrates at ω ranging from 3500 to 4000 rpm do not show Kiessig fringes, and the XRR signal is damped. This is typical of ultrathin films deposited on (relatively) rough surfaces [50], as observed by AFM.

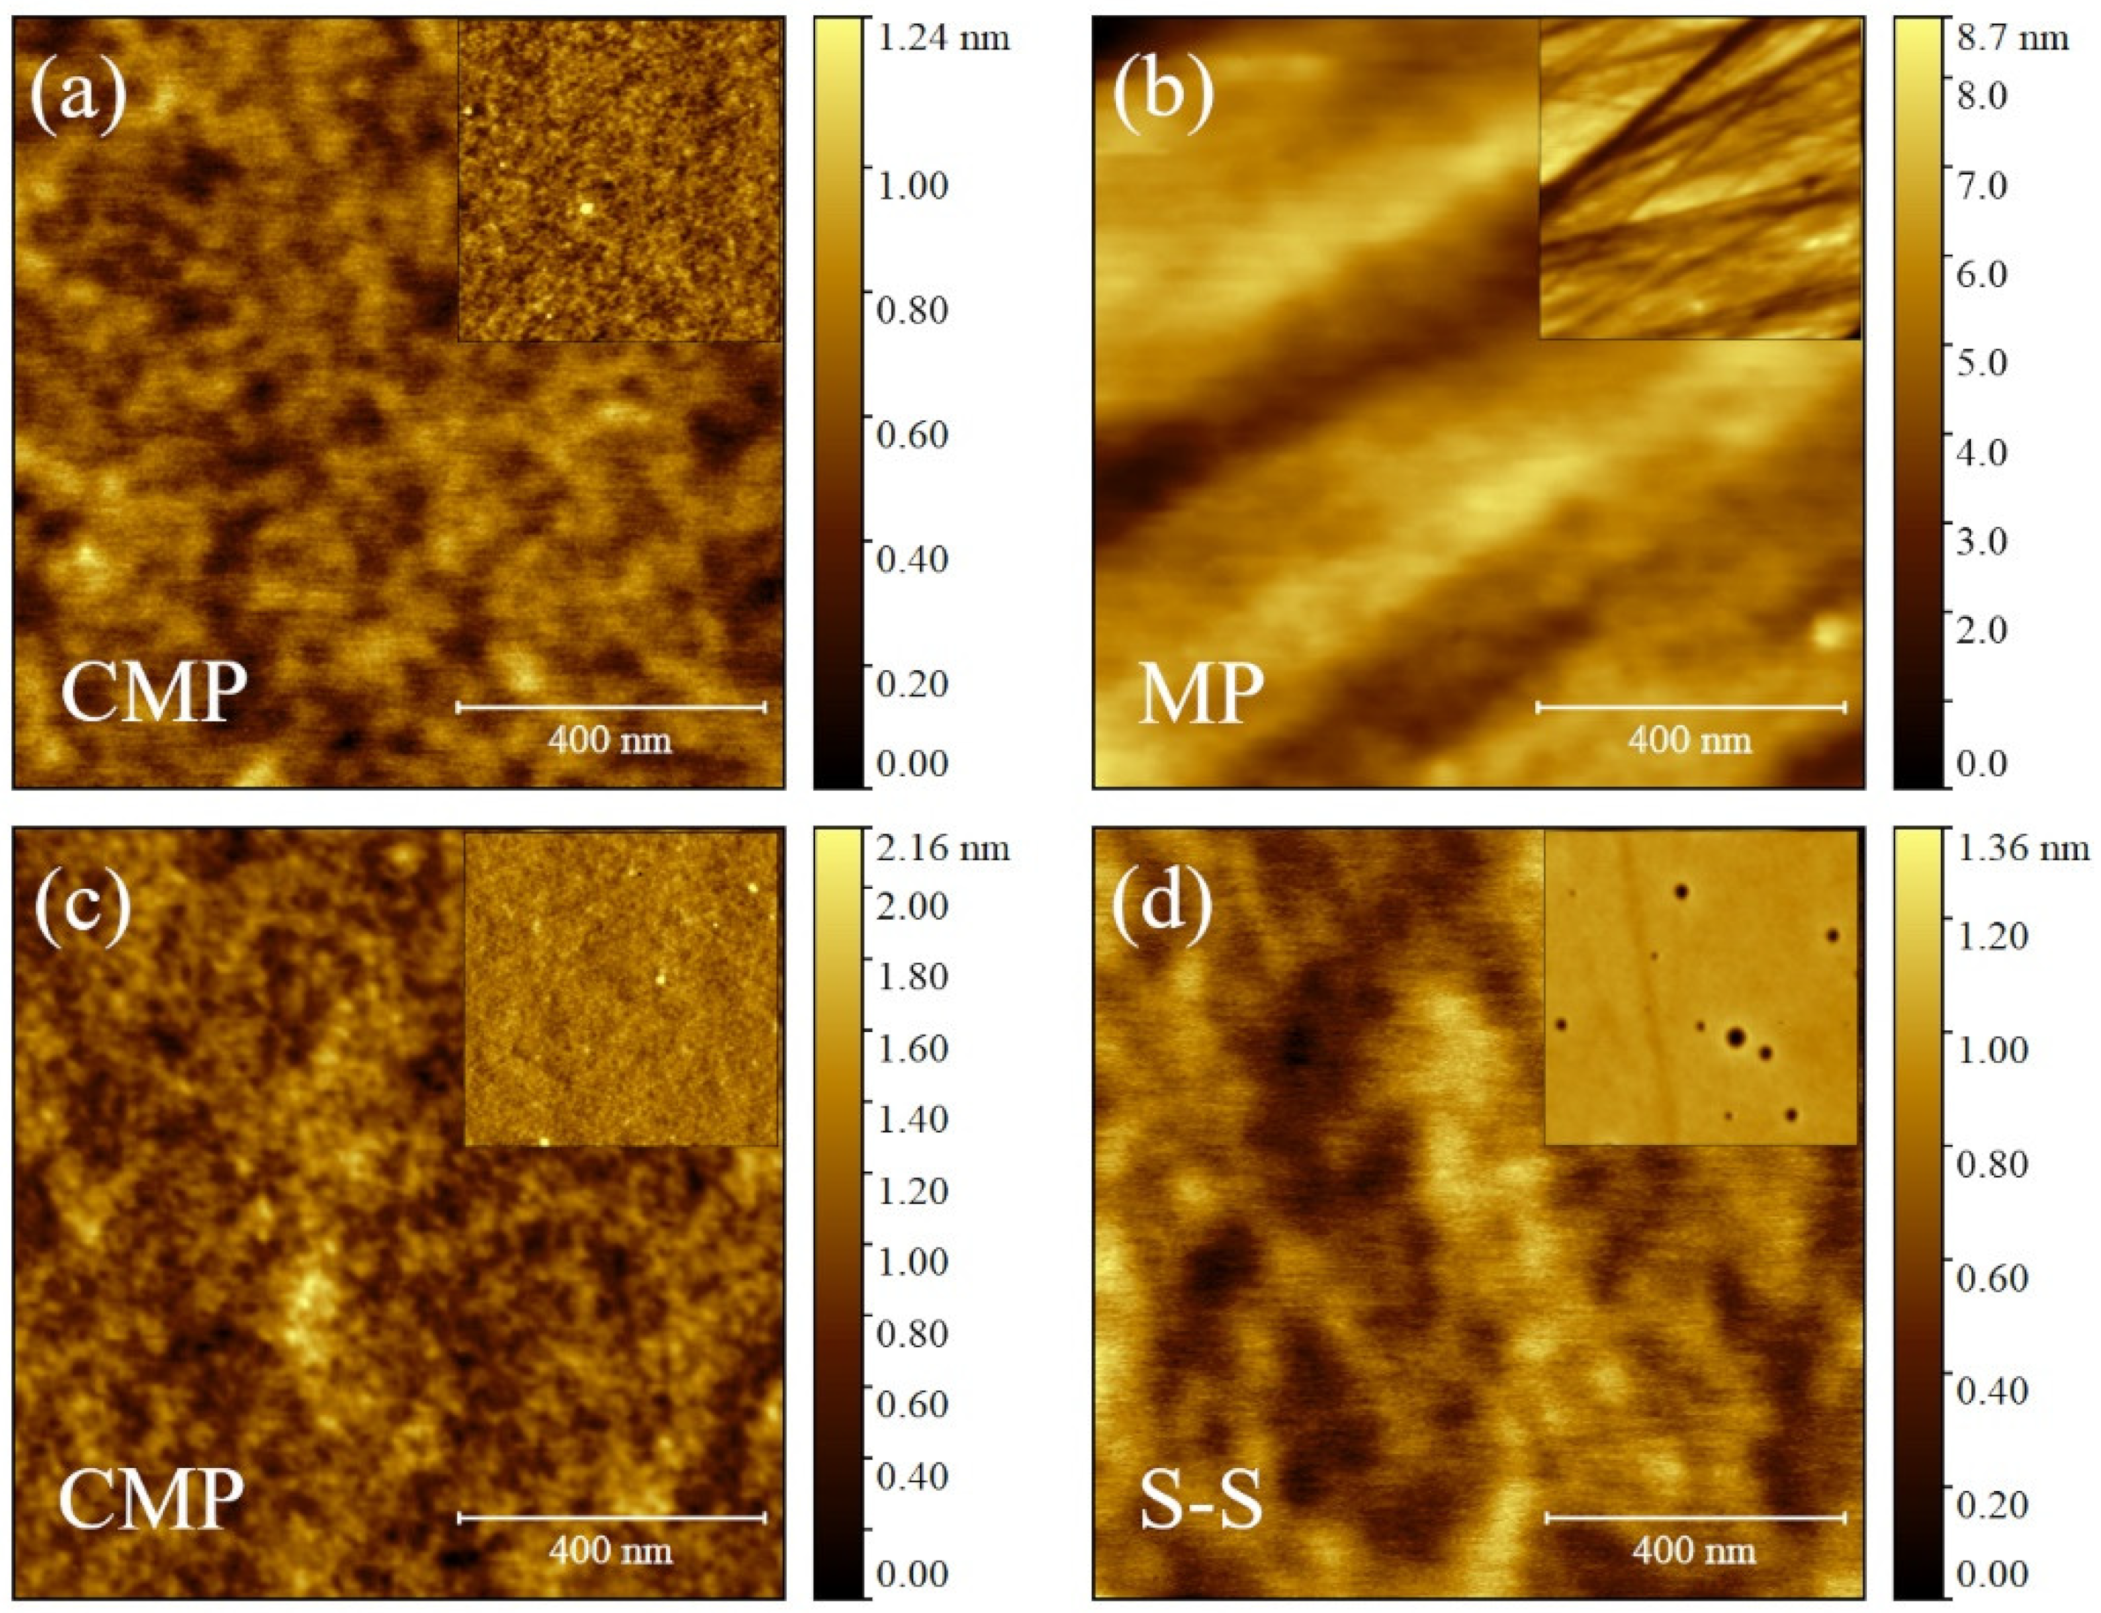
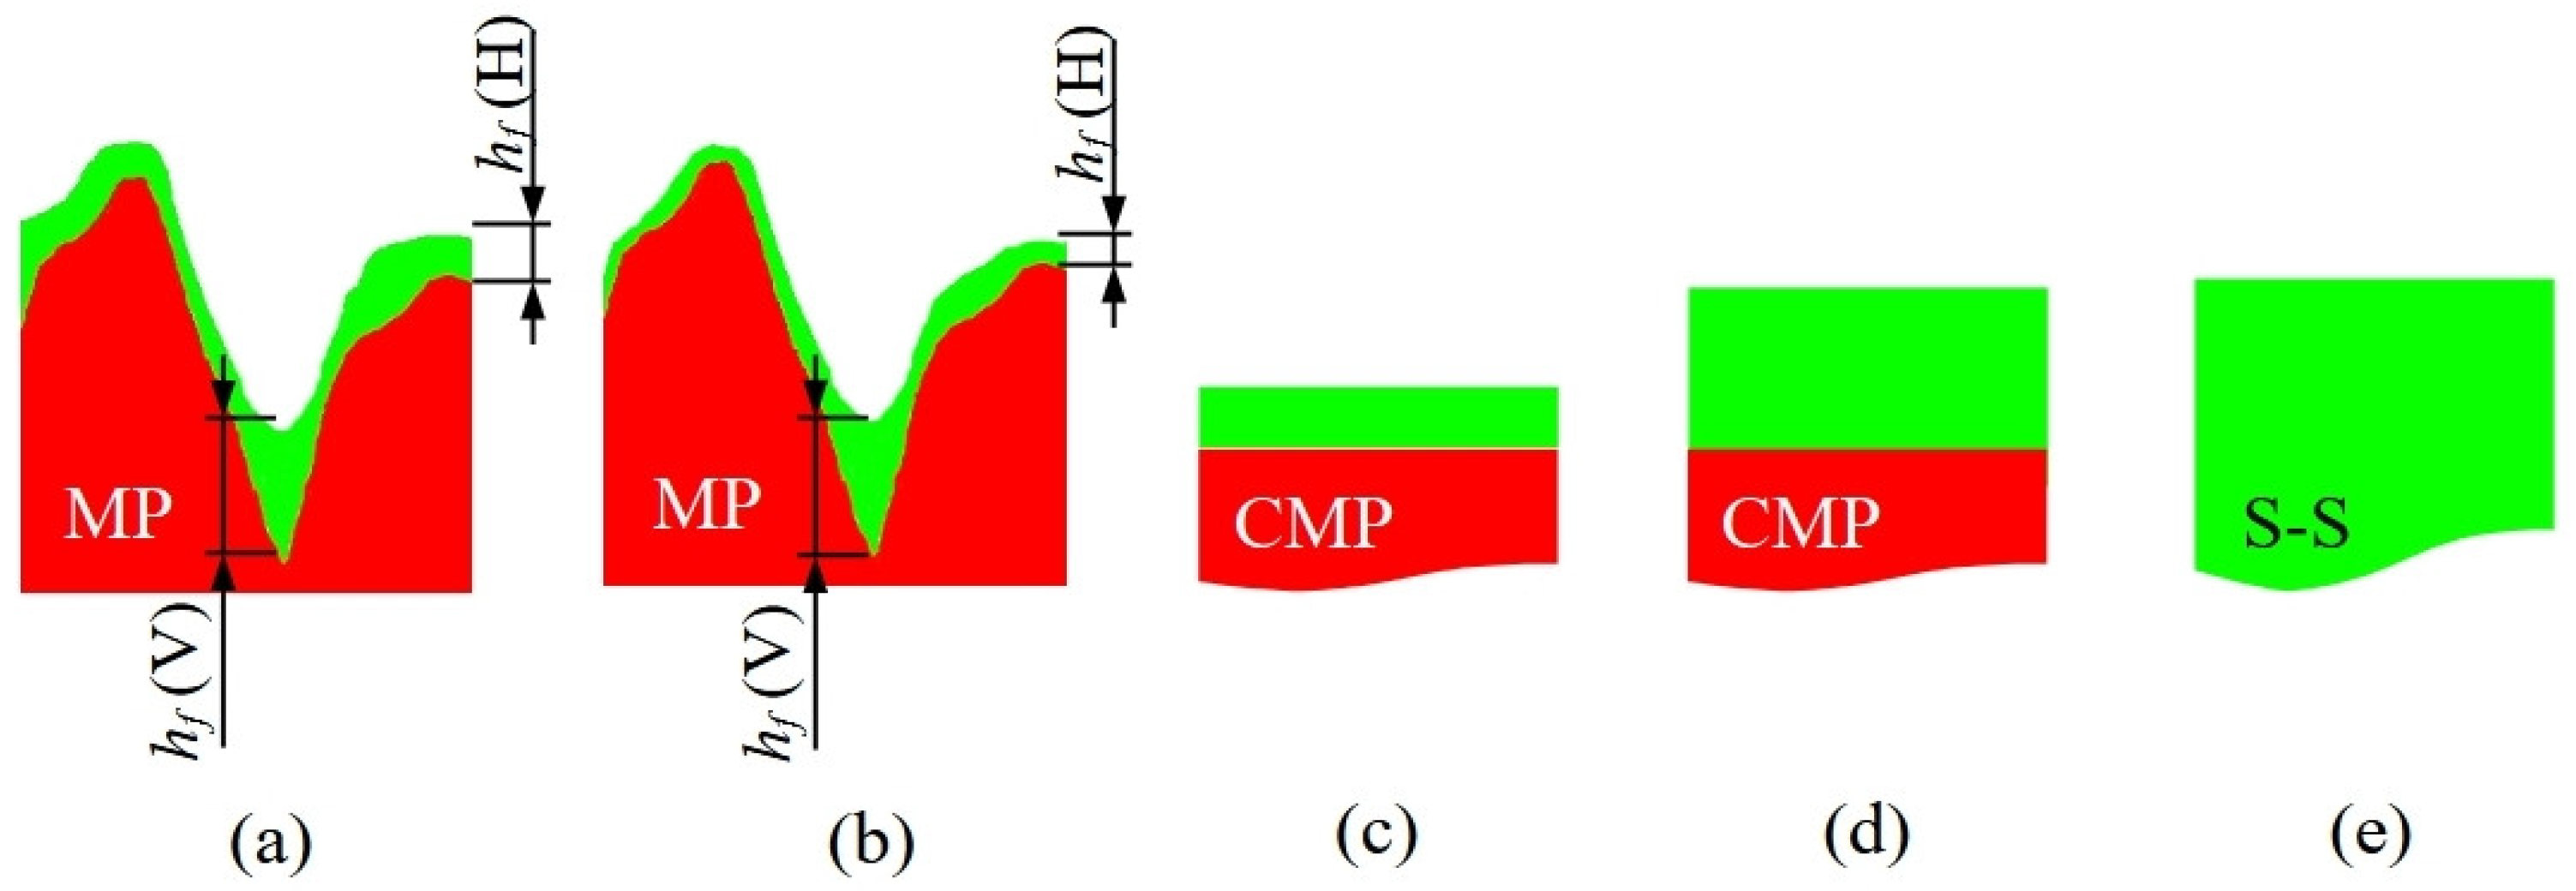
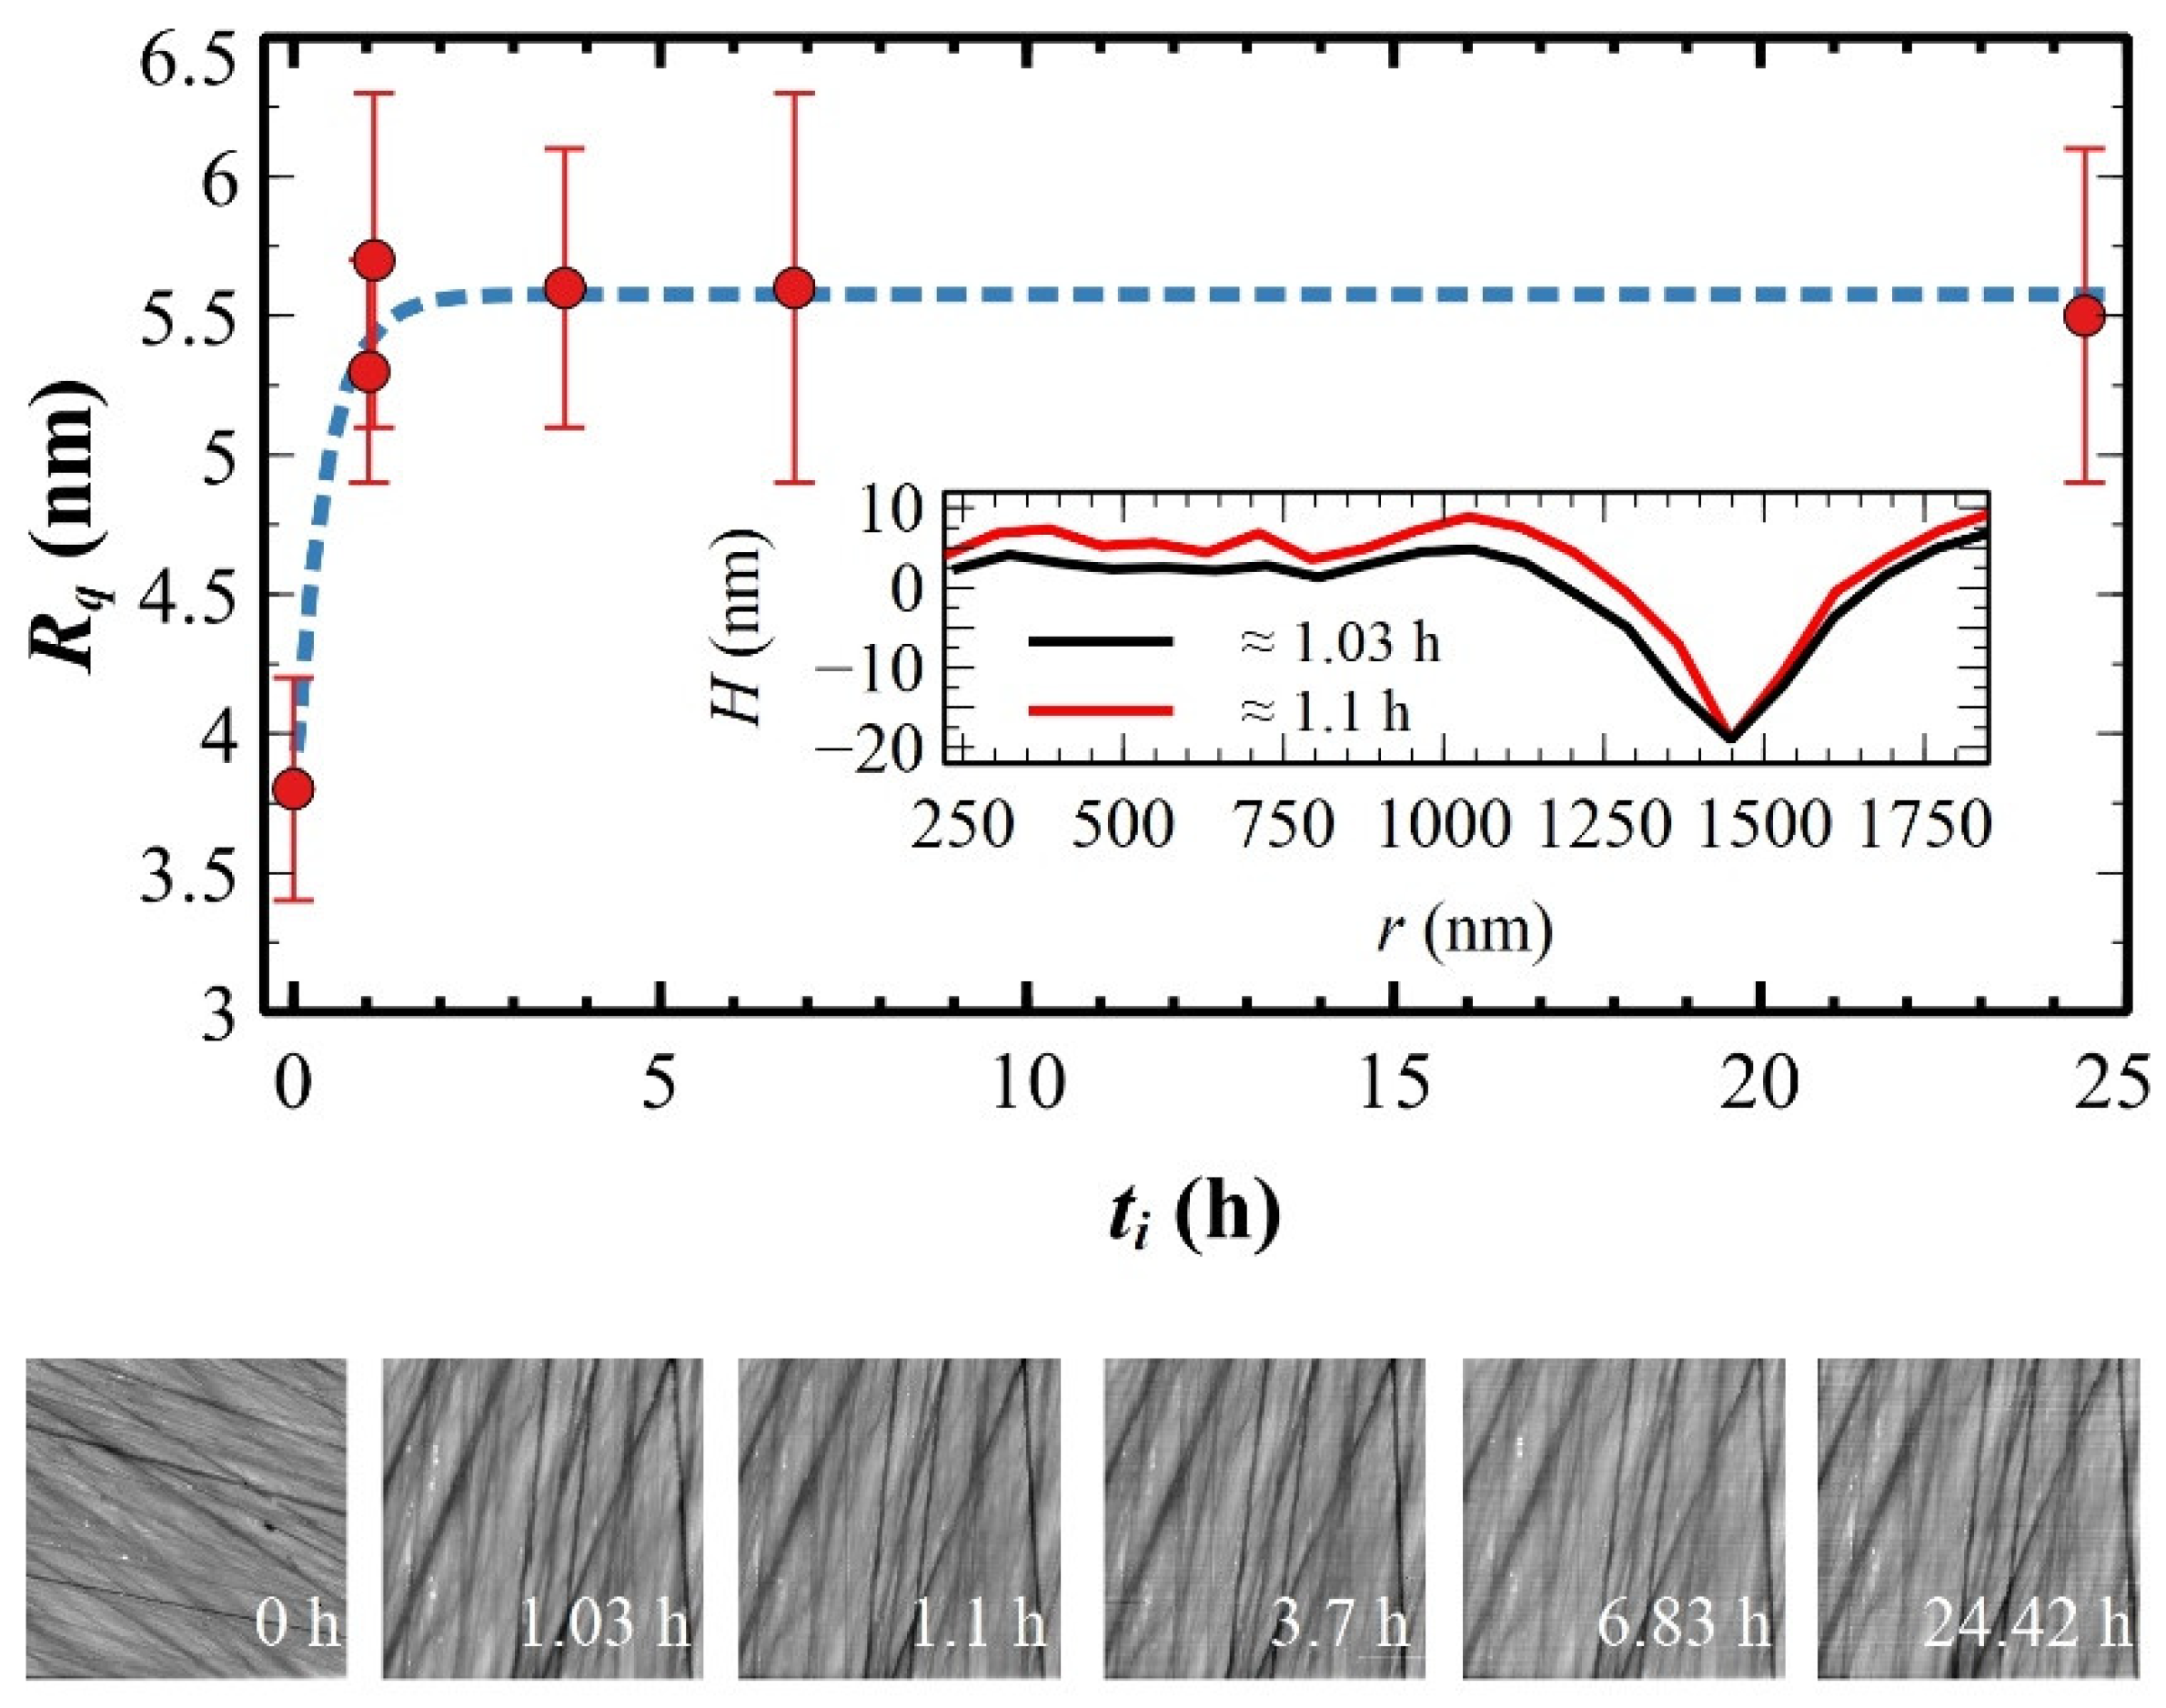
3.3. Morphological Characterization of Ultrathin and Self-Standing Polymeric Films

The morphology of polymeric films depends strongly on the deposition technique. In spin-coated films, it depends on both the substrate, CMP or MP, and the rotational speed ω. This latter dependence is lost in the case of CMP substrates where the films are flat with an average roughness Rq of ≈0.17 nm (see Table 2) and the films are featureless even at a large scale (see Figure 4a and its inset).
Otherwise, the film morphology depends on ω due to the morphology of MP substrates (see Figure 4b). By comparing Figure 1a and Figure 4b, polymeric films smoothen the topographical features of bare MP substrates, although relatively large scratches are still present. The roughness of polymeric films, measured both by one-dimensional analysis, Rq1, as well as height distribution, Rq, are progressively reduced vs. ω from Rq1 ≈ 4.1 to ≈2.6 nm for 3500 and 4000 rpm, respectively (see Table 2). Such a reduction, but less pronounced, is also observed on Wq. Within experimental errors, λq remains, on average, constant at (0.74 ± 0.30) µm and independent of ω (see Table 2).
For understanding the morphological evolution of polymeric films vs. ω, the one-dimensional parameters summarized in Table 2 are compared with those obtained on bare MP substrates (λq ≈ 0.72 µm, Wq ≈ 1.8 nm, and Rq1 ≈ 8.5 nm). The wavelength λq, which is determined by surface scratches, is unaffected by the presence of films and invariant with ω. Since the scratches are deeper, or at most comparable, to the film thickness hf (on average ≈ 11 nm, cp. to Section 3.2), their modulations are preserved even after the film deposition. The amplitude Wq also depends on the scratches, but it is reduced with respect to the bare MP substrate for films deposited at ω = 4000 rpm. The roughness Rq1 is lower than the roughness of the bare MP substrate, also for increasing ω. Since Rq1 is governed by small height variations around the oscillating roughness profile (see Figure 2), its reduction means that such height modulations are progressively filled by the film for increasing rotational speed ω.
These experimental observations can be rationalized with a single parameter termed surface planarization P (in %) [51]. Mathematically, P is defined as
P = 100 1 s h d
where sh and d are the (average) peak-to-valley roughness, viz., Rz (ISO) [52], for the polymeric film and the bare MP substrate, respectively. If the film is conformal to the substrate features, shd and P → 0%. Vice versa, if the film is flat sh → 0 and P → 100%. For bare MP substrates, d is (35 ± 6) nm and sh ranges from ≈18 to ≈9 nm for 3500 and 4000 rpm, respectively (see Table 2). Accordingly, P runs from ≈49 to ≈73%. In the case of spin-coated films on CMP substrates, they are flat with a small d of (0.15 ± 0.05) Å. The same for sh, that is, ≈0.15 nm and ≈0.2 nm for 3000 and 3200 rpm, respectively (see Table 2). Substrates and films have comparable Rz (ISO), so films are flat (P = 100%), as well as the CMP substrate.
Polymeric films on CMP substrates deposited by drop-casting are flat and featureless with an Rq of (0.25 ± 0.025) nm, even at a large scale size (see Figure 4c and its inset). Similarly, self-standing polymeric films S-S have a surface roughness Rq of (0.20 ± 0.025) nm (see Figure 4c and its inset).
In view of the P values reported in Table 2, MP substrate planarization through the polymeric film is affected by both substrate corrugations and ω. Such nanometer corrugations are also expected to locally change the film thickness.
The fluid film formed on the substrate surface during the spin-coating deposition is pivotal for the planarization effect. The A(BC)2 solution is a non-Newtonian fluid due to the high volatility of CHCl3 and, also, it is a low viscosity fluid due to the low concentration of the solution (c = 1 mg·mL−1) and the low polymer mass fraction dissolved in CHCl3 (wt.% = 0.067). Such a fluid easily fills completely the scratches independently of ω [53]. Such filling is also facilitated by the average width of the scratches (a few hundred nm); indeed, the lowest critical width at which trench filling is impeded is about 5 cm (as calculated from the spin-coating theory in our experimental conditions [54]), several orders of magnitude larger than the average width of the scratches. Accordingly, the liquid film spin-coated on the substrate fills the scratches completely and, after solvent evaporation, surface planarization is reached even if it is not perfect due to the non-Newtonian behavior of the solution [54].
The (relatively) flat regions between the scratches show a different behavior. The liquid film thickness hw is thinned for increasing ω similarly to flat substrates like CMP. The solid film thickness hf is reduced from 10 to 9 nm passing from ω = 3500 to 4000 rpm (cp. to Section 2.3), a thickness comparable to small height variations determining Rq1 (≈8.5 nm). In these conditions, height variations are smoothed by the film [55,56] and Rq1 is reduced from ≈ 8.5 nm (bare substrate) to ≈4.1 nm (or less; see Table 2). The liquid film spin-coated on the substrate is governed by capillary forces (Ω2 ≈ 10−7 [57]), and the solution moves toward roughness valleys (≈100 nm wide, as evaluated by the Height–Height Correlation Function [58]) rather than on top of hills due to their high aspect ratio [59]. Since hf is larger for a lower ω, the dried film on roughness hills, hf (H), will be thicker at 3500 to 4000 rpm while the roughness valleys, like scratches, will be filled completely by the solution and hf (V) will be independent to ω (see Figure 5a,b). Consequently, hf (H) obtained at ω1, hf (H)|ω1, is thicker than hf (H)|ω2 if ω1 < ω2 while hf (V)|ω1 = hf (V)|ω2 regardless of ω. As reported by Table 2, Rq1|ω1 > Rq1|ω2 for ω1 < ω2, explaining why P|ω1 < P|ω2. These observations and results suggest that polymeric films on MP substrates have a final thickness hf comparable to the substrate roughness in agreement with X-ray results and the literature [60]. Other films on the CMP substrate (Figure 5c,d) and self-standing (S-S, Figure 5e) are featureless and do not need additional morphological descriptions.

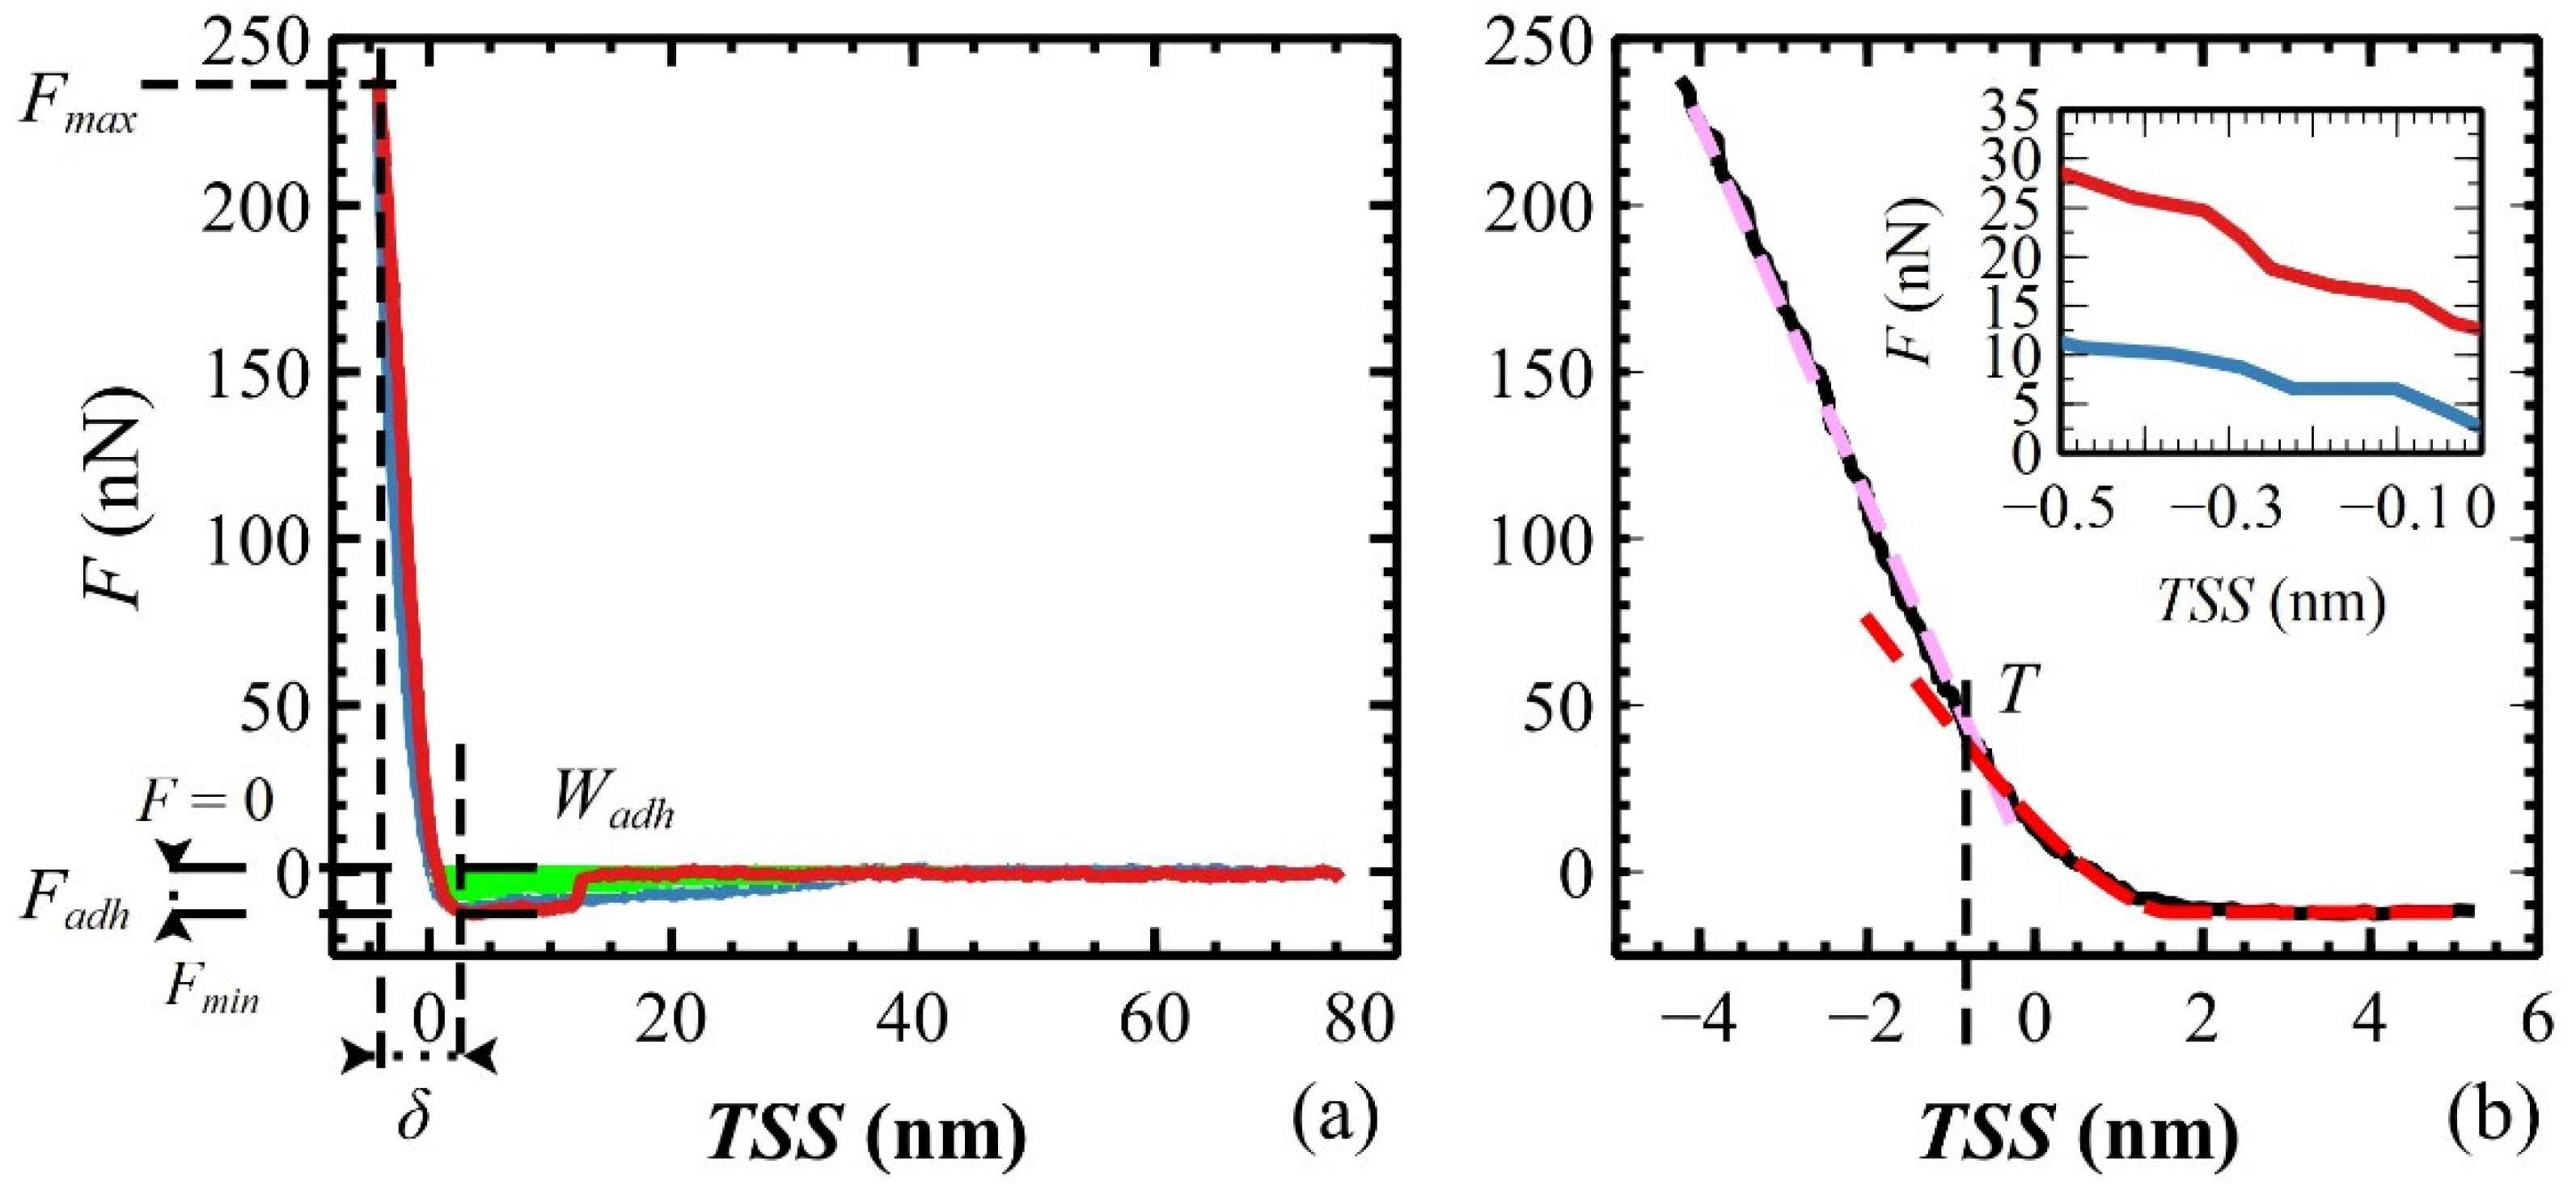
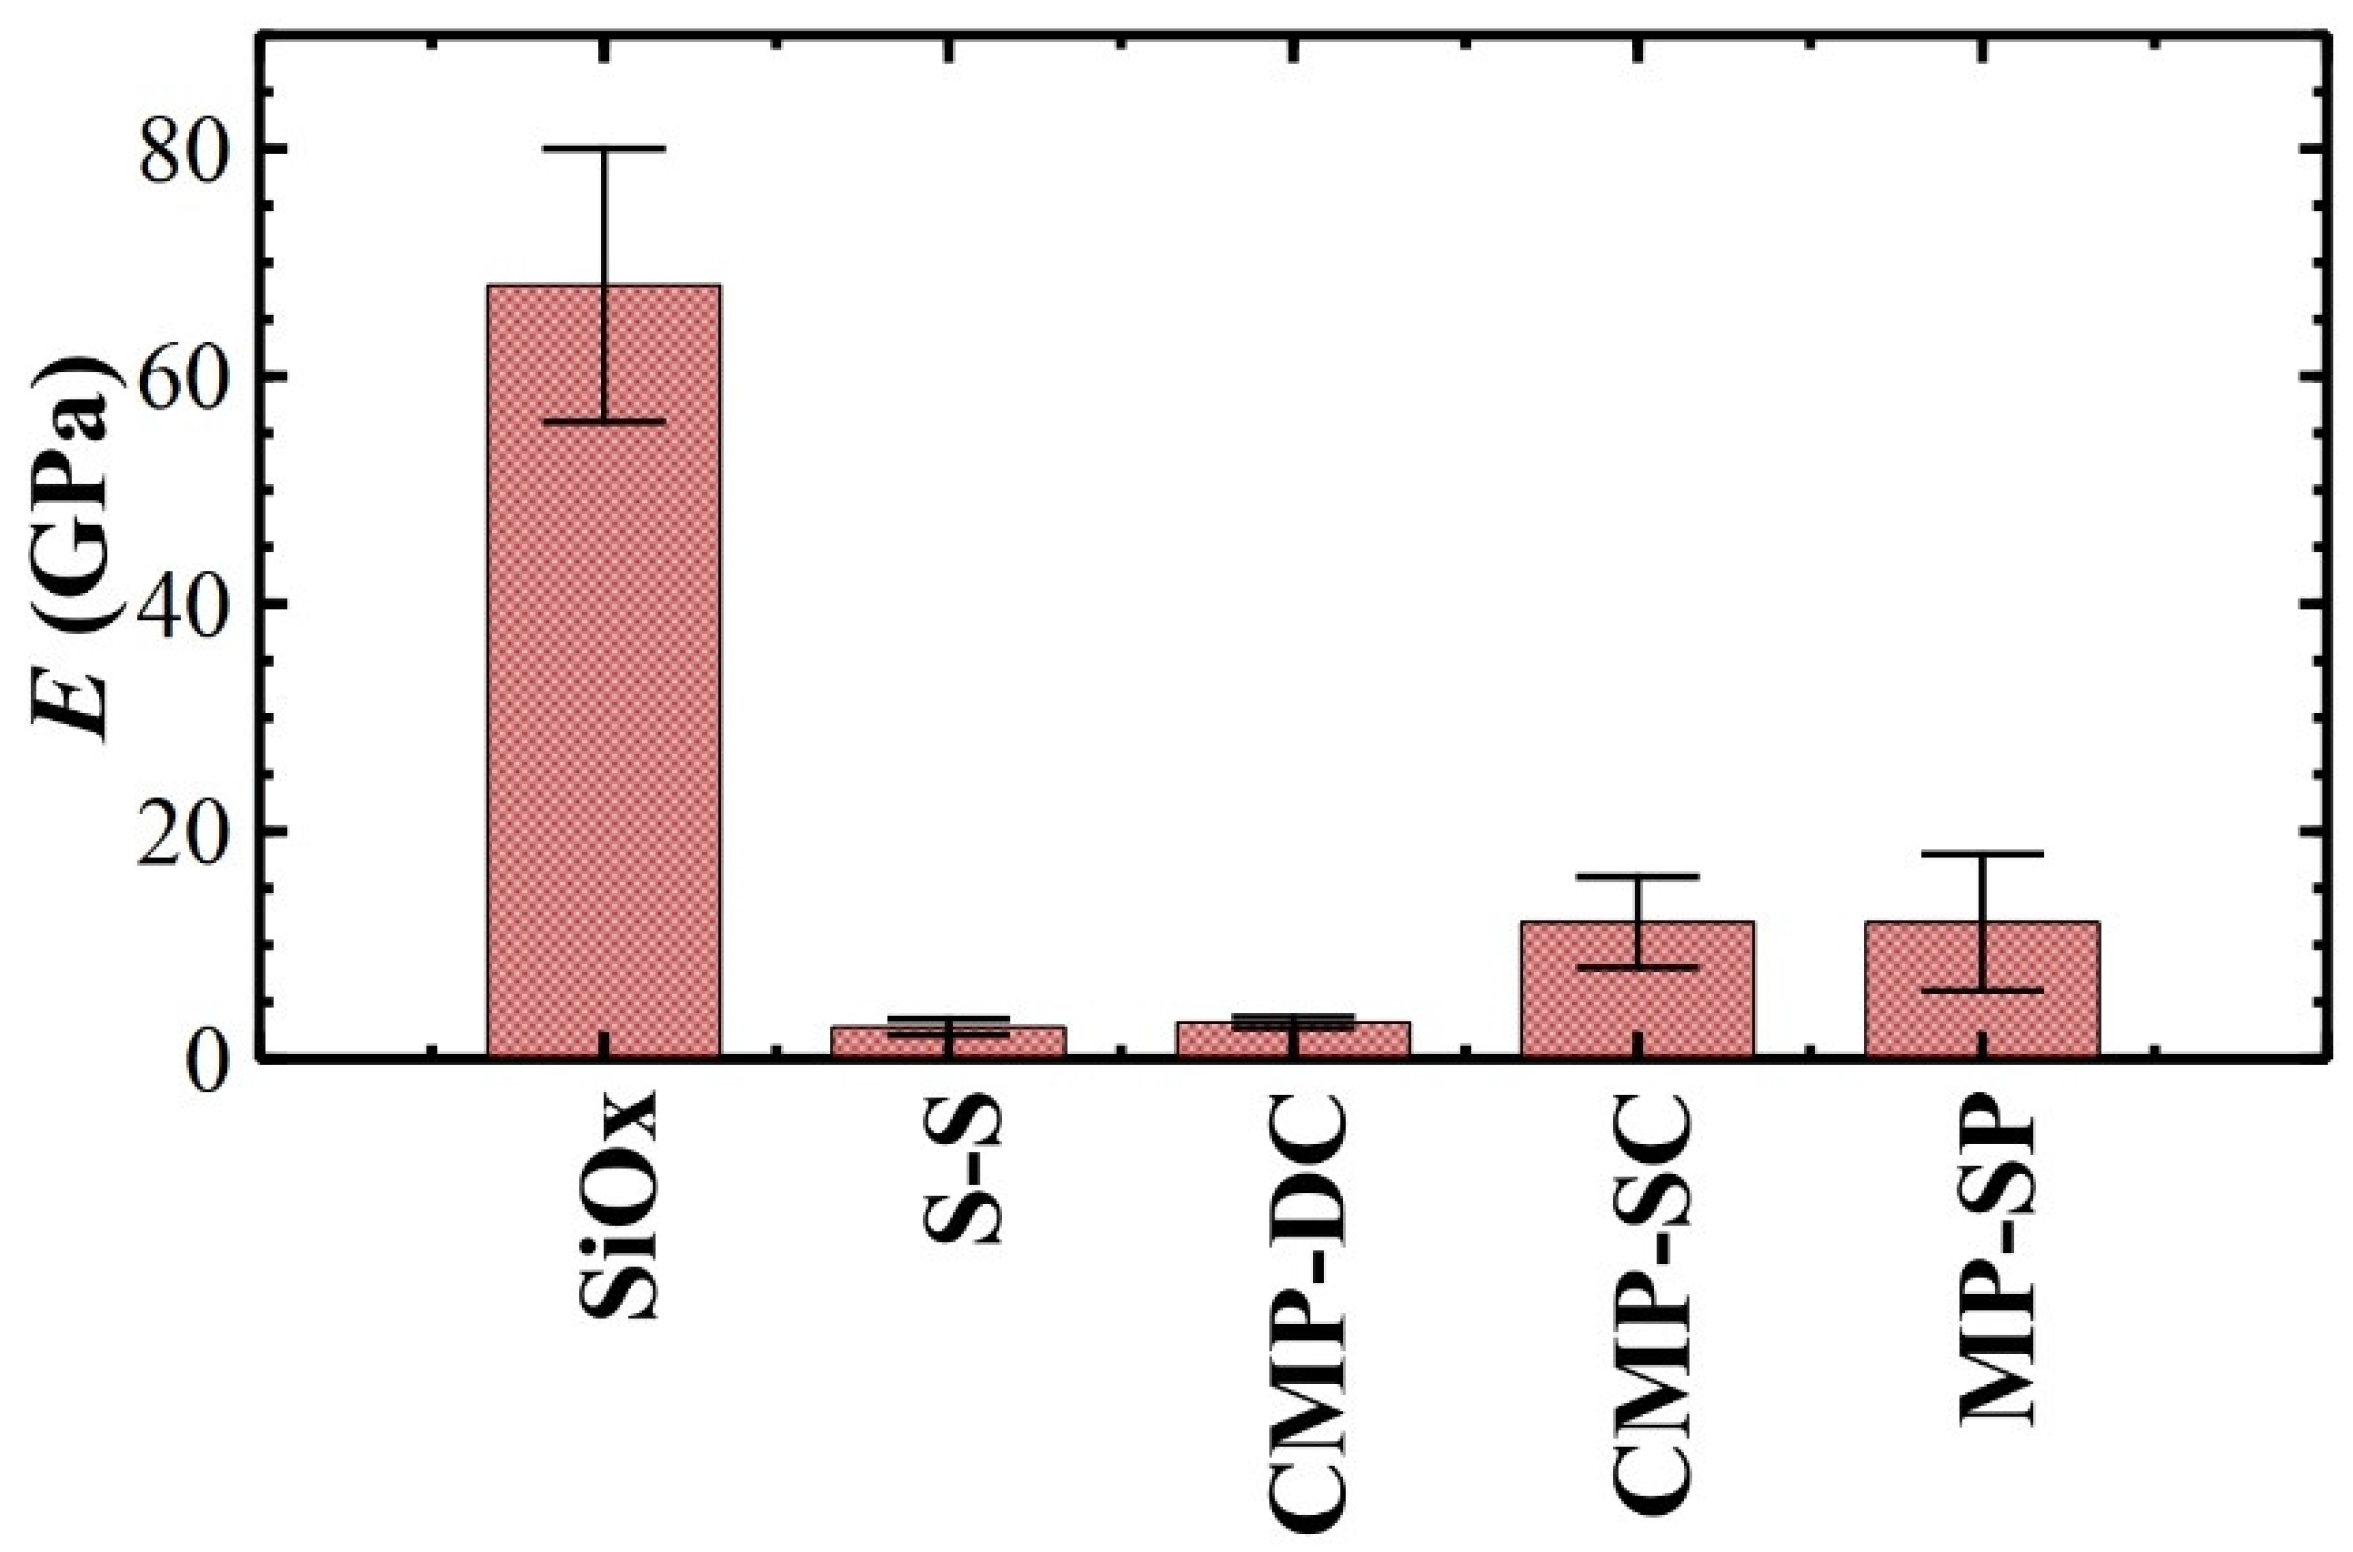
3.4. Elastic Modulus of Polymeric Films Measured in the Air

The indentation hardness of polymeric films was measured by FVM [61,62]. Raw force–height curves composing the FVM were vertically aligned to the x-axis (baseline subtraction, y = 0) and horizontally shifted to the y-axis by setting the height value to x = 0 at F = 0, i.e., where the tip–sample interaction starts to be in a repulsive regime (also termed “contact point”; the measured height is, therefore, re-scaled). To perform quantitative measurements of the mechanical properties, force–height curves have to be converted into force–tip–sample separation (TSS) curves [63] by subtracting the bending of the cantilever from the height (see Figure 6a). As reported by Cappella [34], the approach curve is used to measure the indentation δ and elastic modulus E, while the retraction curve is used to measure the adhesion force Fadh, and the work required to separate the tip from the sample, i.e., the work of adhesion Wadh (see Figure 6a). Such physical parameters for each sample were obtained by analyzing one hundred TSS curves, manually selected on random spatial positions from FVM composed of 128 × 128 curves. Then, the data were plotted as histograms and fitted by Gaussian distributions to obtain the average value of the parameters.
To measure E of the polymeric films, the Hertz model was adopted wherein the tip is approximated to a sphere [64]. This approximation is valid for a tip indentation δ smaller than the radius of the curvature of the tip Ξ. In these experiments, Ξ = 10 nm is calculated by averaging the maximum nominal Ξ reported in the datasheets (12, 12, and 8 nm for Bruker RTESP, LTESP, and MikroMash NSC35, respectively), so δ < Ξ for all measurements (Table 3). The choice of the Hertz model is also validated by the adhesion force Fadh measured as the difference between the minimum force, Fmin, and the baseline, i.e., F = 0 (see Figure 6a) [65,66]. Within the Hertz model, the calculation of E is precise if the maximum applied force Fmax is much larger than Fadh [67,68,69]. In our films, Fadh runs from a minimum of ≈ 6 nN (CMP-DC sample) to a maximum of ≈19 nN (CMP-SC sample) with Fmax ≈ 120 nN and ≈260 nN, respectively (see Table 3). The ratio Fadh/Fmax is within the range [0.05, 0.07], hence E is measured correctly.
The inset of Figure 6b shows a small hysteresis between the approach and retraction curves, typical of an elastoplastic deformation of the films [34]. The indentation δ, measured as the difference between the TSS values at Fmin and Fmax (see Figure 6a) [71], shows two slopes indicated by two dashed lines in Figure 6b. The portion of the approach curve from the Fmin plateau to the intersection T is the elastic deformation of the film, useful for measuring E (the first few nm; the red dashed line is the fitting curve obtained by using the Hertz model). In this indentation range, F increases from 0 to ≈30 nN with a root mean square error of (1.0 ± 0.2) nN, i.e., the quality of data fitting is within an error of 3%. Then, the film is plastically deformed by the tip for an additional few nm, as indicated by the pink dashed line (a guide to the eye) [72]. The last parameter adopted in the Hertz model is the Poisson ratio of polymeric films ν, fixed to 0.33 from the literature [15]. This choice is supported by experimental results on similar amorphous polymeric films (see SI of Ref. [15]), where the magnitude of E shows slight changes within a realistic ν interval, i.e., 0 < ν < 0.5 and, also, the trend of E vs. film thickness hf is preserved for all ν.
As shown in Figure 7, thicker films have comparable E (≈3 GPa; see Table 3), in agreement with the results obtained on similar bulk films (1–10 µm thick) [73]. Our polymeric films reach the bulk value for hf ≥ 20 nm, independently of c (S-S and CMP-DC were obtained from solutions with c = 4 and 1 mg·ml−1, respectively) and in agreement with the literature [15,74]. For ultrathin films deposited by spin-coating, E increases to ≈12 GPa with a variance of ≈0.3 and ≈7 for CMP-SC and MP-SC, respectively. Such high variance produces E values spanning from ≈7 to ≈20 GPa for MP-SC samples, suggesting that hf is locally not homogeneous by reason of the high local roughness Rq1 with respect to the flatness of CMP substrates.
The film thickness hf plays a key role in the E interpretation; E is accurate if the ratio δ/hf is ≤0.025 (film-affected zone); otherwise, it is overestimated if δ/hf > 0.15 (substrate-dominated zone) [66].
The S-S sample is the reference for the film-affected zone: a tip indentation δ of ≈6 nm, obtained by applying a maximum force Fmax of ≈240 nN (see Table 3) on a sample ≈ 400 µm thick, produces a δ/hf of ≈1.5 × 10⁻⁵. On CMP-DC, i.e., the thickest ultrathin film, δ is ≈ 3 nm, obtained by applying a Fmax of ≈ 120 nN (see Table 3) on a ≈20 nm thick film, i.e., δ/hf ≈ 0.15, a value between film- and substrate-dominated zones (transition zone). In particular, δ/hf ≈ 0.15 is the upper limit to avoid the substrate effect, explaining why the measured E is comparable to the S-S sample. In the case of the ultrathin films prepared by spin-coating on the CMP and MP substrates, E was measured in the flat regions between the MP substrate scratches, which are morphologically similar to the flat CMP substrates (but with higher roughness). The CMP-SC films are flat with a constant thickness hf ≈ 12 nm; δ is ≈2.6 nm by applying Fmax of ≈260 nN, so δ/hf ≈ 0.22 > 0.15 and E is overestimated (substrate-dominated zone). In the MP-SC samples, the ultrathin films are thinner by 1 nm (at least) than those prepared on the CMP substrates because of a higher rotational speed during deposition (ω = 3500 rpm compared to ω = 3200 rpm). The thickness hf is <11 nm, δ is ≈1.6 nm for Fmax ≈ 120 nN, and δ/hf > 0.15 (at the minimum), so just enough to enter the substrate-dominated zone. Accordingly, the CMP-SC and MP-SC samples have comparable E. Such an overestimation of E on ultrathin films is reported in the literature [73,76,77,78], and it is associated with both a supporting substrate [76] and polymer molecular weight [79]. In addition, it can also be explained by using an extreme case study termed “contact-induced stiffening” [80], i.e., when the substrate is elastically deformed by the tip after a full plastic deformation of the film [66].
The adhesion between the tip and the sample increases for an increasing interaction time, i.e., for increasing indentation δ [81]. This phenomenon is due to the increase in the effective surface area of the tip interacting with the sample, resulting in an increase in the overall adhesion between the tip and the sample. During sample indentation (approach curve), the tip interacts with the sample by van der Waals forces and H-bond [82]. The sum of such interactions increases for an increasing effective surface area; therefore, the adhesion force Fadh is expected to increase with an increase in the maximum applied force Fmax (see Table 3) [81]. Once indentation is complete, the tip is retracted from the surface (retraction curve) and the work to detach the tip from the sample (adhesion work, in J) is the work necessary to break the van der Waals forces and H-bond (material-dependent), and then to overcome capillary forces [83]. As shown in Table 3, Fadh and Wadh depend on film thickness with higher values for ultrathin films made by spin-coating since their thickness is close to the critical one (≈10 nm) [84]. By comparing the data in Table 3 with the literature, Fadh is comparable to the one obtained on PMMA films [85] suggesting that MMA branches might be exposed at the film surface.

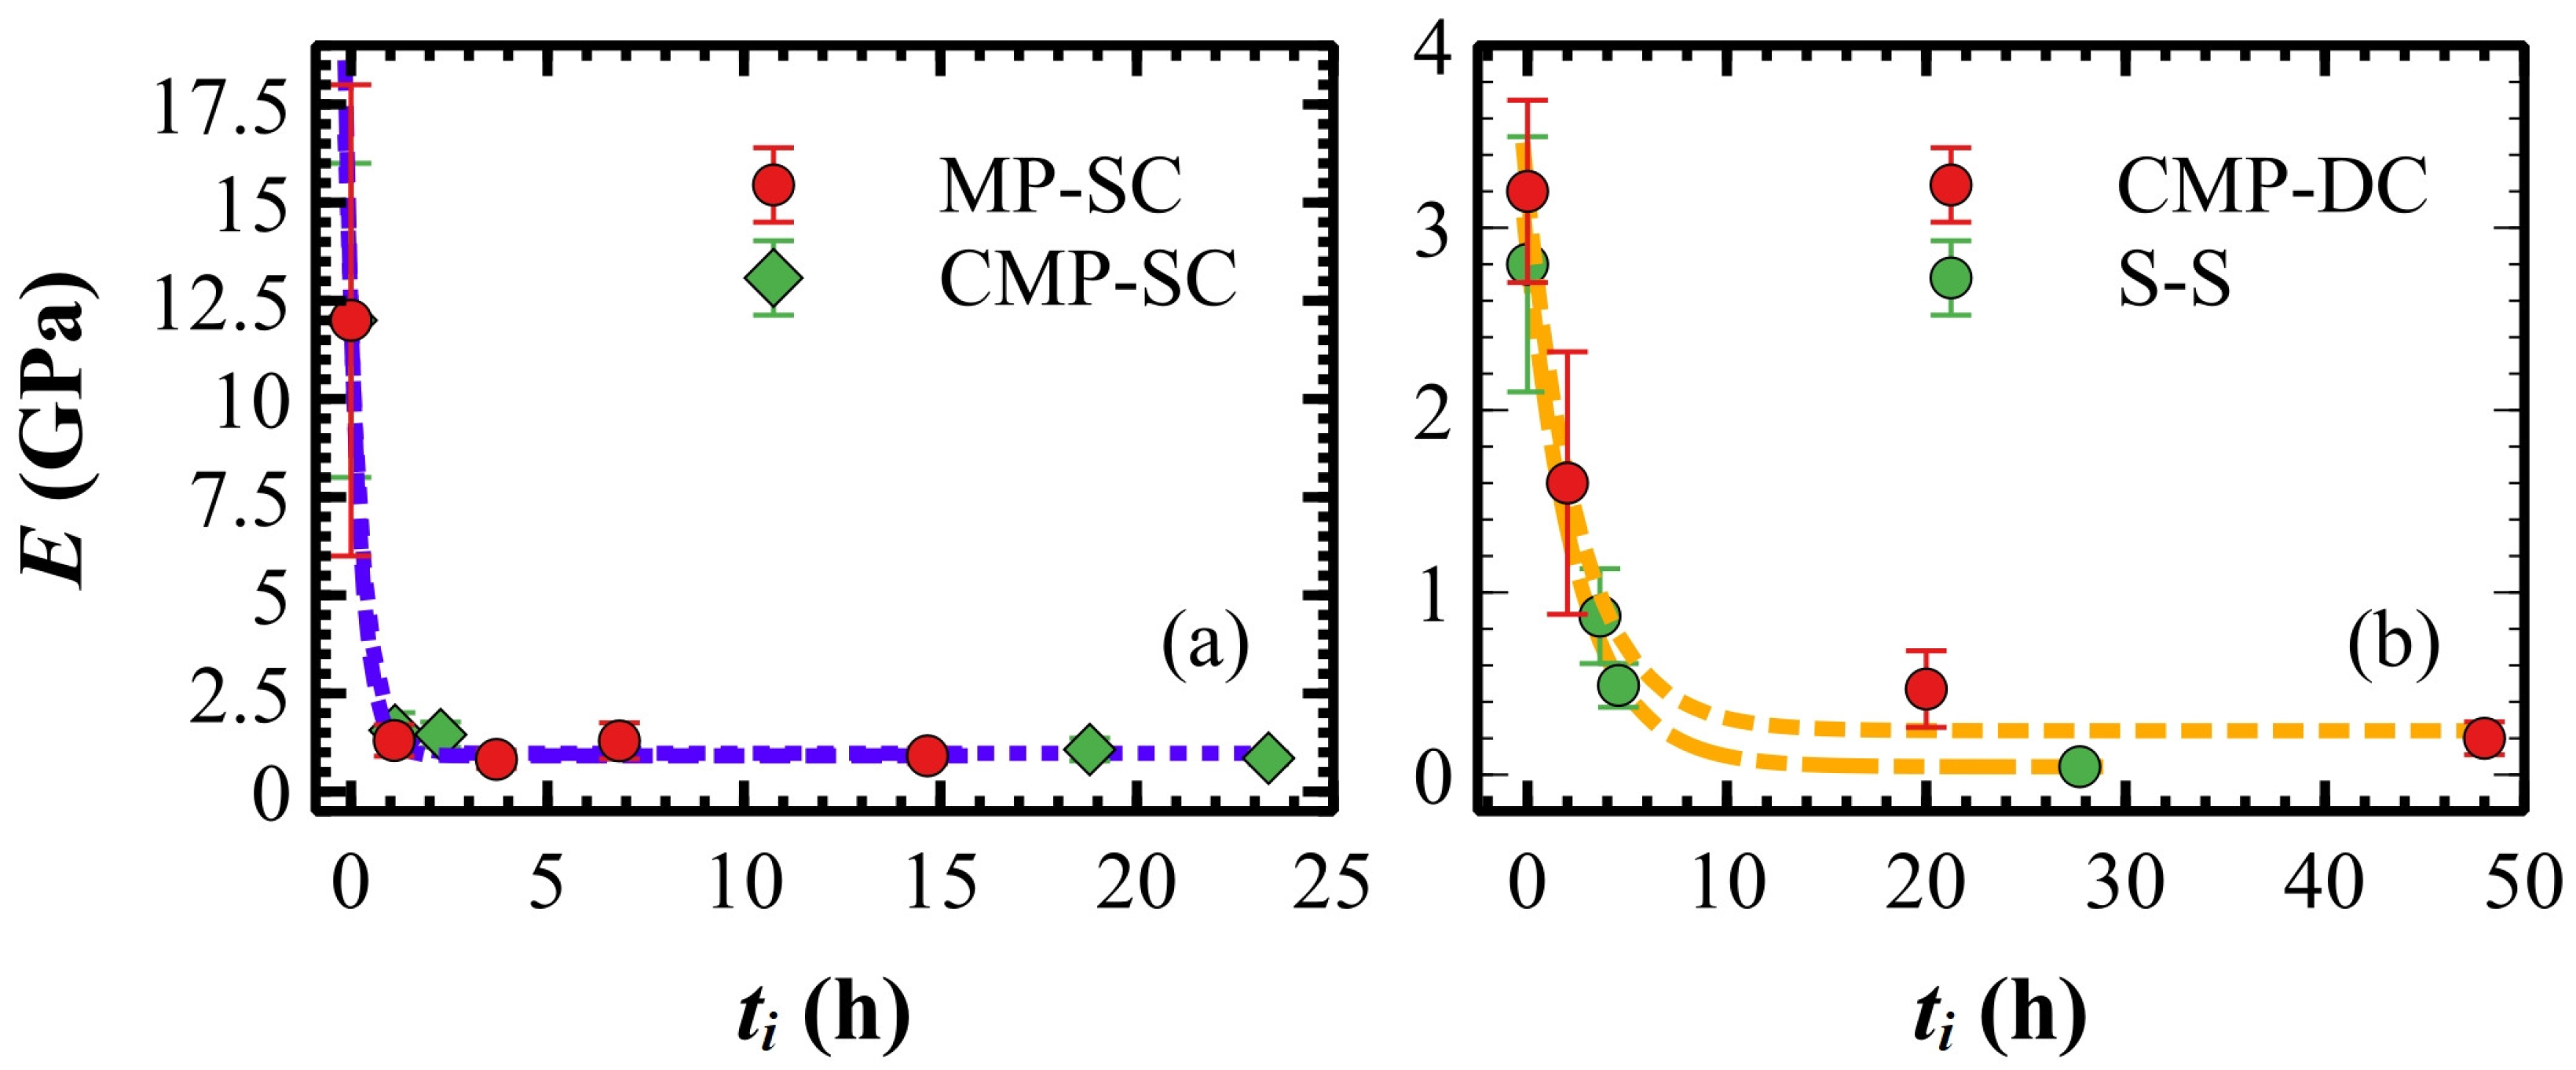
3.5. Elastic Modulus of Polymeric Films Measured in Liquid

When polymeric films are immersed in mQ water, a certain amount of water is soaked up into the film over time [86]. Film confinement leads to a decrease in the water diffusion coefficient [87], so ultrathin films are expected to be less permeable to water than thick ones. As shown in Figure 8, E decreases exponentially for increasing immersion time ti with a time constant t0, defining the minimum soaked time after which the mechanical properties of wet samples saturate to ES [88]. As expected, t0 and ES depend on the thickness hf (see Table 4): (i) ultrathin films show a shorter minimum soaked time t0 ≈ 0.37 h (Figure 8a) with respect to thick and drop-casted ultrathin films that take more time to soak up water, t0 ≈ 2.65 h (Figure 8b); (ii) wet samples reduce their elastic modulus by about 92% and notably by 98% for the S-S samples. By comparing ultrathin films deposited on the same substrate, viz., CMP-SC and CMP-DC samples, ES for the former is about four times larger than the latter (see Table 4) and, thus, the E ratio observed in the air is preserved in water (cp. to Table 3).
Films on the CMP substrates were used to test how the indentation δ changes for a fixed immersion time (ti ≈ 2 h). In the air, the CMP-SC films show a δ of ≈2.6 nm by applying a maximum force Fmax of ≈260 nN, whereas, after ≈2 h of immersion, the same indentation (δ ≈ 2.8 nm) is obtained with one-fifth of the force (Fmax ≈ 45 nN). On the CMP-DC films, δ is doubled after ti ≈ 2 h, increasing from ≈5.8 nm (in the air) to ≈10.6 nm (in water) by applying half of the force (240 vs. 110 nN). Such mechanical behavior is caused by the film swelling [14]. On featureless surfaces, like the CMP-SC and CMP-DC samples, the swelling is observable only by X-ray or ellipsometry measurements [14,89], whereas surfaces rich in morphological features is necessary for AFM measurements [90]. This is the case of MP-SC samples that are characterized by flat regions between deep scratches (cp. to Section 3.3) where swelling depends on the substrate morphology: it is large in flat regions and small within scratches due to the confinement effect of the scratch walls [91,92]. Such local film expansions produce an increase in the surface roughness Rq for all immersion times [92,93]. The roughness grows and saturates following an exponential saturating curve characterized by a time constant tR = (0.44 ± 0.16) (Figure 9, blue dashed line). Thanks to in situ FVMs, the same topographic profile crossing a deep scratch (>20 nm, taken as the reference) was collected in two consecutive FVMs at ti ≈ 1.03 and 1.1 h, i.e., where Rq starts to saturate. As shown in the inset of Figure 9, film swelling in the flat region is clearly visible. In situ FVMs performed in liquid also confirm that the film is water-insoluble (see sequence of images in Figure 9) [7]. As expected in liquid [83], Fadh and Wadh are largely reduced and constant for all the samples within experimental errors (see Table 4), confirming that capillary forces give the main contribution to the tip–sample adhesion.
In view of these results, the morphological interpretation reported in the introduction and envisaged in Ref. [6] appears to be correct. The swelling of the star copolymer network causes a stretching of the A, B, and C components. Depending on the cross-link density, the network architecture, and the polymer–solvent interaction, the swelling equilibrium is reached at different amounts of solvent uptake [92], making the film softer at the surface. Notably, the minimum soaked time t0 for thick films (2.65 h) includes 1.5 h for having high effectiveness of antimicrobial activity due to charges [7] and the stress time of bacteria membranes [12]. Lastly, the large reduction in E for the S-S samples might promote a conformal contact between the bacteria and film, thus enhancing all chemical/physical phenomena related to antimicrobial activity.

4. Conclusions

Star copolymer films were produced by spin-coating, drop-casting, and casting deposition techniques obtaining ultrathin and thick films, respectively. Drop-casted ultrathin and thick films were morphologically flat, while spin-coated ultrathin films had a morphology dependent on the substrate. In the case of a rough substrate, polymer films smoothed the substrate surface except for (relatively) deep scratches. The indentation hardness of such films was investigated by FVMs in both the air and liquid. In the air, ultrathin films were in the substrate-dominated zone and, thus, the elastic modulus E was overestimated, while E reached its bulk value for drop-casted ultrathin and thick films, specifically for thicknesses > 20 nm. The surface adhesion was correlated to the film thickness showing larger adhesion in ultrathin films with respect to drop-casted ultrathin and thick films. In liquid (water), E followed an exponential decay for all films with a minimum soaked time t0 of 0.37 and 2.65 h for ultrathin and drop-casted ultrathin and thick films, respectively. After this time, E saturated to a value that was reduced by about 92% or more for all films. Such film softening was caused by swelling. These results are consistent with the morphological picture envisaged in Ref. [6] and, moreover, suggest a role of mechanical properties in the antimicrobial activity. Since t0 is short with respect to the timescale of standard FVMs, Fast Force Mapping Mode [94] is indispensable for investigating the first two hours of the swelling process, which are crucial for understanding changes in film hardness.

Supplementary Materials

The following supporting information can be downloaded at https://www.mdpi.com/article/10.3390/ma17030592/s1, Figure S1: Structure of the two-branch, star-like copolymer m-PEG-P(MMA-ran-DMAEMA)2; Figure S2: Viscosity η0 of the A(BC)2 solution vs. the mass fraction x of A(BC)2 dissolved in the solution.; Figure S3: (a) Topographic AFM image of the interfacial region between the CMP substrate (dark region) and the ultrathin polymeric film (brighter region), (b) Exemplificative cross-sectional profile.; Figure S4: Intersections of adjacent peaks and valleys (purple horizontal lines) for a typical MP topographic profile. References [24,26,95,96] are cited in the Supplementary Materials.

Author Contributions

Conceptualization, C.A., L.I. and F.B.; methodology, C.A.; validation, C.A.; formal analysis, C.A.; investigation, C.A., G.V. and F.L.; resources, L.I., G.V. and F.B; data curation, C.A. and F.L.; writing—original draft preparation, C.A. and F.L.; writing—review and editing, C.A., L.I., G.V., M.S.S. and F.B. All authors have read and agreed to the published version of the manuscript.

Funding

This research received no external funding.

Institutional Review Board Statement

Not applicable.

Informed Consent Statement

Not applicable.

Data Availability Statement

Data are contained within the article and Supplementary Materials.

Acknowledgments

C.A. wishes to thank Maria Letizia Focarete, Francesco Valle, and Marco Brucale for useful suggestions and discussions and John B. Stephen for proofreading this manuscript. The data were analyzed by the GNU General Public Licensed Software QtiPlot (version 1.1.9) and the figures were prepared by the GNU General Public Licensed Software Veusz (version 3.6.2).

Conflicts of Interest

The authors declare no conflicts of interest.

References

  1. Gorrasi, G.; Stanzione, M.; Izzo, L. Synthesis and Characterization of Novel Star-like PEO-PMMA Based Copolymers. React. Funct. Polym. 2011, 71, 23–29. [Google Scholar] [CrossRef]
  2. Choi, Y.K.; Bae, Y.H.; Kim, S.W. Star-Shaped Poly(Ether-Ester) Block Copolymers: Synthesis, Characterization, and Their Physical Properties. Macromolecules 1998, 31, 8766–8774. [Google Scholar] [CrossRef]
  3. Izzo, L.; Pappalardo, D. “Tree-Shaped” Copolymers Based on Poly(Ethylene Glycol) and Atactic or Isotactic Polylactides: Synthesis and Characterization. Macromol. Chem. Phys. 2010, 211, 2171–2178. [Google Scholar] [CrossRef]
  4. Yang, Y.; Chen, M.; Li, H.; Li, H. The Degree of Crystallinity Exhibiting a Spatial Distribution in Polymer Films. Eur. Polym. J. 2018, 107, 303–307. [Google Scholar] [CrossRef]
  5. Wu, W.; Wang, W.; Li, J. Star Polymers: Advances in Biomedical Applications. Prog. Polym. Sci. 2015, 46, 55–85. [Google Scholar] [CrossRef]
  6. Vigliotta, G.; Mella, M.; Rega, D.; Izzo, L. Modulating Antimicrobial Activity by Synthesis: Dendritic Copolymers Based on Nonquaternized 2-(Dimethylamino)Ethyl Methacrylate by Cu-Mediated ATRP. Biomacromolecules 2012, 13, 833–841. [Google Scholar] [CrossRef] [PubMed]
  7. Matrella, S.; Vitiello, C.; Mella, M.; Vigliotta, G.; Izzo, L. The Role of Charge Density and Hydrophobicity on the Biocidal Properties of Self-Protonable Polymeric Materials. Macromol. Biosci. 2015, 15, 927–940. [Google Scholar] [CrossRef]
  8. Francolini, I.; Ruggeri, V.; Martinelli, A.; D’Ilario, L.; Piozzi, A. Novel Metal-Polyurethane Complexes with Enhanced Antimicrobial Activity. Macromol. Rapid Commun. 2006, 27, 233–237. [Google Scholar] [CrossRef]
  9. Sun, Y.; Sun, G. Novel Refreshable N-Halamine Polymeric Biocides: Grafting Hydantoin-Containing Monomers onto High Performance Fibers by a Continuous Process. J. Appl. Polym. Sci. 2003, 88, 1032–1039. [Google Scholar] [CrossRef]
  10. Mella, M.; Mollica, L.; Izzo, L. Influence of Charged Intramolecular Hydrogen Bonds in Weak Polyelectrolytes: A Monte Carlo Study of Flexible and Extendible Polymeric Chains in Solution and near Charged Spheres. J. Polym. Sci. Part B Polym. Phys. 2015, 53, 650–663. [Google Scholar] [CrossRef]
  11. Mella, M.; Izzo, L. Structural Properties of Hydrophilic Polymeric Chains Bearing Covalently-Linked Hydrophobic Substituents: Exploring the Effects of Chain Length, Fractional Loading and Hydrophobic Interaction Strength with Coarse Grained Potentials and Monte Carlo Simulat. Polymer 2010, 51, 3582–3589. [Google Scholar] [CrossRef]
  12. Izzo, L.; Matrella, S.; Mella, M.; Benvenuto, G.; Vigliotta, G. Escherichia Coli as a Model for the Description of the Antimicrobial Mechanism of a Cationic Polymer Surface: Cellular Target and Bacterial Contrast Response. ACS Appl. Mater. Interfaces 2019, 11, 15332–15343. [Google Scholar] [CrossRef] [PubMed]
  13. De Rosa, M.; Vigliotta, G.; Soriente, A.; Capaccio, V.; Gorrasi, G.; Adami, R.; Reverchon, E.; Mella, M.; Izzo, L. “Leaching or Not Leaching”: An Alternative Approach to Antimicrobial Materials via Copolymers Containing Crown Ethers as Active Groups. Biomater. Sci. 2017, 5, 741–751. [Google Scholar] [CrossRef] [PubMed]
  14. Singh, A.; Mukherjee, M. Swelling Dynamics of Ultrathin Polymer Films. Macromolecules 2003, 36, 8728–8731. [Google Scholar] [CrossRef]
  15. Stafford, C.M.; Vogt, B.D.; Harrison, C.; Julthongpiput, D.; Huang, R. Elastic Moduli of Ultrathin Amorphous Polymer Films. Macromolecules 2006, 39, 5095–5099. [Google Scholar] [CrossRef]
  16. Passeri, D.; Alippi, A.; Bettucci, A.; Rossi, M.; Tamburri, E.; Terranova, M.L. Indentation Modulus and Hardness of Polyaniline Thin Films by Atomic Force Microscopy. Synth. Met. 2011, 161, 7–12. [Google Scholar] [CrossRef]
  17. Passeri, D.; Bettucci, A.; Biagioni, A.; Rossi, M.; Alippi, A.; Tamburri, E.; Lucci, M.; Davoli, I.; Berezina, S. Indentation Modulus and Hardness of Viscoelastic Thin Films by Atomic Force Microscopy: A Case Study. Ultramicroscopy 2009, 109, 1417–1427. [Google Scholar] [CrossRef]
  18. Vogt, B.D.; Soles, C.L.; Lee, H.-J.; Lin, E.K.; Wu, W. Moisture Absorption and Absorption Kinetics in Polyelectrolyte Films:  Influence of Film Thickness. Langmuir 2004, 20, 1453–1458. [Google Scholar] [CrossRef]
  19. Stanford Nanofabrication Facility Cleaving Wafers and Substrates. Available online: https://www.youtube.com/watch?v=IRoIXjxIcBQ (accessed on 21 January 2024).
  20. Xia, J.; Yu, J.; Lu, S.; Huang, Q.; Xie, C.; Wang, Z. Surface Morphology Evolution during Chemical Mechanical Polishing Based on Microscale Material Removal Modeling for Monocrystalline Silicon. Materials 2022, 15, 5641. [Google Scholar] [CrossRef]
  21. Tyona, M.D. A Comprehensive Study of Spin Coating as a Thin Film Deposition Technique and Spin Coating Equipment. Adv. Mater. Res. 2013, 2, 181–193. [Google Scholar] [CrossRef]
  22. Mella, M.; Tagliabue, A.; Vaghi, S.; Izzo, L. Evidences for Charged Hydrogen Bonds on Surfaces Bearing Weakly Basic Pendants: The Case of PMMA–Ran–PDMAEMA Polymeric Films. Colloids Surfaces A Physicochem. Eng. Asp. 2021, 620, 126525. [Google Scholar] [CrossRef]
  23. Extrand, C.W. Spin Coating of Very Thin Polymer Films. Polym. Eng. Sci. 1994, 34, 390–394. [Google Scholar] [CrossRef]
  24. Meyerhofer, D. Characteristics of Resist Films Produced by Spinning. J. Appl. Phys. 1978, 49, 3993–3997. [Google Scholar] [CrossRef]
  25. Koryta, J. Diffusion. Mass Transfer in Fluid Systems; Cambridge University Press: Cambridge, UK, 1985; Volume 194, ISBN 0521871212. [Google Scholar]
  26. Chang, C.C.; Pai, C.L.; Chen, W.C.; Jenekhe, S.A. Spin Coating of Conjugated Polymers for Electronic and Optoelectronic Applications. Thin Solid Films 2005, 479, 254–260. [Google Scholar] [CrossRef]
  27. Bornside, D.E.; Macosko, C.W.; Scriven, L.E. Spin Coating of a PMMA/Chlorobenzene Solution. J. Electrochem. Soc. 1991, 138, 317–320. [Google Scholar] [CrossRef]
  28. Hall, D.B.; Underhill, P.; Torkelson, J.M. Spin Coating of Thin and Ultrathin Polymer Films. Polym. Eng. Sci. 1998, 38, 2039–2045. [Google Scholar] [CrossRef]
  29. Stull, D.R. Vapor Pressure of Pure Substances. Organic and Inorganic Compounds. Ind. Eng. Chem. 1947, 39, 517–540. [Google Scholar] [CrossRef]
  30. Cavallini, M.; Albonetti, C.; Biscarini, F. Nanopatterning Soluble Multifunctional Materials by Unconventional Wet Lithography. Adv. Mater. 2009, 21, 1043–1053. [Google Scholar] [CrossRef]
  31. Sader, J.E.; Chon, J.W.M.; Mulvaney, P. Calibration of Rectangular Atomic Force Microscope Cantilevers. Rev. Sci. Instrum. 1999, 70, 3967–3969. [Google Scholar] [CrossRef]
  32. Smolyakov, G.; Formosa-Dague, C.; Severac, C.; Duval, R.E.; Dague, E. High Speed Indentation Measures by FV, QI and QNM Introduce a New Understanding of Bionanomechanical Experiments. Micron 2016, 85, 8–14. [Google Scholar] [CrossRef]
  33. Garcia, R. Nanomechanical Mapping of Soft Materials with the Atomic Force Microscope: Methods, Theory and Applications. Chem. Soc. Rev. 2020, 49, 5850–5884. [Google Scholar] [CrossRef] [PubMed]
  34. Cappella, B.; Dietler, G. Force-Distance Curves by Atomic Force Microscopy. Surf. Sci. Rep. 1999, 34, 1–104. [Google Scholar] [CrossRef]
  35. Chiodini, S.; D’Avino, G.; Muccioli, L.; Bartolini, L.; Gentili, D.; Toffanin, S.; Albonetti, C. Self-Organization of Complete Organic Monolayers via Sequential Post-Deposition Annealing. Prog. Org. Coat. 2020, 138, 105408. [Google Scholar] [CrossRef]
  36. D’Costa, N.P.; Hoh, J.H. Calibration of Optical Lever Sensitivity for Atomic Force Microscopy. Rev. Sci. Instrum. 1995, 66, 5096–5097. [Google Scholar] [CrossRef]
  37. Nolte, A.J.; Treat, N.D.; Cohen, R.E.; Rubner, M.F. Effect of Relative Humidity on the Young’s Modulus of Polyelectrolyte Multilayer Films and Related Nonionic Polymers. Macromolecules 2008, 41, 5793–5798. [Google Scholar] [CrossRef]
  38. Ishiyama, C.; Higo, Y. Effects of Humidity on Young’s Modulus in Poly(Methyl Methacrylate). J. Polym. Sci. Part B Polym. Phys. 2002, 40, 460–465. [Google Scholar] [CrossRef]
  39. Bruker Corporation JPK Bio-Compatible Glue. Available online: https://www.bruker.com/en/products-and-solutions/microscopes/bioafm/bioafm-accessories/jpk-bio-compatible-glue.html (accessed on 21 January 2024).
  40. Nečas, D.; Klapetek, P. Gwyddion: An Open-Source Software for SPM Data Analysis. Cent. Eur. J. Phys. 2012, 10, 181–188. [Google Scholar] [CrossRef]
  41. Gualtieri, E.; Pugno, N.; Rota, A.; Spagni, A.; Lepore, E.; Valeri, S. Role of Roughness Parameters on the Tribology of Randomly Nano-Textured Silicon Surface. J. Nanosci. Nanotechnol. 2011, 11, 9244–9250. [Google Scholar] [CrossRef]
  42. Pace Technology. Abrasive Grinding Paper. 2011. Available online: https://www.metallographic.com/Brochures/SiCpaper.pdf (accessed on 21 January 2024).
  43. Gadelmawla, E.S.; Koura, M.M.; Maksoud, T.M.A.; Elewa, I.M.; Soliman, H.H. Roughness Parameters. J. Mater. Process. Technol. 2002, 123, 133–145. [Google Scholar] [CrossRef]
  44. Dagnall, H. Exploring Surface Texture; Rank Taylor Hobson: Leicester, UK, 1986; ISBN 090192007X. [Google Scholar]
  45. De, R.R.L.; Albuquerque, D.A.C.; Cruz, T.G.S.; Yamaji, F.M.; Leite, F.L. Measurement of the Nanoscale Roughness by Atomic Force Microscopy: Basic Principles and Applications. In Atomic Force Microscopy—Imaging, Measuring and Manipulating Surfaces at the Atomic Scale; Bellitto, V., Ed.; IntechOpen: Rijeka, Croatia, 2012; Chapter 7. [Google Scholar]
  46. Simpson, G.J.; Sedin, D.L.; Rowlen, K.L. Surface Roughness by Contact versus Tapping Mode Atomic Force Microscopy. Langmuir 1999, 15, 1429–1434. [Google Scholar] [CrossRef]
  47. Wu, W.; Wallace, W.E. Characterization of Planarity of Polymer Thin Films on Rough Surfaces. Scatt. Surf. Rough. II 1998, 3426, 222–228. [Google Scholar] [CrossRef]
  48. Miller, A.M.; Lemon, M.; Choffel, M.A.; Rich, S.R.; Harvel, F.; Johnson, D.C. Extracting Information from X-Ray Diffraction Patterns Containing Laue Oscillations. Z. Naturforschung B 2022, 77, 313–322. [Google Scholar] [CrossRef]
  49. Huang, T.C.; Gilles, R.; Will, G. Thin-Film Thickness and Density Determination from x-Ray Reflectivity Data Using a Conventional Power Diffractometer. Thin Solid Films 1993, 230, 99–101. [Google Scholar] [CrossRef]
  50. Garoff, S.; Sirota, E.B.; Sinha, S.K.; Stanley, H.B. The Effects of Substrate Roughness on Ultrathin Water Films. J. Chem. Phys. 1989, 90, 7505–7515. [Google Scholar] [CrossRef]
  51. Wu, P.; Chou, F. Complete Analytical Solutions of Film Planarization during Spin Coating. J. Electrochem. Soc. 1999, 146, 3819–3826. [Google Scholar] [CrossRef]
  52. Precision Devices, I. Surface Roughness Terminology and Parameters. Available online: www.predev.com/pdffiles/surface_roughness_terminology_and_parameters.pdf (accessed on 21 January 2023).
  53. Wei, J.; Verhaar, T.M.; Sarro, P.M. Pattern Transfer on a Vertical Cavity Sidewall Using SU8. J. Micromechanics Microengineering 2009, 19, 74018. [Google Scholar] [CrossRef]
  54. Stillwagon, L.E.; Larson, R.G.; Taylor, G.N. Planarization of Substrate Topography by Spin Coating. J. Electrochem. Soc. 1987, 134, 2030–2037. [Google Scholar] [CrossRef]
  55. Park, S.; Tsarkova, L.A. Surface Roughness-Mediated Ordering in Block Copolymer Films toward Spatially Controlled Patterns. Macromolecules 2017, 50, 6840–6848. [Google Scholar] [CrossRef]
  56. Zheng, W.; Yu, X.; Jin, Y. Considering Surface Roughness Effects in a Triangular Pore Space Model for Unsaturated Hydraulic Conductivity. Vadose Zo. J. 2015, 14, 1–13. [Google Scholar] [CrossRef]
  57. C. Grant Willson Spincoating. Available online: https://willson.cm.utexas.edu/Research/Sub_Files/Planarization/simulation.php (accessed on 4 September 2023).
  58. Valle, F.; Brucale, M.; Chiodini, S.; Bystrenova, E.; Albonetti, C. Nanoscale Morphological Analysis of Soft Matter Aggregates with Fractal Dimension Ranging from 1 to 3. Micron 2017, 100, 60–72. [Google Scholar] [CrossRef]
  59. Henry, C.; Minier, J.P.; Lefèvre, G. Numerical Study on the Adhesion and Reentrainment of Nondeformable Particles on Surfaces: The Role of Surface Roughness and Electrostatic Forces. Langmuir 2012, 28, 438–452. [Google Scholar] [CrossRef]
  60. Yu, Z.; Hwu, J.; Liu, Y.; Gauzner, G.; Lee, K.; Kuo, D. Study of Spin-Coated Resist Coverage on Nanoscale Topography Using Spectroscopic Ellipsometry. J. Appl. Phys. 2011, 110, 14303. [Google Scholar] [CrossRef]
  61. Hoffman, D. Measuring the Elastic Modulus of Polymers Using the Atomic Force Microscope. Master’s Thesis, Michigan Technological University, Houghton, MI, USA, 2010; 43p.
  62. Olubowale, O.H.; Biswas, S.; Azom, G.; Prather, B.L.; Owoso, S.D.; Rinee, K.C.; Marroquin, K.; Gates, K.A.; Chambers, M.B.; Xu, A.; et al. “may the Force Be with You!” Force-Volume Mapping with Atomic Force Microscopy. ACS Omega 2021, 6, 25860–25875. [Google Scholar] [CrossRef]
  63. Franz, C.M.; Taubenberger, A.; Puech, P.H.; Muller, D.J. Studying Integrin-Mediated Cell Adhesion at the Single-Molecule Level Using AFM Force Spectroscopy. Sci. STKE 2007, 2007, pl5. [Google Scholar] [CrossRef]
  64. Silbernagl, D.; Cappella, B. Mechanical Properties of Thin Polymer Films on Stiff Substrates. Scanning 2010, 32, 282–293. [Google Scholar] [CrossRef]
  65. Lin, Z.; Yu, Z.; Wei, Y. Measurement of Nanoindentation Properties of Polymers Considering Adhesion Effects between AFM Sharp Indenter and Material. J. Adhes. Sci. Technol. 2020, 34, 1591–1608. [Google Scholar] [CrossRef]
  66. Zak, S.; Trost, C.O.W.; Kreiml, P.; Cordill, M.J. Accurate Measurement of Thin Film Mechanical Properties Using Nanoindentation. J. Mater. Res. 2022, 37, 1373–1389. [Google Scholar] [CrossRef]
  67. Dokukin, M.E.; Sokolov, I. On the Measurements of Rigidity Modulus of Soft Materials in Nanoindentation Experiments at Small Depth. Macromolecules 2012, 45, 4277–4288. [Google Scholar] [CrossRef]
  68. Tranchida, D.; Piccarolo, S.; Soliman, M. Nanoscale Mechanical Characterization of Polymers by AFM Nanoindentations: Criticalr Approach to the Elastic Characterization. Macromolecules 2006, 39, 4547–4556. [Google Scholar] [CrossRef]
  69. Griepentrog, M.; Krämer, G.; Cappella, B. Comparison of Nanoindentation and AFM Methods for the Determination of Mechanical Properties of Polymers. Polym. Test. 2013, 32, 455–460. [Google Scholar] [CrossRef]
  70. Bruker QITM Makes AFM Easy—Perfect for Non-Experts, Beginners and Occasional Users. Available online: https://www.jpk.com/products/atomic-force-microscopy/qi-mode/pid4448 (accessed on 18 September 2023).
  71. Butt, H.-J.; Cappella, B.; Kappl, M. Force Measurements with the Atomic Force Microscope: Technique, Interpretation and Applications. Surf. Sci. Rep. 2005, 59, 1–152. [Google Scholar] [CrossRef]
  72. Chang, Y.R.; Raghunathan, V.K.; Garland, S.P.; Morgan, J.T.; Russell, P.; Murphy, C.J. Automated AFM Force Curve Analysis for Determining Elastic Modulus of Biomaterials and Biological Samples. J. Mech. Behav. Biomed. Mater. 2014, 37, 209–218. [Google Scholar] [CrossRef]
  73. Miyake, K.; Satomi, N.; Sasaki, S. Elastic Modulus of Polystyrene Film from near Surface to Bulk Measured by Nanoindentation Using Atomic Force Microscopy. Appl. Phys. Lett. 2006, 89, 31925. [Google Scholar] [CrossRef]
  74. Chang, J.; Toga, K.B.; Paulsen, J.D.; Menon, N.; Russell, T.P. Thickness Dependence of the Young’s Modulus of Polymer Thin Films. Macromolecules 2018, 51, 6764–6770. [Google Scholar] [CrossRef]
  75. Bassous, E. Fabrication of Novel Three-Dimensional Microstructures by the Anisotropic Etching of (100) and (110) Silicon. IEEE Trans. Electron Devices 1978, 25, 1178–1185. [Google Scholar] [CrossRef]
  76. Geng, K.; Yang, F.; Druffel, T.; Grulke, E.A. Nanoindentation Behavior of Ultrathin Polymeric Films. Polymer 2005, 46, 11768–11772. [Google Scholar] [CrossRef]
  77. Oommen, B.; Van Vliet, K.J. Effects of Nanoscale Thickness and Elastic Nonlinearity on Measured Mechanical Properties of Polymeric Films. Thin Solid Films 2006, 513, 235–242. [Google Scholar] [CrossRef]
  78. Dimitriadis, E.K.; Horkay, F.; Maresca, J.; Kachar, B.; Chadwick, R.S. Determination of Elastic Moduli of Thin Layers of Soft Material Using the Atomic Force Microscope. Biophys. J. 2002, 82, 2798–2810. [Google Scholar] [CrossRef]
  79. Torres, J.M.; Stafford, C.M.; Vogt, B.D. Impact of Molecular Mass on the Elastic Modulus of Thin Polystyrene Films. Polymer 2010, 51, 4211–4217. [Google Scholar] [CrossRef]
  80. Liu, H.; Liu, W.; Fujie, T.; Nakajima, K. Contact-Induced Stiffening in Ultrathin Amorphous Polystyrene Films. Polymer 2018, 153, 521–528. [Google Scholar] [CrossRef]
  81. Viville, P.; Deffieux, A.; Schappacher, M.; Leclère, P.; Brédas, J.L.; Lazzaroni, R. Influence of Tip Indentation Depth on the Adhesive Behavior of Viscoelastic Polydimethylsiloxane Networks Studied by Atomic Force Microscopy. Macromol. Symp. 2001, 167, 189–199. [Google Scholar] [CrossRef]
  82. Rezende, C.A.; Lee, L.T.; Galembeck, F. Surface Mechanical Properties of Thin Polymer Films Investigated by AFM in Pulsed Force Mode. Langmuir 2009, 25, 9938–9946. [Google Scholar] [CrossRef]
  83. Weisenhorn, A.L.; Hansma, P.K.; Albrecht, T.R.; Quate, C.F. Forces in Atomic Force Microscopy in Air and Water. Appl. Phys. Lett. 1989, 54, 2651–2653. [Google Scholar] [CrossRef]
  84. Tanaka, K.; Takahara, A.; Kajiyama, T. Film Thickness Dependence of the Surface Structure of Immiscible Polystyrene/Poly(Methyl Methacrylate) Blends. Macromolecules 1996, 29, 3232–3239. [Google Scholar] [CrossRef]
  85. Jiang, Y.; Turner, K.T. Measurement of the Strength and Range of Adhesion Using Atomic Force Microscopy. Extrem. Mech. Lett. 2016, 9, 119–126. [Google Scholar] [CrossRef]
  86. Yang, C.; Xing, X.; Li, Z.; Zhang, S. A Comprehensive Review on Water Diffusion in Polymers Focusing on the Polymer–Metal Interface Combination. Polymers 2020, 12, 138. [Google Scholar] [CrossRef] [PubMed]
  87. Buss, F.; Göcke, J.; Scharfer, P.; Schabel, W. From Micro to Nano Thin Polymer Layers: Thickness and Concentration Dependence of Sorption and the Solvent Diffusion Coefficient. Macromolecules 2015, 48, 8285–8293. [Google Scholar] [CrossRef]
  88. Chen, J.; Hu, H.; Li, S.; He, Y. Evolution of Mechanical Properties of Polypropylene Separator in Liquid Electrolytes for Lithium-Ion Batteries. J. Appl. Polym. Sci. 2018, 135, 46441. [Google Scholar] [CrossRef]
  89. Ogieglo, W.; Wormeester, H.; Eichhorn, K.J.; Wessling, M.; Benes, N.E. In Situ Ellipsometry Studies on Swelling of Thin Polymer Films: A Review. Prog. Polym. Sci. 2015, 42, 42–78. [Google Scholar] [CrossRef]
  90. Benaglia, S.; Drakopoulou, S.; Biscarini, F.; Garcia, R. In Operando Nanomechanical Mapping of PEDOT:PSS Thin Films in Electrolyte Solutions with Bimodal AFM. Nanoscale 2022, 14, 14146–14154. [Google Scholar] [CrossRef]
  91. Vasil’eva, V.I.; Kranina, N.A.; Malykhin, M.D.; Akberova, E.M.; Zhiltsova, A.V. The Surface Inhomogeneity of Ion-Exchange Membranes by SEM and AFM Data. J. Surf. Investig. 2013, 7, 144–153. [Google Scholar] [CrossRef]
  92. Metze, F.K.; Sant, S.; Meng, Z.; Klok, H.A.; Kaur, K. Swelling-Activated, Soft Mechanochemistry in Polymer Materials. Langmuir 2023, 39, 3546–3557. [Google Scholar] [CrossRef] [PubMed]
  93. Bonaccurso, E.; Graf, K. Nanostructuring Effect of Plasma and Solvent Treatment on Polystyrene. Langmuir 2004, 20, 11183–11190. [Google Scholar] [CrossRef] [PubMed]
  94. Murphy, J.G.; Raybin, J.G.; Ansay, G.E.; Sibener, S.J. Spatiotemporal Mapping of Hole Nucleation and Growth during Block Copolymer Terracing with High-Speed Atomic Force Microscopy. ACS Nano 2023, 17, 5644–5652. [Google Scholar] [CrossRef] [PubMed]
  95. Palma, D. Re: [Gwyddion-Users] Roughness Parameters. Available online: https://sourceforge.net/p/gwyddion/mailman/message/29363255/ (accessed on 21 January 2024).
  96. Metrology, S. An Introduction to Surface Roughness Measurement. Available online: https://www.spectrum-metrology.co.uk/surface-roughness/theory.php (accessed on 21 January 2024).
Figure 1. Topographic AFM images 10 × 10 µm2 of mechanical ((a), MP) and chemical mechanical ((b), CMP) polished wafer surfaces. The maximum value of false color map ruler is reduced by two orders of magnitude from MP to CMP, stressing roughness differences.
Materials 17 00592 g001
Figure 2. Typical topographic profile in the zx plane; z is the height variation and x is the direction orthogonal to polishing features, obtained by averaging 90 adjacent profiles from MP AFM images (continuous green line). One-dimensional analysis splits the profile into waviness (red dashed line) and roughness (blue dashed line) profiles that are characterized by an average amplitude Wa and wavelength λq and a root mean square roughness Rq1, respectively.
Materials 17 00592 g002
Figure 3. XRR scans of ultrathin polymeric films deposited on CMP and MP substrates at 3000, 3200, 3500, 3750, and 4000 rpm, respectively.
Materials 17 00592 g003
Figure 4. Topographic AFM images of polymeric films deposited by spin-coating on CMP (a) and MP (b) substrates at 3200 and 4000 rpm, respectively; drop-casting on CMP substrates (c); self-standing films, S-S, obtained by casting (d). All images are 1 × 1 µm2. Insets: topographic images at larger scale (3.5 × 3.5 µm2) to show morphological features of films (a) or their flatness (bd).
Materials 17 00592 g004
Figure 5. Sketches of solid films (green regions) cross-sections obtained by spin-coating on MP substrates (red regions) at ω = 3500 rpm (a) and 4000 rpm; (c) spin-coating on CMP substrates (c); (d) drop-casting on CMP substrates; (e) casting on Teflon Petri dish (self-standing film—S-S, cp. to Section 2.4). Polymeric films on MP substrates present several details on valleys, hf (V), and hills, hf (H), due to wetting that modulates locally the final film thickness hf. On flat regions, hf is thicker for low ω (a) and thinner for high ones (b), while in valleys it remains constant.
Materials 17 00592 g005
Figure 6. (a) Typical force F vs. Tip Sample Separation (TSS, approach curve—red, retraction curve—blue) obtained on polymeric films with all measurable parameters: Fmax, Fadh, δ, and Wadh (green area); (b) zoom of the approach curve (black) in the tip–sample contact region. In the first few nm, from 5 to −2 nm, the sample is elastically deformed by the tip and Hertz model fits properly the curve (red dashed line). Then, the sample begins to be plastically deformed at point T, where the curve changes its slope (pink dashed line). Inset: zoom of F vs. TSS curve near TSS = 0 (approach curve—red, retraction curve—blue) for highlighting the small curve hysteresis symptomatic of elastoplastic behavior of the film.
Materials 17 00592 g006
Figure 7. Young moduli E of polymeric films deposited by casting, drop-casting (DC), and spin-coating (SC) on CMP and MP substrates, except for self-standing films (S-S). Such values are compared to E of SiOx [75].
Materials 17 00592 g007
Figure 8. Exponential decay (dashed lines) of E vs. ti for ultrathin (a) and drop-casted ultrathin and thick (b) films. For convenience, ti measured in sexagesimal was converted in centesimal.
Materials 17 00592 g008
Figure 9. Exponential growth of Rq vs. ti (dashed blue line). The Rq value at ti = 0 was measured in air on the same sample but not in situ. For convenience, ti measured in sexagesimal was converted in centesimal. Inset: cross-sections across a flat region measured in the same position of the surface from two consecutive images (1.03 and 1.1 h). Below: sequence of topographic images collected for increasing ti in the same position (in situ, except the first one at ti = 0).
Materials 17 00592 g009
Table 1. Physical parameters of the A(BC)2 solution useful to calculate k from Equation (8) of Ref. [27].
A(BC)2 Data
T = 298.15 K
R = 82.06 atm·cm3·mol−1·K−1
Dg = 0.106 × 10⁻⁶ cm2·s−1 a
νg = 0.1553 cSt = 0.1553 × 10⁻² cm2·s−1 b
PCHCl3 = 26.271 kPa ≈ 0.26 atm c
MCHCl3 = 119.38 g·mol−1 d
ρ0 = 1.49 g·cm−3 e
C = 0.5474 f
a Dg is the binary diffusivity of the solvent in the overhead gas phase [28]; b νg is the kinematic viscosity of the overlying gas [28]; c PCHCl3 is the vapor pressure of pure chloroform (CHCl3) at temperature T [29]; d MCHCl3 is the molecular weight of chloroform; e ρ0 is the density of pure chloroform; f C depends on the Schmidt number of the overlying gas [27,28].
Table 2. Surface roughness parameters obtained by one-dimensional analysis of polymeric films deposited on MP and CMP substrates at increasing rotational speed ω. Average roughness Rq, planarization P, and peak-to-valley roughness sh are related to the whole surface, while root mean square wavelength λq, average amplitude Wq, and root mean square roughness Rq1 were obtained by one-dimensional analysis of averaged topographic profiles.
Ω (rpm)SubRq (nm)Wq (nm)λq (µm)Rq1 (nm)sh (nm)P (%)
3000CMP0.15 ± 0.025///≈0.14≈100
3200CMP0.19 ± 0.125///≈0.19≈100
3500MP6.4 ± 0.42.5 ± 1.90.60 ± 0.154.1 ± 0.818 ± 349 ± 17
3750MP4.5 ± 0.92.1 ± 0.70.98 ± 0.363.0 ± 1.313 ± 363 ± 25
4000MP4.0 ± 0.51.2 ± 0.20.65 ± 0.292.6 ± 0.49.3 ± 0.173 ± 13
Table 3. Sample properties extracted from F-TSS curves analysis: tip indentation δ, maximum force exercises by the tip Fmax, adhesion force Fadh, and work of separation Wsep [70].
Sampleδ (nm)Fmax (nN)Fadh (nN)Wsep (×10−17 J)E (GPa)
MP-SC1.6 ± 0.3121 ± 514 ± 16.8 ± 0.712 ± 6
CMP-SC2.6 ± 0.5257 ± 416.8 ± 1.68 ± 112 ± 4
CMP-DC4.2 ± 0.3120.4 ± 0.67.7 ± 0.13.6 ± 0.83.2 ± 0.5
S-S5.8 ± 0.5240 ± 18.2 ± 1.63.3 ± 0.62.8 ± 0.7
Table 4. Mechanical properties of films immersed in water.
Samplet0 (h)ES (Gpa)Fadh (nN)Wadh (×10−17 J)
MP-SC0.33 ± 0.080.91 ± 0.090.7 ± 0.21.1 ± 0.3
CMP-SC0.41 ± 0.130.97 ± 0.150.8 ± 0.21.3 ± 0.3
CMP-DC2.7 ± 0.80.24 ± 0.11.3 ± 0.61.2 ± 0.5
S-S2.6 ± 0.30.044 ± 0.0050.7 ± 0.31.1 ± 0.3
Disclaimer/Publisher’s Note: The statements, opinions and data contained in all publications are solely those of the individual author(s) and contributor(s) and not of MDPI and/or the editor(s). MDPI and/or the editor(s) disclaim responsibility for any injury to people or property resulting from any ideas, methods, instructions or products referred to in the content.

