Article

Nanocrystals Incorporated with Mordenite Zeolite Composites with Enhanced Upconversion Emission for Cu2+ Detection

School of Materials Science and Engineering, Tongji University, Shanghai 201804, China
*
Author to whom correspondence should be addressed.
Materials 2024, 17(4), 854; https://doi.org/10.3390/ma17040854
Submission received: 9 January 2024 / Revised: 8 February 2024 / Accepted: 9 February 2024 / Published: 11 February 2024
(This article belongs to the Section Porous Materials)

Abstract

:
In this research, upconversion nanocrystals incorporated with MOR zeolite composites were synthesized using the desilicated MOR zeolite as a host for the in situ growth of NaREF4 (RE = Y, Gd) Yb/Er nanocrystals. The structure and morphology of the composites were studied with XRD, XPS, and TEM measurements, and the spectral studies indicated that the subsequent thermal treatment can effectively improve the upconversion emission intensity of Er3+. By using the NaYF4:Yb/[email protected] composite that holds the strongest upconversion emission, a probe of UCNC@DSiMOR/BPEI was constructed with the modification of branched poly ethylenimine for the detection of Cu2+. It was indicated that the integrated emission intensity of Er3+ shows a linear dependence with the logarithm value of the Cu2+ concentration ranging from 0.1 to 10 μM. This study offered a feasible method for the construction of UCNC@zeolite composites with enhanced upconversion emission, which may have a potential application as fluorescent probes for the detection of various metal ions by adjusting the doping luminescent center.

1. Introduction

Among various photoluminescent materials, such as quantum dots, inorganic phosphors, metal–organic frameworks, and organic dyes, the lanthanide-doped upconversion nanocrystals (UCNCs) that can convert near-infrared light into short-wavelength light in the visible range have attracted great research interest. The unique properties of large anti-Stokes shifts, narrow emission peaks, and the superior photo stability of the lanthanide-doped UCNCs enable them to be applied in sensors, detection, displays, and lasers [1,2,3].
Multiple emissions of UCNCs can be readily realized to satisfy the application requirements by selecting the rare earth (RE) activator, for example, Tm3+ for blue emission and Er3+ or Ho3+ for red and green emissions [4,5]. In addition, the structure and composition of the host nanocrystal are key factors to generate efficient upconversion emissions. Previous studies strongly suggested that NaYF4 and NaGdF4 are desirable hosts due to their low-phonon energy that can effectively suppress the non-radiative relaxation, high solubility for RE ions, and high thermal stability [6,7]. Another common problem encountered by the small UCNCs is the strong surface luminescence quenching due to a high surface to volume ratio [8,9,10]. The coating of the inert shell on the active core UCNCs is a generally used method to spatially separate the activators and the surface quenching centers and thus greatly improve the upconversion emission intensity [11,12]. It was reported that the lanthanide-doped NaGdF4 is wrapped with a CaF2 shell on its surface, and the heterogeneous structure of the CaF2 shell greatly enhances its upconversion emission [13]; the growing of an inert NaGdF4 shell can effectively improve the upconversion emission intensity of NaYF4:Yb,Er@NaGdF4:Yb,Nd core–shell UCNCs under both 808 and 980 nm excitations [14]. Furthermore, the construction of UCNC-based nano–micro composites is an alternative strategy to obtain desirable upconversion emissions and even realize new functions. For example, the upconversion nanocrystals were combined with metal–organic frameworks (MOFs) to improve their luminescence performance for theranostic applications [15]; the flexible polystyrene (PS) sphere array @UCNC composite was fabricated via self-assembly to promote the upconversion process for the sensing of acetic acid gas [16]. Besides MOFs and organics, the UCNCs can also be combined with various inorganics to construct functional composites for various potential applications.
Zeolites are crystalline aluminosilicates with more than 200 topology structures, which have been widely applied in the fields of catalysis, adsorption, and drug delivery. In recent years, many of the zeolites have received great research interest for the synthesis of functional composites because of their regular porous framework, which is capable of incorporating various nanoparticles [17,18,19]. It was reported that zeolites can be used as a matrix for various nano-sized metal and oxides to construct nanoparticle@zeolite composites, which not only improved the properties of individual nanoparticles but also endowed the composites with new functions [20]. For example, Pd nanoparticles were successfully encapsulated in MCM-41, selective thermal treatment during synthesis via the microwave method allowed Pd nanoparticles to enter into zeolite pores without aggregating on the outside, and, meanwhile, the crystal structure of the zeolite was not altered after microwave treatment, which provided a novel path for the design and development of composite materials and excellent size selectivity in catalytic reactions [21]. An LTA zeolite doped with titanium dioxide was prepared via the hydrothermal method and used as electrochemical catalyst for detecting H2O2 [22]. Generally, the pore size of pristine zeolites is in the molecular scale of 0.3–1.5 nm, which may limit their application as carriers for the incorporation of nanoparticles [23]. Thereafter, some post-treatments like desilication and dealumination have been applied to enlarge the pore size and create more mesopores to benefit the loading of various nanoparticles [24,25,26]. For example, the dealuminated Zeolite 13X was used to load CeO2 nanoparticles to prepare composites for the effective degradation of caffeine [27] and the desilicated FAU-Y and ZSM-5 zeolites were used as target zeolites for the in situ growth of UCNCs for gallic acid detection or drug delivery monitoring [14,28]. A benefit for the flexible control of the upconversion emission spectral profile is that by selecting the luminescence center, like Tm3+, Ho3+, and Er3+, it is expected that the UCNC-loaded zeolites can be developed as sensitive probes for the detection of various chemicals in aqueous solutions.
The monitoring of the Cu2+ level in water is an important environmental issue, and fluorescence spectroscopy can be used to detect metal ions with a high sensitivity, low cost, and simplicity. So far, fluorescent probes have been developed for the selective detection of Cu2+, like the rhodamine derivative of poly ethylene glycol (PEG)- neridronate, rhodamine B hydrazide (RBH), and ethylene imine polymer (PEI) modified UCNCs [29,30,31]. In this research, UCNCs incorporated with MOR zeolite composites of UCNC@DSiMOR were synthesized using the desilicated MOR zeolite as host for the in situ growth of NaREF4 (RE = Y, Gd) Yb3+/Er3+ nanocrystals, which showed improved upconversion emissions after further thermal treatment. Using branched poly ethylenimine (BPEI) combined with NaYF4:Yb/[email protected] as a fluorescent probe, the level of Cu2+ in water can be effectively and accurately detected.

2. Materials and Methods

2.1. Materials

The sodium form mordenite zeolite was supplied by Thermo Scientific Chemical Co., Ltd, Shanghai, China. YCl3·6H2O (99.99%), YbCl3·6H2O (99.99%), ErCl3·6H2O (99.99%), GdCl3·6H2O (99.99%), NH4F (99.99%), oleic acid (OA, 90%), sodium oleate (NaOA, >97%), 1-octadecene (ODE, 90%), sodium hydroxide (NaOH, 97%), CuCl2·2H2O (AR), Na2SO4 (AR), ethanol (AR), methanol (99.9%), and cyclohexane (AR) were purchased from Aladdin Chemical Co., Ltd. FeCl3·6H2O (AR), MnCl2·4H2O (AR), MgCl2·6H2O (AR), CaCl2 (AR), KCl (AR), NaCl (AR), NaF (AR), Na2CO3 (AR), and hydrochloric acid (HCl, AR) were purchased from Sinopharm Chemical Reagent Co., Ltd., Shanghai, China. The branched poly ethylenimine (BPEI, M.W. 25,000, 30% in water) was purchased from Tansolo Co., Ltd., Shanghai, China. All chemical reagents were used without further purification.

2.2. Desilication of Mordenite Zeolite

The mordenite zeolite was modified through desilication upon alkaline treatment in NaOH solution to increase the porosity. Each 1 g of the parent zeolite was stirred in 30 mL of NaOH aqueous solution with different concentrations of 1.0 and 2.0 mol/L at 85 °C for 2 h. After that, the obtained suspensions were cooled down to room temperature, filtered, and washed with deionized water. The final products were collected via centrifugation before drying at 60 °C for 24 h. According to the NaOH aqueous solution concentration, the alkali-treated zeolites were labeled as DSixMOR, where x = 1.0, 2.0, respectively. The purchased sodium form mordenite zeolite was labeled MOR.

2.3. Synthesis of NaREF4:Yb/Er (RE = Y, Gd) @DSixMOR Composites

The UCNC@DSixMOR composite was prepared via the impregnation of DSixMOR in the synthesis of NaYF4:Yb/Er nanocrystals with the coprecipitation method, for the growth of NaYF4:Yb/Er in the cages of DSixMOR. In the first step, 1 mmol of RE chlorides was mixed with 6 mL OA and 15 mL ODE in a three-necked flask. The RE chlorides included 0.18 mmol YbCl3·6H2O, 0.02 mmol ErCl3·6H2O, and 0.8 mmol YCl3·6H2O. After that, the solution was mixed for 30 min in 160 °C under an argon atmosphere to dissolve the RE chlorides. After cooling down to 40 °C, 0.25 g of DSixMOR was added into the flask and stirred for 90 min. Then, 10 mL methanol solution of NaOA (0.7611 g) and 10 mL methanol solution of NH4F (0.1482 g) were added into this solution respectively. The solution was slowly heated up to 65 °C and all of the methanol was removed. Next, the solution was heated for 30 min at 280 °C under an argon atmosphere. After the solution was cooled down to room temperature, the composites were collected via centrifugation and washed with ethanol three times before being dried at 60 °C for 24 h. Finally, the obtained composites were heat-treated at 400 °C for 150 min to obtain an improved upconversion emission from Er3+. The resulting composites were named as NaYF4:Yb/Er@DSixMOR and NaYF4:Yb/Er@DSixMOR-HT, respectively.
NaGdF4:Yb/Er@DSixMOR and NaGdF4:Yb/Er@DSixMOR-HT were synthesized using GdCl3·6H2O instead of YCl3·6H2O at the initial synthesis step; the other synthesis conditions were the same.

2.4. Detection of Cu2+

2.4.1. Surface Modification of NaYF4:Yb/[email protected] Composite

For the preparation of the luminescence probe, the NaYF4:Yb/[email protected] was modified with BPEI. Firstly, the NaYF4:Yb/[email protected] was added into 0.05 M HCl solution with stirring for 20 h to remove the oleate ligand from the surface and then washed with water 3 times. After centrifugation, the solids were added into water followed by the addition of 0.4 mM BPEI and stirring for 20 h at 25 °C to modified BPEI on NaYF4:Yb/[email protected]. Finally, NaYF4:Yb/[email protected]/BPEI composites were collected via centrifugation, washed with water, and dried at 60 °C for 24 h. The resulting samples were named UCNC@DSiMOR/BPEI.

2.4.2. Detection of Cu2+ by Using the NaYF4:Yb/[email protected]/BPEI Composite

In terms of the detection of Cu2+, NaYF4: Yb/Er @DSi1.0MOR-HT/BPEI composites were added into different concentrations (0.1 to 10 μM) of CuCl2·2H2O solutions. Then, the upconversion spectra of luminescence probes were measured under 980 nm excitation. Additionally, to indicate the principle of detection, we added 0.4 mM BPEI into 1 mM CuCl2·2H2O solution and measured the UV-Vis NIR absorption spectra.

2.4.3. Anti-Interference Test

To validate the sensitivity and selectivity for the probing of Cu2+ in aqueous solutions, various potential interference substances, including Fe3+, Mn2+, Mg2+, Ca2+, K+, Cl, F, CO32−, and SO42−, were chosen for an anti-interference test of UCNC/BPEI. For the fluorometric assay, all the other conditions were kept the same except that the concentrations of metal ions and the anion solution were settled to 100 μM. The probe without adding any substances was set as a blank control.

2.5. Characterization

X-ray diffraction (XRD) analyses were recorded on a Rigaku Smartlab9 diffractometer with Cu-Kα radiation (λ = 1.5406 Å, 40 KV/150 mA). The N2 adsorption–desorption isotherm of the zeolite samples was measured via a Micromeritics ASAP2020, Atlanta, GA, USA, at 77 K. And the total surface area was calculated using the Brunauer–Emmett–Teller (BET) method, while the t-plot method was used to determine the surface area of micropores and mesopores. The pore size distribution was derived from the Barrett–Joyner–Halenda (BJH) model. X-ray photoelectron spectroscopy (XPS) characterization was carried out on a Thermo ESCALAB 250XI using Al Kα X (ℎν = 1486.6 eV, 650 μm of beam spot) as the incident radiation source, and the electron flood gun was used to minimize surface charging. The ion content in the final alkaline treatment solution was determined via inductively coupled plasma optical emission spectroscopy (ICP-OES), (ICP-8300, PerkinElmer, America). Transmission electron microscope (TEM) analyses were carried out on a JEM-2100F TEM instrument. The upconversion spectra were measured using a set of well-aligned instruments (Zolix Instruments Co. Ltd.), and the 980 nm laser was used as excitation source. The UV-Vis NIR absorption spectra were recorded using a fluorescence spectrophotometer (U-4100).

3. Results and Discussion

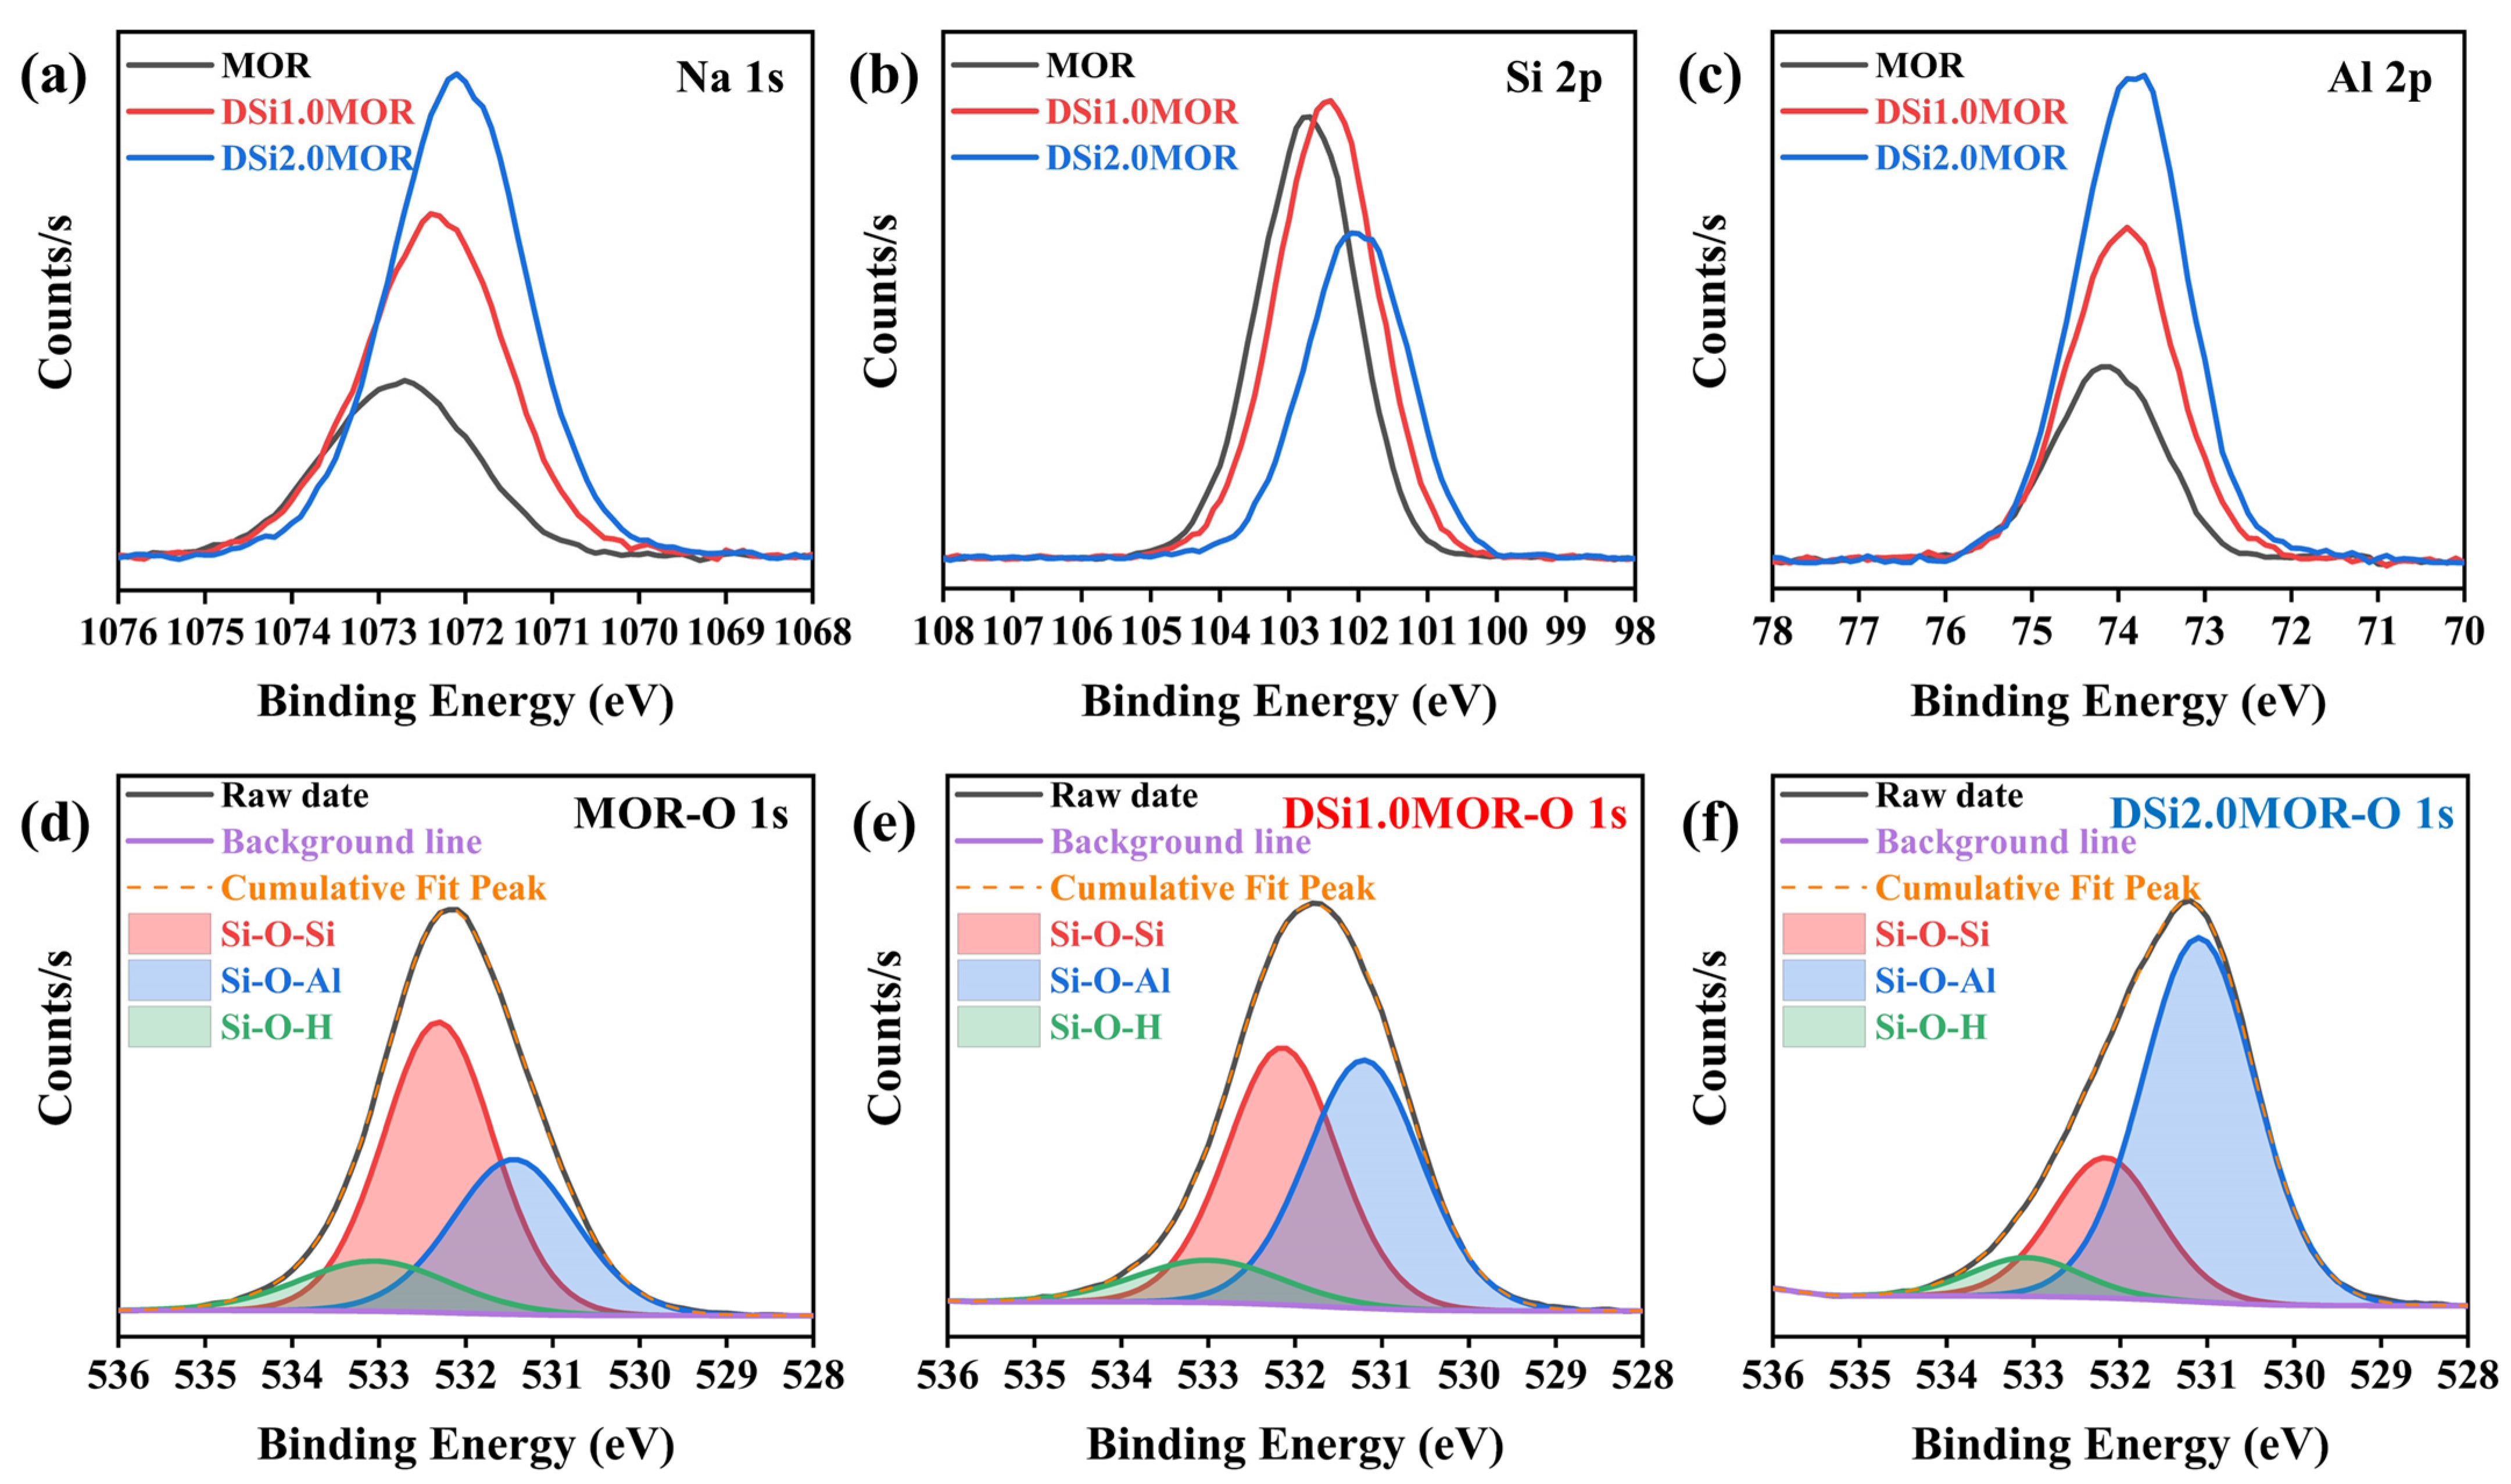
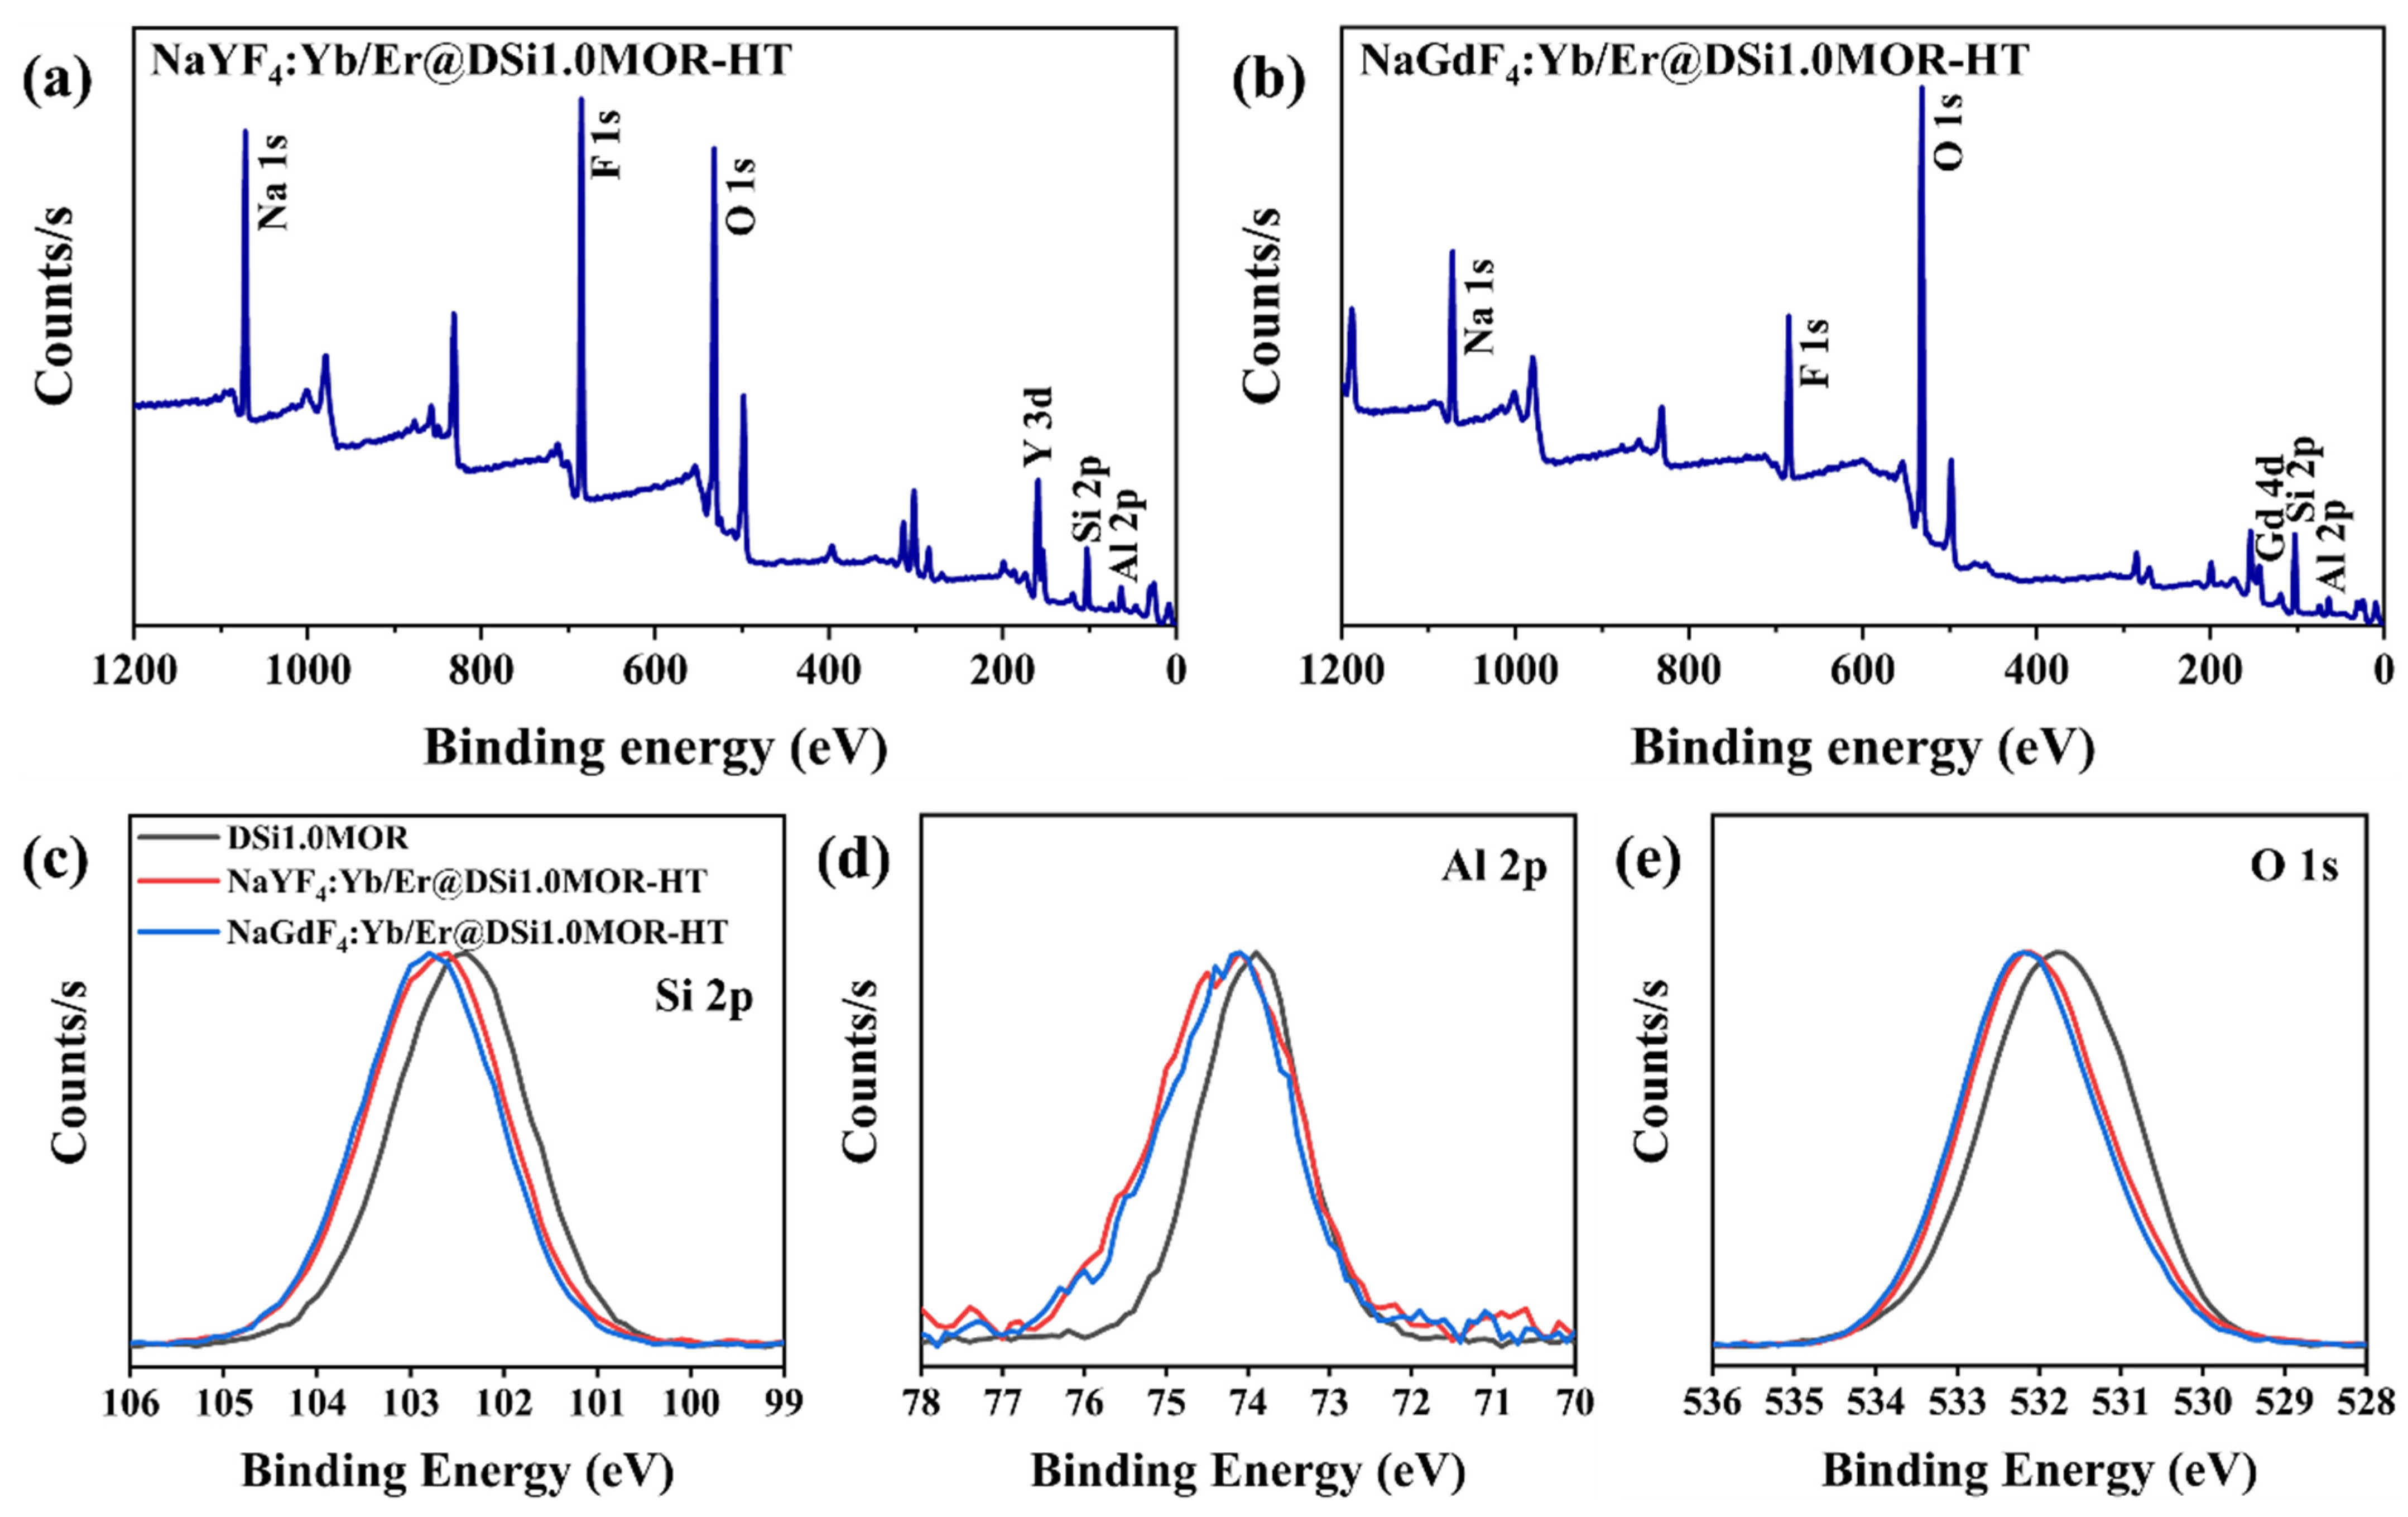
3.1. Structure and Morphology

The influence of desilication on the structure of the parent MOR zeolite was firstly studied with XRD measurement and is shown in Figure 1. The XRD patterns of DSi1.0MOR and DSi2.0MOR are in accordance with that of the parent zeolite; it is noticable that the diffraction peak intensity of DSi1.0MOR is very strong, while that of DSi2.0MOR is extremely weak, which indicates that the alkali treatment at a concentration of 2.0 M had already destroyed the zeolite structure. Therefore, DSi1.0MOR was chosen as the target zeolite for the subsequent UCNC growth. DSi1.0MOR ensures a well-defined structure for the construction of composites incorporating UCNCs, while mesopores provide space for the growth of UCNCs without structural constraints. It can be seen from Table 1 that DSi1.0MOR exhibits a decreased specific surface area, but its mesopore surface area, mesopore volume, and average mesopore size are increased, which suggested the successful creation of enlarged mesopores upon alkali treatment [32,33]. The removal of Si atoms from the framework led to the creation of voids and larger cavities within the zeolite structure. Compared with the parent MOR zeolite, DSi1.0MOR can offer improved accessibility for larger molecules. This is crucial for applications like adsorption and detection, where bulky reactants or products need efficient diffusion within the probe materials.
For further understanding the effect of alkali treatment on the elemental composition and chemical state of the parent MOR zeolite, the XPS measurement was carried out on MOR, DSi1.0MOR, and DSi2.0MOR, respectively. Figure 2a–f exhibit the high-resolution XPS spectra of Na 1s, Si 2p Al 2p, and O 1s, according to which the atomic percentages of each element were calculated, which are listed in Table 2. It can be seen that the atomic percentage of Si decreases in the alkali-treated zeolites and the corresponding Si/Al ratio obviously decreased in DSi1.0MOR and DSi2.0MOR, suggesting the successful removal of Si from the parent MOR zeolite. This is also consistent with the monotonously increased Si concentration in the alkaline treatment solution after a reaction measured using ICP (Table S1). Moreover, it is noticed from the high-resolution XPS spectra that the photoelectron peaks of Na 1s, Si 2p Al 2p, and O 1s all showed negative shifts in DSi1.0MOR and DSi2.0MOR compared with in the parent MOR zeolite; the binding energies of Na 1s, Si 2p Al 2p, and O 1s all shift in the same direction with changes in the Si/ Al ratio. This binding energy shift can be explained in terms of a charge transfer in the zeolite lattice. Zeolite desilication causes the removal of Si atoms and the breaking of Si-O-Si bonds and increases the Si-O-Al bond percentage of the zeolite framework. As shown in Figure 3d–f, the high-resolution XPS spectra of O 1s can be deconvoluted into three components that can be attributed to Si-O-Si, Si-O-Al, and Si-O-H, respectively. As the concentration of the NaOH solution increases, the proportion of Si-O-Si bonds decreases and the proportion of Si-O-Al bonds increases, accompanied by a decrease in Si-O-H bonds, indicating that the removal of Si atoms lead to an increased Si-O-Al bond percentage [34,35]. It is estimated that the Si-O-Al percentages in MOR, DSi1.0MOR, and DSi2.0MOR are 32.6%, 45.3%, and 68.4%, respectively. In this case, the negative binding energy shifts of Na 1s, Si 2p, Al 2p, and O 1s of the desilicated MOR zeolites can be attributed to the increase in negative charge due to the increase in Si-O-Al bonds, and the lower the Si/Al ratio, the more negative the binding energy shift [36,37].
After the in situ growth of UCNCs in the DSi1.0MOR zeolite and the subsequent thermal treatment, the structures of the compounds were firstly characterized with XRD measurements. As shown in Figure 3a, the XRD patterns of NaYF4:Yb/[email protected] and NaYF4:Yb/[email protected] both maintain the typical diffraction peaks belong to the MOR zeolite, and meanwhile the diffraction peaks only assigned to α-NaYF4 and assigned to both α-NaYF4 and β-NaYF4 nanocrystals can be observed before and after the thermal treatment, respectively, due to the heat treatment-induced phase transition [38]. The XRD patterns for NaGdF4:Yb/[email protected] and NaGdF4:Yb/[email protected] composites show similar characteristics, which both keep the diffraction peaks belong to the MOR zeolite together with additional diffraction peaks assigned to NaGdF4. It is noticed that the (110) and (101) plane diffractions of NaGdF4 can be clearly discriminated after thermal treatment, indicating an increased crystal size. The TEM images of NaYF4: Yb/Er @DSi1.0MOR-HT and NaGdF4: Yb/Er @DSi1.0MOR-HT in Figure 3c,d both show some black dots on DSi1.0MOR substrates, and no free nanoparticles can be observed. The locally magnified high-resolution TEM images reveal the fine crystalline structure of the black dots, as shown in Figure 3(c2,d2); the lattice spacing of 0.297 nm well corresponds to the (110) plane of NaYF4, and the lattice space of 0.297 nm is in good accordance with the (101) plane of NaGdF4.
Moreover, the XPS measurement was carried out and the survey spectra of NaREF4:Yb/[email protected] (RE = Y, Gd) are shown in Figure 4a,b, from which the Na 1s, Si 2p, Al 2p, and O 1s photoelectron peaks belonging to DSi1.0MOR and the F 1s, Y 3d, and Gd 4d photoelectron peaks belonging to NaREF4 can be observed, respectively. The high-resolution XPS spectra of Si 2p, Al 2p, and O 1s in Figure 4c–e show that the photoelectron peaks of the elements that constitute the host zeolite all positively shift in NaREF4:Yb/[email protected] compared with those in DSi1.0MOR. The increased banding energies of Si 2p, Al 2p, and O 1s in NaREF4:Yb/[email protected] (RE = Y, Gd) composites imply that the constitution ions of DSi1.0MOR have undergone a charge transfer with the NaREF4:Yb/Er nanocrystal and therefore the existing chemical complex between them [39,40,41].

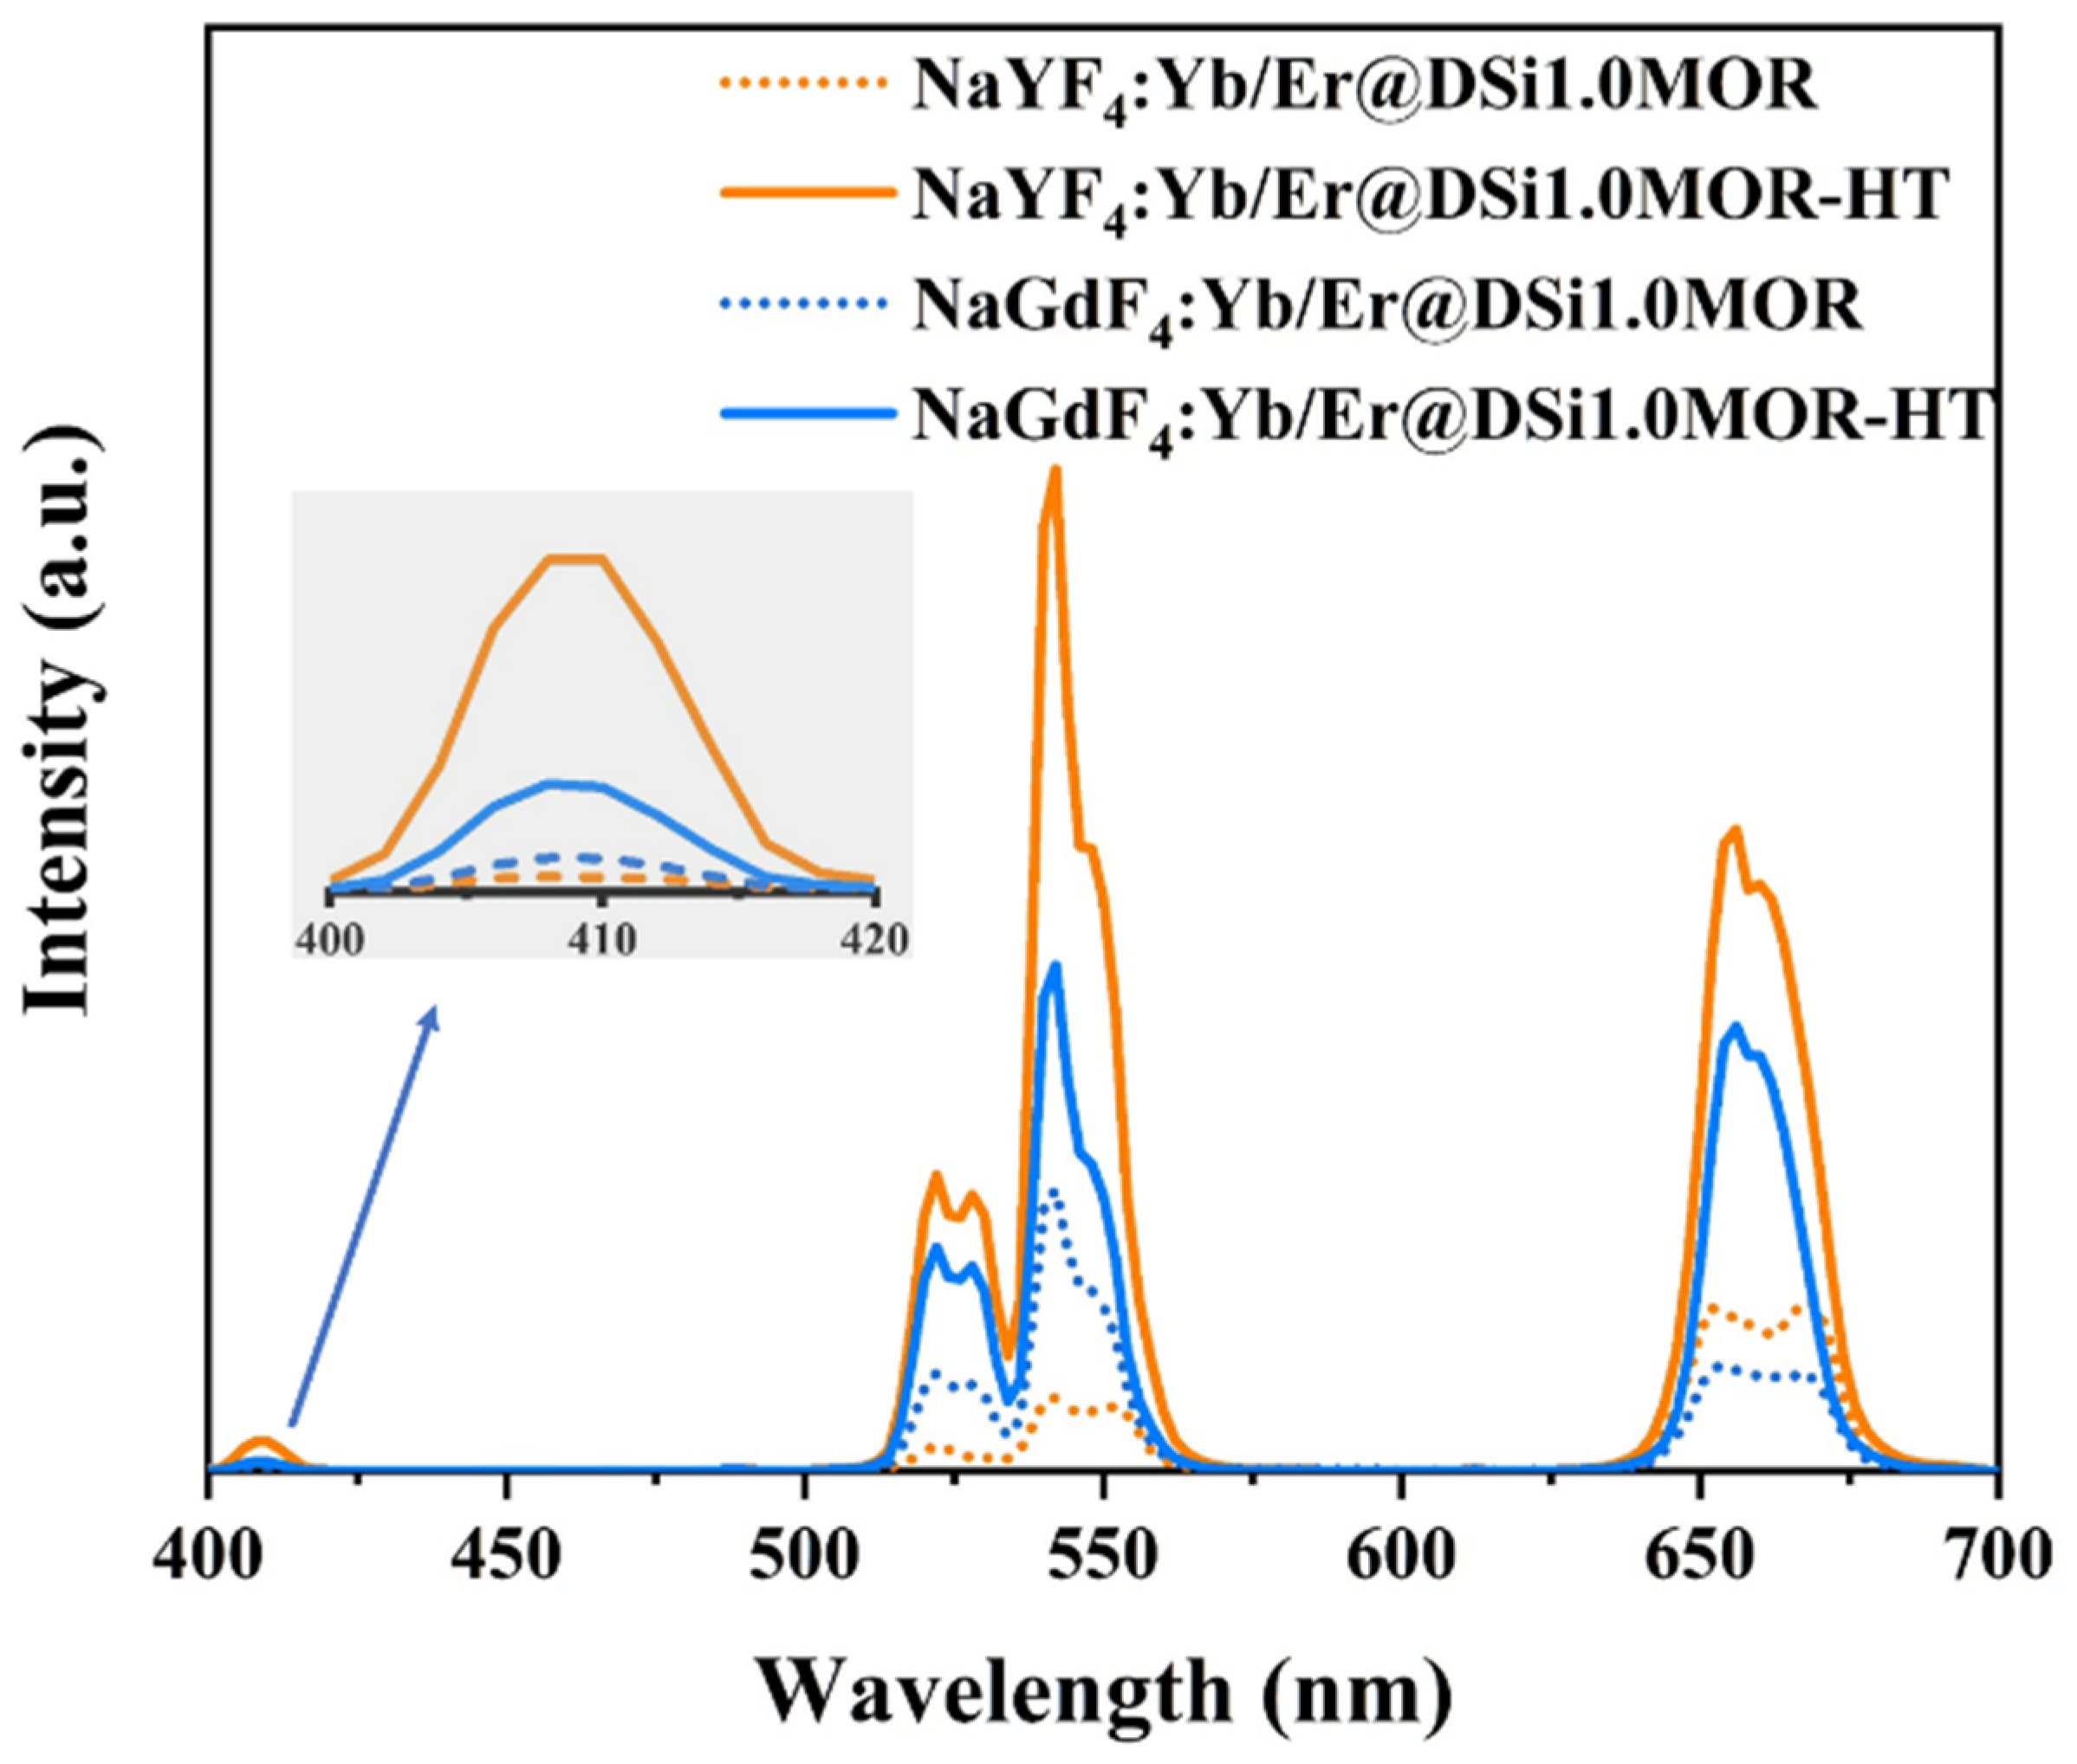
3.2. Upconversion Properties

Under the excitation of a 980 nm laser, the upconversion luminescence spectrum of NaREF4:Yb/[email protected] exhibits a characteristic emission of Er3+ in the visible region, in which the emission peaks located at 521, 542, and 654 nm can be well attributed to the radiative transitions of Er3+: 2H11/24I15/2, 4S3/24I15/2, and 4F9/24I15/2, respectively, as shown in Figure 5 [42,43]. After heat treatment, the upconversion emission intensity of Er3+ is drastically enhanced; even Er3+: 2H9/24I15/2 radiative transition at 409 nm can be clearly observed in NaREF4:Yb/[email protected]. It is estimated from the emission spectra that the heat treatment-induced enhancements in emission intensity are 4.9 and 2.2 times for NaYF4:Yb/[email protected] and NaGdF4:Yb/[email protected], respectively. According to previous studies, proper thermal treatment can promote the formation of tightly combined interfaces between the nanocrystals and the host zeolite, which can effectively modify the surface defects of the nanocrystals, and thus the improved upconversion emission can be obtained [28]. However, the increase in nanocrystal size after thermal treatment can also reduce the non-radiative relaxation probability of the surface RE ions and contributes to the strong upconversion emission [14,44]. As shown in Figure 5, the upconversion emission intensity of Er3+ is strongest in NaYF4:Yb/[email protected] among these four considered samples.

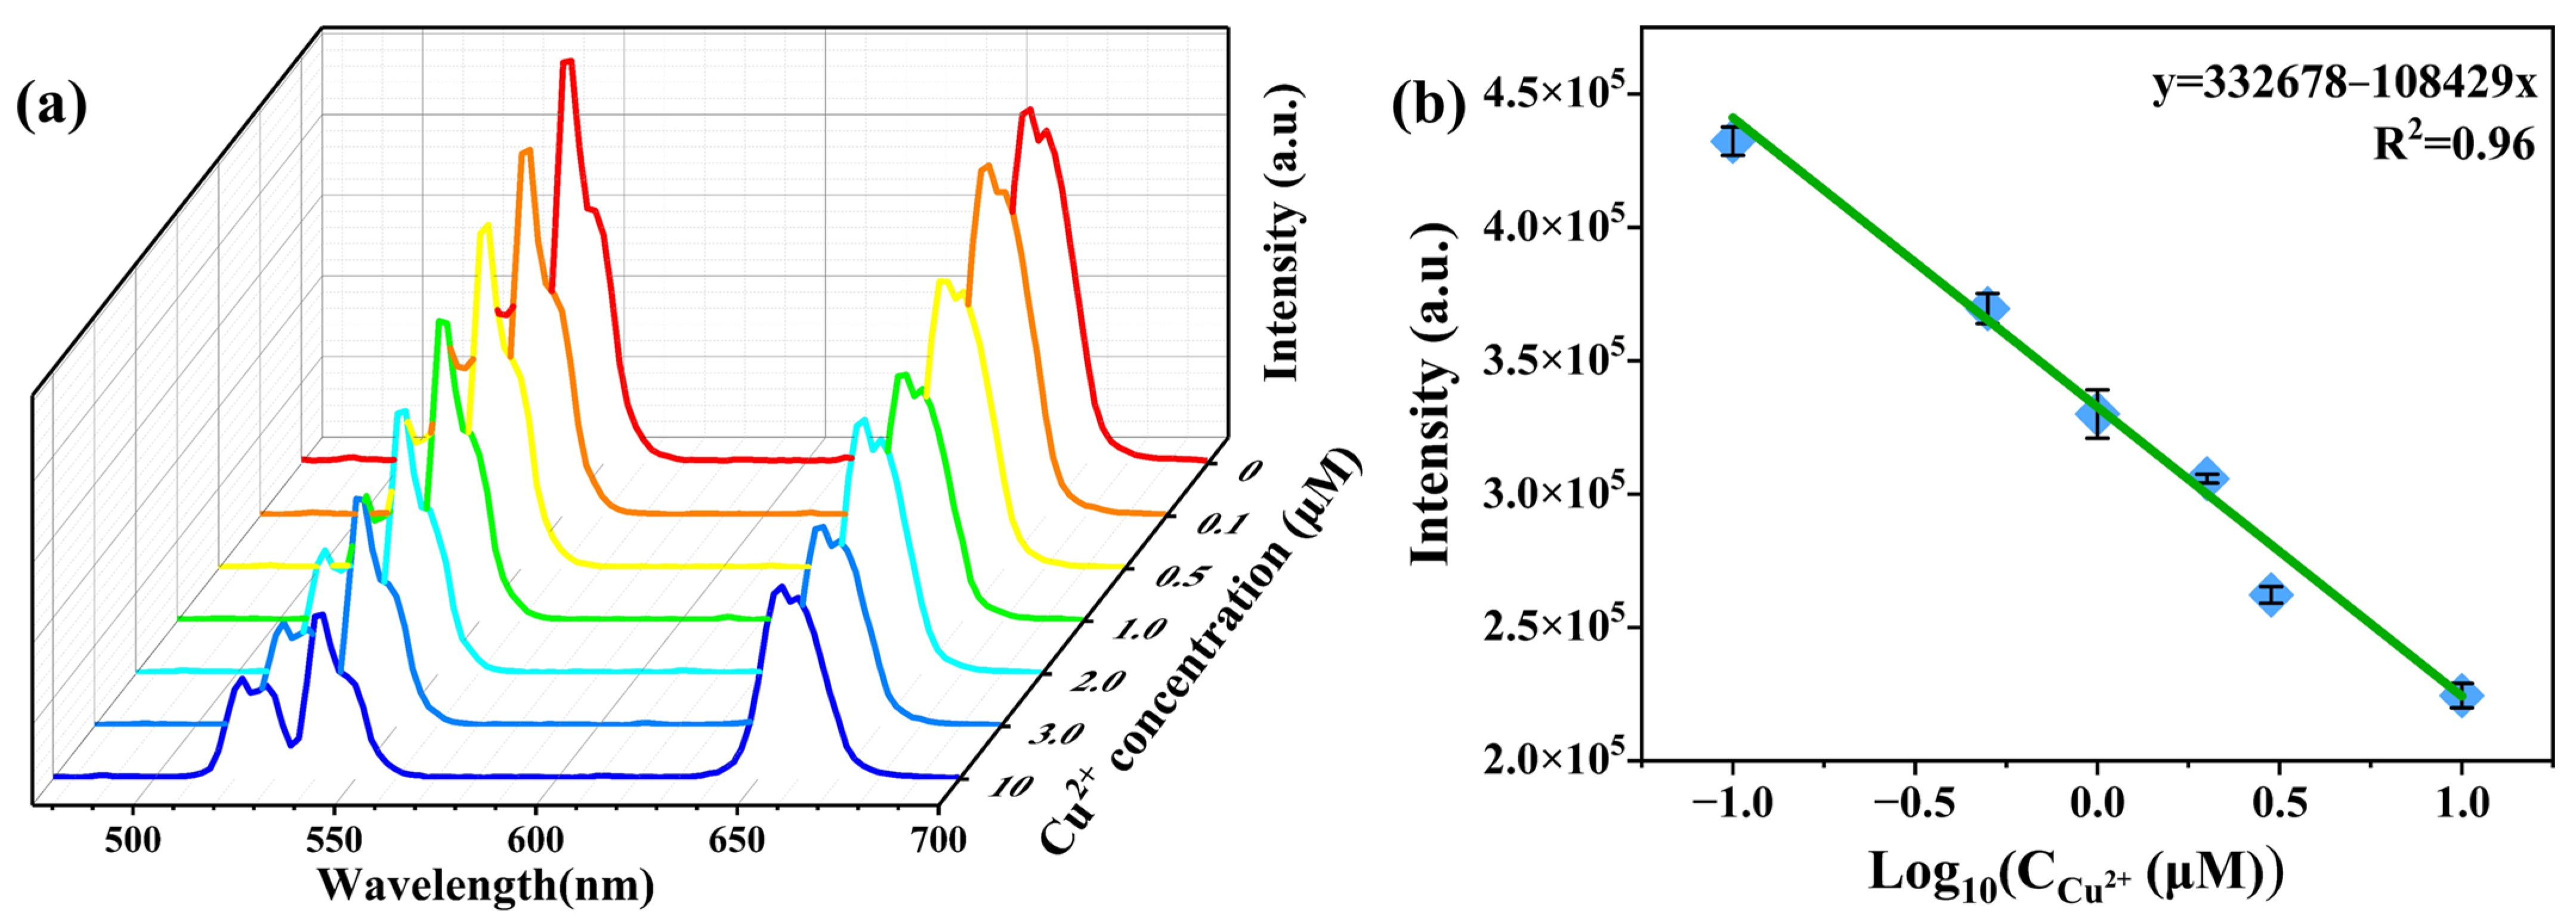
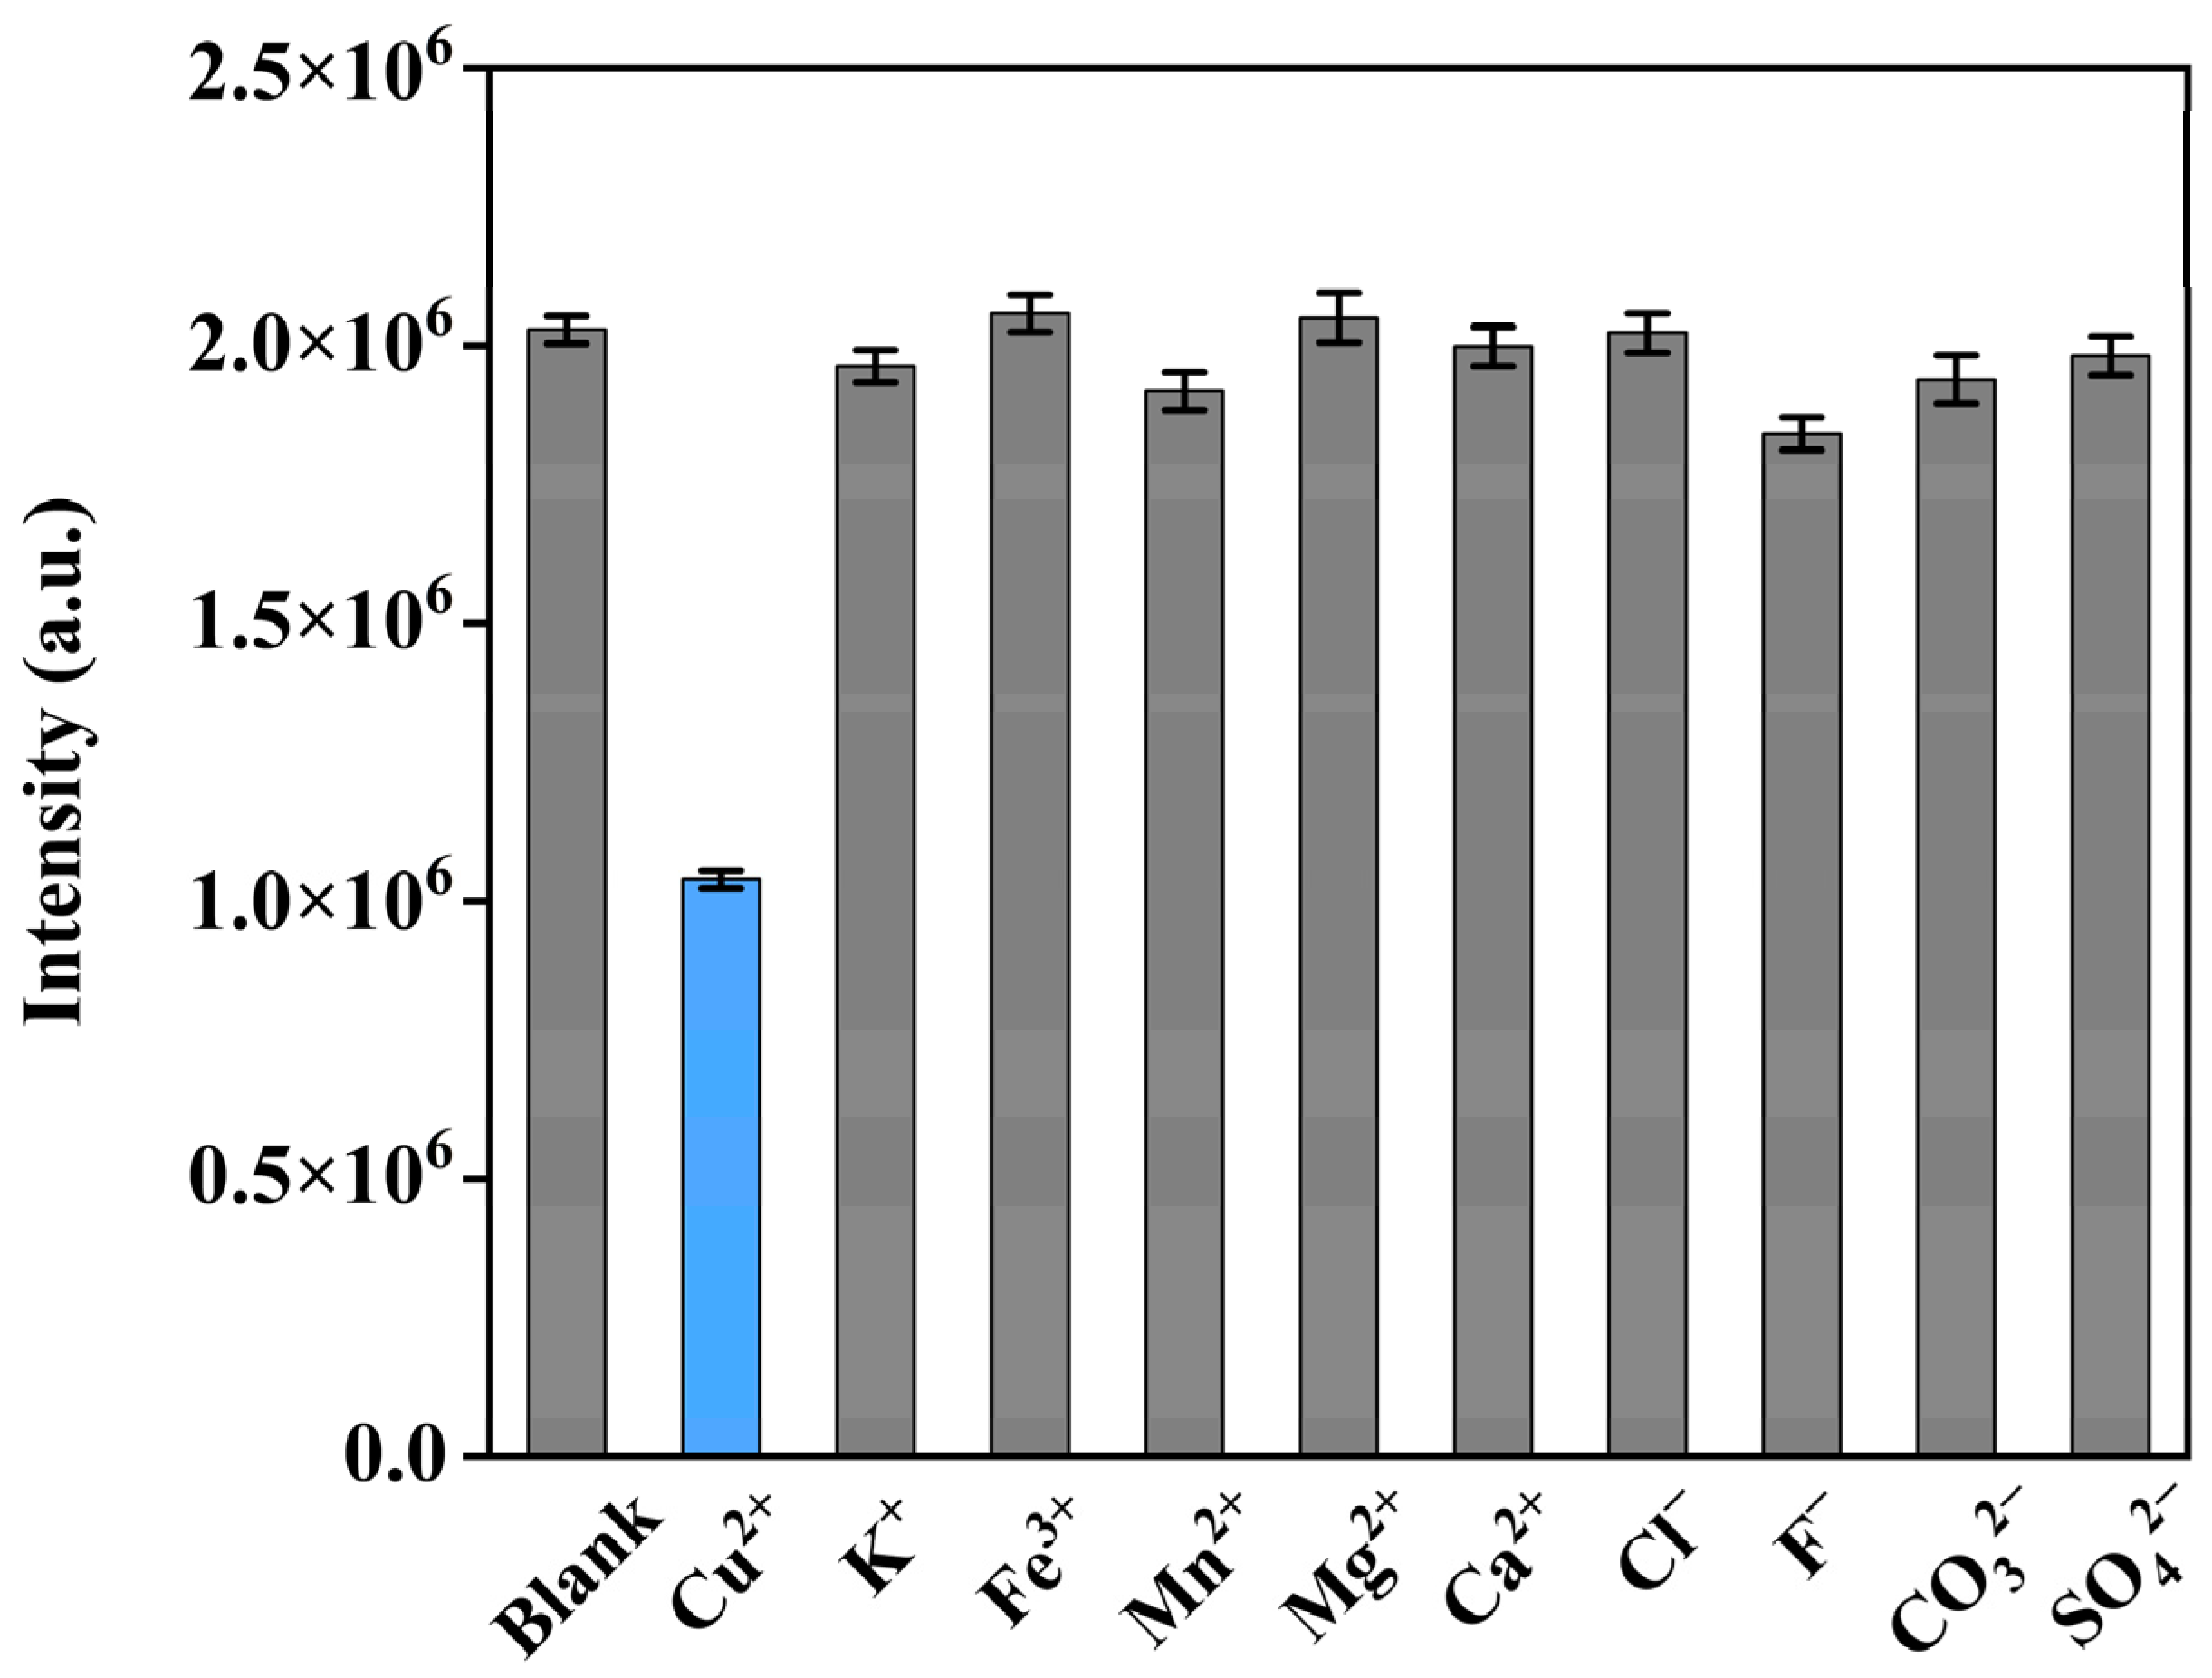
3.3. Detection of Cu2+ via Upconversion Emission

In the present research, we used the NaYF4:Yb/[email protected] composite that holds the strongest upconversion emission to construct an example probe of UCNC@DSiMOR/BPEI and to demonstrate the detection of Cu2+. The emission spectra of UCNC@DSiMOR/BPEI and the absorption spectra of the BPEI solution and BPEI-Cu2+ complex solution are shown in Figure S1. After BPEI was added to the solution of Cu2+, the amino groups of BPEI on the surface of UCNC@DSiMOR/BPEI coordinate with Cu2+, which shows an absorption band between 450 and 700 nm [45]. Upon excitation with a 980 nm laser, UCNC@DSiMOR/BPEI exhibits three emission peaks centered at 521, 542, and 654 nm, which can be attributed to Er3+: 2H11/24I15/2, 4S3/24I15/2, and 4F9/24I15/2 transitions, respectively. According to the spectra in Figure S1, the absorption spectrum of BPEI-Cu2+ complexes overlaps with the emission spectra of UCNC@DSiMOR. Therefore, the emission of UCNC@DSiMOR will be quenched in the presence of BPEI-Cu2+, especially for the red emission wavelength region. In order to obtain the relationship between the upconversion emission intensity of the UCNC@DSiMOR/BPEI probe and the Cu2+ level in water, the upconversion emission spectra of Er3+ were measured upon the addition of different concentrations of Cu2+, and the corresponding results are shown in Figure 6a. In order to reduce the errors caused by experimental and environmental factors, the spectral measurements of the samples for the detection of Cu were repeated three times using the same method, and the repeatability deviations are shown in Figure 6b. We can observe that the upconversion emission intensity monotonously decreases with increases in the Cu2+ concentration, and, meanwhile, the integrated emission intensity shows a linear dependence with the logarithm value of the Cu2+ concentration ranging from 0.1 to 10 μM. The limit of detection (LOD) is defined as 3 s/k, where s represents the standard deviation of the blank and k represents for the slope of the linear calibration equation. Here, the LOD of the UCNC@DSiMOR/BPEI probe was determined to be 1.507 μmol/L, which is comparable to or lower than some of the previously reported detection limits for Cu2+ (Table S2) [46,47,48,49,50,51,52].
Practical applications often contain a variety of ions and molecules that can interfere with Cu2+ detection. In order to validate the selectivity for the detection of Cu2+ using the UCNC@DSiMOR/BPEI as probe, various potential interference metal ions and ionic clusters, including K+, Ca2+, Mg2+, Mn2+, Fe3+, Cl, F, CO32−, and SO42−, were chosen for an anti-interference test, in which the concentrations of the interference ions’ aqueous solutions were set to 100 μM. The corresponding integrated upconversion emission intensities upon the adding of each interference solution are shown in Figure 7. To minimize errors due to experimental and environmental factors, the spectral measurements were repeated three times using the same method, and the repeatability deviations are also shown. It can be seen that compared with Cu2+, the presence of the considered interference ions and ionic clusters did not lead to an obvious decrease in the upconversion emission intensity of the probe. These results demonstrated the excellent sensitivity and selectivity of UCNC@DSiMOR/BPEI toward the detection of Cu2+.

4. Summary

In summary, the UNCN@MOR zeolite composites were successfully synthesized using an MOR zeolite desilicated with a 1.0 mol/L NaOH alkaline solution as the host for the in situ growth of NaREF4 (RE = Y, Gd) Yb/Er nanocrystals with the coprecipitation method, and the subsequent thermal treatment was conducted to effectively improve the upconversion emission intensity of Er3+. The NaYF4:Yb/[email protected] composite that holds the strongest upconversion emission was used to construct the UCNC@DSiMOR/BPEI probe for the selective detection of Cu2+ in water. The spectra results indicated that the integrated emission intensity of Er3+ holds a linear dependence with the logarithm value of the Cu2+ concentration ranging from 0.1 to 10 μM with an LOD of 1.507 μmol/L, while less emission quenching was exhibited in the presence of various potential interference metal ions and ionic clusters with a concentration of 100 μM. It is expected that the NaYF4:Yb/[email protected] composite can be a desirable probe for the detection of Cu2+ with good sensitivity and selectivity.

Supplementary Materials

The following supporting information can be downloaded at https://www.mdpi.com/article/10.3390/ma17040854/s1, Figure S1: Upconversion spectrum of NaYF4:Yb/[email protected] composite interacting with BPEI and absorption spectrum of BPEI and BPEI-Cu(II); Table S1: The ion concentrations in the alkaline treatment solution after reaction measured using ICP; Table S2: The limit of detection (LOD) of Cu2+.

Author Contributions

Sample preparation, spectra and XPS measurements, data analysis, original draft preparation, P.L.; writing—review and editing, supervision, funding acquisition, project administration, S.Y.; XRD measurement and data analysis, L.P.; spectra measurement, H.Z.; spectra measurement and data analysis, R.H.; review and funding acquisition, D.W. All authors have read and agreed to the published version of the manuscript.

Funding

This work was financially supported by the National Natural Science Foundation of China (Nos. 51872200, 51772210) and the Natural Science Foundation of Shanghai (No. 18ZR1441900).

Institutional Review Board Statement

Not applicable.

Informed Consent Statement

Not applicable.

Data Availability Statement

The original contributions presented in the study are included in the article/supplementary material, further inquiries can be directed to the corresponding author/s.

Conflicts of Interest

The authors declare no conflicts of interest.

References

  1. Huy, B.T.; Kumar, A.P.; Thuy, T.T.; Nghia, N.N.; Lee, Y.-I. Recent advances in fluorescent upconversion nanomaterials: Novel strategies for enhancing optical and magnetic properties to biochemical sensing and imaging applications. Appl. Spectrosc. Rev. 2020, 57, 265–299. [Google Scholar] [CrossRef]
  2. Hlavacek, A.; Farka, Z.; Mickert, M.J.; Kostiv, U.; Brandmeier, J.C.; Horak, D.; Skladal, P.; Foret, F.; Gorris, H.H. Bioconjugates of photon-upconversion nanoparticles for cancer biomarker detection and imaging. Nat. Protoc. 2022, 17, 1028–1072. [Google Scholar] [CrossRef] [PubMed]
  3. Shrivastava, R.; Fekar, D.; Mahilang, M. Up-conversion phosphors: A short review. Ferroelectrics 2023, 614, 112–118. [Google Scholar] [CrossRef]
  4. Richards, B.S.; Hudry, D.; Busko, D.; Turshatov, A.; Howard, I.A. Photon Upconversion for Photovoltaics and Photocatalysis: A Critical Review. Chem. Rev. 2021, 121, 9165–9195. [Google Scholar] [CrossRef] [PubMed]
  5. Mandl, G.A.; Cooper, D.R.; Hirsch, T.; Seuntjens, J.; Capobianco, J.A. Perspective: Lanthanide-doped upconverting nanoparticles. Methods Appl. Fluoresc. 2019, 7, 012004. [Google Scholar] [CrossRef]
  6. Cooper, D.R.; Capobianco, J.A.; Seuntjens, J. Radioluminescence studies of colloidal oleate-capped β-Na(Gd,Lu)F4:Ln3+ nanoparticles (Ln = Ce, Eu, Tb). Nanoscale 2018, 10, 7821–7832. [Google Scholar] [CrossRef] [PubMed]
  7. Naccache, R.; Yu, Q.; Capobianco, J.A. The Fluoride Host: Nucleation, Growth, and Upconversion of Lanthanide-Doped Nanoparticles. Adv. Opt. Mater. 2015, 3, 482–509. [Google Scholar] [CrossRef]
  8. Liu, X.; Yan, L.; Liu, S.; Li, Q.; Zhou, B. Controllable synthesis of ultrasmall core-shell hexagonal upconversion nanoparticles towards full-color output. Optik 2020, 207, 164398. [Google Scholar] [CrossRef]
  9. Sun, C.; Gradzielski, M. Advances in fluorescence sensing enabled by lanthanide-doped upconversion nanophosphors. Adv. Colloid Interface Sci. 2022, 300, 102579. [Google Scholar] [CrossRef]
  10. Banerjee, A.; Shwetabh, K.; Kumar, K.; Poddar, R. Exploring the Effect of Size Variability on Efficiency of Upconversion Nanoparticles as Optical Contrast Agents. J. Fluoresc. 2023. [Google Scholar] [CrossRef] [PubMed]
  11. Hudry, D.; Howard, I.A.; Popescu, R.; Gerthsen, D.; Richards, B.S. Structure-Property Relationships in Lanthanide-Doped Upconverting Nanocrystals: Recent Advances in Understanding Core-Shell Structures. Adv. Mater. 2019, 31, e1900623. [Google Scholar] [CrossRef]
  12. Hasegawa, M.; Ishii, A. Thin-film formation for promoting the potential of luminescent lanthanide coordination complexes. Coord. Chem. Rev. 2020, 421, 213458. [Google Scholar] [CrossRef]
  13. Dong, H.; Sun, L.-D.; Li, L.-D.; Si, R.; Liu, R.; Yan, C.-H. Selective Cation Exchange Enabled Growth of Lanthanide Core/Shell Nanoparticles with Dissimilar Structure. J. Am. Chem. Soc. 2017, 139, 18492–18495. [Google Scholar] [CrossRef]
  14. Liao, H.; Ye, S.; Lin, P.; Pan, L.; Wang, D. In situ growth of lanthanides-doped nanoparticles inside zeolites with enhanced upconversion emission for gallic acid detection. J. Colloid Interface Sci. 2023, 652, 1297–1307. [Google Scholar] [CrossRef]
  15. Du, J.; Jia, T.; Zhang, J.; Chen, G. Heterostructures Combining Upconversion Nanoparticles and Metal–Organic Framework: Fundamental, Classification, and Theranostic Applications. Adv. Opt. Mater. 2023, 11, 2202122. [Google Scholar] [CrossRef]
  16. Wu, X.; Cheng, S.; Huang, G.; Zhan, S.; Nie, G.; Su, X.; Cheng, D.; Liu, Y. Flexible composite film with enhanced upconversion emission for ultrasensitive gas detection. Ceram. Int. 2024, 50, 3843–3851. [Google Scholar] [CrossRef]
  17. de Magalhães, L.F.; da Silva, G.R.; Peres, A.E.C.; Kooh, M.R.R. Zeolite Application in Wastewater Treatment. Adsorpt. Sci. Technol. 2022, 2022, 4544104. [Google Scholar] [CrossRef]
  18. Na, K. Synthesis and Application of Zeolite Catalysts. Catalysts 2021, 11, 685. [Google Scholar] [CrossRef]
  19. Matusiak, J.; Przekora, A.; Franus, W. Zeolites and zeolite imidazolate frameworks on a quest to obtain the ideal biomaterial for biomedical applications: A review. Mater. Today 2023, 67, 495–517. [Google Scholar] [CrossRef]
  20. Pan, L.; Ye, S.; Xv, X.; Lin, P.; Huang, R.; Wang, D. Zeolite-Encaged Luminescent Silver Nanoclusters. Materials 2023, 16, 3736. [Google Scholar] [CrossRef]
  21. Zhou, Y.; Liu, J.; Sun, F.; Ouyang, J.; Su, R.; Meng, F.; Luo, Y.; Xu, C.; Zhang, W.; Zhang, S.; et al. Incorporating metal nanoparticles in porous materials via selective heating effect using microwave. Nano Res. 2023, 1–5. [Google Scholar] [CrossRef]
  22. Jiang, Y.; Tong, X.; E, Y.; Wei, P.; Fang, F.; Chen, P.; Qian, K. TiO2-doped LTA zeolite as a sensitive non-enzymatic electrochemical sensor toward hydrogen peroxide detection. J. Alloys Compd. 2023, 968, 171866. [Google Scholar] [CrossRef]
  23. Groen, J.C.; Zhu, W.; Brouwer, S.; Huynink, S.J.; Kapteijn, F.; Moulijn, J.A.; Pérez-Ramírez, J. Direct Demonstration of Enhanced Diffusion in Mesoporous ZSM-5 Zeolite Obtained via Controlled Desilication. J. Am. Chem. Soc. 2006, 129, 355–360. [Google Scholar] [CrossRef]
  24. Shahid, A.; Inayat, A.; Avadhut, Y.; Hartmann, M.; Schwieger, W. A comparative study of the desilication of channel- and cage-like zeolites. Microporous Mesoporous Mater. 2022, 341, 111903. [Google Scholar] [CrossRef]
  25. Gackowski, M.; Tarach, K.; Kuterasiński, Ł.; Podobiński, J.; Jarczewski, S.; Kuśtrowski, P.; Datka, J. Hierarchical zeolites Y obtained by desilication: Porosity, acidity and catalytic properties. Microporous Mesoporous Mater. 2018, 263, 282–288. [Google Scholar] [CrossRef]
  26. Silaghi, M.-C.; Chizallet, C.; Sauer, J.; Raybaud, P. Dealumination mechanisms of zeolites and extra-framework aluminum confinement. J. Catal. 2016, 339, 242–255. [Google Scholar] [CrossRef]
  27. Roy, N.; Neerugatti, K.R.E.; Sinha, A.; Mukherjee, A. Ceria-decorated zeolite nanocomposite for synergistic adsorption and photocatalytic degradation of caffeine. Surf. Interfaces 2023, 43, 103515. [Google Scholar] [CrossRef]
  28. Liao, H.; Ye, S.; Ding, J.; Yu, J.; Xv, X.; Pan, L.; Lin, P.; Wang, D. Ship-in-a-bottle growth of NaYF4: Yb3+/Tm3+ upconversion nanocrystals in desilicated ZSM-5 zeolite for drug release monitoring. Mater. Res. Bull. 2022, 154, 111926. [Google Scholar] [CrossRef]
  29. Kostiv, U.; Engstova, H.; Krajnik, B.; Slouf, M.; Proks, V.; Podhorodecki, A.; Jezek, P.; Horak, D. Monodisperse Core-Shell NaYF4:Yb3+/Er3+@NaYF4:Nd3+-PEG-GGGRGDSGGGY-NH2 Nanoparticles Excitable at 808 and 980 nm: Design, Surface Engineering, and Application in Life Sciences. Front. Chem. 2020, 8, 497. [Google Scholar] [CrossRef]
  30. Zhang, Y.; Xu, S.; Li, X.; Zhang, J.; Sun, J.; Tong, L.; Zhong, H.; Xia, H.; Hua, R.; Chen, B. Improved LRET-based detection characters of Cu2+ using sandwich structured NaYF4@NaYF4:Er3+/Yb3+@NaYF4 nanoparticles as energy donor. Sens. Actuators B Chem. 2018, 257, 829–838. [Google Scholar] [CrossRef]
  31. Shao, H.; Li, F.; Li, D.; Ma, Q.; Yu, W.; Liu, G.; Dong, X. Up-/Downconversion Fluorescence Dual-Channel Probe Based on NaYF4: Yb/Er/Eu Nanoparticles for the Determination of Cu(II). ACS Appl. Nano Mater. 2022, 5, 3333–3341. [Google Scholar] [CrossRef]
  32. Kerstens, D.; Smeyers, B.; Van Waeyenberg, J.; Zhang, Q.; Yu, J.; Sels, B.F. State of the Art and Perspectives of Hierarchical Zeolites: Practical Overview of Synthesis Methods and Use in Catalysis. Adv. Mater. 2020, 32, 2004690. [Google Scholar] [CrossRef] [PubMed]
  33. Weissenberger, T.; Machoke, A.G.F.; Reiprich, B.; Schwieger, W. Preparation and Potential Catalytic Applications of Hierarchically Structured Zeolites with Macropores. Adv. Mater. Interfaces 2021, 8, 2001653. [Google Scholar] [CrossRef]
  34. Gruenert, W.; Muhler, M.; Schroeder, K.-P.; Sauer, J.; Schloegl, R. Investigations of Zeolites by Photoelectron and Ion Scattering Spectroscopy. 2. A New Interpretation of XPS Binding Energy Shifts in Zeolites. J. Phys. Chem. 1994, 98, 10920–10929. [Google Scholar] [CrossRef]
  35. Silaghi, M.-C.; Chizallet, C.; Raybaud, P. Challenges on molecular aspects of dealumination and desilication of zeolites. Microporous Mesoporous Mater. 2014, 191, 82–96. [Google Scholar] [CrossRef]
  36. Xv, X.; Ye, S.; Pan, L.; Lin, P.; Liao, H.; Wang, D. Tailoring the Luminescence Properties of Silver Clusters Confined in Faujasite Zeolite through Framework Modification. Materials 2022, 15, 7431. [Google Scholar] [CrossRef]
  37. Remy, M.J.; Genet, M.J.; Poncelet, G.; Lardinois, P.F.; Notte, P.P. Investigation of dealuminated mordenites by X-ray photoelectron spectroscopy. J. Phys. Chem. 2002, 96, 2614–2617. [Google Scholar] [CrossRef]
  38. Kavand, A.; Serra, C.A.; Blanck, C.; Lenertz, M.; Anton, N.; Vandamme, T.F.; Mély, Y.; Przybilla, F.; Chan-Seng, D. Controlled Synthesis of NaYF4:Yb,Er Upconversion Nanocrystals as Potential Probe for Bioimaging: A Focus on Heat Treatment. ACS Appl. Nano Mater. 2021, 4, 5319–5329. [Google Scholar] [CrossRef]
  39. Wang, X.; Wang, K.; Plackowski, C.A.; Nguyen, A.V. Sulfuric acid dissolution of 4A and Na-Y synthetic zeolites and effects on Na-Y surface and particle properties. Appl. Surf. Sci. 2016, 367, 281–290. [Google Scholar] [CrossRef]
  40. Choi, J.; Jung, R. In-situ XPS Study of Core-levels of ZnO Thin Films at the Interface with Graphene/Cu. J. Korean Phys. Soc. 2018, 73, 1546–1549. [Google Scholar] [CrossRef]
  41. Haslam, G.E.; Sato, K.; Mizokawa, T.; Chin, X.Y.; Burstein, G.T. Charge transfer effects in electrocatalytic Ni-C revealed by X-ray photoelectron spectroscopy. Appl. Phys. Lett. 2012, 100, 231601. [Google Scholar] [CrossRef]
  42. Nannuri, S.H.; Singh, S.; Misra, S.K.; C, S.; George, S.D. Microwave-assisted synthesis and upconversion luminescence of NaYF4:Yb, Gd, Er and NaYF4:Yb, Gd, Tm nanorods. Methods Appl. Fluoresc. 2022, 10, 024004. [Google Scholar] [CrossRef] [PubMed]
  43. Martins, J.C.; Bastos, A.R.N.; Ferreira, R.A.S.; Wang, X.; Chen, G.; Carlos, L.D. Primary Luminescent Nanothermometers for Temperature Measurements Reliability Assessment. Adv. Photonics Res. 2021, 2, 2000169. [Google Scholar] [CrossRef]
  44. Tegze, B.; Tolnai, G.; Hessz, D.; Kubinyi, M.; Madarász, J.; Sáfrán, G.; Hórvölgyi, Z. Effect of heat treatment temperature on the morphology and upconversion properties of LaF3:Yb,Er nanoparticles. J. Therm. Anal. Calorim. 2023, 148, 10795–10802. [Google Scholar] [CrossRef]
  45. Shao, H.; Xu, D.; Ding, Y.; Hong, X.; Liu, Y. An “off-on” colorimetric and fluorometric assay for Cu(II) based on the use of NaYF4:Yb(III),Er(III) upconversion nanoparticles functionalized with branched polyethylenimine. Microchim. Acta 2018, 185, 211. [Google Scholar] [CrossRef]
  46. Lal, B.; Kumar, S.; Tittal, R.K.; Singh, G.; Singh, J.; Ghule, V.D.; Mathpati, R.S.; Sabane, J.K. 4-aminoantipyrine linked bis-1,2,3-triazole based probes for Cu(II) sensing. J. Mol. Struct. 2024, 1297, 136995. [Google Scholar] [CrossRef]
  47. Liu, M.; Wang, K.; Wang, H.; Lu, J.; Xu, S.; Zhao, L.; Wang, X.; Du, J. Simple and sensitive colorimetric sensors for the selective detection of Cu(ii). RSC Adv. 2021, 11, 11732–11738. [Google Scholar] [CrossRef]
  48. Liu, Y.; Kang, T.; He, Q.; Hu, Y.; Zuo, Z.; Cao, Z.; Ke, B.; Zhang, W.; Qi, Q. A selective and sensitive near-infrared fluorescent probe for real-time detection of Cu(i). RSC Adv. 2021, 11, 14824–14828. [Google Scholar] [CrossRef]
  49. Pei, M.; Kong, H.; Tian, A.; Liu, X.; Zheng, K.; Ren, Z.; Wang, L. Novel benzotriazole-based probes for the selective detection of Cu(II). J. Mol. Struct. 2022, 1250, 131806. [Google Scholar] [CrossRef]
  50. Keller, S.; Prescimone, A.; Constable, E.C.; Housecroft, C.E. Copper(i) and silver(i) complexes of 9,9-dimethyl-4,5-bis(di-tert-butylphosphino)xanthene: Photophysical properties and structural rigidity under pressure. Photochem. Photobiol. Sci. 2018, 17, 375–385. [Google Scholar] [CrossRef]
  51. Sahoo, P.R.; Kumar, A.; Kumar, A.; Kumar, S. Synthesis and optical properties of copper(II) and nickel(II) complexes of a highly fluorescent morpholine-derivative. Polyhedron 2019, 171, 559–570. [Google Scholar] [CrossRef]
  52. Zhang, J.; Li, B.; Zhang, L.; Jiang, H. An optical sensor for Cu(II) detection with upconverting luminescent nanoparticles as an excitation source. Chem. Commun. (Camb.) 2012, 48, 4860–4862. [Google Scholar] [CrossRef]
Figure 1. XRD patterns of MOR zeolite and DSixMOR (x = 1.0, 2.0) zeolite.
Materials 17 00854 g001
Figure 2. The high-resolution XPS spectra for Na 1s (a), Si 2p (b), Al 2p (c), and O 1s (df) in MOR zeolite and DSixMOR (x = 1.0, 2.0) zeolite.
Materials 17 00854 g002
Figure 3. XRD patterns of DSi1.0MOR, NaREF4:Yb/[email protected], and NaREF4:Yb/[email protected] (RE = Y, Gd) (a,b); TEM images of NaREF4:Yb/[email protected] (RE = Y, Gd) (c,d).
Materials 17 00854 g003
Figure 4. The XPS survey spectra for NaYF4:Yb/[email protected] (a) and NaGdF4:Yb/[email protected] (b); high-resolution XPS spectra for Si 2p (c), Al 2p (d), and O 1s (e) in DSi1.0MOR, NaYF4:Yb/[email protected], and NaGdF4:Yb/[email protected].
Materials 17 00854 g004
Figure 5. Upconversion spectra of NaREF4:Yb/[email protected] and NaREF4:Yb/[email protected] (RE = Y, Gd).
Materials 17 00854 g005
Figure 6. Upconversion integrated emission intensities of NaYF4:Yb/[email protected]/BPEI probe with increasing concentrations of Cu2+ under 980 nm excitation (a); the relationship between upconversion emission intensity and the concentrations of Cu2+ (b).
Materials 17 00854 g006
Figure 7. Selectivity of NaYF4:Yb/[email protected]/BPEI probe for Cu2+ over other representative metal ions and anions in aqueous solution.
Materials 17 00854 g007
Table 1. Surface area, pore volume, and average pore size for MOR and DSi1.0MOR zeolites.
SamplesSurface Area (m2/g)Pore Volume (cm3/g)Average Pore Size (nm)
MesoMicroBETMesoMicroTotalMesoMicroBET
MOR13203210.0200.1470.1675.980.512.08
DSi1.0MOR2073930.0610.0340.0958.050.994.06
Table 2. XPS data of elemental composition of parent MOR zeolite, DSi1.0MOR, and DSi2.0MOR.
SampleXPS Atomic (%)Si/Al
SiAlNaO
MOR25.885.115.4163.615.06
DSi1.0MOR23.456.738.6761.143.48
DSi2.0MOR17.269.8812.0860.781.75
Disclaimer/Publisher’s Note: The statements, opinions and data contained in all publications are solely those of the individual author(s) and contributor(s) and not of MDPI and/or the editor(s). MDPI and/or the editor(s) disclaim responsibility for any injury to people or property resulting from any ideas, methods, instructions or products referred to in the content.

