3.1. Micromagnetic Variables
The results of
,
,
,
,
, and
in dependence of
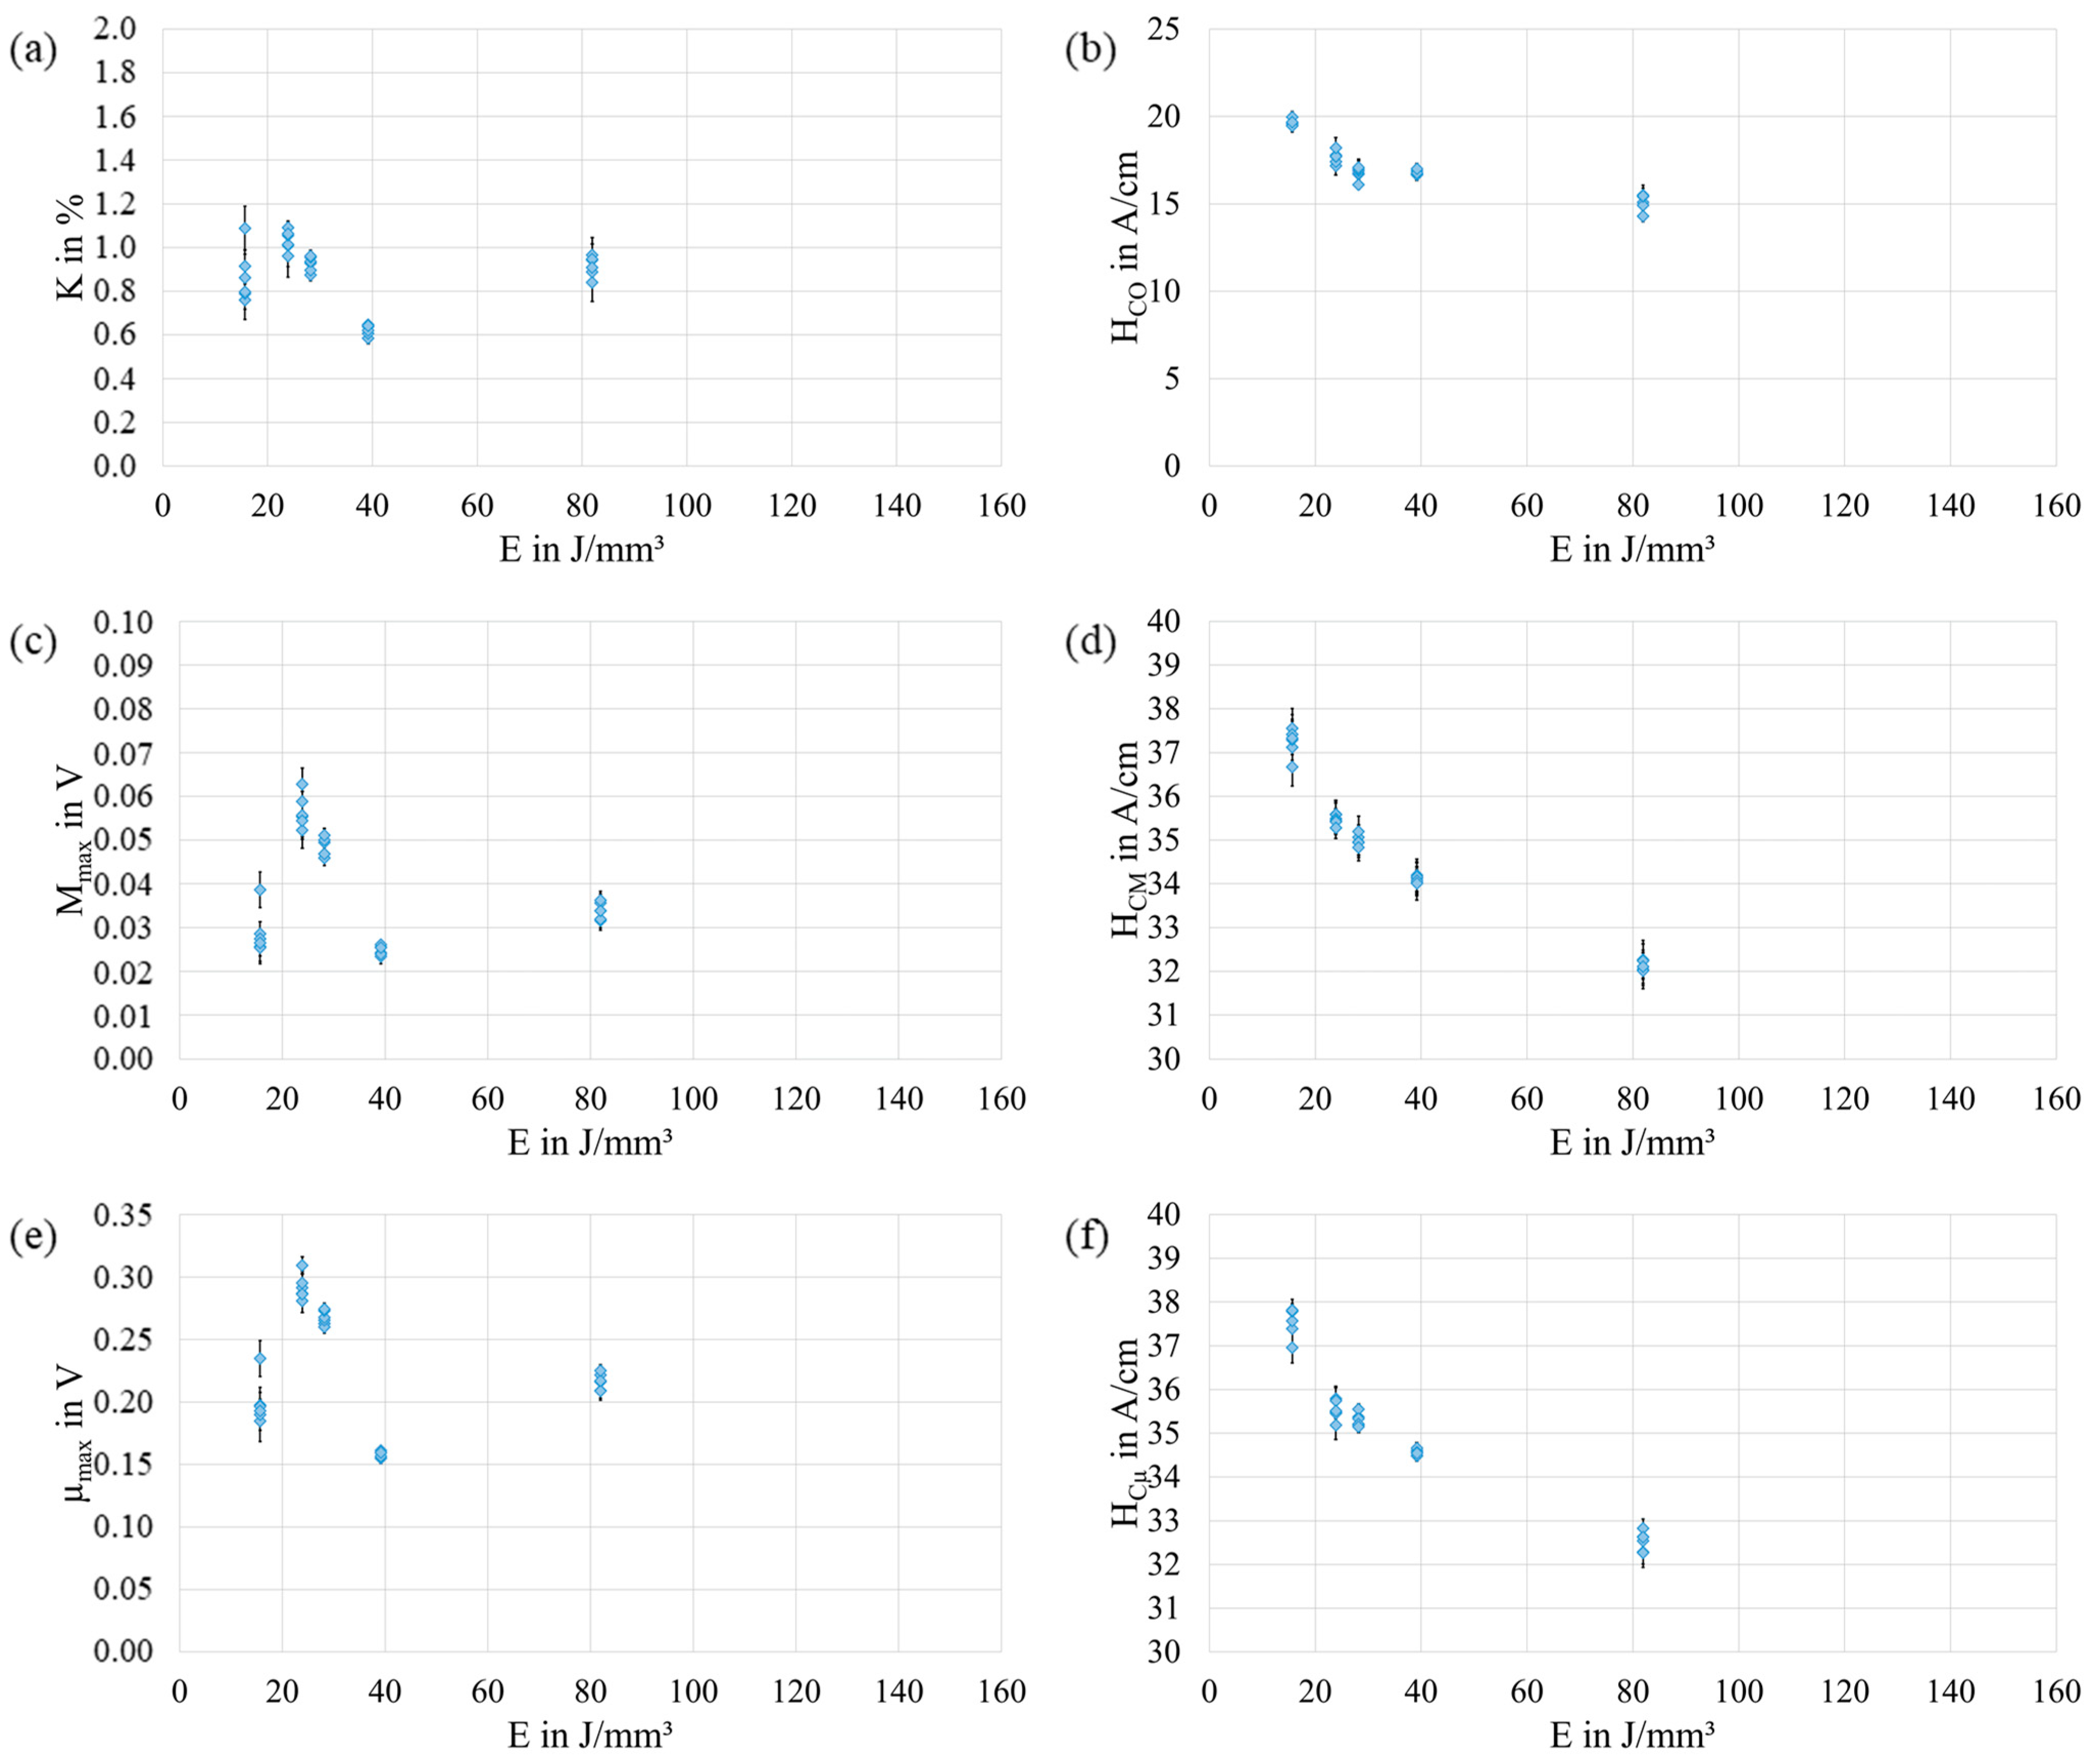
are shown in
Figure 3. The values of
(
Figure 3a) have the tendency to slightly decrease with increasing
. Nevertheless, the values of
show a wide variation, and so a clear trend could not be observed. The values of
(
Figure 3b) sharply decrease up to
J/mm
3. Afterward, with increasing
, the values of
slightly decrease. The values of
(
Figure 3c) and
(
Figure 3e) do not show a clear pattern in dependence of
. In contrast, the values of
(
Figure 3d) and
(
Figure 3f) decrease with increasing
. Moreover, the results of
and
are in a similar range. However, the values of
are slightly higher than the values of
.
To investigate the repeatability, samples were produced with the same parameters representing a low, medium and high
(cf.
Section 2.1). Comparing the three samples produced with the same process parameters, the results vary, although the extent of these variation is different for each micromagnetic variable. In this case, the values of
and
reveal a good repeatability for all three samples independent of the
value considered. For the majority of the micromagnetic variables, the samples produced with
J/mm
3 are characterized by the lowest variations, although a general correlation of the variations and
was not observed.
To further ensure the repeatability of the measurements, five randomly chosen samples of the total 48 samples were probed multiple times. The results of these measurements are shown in
Figure 4. Overall, a good repeatability could be achieved, although some variation exists. This variation might be related to the missing closed magnetic circuit or a non-optimal measurement setup, e.g., caused by slight differences in the positioning of the sensor. A direct relationship between the variation and
could not be observed.
In order to derive possible relations between the process parameters
,
, and
and the micromagnetic variables, a mathematical model was calculated for every considered micromagnetic variable. As can be seen from the results presented in
Table 3, performance criteria vary significantly. Especially, the models of
and
show poor
values. In contrast,
and
reveal high
values and relatively low
values. According to these results, it can be concluded that these micromagnetic variables have the potential to be correlated with the porosity of the PBL-LB/M-manufactured 42CrMo4 samples. As a consequence, the resulting models are assessed in more detail as follows. For both models, the selected model terms are summarized in
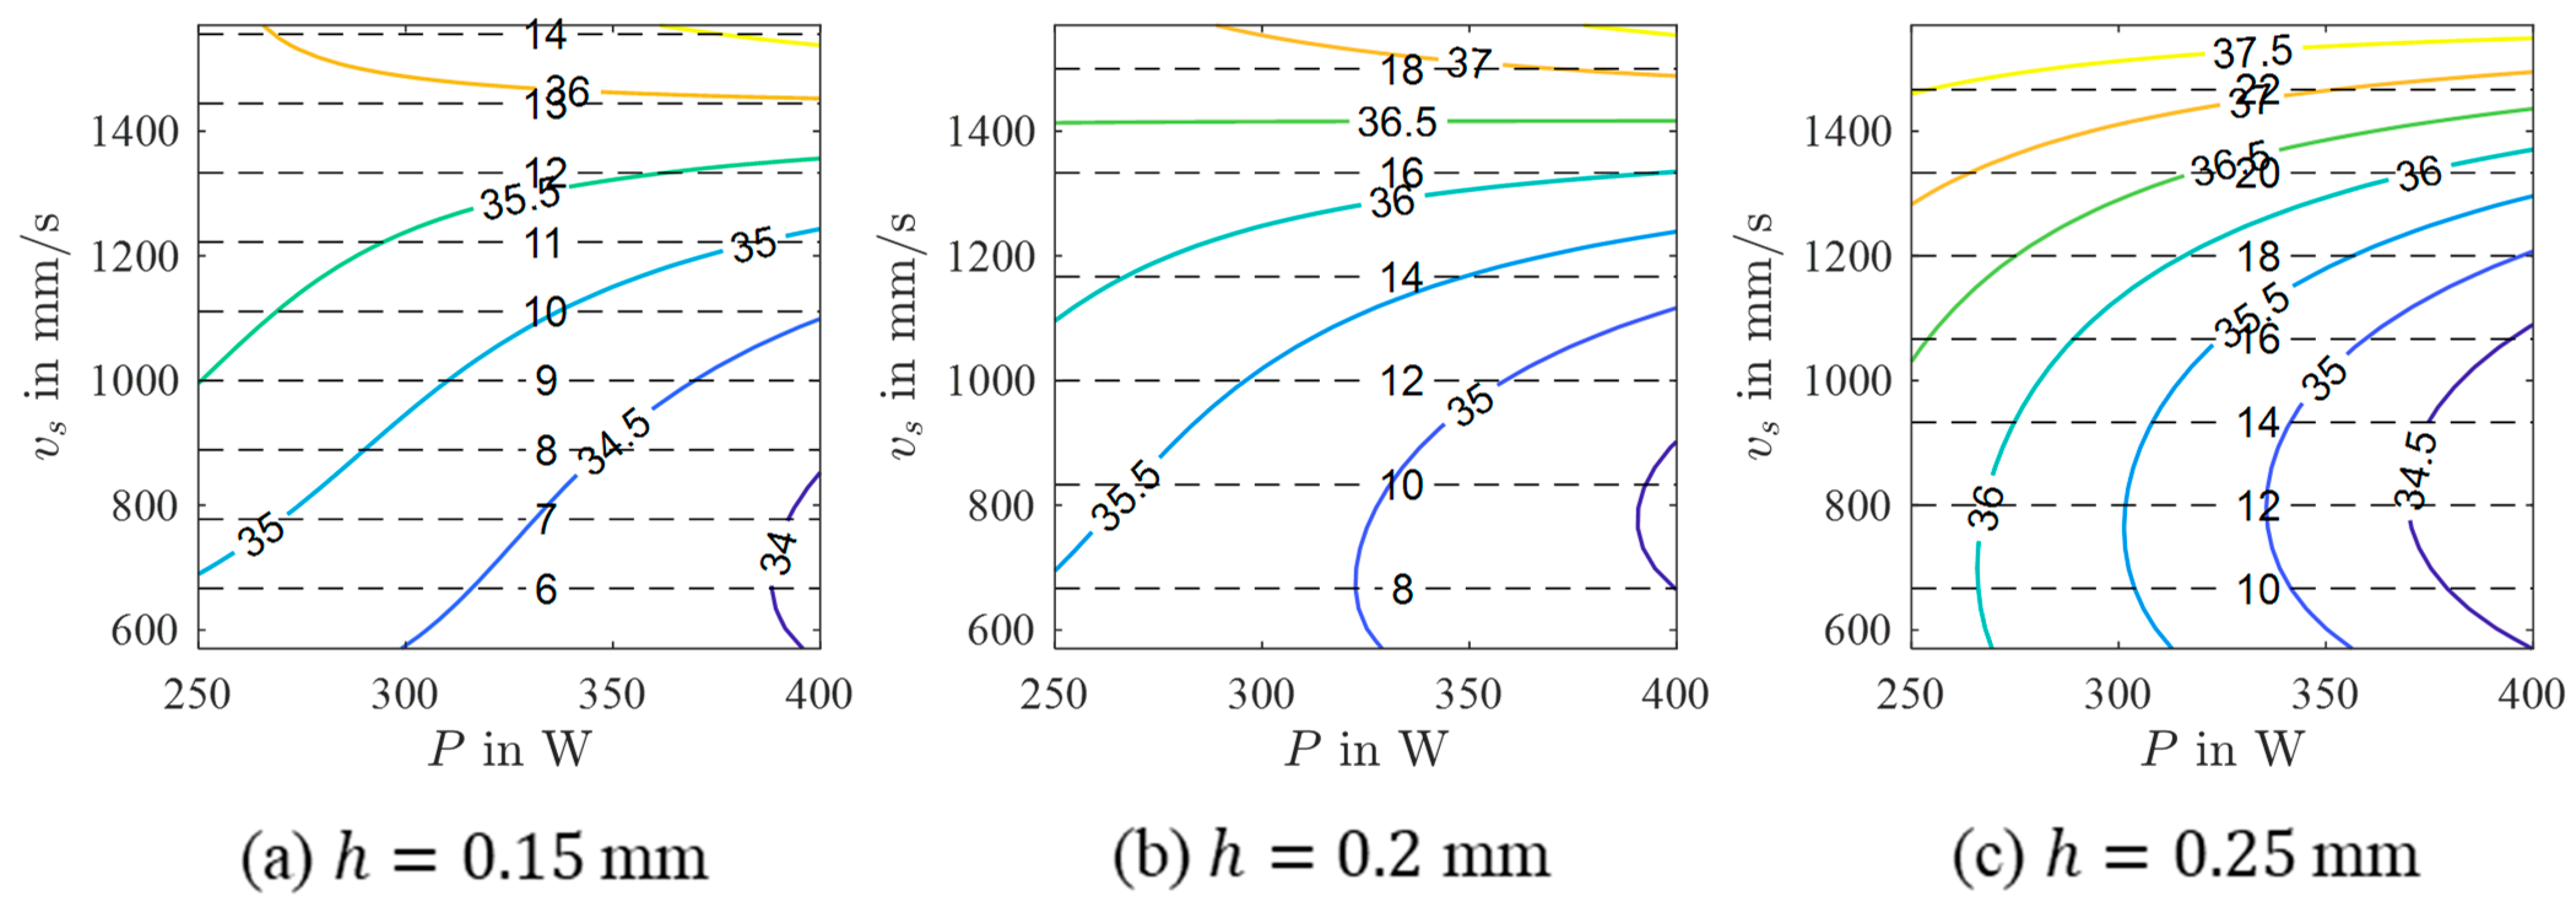
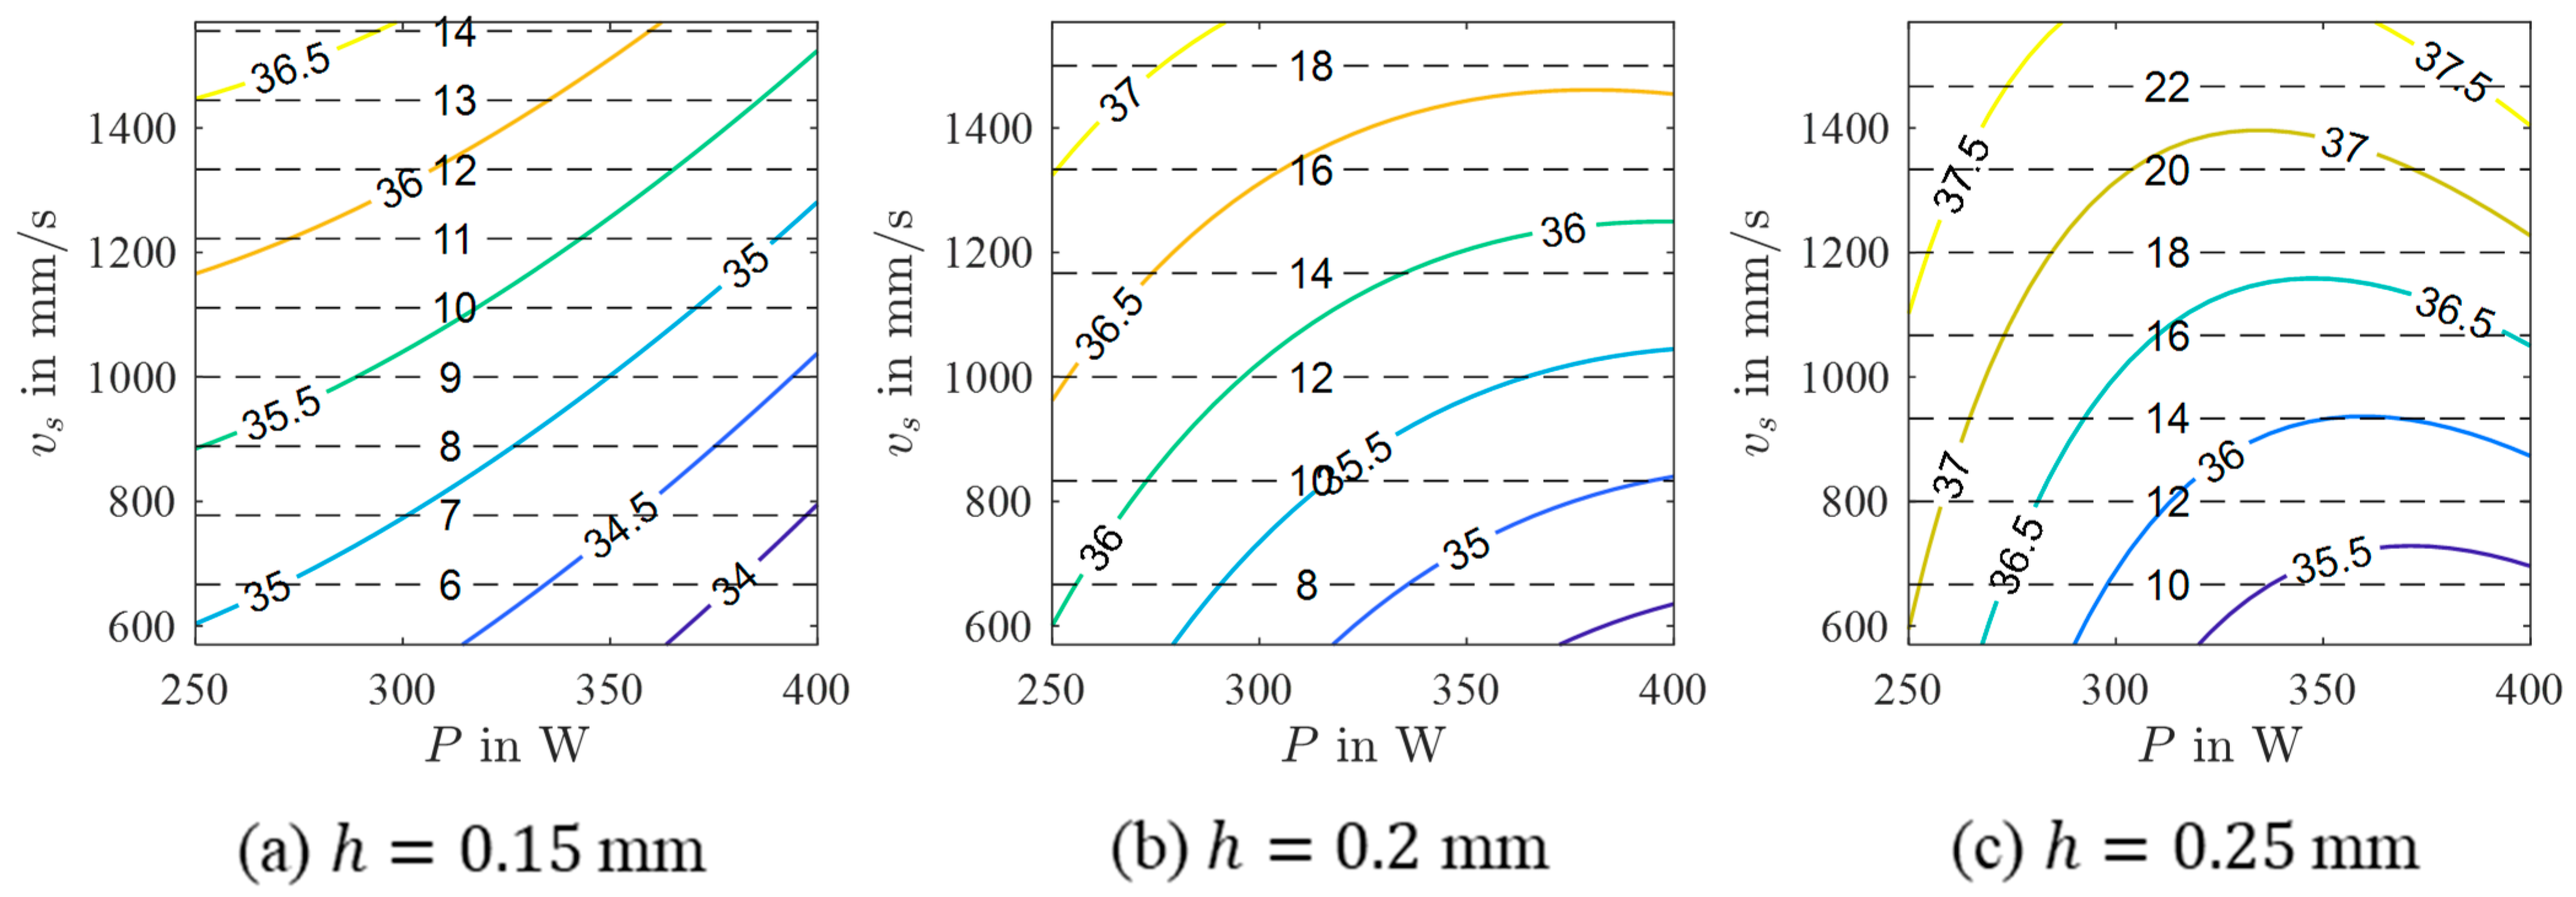
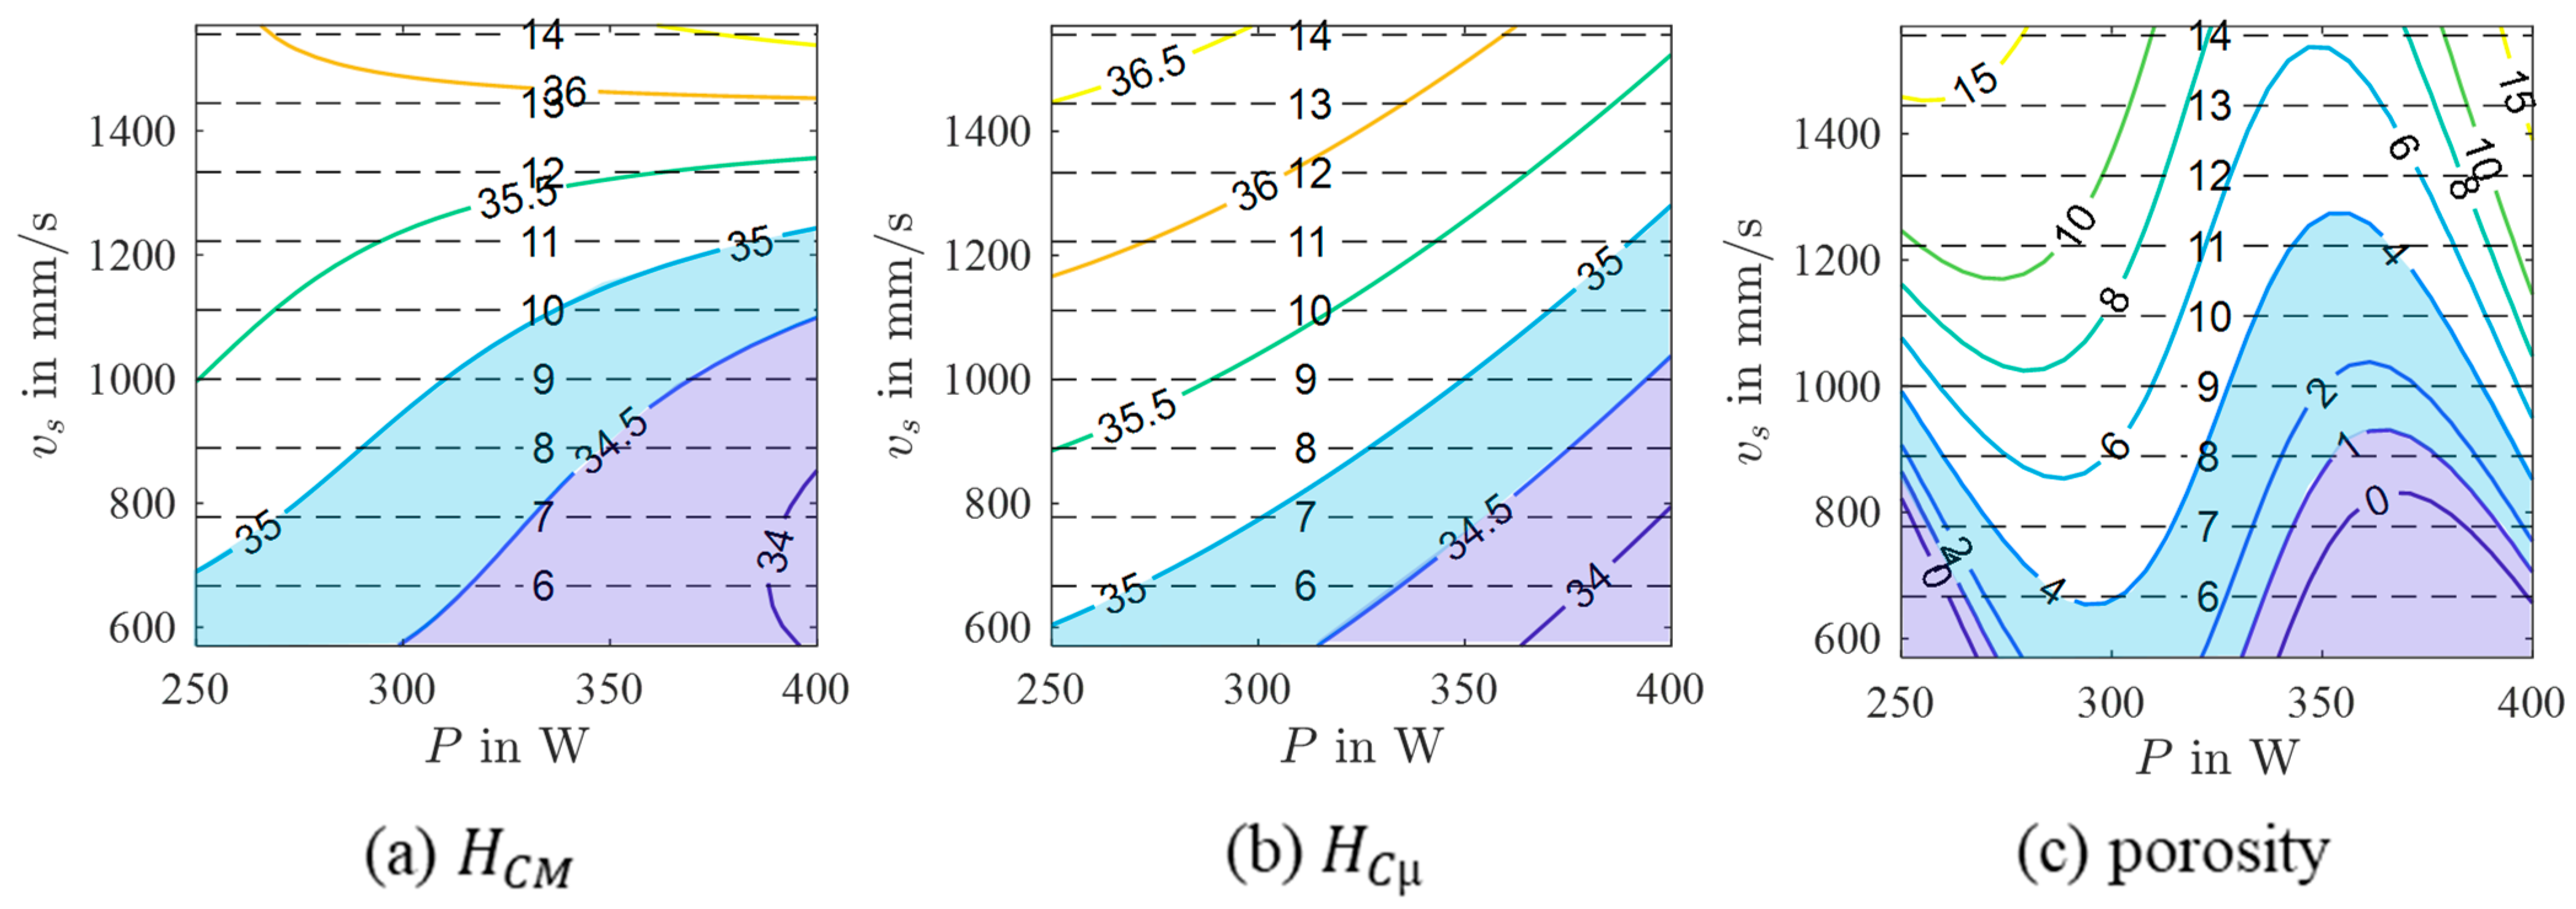
Table 4. In addition, contour plots in the
-
space obtained for different
are shown in
Figure 5 and
Figure 6. Although the contour plots of
and
vary in specific details, their general appearance is similar. For both micromagnetic variables, the values decrease from high
(
) and high
in combination with low
(
), respectively, to high
and low
independent of
. Accordingly, areas with low values, e.g.,
A/cm, are seen at high
and low
. These areas decrease in size with increasing
. Moreover, the areas are shifted to higher
and lower
with increasing
values.
3.2. Porosity
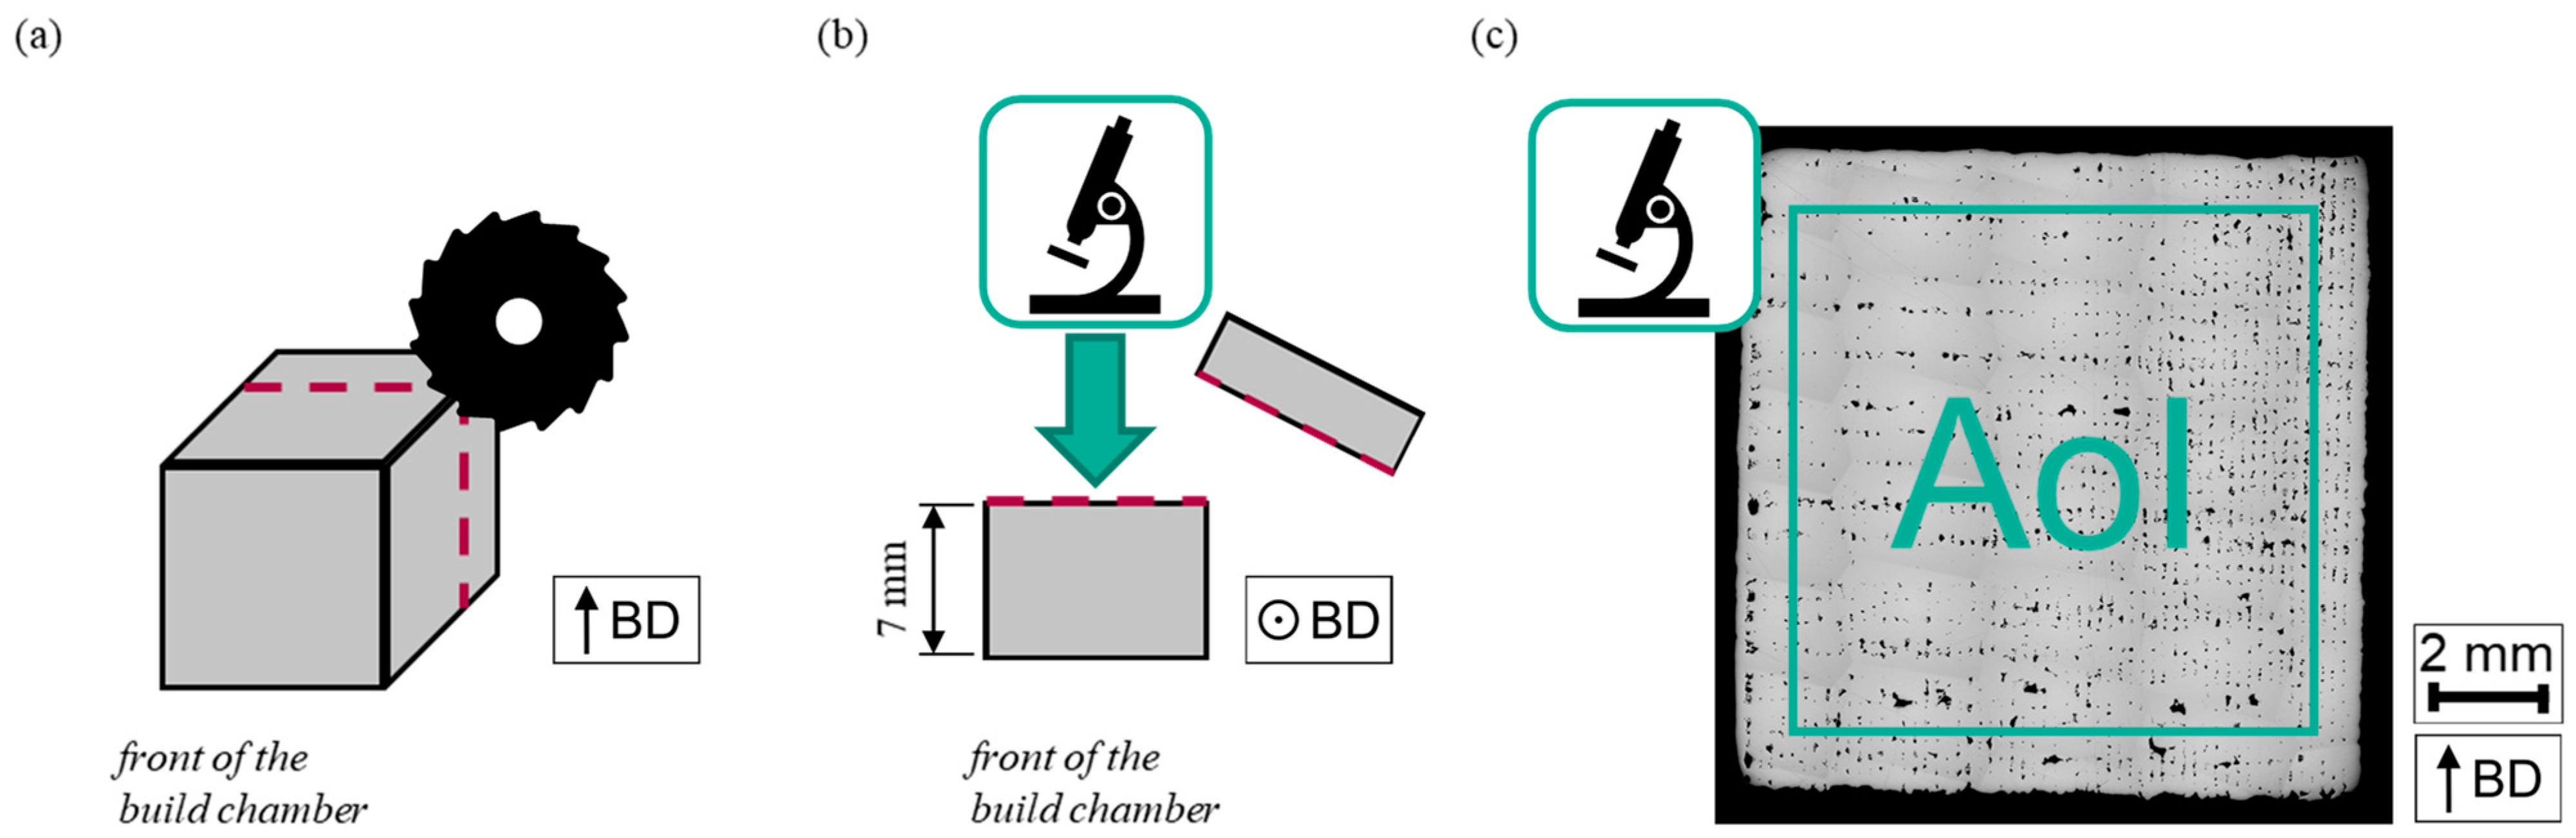
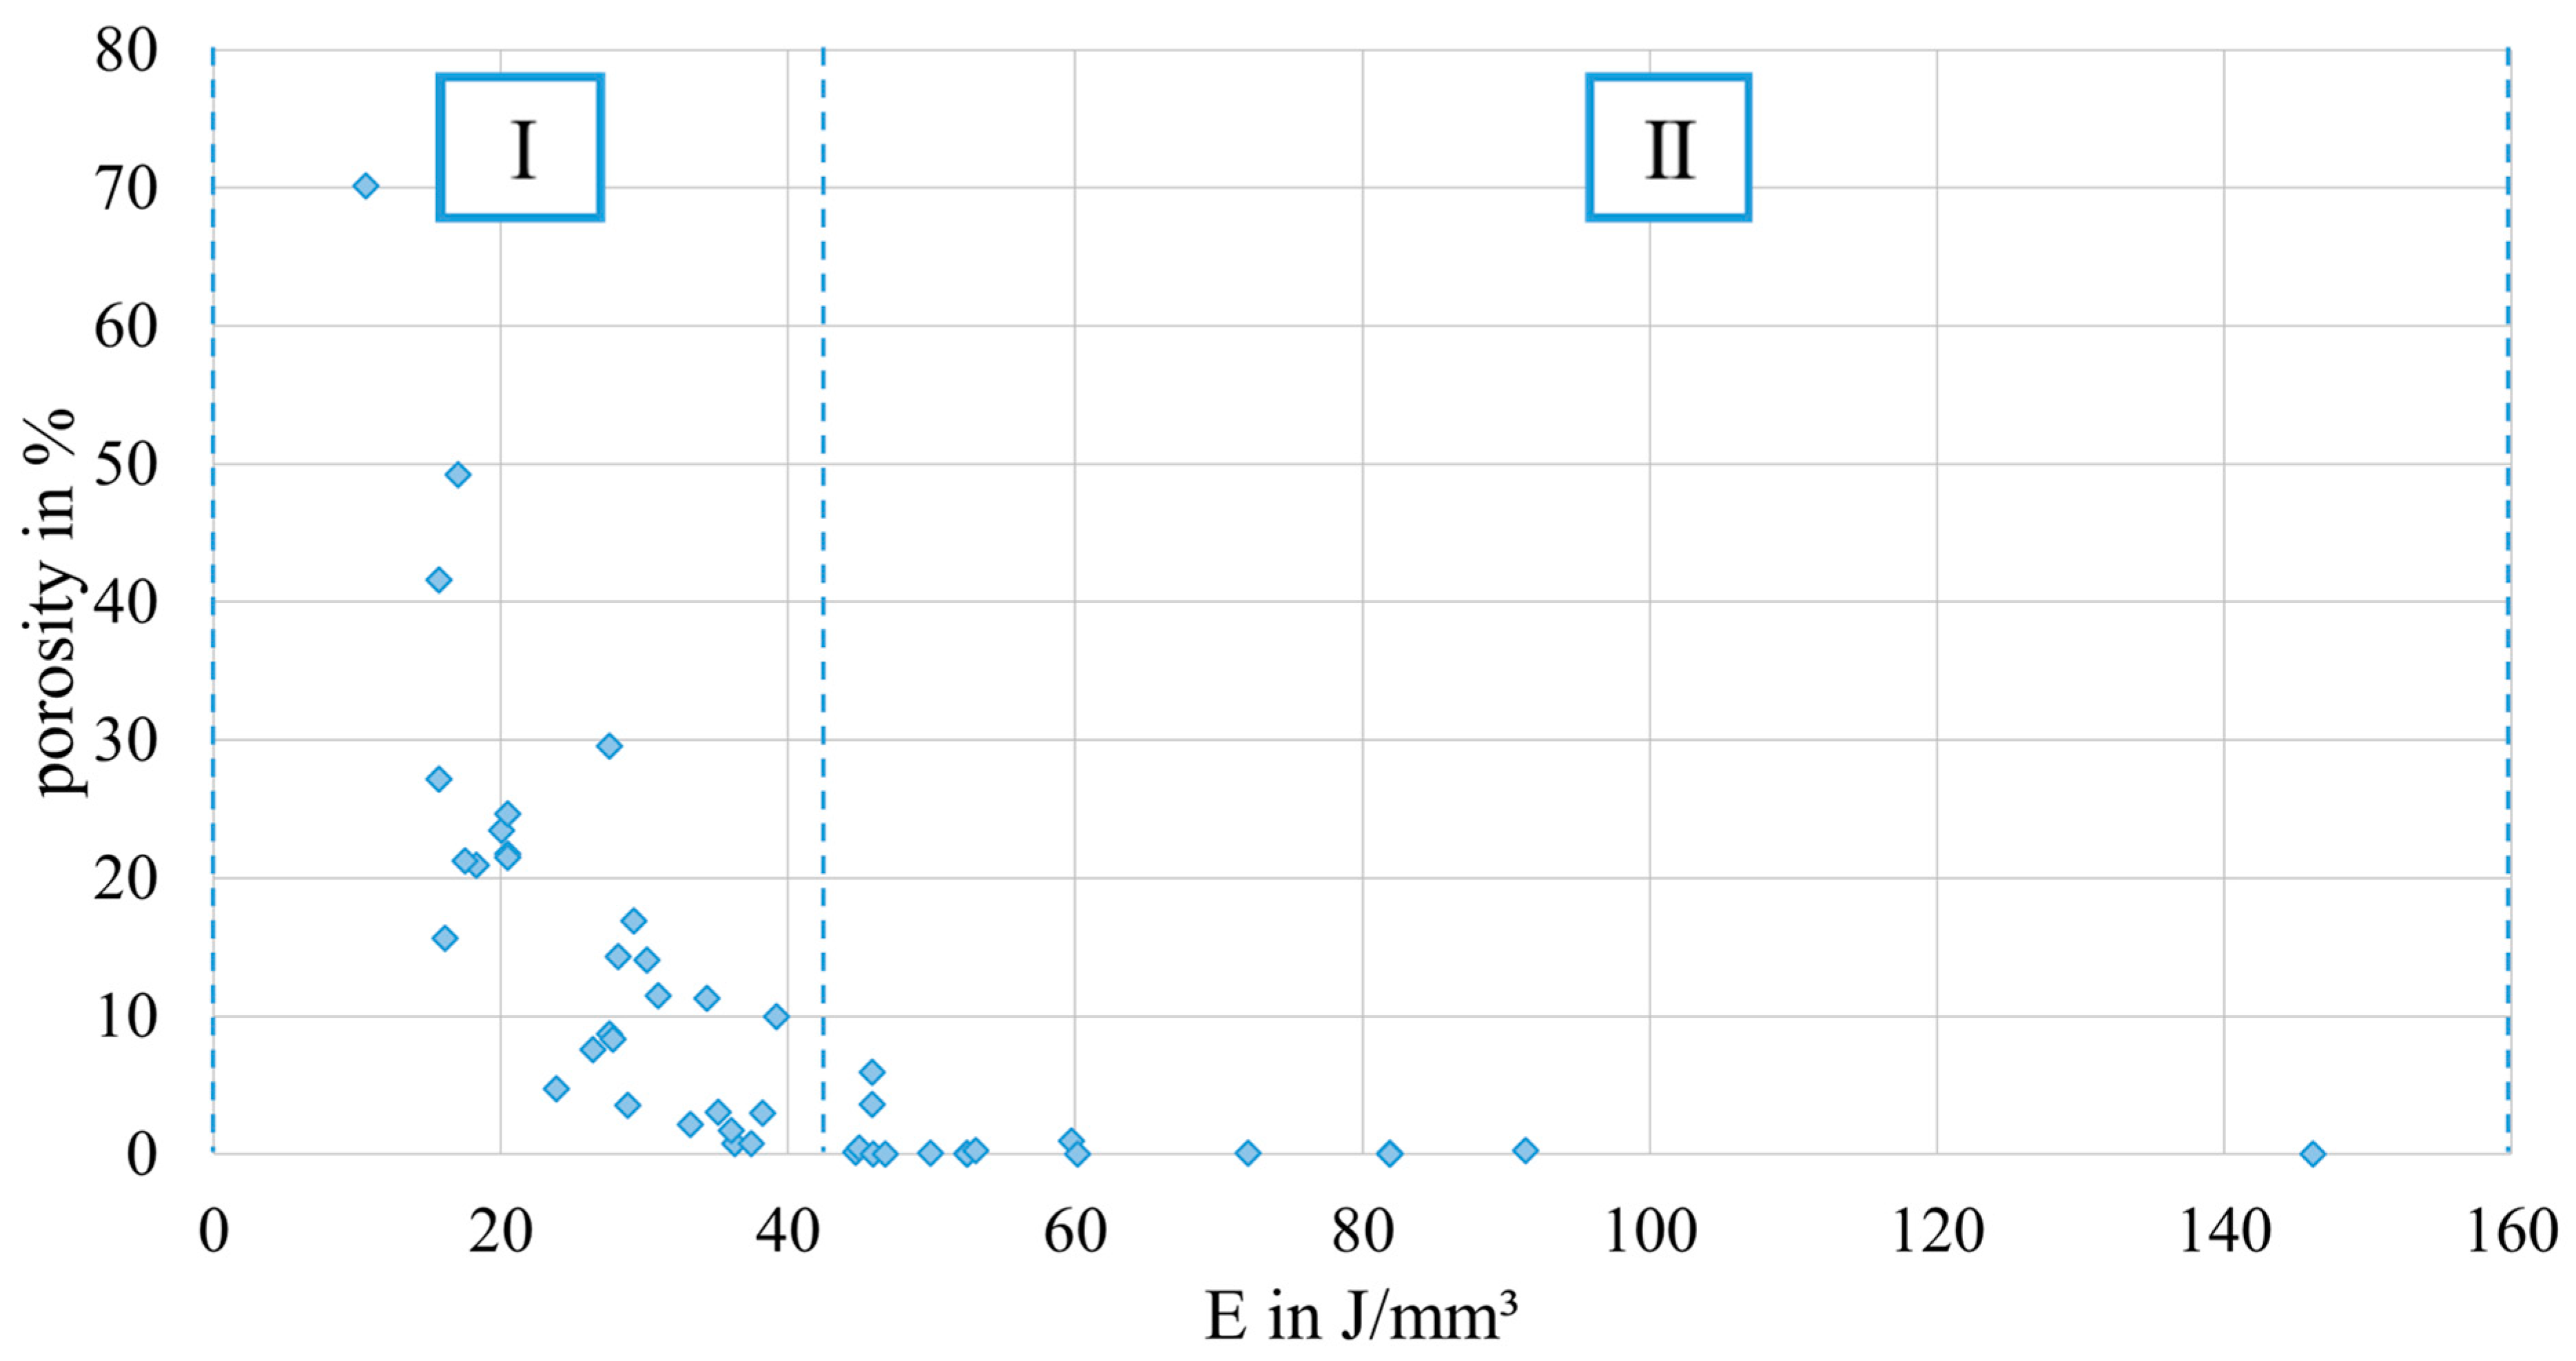
In
Figure 7, the porosity of the PBF-LB/M-processed 42CrMo4 samples as determined by image analysis using optical microscopy in dependence of
is plotted. Based on the porosity of the corresponding samples in combination with the occurring defect types, the resulting graph can be divided into two areas, i.e., high porosity (area I) and low porosity (area II). In area I, high porosity values of up to 70% occur in combination with a low
. Samples in this area are characterized by stripe pores, LoF defects, or sometimes, a mixture of both (representative examples of the occurring defects are shown in
Table 5). In area II, low porosity could be observed for high
values. In area II, most samples could be defined as fully dense material (porosity lower than 0.5%). However, three samples are characterized by the presence of LoF defects, eventually clarifying the significant importance of the consideration of the individual parameter combination as previously discussed in [
27]. The successful realization of nearly dense samples using low build plate temperatures is in line with the literature reporting on PBF-LB/M-processed 42CrMo4. For example, Damon et al. [
15] showed that the PBF-LB/M process is capable of producing low porosity parts in a broad range of process parameters using a build plate temperature of 200 °C and a layer thickness of 30 µm. Similar to the present study, low porosity (density higher than 99.7%, i.e., porosity lower than 0.3%) could be achieved using an
value higher than a certain limit (
value higher than 85 J/mm
3 in [
15]). The observed limits vary in both studies, due to the different layer thicknesses. The existence of different areas with respect to porosity depending on
was also reported in [
27] for an aluminum alloy, i.e., AlSi10Mg. However, comparing both studies, the ranges of
are shifted. For AlSi10Mg, area II characterized by low porosity was found in a range between
J/mm
3 and
J/mm
3 for
µm, demonstrating that lower
values are necessary to achieve fully dense material. These differences can be attributed to the different physical properties of the materials in focus, e.g., heat conductivity, melt viscosity, etc. Furthermore, 42CrMo4 is characterized by a higher melting point compared to AlSi10Mg. Thus, more energy is required to melt the powder, evidently resulting in increased
values for low porosity in the present study. For AlSi10Mg, a third area with high porosity, rationalized by keyhole porosity, was observed at high
[
27]. This area could not be detected in the present study, although it presumably exists at higher values of
. No cracks were observed in the samples of the present study, although a number of previous studies reported cracking as a critical issue in PBF-LB/M processing of 42CrMo4 at low build plate temperatures, e.g., in [
28]. Nevertheless, in [
15], samples without cracks could be produced using a build plate temperature of 200 °C.
In line with the results presented in
Section 3.1, samples representing a low, medium, and high E were analyzed with respect to porosity in order to investigate the repeatability. The samples produced with a low
reveal stripe pores and are characterized by high porosity values between 21.47% and 24.61%. Although this variation of porosity seems not to be extraordinary high, samples with stripe pores could lead to a high variation of the porosity values depending on the position and angle of the analyzed cross section [
27]. For the results of the present study, a similar cross section was used for all three samples, finally resulting in relatively low variation. The samples manufactured with the medium and high
are characterized by low porosity values and could be defined as fully dense material. The variation of porosity values is low for both
, which is in good agreement with data reported in [
27].
A mathematical model was calculated using
,
, and
as input and the porosity as output to ensure that a correlation exists and to investigate the shape and position of the processing windows leading to dense PBF-LB/M-manufactured 42CrMo4 samples. In [
27], samples with stripe pores were excluded from the modeling task due to the high variation of porosity values. Although this high variation was likewise observed in the present work, samples with stripe pores could not be excluded since the resulting data set would have been too small. Therefore, it has to be noted that the mathematical model is expected to have remaining uncertainties. As can be seen in
Table 6, the
values are relatively high, confirming this thesis. Nevertheless, the calculated model reveals high
values, so the model can be used for further investigations to identify major trends. The selected model terms are summarized in
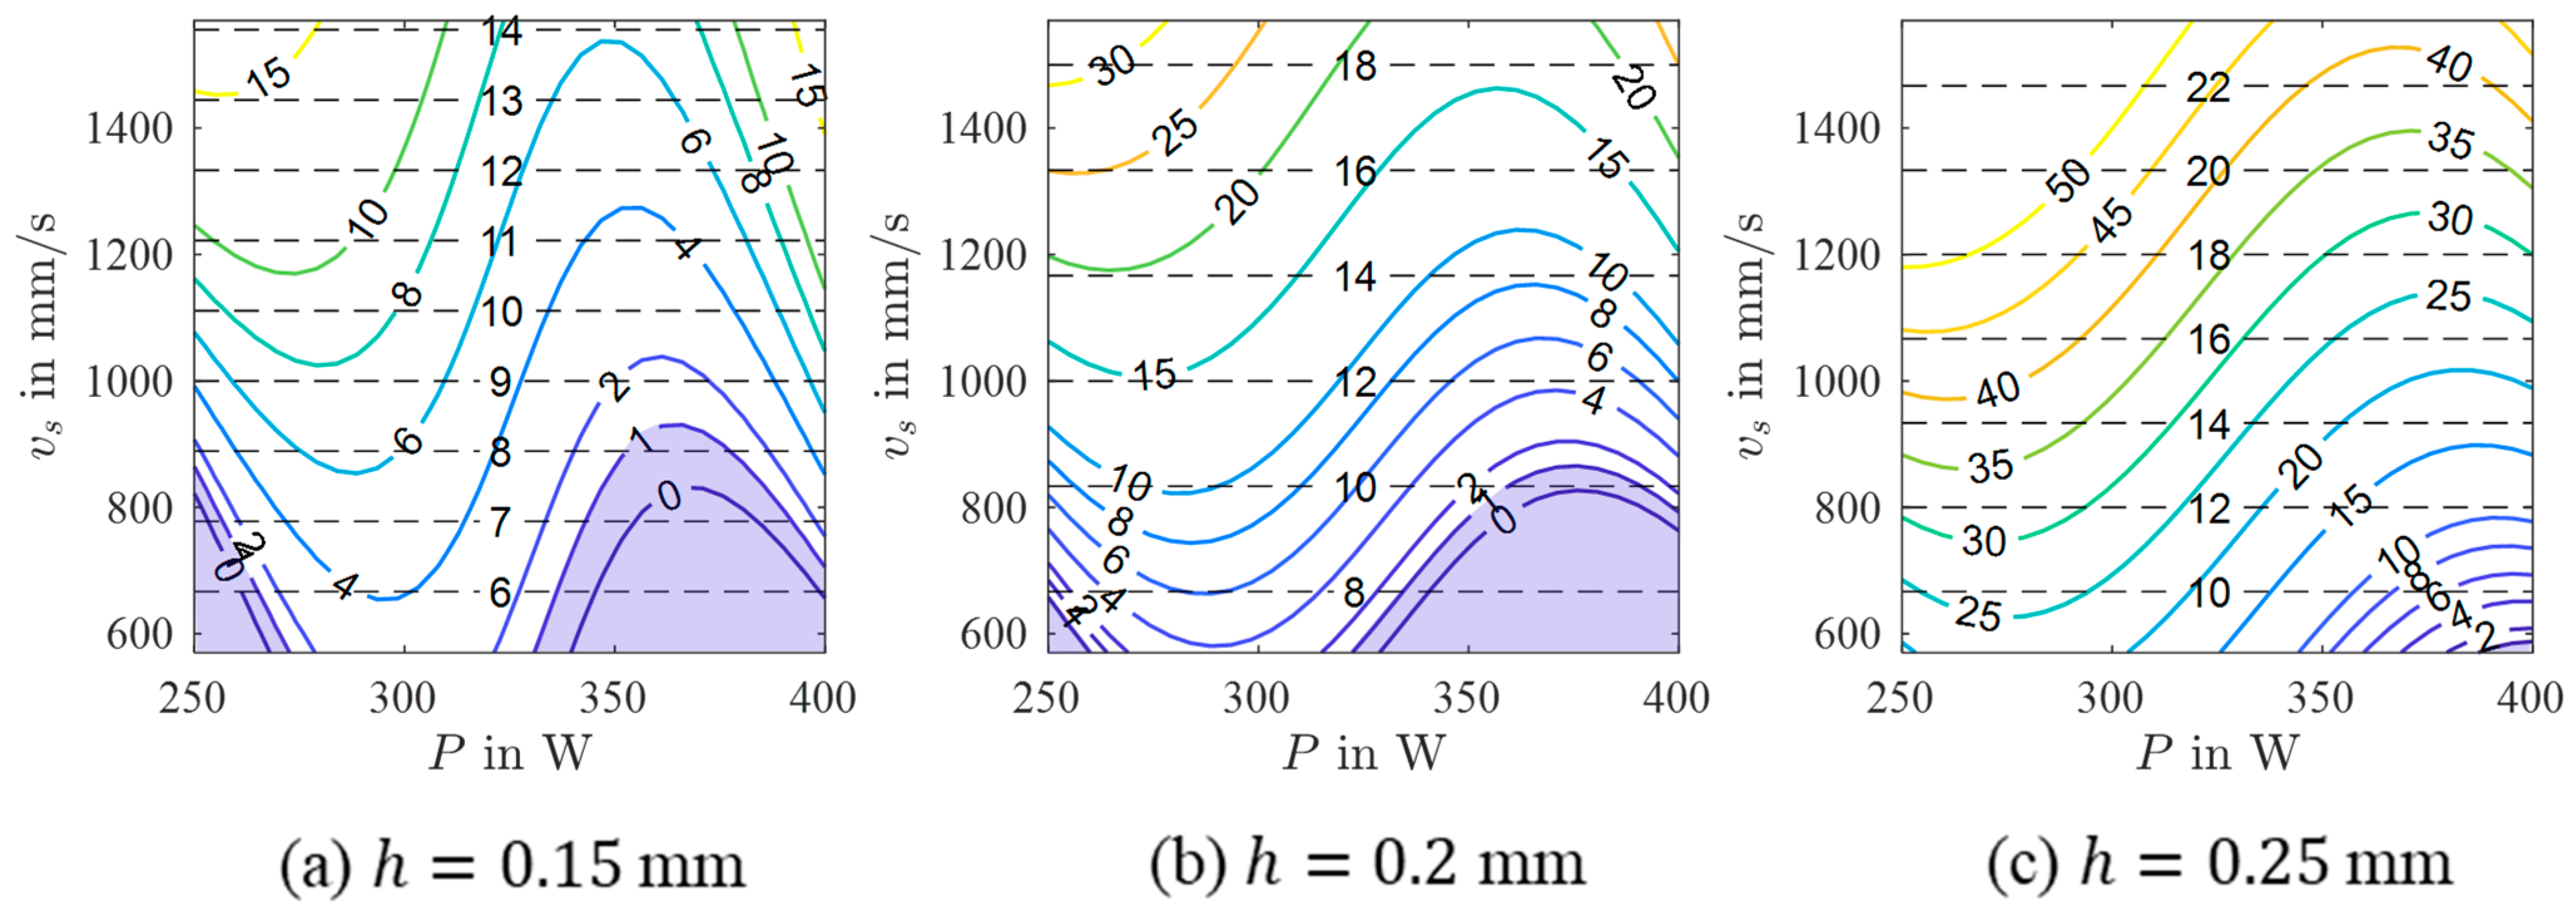
Table 7, and
Figure 8 shows contour plots in the
-
space for different
. The contour plots of
mm and
mm highlight two areas containing promising processing windows (porosity lower than 1%). The first area is located at low
and low
, while the second, bigger area is seen at high
and low
. Samples with low porosity were located in both areas, verifying the predicted processing windows. However, as samples located in the area at high
show small, not connected pores in a regular pattern revealing a less pronounced stripe pore appearance (referred to as dotted line pores in the remainder of the text, cf.
Table 5), the parameter combination must be assessed for each single application. It is possible that the two areas belong to a larger, coherent area that was not predicted by the models due to an insufficient amount of data in the corresponding parameter range. For
mm, only a small area containing an appropriate processing window exists at high
and low
. To conclude, the appropriate areas get smaller with increasing
. In a previous study [
27] focusing on processing windows for PBF-LB/M of AlSi10Mg, a shrinkage of the processing windows with increasing
was observed, as well. Moreover, the areas in the present study are shifting. The area located in a low
range shifts to lower
and lower
values with increasing
. The same behavior was observed for the processing windows of AlSi10Mg [
27]. In contrast, the area located in a high
range shifts to lower
and higher
values with increasing
. Eventually, this different behavior is thought to be related to the occurring defects (dotted line pores). With increasing
, a bigger melt pool is necessary to achieve a sufficient overlap between adjacent scan tracks to finally ensure low porosity. Since a bigger melt pool could be achieved using a lower
or a higher
[
28,
29], the area is shifted in this direction.
At this point, it has to be considered that the underlying model of 42CrMo4 is characterized by particular uncertainties. One reason for this fact is that the used data set includes many samples with stripe pores. Moreover, only relatively small parts of the areas with low porosity are captured by the model. Therefore, further parameter studies are necessary in the future to investigate a wide process parameter range around the determined areas with low porosity to eventually increase the database and to improve the prediction quality of the model in general.


