3.1. Compaction Test
Table 8 illustrates the results of the compaction tests, revealing trends in the optimal moisture content: With a constant amount of OPC, the optimum moisture content increases with the rise in recycled aggregate content. For instance, when the OPC content is 3.5%, and the RA content varies from 0% to 70%, the optimum moisture content increases from 4.6% to 7.8%. Keeping the recycled aggregate content constant, an increase in the OPC content results in a higher optimum moisture content. For instance, with a 0% RA content, as the OPC content increases from 3.5% to 5.5%, the optimum moisture content rises from 4.6% to 5.2%. Under the same RA content and cementitious material content, the GSC exhibits a higher optimum moisture content compared to the OPC, with an increase of approximately 0.4%. With a constant GSC content, the optimum moisture content increases with higher RA content. Similarly, with a constant RA content, an increase in GSC content leads to a rise in optimum moisture content, mirroring the trends observed with OPC.
Table 9 provides the maximum dry density obtained from the compaction tests. Key findings include: With a constant OPC content, the maximum dry density demonstrates a diminishing trend with an escalating RA content. While keeping recycled RA content unaltered, amplifying the OPC content results in an augmented maximum dry density. In scenarios where the RA and cementitious material contents are identical, GSC asserts its dominance, exhibiting a higher maximum dry density by approximately 0.1 g/cm
3 in contrast to OPC. At a stable GSC content, the maximum dry density experiences a decline in the presence of heightened RA content. Similarly, maintaining RA content at a constant and augmenting GSC content induces a rise in the maximum dry density, mirroring the patterns observed in OPC situations.
The analysis of the experimental results above indicates that, when the dosage of recycled aggregates and cementitious materials remains constant, both the maximum dry density and optimum moisture content of gypsum slag cement exceed those of ordinary Portland cement under similar conditions. This phenomenon can be attributed to the larger specific surface area of gypsum slag cement compared to ordinary Portland cement. The specific surface area of the gypsum slag cement used in this experiment is 525 m2/kg, whereas that of the ordinary Portland cement is 339 m2/kg. During the hydration process, cement particles with larger specific surface areas possess more surface area, thus requiring more moisture to wet and envelop each particle to ensure the fluidity and workability of the concrete. Consequently, the optimum moisture content of gypsum slag cement surpasses that of ordinary Portland cement. Consequently, during compaction tests, an increase in moisture content under identical volume conditions leads to enhanced concrete quality and, consequently, an increase in density.
3.2. Seven-Day Unconfined Compressive Strength
The detailed weights and compositions of the specimens in each group are delineated in the following
Table 10, as per academic convention.
Table 11 delineates the unconfined compressive strength acquired from specimens meticulously crafted and subjected to a seven-day curing period, grounded in the optimal moisture content and maximum dry density ascertained through the compaction test.
Figure 1 elucidates a column chart extrapolated from the data in
Table 11. An analysis of
Table 11 and
Figure 1 reveals the following observations: Within the same recycled material and binder composition, the unconfined compressive strength of GSC surpasses that of OPC. For instance, with a recycled material content of 60% and a binder content of 4.5%, the unconfined compressive strength is 4.7 MPa for OPC and 5.8 MPa for gypsum slag cement, signifying an increase of approximately 25%. When the GSC content remains constant, an augmentation in the recycled aggregate content leads to a diminution in the seven-day unconfined compressive strength. For instance, with the GSC content at 3.5% and the recycled material content at 0%, 50%, 60%, and 70%, the unconfined compressive strength descends from 4.8 MPa to 4 MPa, indicating a reduction of 16%. Holding a consistent recycled material content, an escalation in GSC corresponds to an augmentation in the unconfined compressive strength. For example, with the recycled material content at 0%, the GSC content at 3.5%, 4.5%, and 5.5%, the unconfined compressive strength ascends from 4.8 MPa to 7.7 MPa, representing an increase of approximately 60%. Analogous to GSC, the unconfined compressive strength of OPC diminishes with an upswing in recycled material content when the cement content is sustained. Conversely, with a constant RA content, an elevation in cement content leads to a surge in unconfined compressive strength.
Through the compaction test and the seven-day unconfined compressive strength test, it is discernible that, at a cement content of 4.5%, OPC aligns with the requisites for foundational road construction expounded in the Technical Specifications for Highway Base Construction (JTG/T F20-2015) [
27] for high-speed highways and first-class roads enduring heavy traffic (4–6 MPa). GSC, at a content of 3.5%, already meets these road-grade specifications. Furthermore, with a GSC content of 4.5%, it satisfies the criteria for foundational road construction in conditions of extremely heavy and special heavy traffic on high-speed highways and first-class roads (5–7 MPa).
3.4. Indirect Tensile Strength Test
The comprehensive outcomes of this testing are meticulously detailed in
Table 13 and
Table 14.
Table 13 presents the results of the seven-day indirect tensile strength tests, and
Figure 3a provides a visual representation of the data. The findings reveal several key observations: Under consistent proportions of recycled materials and binder content, GSC demonstrates a superior indirect tensile strength compared to OPC. For instance, with a recycled material content of 60% and a binder content of 4.5%, the indirect tensile strength of OPC is 0.32 MPa, while that of GSC is 0.38 MPa, indicating a notable enhancement of approximately 19%. With a constant GSC content, the seven-day indirect tensile strength decreases as the RA content increases. For example, with a GSC content of 3.5% and a recycled material content varying from 0% to 70%, the indirect tensile strength decreases from 0.38 MPa to 0.25 MPa, marking a substantial reduction of 34%. Maintaining a consistent recycled material content, an increase in GSC content leads to a corresponding rise in the seven-day indirect tensile strength. For instance, with a recycled material content of 0%, a GSC content of 3.5%, 4.5%, and 5.5%, the indirect tensile strength increases from 0.38 MPa to 0.51 MPa, representing an approximately 34% improvement. The behavior of OPC aligns with that of GSC. When the content of OPC is constant, an increase in recycled material content results in a decrease in the indirect tensile strength. Similarly, with a constant RA content, an increase in the cement content leads to an enhancement in the indirect tensile strength.
Moving to
Table 14, which showcases the results of the 28-day indirect tensile strength tests, and
Figure 3b, depicting the corresponding graphical representation, we draw the following conclusions: The patterns observed in both OPC and GSC for the 28-day tests mirror those identified in the 7-day tests. After 28 days of curing, the indirect tensile strength of GSC remains notably higher than that of OPC, displaying an increase of approximately 20%. The strength of both OPC and GSC experiences a positive growth, with an approximate 10% increase in indirect tensile strength after 28 days of curing.
3.5. XRD Test Results and Analysis
Figure 4 illustrate the XRD patterns of the activator and cement, respectively. An analysis of these spectra reveals that the primary constituents of the activator are gypsum (CaSO
4) and sulfoaluminate cement clinker, characterized by predominant phases of C
2S and Ca
4Al
6(SO
4). In contrast, the ordinary Portland cement is primarily composed of SiO
2, CaCO
3, C
3S, and C
2S, as evident from the XRD results.
Figure 5a depicts the XRD patterns of GSC hydration after one day, utilizing exclusively new aggregates. The following conclusions can be drawn from the analysis: The hydration products are predominantly consistent after one day when the slag–activator ratio is either 4:1 or 4:2. The heightened proportion of the activator results in a more pronounced presence of CaSO
4 characteristic peaks in the XRD pattern when the slag–activator ratio is 4:2, as compared to the ratio of 4:1. Both ratios exhibit the presence of C-S-H gel and AFt in the XRD patterns. However, a nuanced observation suggests that, when the slag–activator ratio is 4:2, the intensity of the peaks corresponding to the C-S-H gel and AFt appears to be marginally greater than in the case of a 4:1 ratio.
Figure 5b presents the X-ray diffraction (XRD) pattern of GSC after 28 days of hydration with entirely new aggregates. From the graph, the following observations can be made: The products are essentially consistent when the slag–activator ratio is 4:1 or 4:2 after 28 days of hydration. After 28 days of hydration, the characteristic peaks of various hydration products when the slag–activator ratio is 4:2 are significantly stronger than those when the ratio is 4:1.
Combining the insights from
Figure 5a,b, it can be concluded that in the early stages of GSC hydration, the slag–activator ratio has a relatively minor impact on the hydration reaction. However, with the passage of time, the hydration reaction is notably sluggish when the slag–activator ratio is 4:1, leading to a virtually zero unconfined compressive strength at the macroscopic level. This phenomenon is attributed to the hydration mechanism of GSC, wherein gypsum serves as the sulfate activator for slag, and the sulfoaluminate cement clinker acts as the alkaline activator. Under the influence of these two activators, granulated blast furnace slag is stimulated to hydrate. The key to this activation lies in achieving a certain level of alkalinity in the entire system during the reaction process. If the alkalinity of the entire system is insufficient, i.e., in the presence of fewer OH- ions, the surface structure of the slag cannot be disrupted. This prevents the precipitation of active SiO
2 and active Al
2O
3, leading to a limited formation of Al
3+ and Si
4+ ions. Consequently, the subsequent formation of C-S-H gel and ettringite becomes compromised. Therefore, by increasing the proportion of the activator, the OH- ions provided by the hydration of cement clinker increase, reaching the alkalinity required for GSC hydration. The hydration reaction of GSC continues normally under the condition of entirely new aggregates, resulting in a macroscopic unconfined compressive strength reaching normal values and even surpassing the strength of specimens made with OPC.
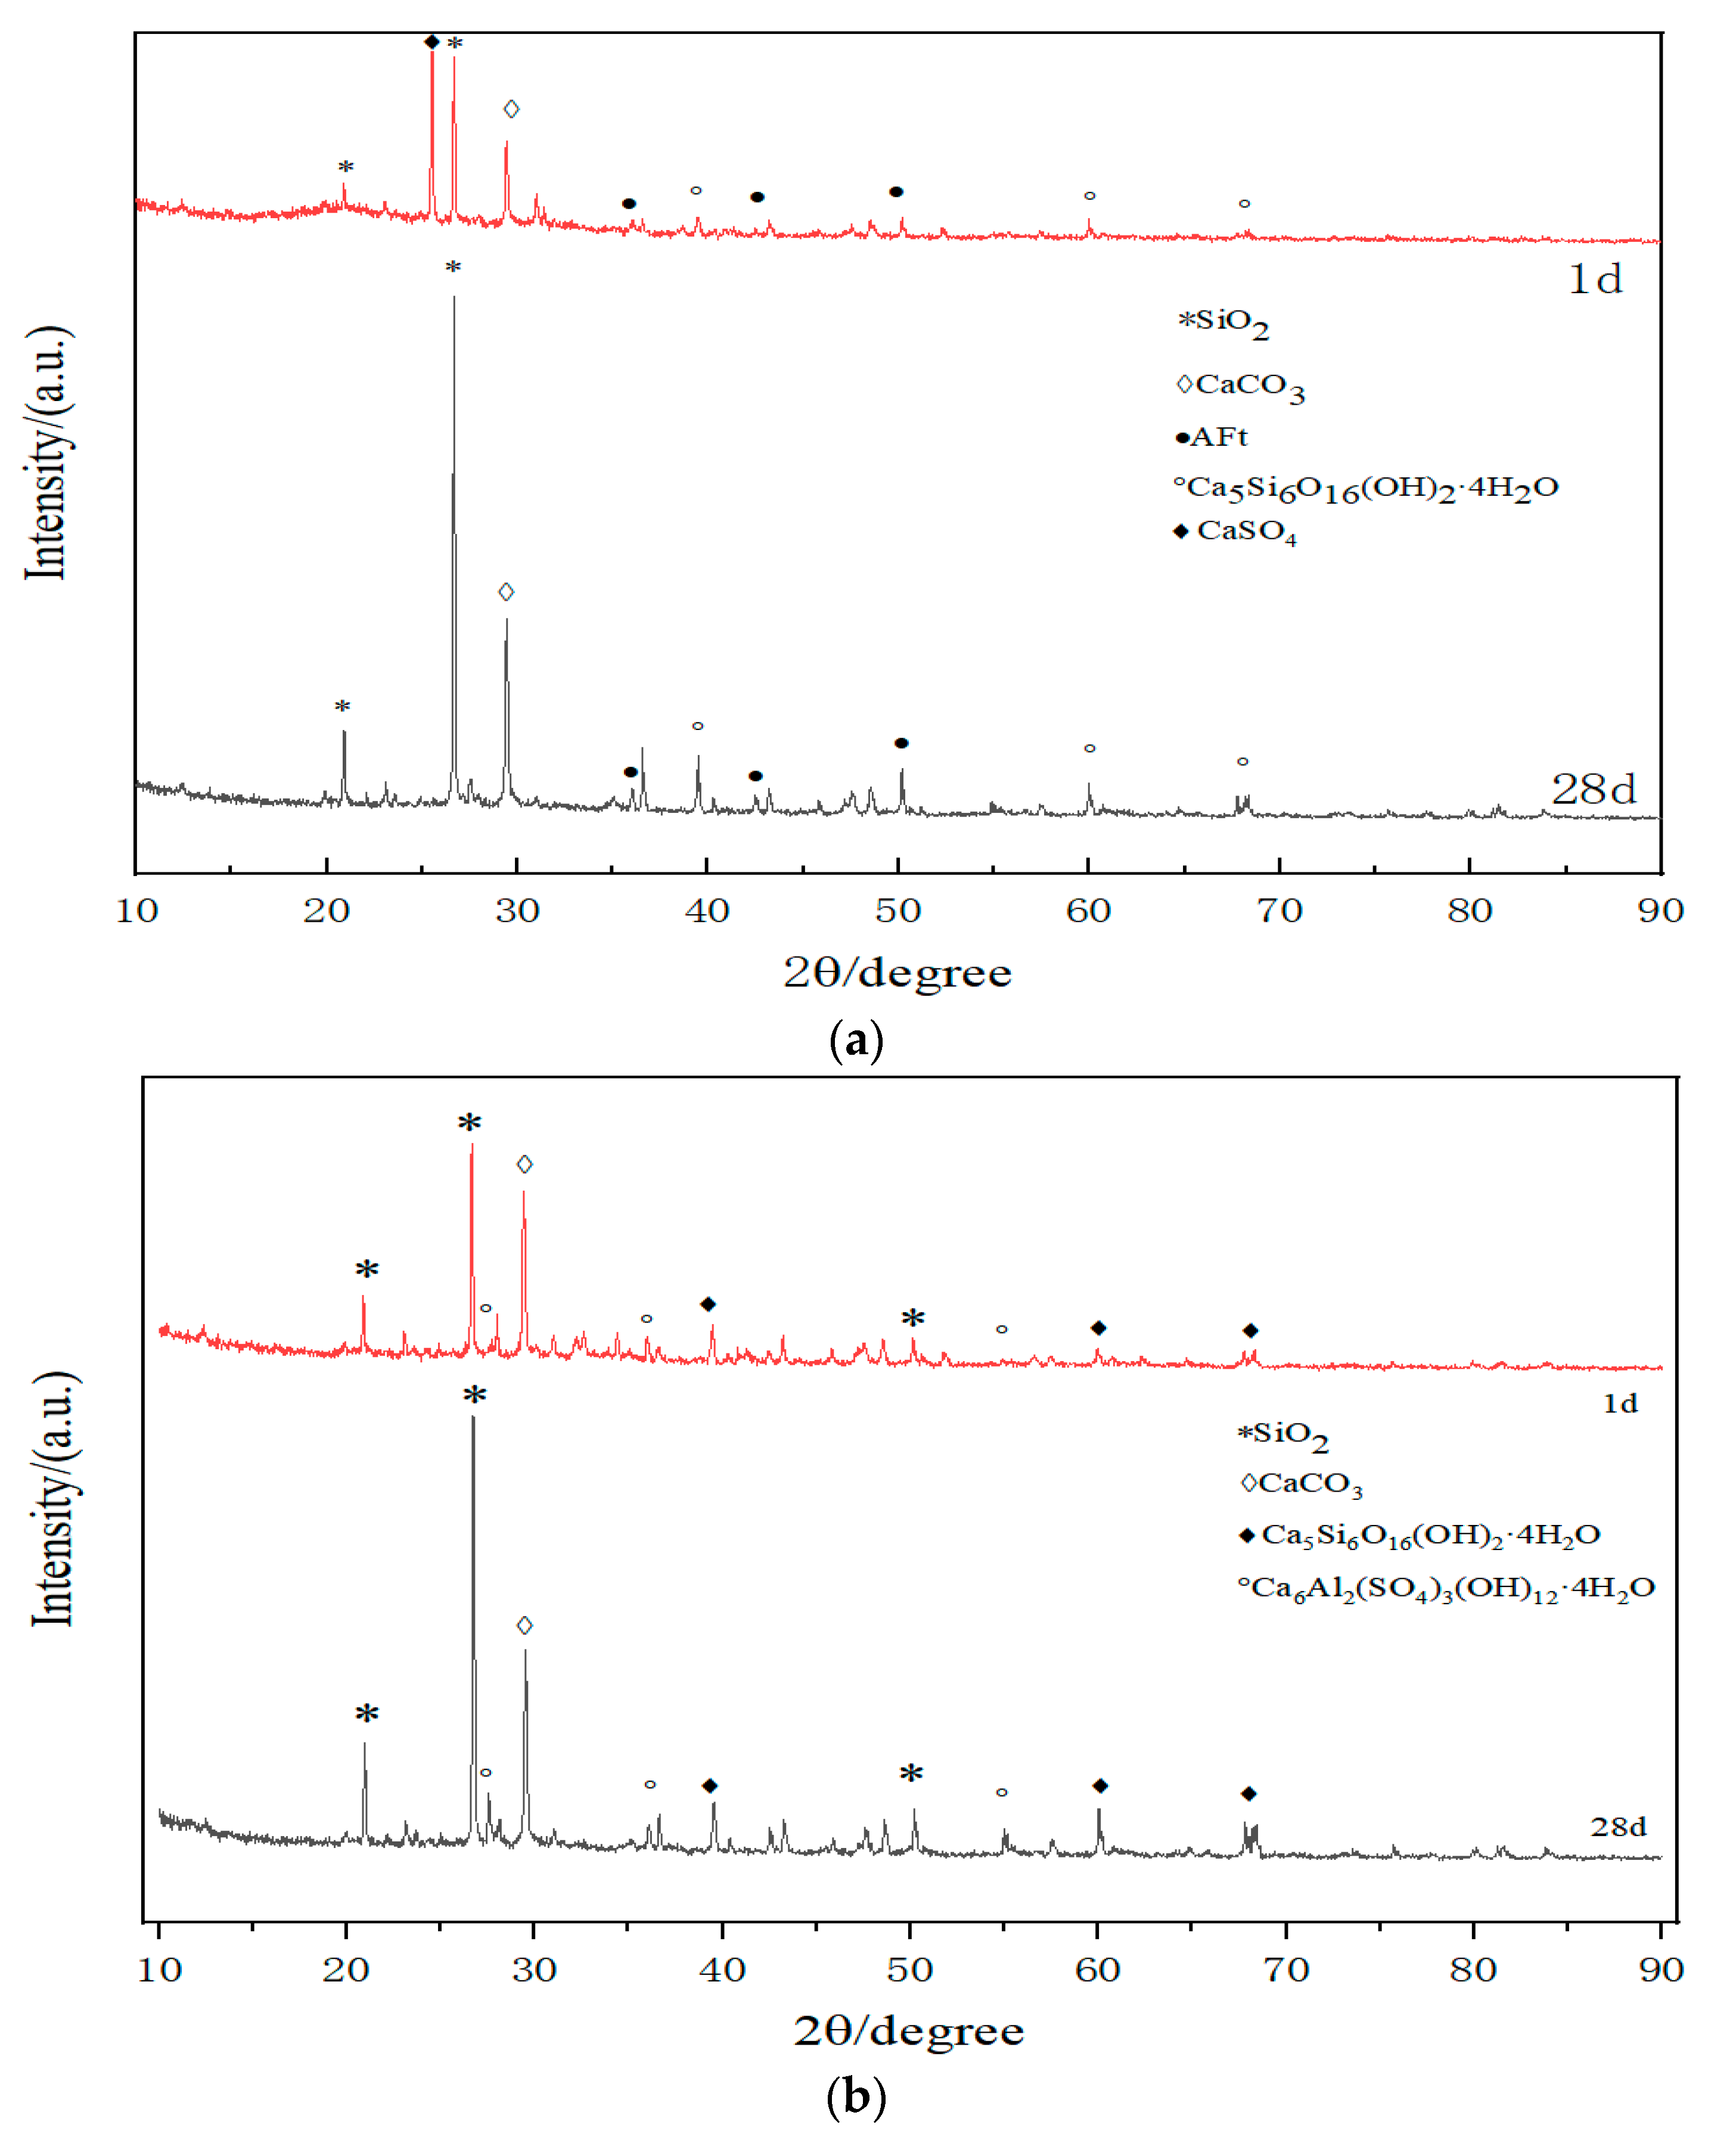
Figure 6a illustrates the XRD analysis of hydration products at different ages for a 4.5% GSC with a 70% recycled material content. The hydration mechanism of GSC involves the initial dissolution of gypsum, a sulfoaluminate cement clinker, and other components within the system, resulting in the release of OH
−, Ca
2+, SO
42−, and a modest quantity of Si
4+ and Al
3+ ions. This initiates the formation of limited amounts of hydrated calcium silicate gel and hydrated calcium aluminate gel.
Following this, the hydrated calcium aluminate gel reacts with the SO42− ions in the system, giving rise to ettringite. However, due to the constrained availability of the cement clinker, there is a deficiency of Si4+ and Al3+ ions in the system, impeding further hydration reactions. Nevertheless, the preceding hydration reactions elevate the alkalinity of the entire system. Under the influence of OH− ions, the Si-O and Al-O in the slag undergo depolymerization-repolymerization reactions, hastening the dissolution of Si4+ and Al3+ ions. This leads to the liberation of Ca2+ ions into a free state, participating in reactions within the alkaline environment to form a C-S-H gel and hydrated calcium aluminate gel.
Concurrently, the presence of calcium sulfate augments the sulfate content in the binder material, engaging in reactions with hydrated calcium aluminate to form ettringite. As per the elucidated hydration mechanism,
Figure 6a reveals distinct features. At one day of hydration, the pronounced characteristic peak of CaSO
4 suggests the incomplete participation of gypsum in the hydration reaction. Although the characteristic peaks of hydrated calcium silicate gel and AFt are discernible, their intensities are comparatively subdued. With the progression of hydration, particularly after 28 days of curing, a notable reduction in the intensity of the CaSO
4 peak is observed in contrast to the 1-day hydration period. Conversely, the characteristic peaks of hydrated calcium silicate gel and ettringite exhibit a significant augmentation in intensity. This phenomenon is macroscopically manifested as an elevation in compressive strength with the extension of the curing period.
The outcomes reveal a noteworthy observation: under a 4:1 ratio of slag-to-activator, GSC fails to achieve the requisite strength in the absence of recycled materials (0% content). However, a modification in the 4:2 slag–activator rectifies this deficiency, enabling the attainment of the desirable strength. Intriguingly, in scenarios where the recycled material content is 50%, 60%, and 70%, GSC demonstrates strength even under the 4:1 ratio.
This phenomenon can be elucidated by the inclusion of recycled fine powder in the recycled aggregates, which contains substances such as CaOH capable of supplying additional OH- ions. This augmentation in OH- ions enhances the overall alkalinity of the reaction system, facilitating sustained reactions within gypsum slag cement even when subjected to a 4:1 ratio.
Figure 6b depicts the XRD analysis of the hydration products at various stages for 4.5% OPC with a 70% recycled material content. The hydration mechanism of OPC involves the predominant early stage hydration of C
3S, resulting in the formation of hydrated calcium silicate (C-S-H) and crystalline calcium hydroxide. The hydration of C
2S progresses at a slower rate, yielding primarily C-S-H and a minor amount of calcium hydroxide. C
3A exhibits the fastest reaction rate, with the primary products being ettringite (AFt) and monosulfate (AFm).
In accordance with the aforementioned reaction mechanism, characteristic peaks of C-S-H and ettringite are observable after one day of hydration, albeit with a reduced intensity. However, after 28 days of hydration, the characteristic peaks of C-S-H and ettringite exhibit an increased intensity compared to the 1-day hydration period. This is reflected at a macroscopic level by an elevation in the unconfined compressive strength.
Analyzing the XRD patterns of GSC and OPC, it can be inferred that the hydration products of both predominantly consist of ettringite and C-S-H gel, with no significant differences between the two in terms of their hydration products.
3.6. SEM Results and Analysis
The experimental parameters for the scanning electron microscopy (SEM, Zeiss, Oberkochen, Germany) analysis were as follows:
Figure 7a and
Figure 8a were conducted with an Extraction High Tension (EHT) of 20 kV, a Working Distance (WD) of 6.5 mm, and a magnification of 3.00 k×. For
Figure 7b and
Figure 8b, the parameters were set to EHT = 20 kV, WD = 6.0 mm, and a magnification of 3.00 k×.
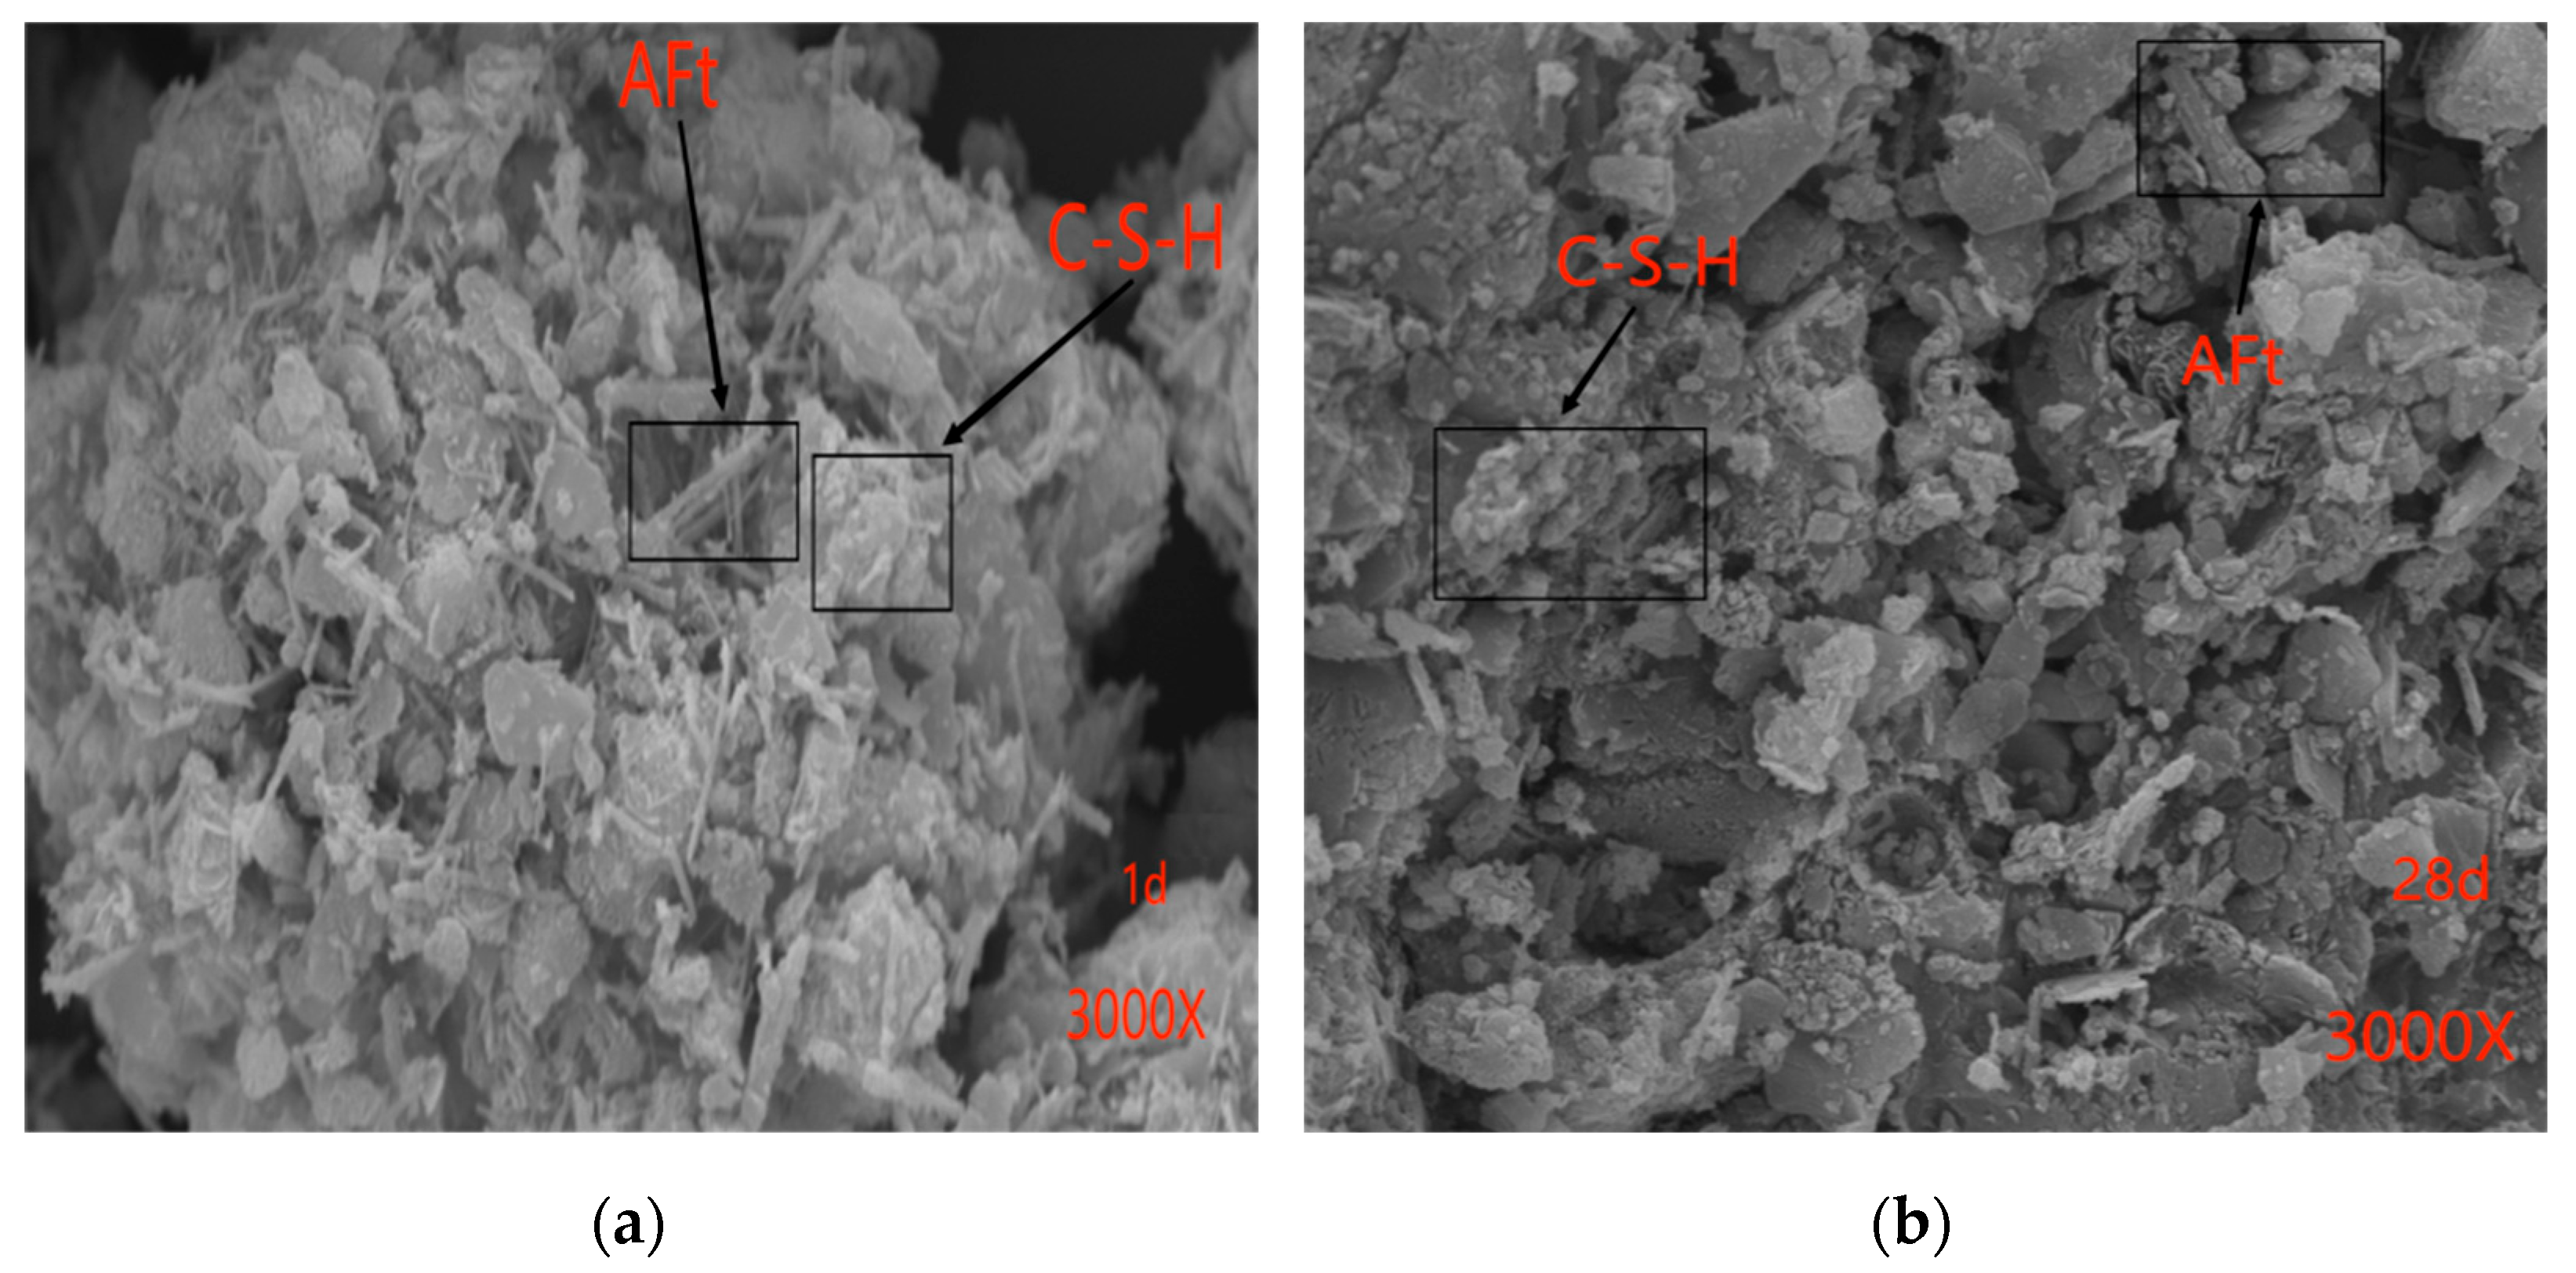
The microstructural characteristics of OPC and GSC were examined at various curing durations using scanning electron microscopy (SEM).
Figure 7a,b presents SEM images depicting the microstructure of ordinary Portland cement after curing for 1 day and 28 days. In these images, the conspicuous white fibrous entities correspond to the C-S-H gel, while the needle-like formations represent the hydration product AFt, some of which are encased within the fibrous C-S-H gel. With the progression of hydration, AFt assumes a more robust morphology, accompanied by an augmented presence of the surrounding C-S-H gel, forming a closely intertwined matrix. Although discernible AFt is evident after the initial day of hydration, its morphology becomes more pronounced with the elapse of time.
Figure 8a,b provides SEM images illustrating the microstructure of GSC after curing for 1 day and 28 days. The hydration products of GSC closely resemble those of OPC, comprising a C-S-H gel and AFt. However, GSC exhibits a higher abundance of AFt, particularly at the 28-day hydration mark when ettringite (AFt) emerges as a principal contributor to early strength, notably in the context of sulfate-resistant cements. Furthermore, it is evident from
Figure 7b and
Figure 8b that after a curing period of 28 days, the hydration products of GSC are notably more abundant compared to those of OPC. Consequently, it can be inferred that the microstructure of GSC exhibits a higher degree of compactness in comparison to OPC. This microscopic analysis elucidates why the strength of GSC surpasses that of OPC.


