Article

Modelling and Optimization of Machined Surface Topography in Ball-End Milling Process

1
College of Mechanical and Electrical Engineering, Harbin Engineering University, Harbin 150001, China
2
College of Power and Energy Engineering, Harbin Engineering University, Harbin 150001, China
*
Authors to whom correspondence should be addressed.
Materials 2024, 17(7), 1533; https://doi.org/10.3390/ma17071533
Submission received: 27 February 2024 / Revised: 23 March 2024 / Accepted: 25 March 2024 / Published: 27 March 2024
(This article belongs to the Topic Advanced Manufacturing and Surface Technology)

Abstract

:
In order to optimize machined surface topography, this paper presents a novel algorithm for simulating the surface topography and predicting the surface roughness of a ball-end milling process. First, a discrete workpiece model was developed using the Z-map method, and the swept surface of a cutter edge was represented using triangular approximation. The workpiece surface was updated (i.e., material removal process) using the intersection between the vertical reference line and the triangular facet under a cutting judgement. Second, the proposed algorithm was verified by comparing the simulated 3D surface topography as well as 2D surface profile and average roughness (Sa) with experimental measurements. Then, numerical simulation examples planed by the Box–Behnken design methods were carried out to investigate the Sa in the ball-end milling operation. The correlations of Sa and cutting parameters were represented by a response surface reduced quadratic model based on the ANOVA results. Finally, the feed per tooth, radial depth of cut, and tilt and lead angles were optimized for improving the machining efficiency under the Sa constraints. This study presents an effective method for simulating surface topography and predicting the Sa to optimize the cutting parameters during ball-end milling process.

1. Introduction

Surface topography has a clear effect on the performance of components, such as their contact, friction, wear, and lubrication properties [1,2]. Surface topography is characterized by the surface roughness quantity for evaluating surface quality. Ball-end milling is one of the most widely used machining operations in various industries, such as aerospace, automobile, bioengineering and molding, as a semi-finish and finish method to replace grinding or polishing for improving the machining efficiency [3]. Therefore, the surface finish and dimensional accuracy of the final part are mainly determined by the ball-end milling operation in the finishing stage. According, the surface topography is easily influenced by many factors (cutting parameters) via ball-end milling. Chen et al. [4] investigated the effects of cutter inclination angle on the surface topography geometrical features using cutting experiments. Zhang et al. [5] investigated the ratio and product of the feed per tooth and radial depth of cut using an analytical model for reducing the surface roughness at a constant material removal rate. Peng et al. [6] investigated the effects of the cutter initial phase angle on the surface topography in micro-ball-end milling, and the surface texture was controlled by planning the noncutting tool path. Zhang et al. [7] used a modified cutting edge to develop a surface topography model considering the tool flank wear effect. Zhang et al. [8] considered stochastic tool wear for simulating the surface topography in micro-milling. Lotfi et al. [9] developed a modified cutter/workpiece engagement algorithm for simulating the surface model in five-axis ball-end milling considering the cutter deflection and cutter runout. Hao et al. [10] introduced a correction model of ball-end milling by wear and force deformation for simulating the surface topography. Omar et al. [11] proposed an integral model for simulating the surface topography and predicting the cutting force simultaneously, and investigated the effects of cutter axis tilt, cutter runout, tool deflection, systems dynamics, and face wear for the surface topography in the ball-end milling. Wang et al. [12] investigated the effects of cutting vibration on the surface topography in ball-end milling of thin-walled parts using a numerical method. Li et al. [13] investigate the geometrical errors imposed by the machine tool on the surface topography in five-axis ball-end milling processes, and evaluated quantity by means of modal coefficients. Biondani et al. [14] developed a surface topography model for investigating the effect of cutter edge micro-geometry on the surface topography and roughness based on an actual cutting-edge model and a judgment of minimum chip thickness. Therefore, numerical simulation has more applications compared with milling experiments for investigating the surface topography in ball-end milling operation. The surface topography simulation involves lower costs and is less time-consuming.
The surface topography simulation methods can be classed into three groups: solid modeling, iterative methods, and discretization. In the solid modeling methods [15], the material removal process is simulated by the Boolean operations between the cutter swept volume and workpiece. The iterative method was first proposed by Zhang et al. [16]. Mathematically, it is like solving the intersection of the swept surface of the cutter edge and the reference line at a selected workpiece point by solving the nonlinear equation using iterative methods. In the discretization methods, first, the cutter is dispersed into a series of units. The workpiece is constructed by means of the Z-map, N-buffer, Dexel and Voxel elements, cut plane, points set, etc. Then, machining time (or tool path) is dispersed, and at each discrete time point (or discrete cutter location point), the surface topography value (i.e., coordinate of workpiece surface) can be determined by the cutter edge unit intersecting with the workpiece. According to related research works, these are the main problems with the solid modeling as well as iterative methods and discretization. Indeed, in the solid modeling techniques, the computation of the intersection between geometrical objects is difficult and time-consuming. In iterative methods, a good initial value (also called starting point) must be determined first, while the determination of the initial value is not an easy task due to the nonlinearity of the equation of the swept surface and multiple intersections with the reference lines. In discretization methods, the computation efficiency and accuracy are low because of the plentiful discretization for the cutter and workpiece. However, the discretization method is still widely employed for modeling as a result of its extensibility and robustness with respect to solid modeling and iterative methods. Moreover, some study works have been performed to improve the accuracy and efficiency of the discretization method. Li et al. [17] introduced iterative methods to improve the discrete methods. In other words, they proposed a new initial value selection algorithm using discretization methods for the iterative methods. Xu et al. [18], Yang et al. [19], and Chen et al. [20] improved the discrete method using different interpolation methods. Therefore, the discretization method was adopted to develop the surface topography model. Meanwhile, an efficient algorithm for calculating the intersection point of the swept surface and workpiece was proposed, which is the key technology for simulating surface topography successfully.
The optimization of cutting parameters is simple and effective in machining process for obtaining the desired surface topography and roughness. Dikshit et al. [21,22] optimized the cutting parameters for minimizing the surface roughness using the response surface methodology in the ball-end milling of AL2014-T6. Zhou et al. [23] developed a modified grey relational analysis model for optimizing the surface roughness and residual stress in the ball-end milling of Inconel 718. Buj-Corral et al. [24] developed an artificial neural network for correlating surface roughness with cutting parameters to obtain the optimal machining strategy in the five-axis ball-end milling of W-Nr. 12344. Venkata-Rao et al. [25] considered the surface roughness as a constraint for reducing power consumption in the micro-ball-end milling of D2 steel. Sonawane et al. [26] used a response surface methodology for optimizing the cutting parameters and obtaining the minimum surface roughness in the high-speed ball-end milling of Inconel-718 thin cantilevers. Torres et al. [27] proposed a structured numerical simulation using several friction coefficient approximations, and adapted it to a pre-textured martensitic precipitation hardening stainless-steel. Cross et al. [28] investigated the surface topography of material measures using confocal microscope and atomic force microscope measurements, and it was found that the surface topography depends primarily on the spindle speed and much less on the feed per tooth, whereas differences between the milling tools are observed in the tendency to form substructures. Klauer et al. [29] found that the ploughing of the material instead of a cutting occurs when too-small tilt angles are applied, and investigated the tilt angle’s influence on the resulting roughness and machined geometry using micro-milling sinusoidal freeform surfaces at different tilt angles. Arruda et al. [30] optimized the surface roughness using the Taguchi method in the ball-end milling of AISI P20. Despite all this, there is a lack of research on improving the machining efficiency when surface roughness is applied as a constraint.
The objective of this study is to present a surface topography simulation algorithm for replacing a milling experiment to study the surface roughness during ball-end milling processes. As mentioned earlier, in order to model the surface topography, the intersection point between the swept surface of the cutter edge and the workpiece must be solved first. Hence, in the current study, an efficient numerical algorithm was proposed for calculating the intersection point between the swept surface and workpiece using an improved discretization method. To this end, first, the swept surface of the cutter edge was formulated by means of the homogeneous coordinate transformation and the kinematics of the ball-end milling cutter. Then, a discrete workpiece model was developed using the Z-map method, and the swept surface was represented using a triangular approximation. Finally, the intersection is calculated from the vertical reference lines and triangular facet. Once the intersection is solved, the mesh point of the workpiece surface can be updated by the intersection point with a smaller z-coordinate. The main contribution of the current study pertains to the central part of the proposed model, i.e., an algorithm for calculating the intersection point of the swept surface and the workpiece for updating the workpiece surface.
Henceforth, the paper is organized as follows. In Section 2, the surface topography simulation algorithm is presented in detail. In Section 3, milling experiments are carried out to valid the proposed algorithm. A response surface model has been developed for improving the machining efficiency under the average roughness (Sa) constraint. Finally, the conclusions of the work are summarized in Section 4.

2. Modeling of Machined Surface Topography

In order to obtain the equation of the swept surface of a cutter edge, the coordinate systems involved in the ball-end milling of flat surface processes are established as shown in Figure 1.
Machine tool coordinate system, OmXmYmZm = {Om; e1M, e2M, e3M}: the global coordinate system, Om, is placed at the origin of the machine tool, and e1M, e2M and e3M can be determined by the kinematic structure of the machine tool.
Cutter coordinate system, OcXcYcZc = {Oc; e1C, e2C, e3C}: the local coordinate system is fixed on the ball-end milling cutter. Oc is placed at the ball center and defined as the cutter location (CL) point. e3C is along the cutter axis. e1C is along the tangent of the cutter edge at the cutter tip. e2C is the cross product of e3C and the e1C, e2C = e3C × e1C. The cutter revolves around the spindle axis at an angular speed ω, and the cutter axis and the spindle axis show eccentricity, e.
Spindle coordinate system, OsXsYsZs = {Os; e1S, e2S, e3S}: local coordinate system attached to the spindle. Os is placed at the intersection between the axis of the spindle and the XcYc plane. e3S is placed along the axis of the spindle, which is parallel to the e3C. The spindle translates along the cutter path at rOc = (xOc, yOc, zOc). When the tilt and lead angles are equal to zero, e1S is parallel to e1M and e2S is parallel to e2M, while e3S is parallel to e3M.
Process coordinate system, OpXpYpZp = {OP; e1P, e2P, e3P}: the local coordinate system is placed at the cutter path. Op is placed at the cutter path and consistent with Os. e1P is along the feed direction and assumed to be e2W, e3P is along the normal direction of the cutter center location surface and is parallel to e3M, e2P is along the cross-feed direction and is also the cross product of e3P and e1P, e2P = e3P × e1P.
Workpiece coordinate system, OwXwYwZw = {Ow; e1W, e2W, e3W}: the global coordinate system is attached to the workpiece, in which the cutter path and surface topography are described. Ow is placed at an arbitrarily selected point on the workpiece and the directions of e1W, e2W, and e3W are assigned to be consistent with the OmXmYmZme1M, e2M and e3M, respectively.
The transformation of a selected point from OcXcYcZc to OsXsYsZs (see Figure 2) can be performed by a rotation around e3C and a translation along the OsOc. The transformation matrices MCS can be expressed as
M CS = cos ω t + μ 0 sin ω t + μ 0 0 e cos ω t + υ 0 sin ω t + μ 0 cos ω t + μ 0 0 e sin ω t + υ 0 0 0 1 0 0 0 0 1 ,
where ω = 2πn/60 (rad/s) is the angular speed of the cutter and n (r/min) is the rotational speed of the spindle, t is the machining time, eccentricity e is the distance from Oc and Os, μ0 is the initial angle of e1C and e1S, and υ0 is the initial phase angle of the cutter runout.
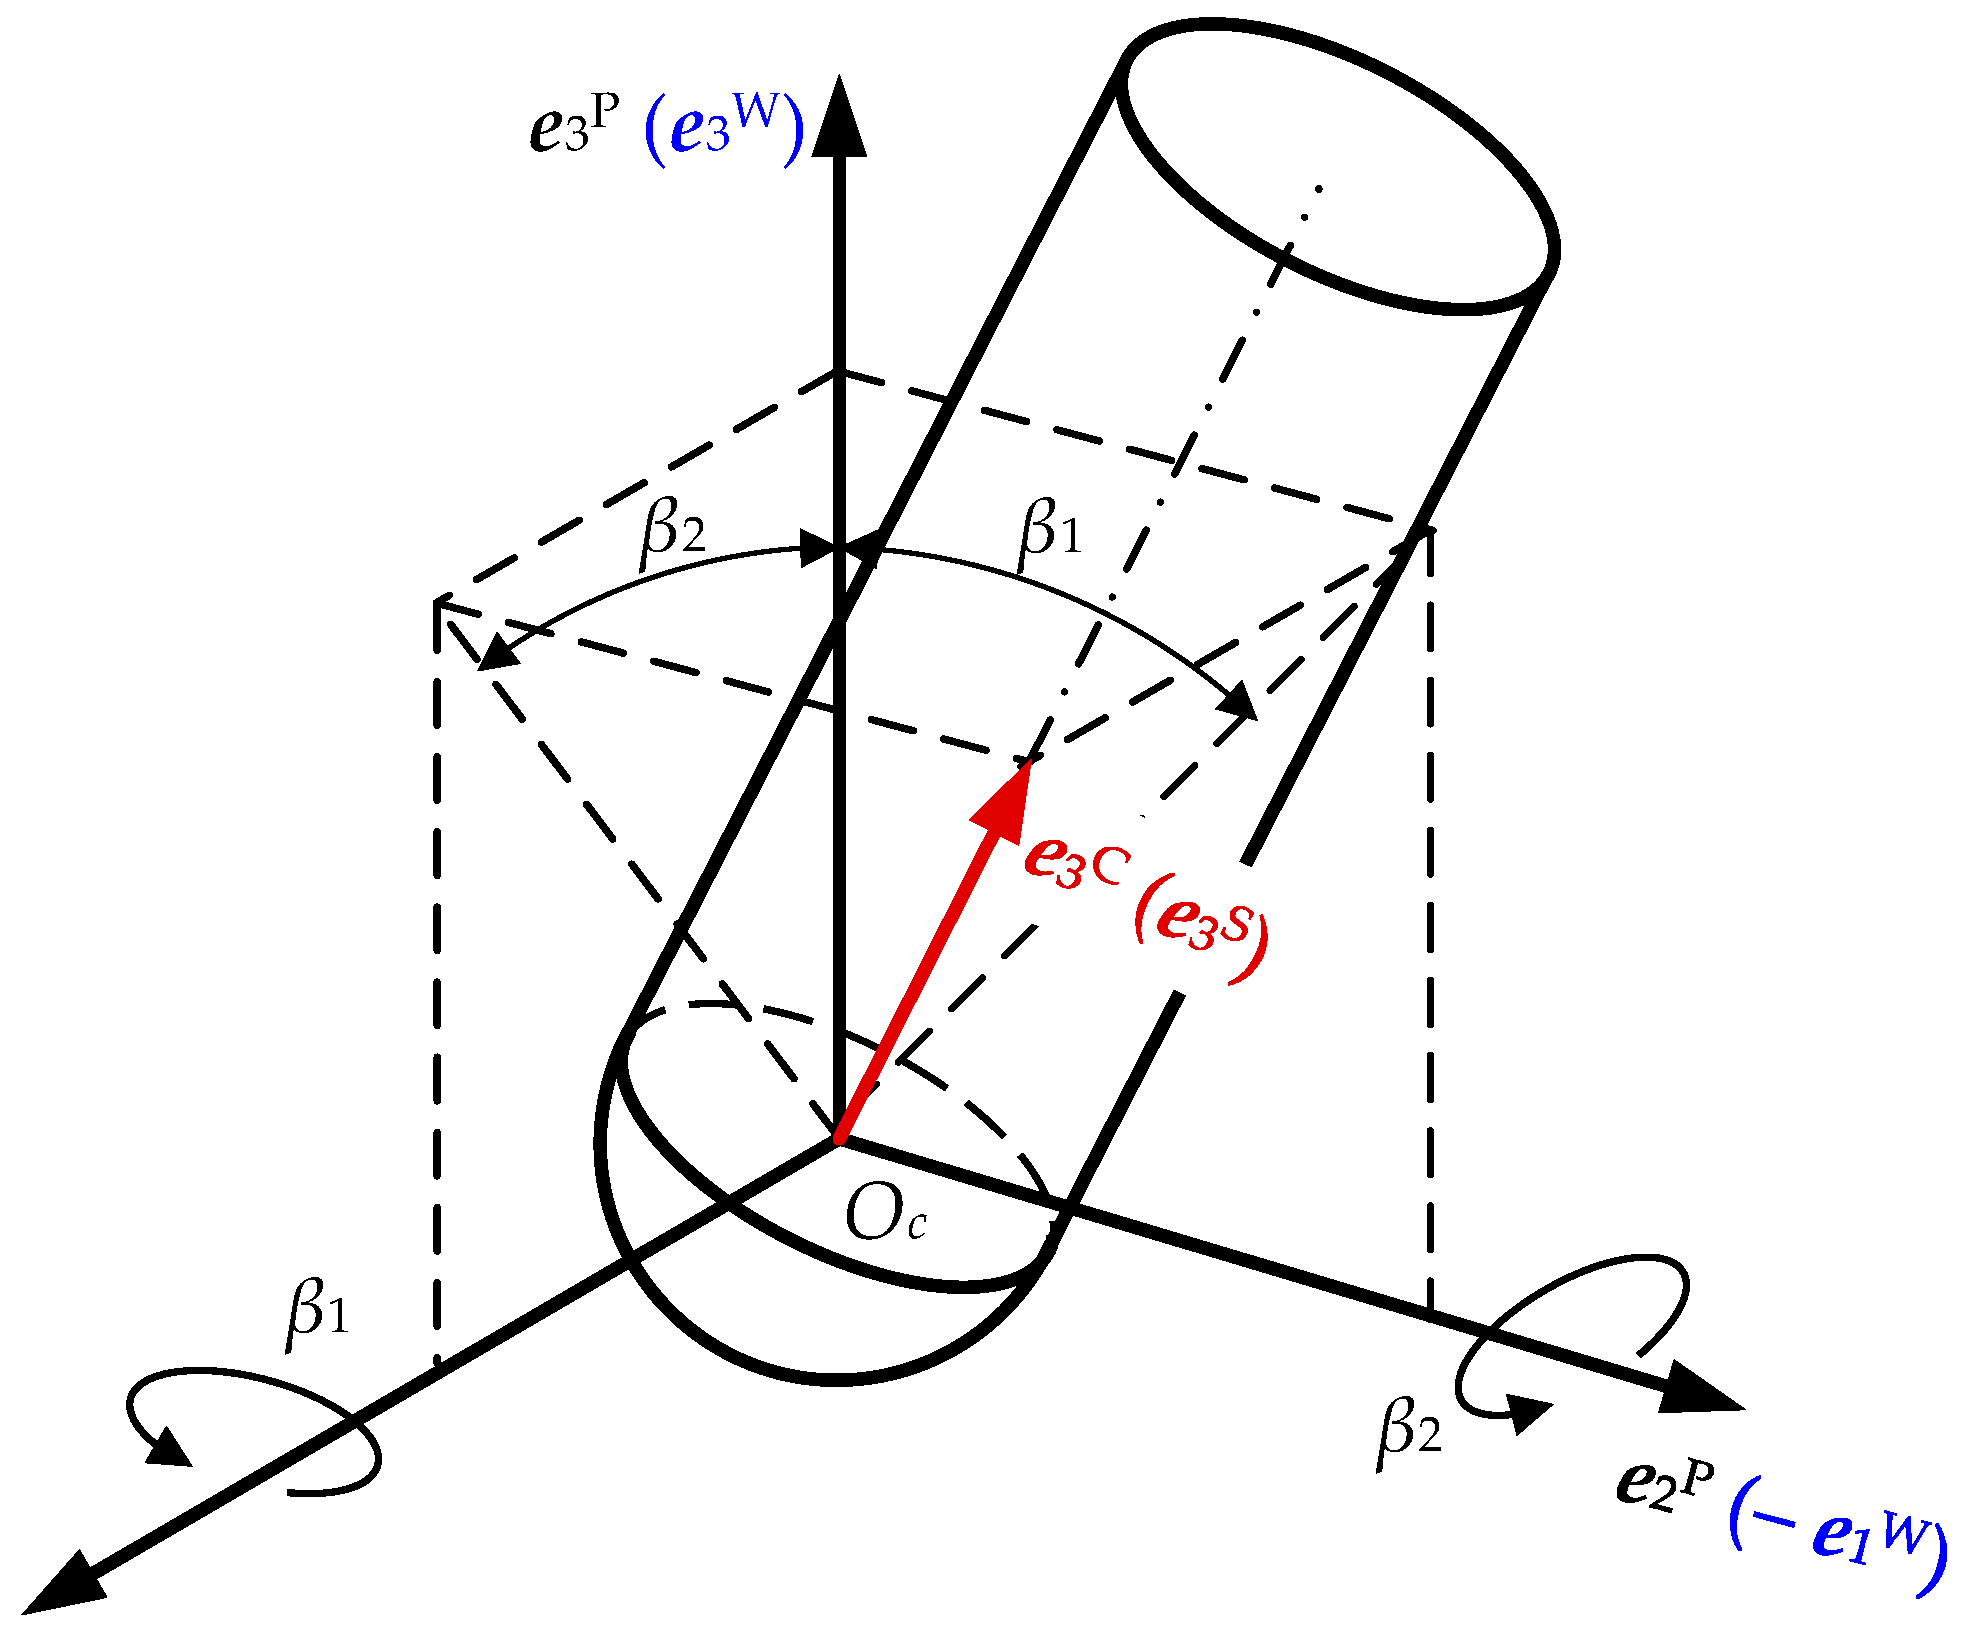
For a type-AB five-axis machining center, we must keep the cutter location point rOc in the proper position and the cutter axis in proper orientation. The spindle translates along the cutter path, and rotates around e1M at β2, and rotates around e2M at β1 relative to the body of the machine tool (see Figure 3). Therefore, the transformation matrix MSW from OsXsYsZs to OwXwYwZw is defined as follows:
M SW = cos β 1 sin β 1 sin β 2 sin β 1 cos β 2 x O c 0 cos β 2 sin β 2 y O c sin β 1 cos β 1 sin β 2 cos β 1 cos β 2 z O c 0 0 0 1 ,
where (xOc, yOc, zOc) is the coordinate of in OwXwYwZw, β1 is the tilt angle, and β2 is the lead angle.
As shown in Figure 4, with the parameter of the axial position angle θ of a selected point p along the cutter edge, in a cutter coordinate system, OcXcYcZc, the spherical cutter edge can be expressed as:
x p C y p C z p C = R 0 cos θ cos φ R 0 cos θ sin φ R 0 cos θ , 0 θ tan β 0 ,
where (xpC, ypC, zpC) is the coordinate of the point P in OcXcYcZc. R0 is the radius of the cutter. For a spherical cutter edge with equal lead, the lag angle φ can be calculated as follows:
φ = tan β 0 1 cos θ + j 1 2 π / N c ,
where β0 is the nominal helix angle as measured in the connection of the spherical and cylindrical cutter edges, j is the index of the cutter edge, and Nc is the number of cutter edges.
Given the cutter geometry as well as the cutter position and the cutter orientation, the swept surface of the cutter edge can be calculated in terms of homogeneous coordinate transformation. Mathematically, it is expressed as follows:
x p W y p W z p W 1 = M SW M CS x p C y p C z p C 1 ,
where (xpW, ypW, zpW) is the coordinate of a selected point P on the swept surface in Ow-XwYwZw.
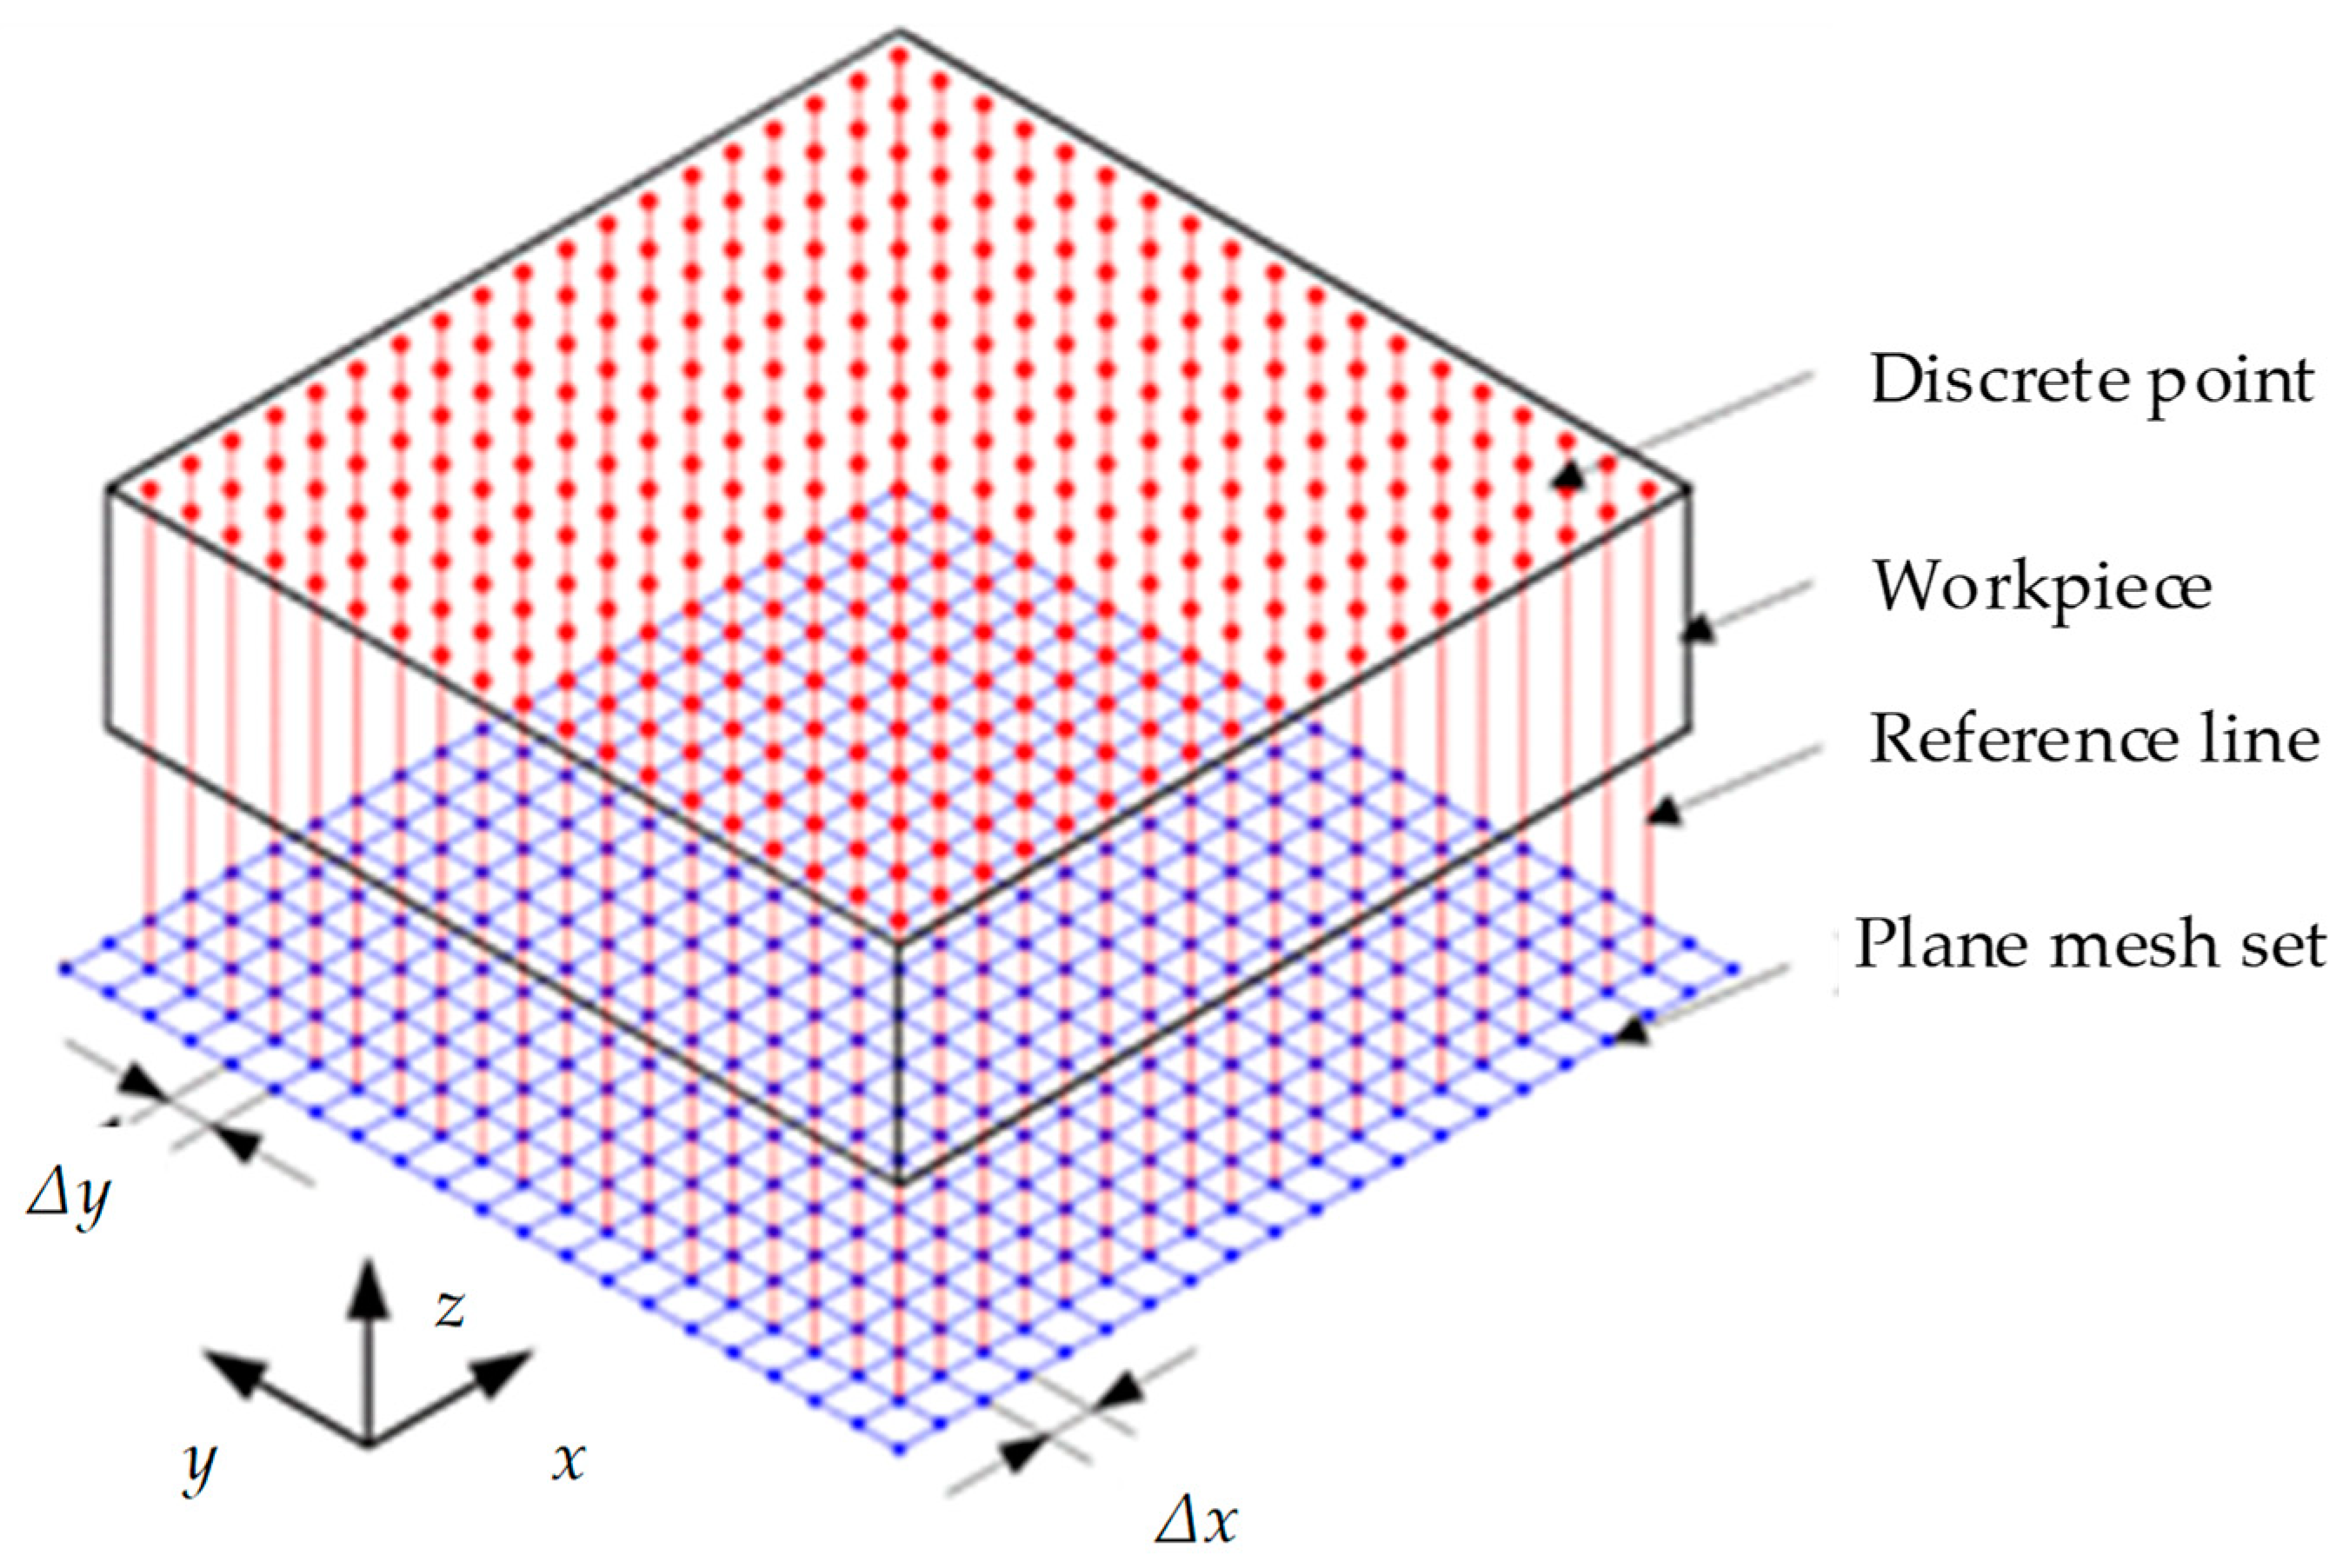
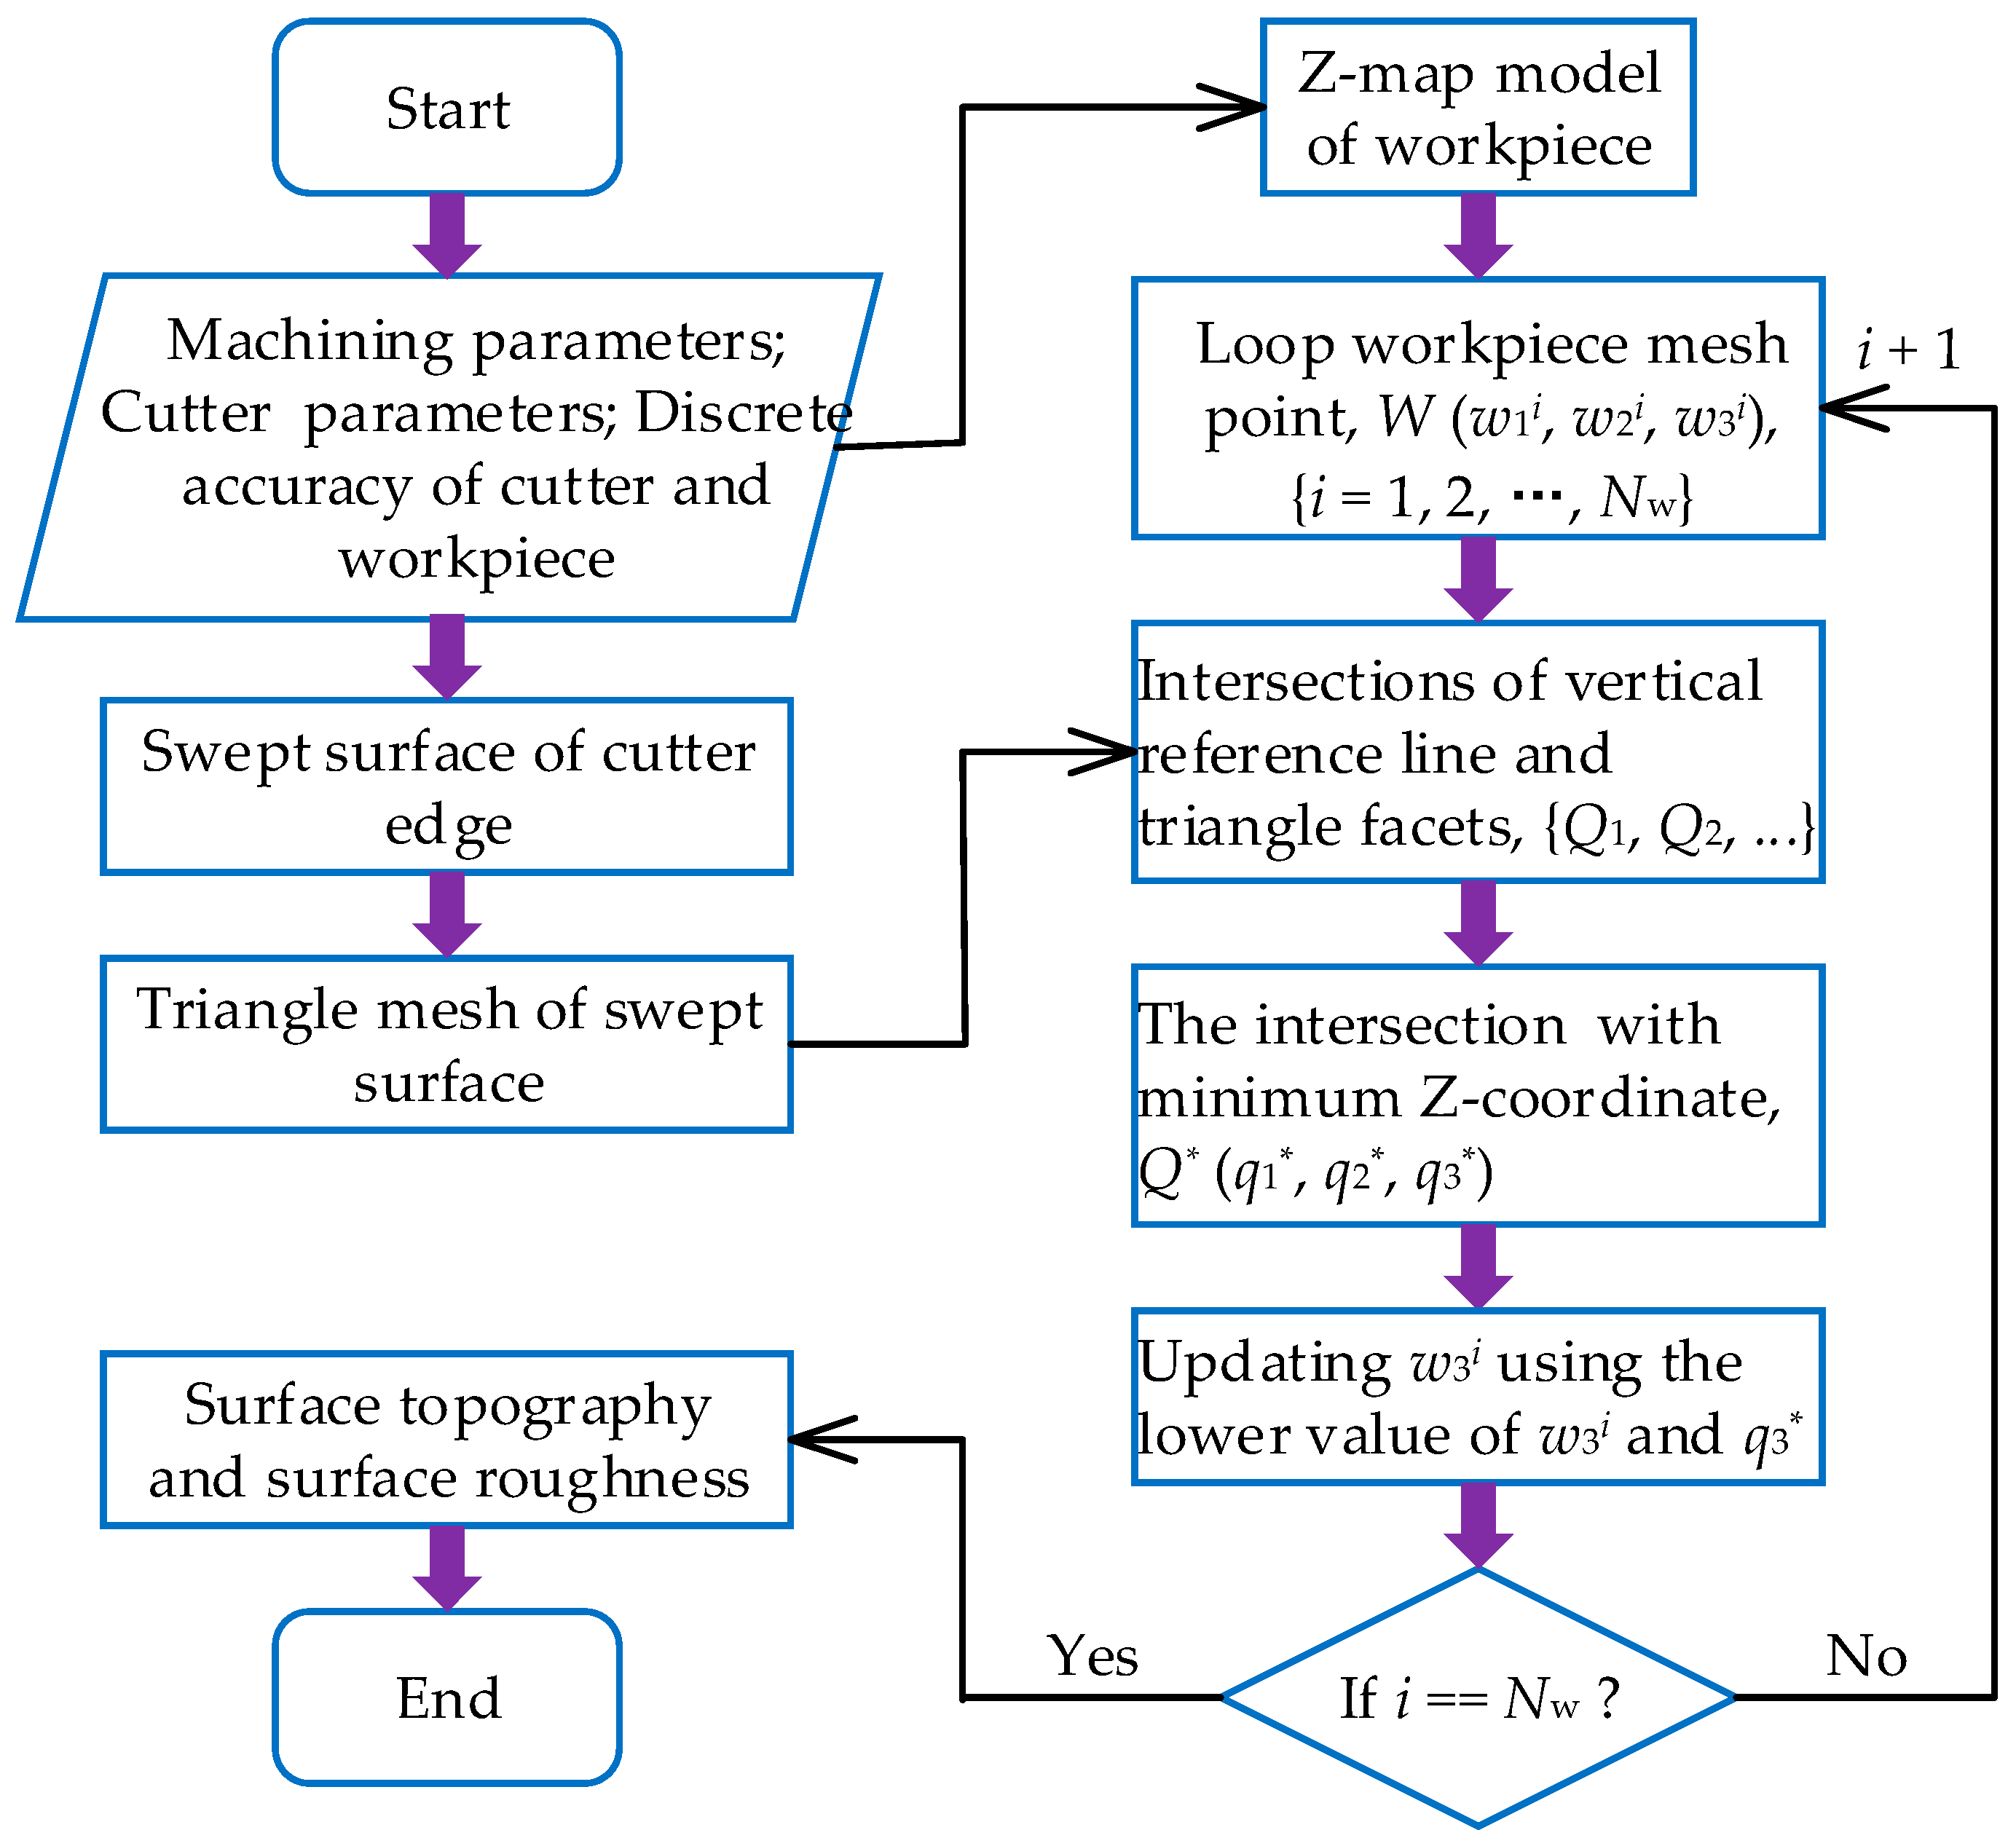
The workpiece surface is updated (i.e., material removal process) based on a ray-triangle algorithm. First, the workpiece surface is dispersed into a series of discrete points using Z-map methods, as shown in Figure 5. Second, the swept surface of the cutter edge is dispersed into a series of triangle facets, as shown in Figure 6. Then, we update the discrete points of the workpiece surface using the intersection point between the vertical line of the workpiece surface and the triangular facet of the swept surface. Finally, we draw the surface topography as well as the surface profile, and calculate the surface roughness according to the coordinate of the discrete point of the workpiece surface. A sketched map of the surface topography simulation algorithm is shown in Figure 7.

3. Results and Discussion

3.1. Experimental Verification

In this study, the typical hot work die steel, AISI P20/3Cr2Mo (33 ± 3 HRC), combines a very good machinability with mirror polishing performance, and covers a wide variety of applications; it was chosen as the workpiece material here. The nominal chemical compositions and mechanical properties of the workpiece material are listed in Table 1 and Table 2, respectively. The workpiece samples were prepared as rectangular blocks (250 mm × 150 mm × 40 mm). Four samples were prepared. The top surfaces of each workpiece with sizes of 250 mm × 150 mm were divided into eight areas. Before milling experiments, the blocks were face-milled on the top and bottom surfaces to remove the heat treatment-related surface defects and flatness to eliminate errors in the experimental results. The cutter utilized in milling experiments was an integral carbide ball-end mill with two teeth (JH970100-Tribon, Seco Tools Company®, Troy, MI, USA) with a diameter of 10 mm and a 30° helix angle.
The flat surface milling tests were carried out on a five-axis computer numerical controlled vertical machining center (DMU 60P duo BLOCK, DMG®, DMP, Frankfurt, Germany) in a dry cutting environment with air-cooling. The milled samples were degreased by ultrasonic cleaning for 15 min in acetone and then rinsed with deionized water. The surface topography, as well as surface profile and Sa, of the machined surface was measured using an interferometer (Wyko NT9300, Bruker Corporation®, Billerica, MA, USA), and the vertical resolution was 0.1 nm. A rectangular region (1 mm × 1 mm) was chosen in order to compared and analyze the characteristics of surface topography during the ball-end milling process. In order to reduce accidental errors in the measurement, three different regions of the machined surface topography were measured under the same machining parameters. According to the engineering and cutting parameters manual, the value range of feed per tooth is 0~1 mm, the value range of the radial depth of cut is 0~1 mm, the value range of the axial depth of cut is 0~1 mm, the value of the spindle speed is 3000~10,000 r/min, and the lead and tilt angles are 0~45°. In order to deeply understand the influences of changes in cutting parameters on the five-axis ball-end milling process, five values of each factor have been selected according to the actual engineering and cutting parameters manual, as shown in [31]. Three arbitrary experiments under different cutting parameters (see Table 3) were selected to validate the developed surface topography model.
The discrete precision of the workpiece was set to 0.01 mm, which is the less than the minimum value of 0.1fz and 0.1ae. The discrete precision of the swept surface is that the angle interval Δθ = 0.2° and Δt is the time it takes the cutter to rotate 2°.
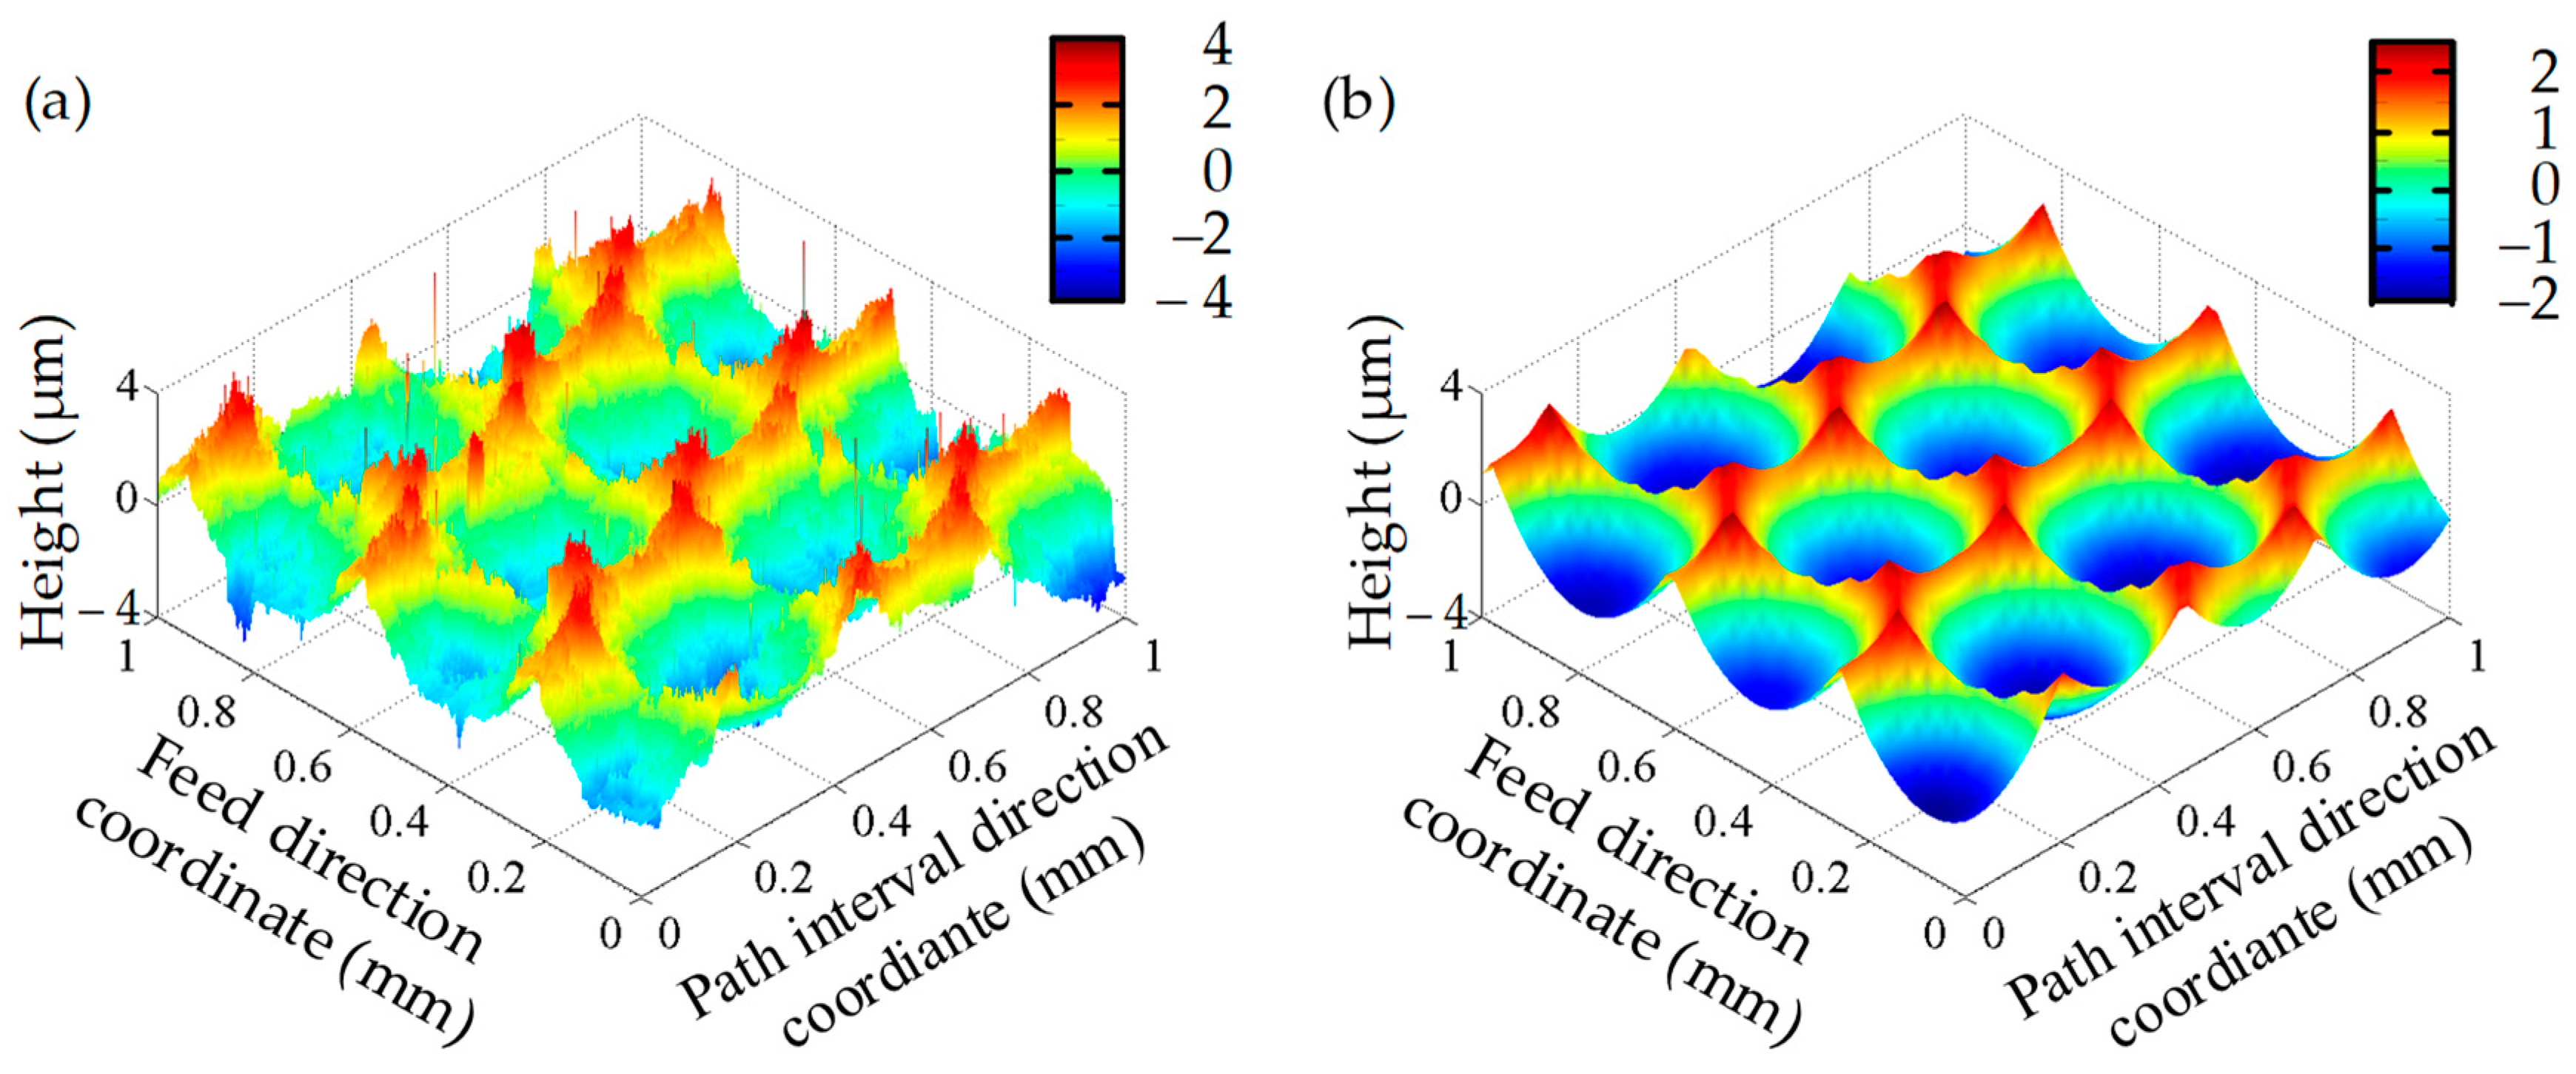
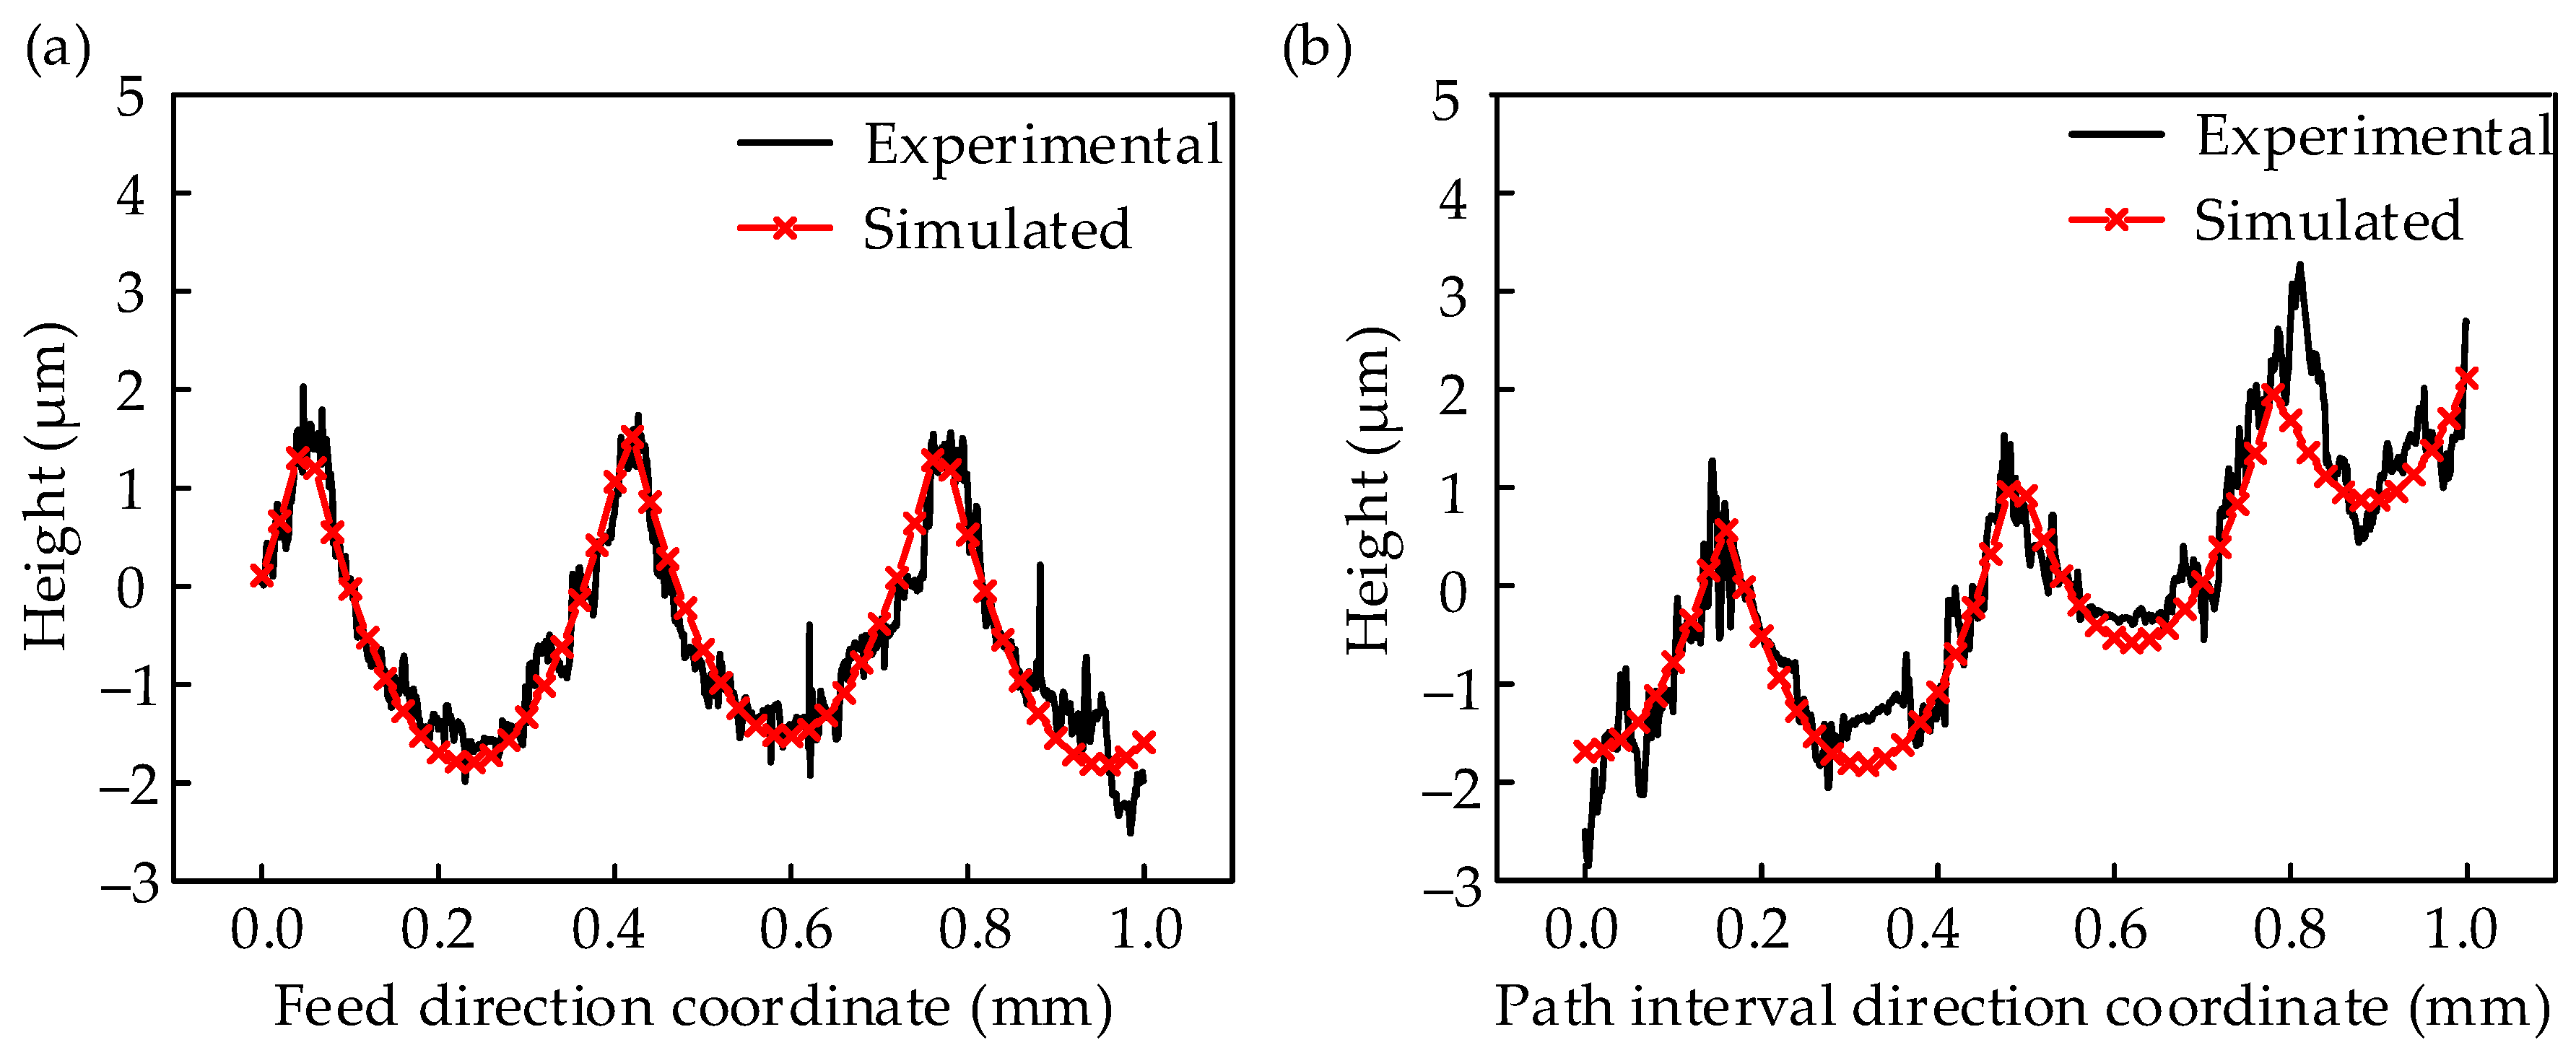
The predicted surface 3D topography and 2D surface profiles were compared with the experimentally measured results from the second trial, as shown in Figure 8 and Figure 9. The results show that the experiments and simulations were very similar to each other, both in the numbers of peaks and valleys and their distribution. There is a certain difference between the simulated and experimental results, such as the fact that the surface topography and profile were smooth in the simulations, while they were rough in the experiments. The main difference between the simulated and experimental results is in the sliding; the abrasion and elastic strain of the material sliding were not considered in the simulation.
According to the simulated and experimental surface topography results, the average roughness, Sa, has been calculated and used to evaluate the developed algorithm quantitatively. The Sa of trials 1#, 2# and 3# are listed in Table 4. The derivation between the simulated and experimental results with a maximum deviation is 13.48%, which shows that the developed model has a high prediction accuracy when predicting the surface roughness. The standard deviations are all less 0.1, which indicates that the measurement results are relatively concentrated, and the values of dispersion are small.
The verified results from Figure 8 and Figure 9 and Table 4 indicate that the surface topography simulation algorithm developed for the ball-end milling of AISI P20 is reliable. Therefore, this surface simulation algorithm can accurately simulate the surface topography and roughness, and thus replace milling experiments.

3.2. Cutting Parameters Optimization

The Sa is a basic requirement of the machining product’s quality, and the surface quality is classified into several grades using the value of Sa. Therefore, the Sa has been taken as a response parameter of the milled surface, which is calculated with the help of simulated surface topography. The feed per tooth (fz), radial depth of cut (ae), tilt (β1) and lead (β2) angle are selected as the numeric factors because they all have clear effects on the surface topography and can be changed by adjusting the feed rate, tool path and tool orientation. The ranges of the level of each numeric factor were set to feed per tooth—0.1~0.5 mm/tooth, radial depth of cut—0.1~0.5 mm, tilt angle—−8~8° and lead angle—−8~8° for the response analysis using the Box–Behnken design. The designs of the surface topography simulation examples and the simulated Sa values are presented in Table 5.
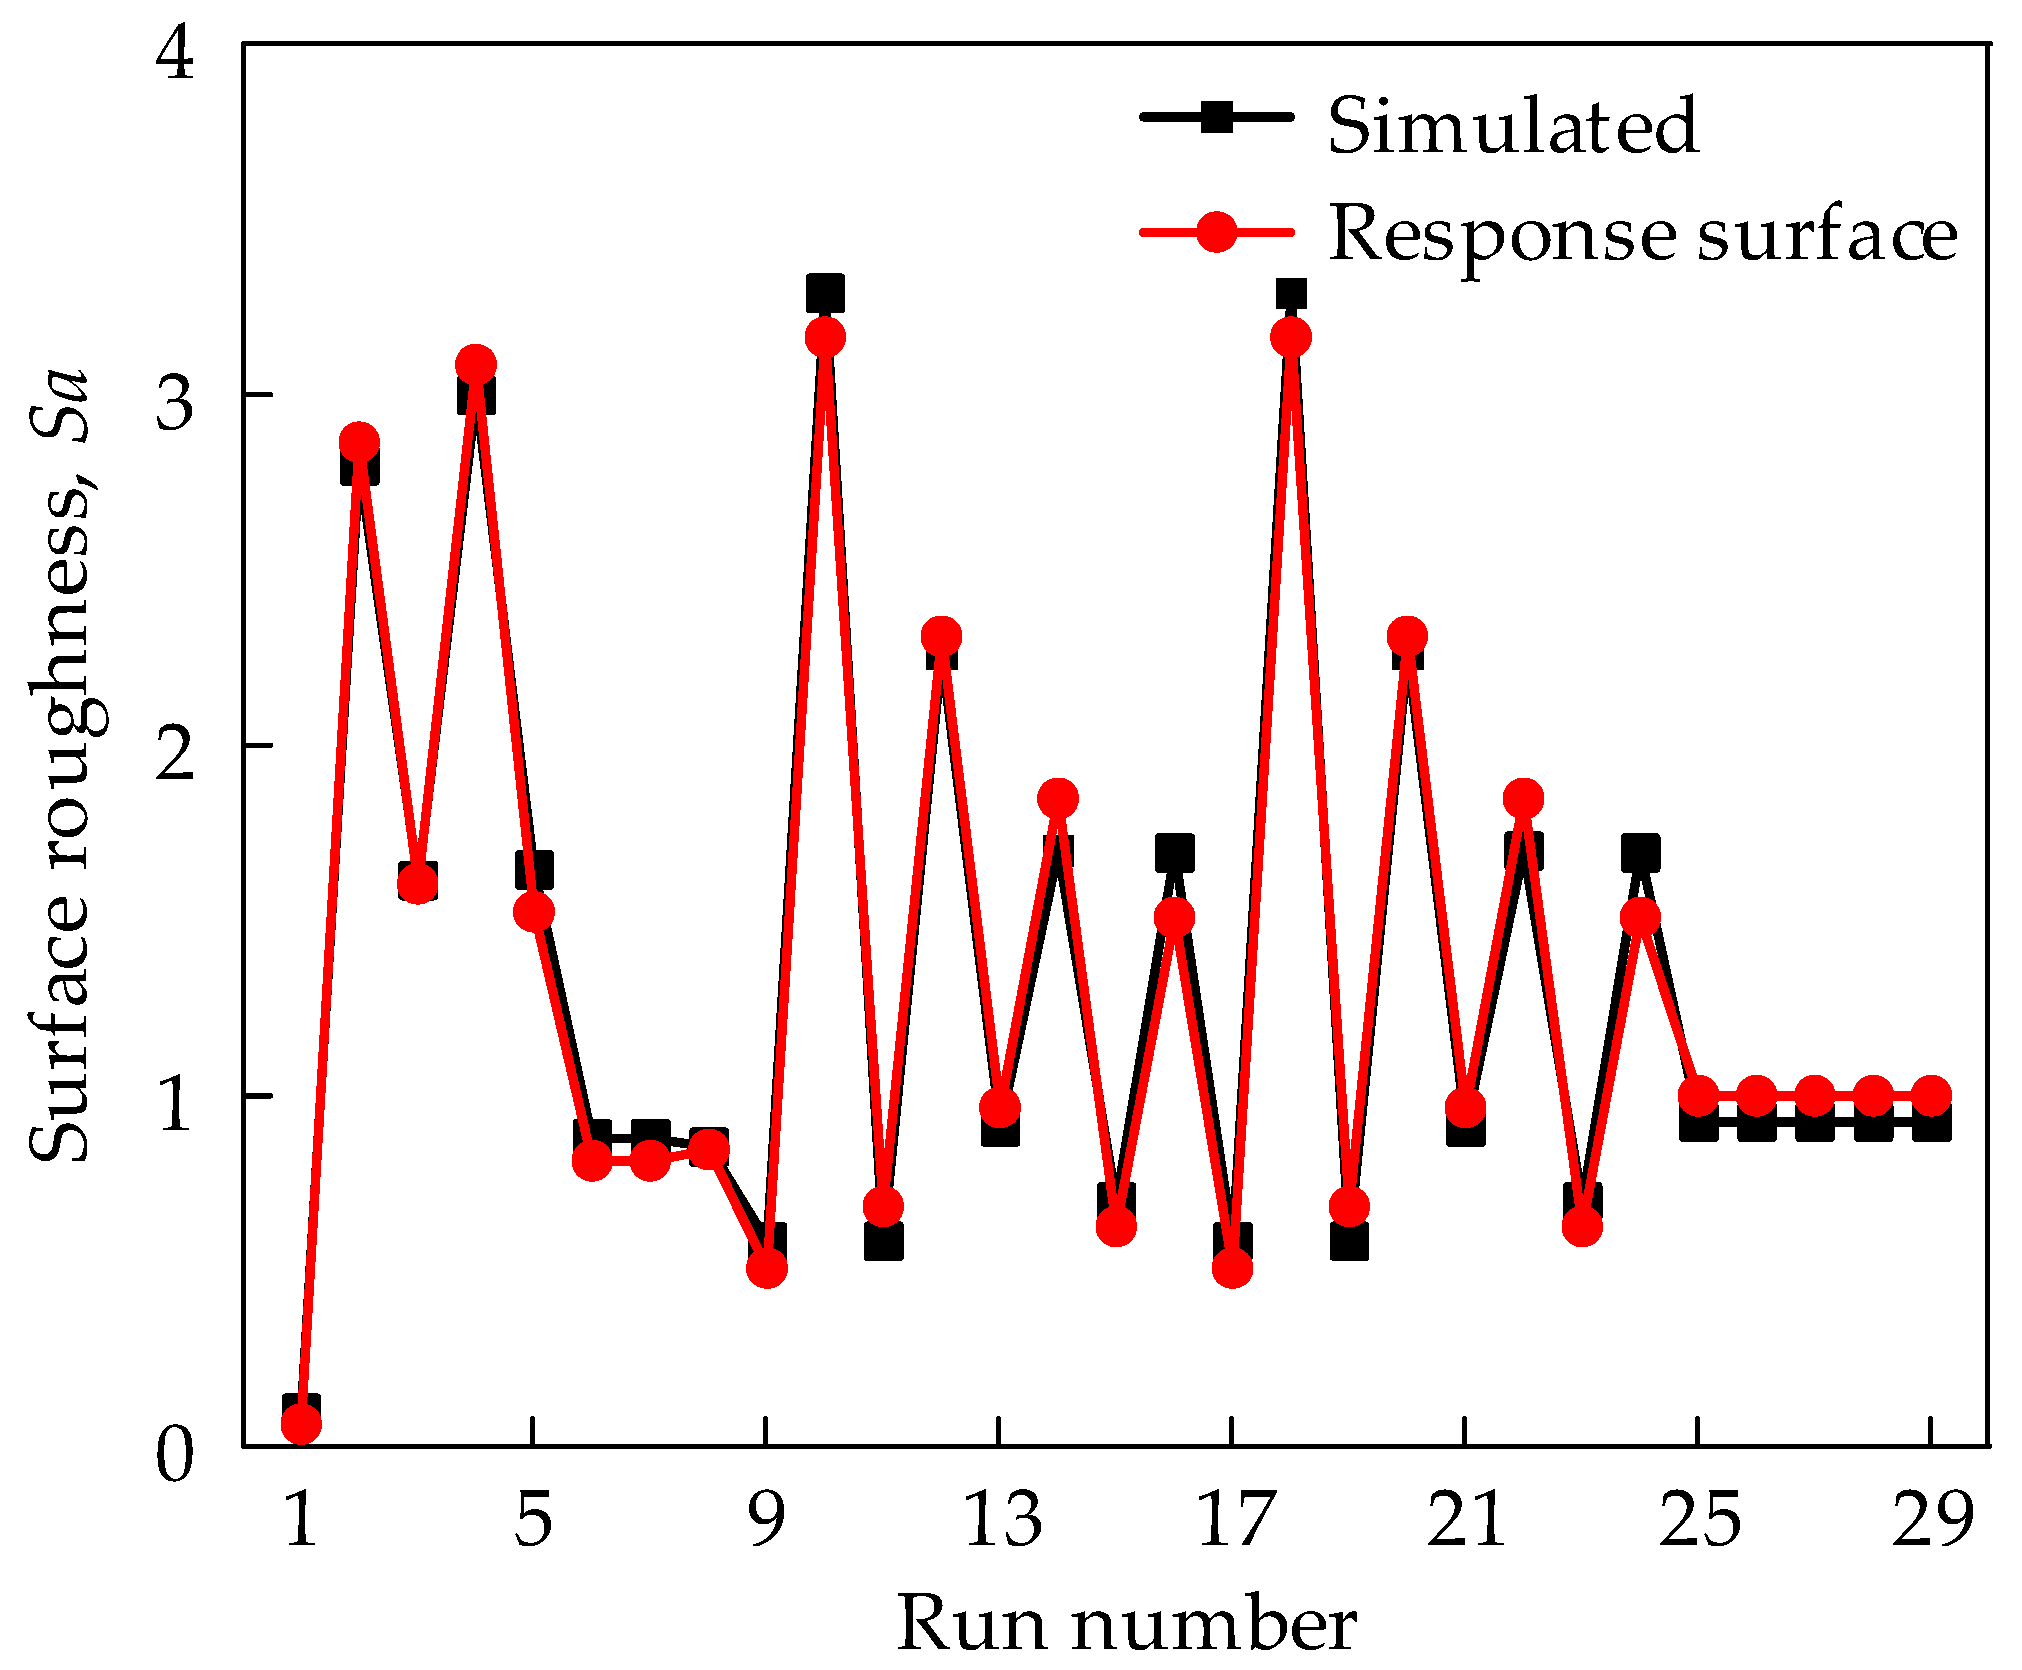
The results in Table 6 show that the model’s F-value of 145.73 implies the model is significant. There is only a 0.01% chance that a model F-value this large could occur due noise. Values of “Prob>F” less than 0.05 indicate that the model terms are significant. In this case, fz, ae, β1, β2, fz × ae, fz × β1, fz × β2, fz2 and ae2 are significant model terms. In contrast, values greater than 0.10 indicate the model terms are not significant; in this case, ae × β1, ae × β2, β12 and β22 are not significant model terms, and are reduced to simplify and improve the regression model, as shown in Equation (6). As shown in Figure 10, the comparison of predicted and simulated Sa indicates the high accuracy of the response surface model.
S a = 0.2235 + 0.3955 f z + 1.118 a e + 0.0078 β 1 + β 2 8.2513 f z a e 0.3219 f z β 1 + β 2 + 0.0116 β 1 β 2 + 16.681 f z 2 + 5.936 a e 2
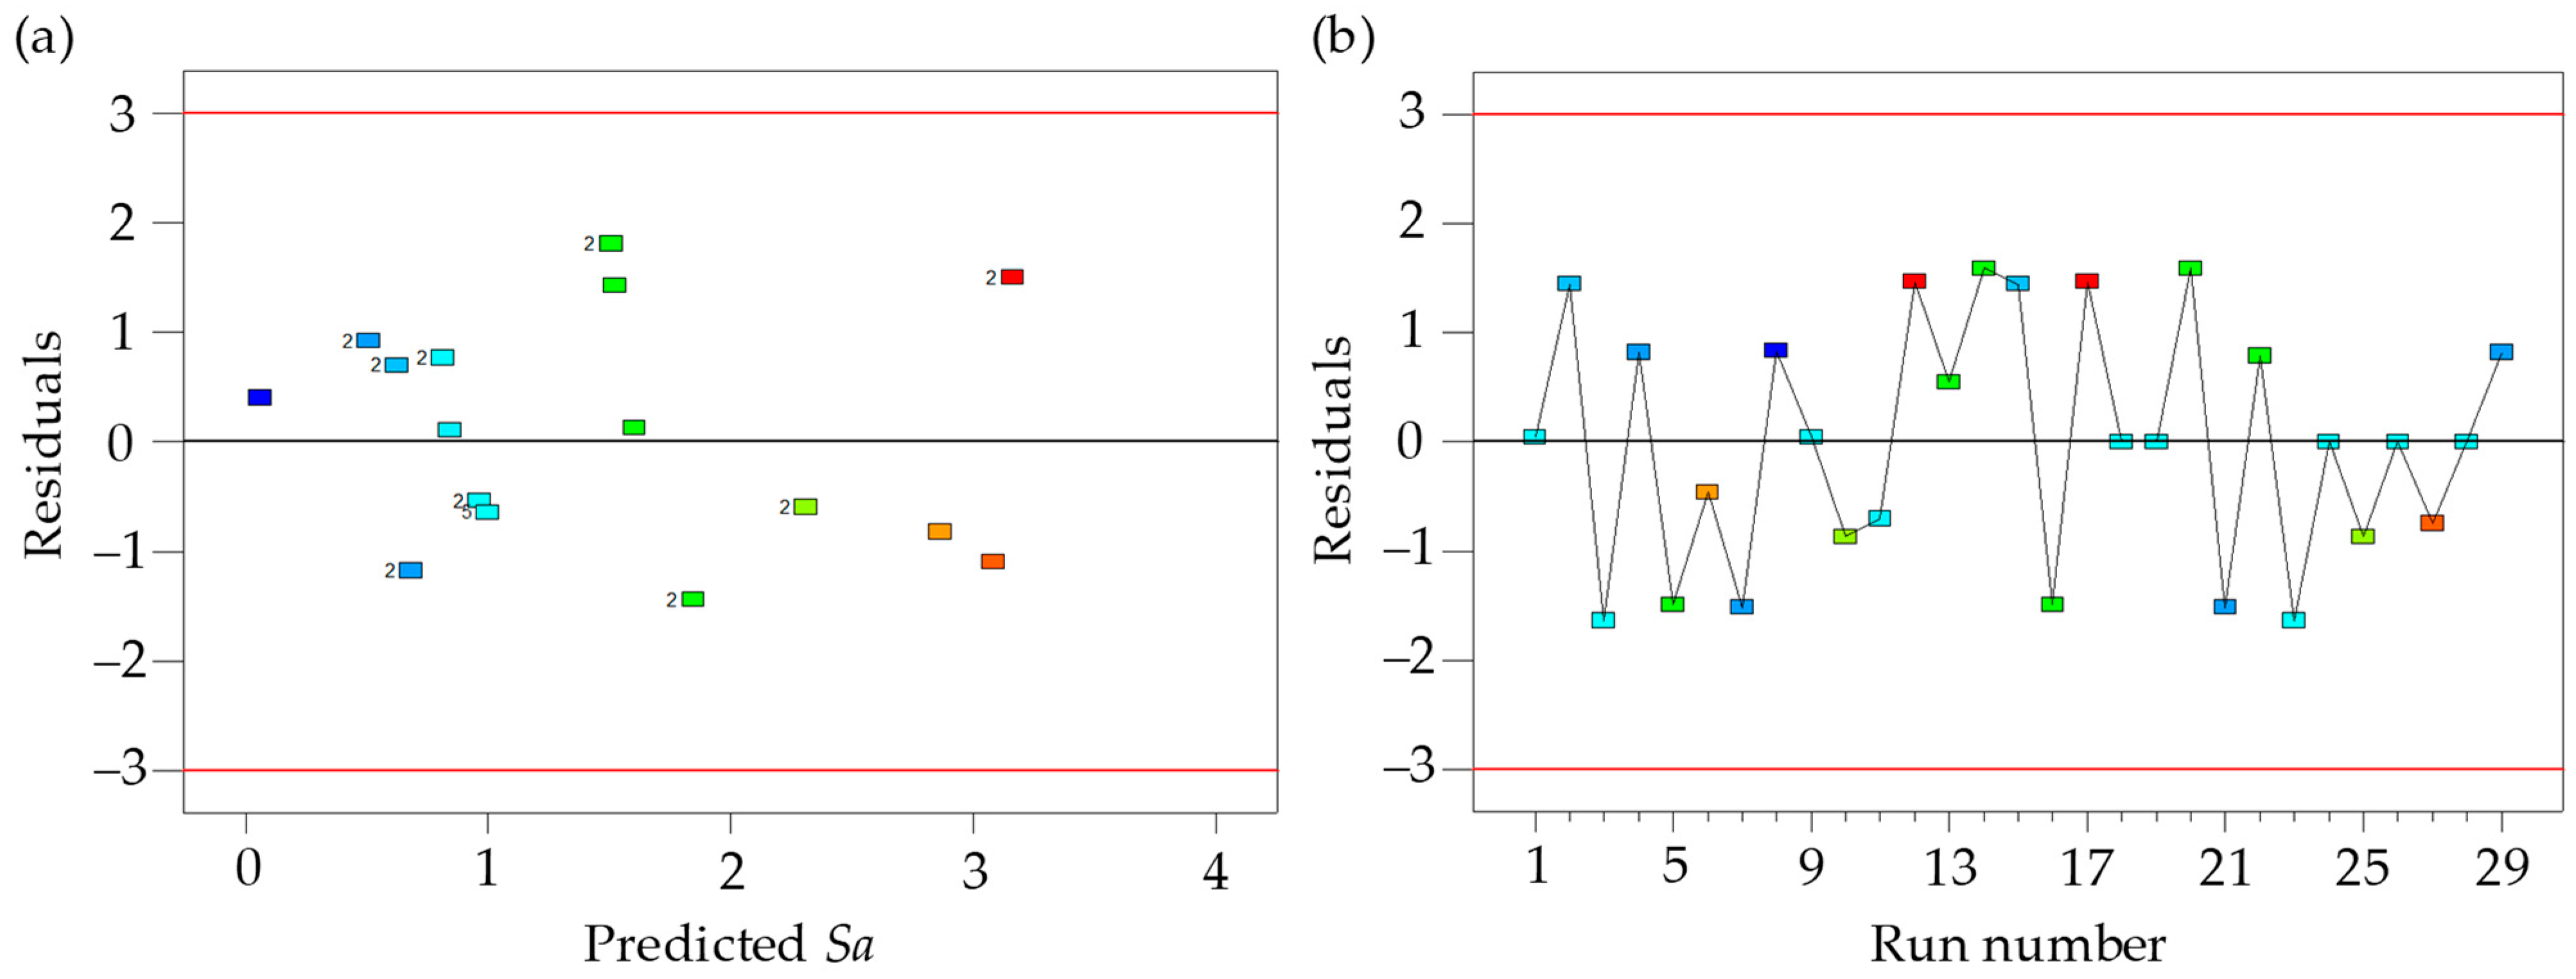
As shown in Figure 10, the predicted Sa using the response surface model was consistent with the simulated Sa using the proposed surface topography model, which indicates the high accuracy of the response surface model. The Studentized residuals are in the range of ±3, which is consistent with the results of the test. In addition, no abnormal data points were found in the residual plot (see Figure 11). The effects of machining parameters on the Sa are shown in Figure 12. The Sa increases with the increase in feed per tooth (fz) and radial depth of cut (ae) (see Figure 12a–c). The Sa decreases with the increase in tilt angle (β1) and lead angle (β2) (see Figure 12b–d). The feed per tooth (fz) and radial depth of cut (ae) have significant effects on material residual height, and the material residual height increases with the feed per tooth (fz) and radial depth of cut (ae). The tilt angle (β1) and lead angle (β2) can improve the interaction between the tool and workpiece, and reduce the Sa.
The response surface model’s accuracy has here been investigated. Next, the ability of the model to improve the machining efficiency by selecting the cutting parameters is analyzed (see Equation (7)). For this purpose, an optimal cutting parameter with the maximum material removal rate is obtained with an Sa of less than 0.7 by solving the response surface model; the optimal cutting parameters are fz = 0.2 mm/tooth, ae = 0.34 mm, β1 = 7.23° and β2 = 2.54°. The predicted Sa is 0.6841 μm, in contrast to the simulated Sa, which is 0.7791 μm. The devotion is −12.19%, which denotes the regression model is effective. In contrast to 20#, 21# and 23#, for which the Sa is less than 0.7 μm, the material removal rate can be improved from 0.03 to 0.068 at a growth of 126.67%. The result of the cutting parameters’ optimization is a substantial improvement in the machining efficiency under the surface roughness constraints.
max f z × a e s . t . S a 0.7 , 0 < f z 0.5 , 0 < a e 0.5 , 0 β 1 8 , 0 β 2 8

4. Conclusions

In this paper, a novel surface topography simulation algorithm was developed for investigating the surface roughness in the five-axis ball-end milling process. The main conclusions as follows:
(1)
A novel surface topography model was developed using triangular approximation and Z-map methods. The consistency between the simulated and experimental results shows that the model can replace the milling experiment when studying the surface topography and roughness during ball-end milling processes;
(2)
A response surface-reduced quadratic model was developed based on the proposed surface topography simulation algorithm. The model can effectively characterize the correlation of Sa and cutting parameters (i.e., feed per tooth, radial depth of cut, tilt, and lead angles) based on ANOVA results;
(3)
An optimization model was developed for improving the machining efficiency by means of the response surface model. The material removal rate (i.e., product of feed per tooth and radial depth of cut) can be improved effectively under the surface roughness constraints;
(4)
The complex interaction between cutting edge and workpiece is neglected in the proposed model, so the cutting edge trajectory error, cutting edge micro-geometry and workpiece material deformation should be considered in the next study to secure a reliable prediction of surface topography.

Author Contributions

Conceptualization, R.W.; methodology, R.W.; software, R.W.; validation, R.W.; investigation, W.W.; writing—original draft preparation, R.W.; writing—review and editing, B.Z. and D.T.; project administration, R.W. and B.Z. All authors have read and agreed to the published version of the manuscript.

Funding

This research was funded by the Fundamental Research Funds for the Central Universities (3072023CFJ0701), and the National Natural Science Foundation of China (52271312).

Institutional Review Board Statement

Not applicable.

Informed Consent Statement

Not applicable.

Data Availability Statement

Data are contained within the article.

Conflicts of Interest

The authors declare no conflicts of interest.

References

  1. Zhao, B.; Zhang, S.; Man, J.; Zhang, Q.; Chen, Y. A modified normal contact stiffness model considering effect of surface topography. Proc. Inst. Mech. Eng. J.-J. Eng. 2015, 229, 677–688. [Google Scholar] [CrossRef]
  2. Milan, N.; Sorgato, M.; Parenti, P.; Annoni, M.; Lucchetta, G. Effects of micromilled NiP mold surface topography on the optical characteristics of injection molded prismatic retroreflectors. Precis. Eng. 2020, 61, 126–135. [Google Scholar] [CrossRef]
  3. Ghorbani, M.; Movahhedy, M.R. Extraction of surface curvatures from tool path data and prediction of cutting forces in the finish milling of sculptured surfaces. J. Manuf. Process. 2019, 45, 273–289. [Google Scholar] [CrossRef]
  4. Chen, X.; Zhao, J.; Dong, Y.; Han, S.; Li, A.; Wang, D. Effects of inclination angles on geometrical features of machined surface in five-axis milling. Int. J. Adv. Manuf. Technol. 2012, 65, 1721–1733. [Google Scholar] [CrossRef]
  5. Zhang, Q.; Zhang, S. Effects of feed per tooth and radial depth of cut on amplitude parameters and power spectral density of a machined surface. Materials 2020, 13, 1323. [Google Scholar] [CrossRef]
  6. Peng, F.; Wu, J.; Fang, Z.; Yuan, S.; Yan, R.; Bai, Q. Modeling and controlling of surface micro-topography feature in micro-ball-end milling. Int. J. Adv. Manuf. Technol. 2013, 67, 2657–2670. [Google Scholar] [CrossRef]
  7. Zhang, C.; Zhang, H.; Li, Y.; Zhou, L. Modeling and on-line simulation of surface topography considering tool wear in multi-axis milling process. Int. J. Adv. Manuf. Technol. 2015, 77, 735–749. [Google Scholar] [CrossRef]
  8. Zhang, X.; Yu, T.B.; Zhao, J. Surface generation modeling of micro milling process with stochastic tool wear. Precis. Eng. 2020, 61, 170–181. [Google Scholar] [CrossRef]
  9. Lotfi, S.; Wassila, B.; Gilles, D. Cutter workpiece engagement region and surface topography prediction in five-axis ball-end milling. Mach. Sci. Technol. 2017, 22, 181–202. [Google Scholar] [CrossRef]
  10. Hao, Y.; Liu, Y. Analysis of milling surface roughness prediction for thin-walled parts with curved surface. Int. J. Adv. Manuf. Technol. 2017, 93, 2289–2297. [Google Scholar] [CrossRef]
  11. Omar, O.; El-Wardany, T.; Ng, E.; Elbestawi, M.A. An improved cutting force and surface topography prediction model in end milling. Int. J. Mach. Tools Manuf. 2007, 47, 1263–1275. [Google Scholar] [CrossRef]
  12. Wang, Z.; Wang, B.; Yuan, J. Modeling of surface topography based on cutting vibration in ball-end milling of thin-walled parts in ball-end milling of thin-walled parts. Int. J. Adv. Manuf. Technol. 2018, 101, 1837–1854. [Google Scholar] [CrossRef]
  13. Li, B.; Cao, Y.; Chen, W.; Pan, J. Geometry simulation and evaluation of the surface topography in five-axis ball-end milling. Int. J. Adv. Manuf. Technol. 2017, 93, 1651–1667. [Google Scholar] [CrossRef]
  14. Biondani, F.G.; Bissacco, G. Effect of cutting edge micro geometry on surface generation in ball end milling. CIRP Ann.-Manuf. Technol. 2019, 68, 571–574. [Google Scholar] [CrossRef]
  15. Imani, B.M.; Elbestawi, M.A. Geometric simulation of ball-end milling operations. J. Manuf. Sci. Eng. 2001, 123, 177–184. [Google Scholar] [CrossRef]
  16. Zhang, W.; Tan, G.; Wan, M.; Gao, T.; Bassir, D.H. A new algorithm for the numerical simulation of machined surface topography in multiaxis ball-end milling. J. Manuf. Sci. Eng. 2008, 130, 0110031. [Google Scholar] [CrossRef]
  17. Li, S.J.; Dong, Y.H.; Li, Y.; Li, P.Y.; Yang, Z.C.; Landers, R.G. Geometrical simulation and analysis of ball-end milling surface topography. Int. J. Adv. Manuf. Technol. 2019, 102, 1885–1900. [Google Scholar] [CrossRef]
  18. Xu, J.T.; Zhang, H.; Sun, Y.W. Swept surface-based approach to simulating surface topography in ball-end CNC milling. Int. J. Adv. Manuf. Technol. 2018, 98, 107–118. [Google Scholar] [CrossRef]
  19. Yang, L.; Wu, S.; Liu, X.L.; Liu, Z.J.; Zhu, M.W.; Li, Z.H. The effect of characteristics of free-form surface on the machined surface topography in milling of panel mold. Int. J. Adv. Manuf. Technol. 2018, 98, 151–163. [Google Scholar] [CrossRef]
  20. Chen, H.Q.; Wang, Q.H. Modeling and simulation of the surface topography in ball-end milling based on biharmonic spline interpolation. Int. J. Adv. Manuf. Technol. 2018, 99, 2451–2466. [Google Scholar] [CrossRef]
  21. Dikshit, M.K.; Puri, A.B.; Maity, A. Optimization of surface roughness in ball-end milling using teaching-learning-based optimization and response surface methodology. Proc. Inst. Mech. Eng. B-J. Eng. 2017, 231, 2596–2607. [Google Scholar] [CrossRef]
  22. Dikshit, M.K.; Puri, A.B.; Maity, A. Modelling and application of response surface optimization to optimize cutting parameters for minimizing cutting forces and surface roughness in high-speed, ball-end milling of Al2014-T6. J. Braz. Soc. Mech. Sci. 2017, 39, 5117–5133. [Google Scholar] [CrossRef]
  23. Zhou, J.H.; Ren, J.X.; Yao, C.F. Multi-objective optimization of multi-axis ball-end milling Inconel 718 via grey relational analysis coupled with RBF neural network and PSO algorithm. Measurement 2017, 102, 271–285. [Google Scholar] [CrossRef]
  24. Buj-Corral, I.; Ortiz-Marzo, J.A.; Costa-Herrero, L.; Vivancos-Calvet, J.; Luis-Pérez, C. Optimal machining strategy selection in ball-end milling of hardened steels for injection molds. Materials 2019, 12, 860. [Google Scholar] [CrossRef] [PubMed]
  25. Venkata-Rao, K. Power consumption optimization strategy in micro ball-end milling of D2 steel via TLBO coupled with 3D FEM simulation. Measurement 2019, 132, 68–78. [Google Scholar] [CrossRef]
  26. Sonawane, H.A.; Joshi, S.S. Modeling of machined surface quality in high-speed ball-end milling of Inconel-718 thin cantilevers. Int. J. Adv. Manuf. Technol. 2015, 78, 1751–1768. [Google Scholar] [CrossRef]
  27. Torres, A.; Amini, C.; Cuadrado, N.; Travieso-Rodriguez, J.A.; Llumà, J.; Vilaseca, M. Experimental validation of ball burnishing numerical simulation on ball-end milled martensitic stainless-steel considering friction and the initial surface topography. J. Mater. Res. Technol. 2023, 22, 3352–3361. [Google Scholar] [CrossRef]
  28. Cross, K.; Eifler, M.; Klauer, K.; Huttenlochner, K.; Kirsch, B.; Ziegler, C.; Aurich, J.C.; Seewig, J. Determination of the surface topography of ball end micro milled material measures. Eng. Sci. Technol. 2021, 24, 543–555. [Google Scholar] [CrossRef]
  29. Klauer, K.; Eifler, M.; Kirsch, B.; Seewig, J.; Aurich, J.C. Ball end micro milling of areal material measures: Influence of the tilt angle on the resulting surface topography. Prod. Eng.-Res. Dev. 2020, 14, 239–252. [Google Scholar] [CrossRef]
  30. Arruda, E.M.; Brandão, L.C.; Ribeiro Filho, S.L.M.; De Oliveira, J.A. Integrated optimization using mixture design to confirm the finishing of AISI P20 using different cutting strategies and ball nose end mills. Measurement 2014, 47, 54–63. [Google Scholar] [CrossRef]
  31. Wang, P.; Zhang, S.; Yan, Z.G. Study on surface defects in five-axis ball-end milling of tool steel. Int. J. Adv. Manuf. Technol. 2016, 89, 599–609. [Google Scholar] [CrossRef]
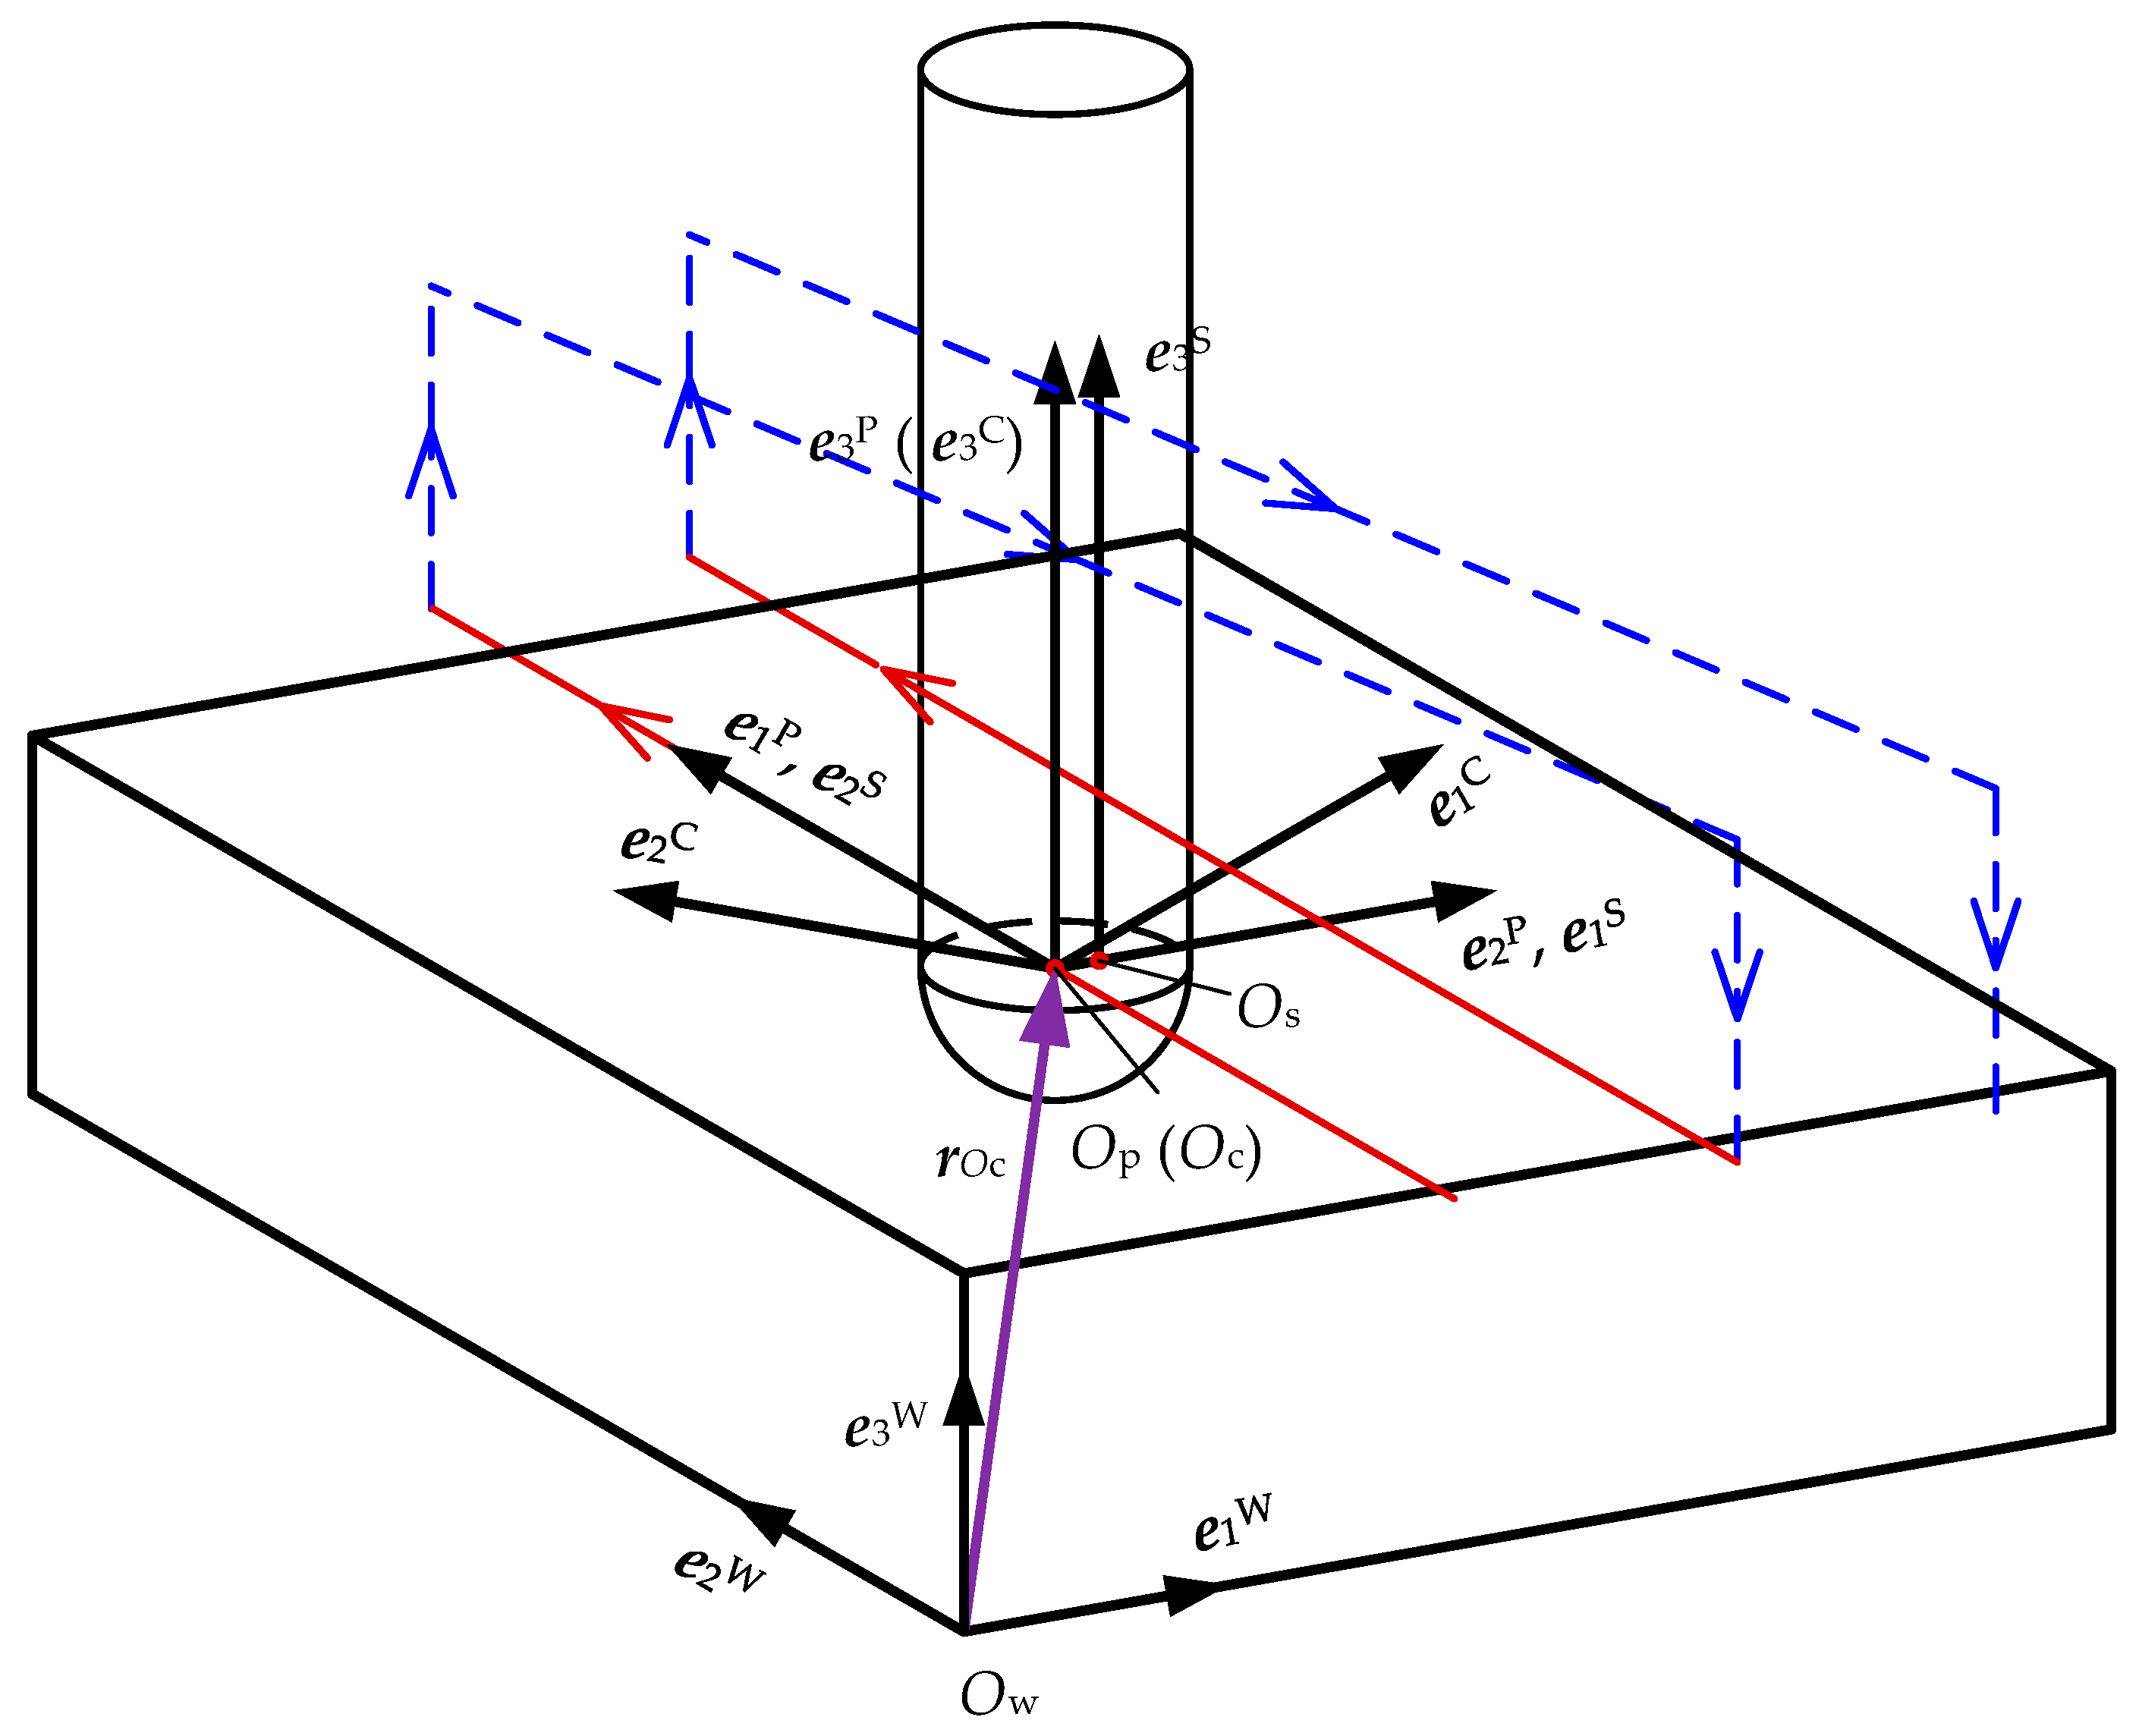
Figure 1. Definition of coordinate systems in ball-end milling of flat surface.
Materials 17 01533 g001
Figure 2. Definition of cutter runout: (a) front view; (b) top view.
Materials 17 01533 g002
Figure 3. Definition of lead and tilt angles.
Materials 17 01533 g003
Figure 4. Definition of cutting edge model: (a) general view; (b) top view.
Materials 17 01533 g004
Figure 5. Z-map model of the workpiece.
Materials 17 01533 g005
Figure 6. Triangular approximation of the swept surface.
Materials 17 01533 g006
Figure 7. Sketched map of surface topography simulation algorithm.
Materials 17 01533 g007
Figure 8. 3D surface topography: (a) experimental; (b) simulated.
Materials 17 01533 g008
Figure 9. 2D surface profile: (a) experimental; (b) simulated.
Materials 17 01533 g009
Figure 10. Comparison of average roughness between surface topography simulation and response surface models.
Materials 17 01533 g010
Figure 11. Residuals of response surface quadratic model: (a) residuals to predict surface roughness; (b) residuals to run number. The numbers represents the amount of similar results, and the colors make it easier to identify corresponding data points in (a,b).
Materials 17 01533 g011
Figure 12. Interaction effect of machining parameters on average roughness: (a) feed per tooth and radial depth of cut; (b) feed per tooth and tilt angle; (c) feed per tooth and lead angle; (d) tilt and lead angles. Colors represent the design points above predicted value.
Materials 17 01533 g012
Table 1. Nominal chemical composition of AISI P20 steel (wt.%).
CSiMnCrMoNiFe
0.28~0.400.20~0.800.60~1.001.40~2.000.30~0.550.05~0.10Bal
Table 2. Mechanical properties of AISI P20 steel at room temperature.
Density
(kg/m3)
Young’s Modulus
(GPa)
Hardness
(HRC)
Yield Strength
(MPa)
Thermal Conductivity
(W/m·K)
780020730~36114029.0
Table 3. Machining parameters of ball-end milling experiments.
No.Spindle Speed, n (r/min)Feed per Tooth, fz (mm/tooth)Radial Depth of Cut, ae (mm)Axial Depth of Cut, ap (mm)Tilt Angle, β1 (°)Lead Angle, β2 (°)
1#50000.360.250.3−84
2#65000.360.30.15−120
3#65000.560.20.1−164
Table 4. Experimental and simulated roughness.
No.Experimental Sa (μm)Predicted Sa (μm)Relative Deviation (%)
Average ValueStandard Deviation
1#0.81580.06560.82270.85
2#0.92890.08710.9087−2.17
3#1.87230.09852.124613.48
Table 5. Box–Behnken design and simulated results of average roughness.
StdFeed per Tooth, fz (mm)Radial Depth of Cut, ae (mm)Tilt Angle, β1 (°)Lead Angle, β2 (°)Simulated Roughness, Sa (μm)
10.10.1440.0937
20.50.1442.7981
30.10.5441.6139
40.50.5442.9981
50.30.3001.644
60.30.3800.8779
70.30.3080.8779
80.30.3880.8536
90.10.3400.5844
100.50.3403.2895
110.10.3480.5847
120.50.3482.2598
130.30.1040.9095
140.30.5041.6984
150.30.1840.6976
160.30.5841.6937
170.10.3040.5844
180.50.3043.2895
190.10.3840.5847
200.50.3842.2598
210.30.1400.9095
220.30.5401.6984
230.30.1480.6976
240.30.5481.6937
250.30.3440.925
260.30.3440.925
270.30.3440.925
280.30.3440.925
290.30.3440.925
Table 6. ANOVA for response surface quadratic model.
SourceSum of SquaresdfMean SquareF Valuep-Value (Prob>F)
Model21.11102.11145.73<0.0001
fz13.76113.76949.88<0.0001
ae2.3312.33161.02<0.0001
β10.3510.3523.860.0001
β20.3510.3523.860.0001
fz × ae0.4410.4430.08<0.0001
fz × β10.2710.2718.310.0005
fz × β20.2710.2718.310.0005
ae × β10.01110.0110.790.3883
ae × β20.01110.0110.790.3883
β1 × β20.1410.149.500.0064
fz23.0713.07212.15<0.0001
ae20.3910.3926.87<0.0001
β120.0310.032.180.1615
β220.0310.032.180.1615
Residual0.26140.014
Lack of fit0.26140.019
Pure error0.00040.000
Cor Total21.3728
Disclaimer/Publisher’s Note: The statements, opinions and data contained in all publications are solely those of the individual author(s) and contributor(s) and not of MDPI and/or the editor(s). MDPI and/or the editor(s) disclaim responsibility for any injury to people or property resulting from any ideas, methods, instructions or products referred to in the content.