
First-Principles Calculations of the Mechanical Properties of Doped Cu3P Alloys

Abstract
:1. Introduction
2. Crystal Structure and Calculation Methods
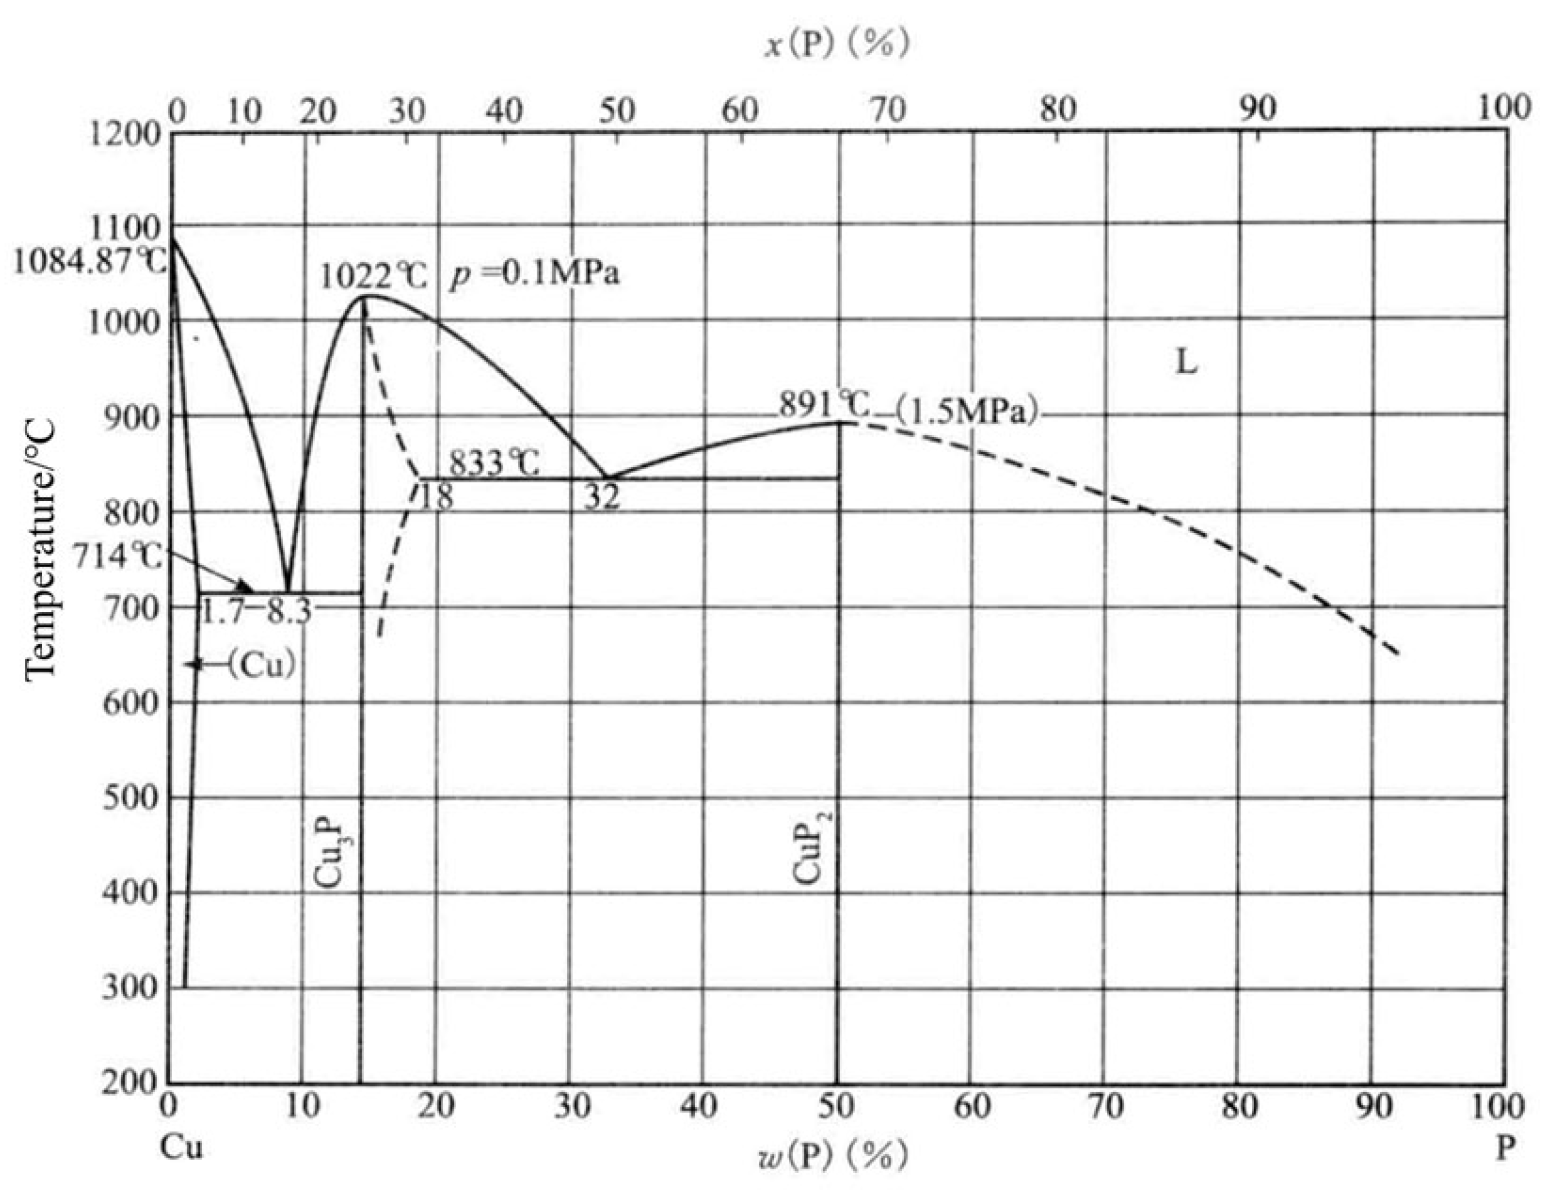
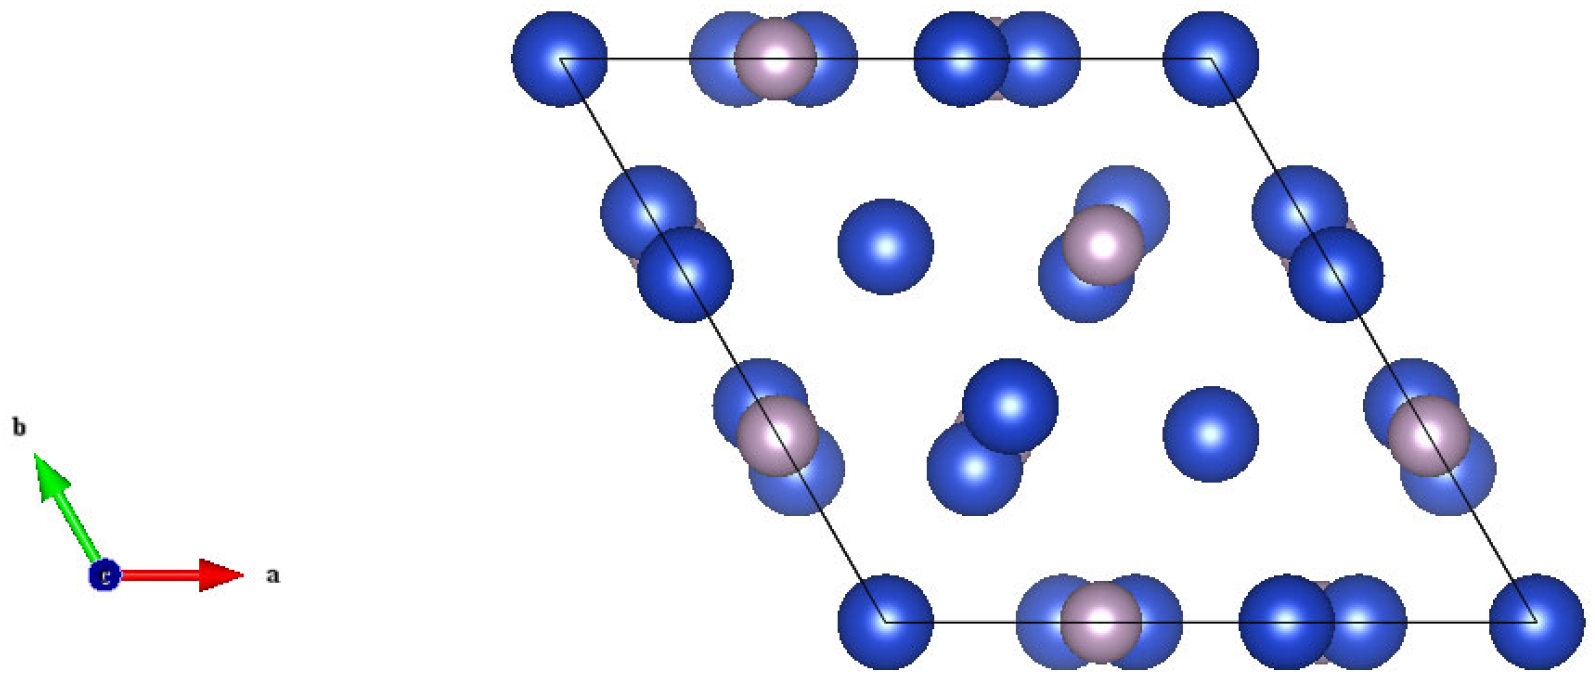
2.1. Crystal Structure
2.2. Calculation Methods and Parameters
3. Results
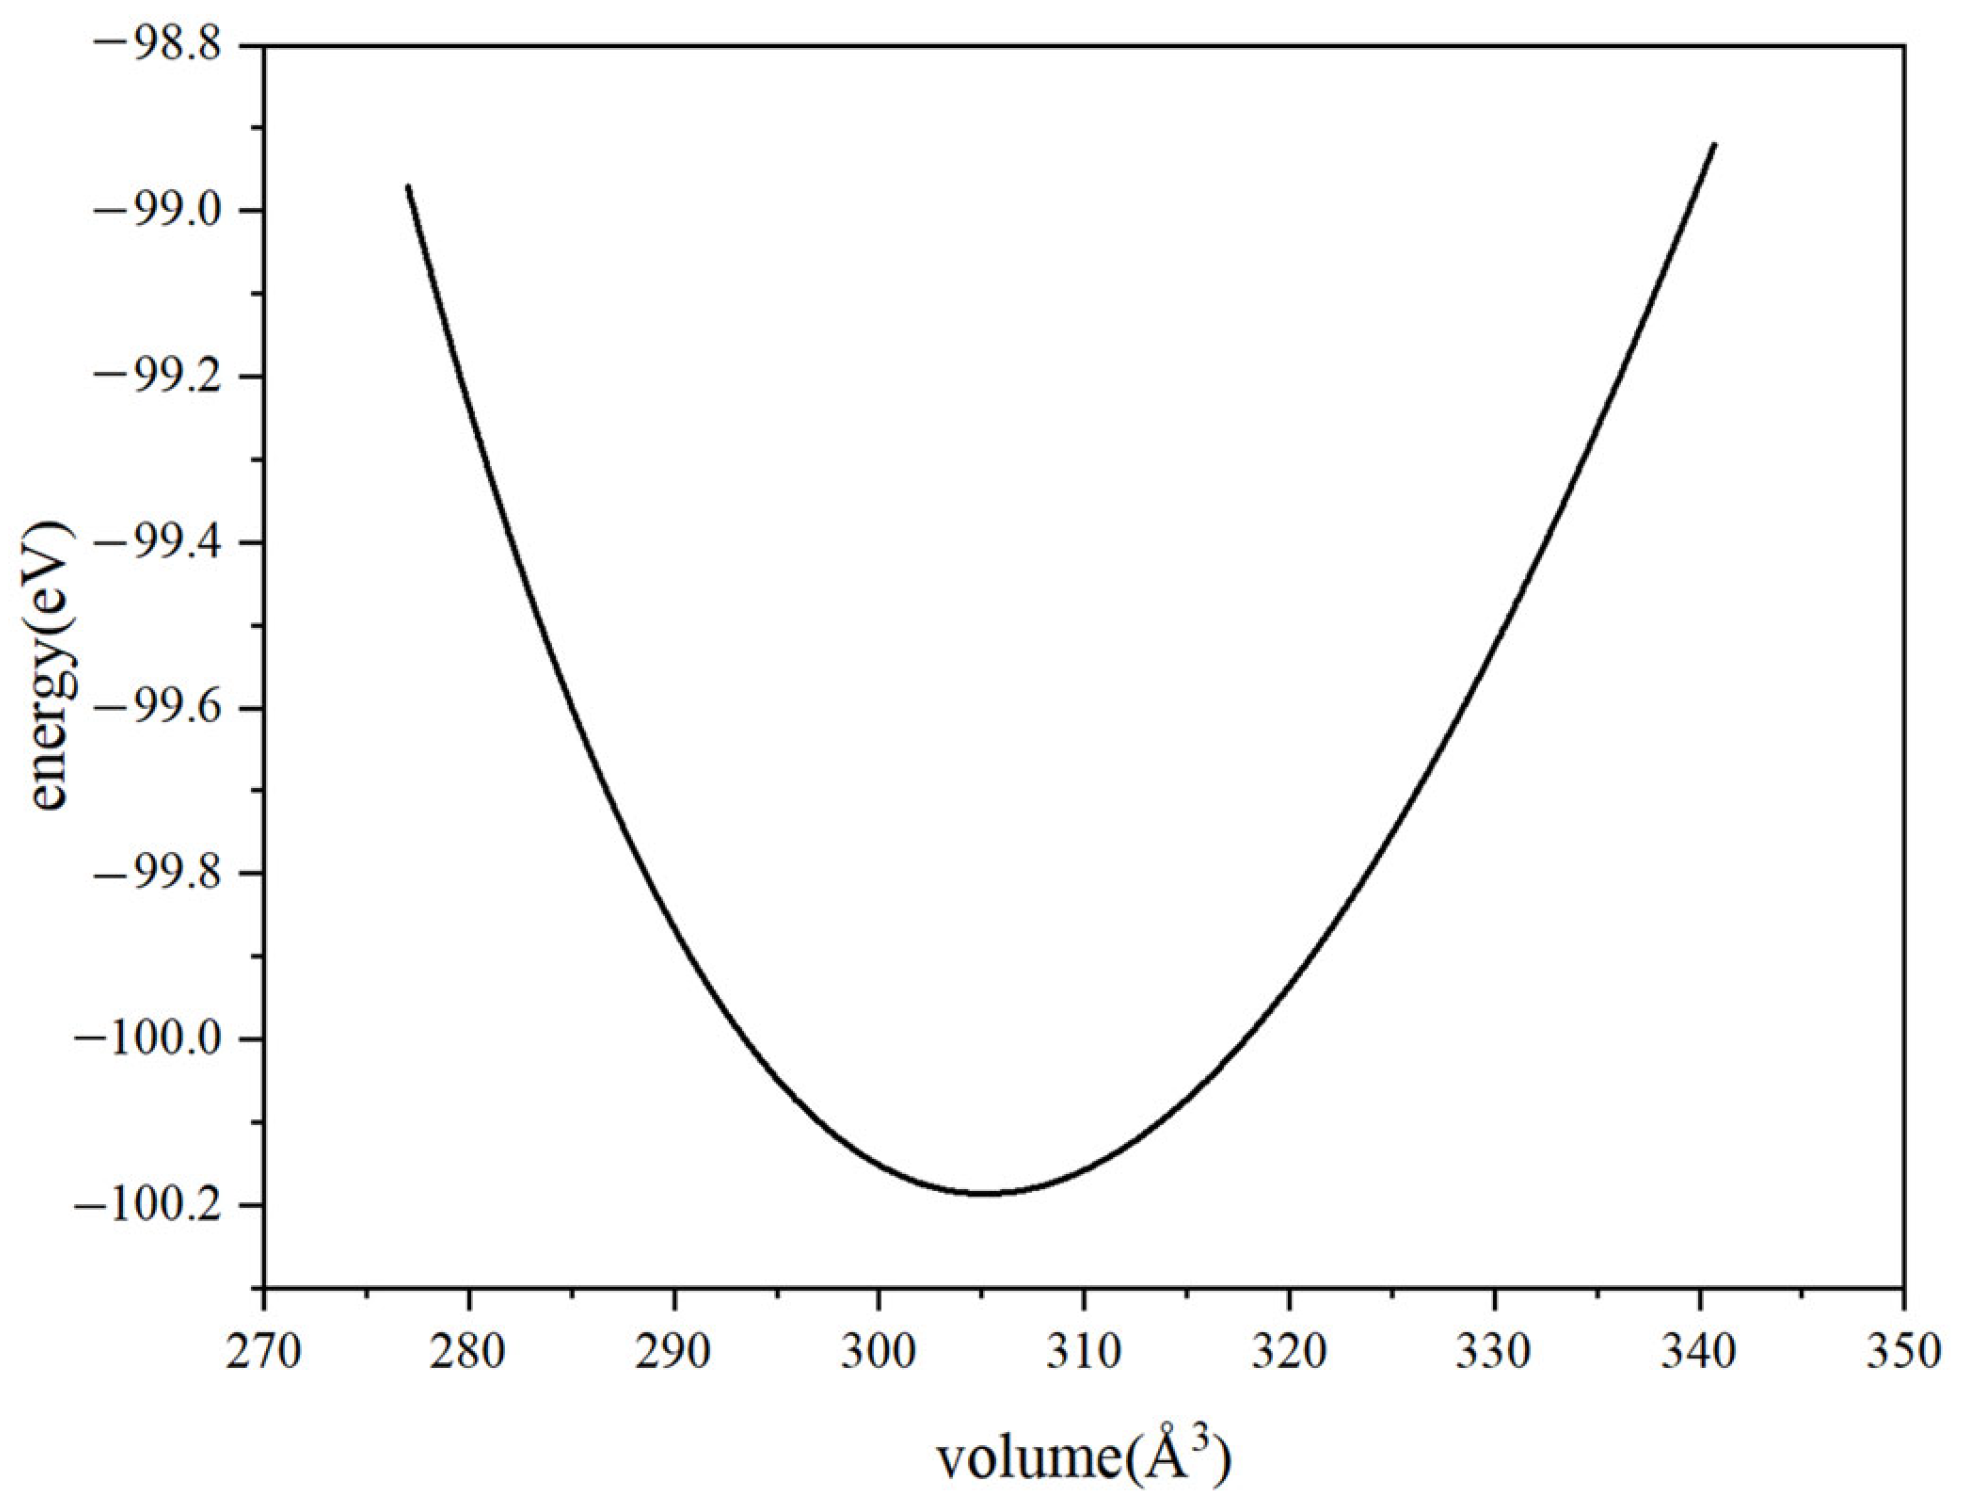
3.1. Lattice Constants
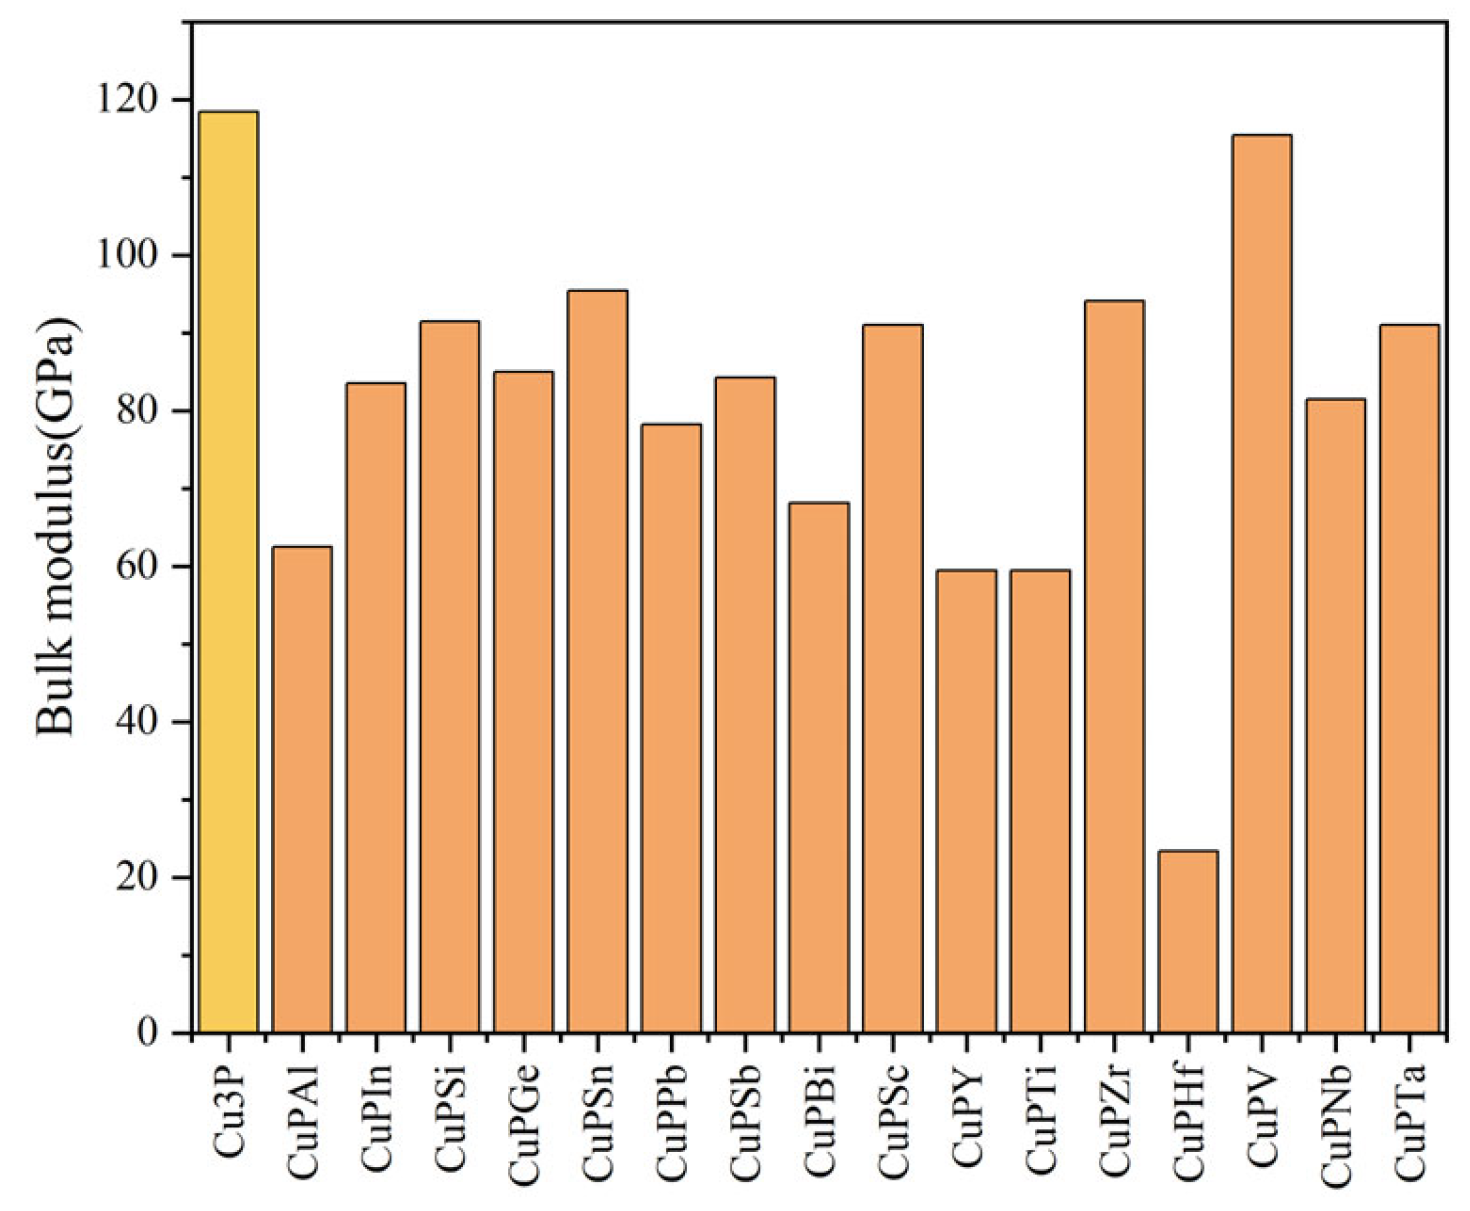
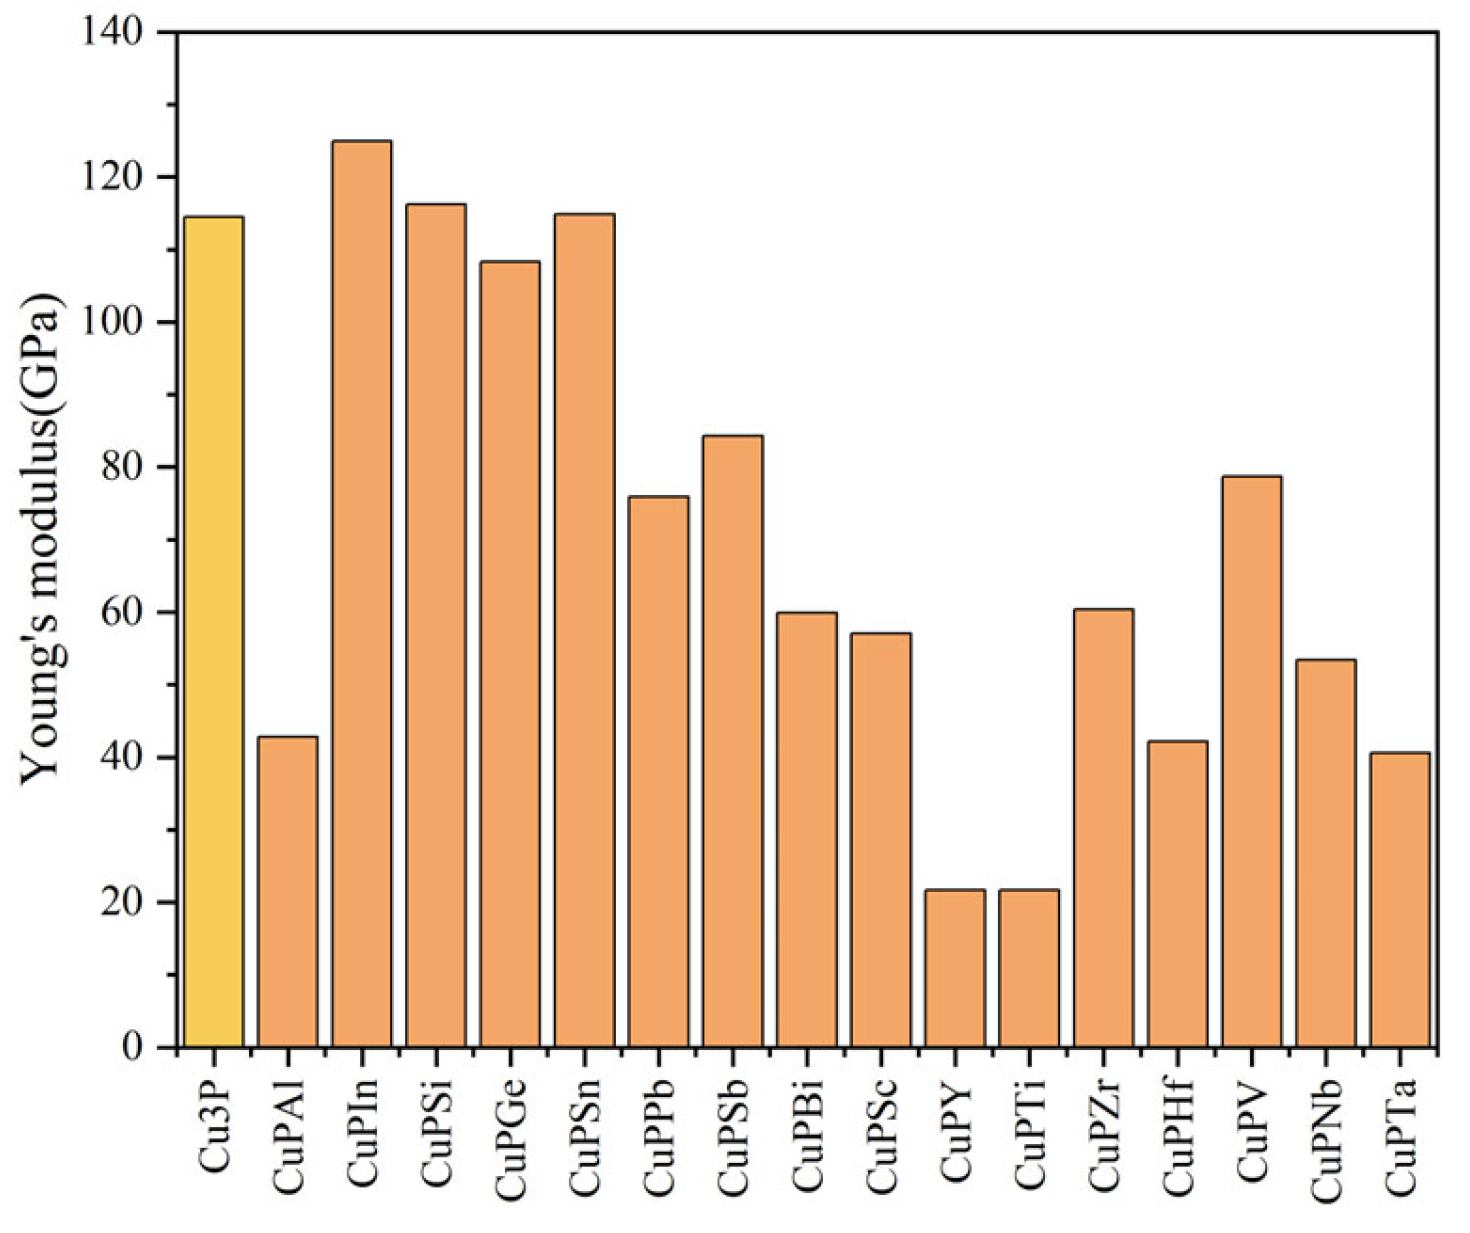
3.2. Mechanical Properties
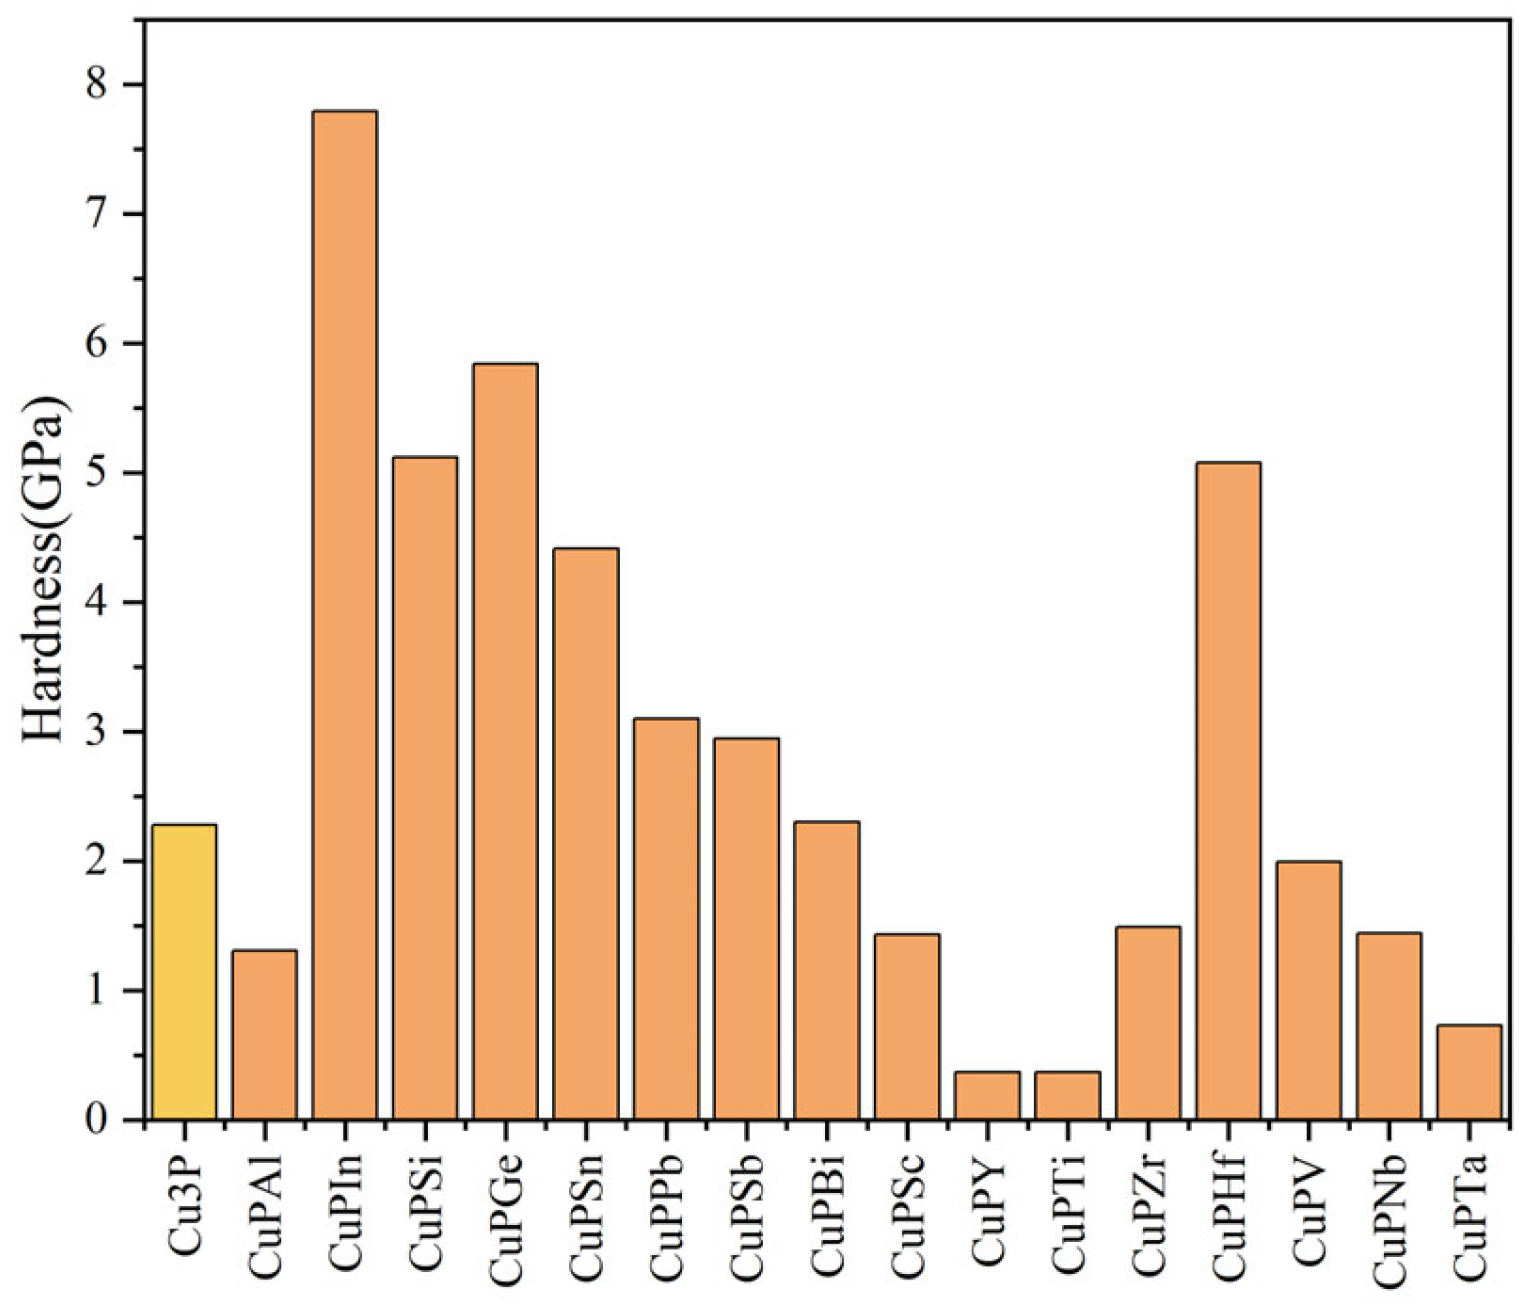
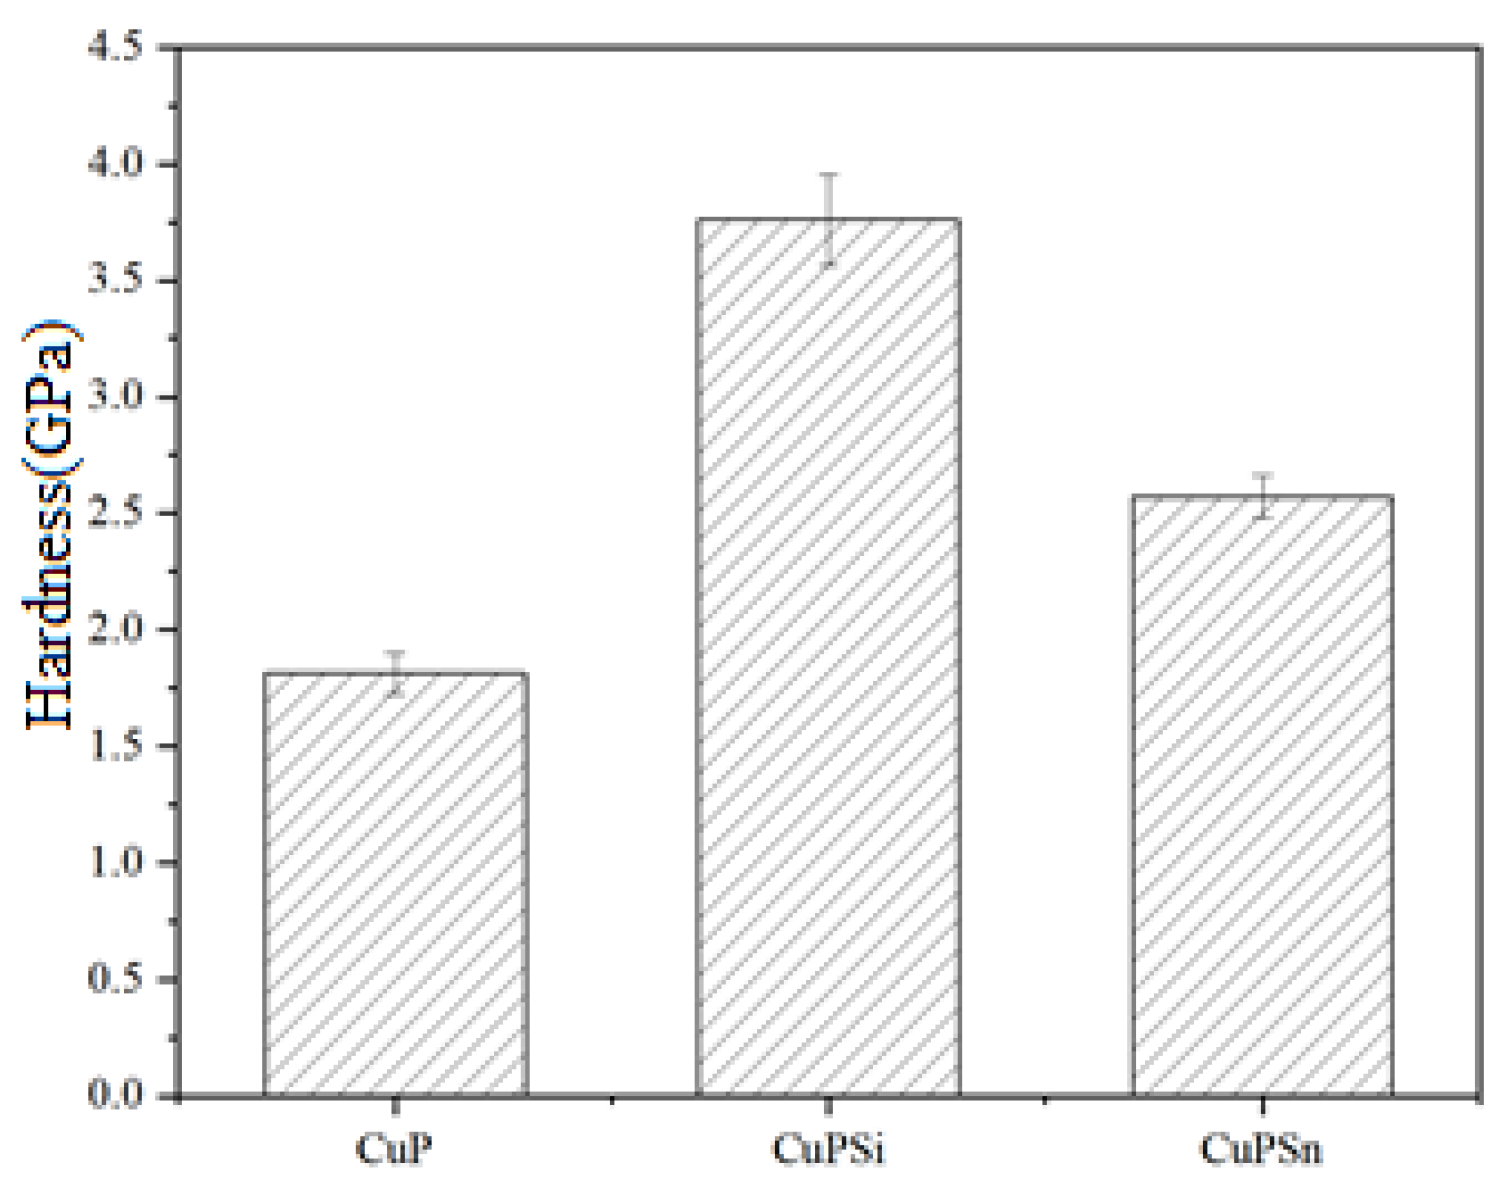
3.3. Hardness
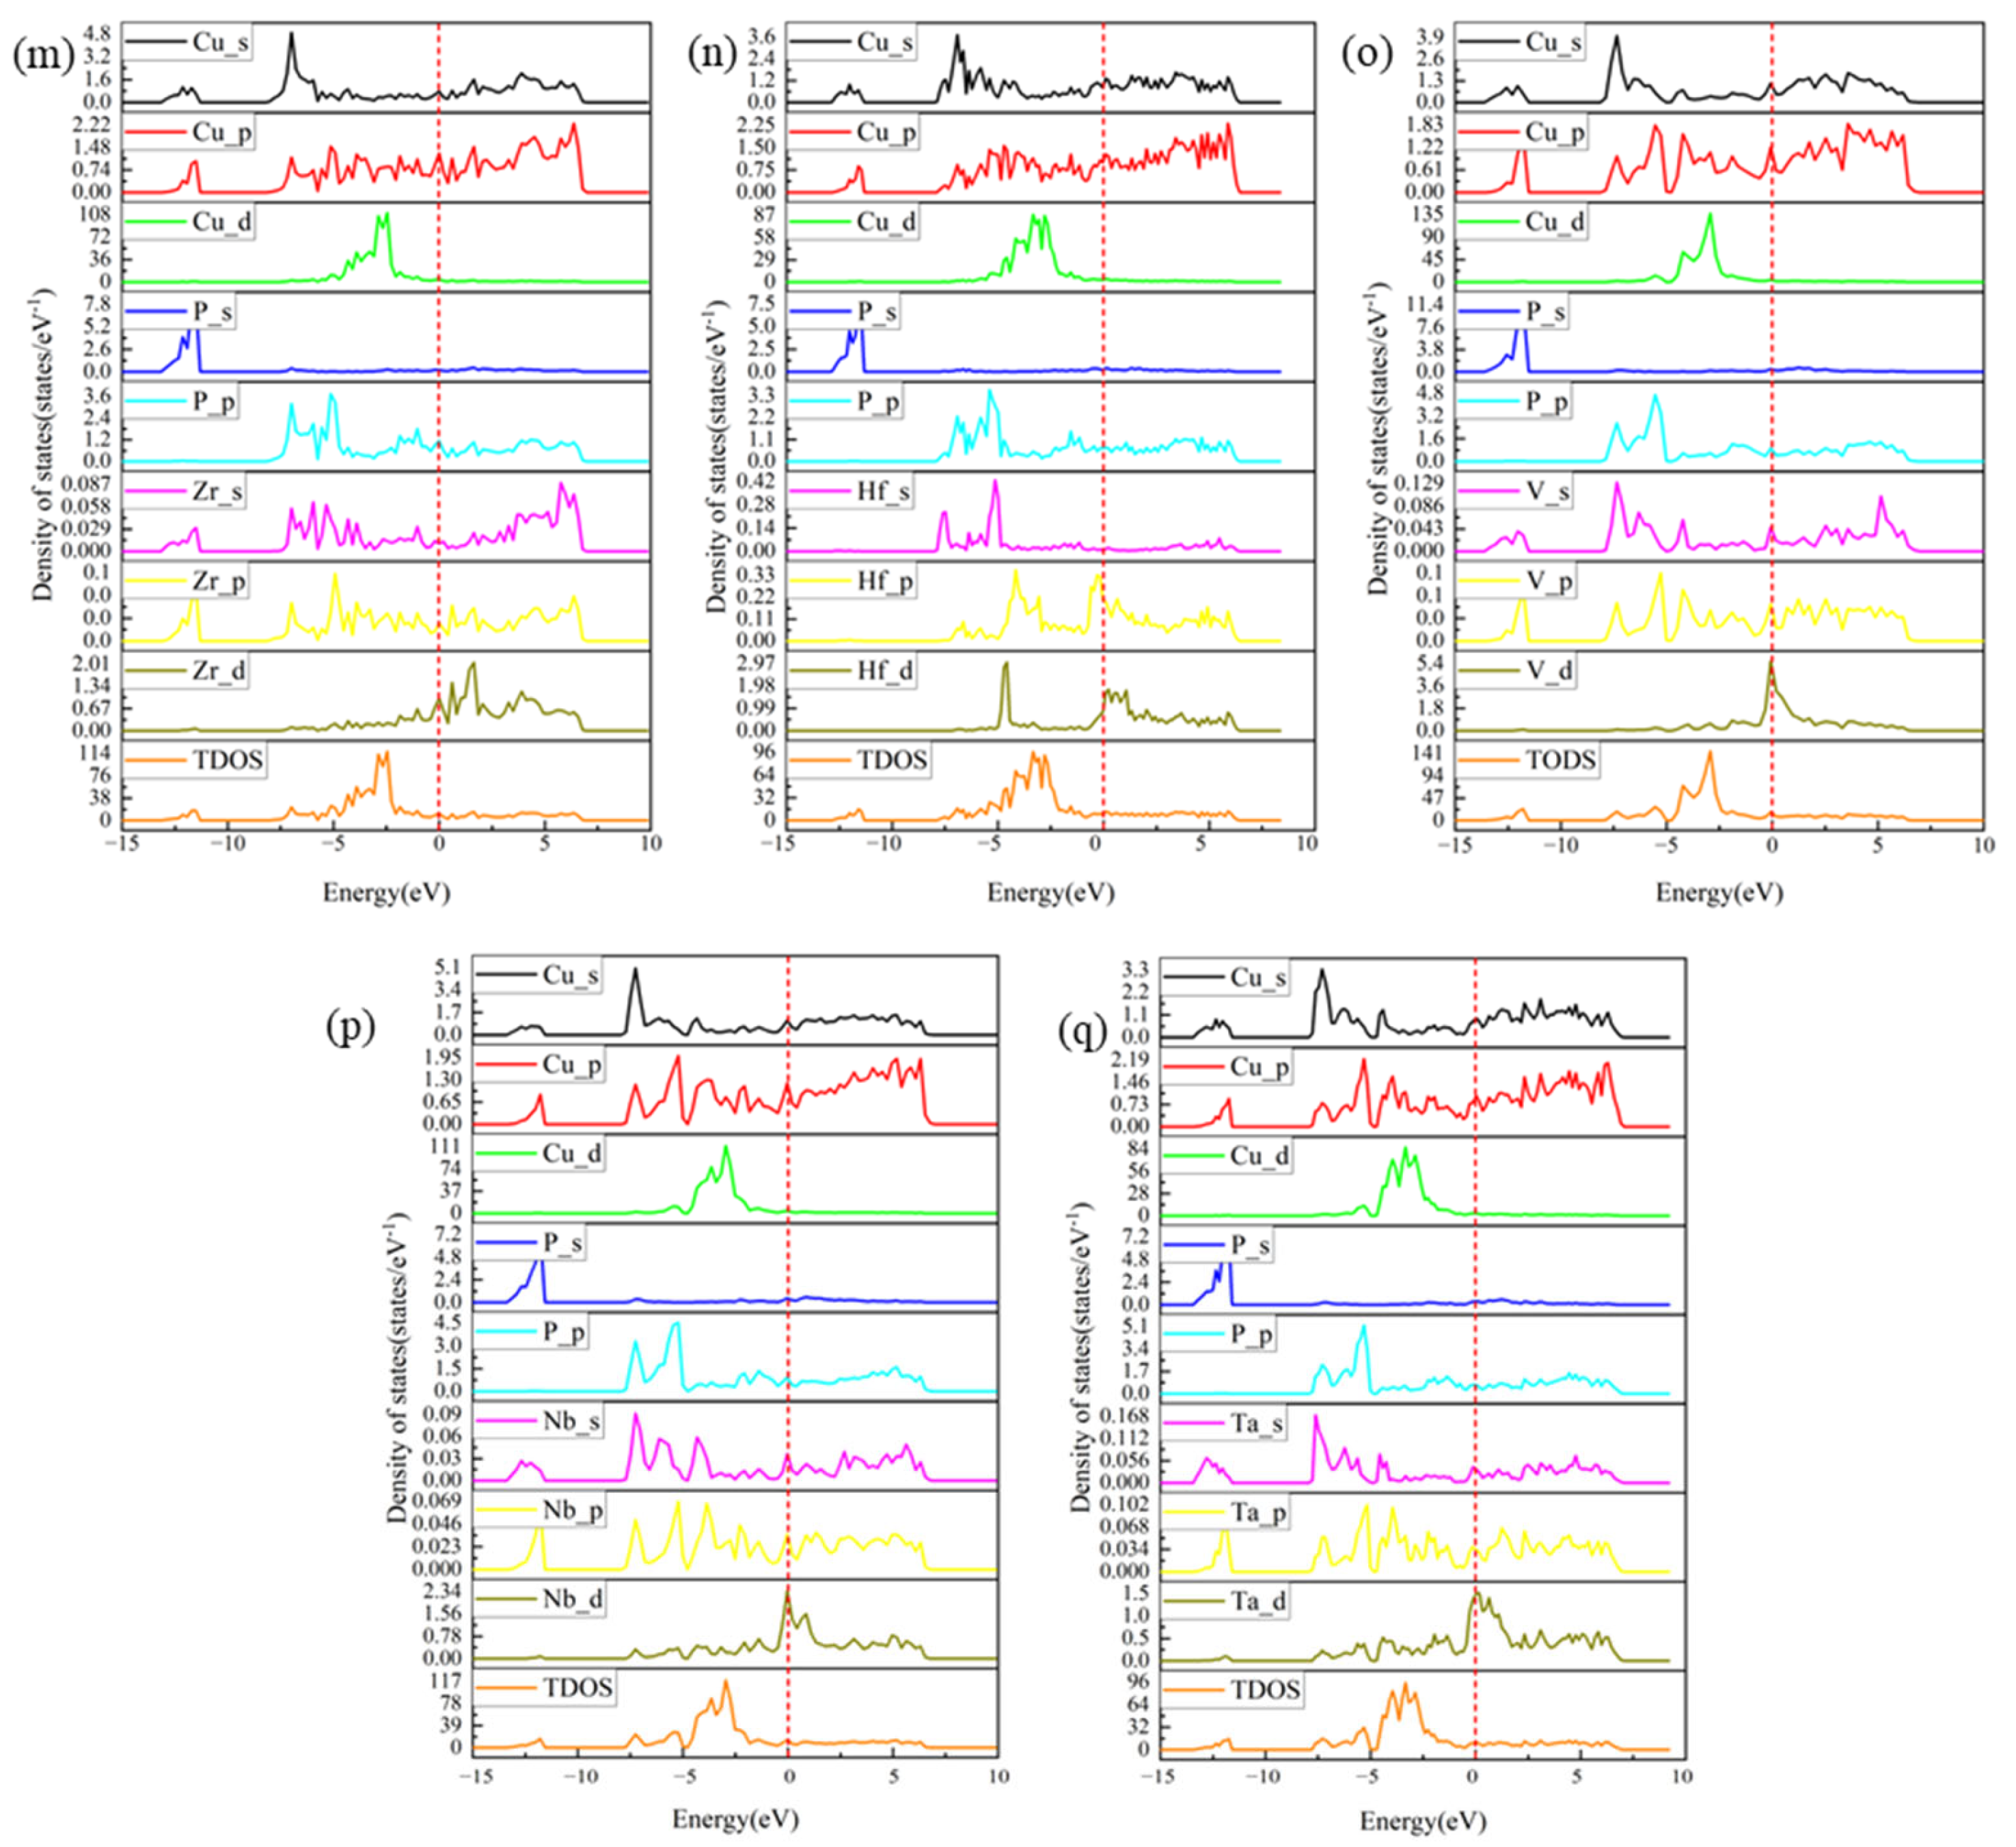
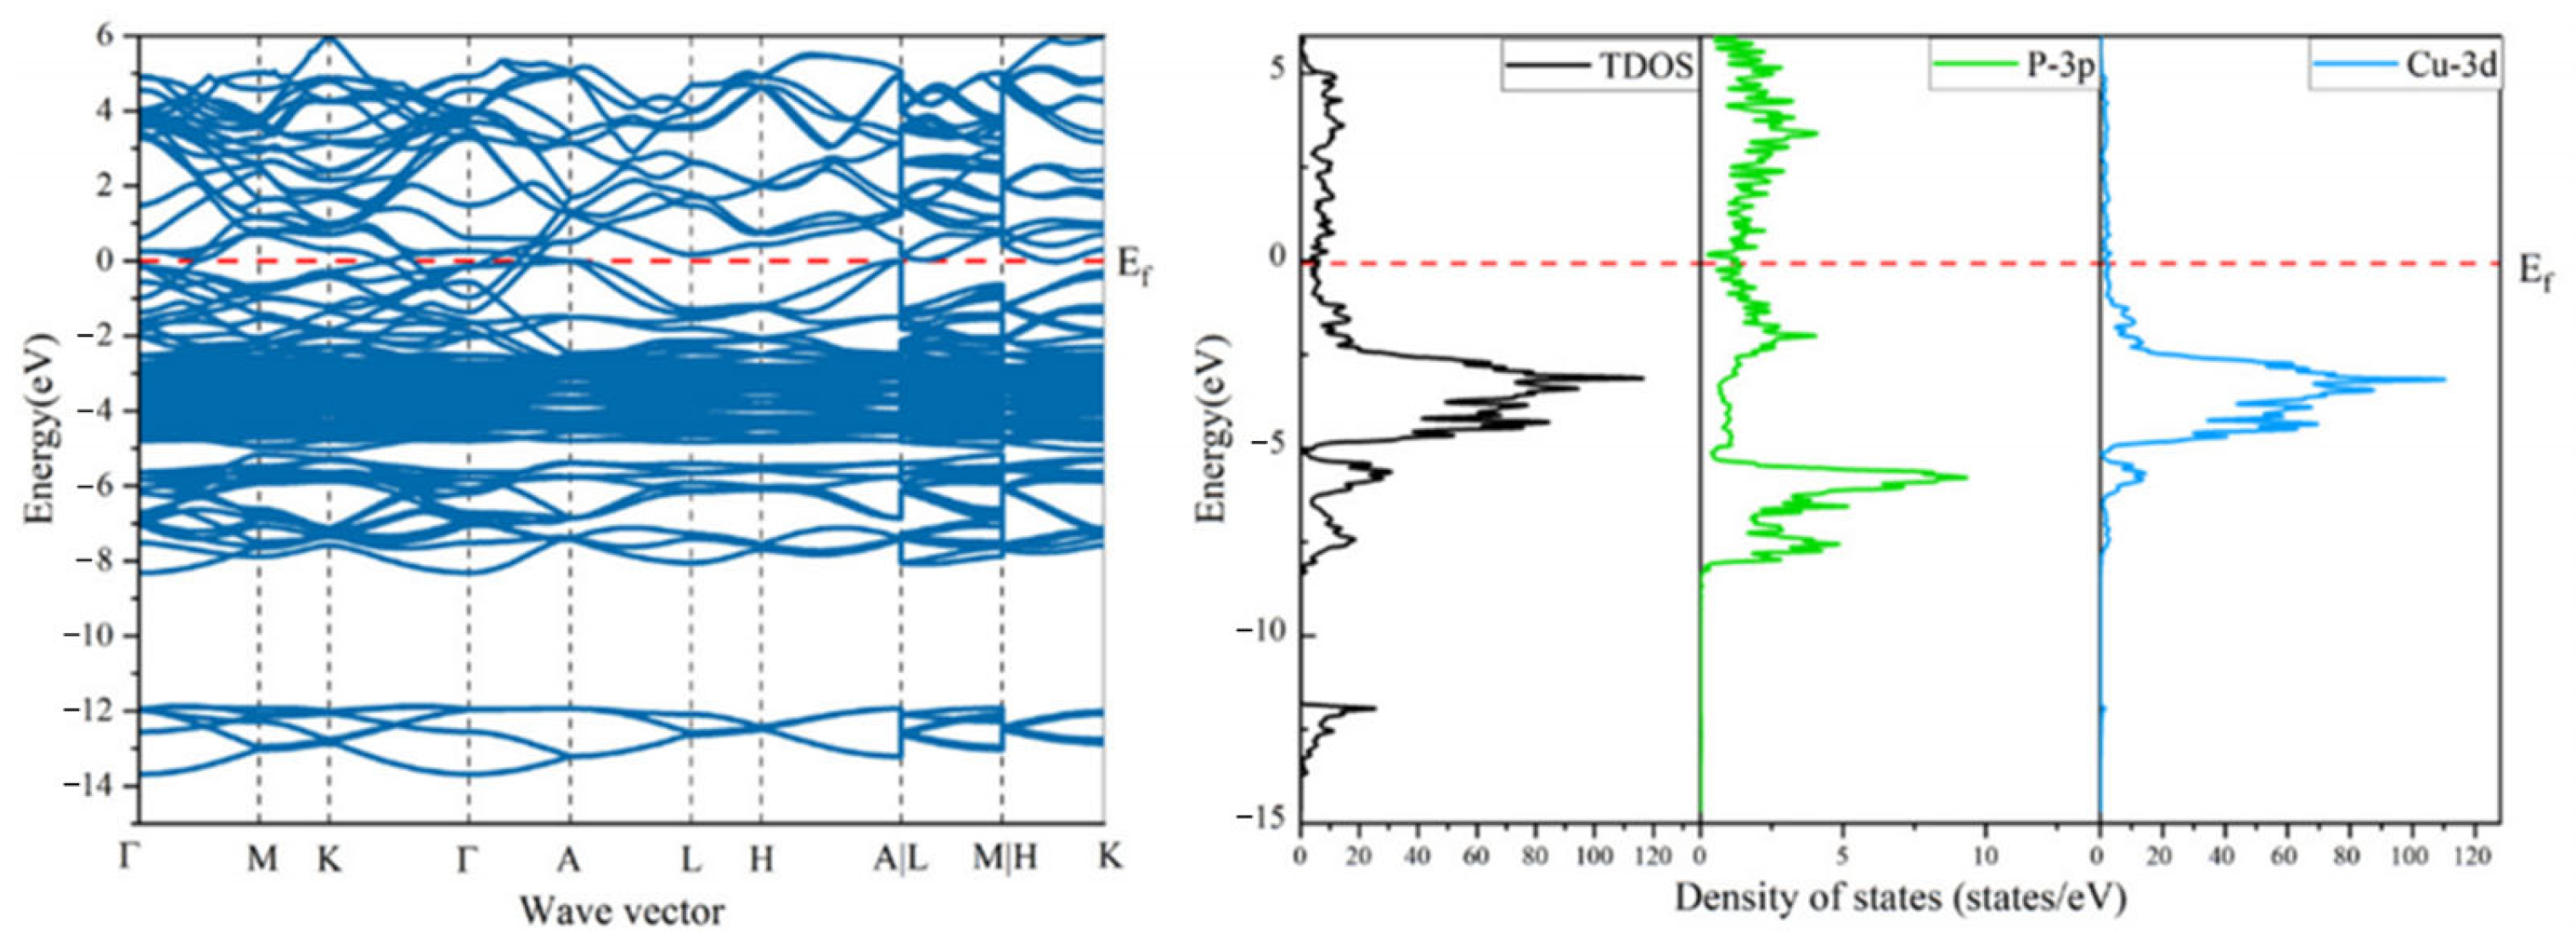
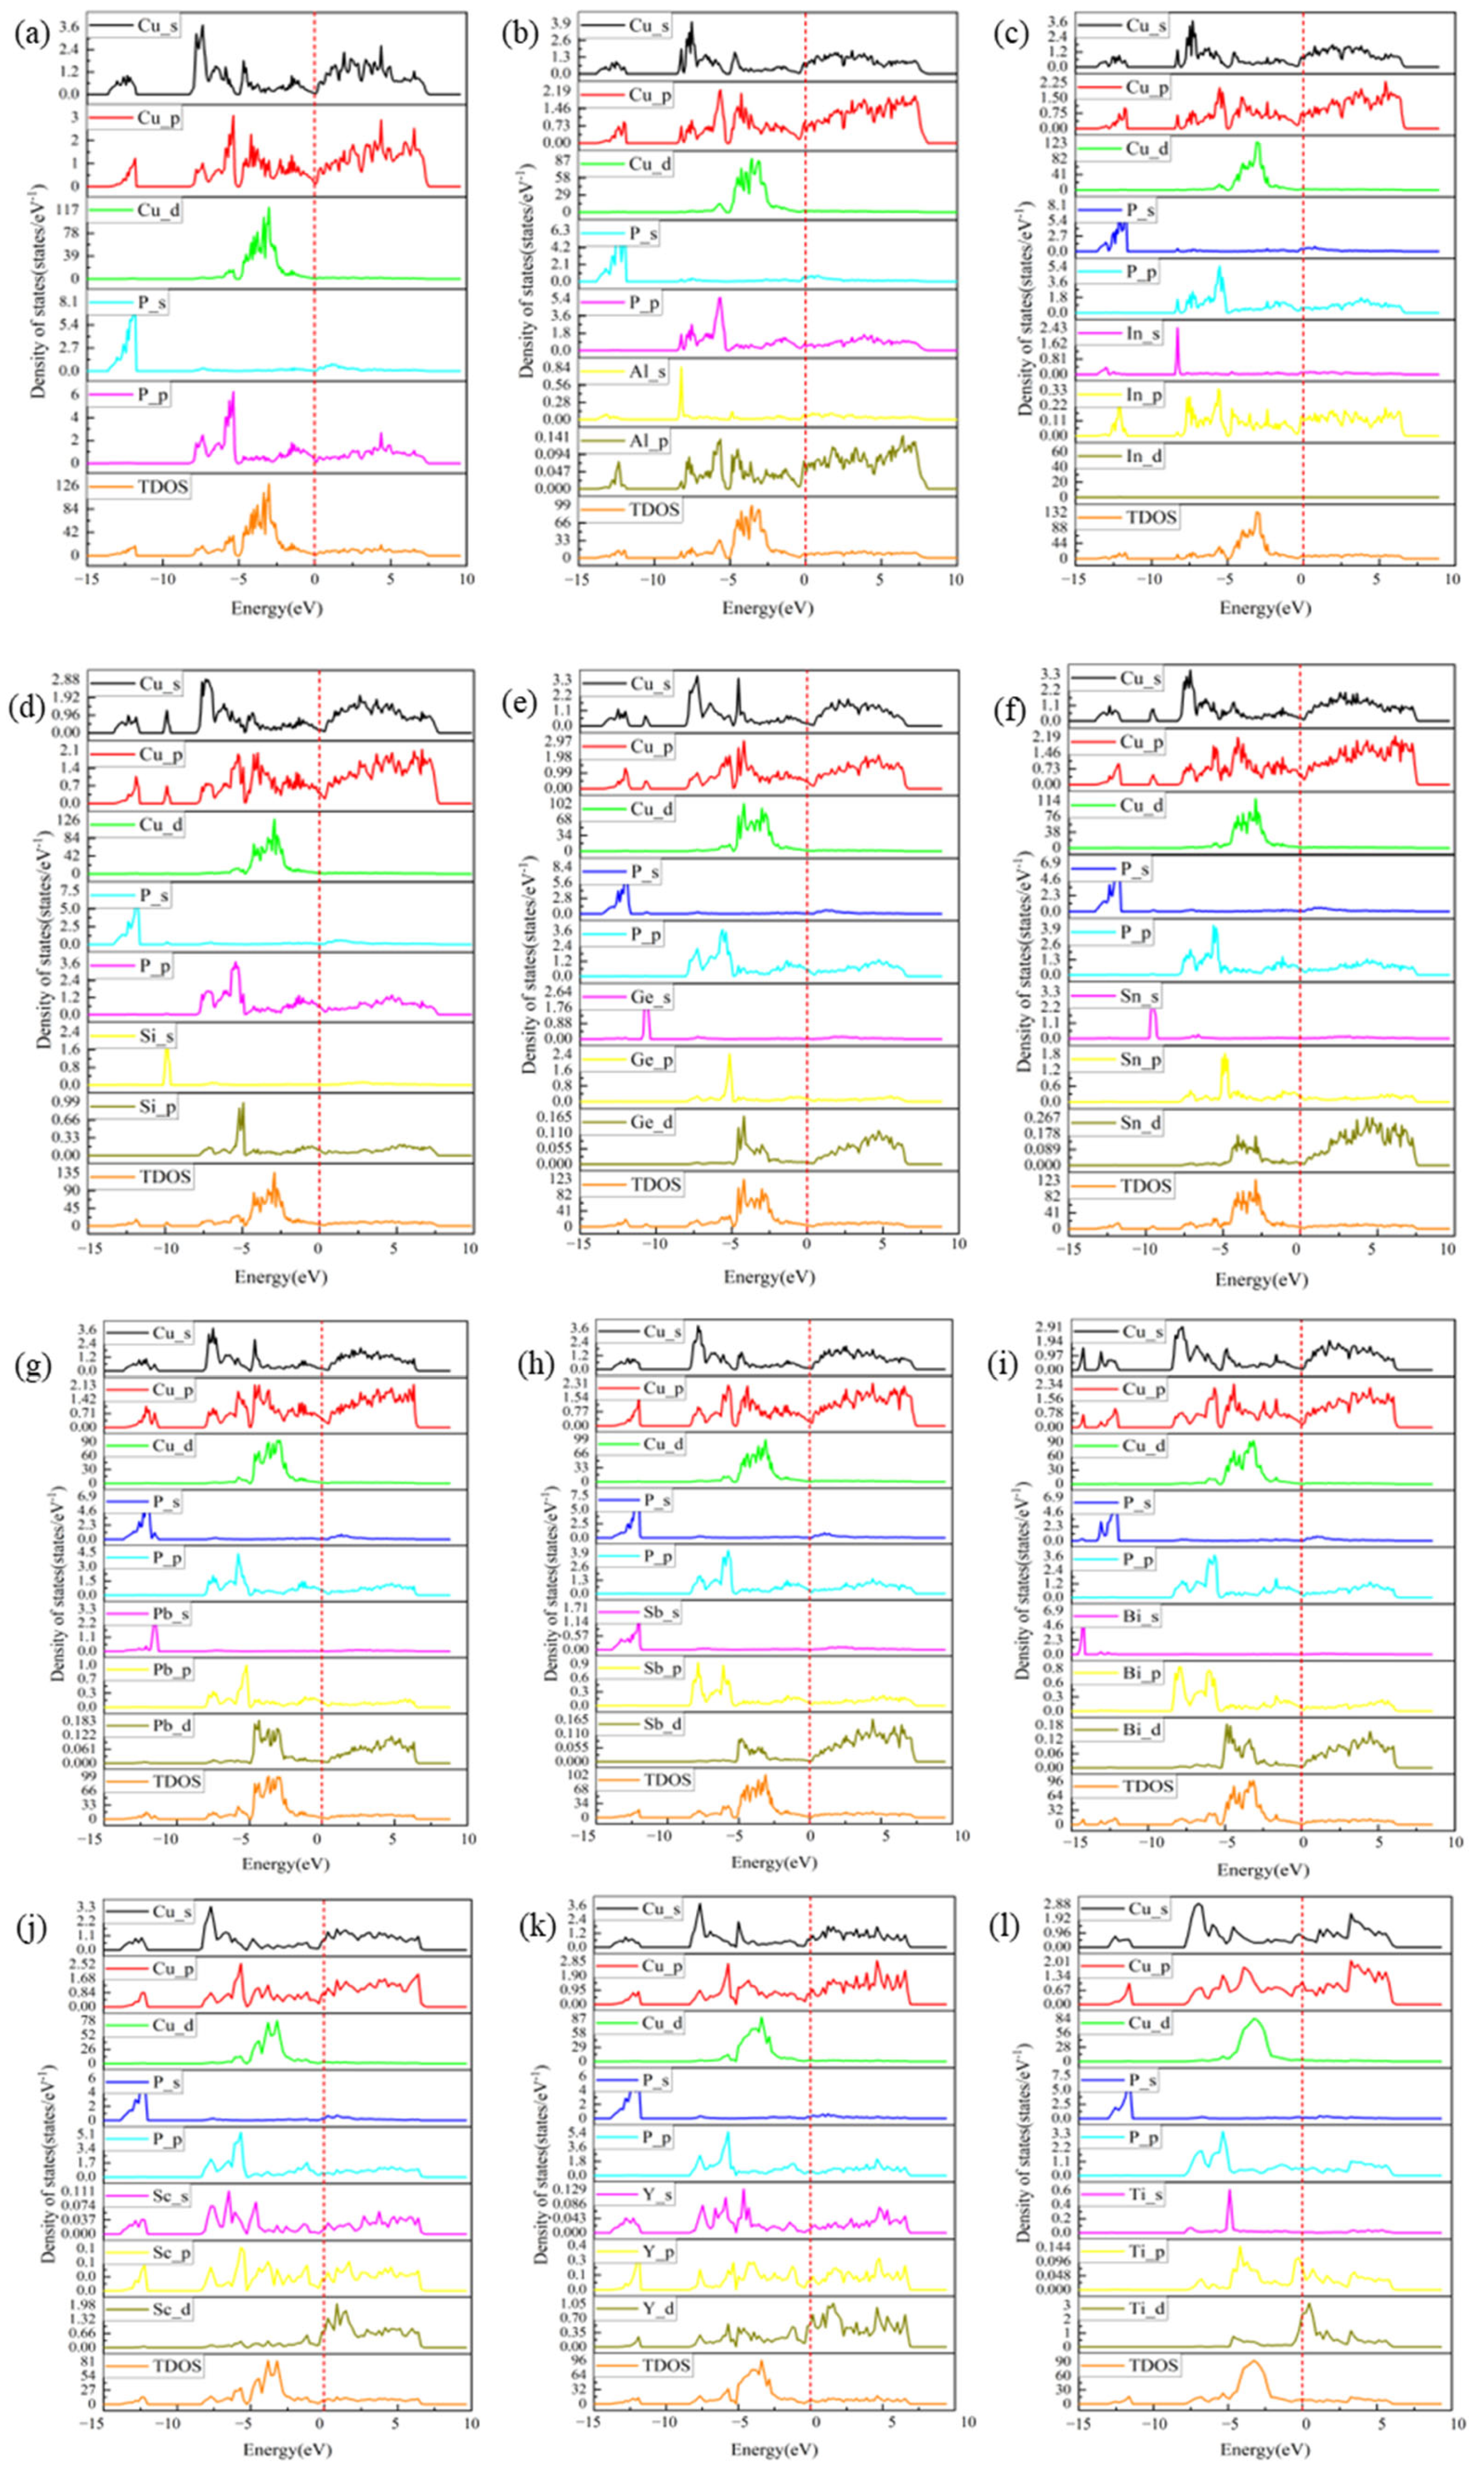
3.4. PDOS and TDOS
4. Conclusions
Author Contributions
Funding
Institutional Review Board Statement
Informed Consent Statement
Data Availability Statement
Conflicts of Interest
References
- Xu, X.; Ma, Q.; Xia, C. Micromorphology change and microstructure of Cu-P based amorphous filler during heating process. High Temp. Mater. Process. 2019, 38, 651–661. [Google Scholar] [CrossRef]
- Xue, S.; Wang, B.; Zhang, L.; Long, W. Development of green welding technology in China during the past decade. Mater. Rep. 2019, 33, 2813–2830. [Google Scholar]
- Yu, J.-Q. Practical Brazing Alloy Phase Diagram Manual; China Machinery Industry Publishing: Zhengzhou, China, 2015; Volume 1, p. 745. [Google Scholar]
- Crovetto, A.; Unold, T.; Zakutayev, A. Is Cu3–x P a Semiconductor, a Metal, or a Semimetal? Chem. Mater. 2023, 35, 1259–1272. [Google Scholar] [CrossRef] [PubMed]
- Li, Y.-N.; Wang, C.-W.; Peng, Z.-L.; Yan, J.-C.; Liu, X.-S. Dissolution behavior of Cu in Cu-Ag and Cu-P brazing alloys using weld brazing. Trans. Nonferrous Met. Soc. China 2011, 21, s394–s399. [Google Scholar] [CrossRef]
- Wu, J.; Xue, S.; Luo, Q. Development of a Novel Low-Silver Cu-P Brazing Filler Metal Bearing Sn. Crystals 2022, 12, 66. [Google Scholar] [CrossRef]
- Luo, Q.; Xue, S.; Wu, J. Influences of Sn on Properties of Ag-Based and Cu-Based Brazing Filler Metals. Crystals 2021, 11, 1403. [Google Scholar] [CrossRef]
- Xia, T.; Zhang, Q.; Yu, W. Fuzzy Comprehensive Evaluation of Performance of Typical Cu-P and Ag-Cu-Zn Alloys. Hot Work. Technol. 2013, 42, 212–214. [Google Scholar]
- Huang, J.; Long, W.; Zhang, G. Effect of Sn on performance and microstructure of copper-phosphorus filler metals. Weld. Join. 2012, 3, 57–60. [Google Scholar]
- Li, S. Effect of Fe/mn/zn on Microstructure and Properties of Copper-Phosphorous Solder and Joints. Master’s Thesis, Zhengzhou University, Zhengzhou, China, 2018. [Google Scholar]
- Peng, C.; Liang, S.; Huang, F.; Zeng, L.; Zhou, L.; Ran, X. Influence of Au, Cu, Pd added in Ag alloy on stability and electronic structure of Ag/Al interface by first-principles calculations. Mater. Today Commun. 2020, 22, 100670. [Google Scholar] [CrossRef]
- Xiao, F.; Lin, W.; Cheng, Q. Ab-initio calculations and molecular dynamics simulations of In, Ag, and Cu replacing Zn in sphalerite: Implications for critical metal mineralization. Ore Geol. Rev. 2023, 163, 105699. [Google Scholar] [CrossRef]
- Dai, W.; Zou, Y.; Wang, J.; Su, Y.; Zhang, D. A First-Principles Study of Mechanical and Electronic Properties of Cr0. 5-xAl0. 5TMxN Hard Coatings (TM= Ti, V, Y, Zr, Hf, and Ta). Materials 2024, 17, 1070. [Google Scholar] [CrossRef] [PubMed]
- Cui, X.Y.; Medvedeva, J.E.; Delley, B.; Freeman, A.J.; Newman, N.; Stampfl, C. Role of embedded clustering in dilute magnetic semiconductors: Cr doped GaN. Phys. Rev. Lett. 2005, 95, 256404. [Google Scholar] [CrossRef] [PubMed]
- Azar, S.M.; Mousa, A.A.; Khalifeh, J.M. Structural, electronic and magnetic properties of Ti 1+x FeSb Heusler alloys. Intermetallics 2017, 85, 197–205. [Google Scholar] [CrossRef]
- Stojković, M.; Koteski, V.; Belošević-Čavor, J.; Cekić, B.; Stojić, D.; Ivanovski, V. Structure and electronic properties ofMo3Pt, MoPt2, andMoPt3: First-principles calculations. Phys. Rev. B 2008, 77, 193111. [Google Scholar] [CrossRef]
- Olofsson, O.; Holmlund, L.G.; Ingri, N.; Tricker, M.J.; Svensson, S.J.A.C.S. The Crystal Structure of Cu3P. Acta Chem. Scand. 1972, 26, 2777–2787. [Google Scholar] [CrossRef]
- Jain, A.; Ong, S.P.; Hautier, G.; Chen, W.; Richards, W.D.; Dacek, S.; Cholia, S.; Gunter, D.; Skinner, D.; Ceder, G.; et al. Commentary: The Materials Project: A materials genome approach to accelerating materials innovation. APL Mater. 2013, 1, 011002. [Google Scholar] [CrossRef]
- Hill, R. The elastic behaviour of a crystalline aggregate. Proc. Phys. Soc. A 1952, 65, 349. [Google Scholar] [CrossRef]
- Yangzhen, L.; Yehua, J.; Rong, Z. First-Principles Study on Stability and Mechanical Properties of Cr7C3. Rare Met. Mater. Eng. 2014, 43, 2903–2907. [Google Scholar] [CrossRef]
- Mattesini, M.; Ahuja, R.; Johansson, B. CubicHf3N4andZr3N4:A class of hard materials. Phys. Rev. B 2003, 68, 184108. [Google Scholar] [CrossRef]
- Chen, K.; Zhao, L.R.; Rodgers, J.; Tse, J.S. Alloying effects on elastic properties of TiN-based nitrides. J. Phys. D Appl. Phys. 2003, 36, 2725–2729. [Google Scholar] [CrossRef]
- Tian, Y.; Xu, B.; Zhao, Z. Microscopic theory of hardness and design of novel superhard crystals. Int. J. Refract. Met. Hard Mater. 2012, 33, 93–106. [Google Scholar] [CrossRef]
- Chen, X.-Q.; Niu, H.; Li, D.; Li, Y. Modeling hardness of polycrystalline materials and bulk metallic glasses. Intermetallics 2011, 19, 1275–1281. [Google Scholar] [CrossRef]


| The Formation Energy of Doped (eV) | ||
|---|---|---|
| Substituted P | Substituted Cu | |
| CuPAl | 3.4878 | 1.1919 |
| CuPIn | 7.0751 | 5.0229 |
| CuPSi | −1.2637 | 1.2642 |
| CuPGe | 0.9096 | 1.0031 |
| CuPSn | 3.4962 | 5.2153 |
| CuPPb | 1.0973 | 1.1961 |
| CuPSb | 1.0393 | 1.1533 |
| CuPBi | 1.138 | 1.248 |
| CuPSc | 1.0137 | 0.894 |
| CuPY | 1.1317 | 0.9915 |
| CuPTi | 0.9469 | 1.015 |
| CuPZr | 3.0571 | −1.1363 |
| CuPHf | 0.9735 | 1.0212 |
| CuPV | 0.9821 | 0.8592 |
| CuPNb | 0.9468 | 0.7869 |
| CuPTa | 0.9229 | 0.777 |
| Calculated Values in This Paper | Literature Experimental Values [17] | Literature Calculated Values [18] | |||||||
|---|---|---|---|---|---|---|---|---|---|
| Cu3P | a/Å | b/Å | c/Å | a/Å | b/Å | c/Å | a/Å | b/Å | c/Å |
| 6.974 | 6.974 | 7.199 | 6.959 | 6.959 | 7.143 | 6.96 | 6.96 | 7.18 | |
| a/Å | b/Å | c/Å | Volume/Å | |
|---|---|---|---|---|
| CuPAl | 7.0103 | 7.0103 | 7.316 | 311.3727 |
| CuPIn | 7.0936 | 7.0936 | 7.403 | 322.6141 |
| CuPSi | 6.968 | 6.9664 | 7.2143 | 304.4818 |
| CuPGe | 7.0344 | 7.0344 | 7.2201 | 309.4002 |
| CuPSn | 7.1849 | 7.0899 | 7.2743 | 319.2132 |
| CuPPb | 7.1557 | 7.1557 | 7.3446 | 325.6873 |
| CuPSb | 7.1252 | 7.1252 | 7.3133 | 321.5426 |
| CuPBi | 7.1748 | 7.1748 | 7.3642 | 328.3069 |
| CuPSc | 7.1025 | 7.1025 | 7.29 | 318.4796 |
| CuPY | 7.1861 | 7.1861 | 7.3758 | 329.862 |
| CuPTi | 7.0805 | 7.0805 | 7.2674 | 315.5243 |
| CuPZr | 7.0226 | 7.0226 | 7.5458 | 331.3888 |
| CuPHf | 7.1563 | 7.1563 | 7.3452 | 325.7642 |
| CuPV | 7.0196 | 7.0196 | 7.2049 | 307.4571 |
| CuPNb | 7.088 | 7.0880 | 7.2751 | 316.537 |
| CuPTa | 7.0887 | 7.0887 | 7.2758 | 316.6252 |
| P | Si | Sn | Cu | |
|---|---|---|---|---|
| CuPSi | 12.50 (11.67) | 0.26 (2.12) | / | Allowance |
| CuPSn | 11.38 (10.93) | / | 6.42 (8.37) | Allowance |
Disclaimer/Publisher’s Note: The statements, opinions and data contained in all publications are solely those of the individual author(s) and contributor(s) and not of MDPI and/or the editor(s). MDPI and/or the editor(s) disclaim responsibility for any injury to people or property resulting from any ideas, methods, instructions or products referred to in the content. |
© 2024 by the authors. Licensee MDPI, Basel, Switzerland. This article is an open access article distributed under the terms and conditions of the Creative Commons Attribution (CC BY) license (https://creativecommons.org/licenses/by/4.0/).
Share and Cite
Ma, X.; Cheng, F.; Huang, W.; He, L.; Ye, Z.; Yu, S.; Hu, L.; Yu, D.; Shen, H. First-Principles Calculations of the Mechanical Properties of Doped Cu3P Alloys. Materials 2024, 17, 1677. https://doi.org/10.3390/ma17071677
Ma X, Cheng F, Huang W, He L, Ye Z, Yu S, Hu L, Yu D, Shen H. First-Principles Calculations of the Mechanical Properties of Doped Cu3P Alloys. Materials. 2024; 17(7):1677. https://doi.org/10.3390/ma17071677
Chicago/Turabian StyleMa, Xiao, Fang Cheng, Weiqing Huang, Lian He, Zixin Ye, Shimeng Yu, Ling Hu, Dingkun Yu, and Hangyan Shen. 2024. "First-Principles Calculations of the Mechanical Properties of Doped Cu3P Alloys" Materials 17, no. 7: 1677. https://doi.org/10.3390/ma17071677