
Performance Evaluation of Calcined Phosphogypsum Reinforced with Basalt Fiber and Calcium Carbonate Whiskers: A Study on Individual and Mixed Tests
Abstract
:1. Introduction
2. Materials and Test Methods
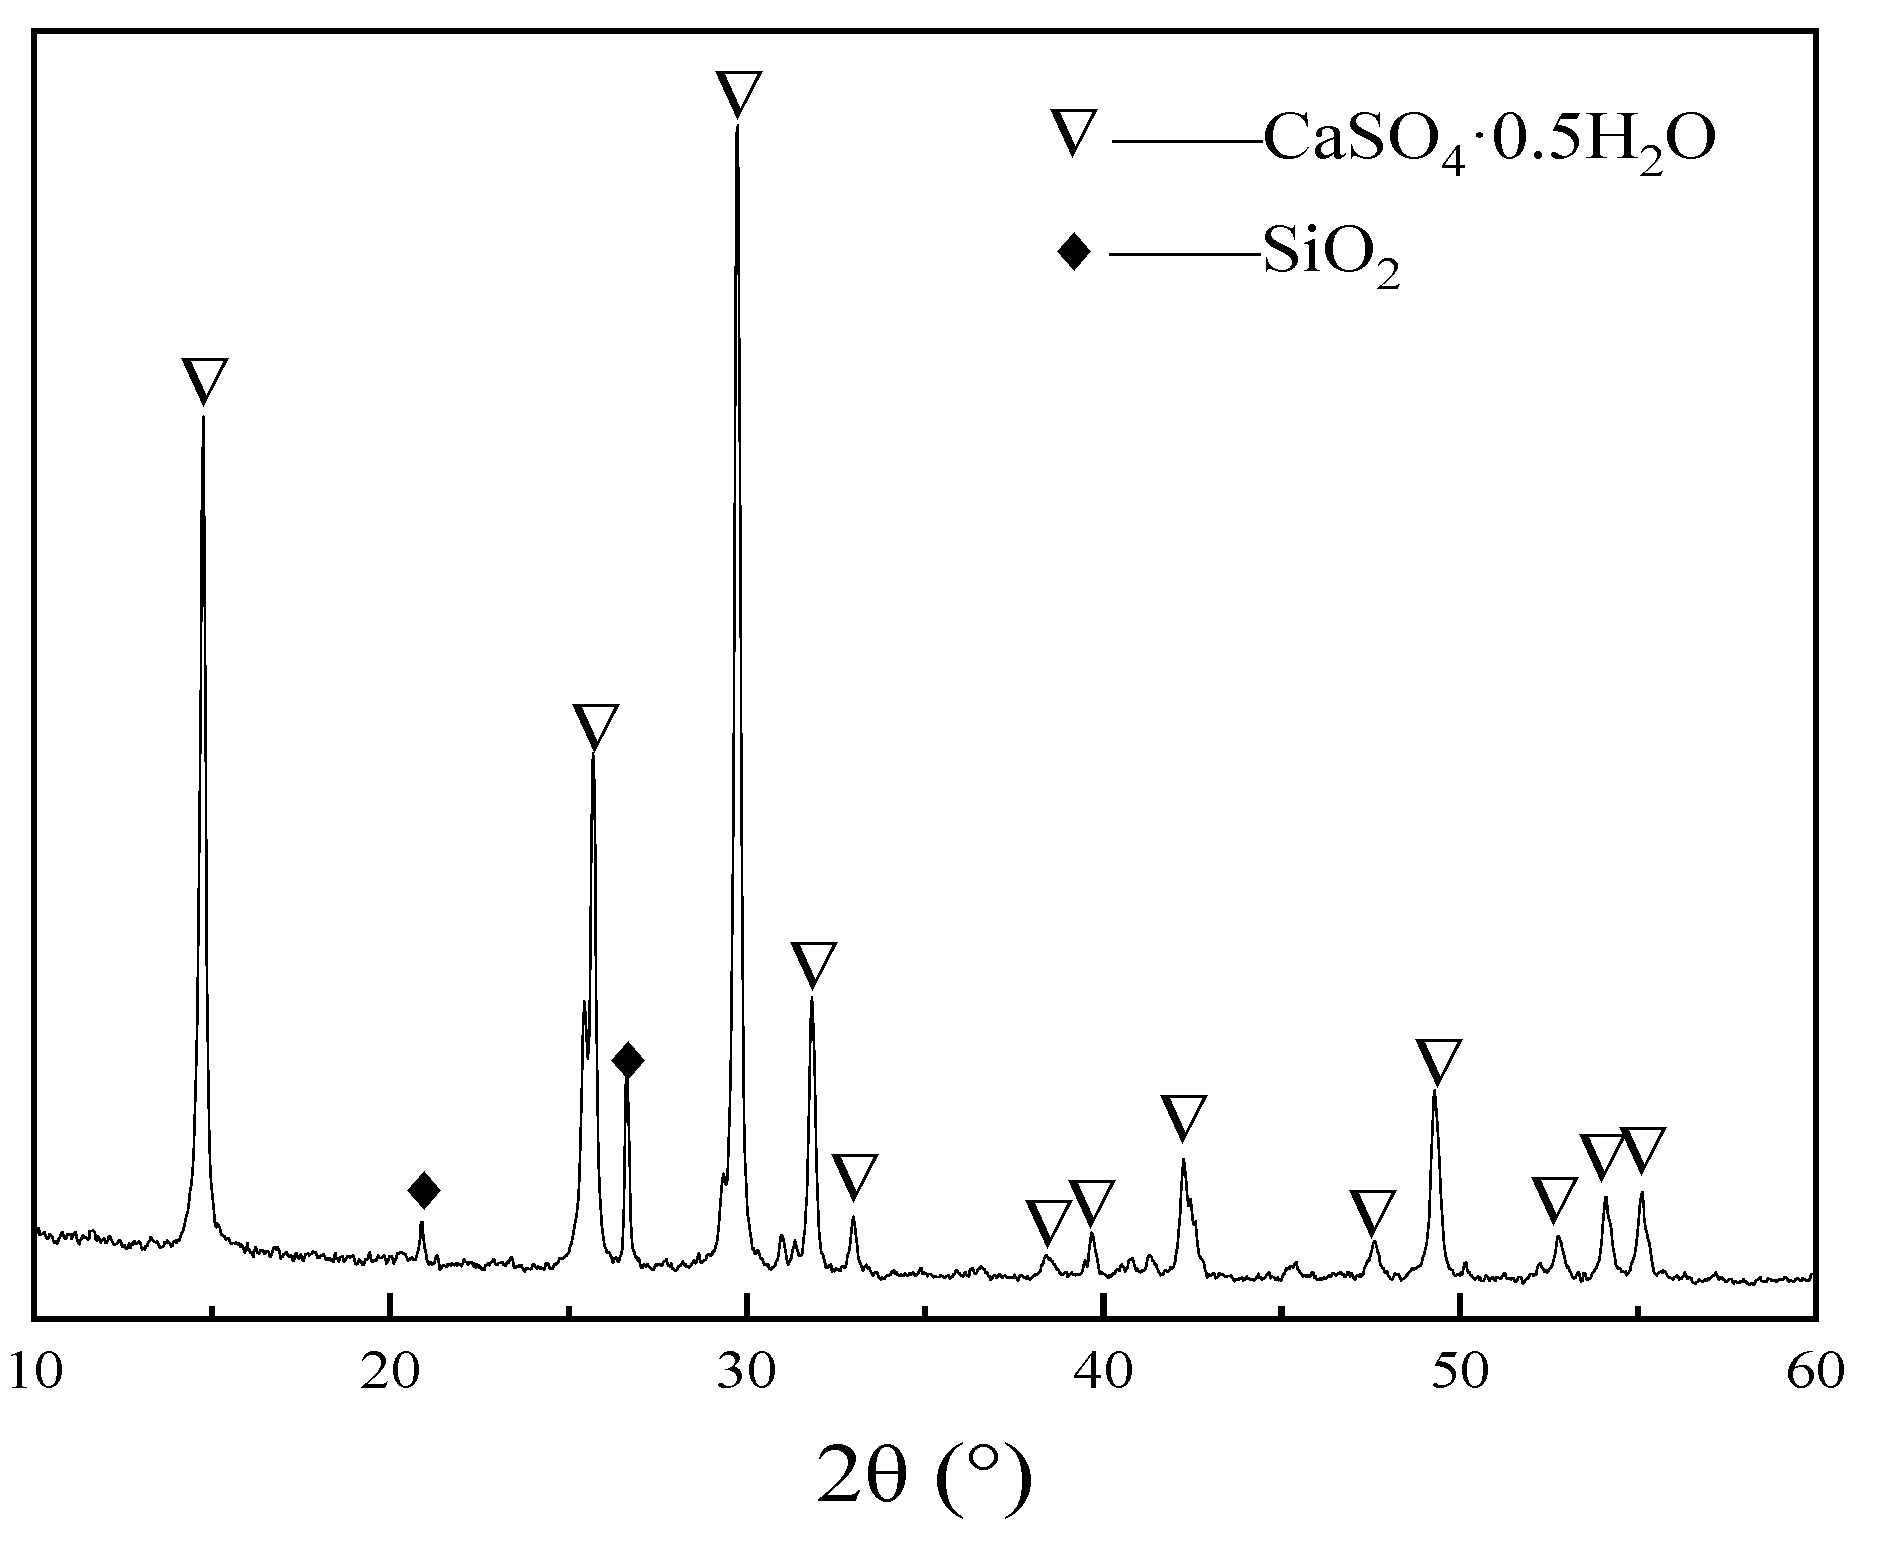
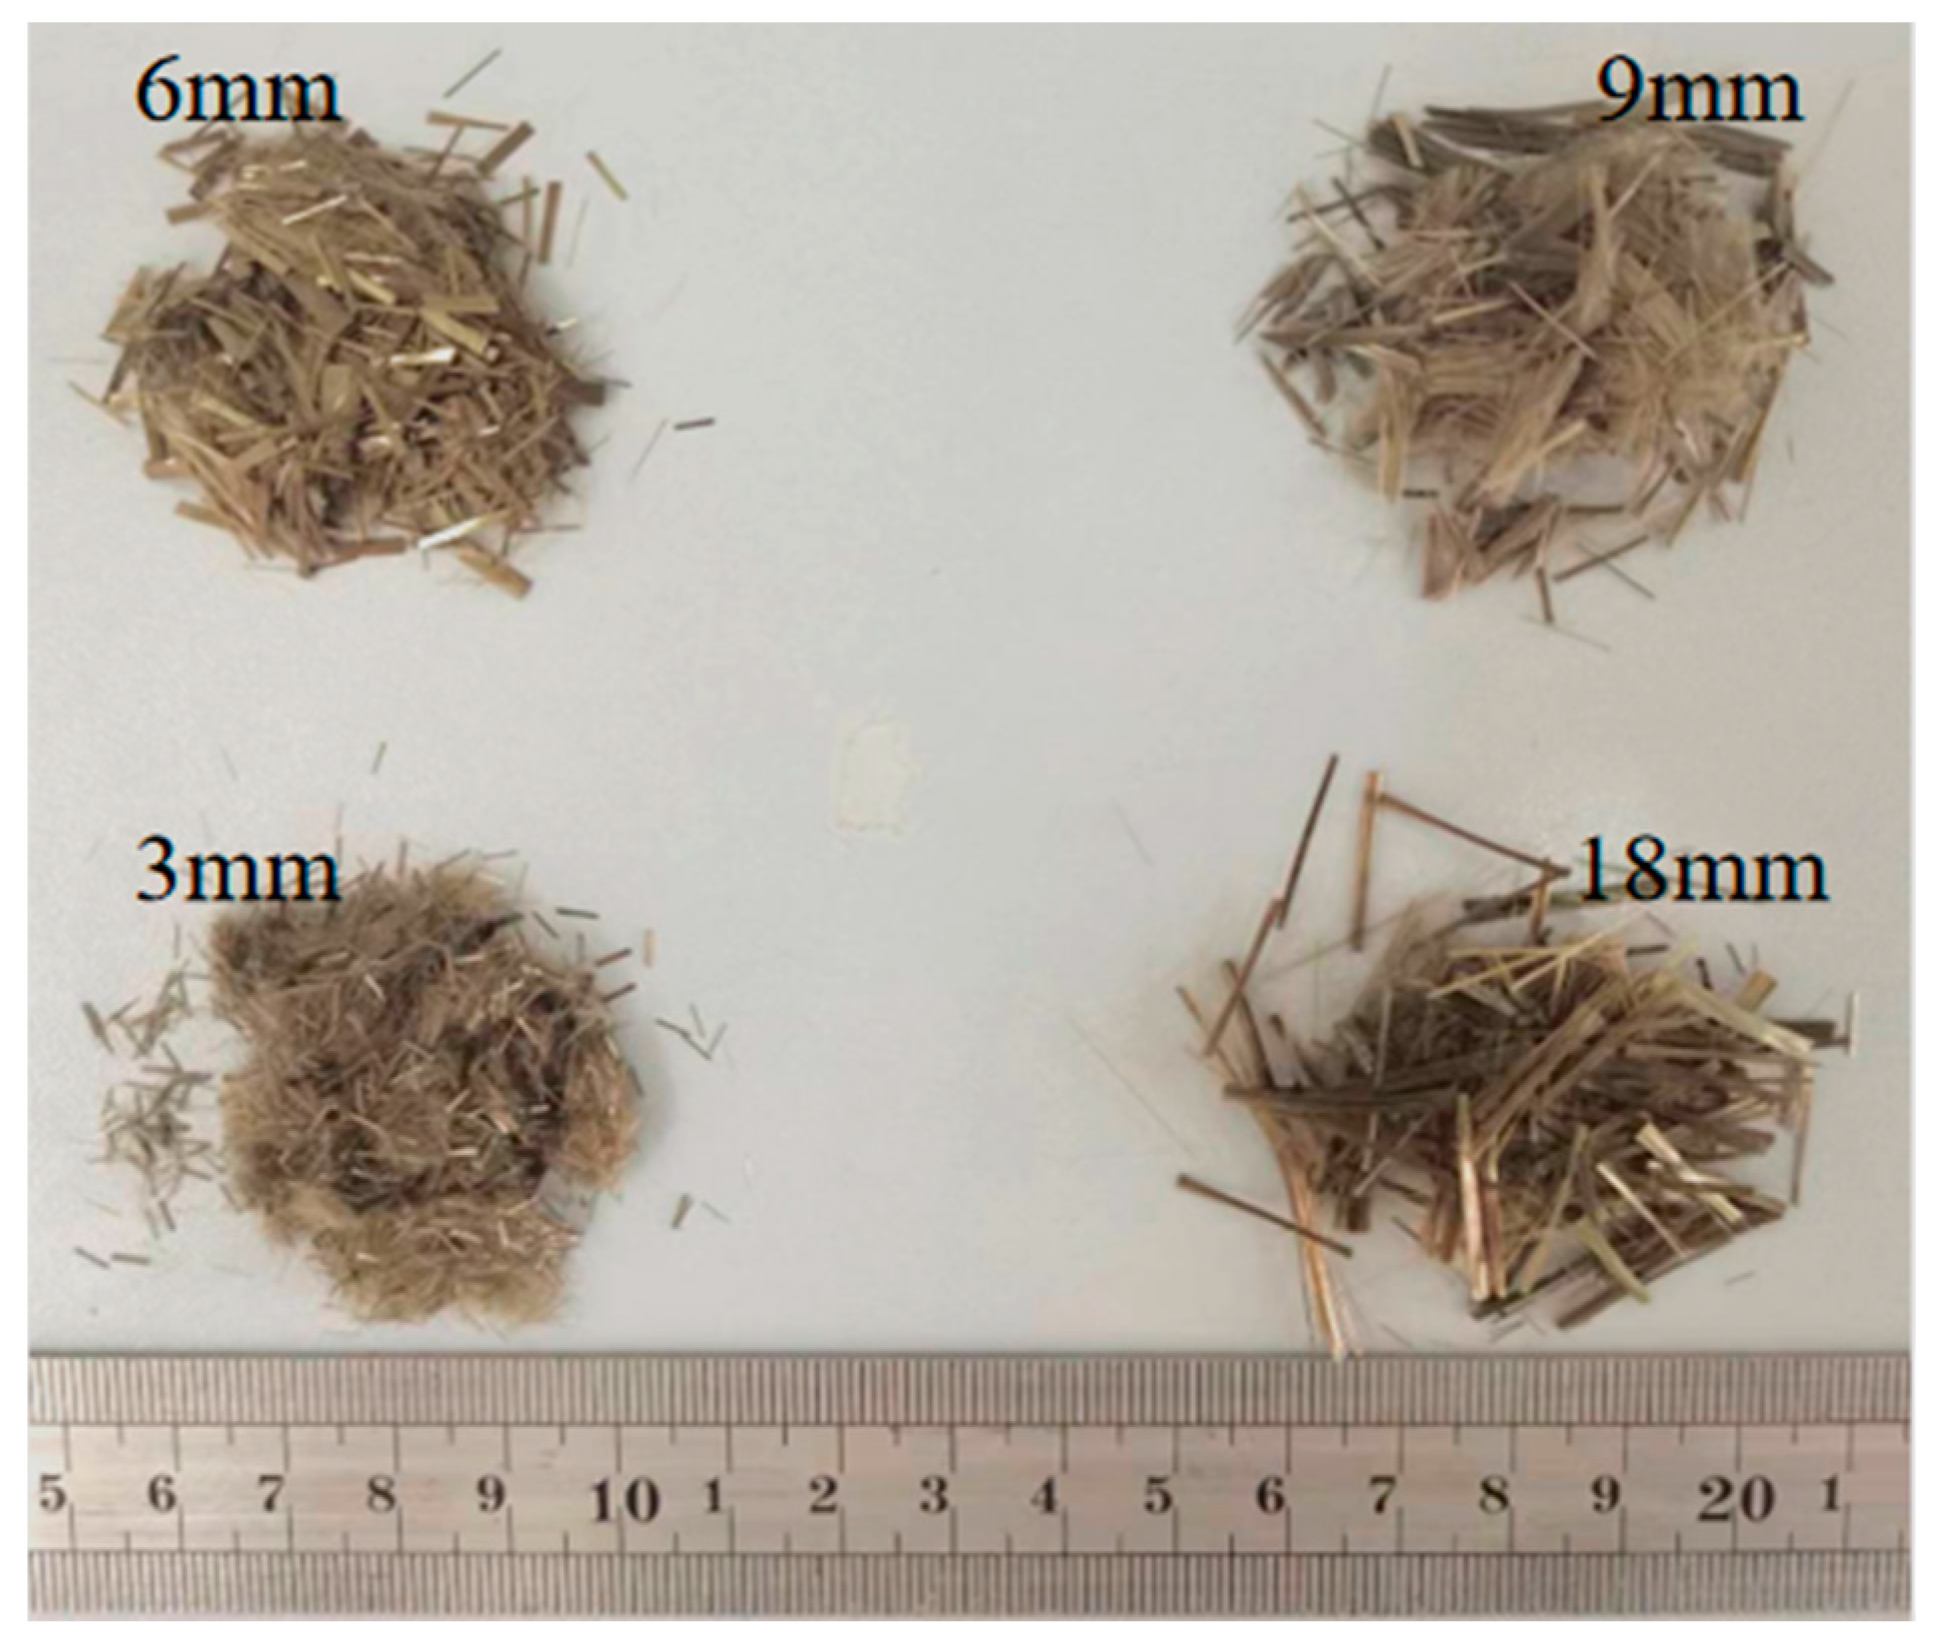
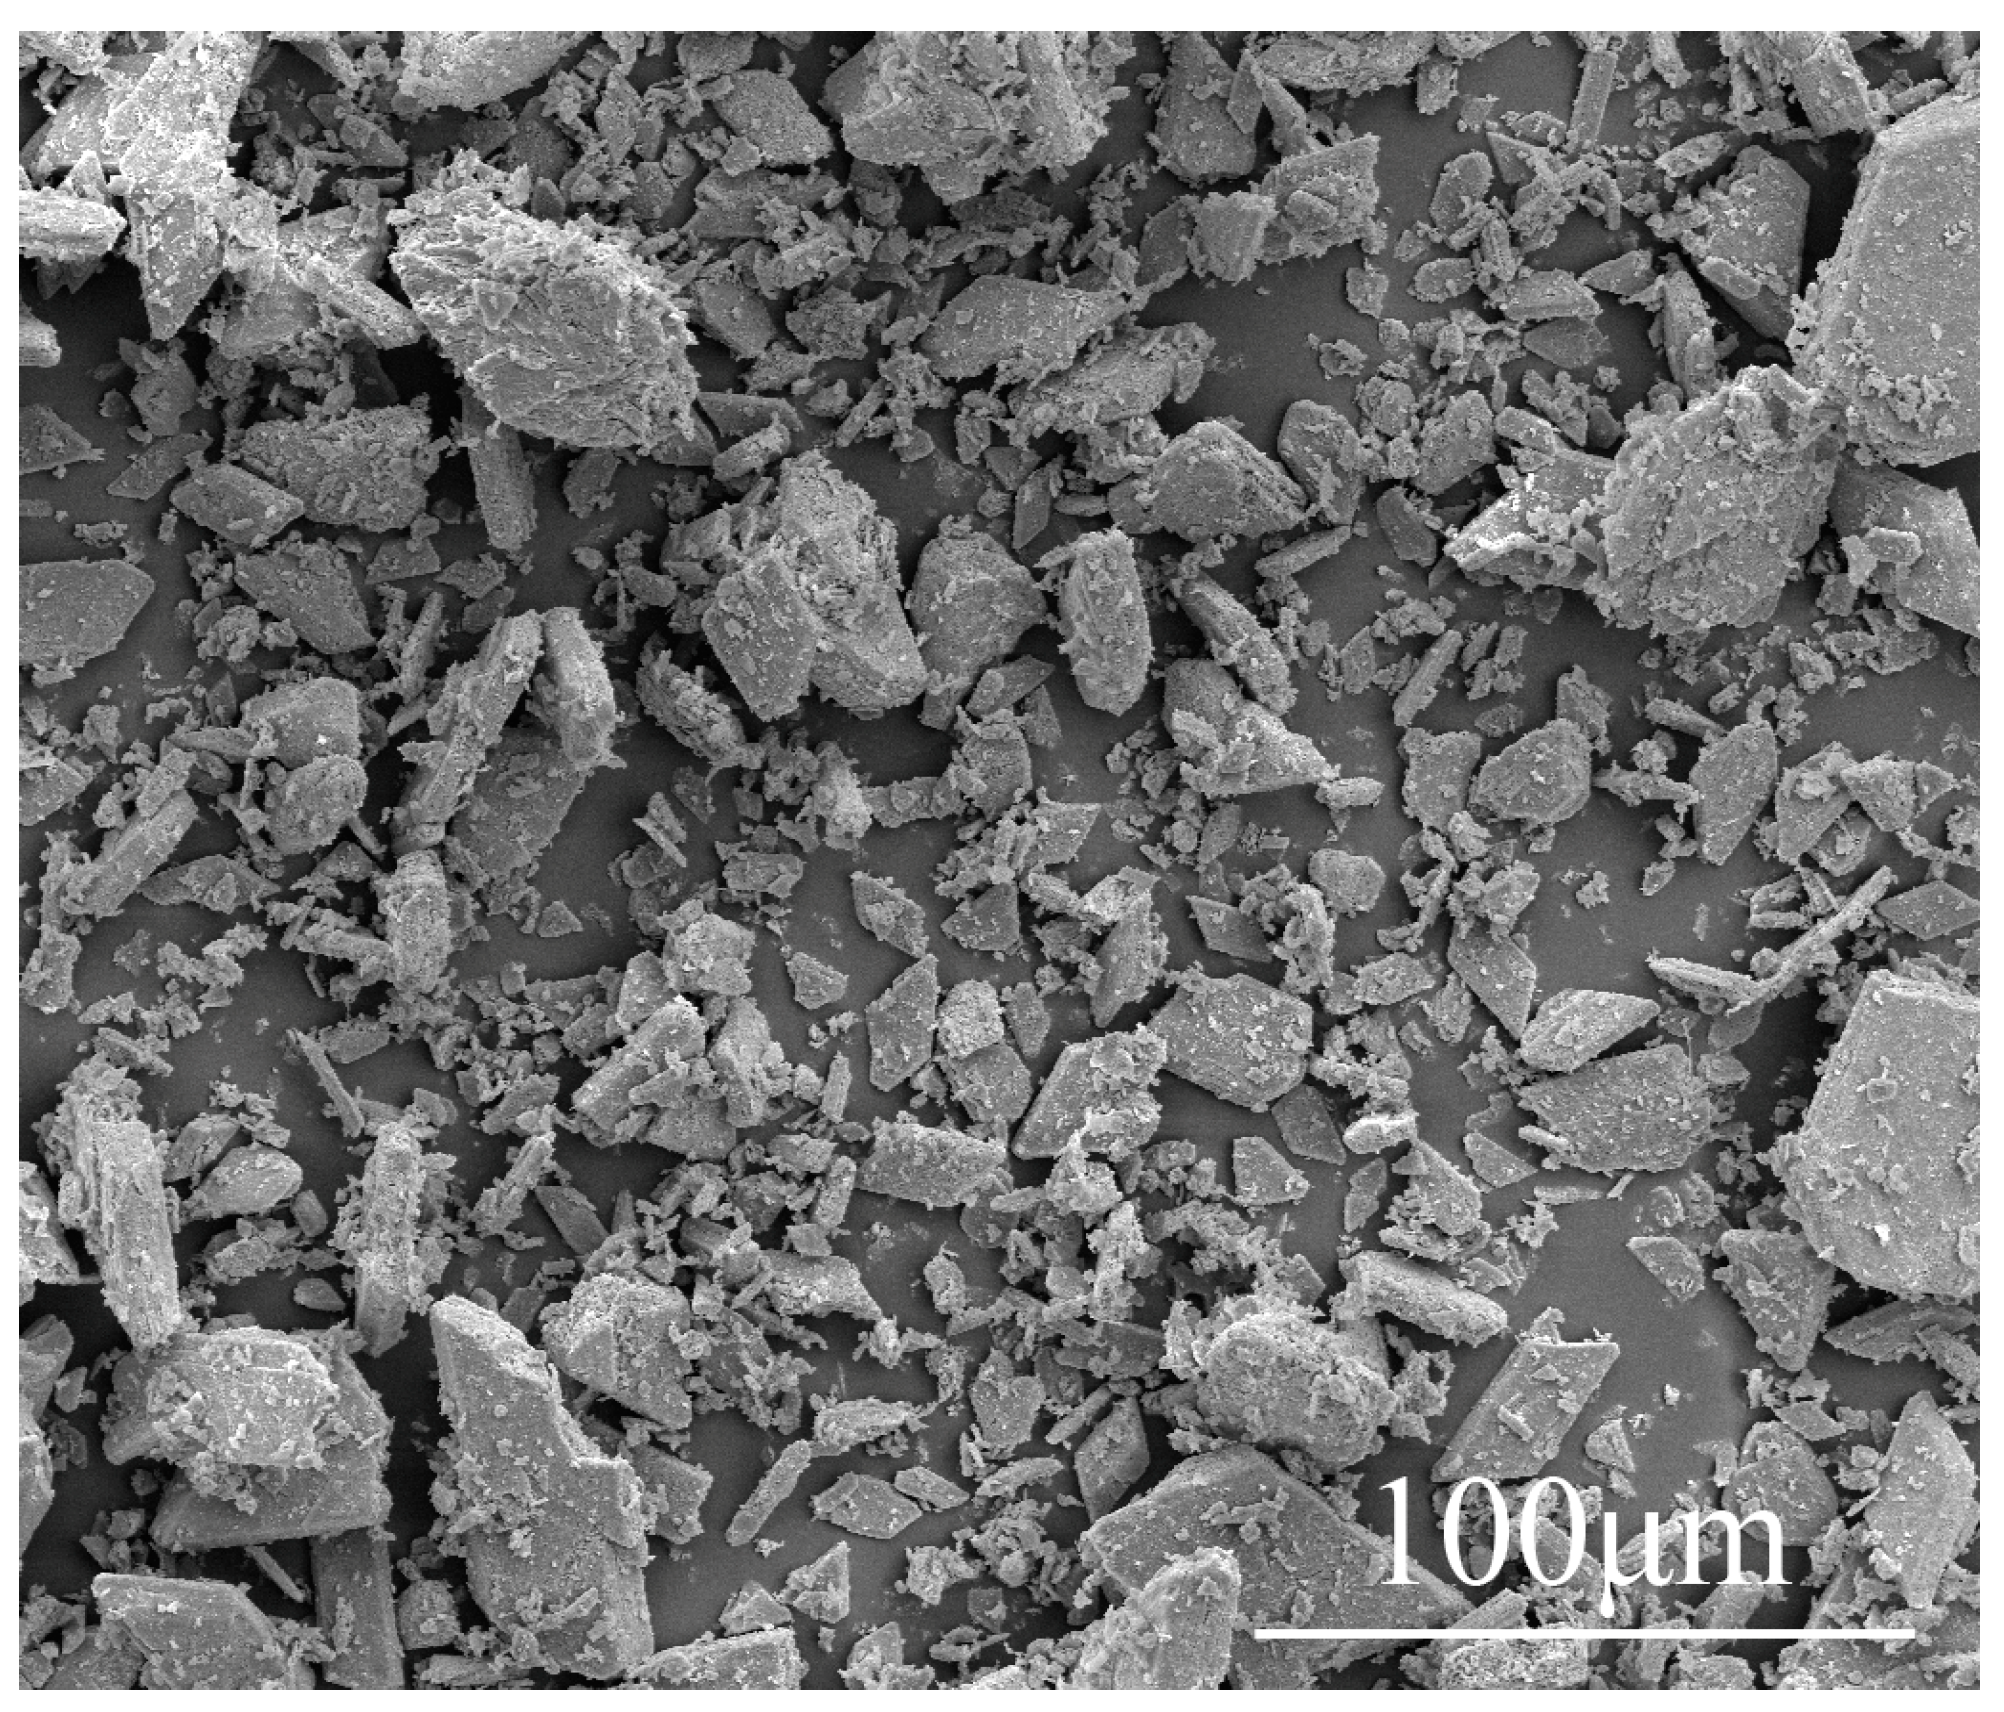
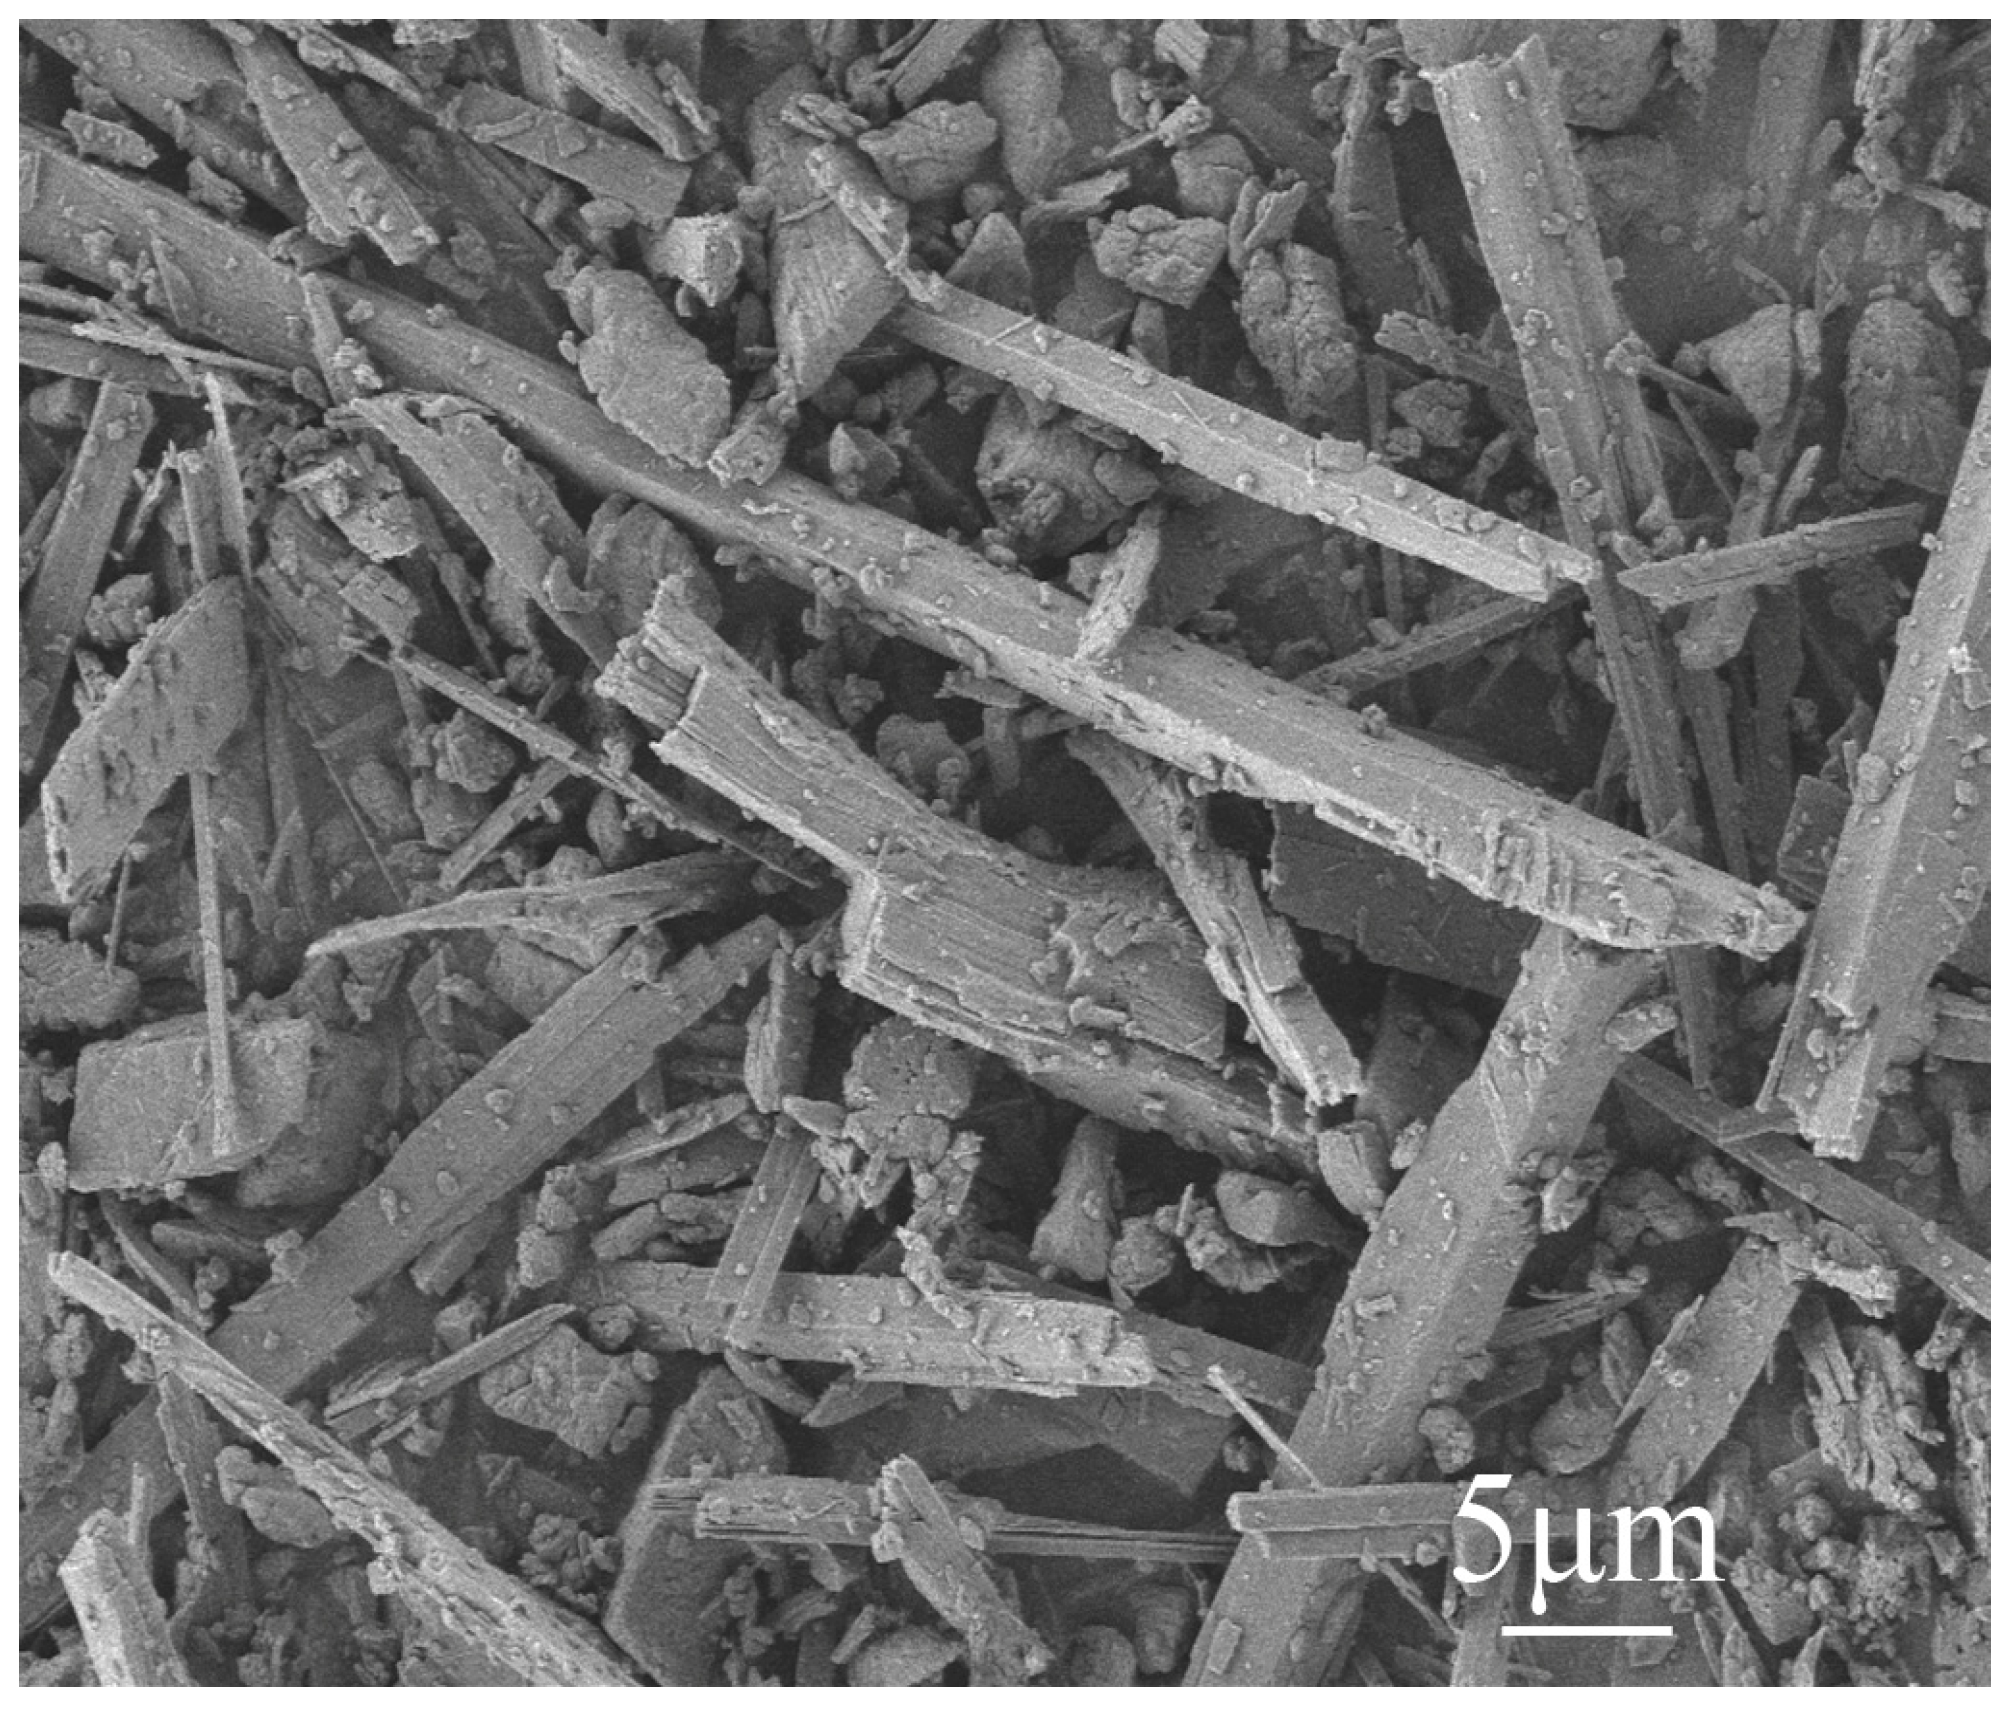
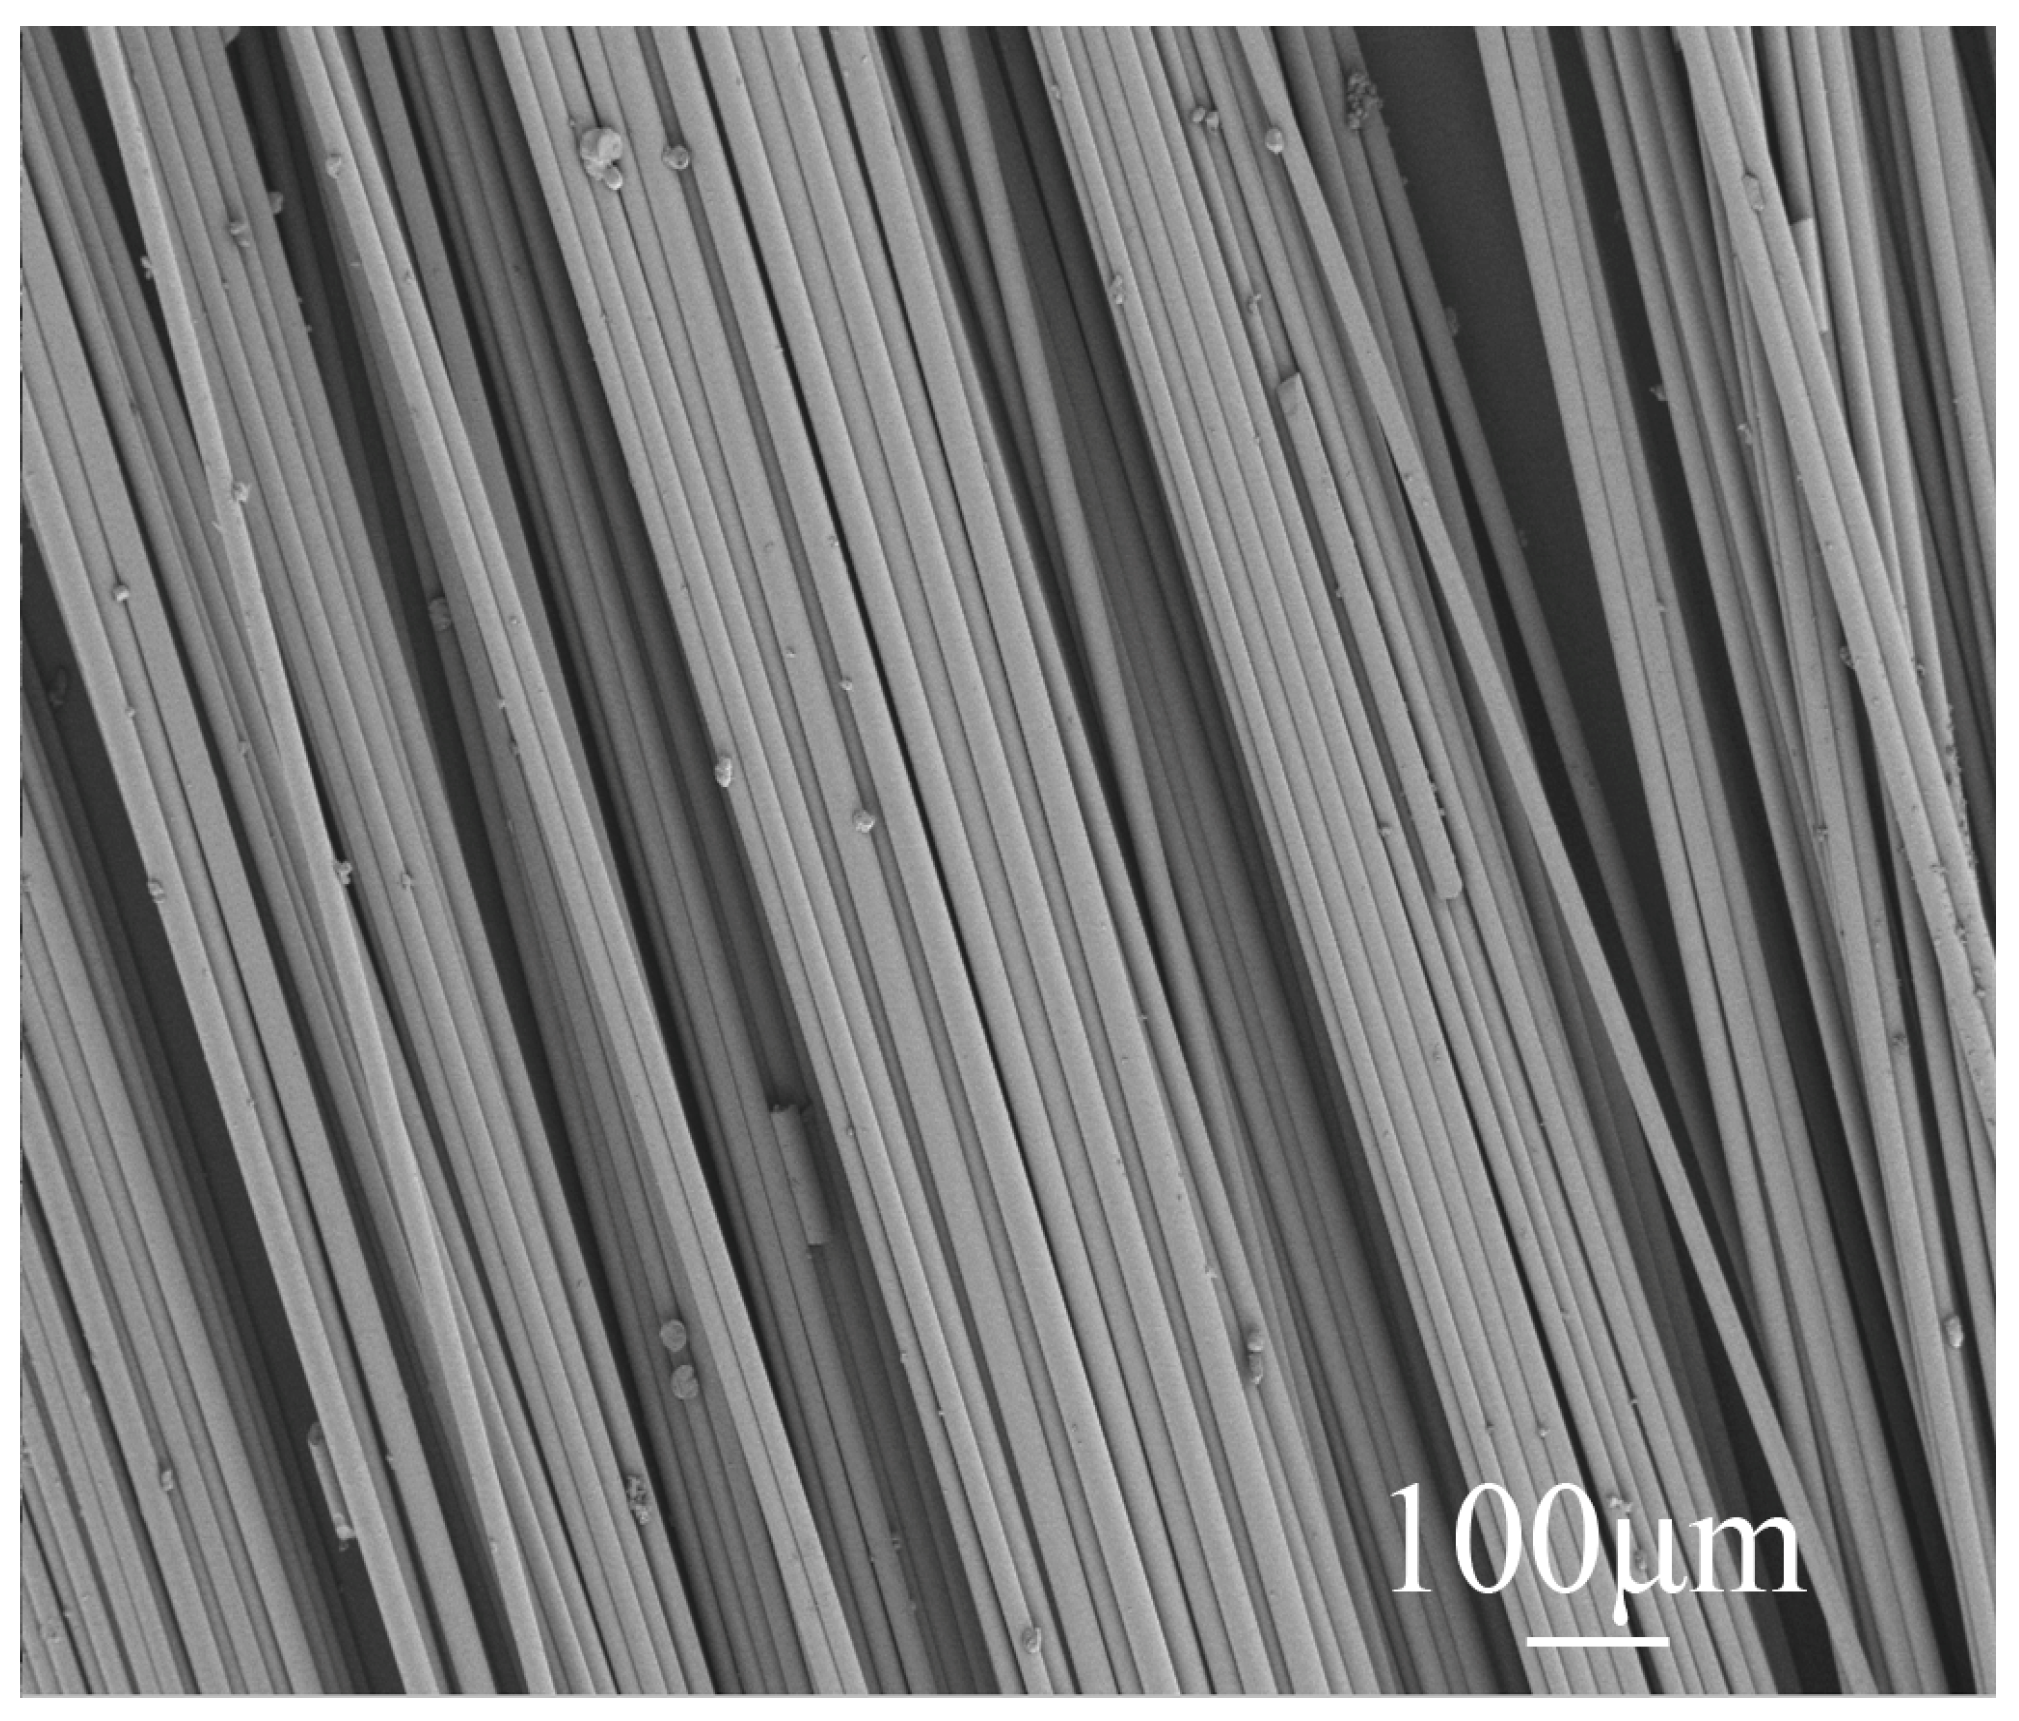
2.1. Materials
2.2. Experimental Design
2.3. Sample Preparation
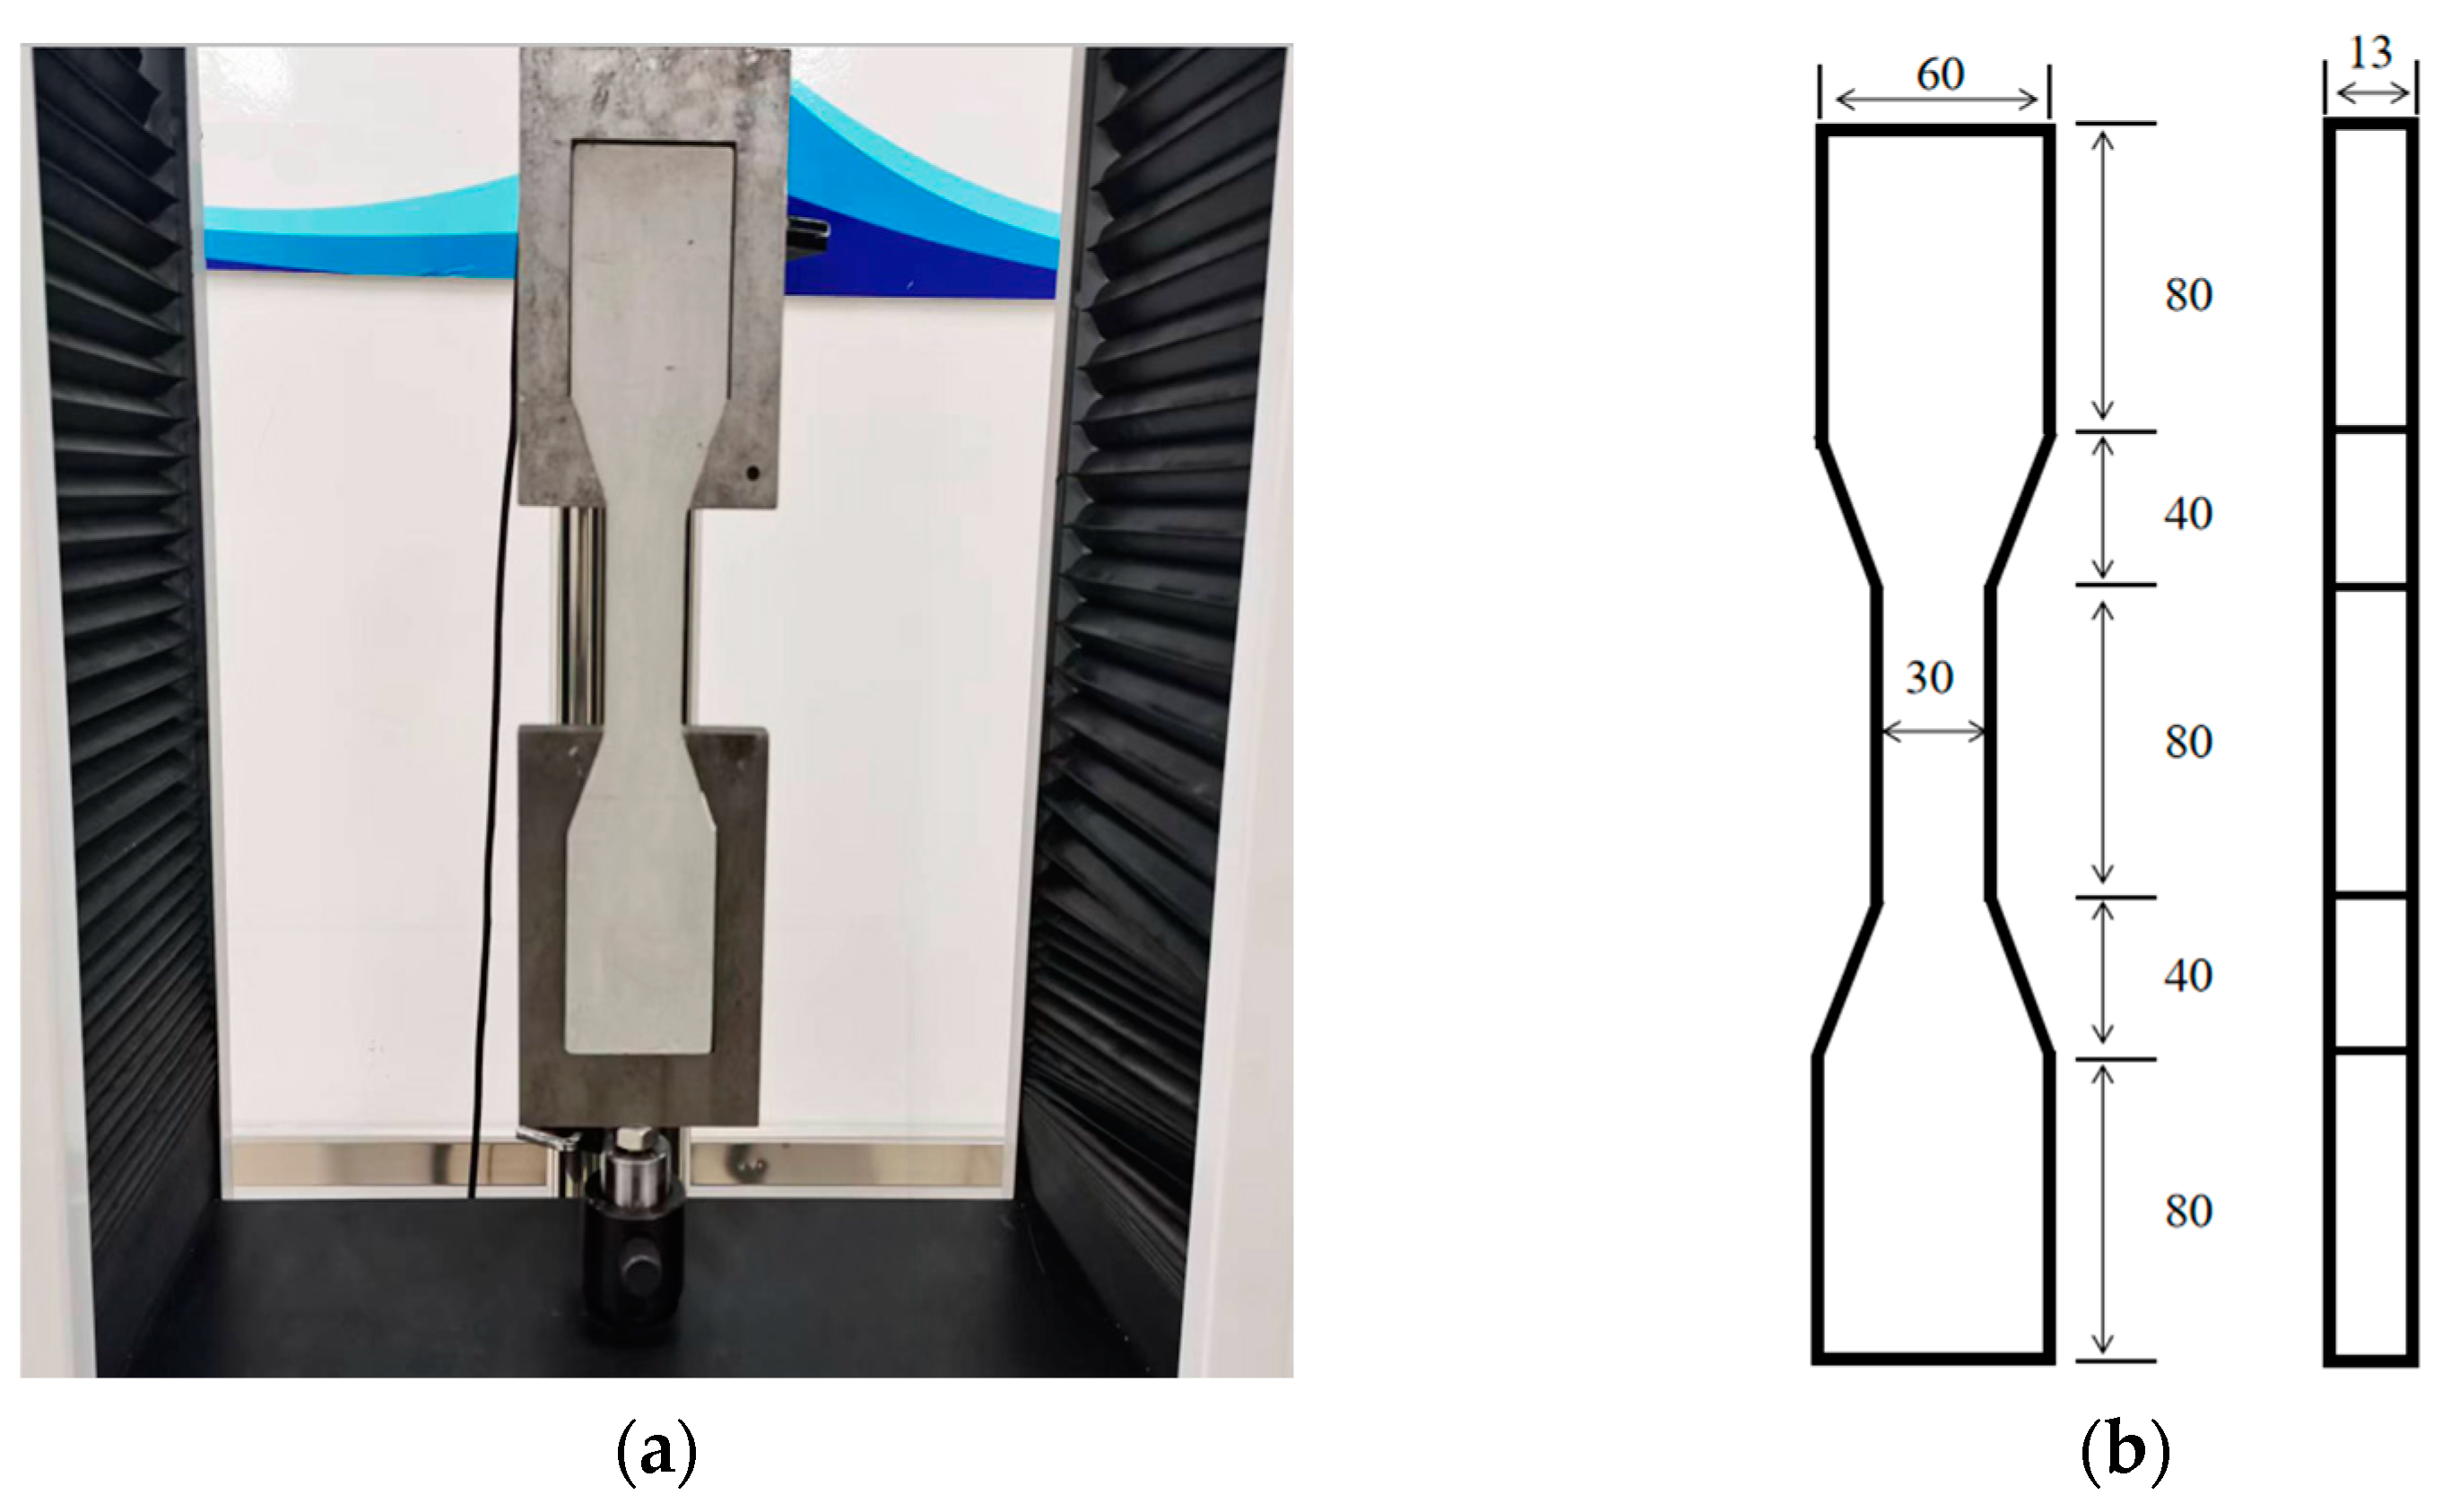
2.4. Test Methods
3. Test Results and Analysis
3.1. Individual Tests
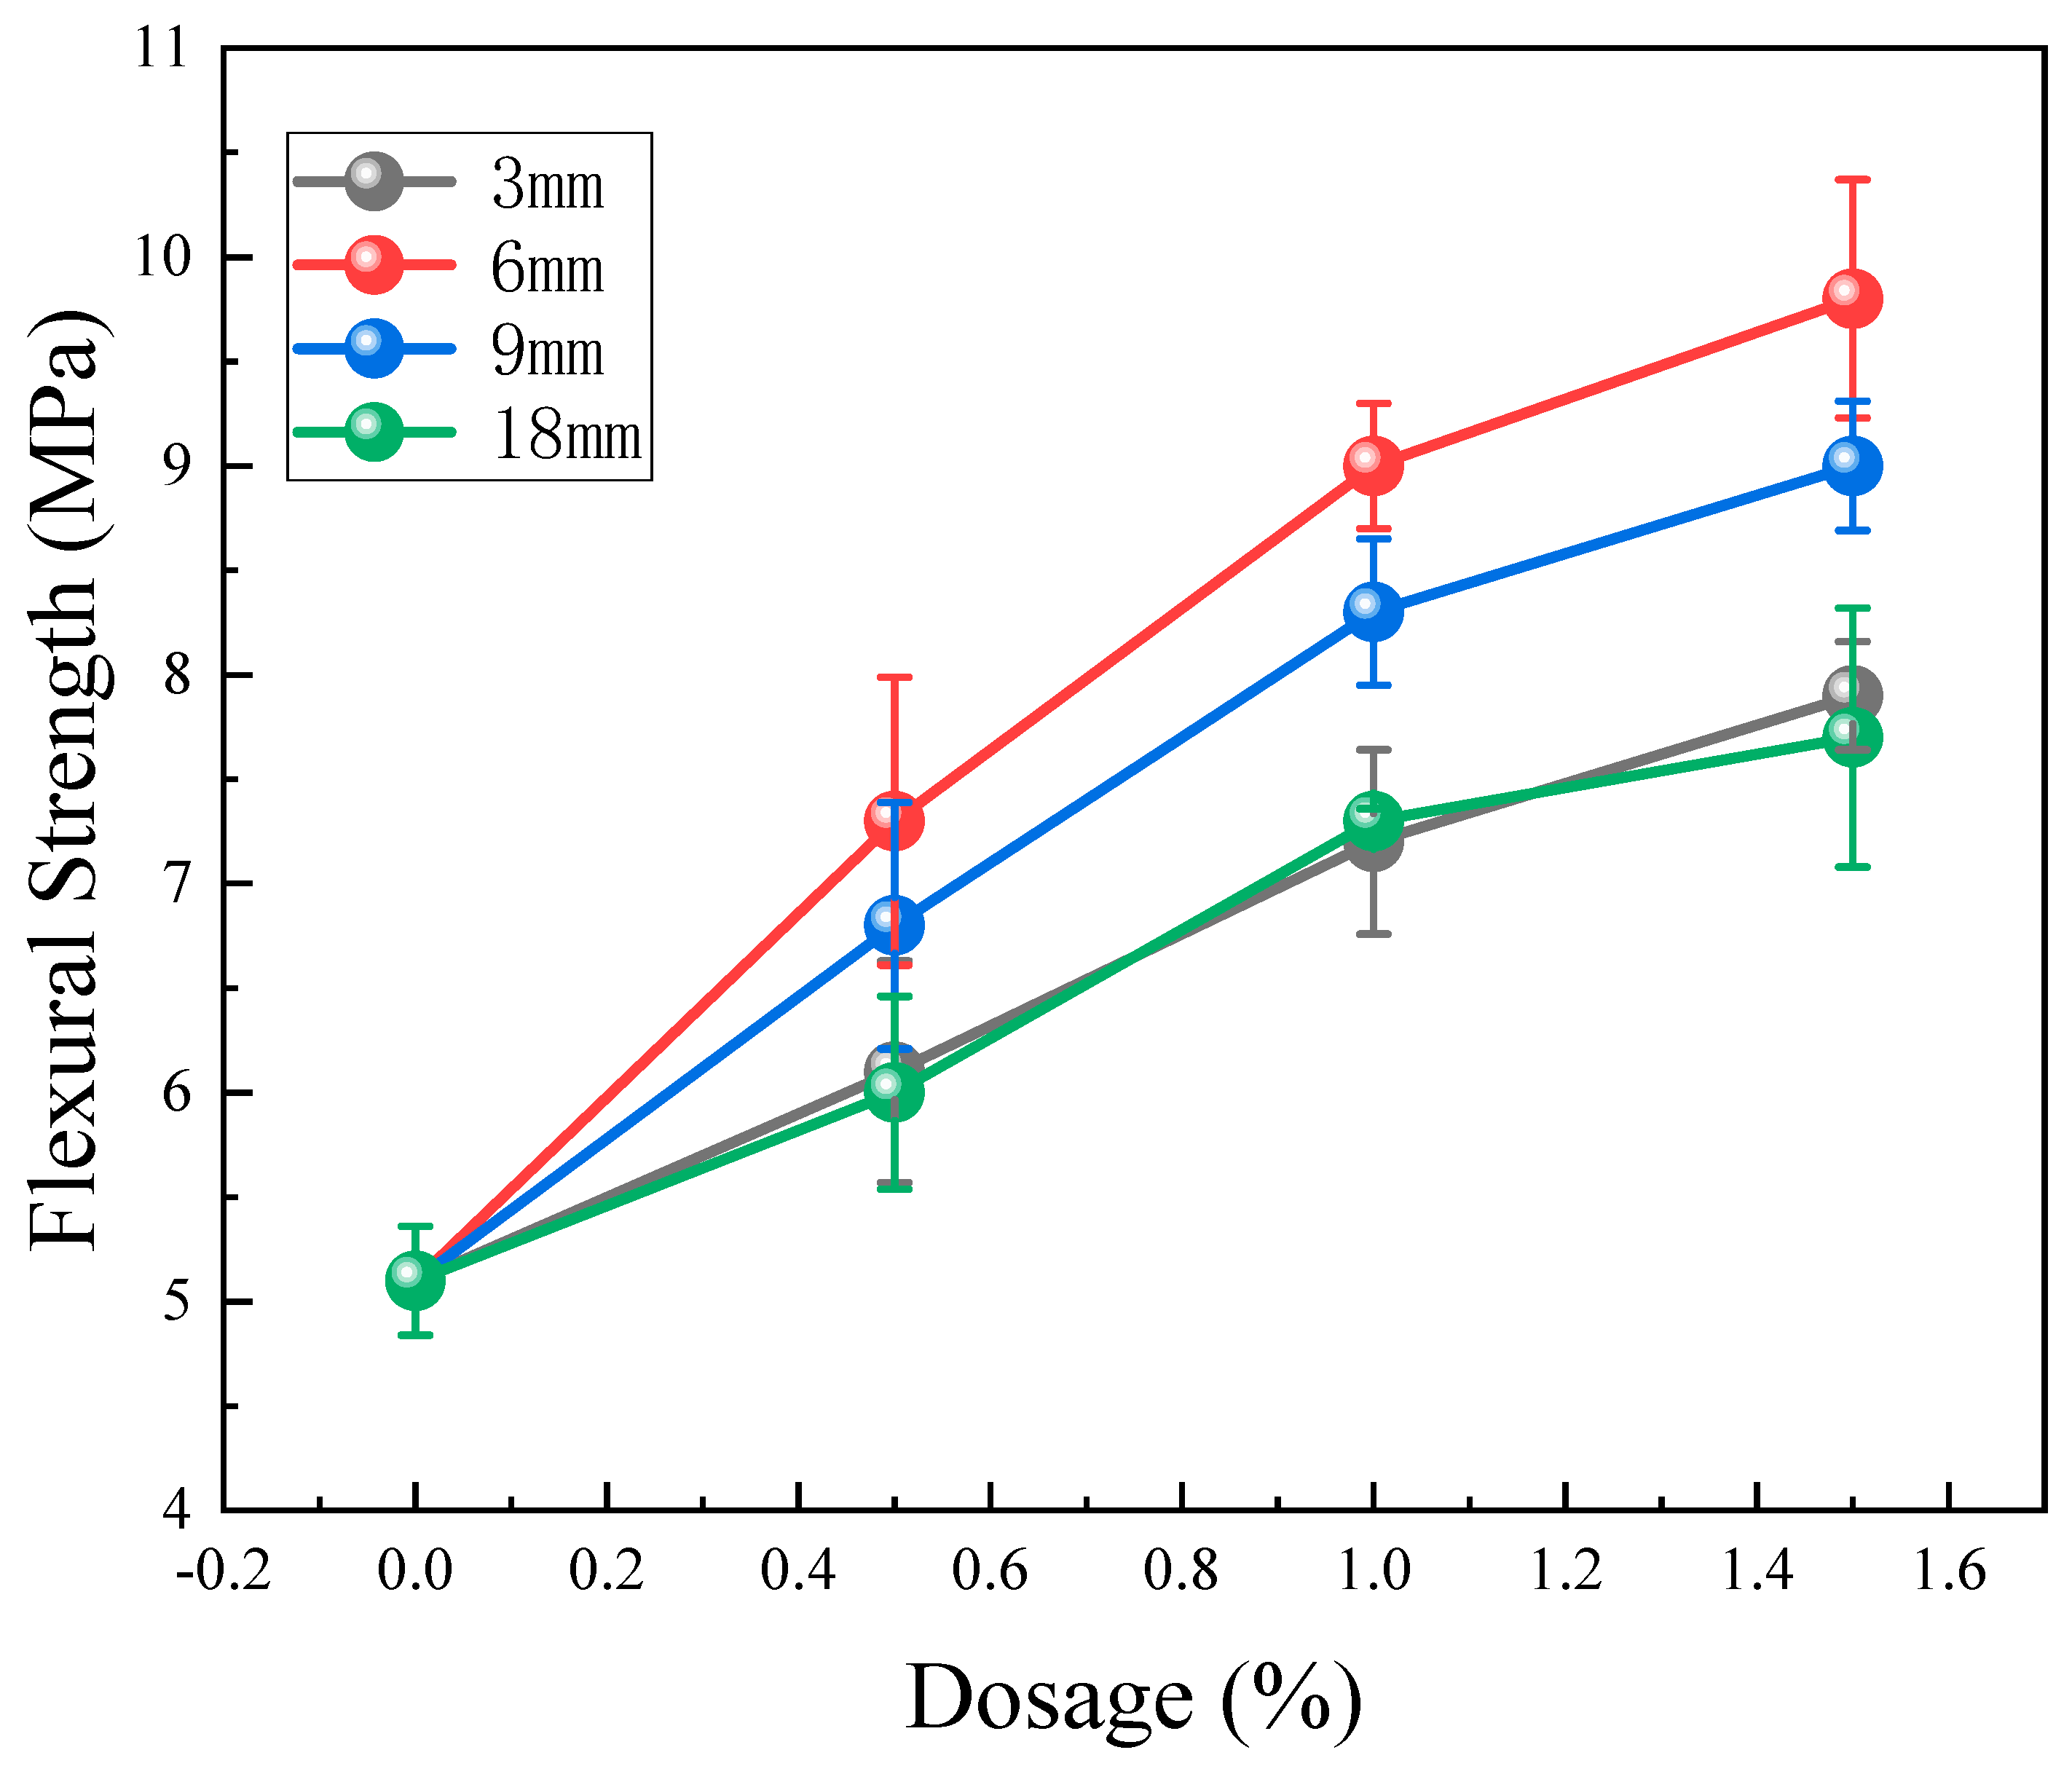
3.1.1. Flexural Strength
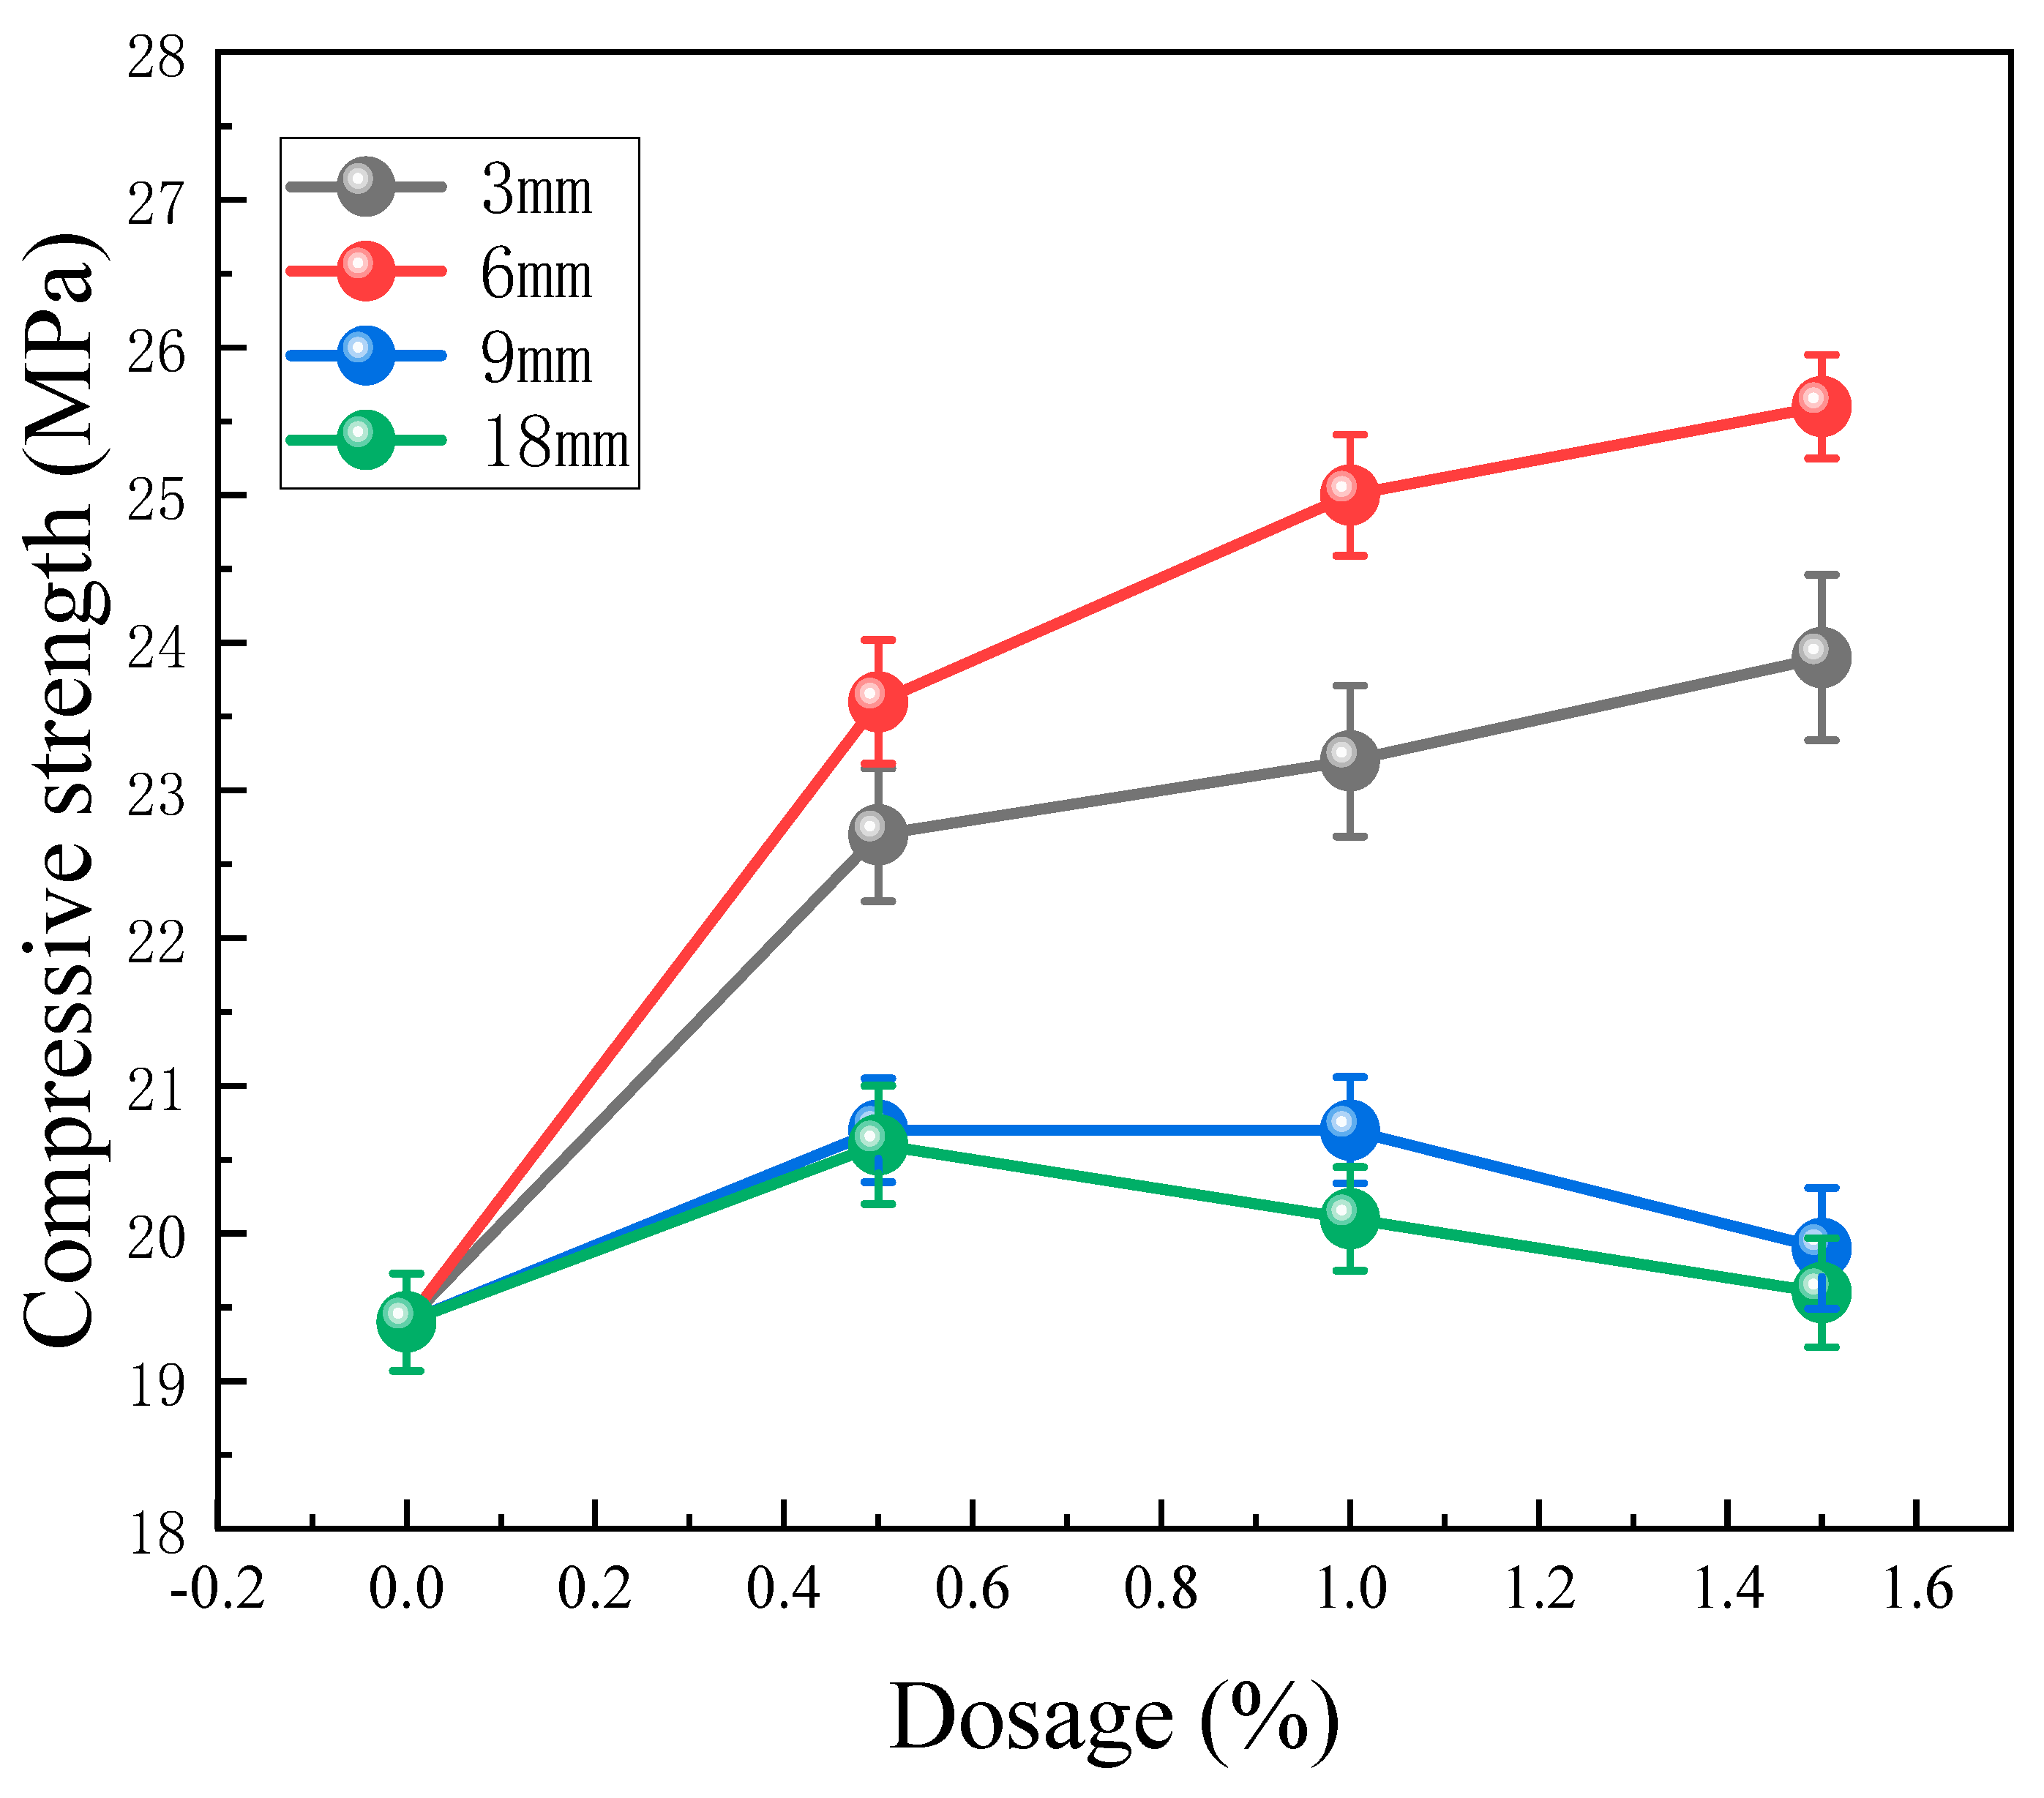
3.1.2. Compressive Strength
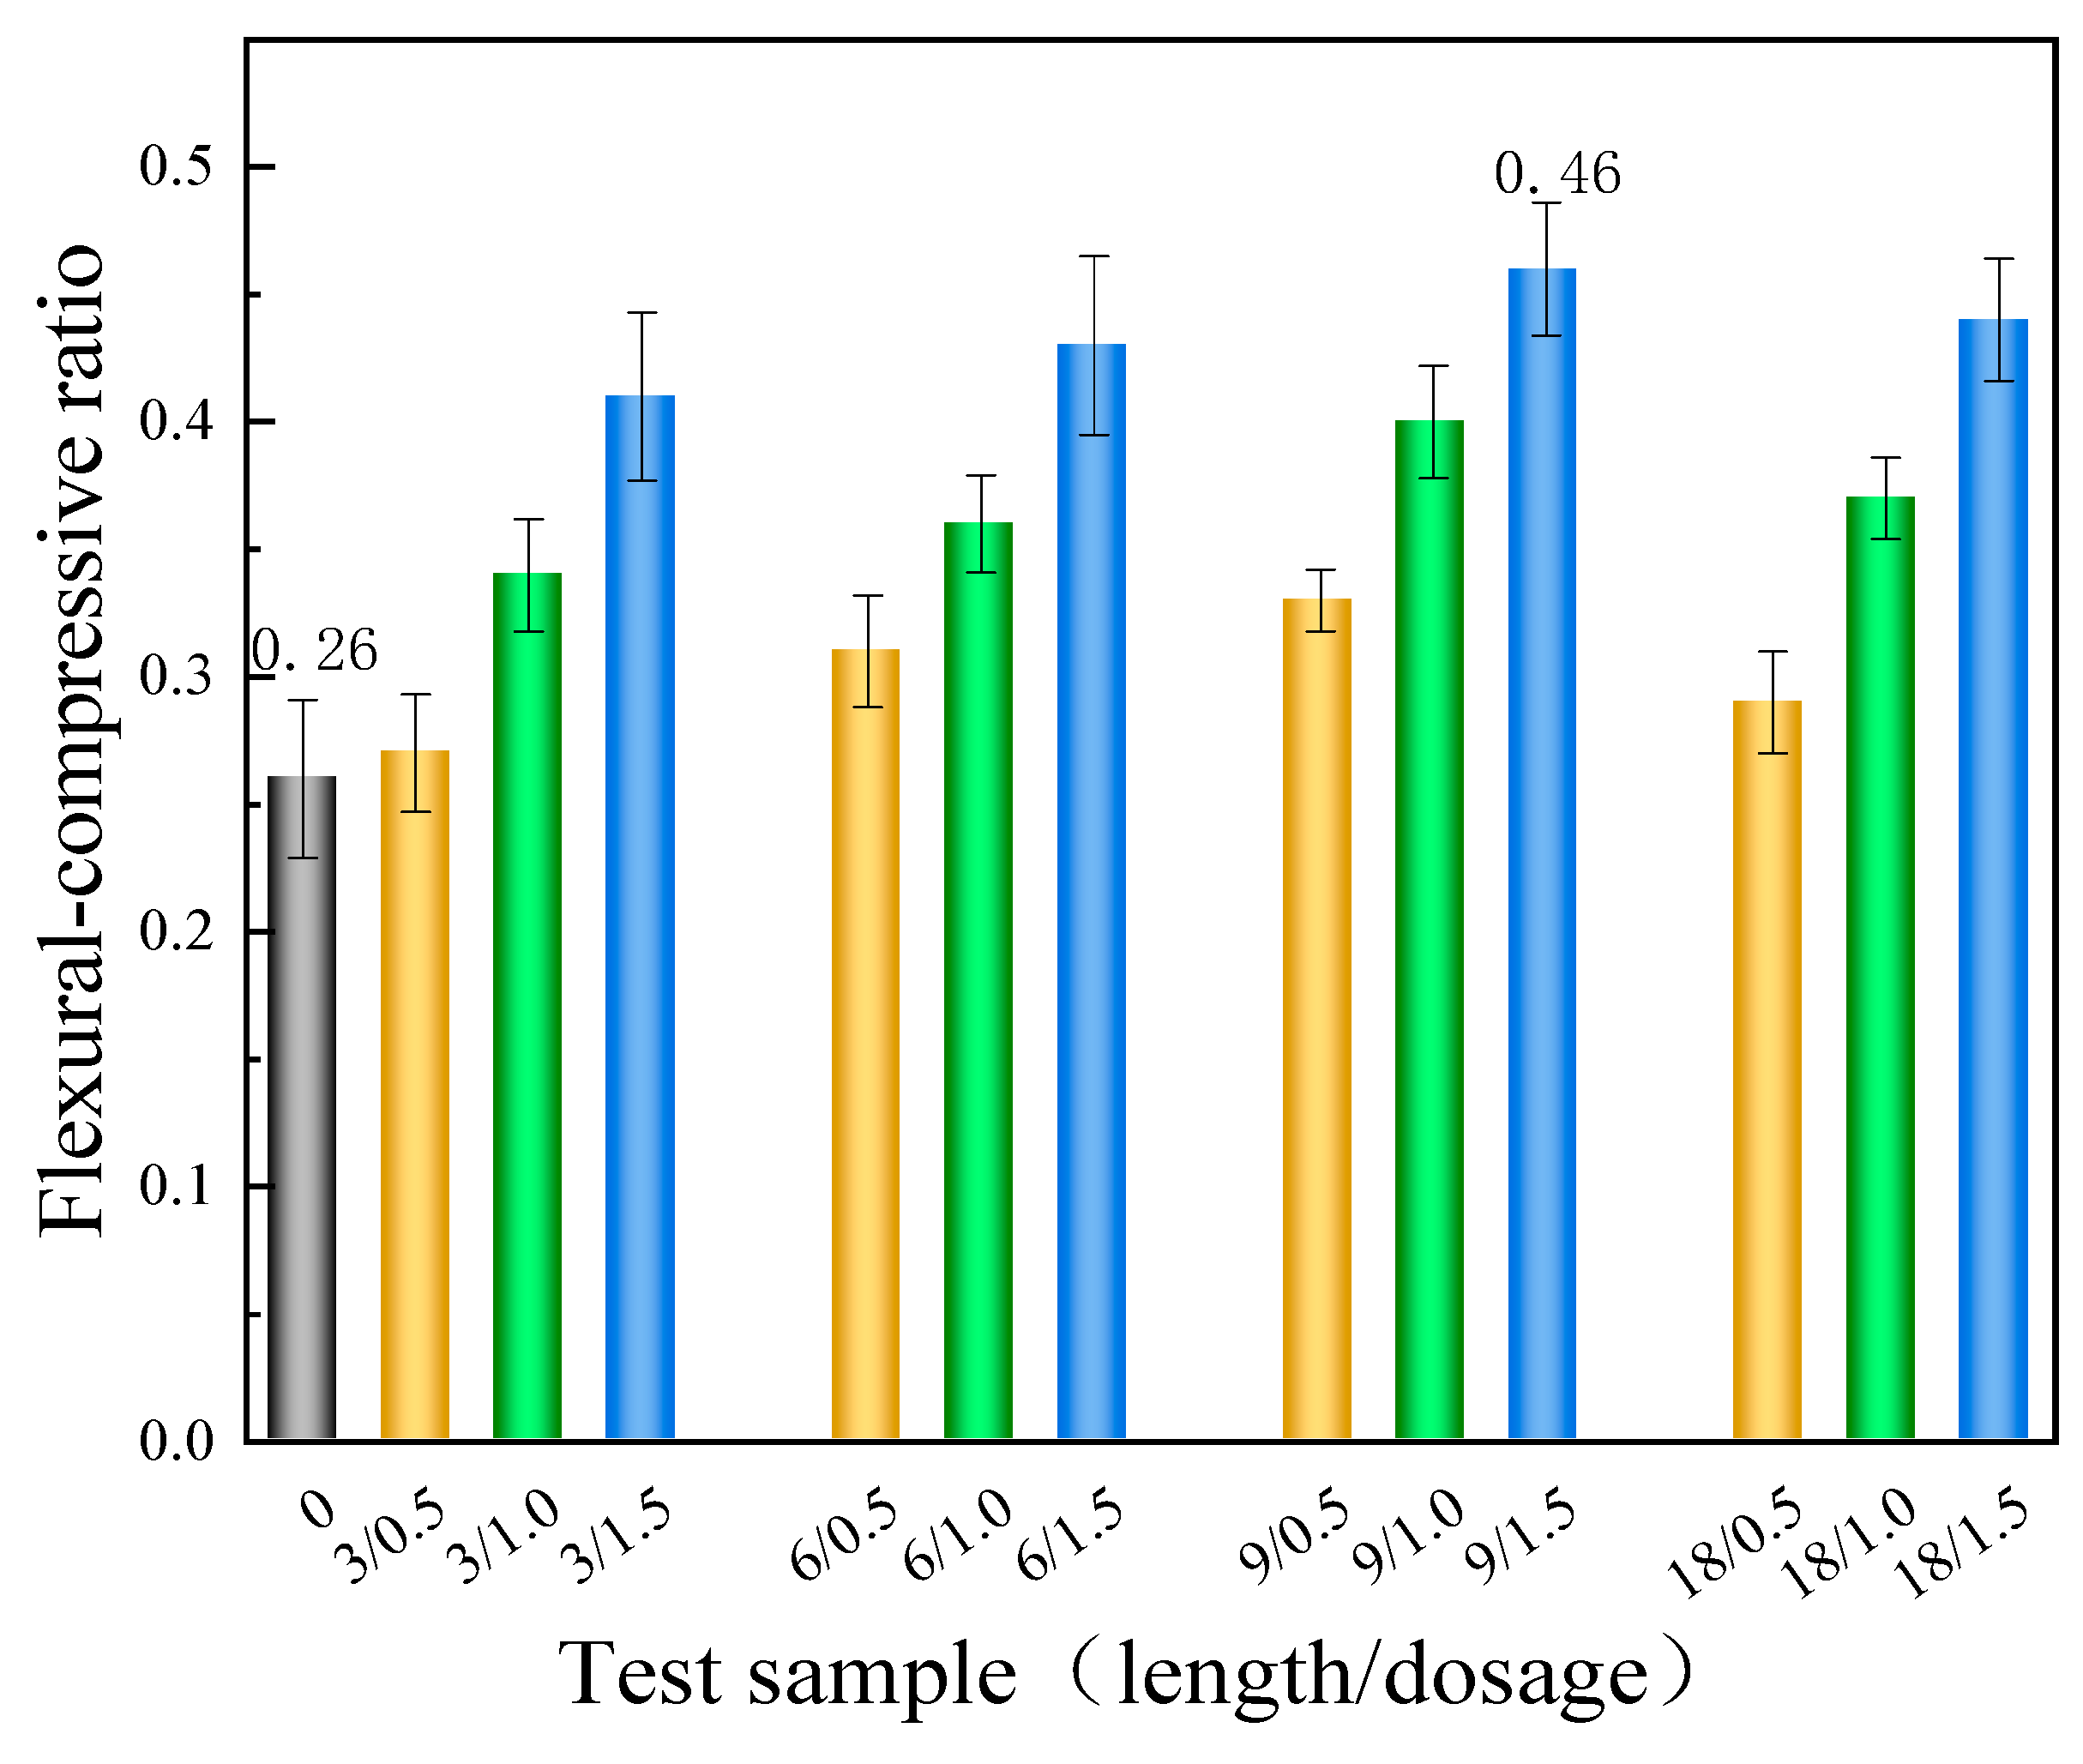
3.1.3. Toughness
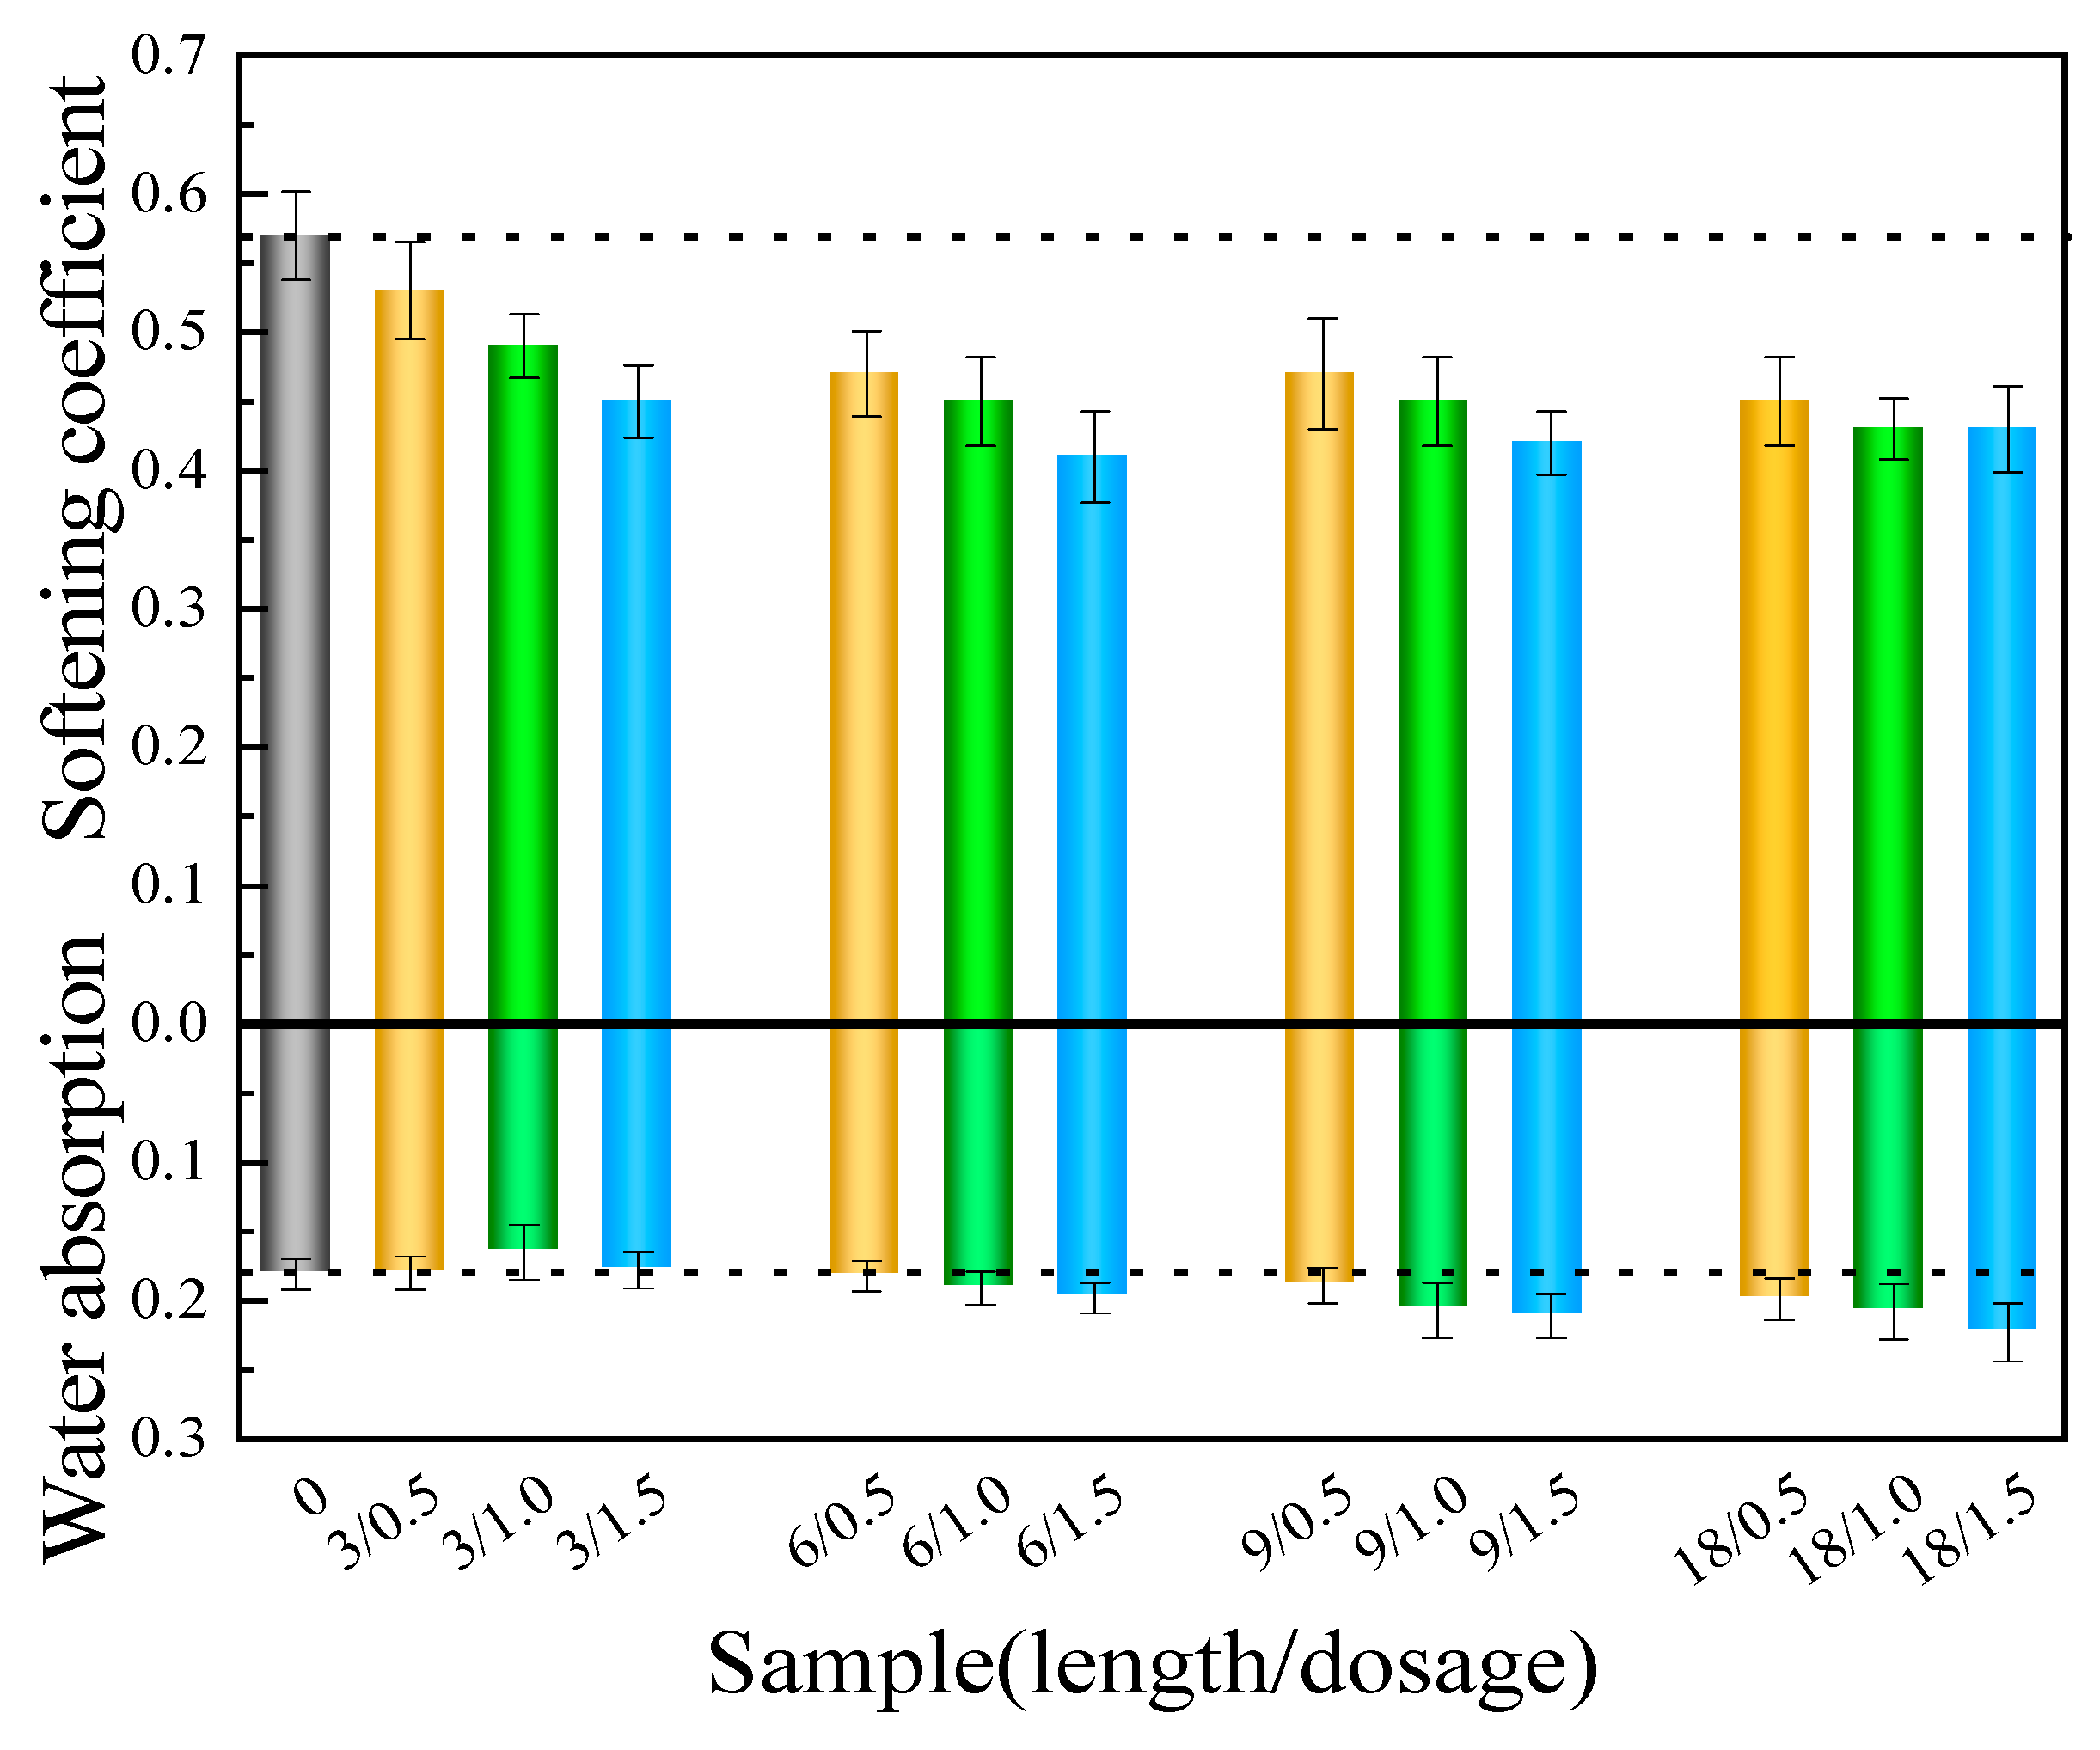
3.1.4. Water Absorption and Softening Coefficient
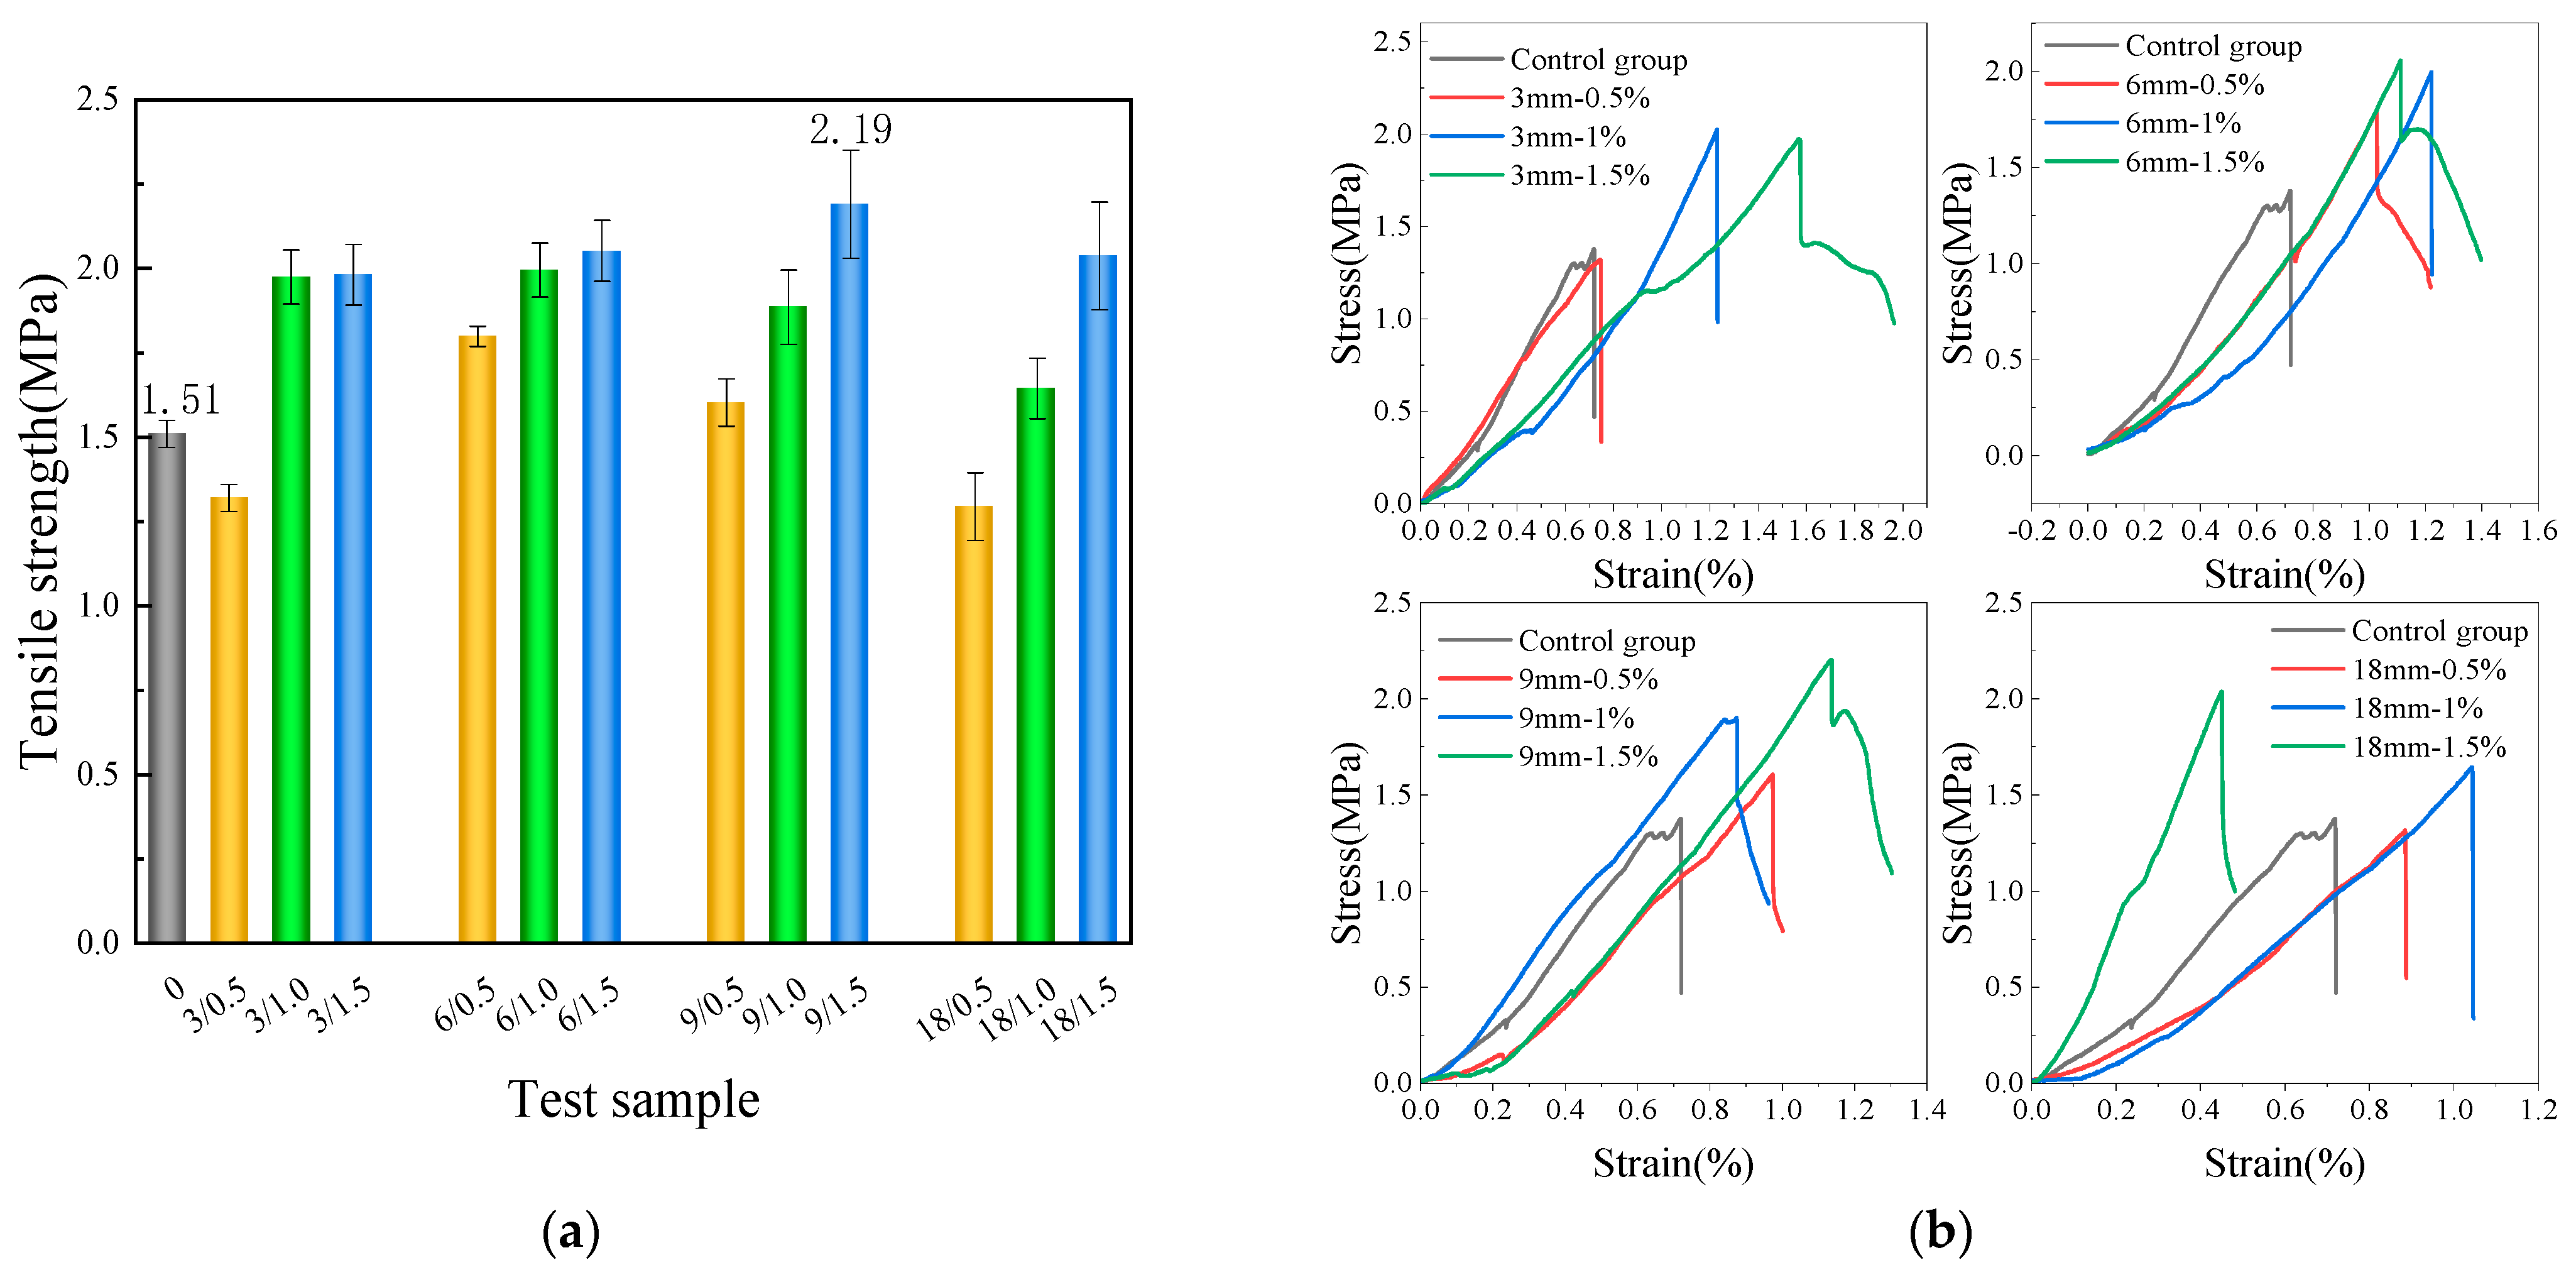
3.1.5. Tensile Strength
3.2. Mixing BF and CW Test
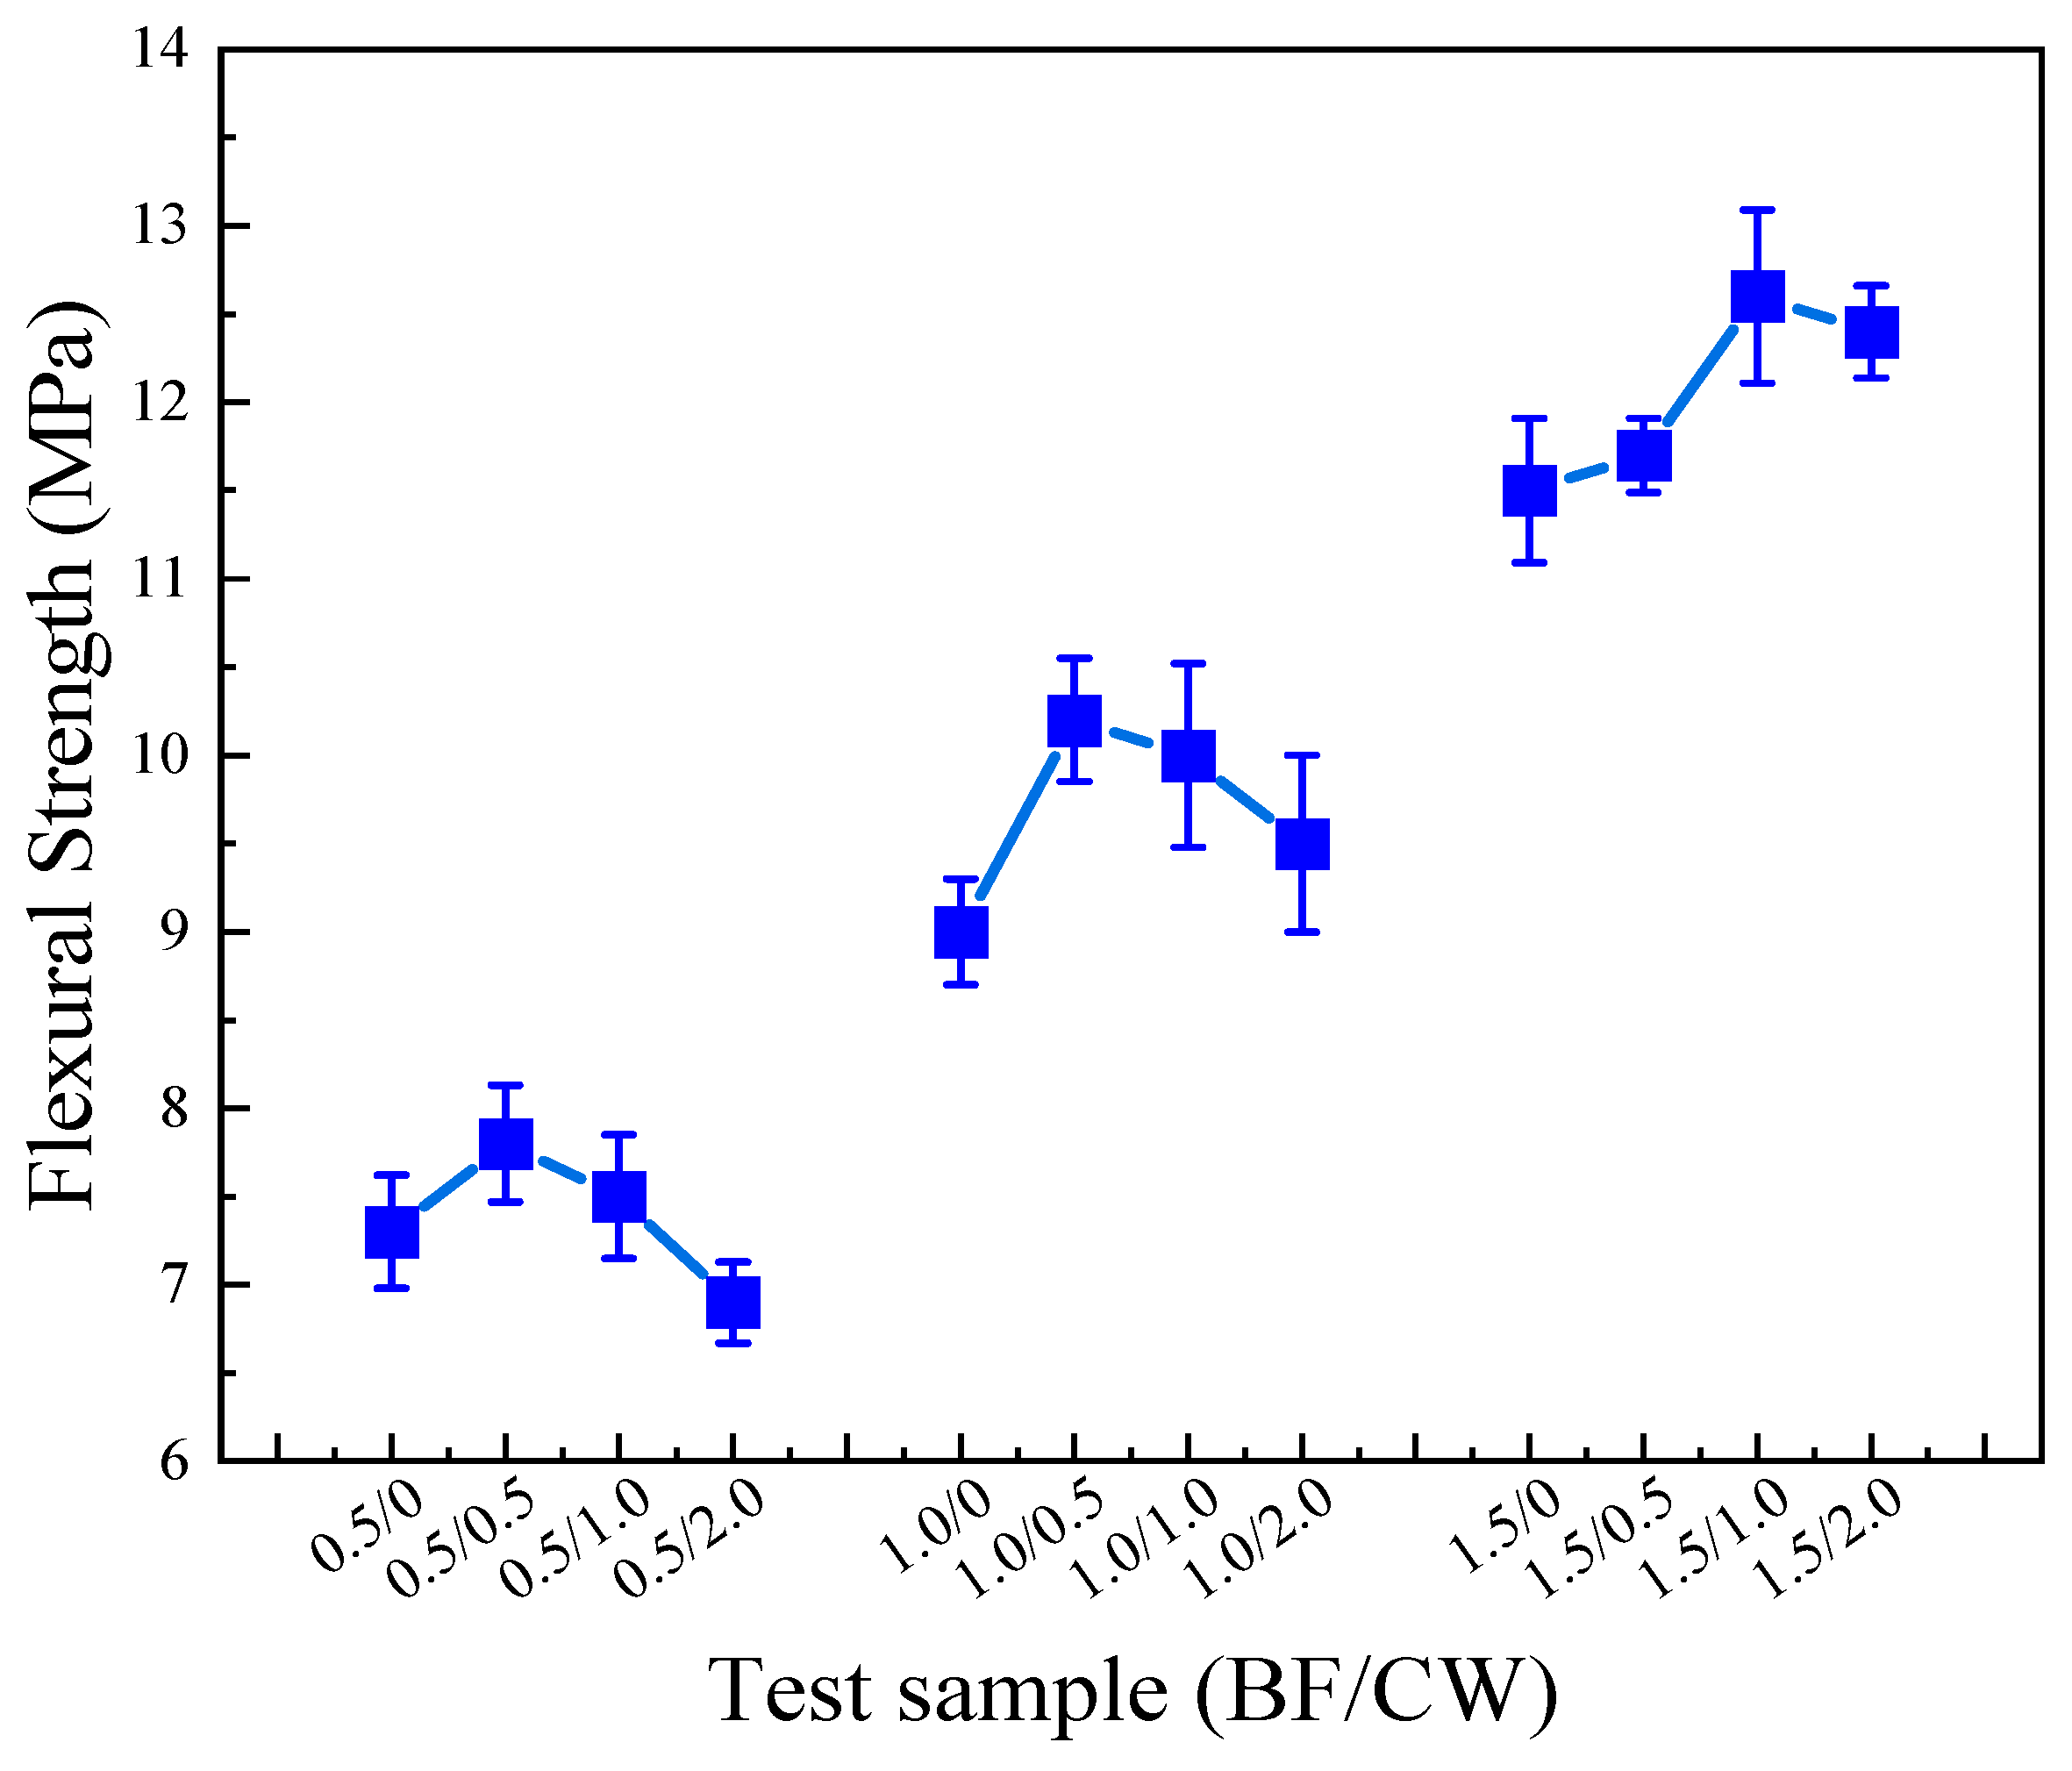
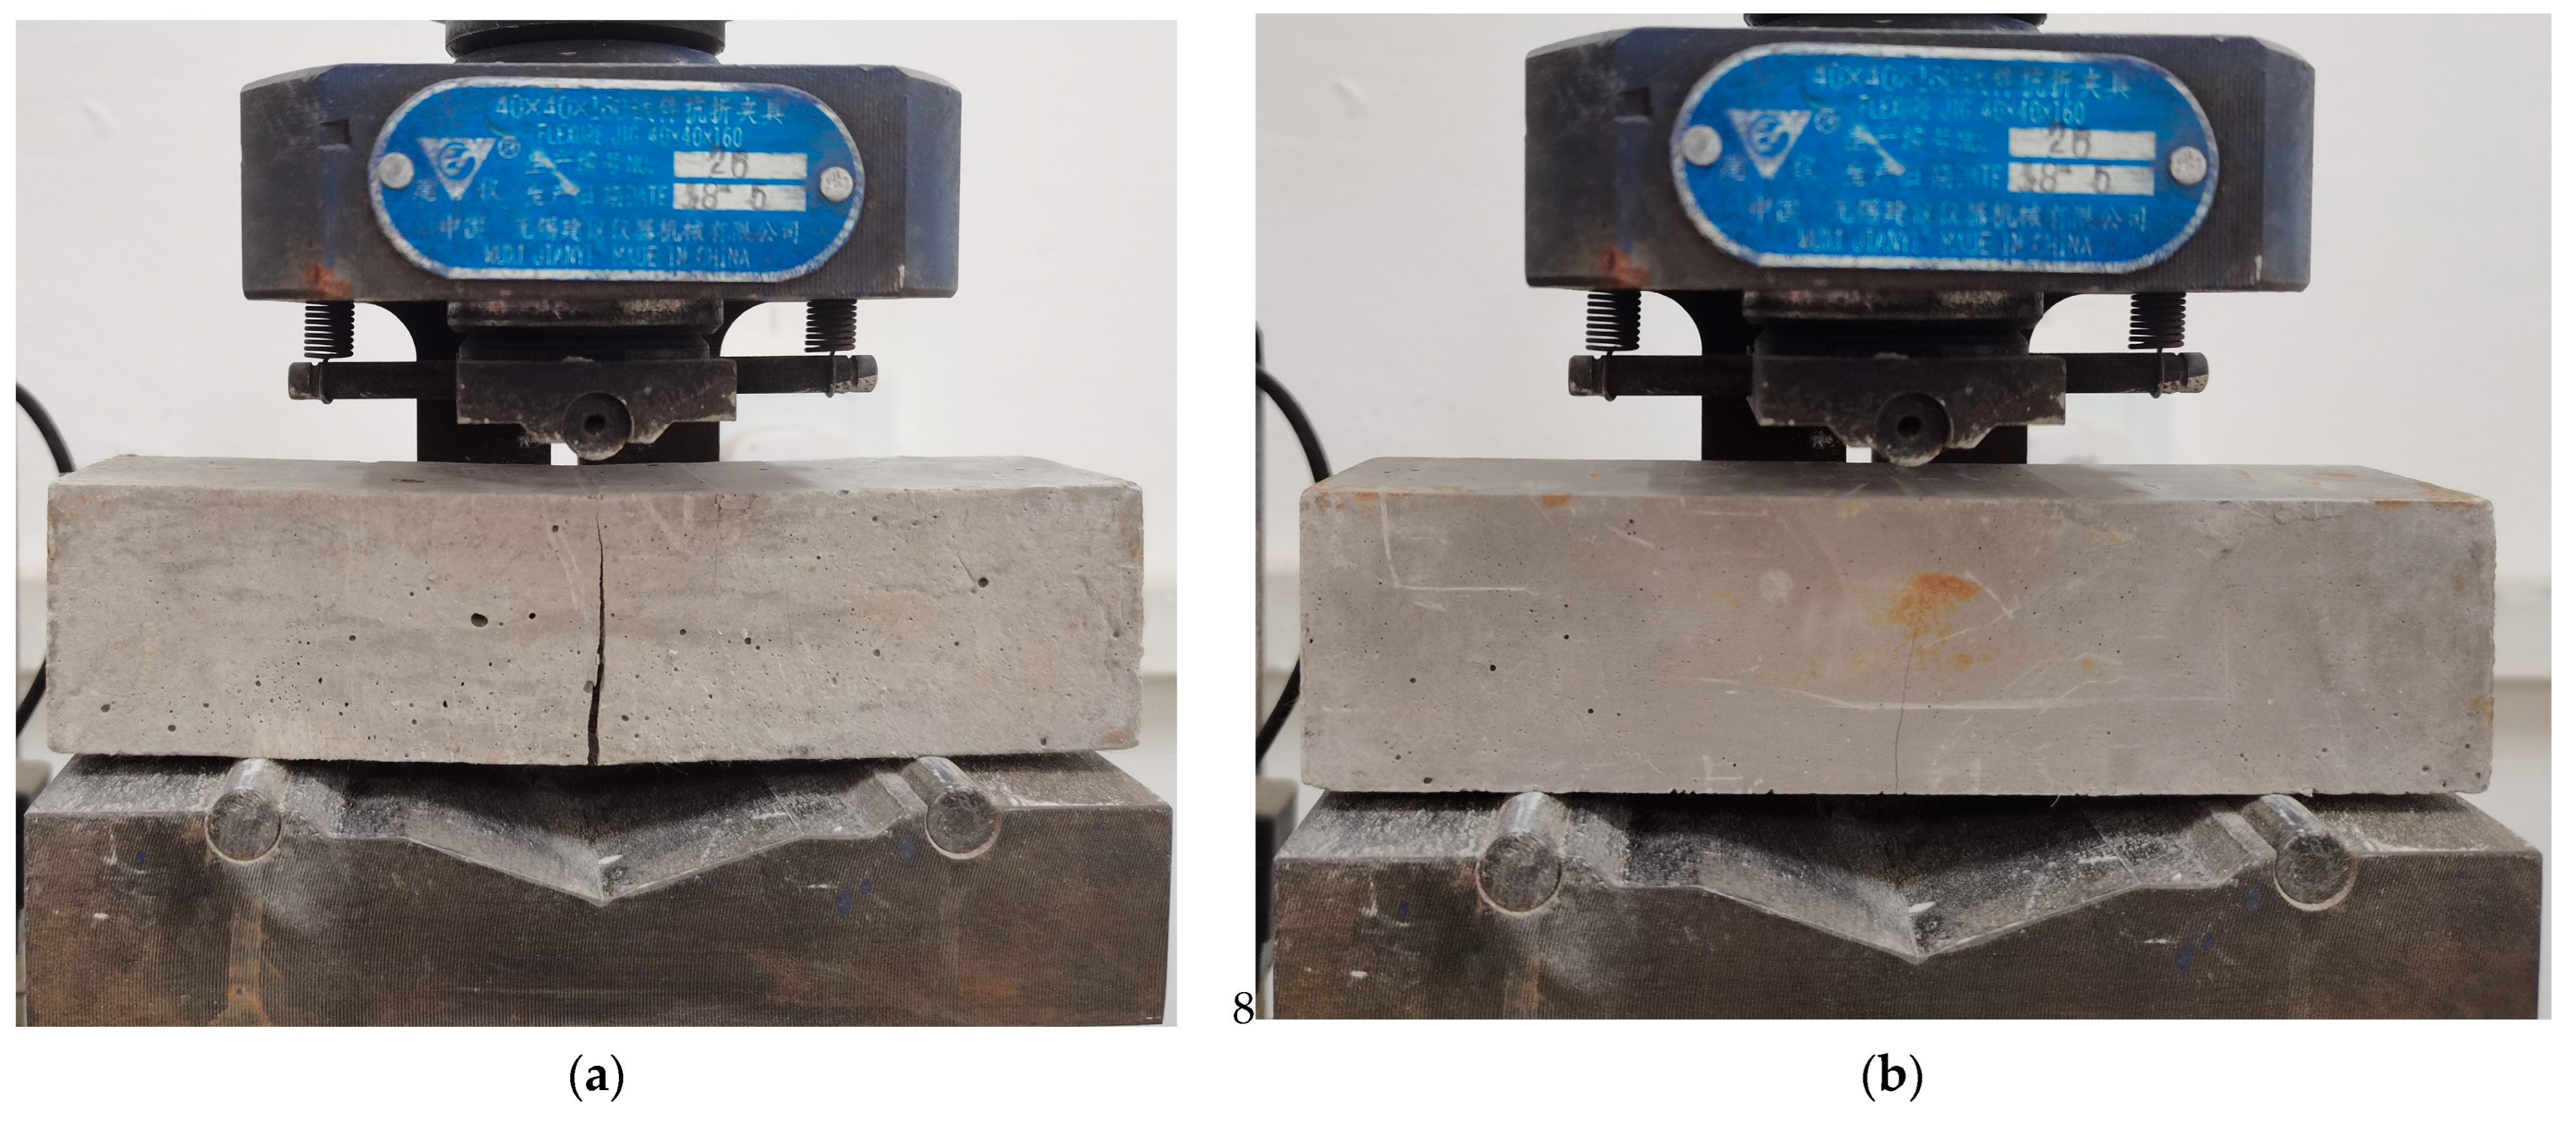
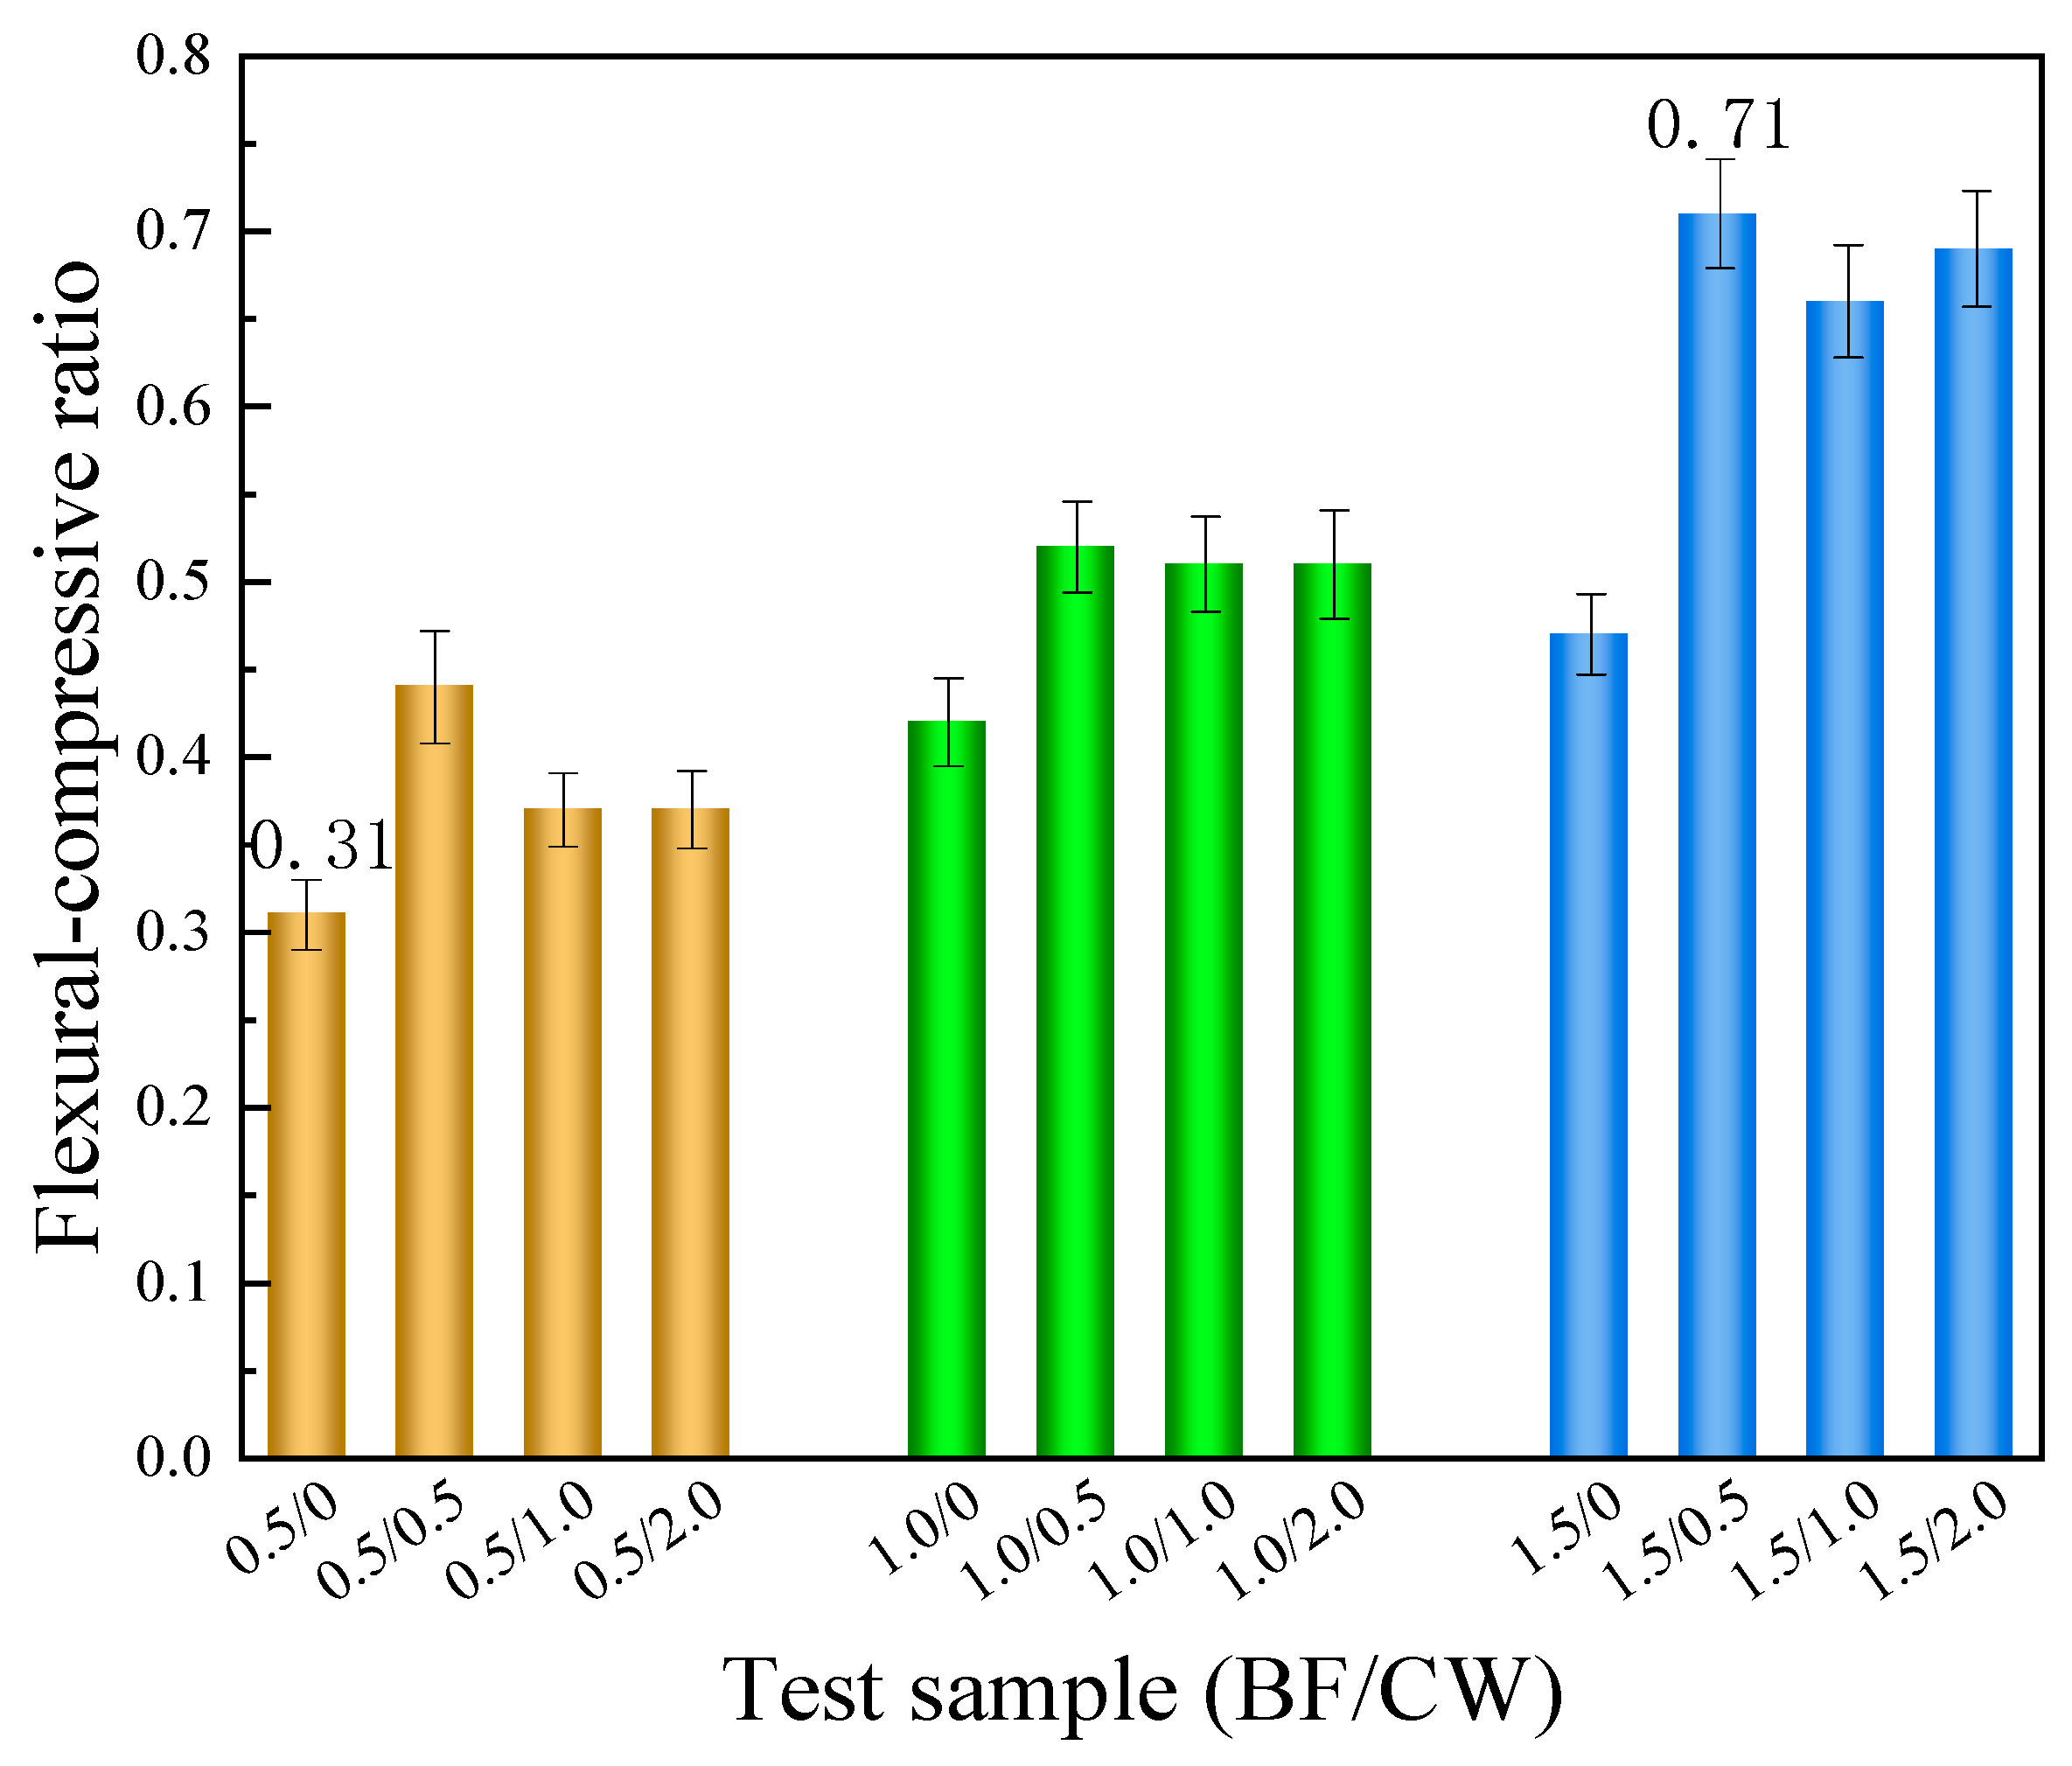
3.2.1. Flexural Strength
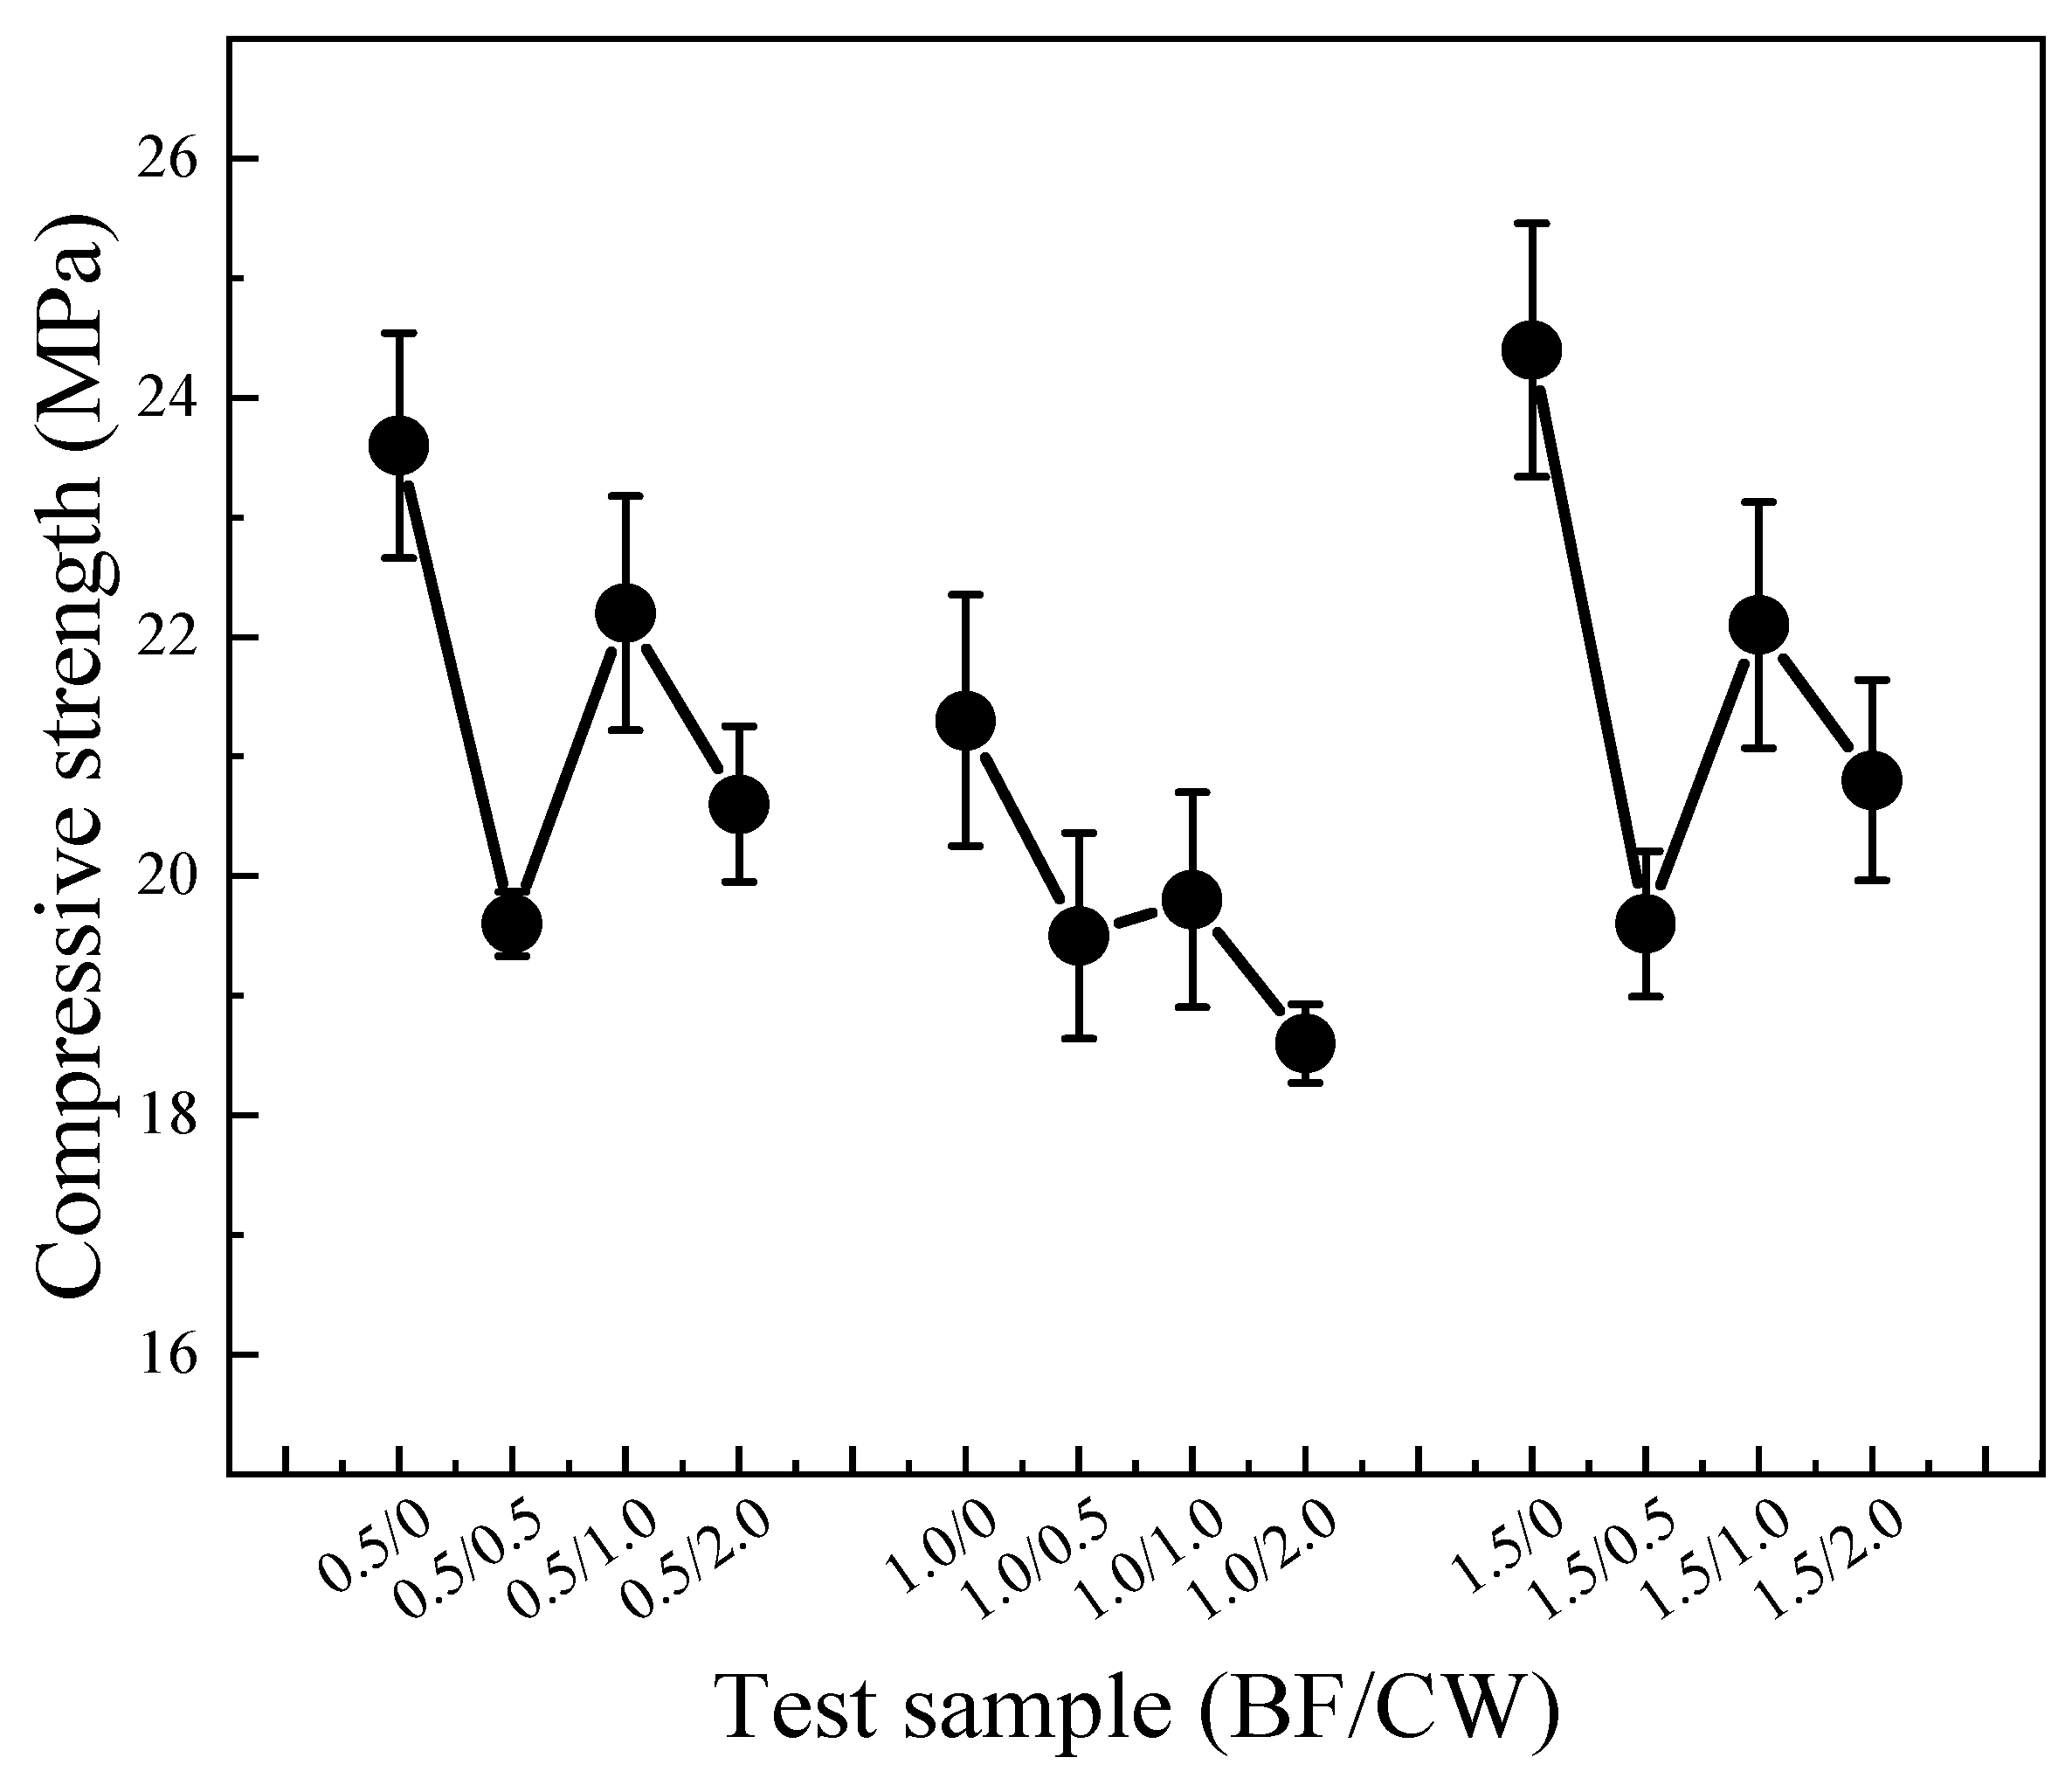
3.2.2. Compressive Strength
3.2.3. Toughness
3.2.4. Water Absorption and Softening Coefficient
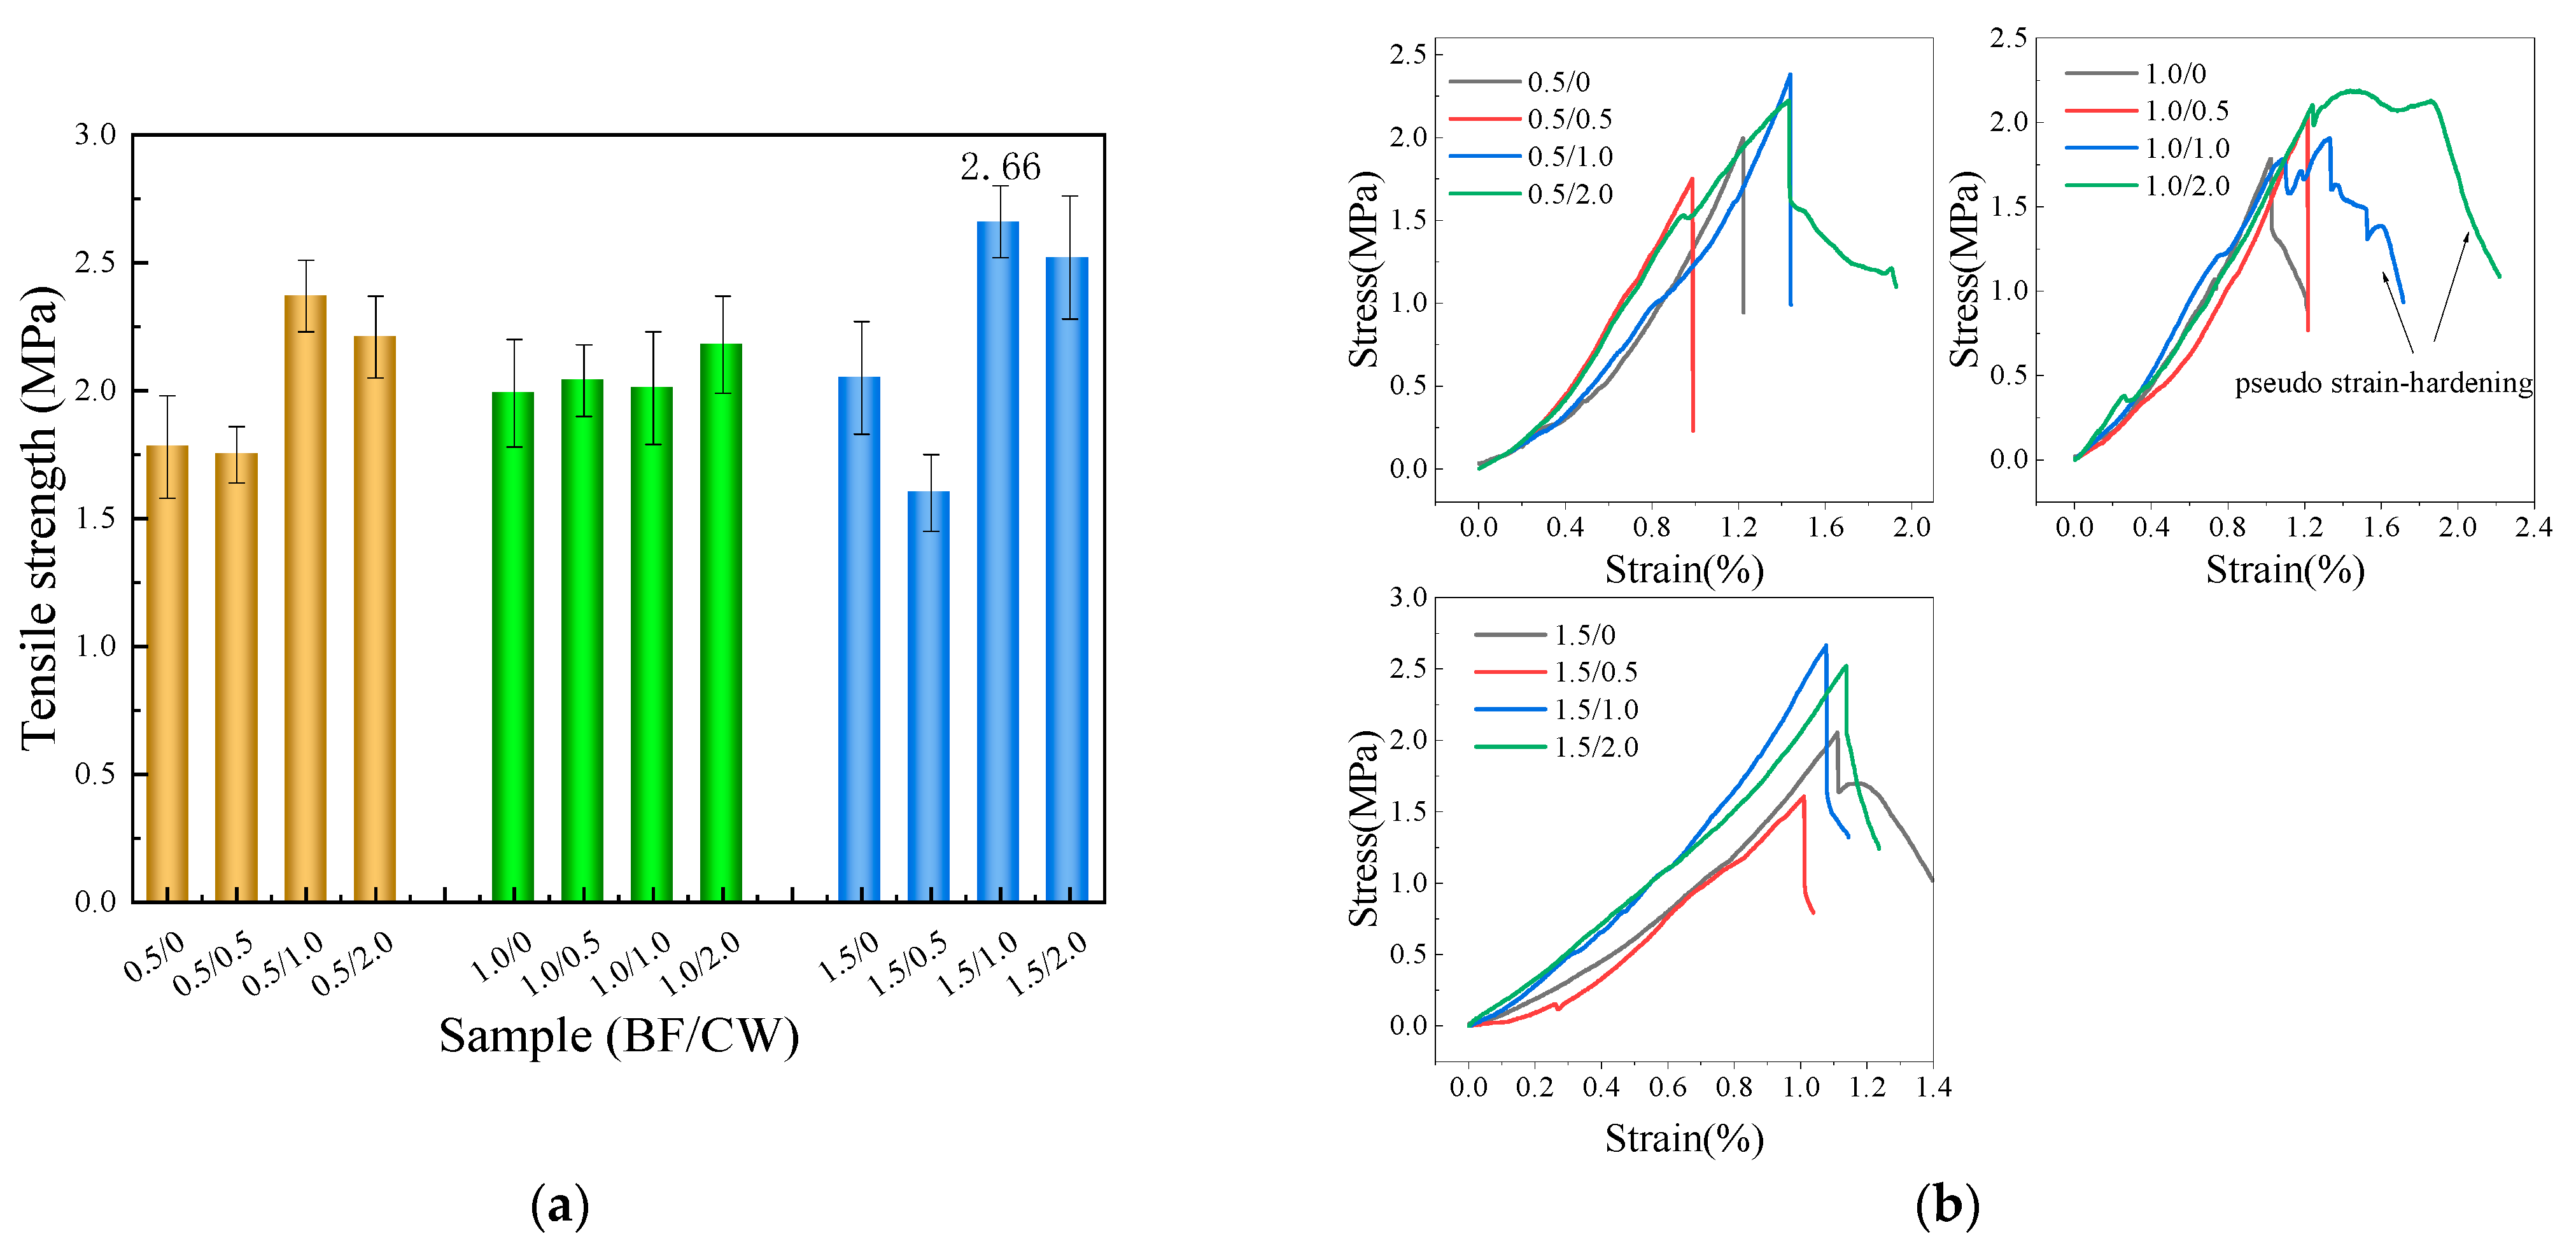
3.2.5. Tensile Strength
3.3. Mechanism Analysis
3.3.1. Monofilament Number and Interface Area Calculation
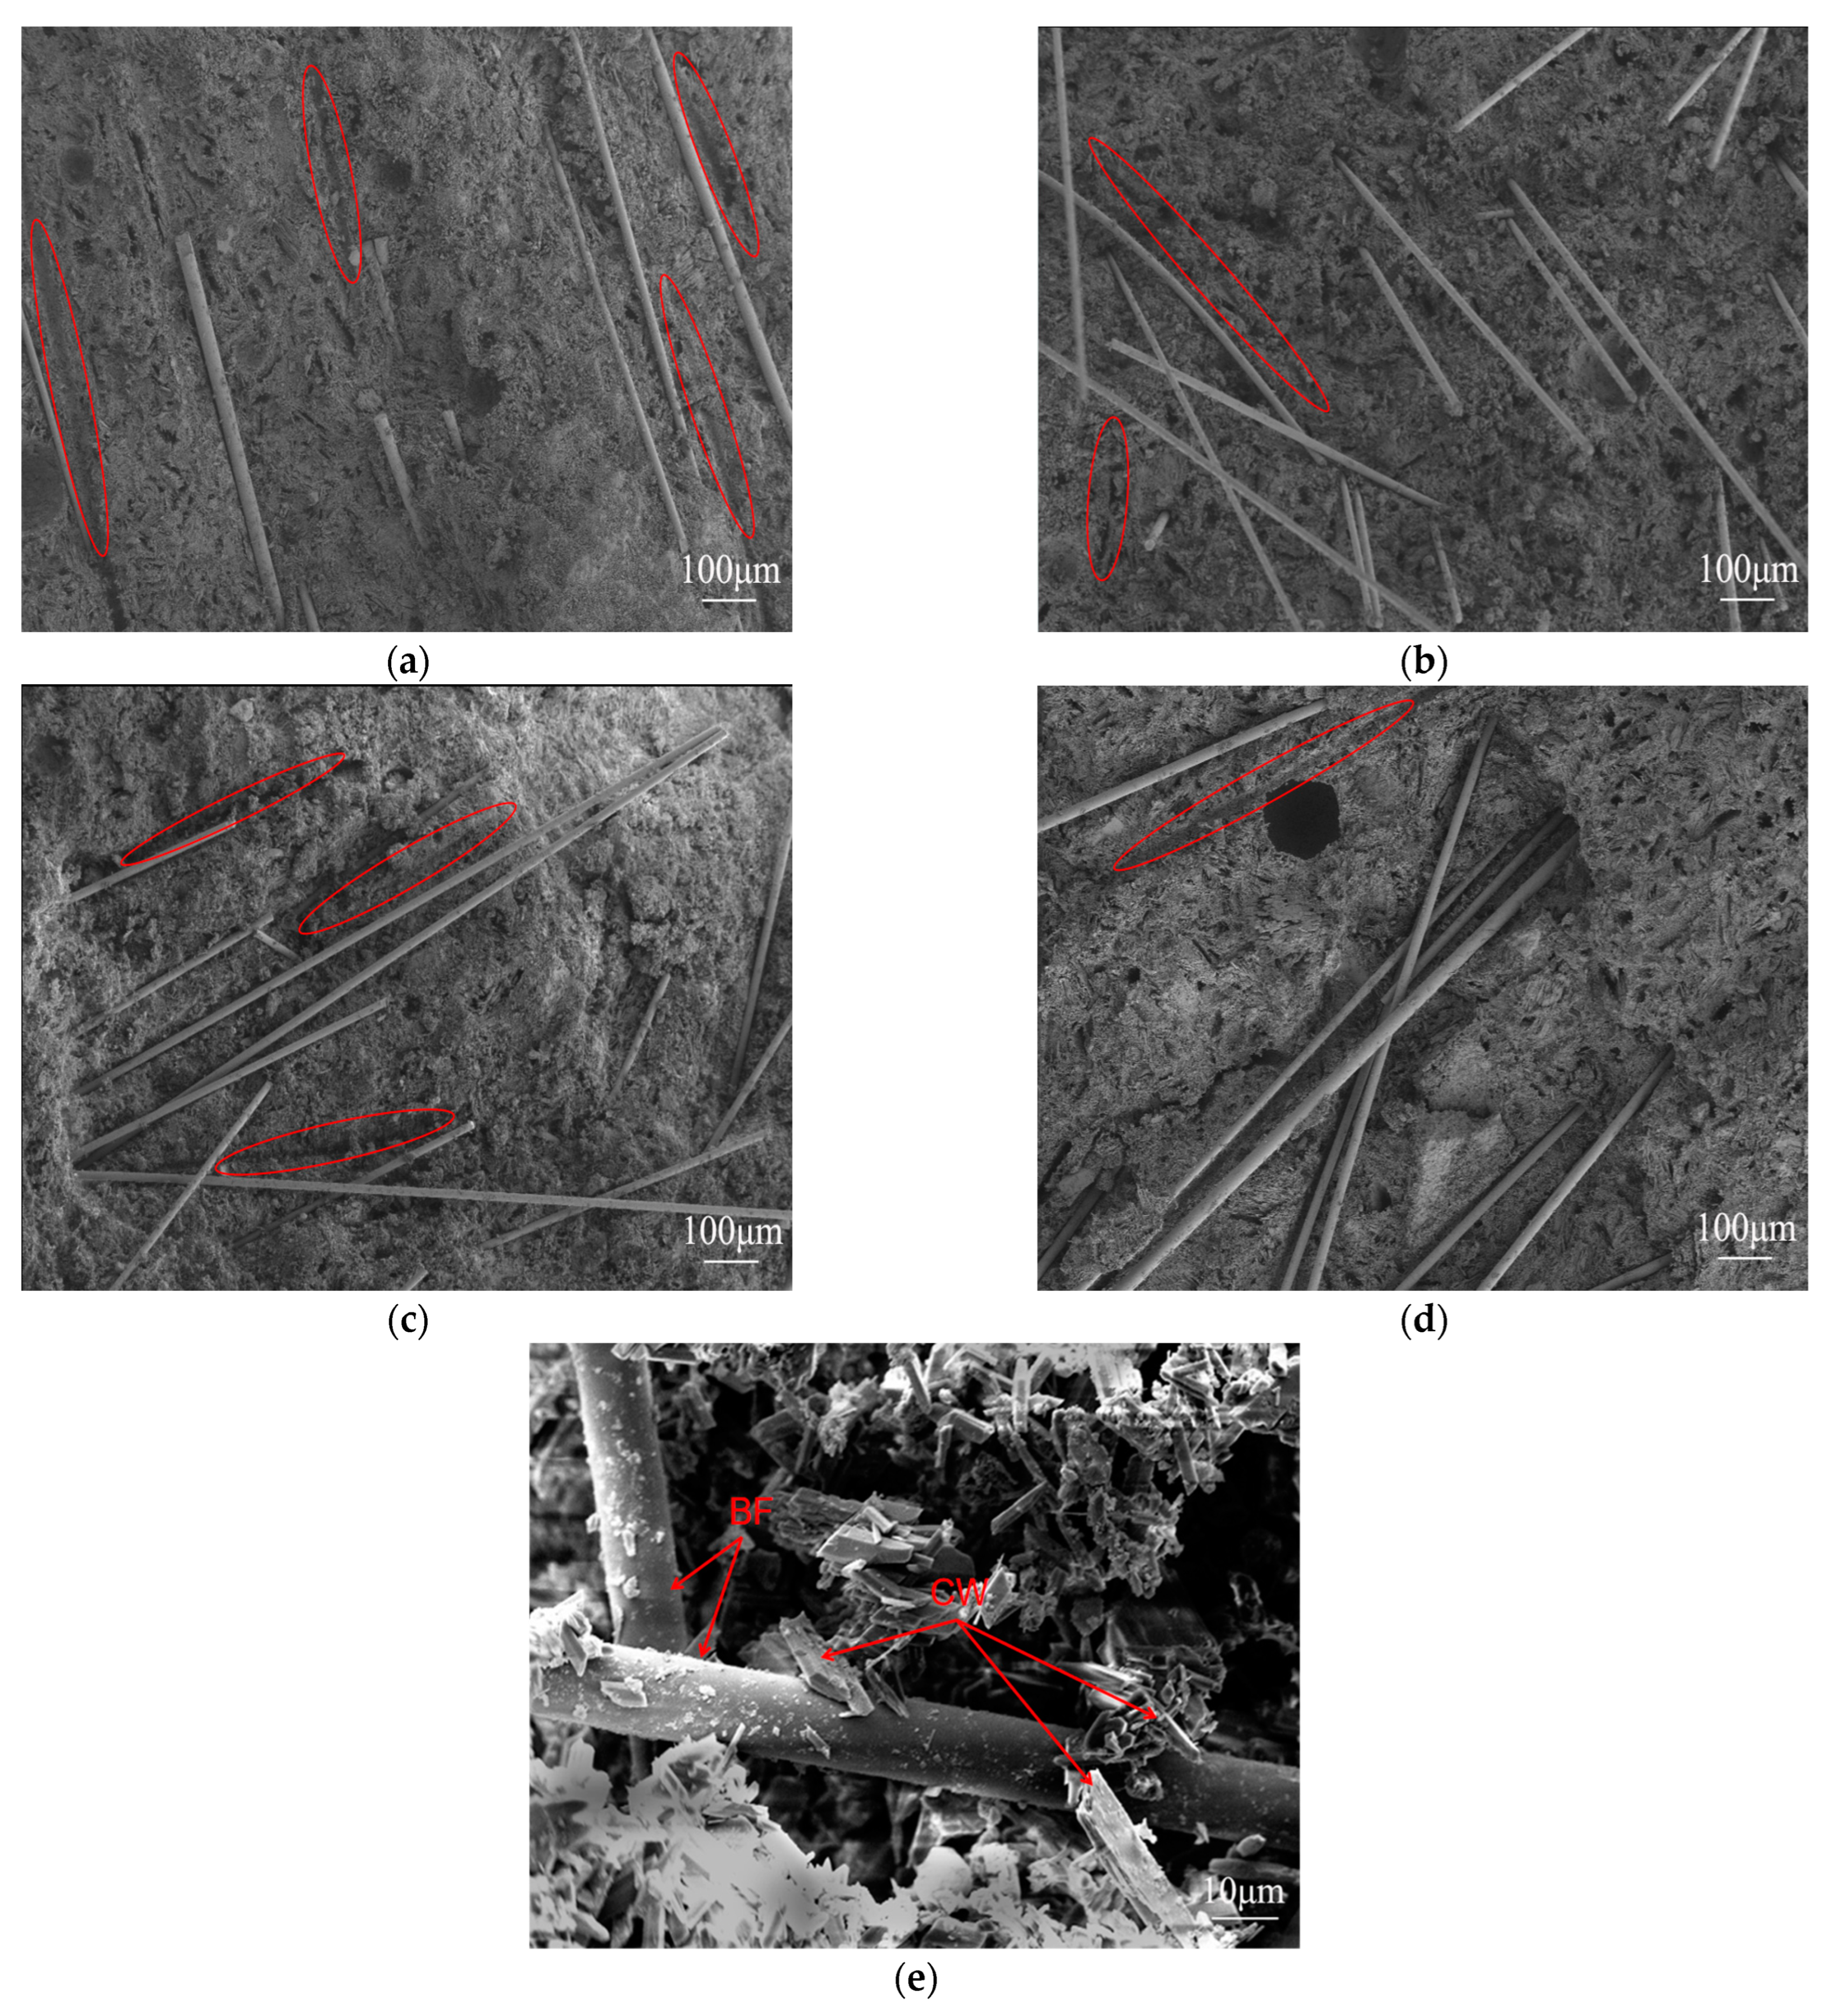
3.3.2. SEM Analysis
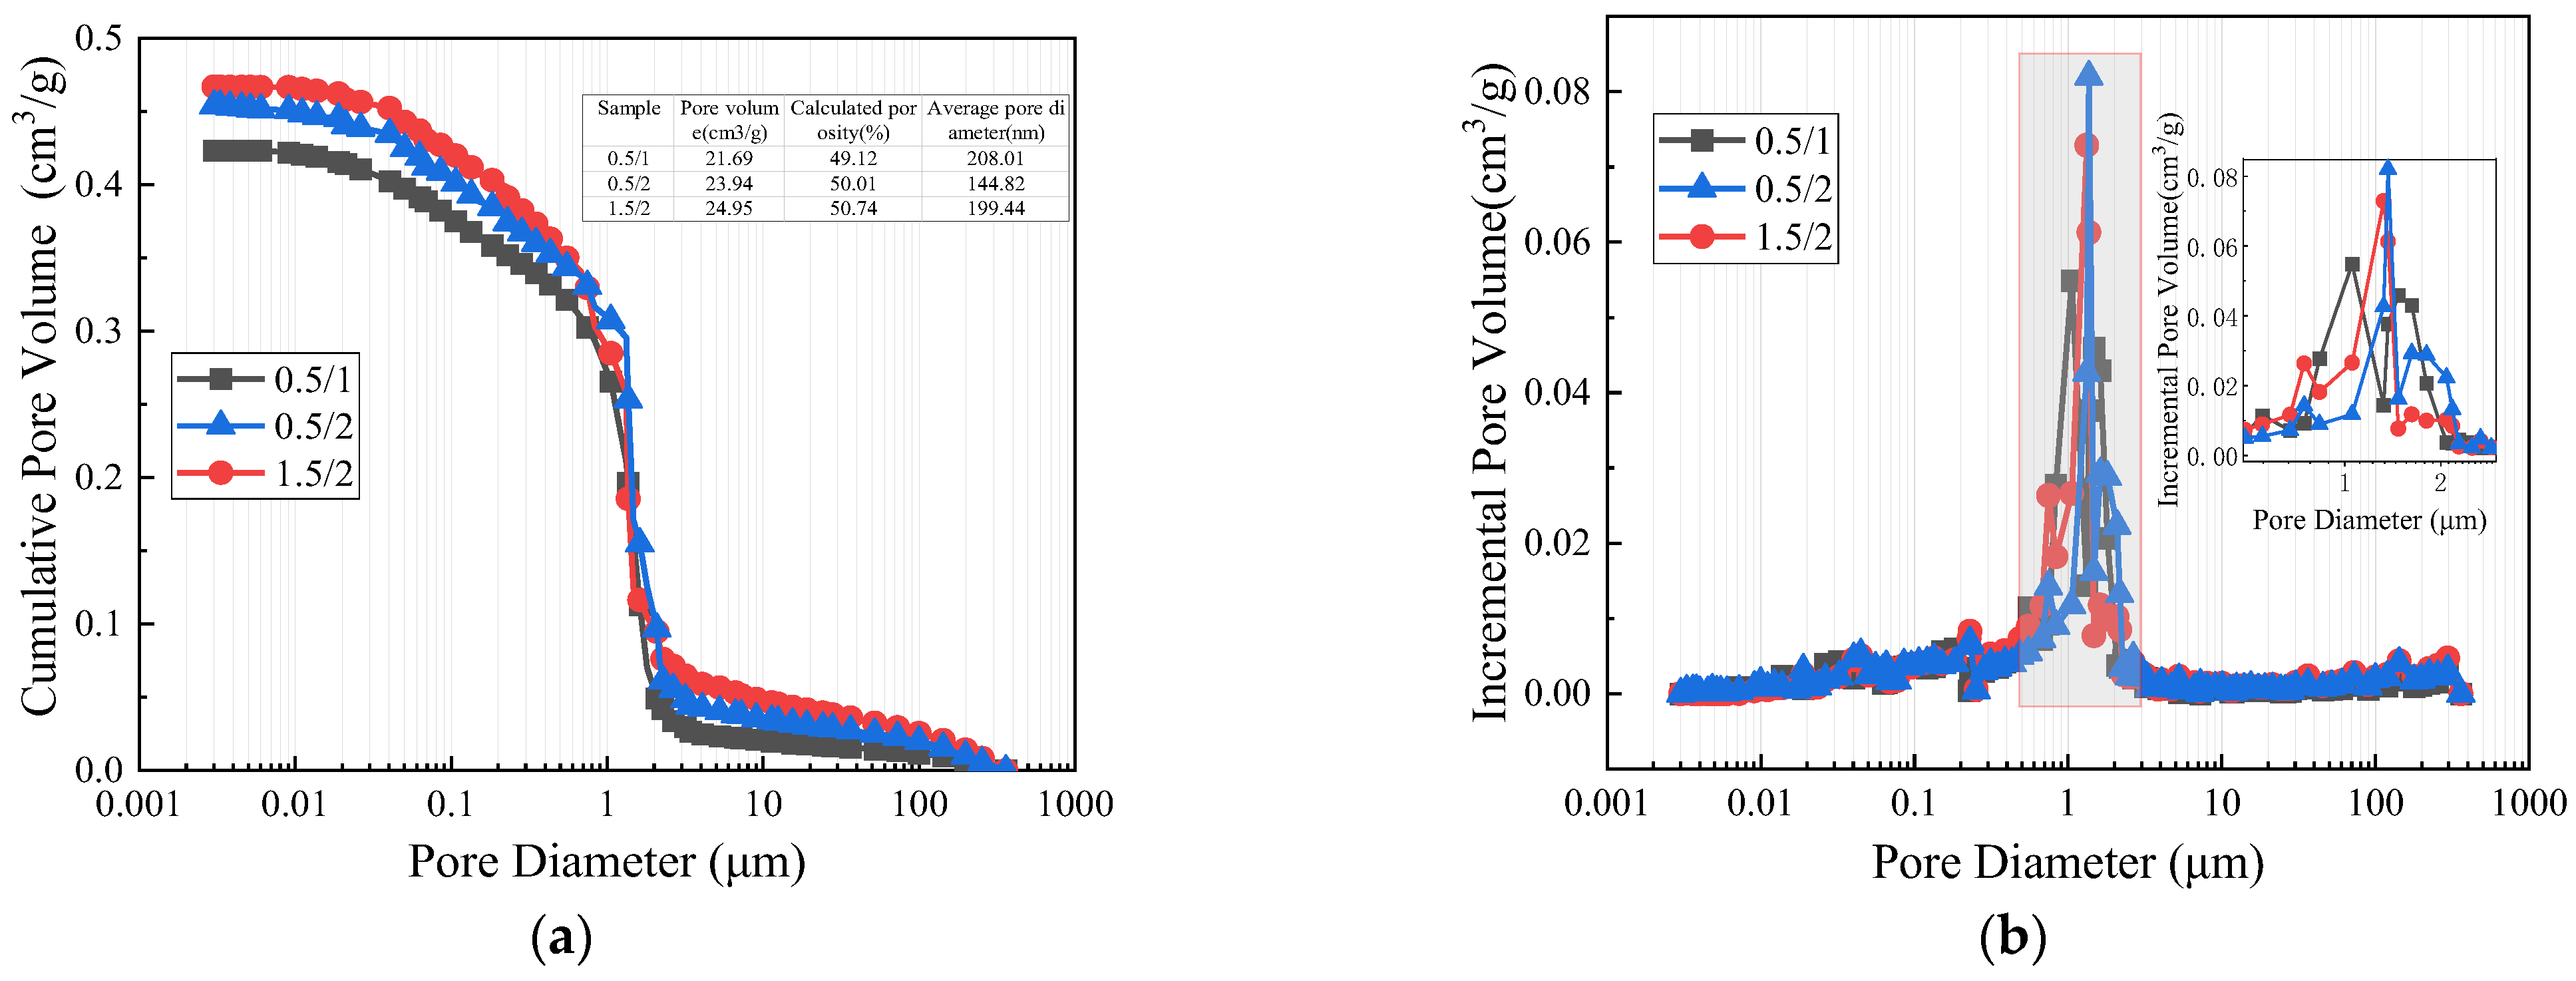
3.3.3. MIP Analysis
4. Conclusions
Author Contributions
Funding
Institutional Review Board Statement
Informed Consent Statement
Data Availability Statement
Conflicts of Interest
References
- Rashad, A.M. Phosphogypsum as a construction material. J. Clean. Prod. 2017, 166, 732–743. [Google Scholar] [CrossRef]
- Qin, X.; Cao, Y.; Guan, H.; Hu, Q.; Liu, Z.; Xu, J.; Hu, B.; Zhang, Z.; Luo, R. Resource utilization and development of phosphogypsum-based materials in civil engineering. J. Clean. Prod. 2023, 387, 135858. [Google Scholar] [CrossRef]
- Tayibi, H.; Choura, M.; López, F.A.; Alguacil, F.J.; López-Delgado, A. Environmental impact and management of phosphogypsum. J. Environ. Manag. 2009, 90, 2377–2386. [Google Scholar] [CrossRef] [PubMed]
- Saadaoui, E.; Ghazel, N.; Ben Romdhane, C.; Massoudi, N. Phosphogypsum: Potential uses and problems—A review. Int. J. Environ. Stud. 2017, 74, 558–567. [Google Scholar] [CrossRef]
- Li, X.; Lv, X.; Xiang, L. Review of the State of Impurity Occurrences and Impurity Removal Technology in Phosphogypsum. Materials 2023, 16, 5630. [Google Scholar] [CrossRef] [PubMed]
- Chandara, C.; Azizli, K.A.M.; Ahmad, Z.A.; Sakai, E. Use of waste gypsum to replace natural gypsum as set retarders in Portland cement. Waste Manag. 2009, 29, 1675–1679. [Google Scholar] [CrossRef] [PubMed]
- Shen, W.; Gan, G.; Dong, R.; Chen, H.; Tan, Y.; Zhou, M. Utilization of solidified phosphogypsum as Portland cement retarder. J. Mater. Cycles Waste Manag. 2012, 14, 228–233. [Google Scholar] [CrossRef]
- Li, B.; Li, L.; Chen, X.; Ma, Y.; Zhou, M. Modification of phosphogypsum using circulating fluidized bed fly ash and carbide slag for use as cement retarder. Constr. Build. Mater. 2022, 338, 127630. [Google Scholar] [CrossRef]
- Van der Merwe, E.M.; Strydom, C.A. Purification of South African phosphogypsum for use as Portland cement retarder by a combined thermal and sulphuric acid treatment method: Research in action. S. Afr. J. Sci. 2004, 100, 411–414. [Google Scholar]
- Rosales, J.; Pérez, S.M.; Cabrera, M.; Gázquez, M.J.; Bolivar, J.P.; de Brito, J.; Agrela, F. Treated phosphogypsum as an alternative set regulator and mineral addition in cement production. J. Clean. Prod. 2020, 244, 118752. [Google Scholar] [CrossRef]
- Nguyen, N.L.; Le Vu, P. Eco-friendly super sulphated cement concrete using vietnam phosphogypsum and sodium carbonate Na2CO3. Civ. Eng. J. 2022, 8, 2445–2460. [Google Scholar] [CrossRef]
- Liao, Y.; Yao, J.; Deng, F.; Li, H.; Wang, K.; Tang, S. Hydration behavior and strength development of supersulfated cement prepared by calcined phosphogypsum and slaked lime. J. Build. Eng. 2023, 80, 108075. [Google Scholar] [CrossRef]
- Zhang, L.; Mo, K.H.; Yap, S.P.; Gencel, O.; Ling, T.C. Mechanical strength, water resistance and drying shrinkage of lightweight hemihydrate phosphogypsum-cement composite with ground granulated blast furnace slag and recycled waste glass. Constr. Build. Mater. 2022, 345, 128232. [Google Scholar] [CrossRef]
- Isteri, V.; Ohenoja, K.; Hanein, T.; Kinoshita, H.; Kletti, H.; Rößler, C.; Tanskanen, P.; Illikainen, M.; Fabritius, T. Ferritic calcium sulfoaluminate belite cement from metallurgical industry residues and phosphogypsum: Clinker production, scale-up, and microstructural characterisation. Cem. Concr. Res. 2022, 154, 106715. [Google Scholar] [CrossRef]
- Meskini, S.; Samdi, A.; Ejjaouani, H.; Remmal, T. Valorization of phosphogypsum as a road material: Stabilizing effect of fly ash and lime additives on strength and durability. J. Clean. Prod. 2021, 323, 129161. [Google Scholar] [CrossRef]
- Meskini, S.; Remmal, T.; Ejjaouani, H.; Samdi, A. Formulation and optimization of a phosphogypsum–fly ash–lime composite for road construction: A statistical mixture design approach. Constr. Build. Mater. 2022, 315, 125786. [Google Scholar] [CrossRef]
- Ding, C.; Sun, T.; Shui, Z.; Xie, Y.; Ye, Z. Physical properties, strength, and impurities stability of phosphogypsum-based cold-bonded aggregates. Constr. Build. Mater. 2022, 331, 127307. [Google Scholar] [CrossRef]
- Kuzmanović, P.; Todorović, N.; Mrđa, D.; Forkapić, S.; Petrović, L.F.; Miljević, B.; Hansman, J.; Knežević, J. The possibility of the phosphogypsum use in the production of brick: Radiological and structural characterization. J. Hazard. Mater. 2021, 413, 125343. [Google Scholar] [CrossRef] [PubMed]
- Chen, X.; Gao, J.; Liu, C.; Zhao, Y. Effect of neutralization on the setting and hardening characters of hemihydrate phosphogypsum plaster. Constr. Build. Mater. 2018, 190, 53–64. [Google Scholar] [CrossRef]
- Xue, S.; Li, M.; Jiang, J.; Millar, G.J.; Li, C.; Kong, X. Phosphogypsum stabilization of bauxite residue: Conversion of its alkaline characteristics. J. Environ. Sci. 2019, 77, 1–10. [Google Scholar] [CrossRef]
- Cichy, B.; Kraszewski, C.; Rafalski, L. Geotechnical properties of phosphogypsum and its use in road engineering. In Proceedings of the China-Europe Conference on Geotechnical Engineering, Online, 3 August 2018; Springer International Publishing: Cham, Switzerland, 2018; Volume 2, pp. 1664–1667. [Google Scholar]
- Singh, M. Role of phosphogypsum impurities on strength and microstructure of selenite plaster. Constr. Build. Mater. 2005, 19, 480–486. [Google Scholar] [CrossRef]
- Jamshaid, H.; Mishra, R. A green material from rock: Basalt fiber—A review. J. Text. Inst. 2016, 107, 923–937. [Google Scholar] [CrossRef]
- Al-Kharabsheh, B.N.; Arbili, M.M.; Majdi, A.; Alogla, S.M.; Hakamy, A.; Ahmad, J.; Deifalla, A.F. Basalt fiber reinforced concrete: A compressive review on durability aspects. Materials 2023, 16, 429. [Google Scholar] [CrossRef]
- Gencel, O.; Nodehi, M.; Bayraktar, O.Y.; Kaplan, G.; Benli, A.; Gholampour, A.; Ozbakkaloglu, T. Basalt fiber-reinforced foam concrete containing silica fume: An experimental study. Constr. Build. Mater. 2022, 326, 126861. [Google Scholar] [CrossRef]
- Li, Z.; Wang, X.; Yan, W.; Ding, L.; Liu, J.; Wu, Z.; Huang, H. Physical and mechanical properties of gypsum-based composites reinforced with basalt, glass, and PVA fibers. J. Build. Eng. 2023, 64, 105640. [Google Scholar] [CrossRef]
- Li, X.; Yu, T.; Park, S.-J.; Kim, Y.-H. Reinforcing effects of gypsum composite with basalt fiber and diatomite for improvement of high-temperature endurance. Constr. Build. Mater. 2022, 325, 126762. [Google Scholar] [CrossRef]
- Lv, F.; Wang, L.; An, H.; Chen, S.; Shu, J.; Kong, D. Effects of hybrid fibers on properties of desulfurized gypsum-based composite cementitious materials. Constr. Build. Mater. 2023, 392, 131840. [Google Scholar] [CrossRef]
- Jian, S.; Yang, X.; Gao, W.; Li, B.; Gao, X.; Huang, W.; Tan, H.; Lei, Y. Study on performance and function mechanisms of whisker modified flue gas desulfurization (FGD) gypsum. Constr. Build. Mater. 2021, 301, 124341. [Google Scholar] [CrossRef]
- Ma, H.; Cai, J.; Lin, Z.; Qian, S.; Li, V.C. CaCO3 whisker modified Engineered Cementitious Composite with local ingredients. Constr. Build. Mater. 2017, 151, 1–8. [Google Scholar] [CrossRef]
- Cai, J.; Pan, J. Using calcium carbonate whisker in engineered cementitious composites. In Proceedings of the 9th International Conference on Fracture Mechanics of Concrete and Concrete Structures, Berkeley, CA, USA, 29 May–1 June 2016. [Google Scholar]
- GB/T 9776-2008; Calcined Gypsum. Inspection and Quarantine of the People’s Republic of China: Beijing, China, 2008.
- Cui, G.; Xie, L.; Lu, Y.; Kong, D.; Wang, L. Optimization of mechanical properties of basalt fiber reinforced phosphogypsum-based composites based on RSM. Inorg. Chem. Ind. 2023, 55, 116–123. [Google Scholar]
- Alaskar, A.; Albidah, A.; Alqarni, A.S.; Alyousef, R.; Mohammadhosseini, H. Performance evaluation of high-strength concrete reinforced with basalt fibers exposed to elevated temperatures. J. Build. Eng. 2021, 35, 102108. [Google Scholar] [CrossRef]
- Xie, L.; Zhou, Y.; Xiao, S.; Miao, X.; Murzataev, A.; Kong, D.; Wang, L. Research on basalt fiber reinforced phosphogypsum-based composites based on single factor test and RSM test. Constr. Build. Mater. 2022, 316, 126084. [Google Scholar] [CrossRef]
- Chen, F.B.; Xu, B.; Jiao, H.; Chu, H.; Wang, Y.; Liu, J. Fiber distribution and pore structure characterization of basalt fiber reinforced concrete. J. China Univ. Min. Technol. 2021, 50, 273–280. [Google Scholar]
- Xie, L.; Zhou, Y.S.; Luo, S.; Fu, R.B.; Kong, D.W.; Wang, L.L. Study on Basalt Fiber Modified Desulfurized Building Gypsum. Non-Met. Mines 2020, 43, 49–55. [Google Scholar]
- Cao, M.; Zhang, C.; Wei, J. Microscopic reinforcement for cement based composite materials. Constr. Build. Mater. 2013, 40, 14–25. [Google Scholar] [CrossRef]


| Materials | Diameter (μm) | Length (μm) | Density (g/cm3) | Tensile Strength (MPa) |
|---|---|---|---|---|
| BFs | 13 | 3, 6, 9, 18 | 2.65 | 3800–4800 |
| CW | 1–2 | 20–30 | 2.80 | − |
| Experimental Group | CPG | Water | Retarder | BFs | CW (wt%) | |
|---|---|---|---|---|---|---|
| Length (mm) | Dosages (wt%) | |||||
| Individual tests: BFs | 1 | 0.45 | 0.001 | 3 | 0/0.5/1.0/1.5 | − |
| 1 | 0.45 | 0.001 | 6 | 0/0.5/1.0/1.5 | − | |
| 1 | 0.45 | 0.001 | 9 | 0/0.5/1.0/1.5 | − | |
| 1 | 0.45 | 0.001 | 18 | 0/0.5/1.0/1.5 | − | |
| Mixed tests:BFs + CW | 1 | 0.45 | 0.001 | 6 | 0.5 | 0.5/1.0/2.0 |
| 1 | 0.45 | 0.001 | 6 | 1.0 | 0.5/1.0/2.0 | |
| 1 | 0.45 | 0.001 | 6 | 1.5 | 0.5/1.0/2.0 | |
| Mass Fraction of Fibers (C, %) | Fiber Density (ρ, g/cm3) | Fiber Diameter (A, μm) | Fiber Length (B, mm) | Monofilament Quantity (Q) | Interfacial Area (S, mm2) |
|---|---|---|---|---|---|
| 0.5 | 2.65 | 13 | 3 | 4740.7 | 580.6 |
| 1.0 | 2.65 | 13 | 3 | 9481.5 | 1161.1 |
| 1.5 | 2.65 | 13 | 3 | 14,222.2 | 1741.7 |
| 0.5 | 2.65 | 13 | 6 | 2370.4 | 580.6 |
| 1.0 | 2.65 | 13 | 6 | 4740.7 | 1161.1 |
| 1.5 | 2.65 | 13 | 6 | 7111.1 | 1741.7 |
| 0.5 | 2.65 | 13 | 9 | 1580.2 | 580.6 |
| 1.0 | 2.65 | 13 | 9 | 3160.5 | 1161.1 |
| 1.5 | 2.65 | 13 | 9 | 4740.7 | 1741.7 |
| 0.5 | 2.65 | 13 | 18 | 790.1 | 580.6 |
| 1.0 | 2.65 | 13 | 18 | 1580.2 | 1161.1 |
| 1.5 | 2.65 | 13 | 18 | 2370.4 | 1741.7 |
Disclaimer/Publisher’s Note: The statements, opinions and data contained in all publications are solely those of the individual author(s) and contributor(s) and not of MDPI and/or the editor(s). MDPI and/or the editor(s) disclaim responsibility for any injury to people or property resulting from any ideas, methods, instructions or products referred to in the content. |
© 2024 by the authors. Licensee MDPI, Basel, Switzerland. This article is an open access article distributed under the terms and conditions of the Creative Commons Attribution (CC BY) license (https://creativecommons.org/licenses/by/4.0/).
Share and Cite
Jiang, Y.; Huo, J.; Lei, Y.; Jia, L. Performance Evaluation of Calcined Phosphogypsum Reinforced with Basalt Fiber and Calcium Carbonate Whiskers: A Study on Individual and Mixed Tests. Materials 2024, 17, 1725. https://doi.org/10.3390/ma17081725
Jiang Y, Huo J, Lei Y, Jia L. Performance Evaluation of Calcined Phosphogypsum Reinforced with Basalt Fiber and Calcium Carbonate Whiskers: A Study on Individual and Mixed Tests. Materials. 2024; 17(8):1725. https://doi.org/10.3390/ma17081725
Chicago/Turabian StyleJiang, Yong, Jichuan Huo, Yonglin Lei, and Lujun Jia. 2024. "Performance Evaluation of Calcined Phosphogypsum Reinforced with Basalt Fiber and Calcium Carbonate Whiskers: A Study on Individual and Mixed Tests" Materials 17, no. 8: 1725. https://doi.org/10.3390/ma17081725