Abstract
Altaf et al. recently published in Materials, 2022; 15(11), 3826, about the synthesis of silver nanoparticles (AgNPs) using the non-thermal plasma reduction of AgNO3 salt and performed statistical optimization for the reaction conditions, i.e., (A) the concentration of a stabilizing agent, mM (B) concentration of AgNO3 salt, mM and (C) the reaction time, mins. We would like to point out that their writing on the statistical analysis (Box–Behnken response surface methodology for predicting the size of the nanoparticles) is not complete and, therefore, cannot be independently checked by the readers. The problems found in their report are as follows: the hard-to-find actual value of the uncoded units; a dubious claim about the middle levels of variable B (salt concentration); inconsistency in using coded vs. uncoded units in the table vs. the regression equation; and three center points with identical conditions give a dissimilar prediction of results. These serious issues need to be clarified and revised, as well as several writing errors, in order to uphold the standard of scientific publications.
1. Introduction
We are writing in response to the article by Altaf et al., Materials, 2022; 15(11), 3826, “Non-Thermal Plasma Reduction of Ag+ Ions into Silver Nanoparticles in Open Atmosphere under Statistically Optimized Conditions for Biological and Photocatalytic Applications” [1]. This article is in line with our experience of plasma treatment for material modifications [2,3,4,5]. In that article, silver nanoparticles (AgNPs) were prepared using the non-thermal plasma reduction of AgNO3 salt and a stabilizing agent (glucose). They also conducted statistical optimization (the Box–Behnken response surface methodology) for the reaction conditions, i.e., (A) the concentration of the stabilizing agent, mM, (B) the concentration of AgNO3 salt, mM, and (C) the reaction time, mins. We would like to highlight that their calculation for the statistical analysis for predicting the size of the AgNPs is questionable and, therefore, cannot be independently checked by the readers of this particular paper. The experimental conditions and the results (AgNPs size) in question can be observed in Table 1.

Table 1.
Experimental conditions, the AgNPs’ size (laboratory data), the prediction of AgNPs’ size (Altaf and coworkers), and our prediction accompanied by a step-by-step calculation.
The report by Altaf et al. on the experimental parameters (as shown in Table 1) was written only as independent variables in the form of coded units (−1, 0, +1) for the Box–Behnken response surface methodology comprising 15 runs, where three of them are identical center points (A = 0, B = 0, and C = 0, middle levels, for runs 3, 9, and 14). These coded units were not accompanied by the actual or the uncoded units in the Materials and Methods section. They finally can be found, although indirectly, from the x- and y-axes labels of Figure 4a–c (page 9) [1], where, on one hand, A = 1–5 mM, B = 1–5 mM, and C = 30–60 min, or in other words, the middle levels for A must be 3 mM, for B = 3 mM, and for C = 45 min. This inconvenience must be corrected. On the other hand, the middle levels of A and B were stated to be 3 and 5 mM (page 10, lines 1–2 from the top). Therefore, these comparisons indicate that the middle level for B was not calculated correctly by Altaf et al.
These aforementioned issues result in more confusion when the regression equation is discussed. The authors used the second-order polynomial model (Equation (1)) for their model (Equation (2)), as shown below:
Y = β0 + β1A + β2B + β3C + β12AB + β13AC + β23BC + β11A2 + β22B2 + β33C2
Y(AgNPs size) = 230.981 − 50.208A − 1.00097 B + 2.895 C − 0.042 AB − 0.79 AC
− 0.00029 BC + 3.549 A2 + 0.0201 B2 + 0.224 C2
− 0.00029 BC + 3.549 A2 + 0.0201 B2 + 0.224 C2
When we checked Equations (1) and (2) against the center points (or with the conditions of A = B = C = 0, as shown in Table 1), then A = B = C = AB = AC = BC = A2 = B2 = C2 = 0. Therefore, the equations must yield Y = β0 or Y(AgNPs size) = 230.981 nm. However, in Table 1, the laboratory results of the AgNPs’ size did not exceed 40 nm, let alone 230 nm. Therefore, we expect that Equation (2) might be using uncoded units. However, with the aforementioned discrepancies of coded and uncoded units, the regression model in Equation (2) cannot be checked and verified. This issue must be corrected soon.
Finally, as highlighted in yellow in Table 1, the center points (A = B = C = 0, runs 3, 9, and 14) show different laboratory results (with AgNP sizes of 36.45, 32.6, and 25.55 nm, respectively). By performing a quick calculation, the average of these three values obtained from the laboratory is 31.5333 nm, with a standard deviation of 5.527 nm. This kind of broad inconsistency could somehow be tolerated for the laboratory-based experimental results. However, Altaf and coworkers’ prediction using the Box–Behnken regression calculation for the three identical center points (runs 3, 9, and 14) does not provide identical AgNP dimensions, i.e., 37, 32.3, and 22.36 nm, respectively (or an average of 30.5333 nm, and standard deviation of 7.477 nm). On the contrary, our prediction (as shown in Equation (3)) for the three identical center points shows that the predicted size of AgNPs is, in fact, 31.5333 nm (matching the average laboratory-based value), with a standard deviation of 0.0 nm. This discrepancy must be rectified.
Y(coded values) = 31.5333 − 2.16375A − 0.56875B − 3.7825C − 1.5575AB −0.73 AC
−0.385BC − 3.03542 A2 − 3.39042 B2 − 1.80292 C2
−0.385BC − 3.03542 A2 − 3.39042 B2 − 1.80292 C2
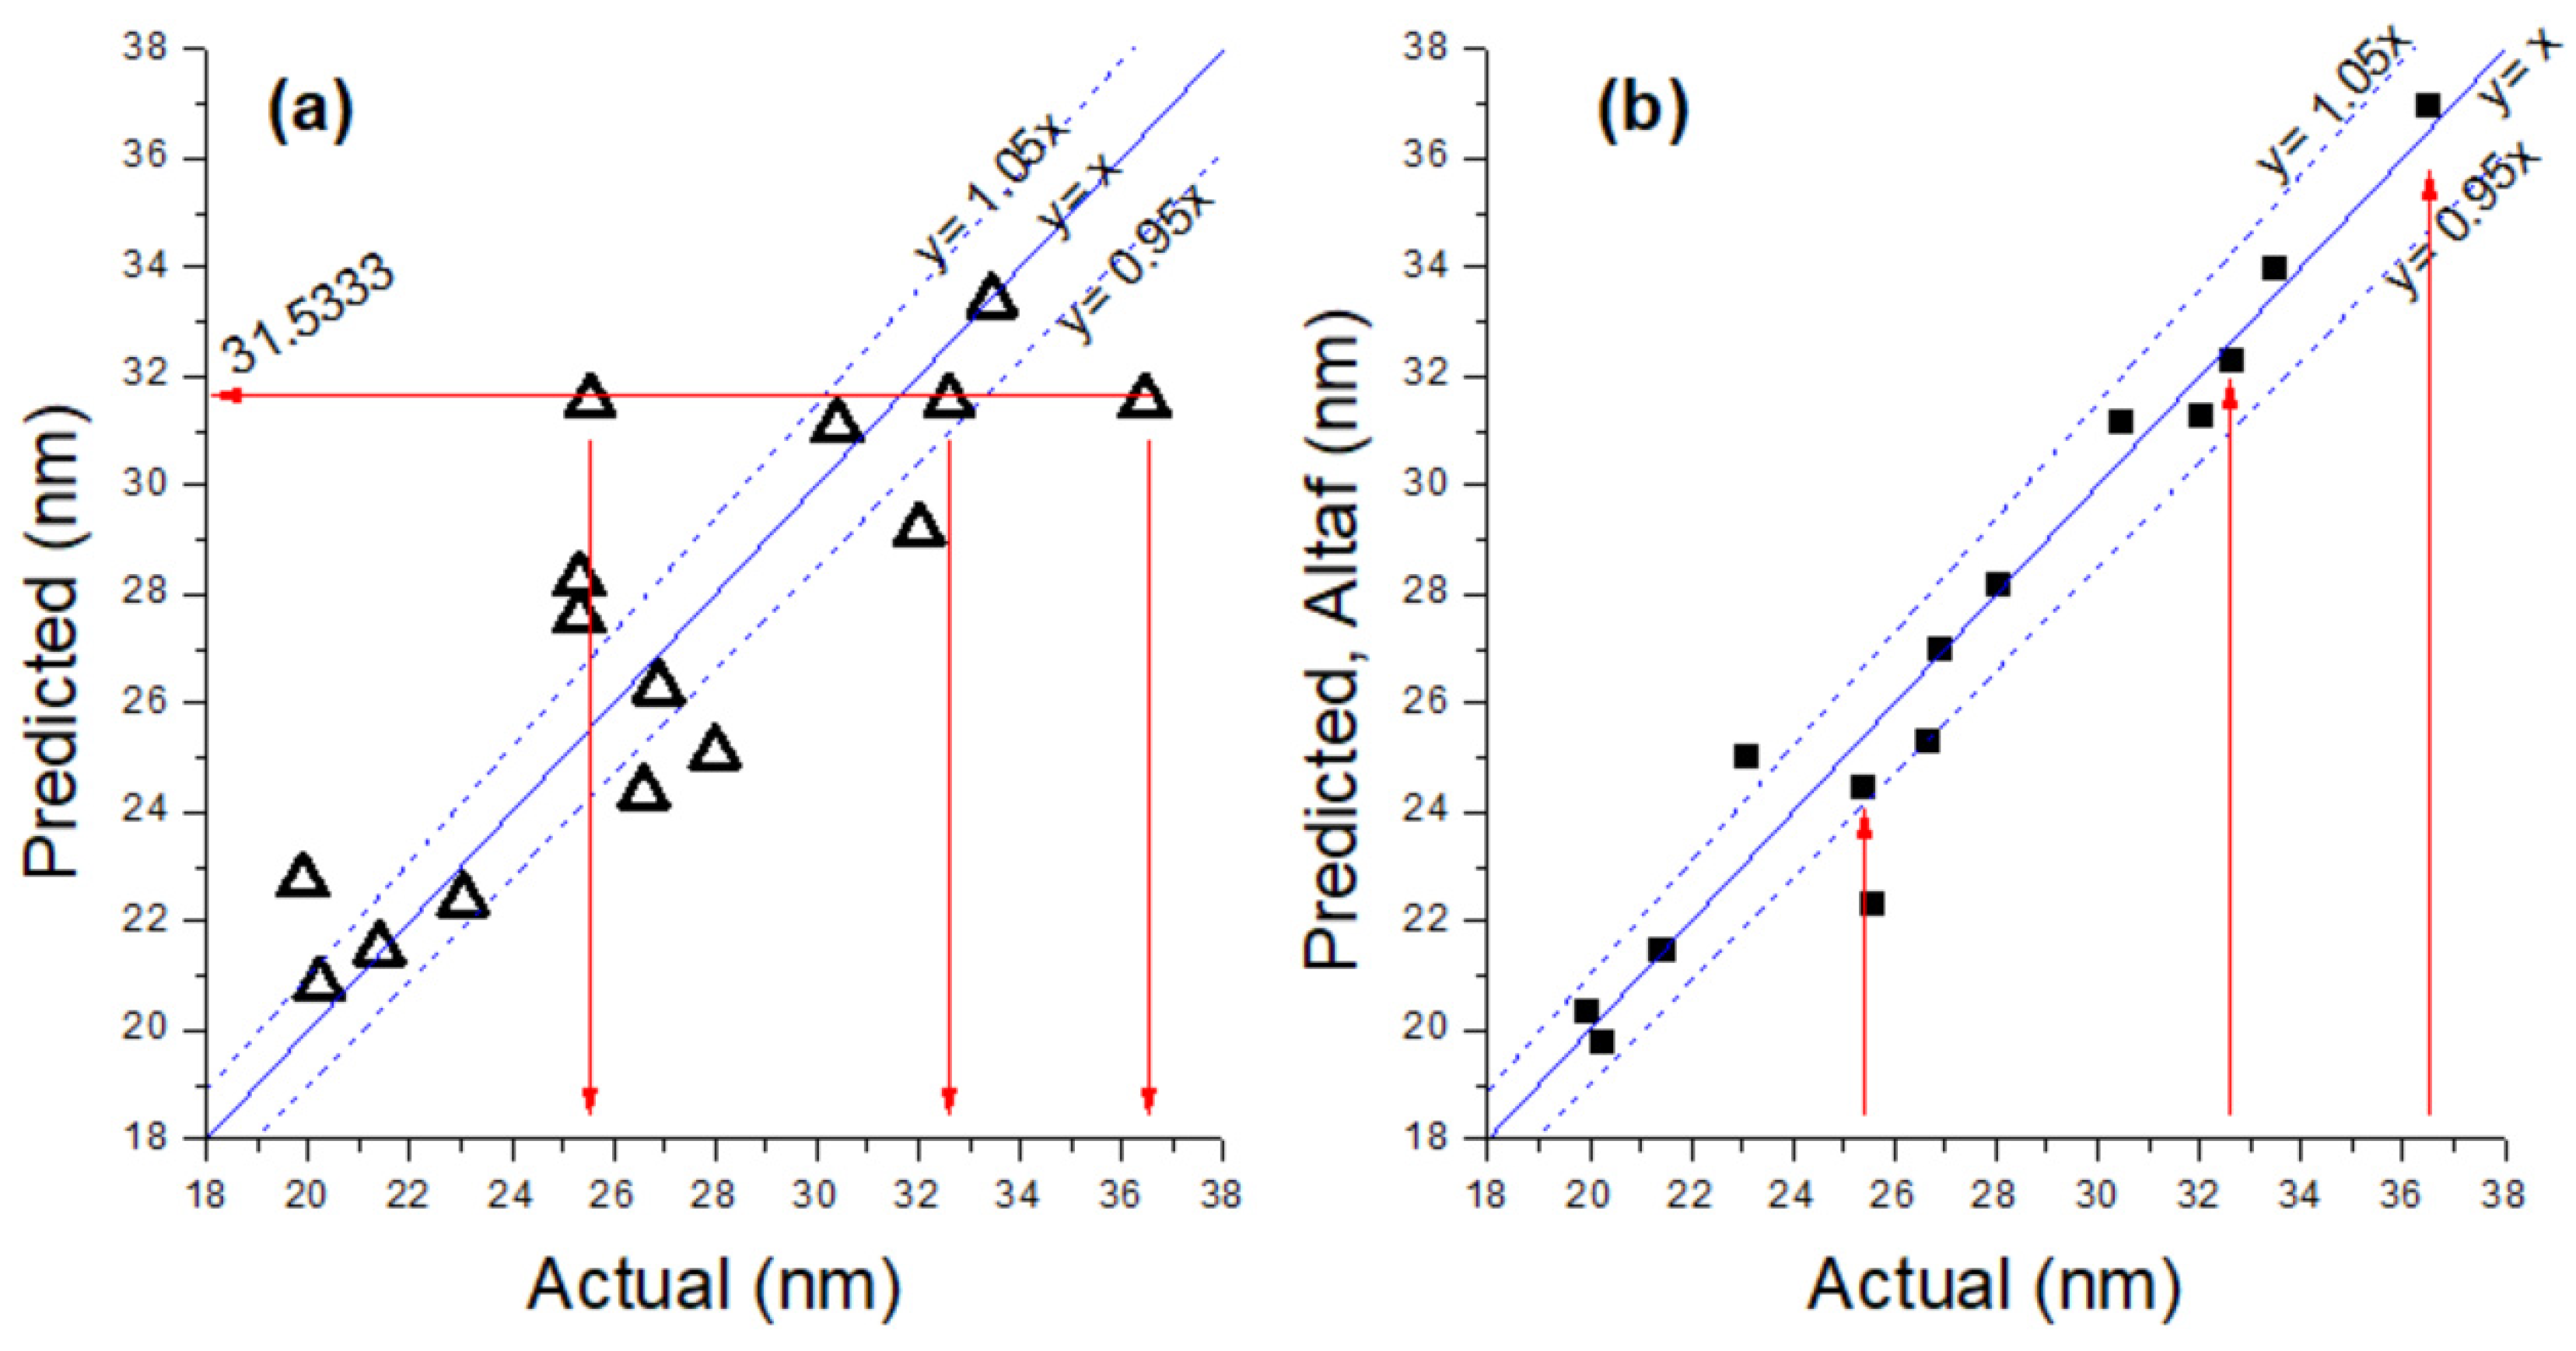
To show how realistic our regression model is vs. Altaf and coworkers’, we made a parity plot, as shown in Figure 1. Our parity plot in Figure 1a shows the different AgNP sizes recorded in Table 1 with runs 3, 9, and 14 (center points, with A = B = C = 0) modeled to one value of 31.5333 nm. On the other hand, the parity plot for the work by Altaf et al. (Figure 4b) shows that different values of the center points (runs 3, 9, and 14) are not modeled to a single value. This is very unrealistic, especially when the regression model falsely claims that it matches almost all the predicted values within the range of a ±5% error.
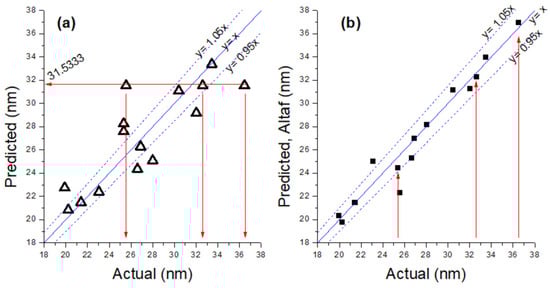
Figure 1.
Parity plot of actual values against predicted values, guided with y = x, y = 0.95x, and y = 1.05x, representing a matching level of 100%, 95%, and 105%, respectively, for (a) our parity plot (△), and (b) that of Altaf and coworkers (■).
Besides this critical statistical problem, there are other issues based on the comments from a reviewer with high attention to detail to the original manuscript by Altaf and coworkers [1]. In Table 4 (page 14) [1], the difference in the size of the particles is very large, where those measured using XRD are 19–33 nm, while those measured via SEM are 82–102 nm. Moreover, the UV-vis peak of the AgNPs (20–80 nm) purchased by the reviewer has a maximum peak of UV-vis spectroscopy from 395 (AgNPs 20 nm) to 466 nm (AgNPs 80 nm). However, in Altaf and coworkers’ paper (Figure 4 and page 12), for the AgNPsat19.8 nm, the claimed peak is 468 nm, which leads to some uncertainty. In addition to those aforementioned issues, typographical errors are also found and shown in Table 2. These errors are essential to be revised.
Table 2.
Typographical errors found in Altaf et al [1].
2. Conclusions
In this note, we point out these serious issues that need to be clarified and revised heavily for the statistical parts, as well as several writing errors, in order to uphold the standard of scientific publications.
Funding
This research received no external funding.
Conflicts of Interest
The author declares no conflicts of interest.
References
- Altaf, N.U.H.; Naz, M.Y.; Shukrullah, S.; Ghamkhar, M.; Irfan, M.; Rahman, S.; Jakubowski, T.; Alqurashi, E.A.; Glowacz, A.; Mahnashi, M.H. Non-Thermal Plasma Reduction of Ag+ Ions into Silver Nanoparticles in Open Atmosphere under Statistically Optimized Conditions for Biological and Photocatalytic Applications. Materials 2022, 15, 3826. [Google Scholar] [CrossRef] [PubMed]
- Mangindaan, D.; Kuo, W.-H.; Wang, M.-J. Two-dimensional amine-functionality gradient by plasma polymerization. Biochem. Eng. J. 2013, 78, 198–204. [Google Scholar] [CrossRef]
- Mangindaan, D.; Kuo, W.-H.; Kurniawan, H.; Wang, M.-J. Creation of biofunctionalized plasma polymerized allylamine gradients. J. Polym. Sci. Part B Polym. Phys. 2013, 51, 1361–1367. [Google Scholar] [CrossRef]
- Mangindaan, D.; Chen, C.-T.; Wang, M.-J. Integrating sol–gel with cold plasmas modified porous polycaprolactone membranes for the drug-release of silver-sulfadiazine and ketoprofen. Appl. Surf. Sci. 2012, 262, 114–119. [Google Scholar] [CrossRef]
- Mangindaan, D.; Kuo, C.-C.; Lin, S.-Y.; Wang, M.-J. The diffusion-reaction model on the wettability gradient created by SF6 plasma. Plasma Process. Polym. 2012, 9, 808–819. [Google Scholar] [CrossRef]
Disclaimer/Publisher’s Note: The statements, opinions and data contained in all publications are solely those of the individual author(s) and contributor(s) and not of MDPI and/or the editor(s). MDPI and/or the editor(s) disclaim responsibility for any injury to people or property resulting from any ideas, methods, instructions or products referred to in the content. |
© 2024 by the author. Licensee MDPI, Basel, Switzerland. This article is an open access article distributed under the terms and conditions of the Creative Commons Attribution (CC BY) license (https://creativecommons.org/licenses/by/4.0/).