
New Method for Determining Mode-I Static Fracture Toughness of Coal Using Particles


Abstract
:1. Introduction
2. Relationship between Fracture Toughness and Hardness Coefficient
3. Materials and Methods
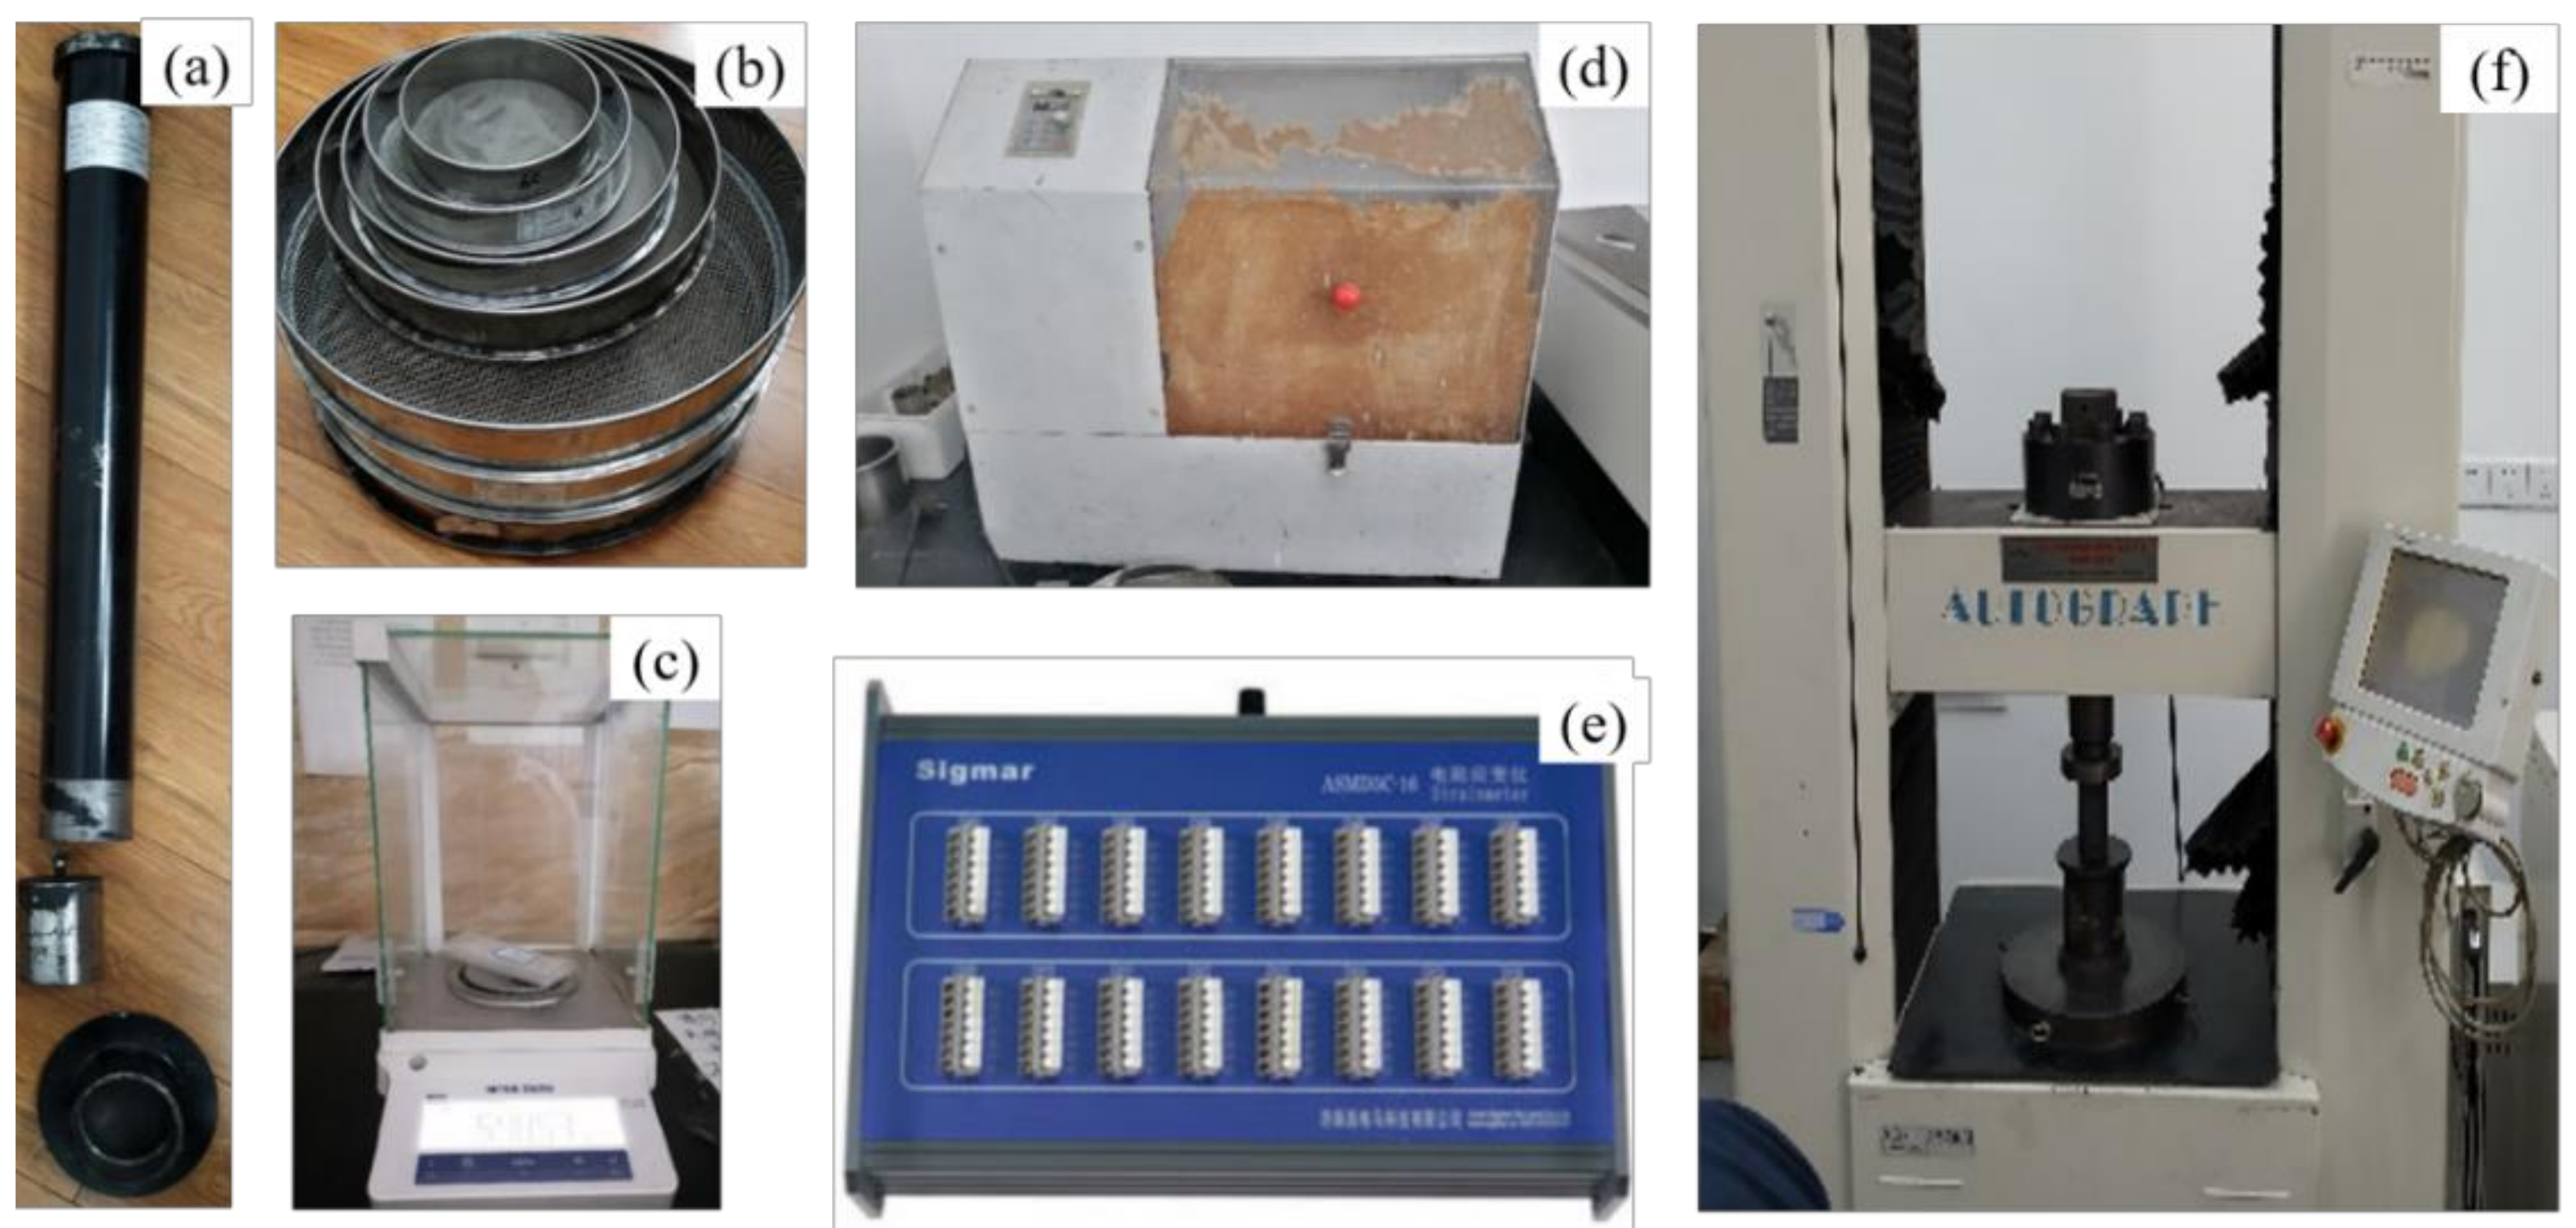
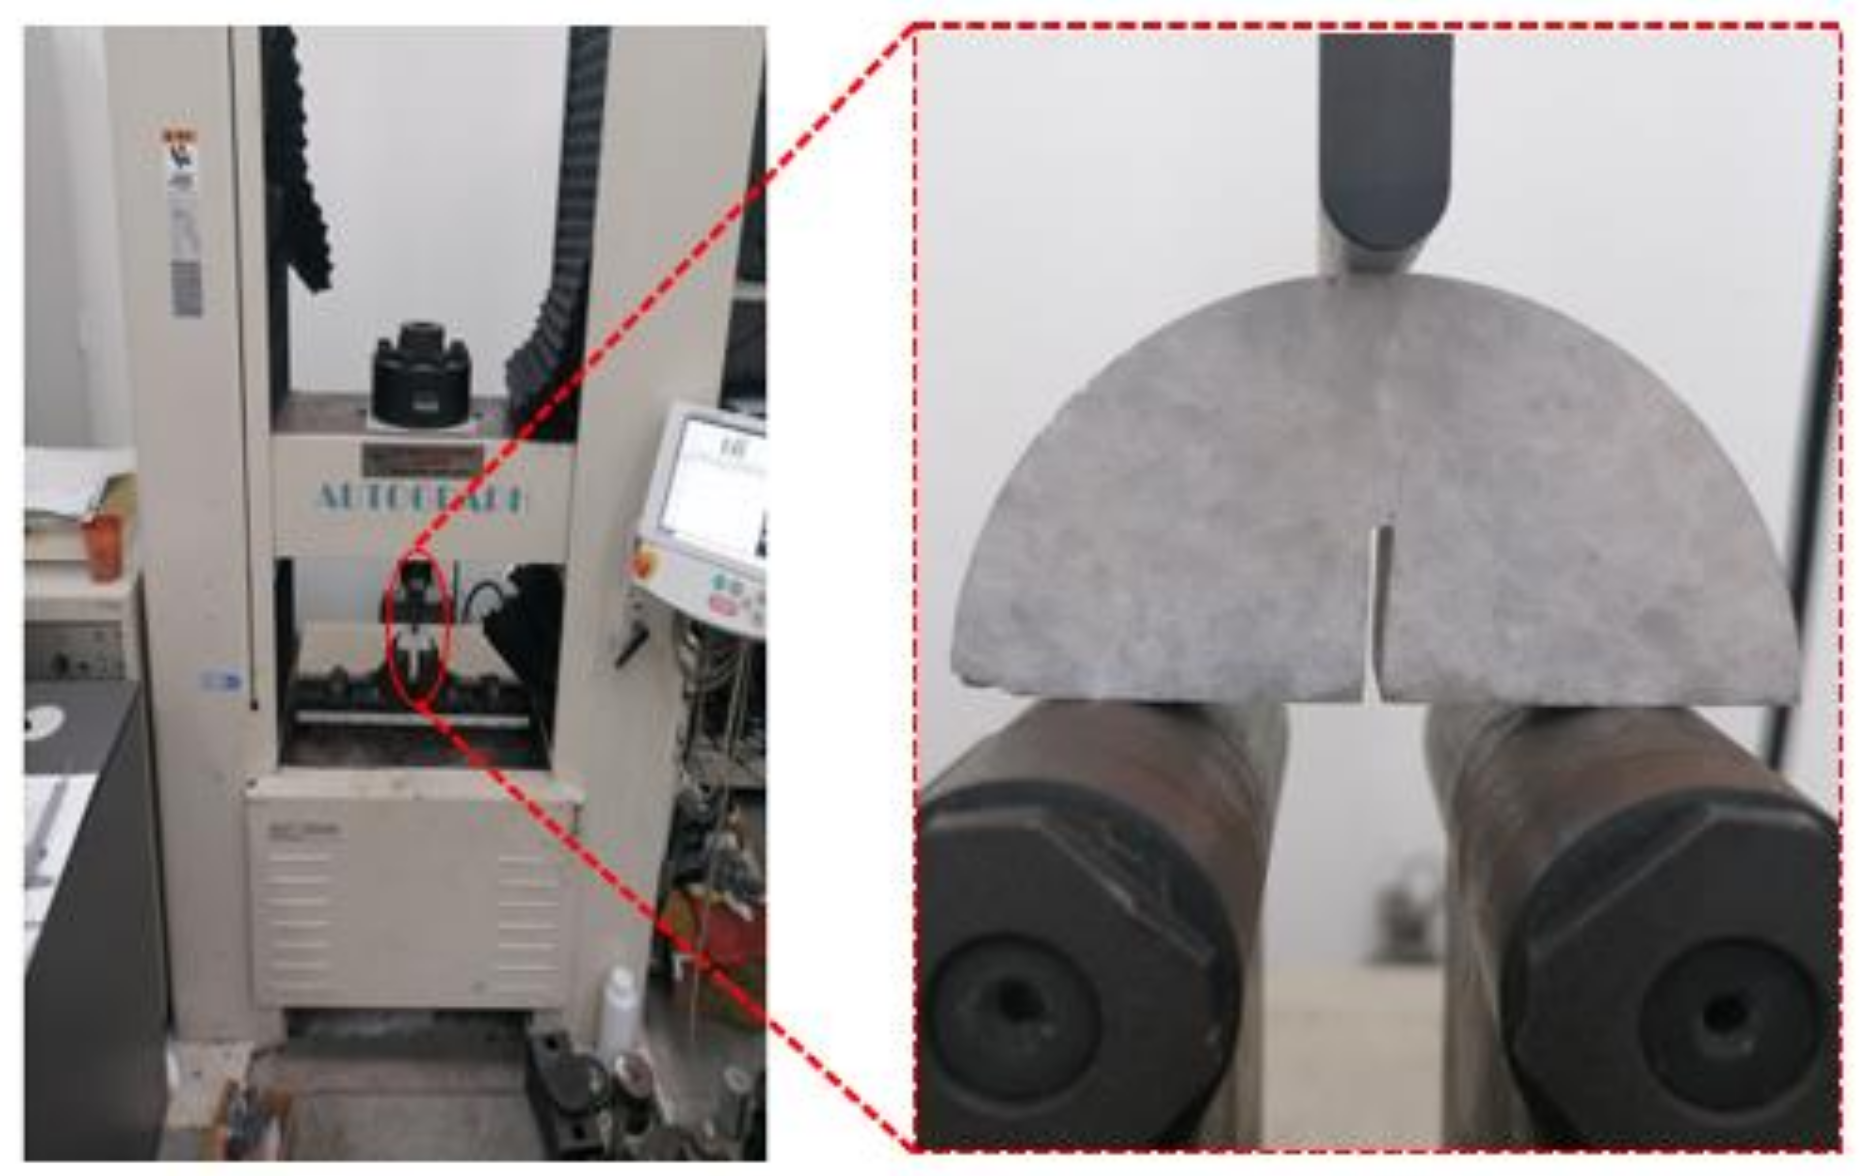
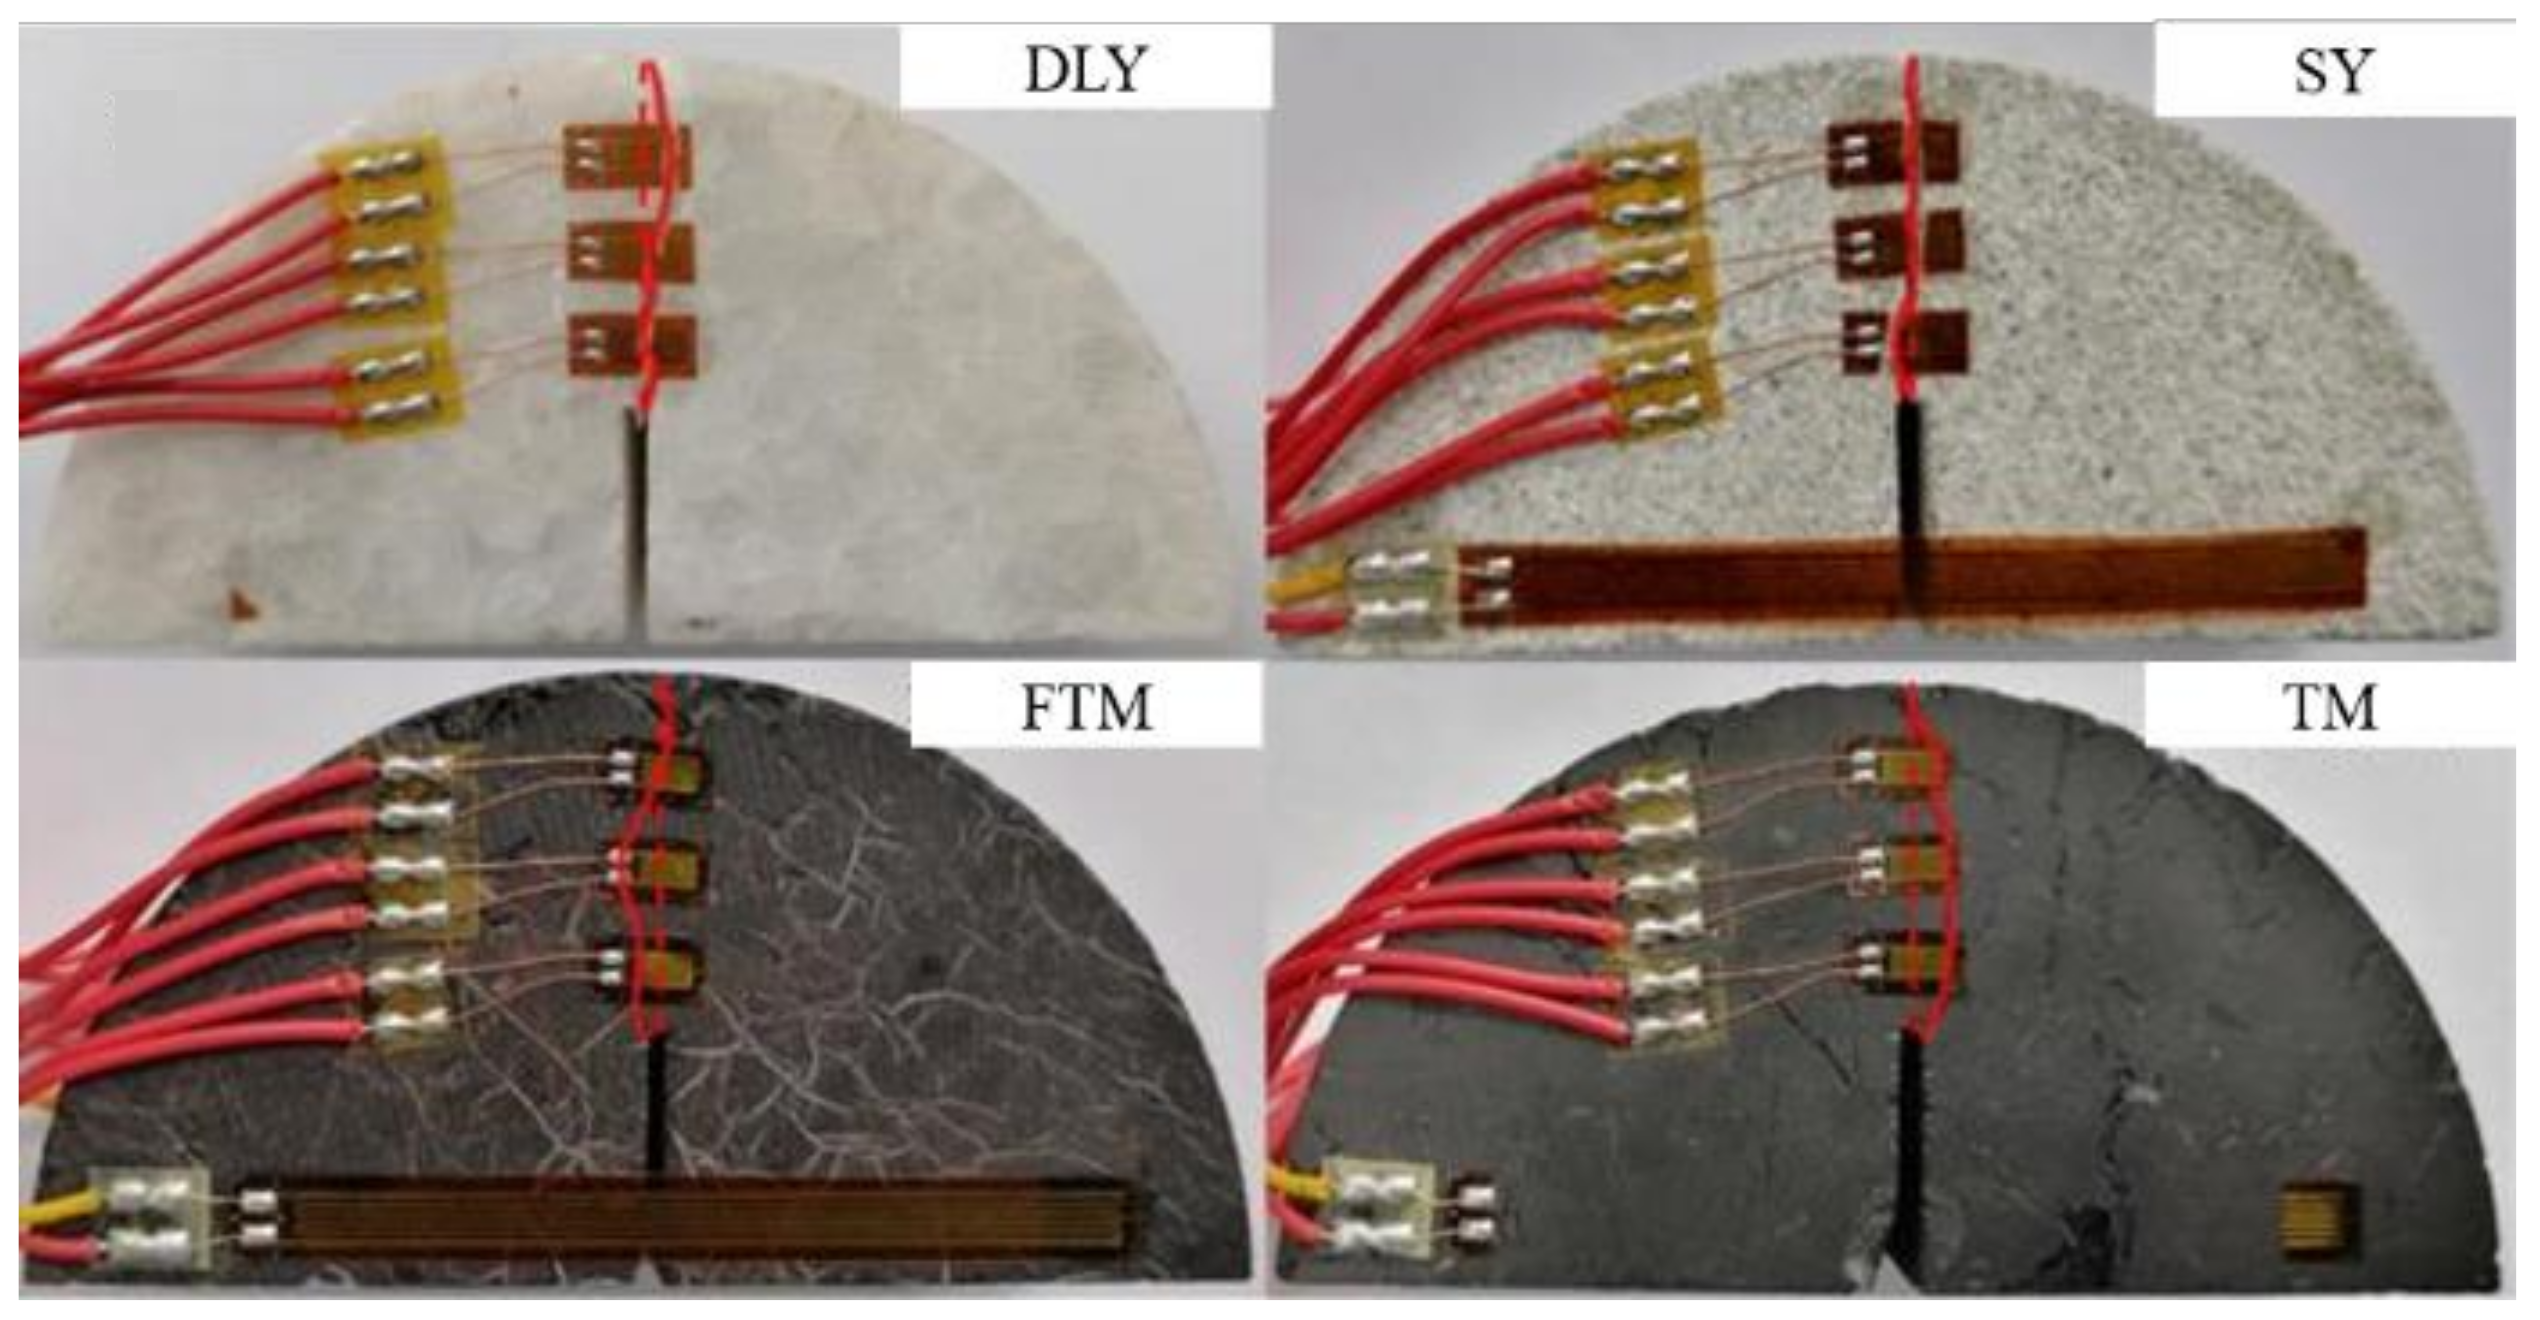
3.1. Sample Preparation and Equipment
3.2. Experimental Procedure
- Drop weight experiment
- Grinding experiment
- Mechanical properties of coal and rock
- The experimental procedures for measuring the uniaxial compressive strength, elastic modulus and Poisson’s ratio utilize a Φ50 × 100 standard cylindrical specimen. These procedures follow the “(GB/T 23561.7-2009) [43]” and “(GB/T 23561.8-2009) [44]”. Displacement control was employed during loading, with a loading rate set at 0.1 mm/min.
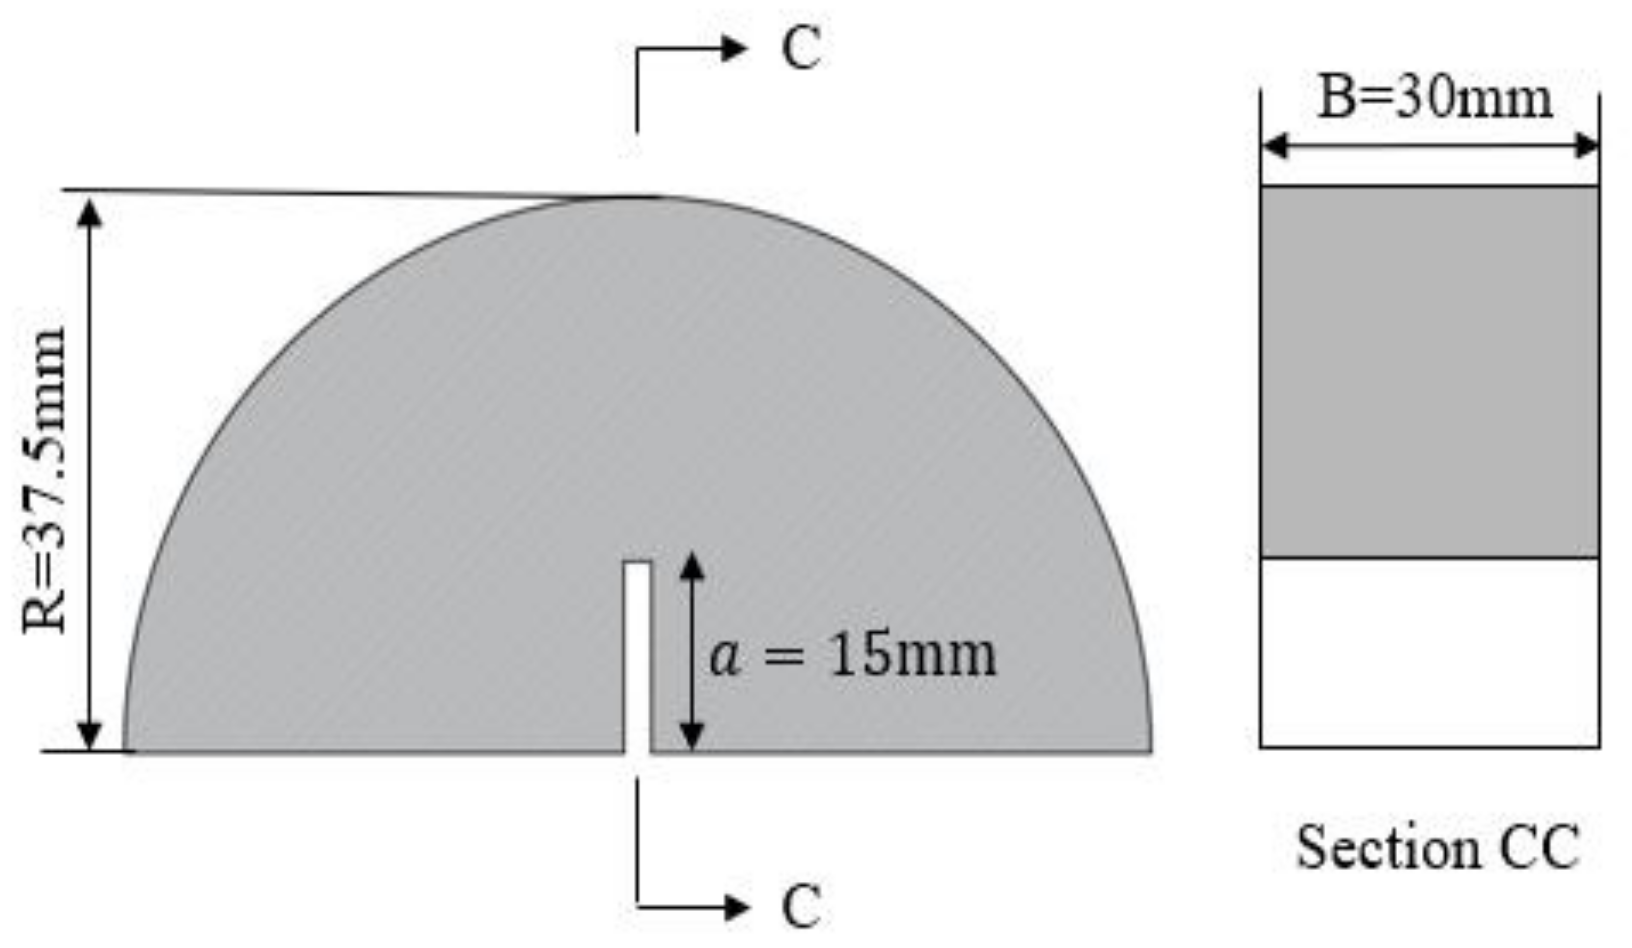
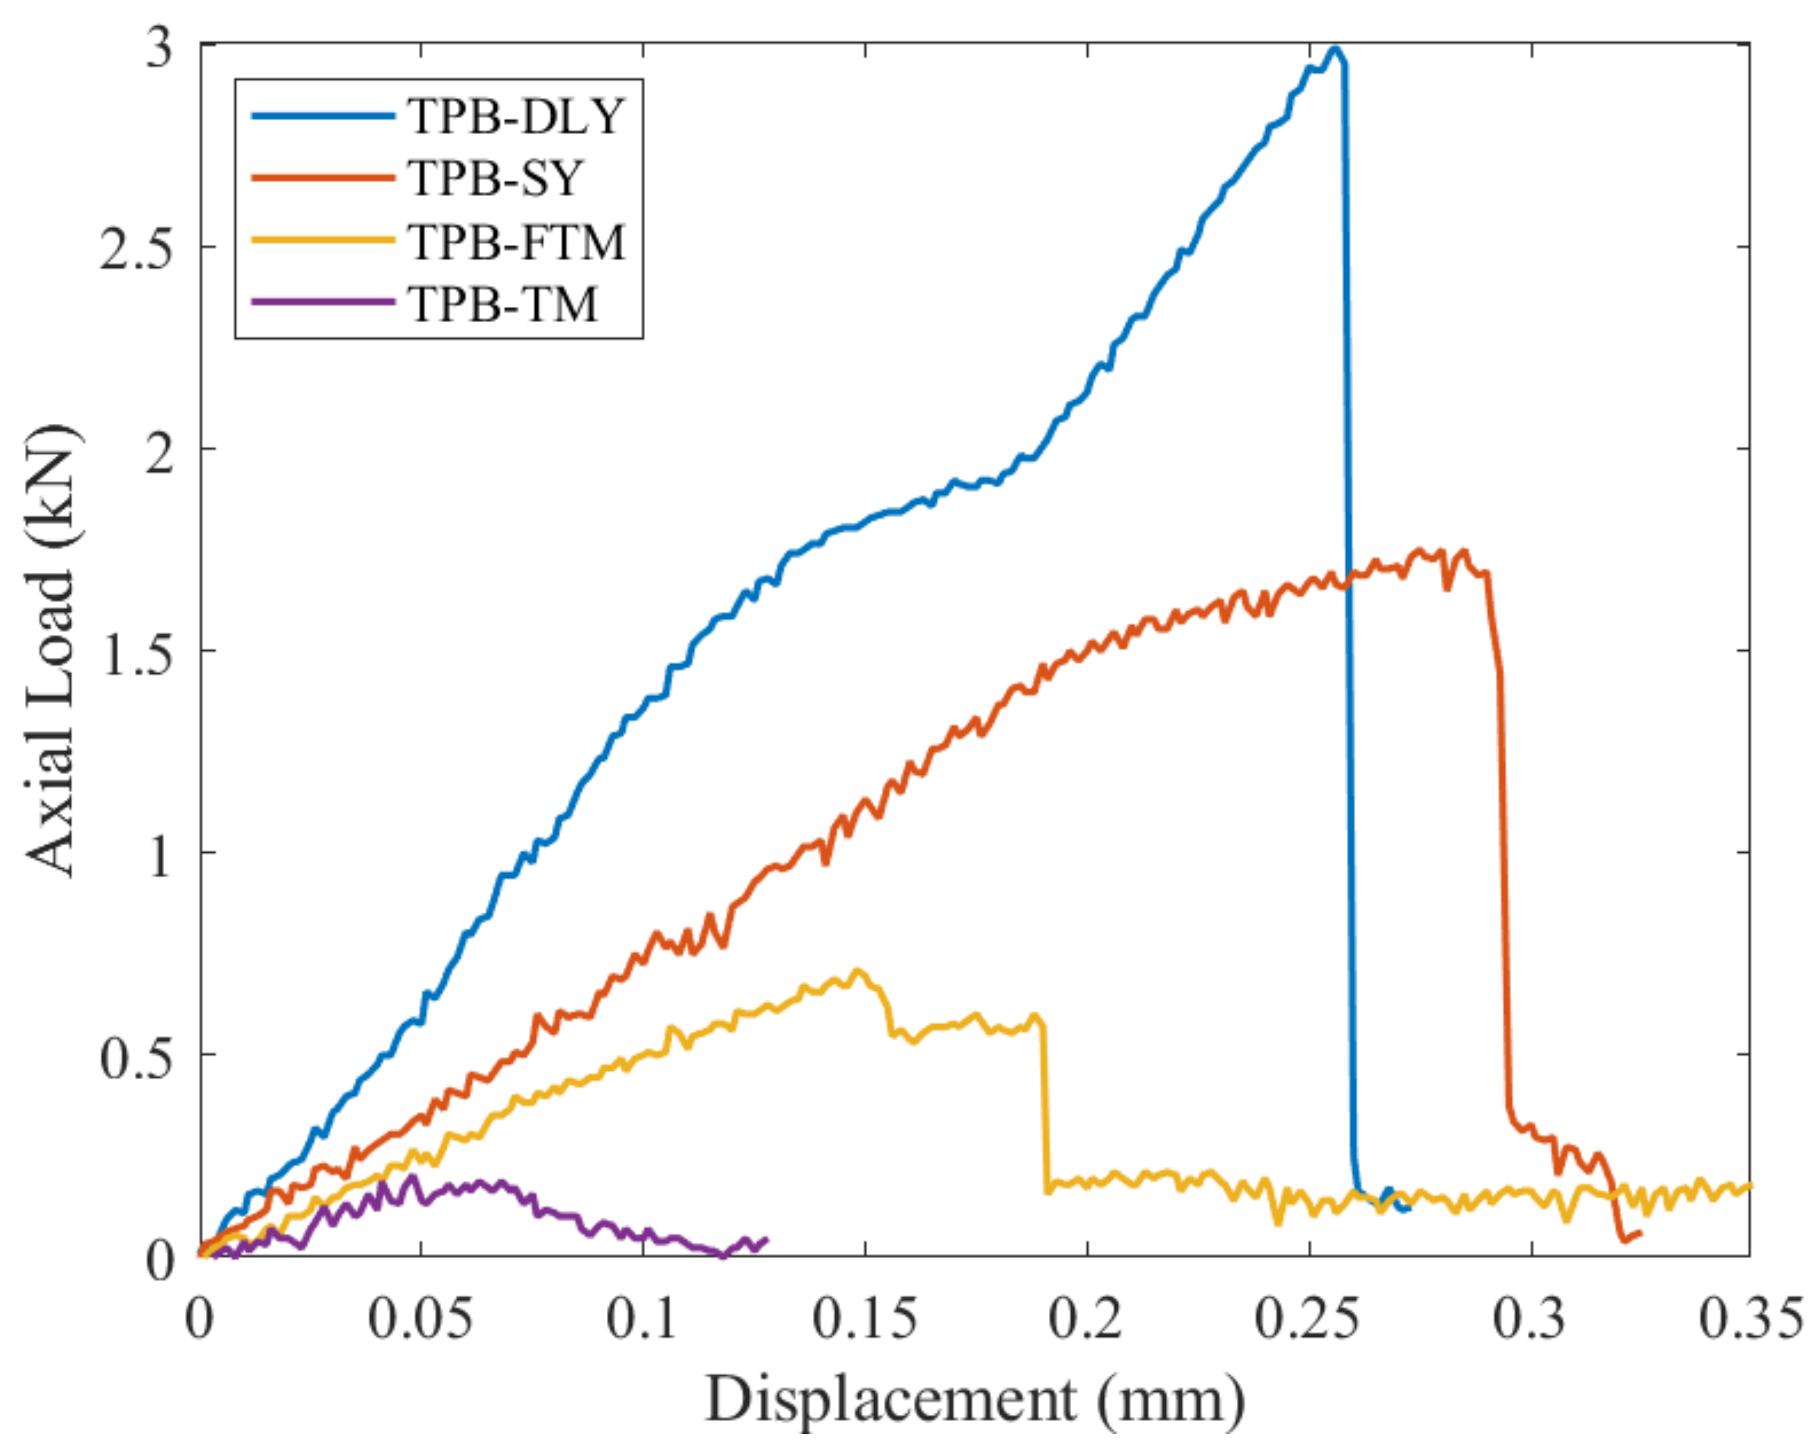
- Three-point bending experiment
4. Results
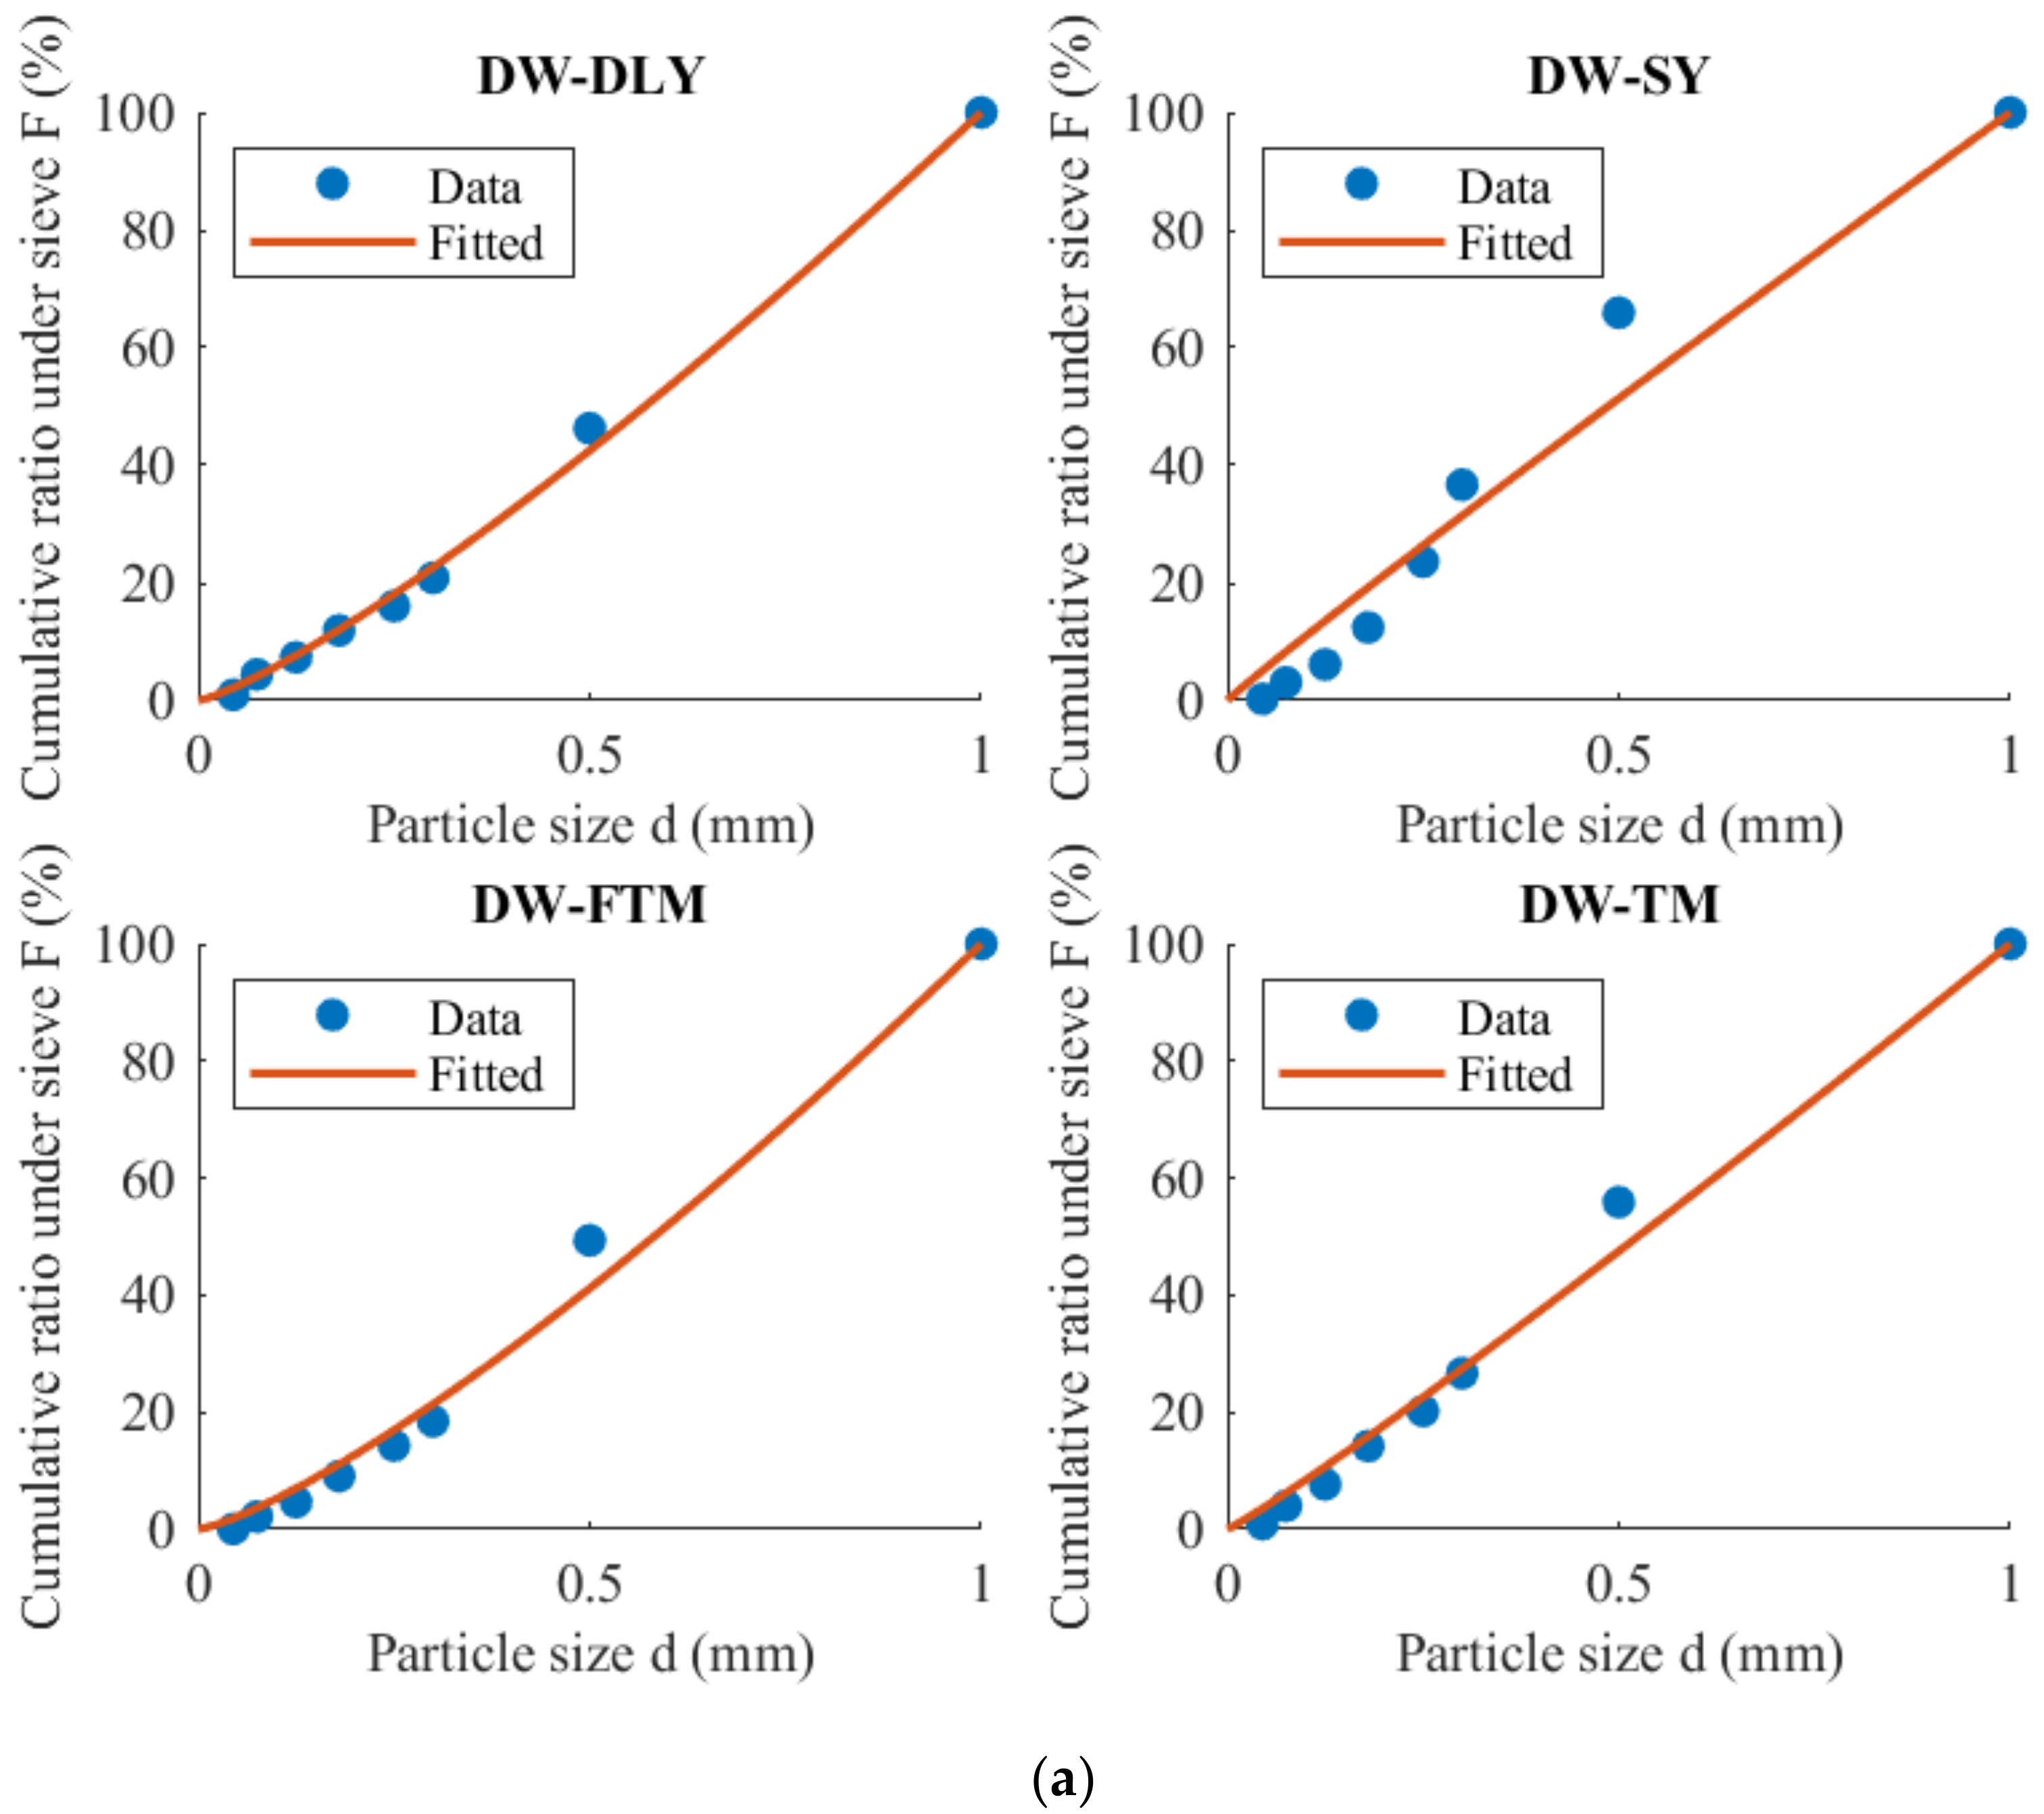
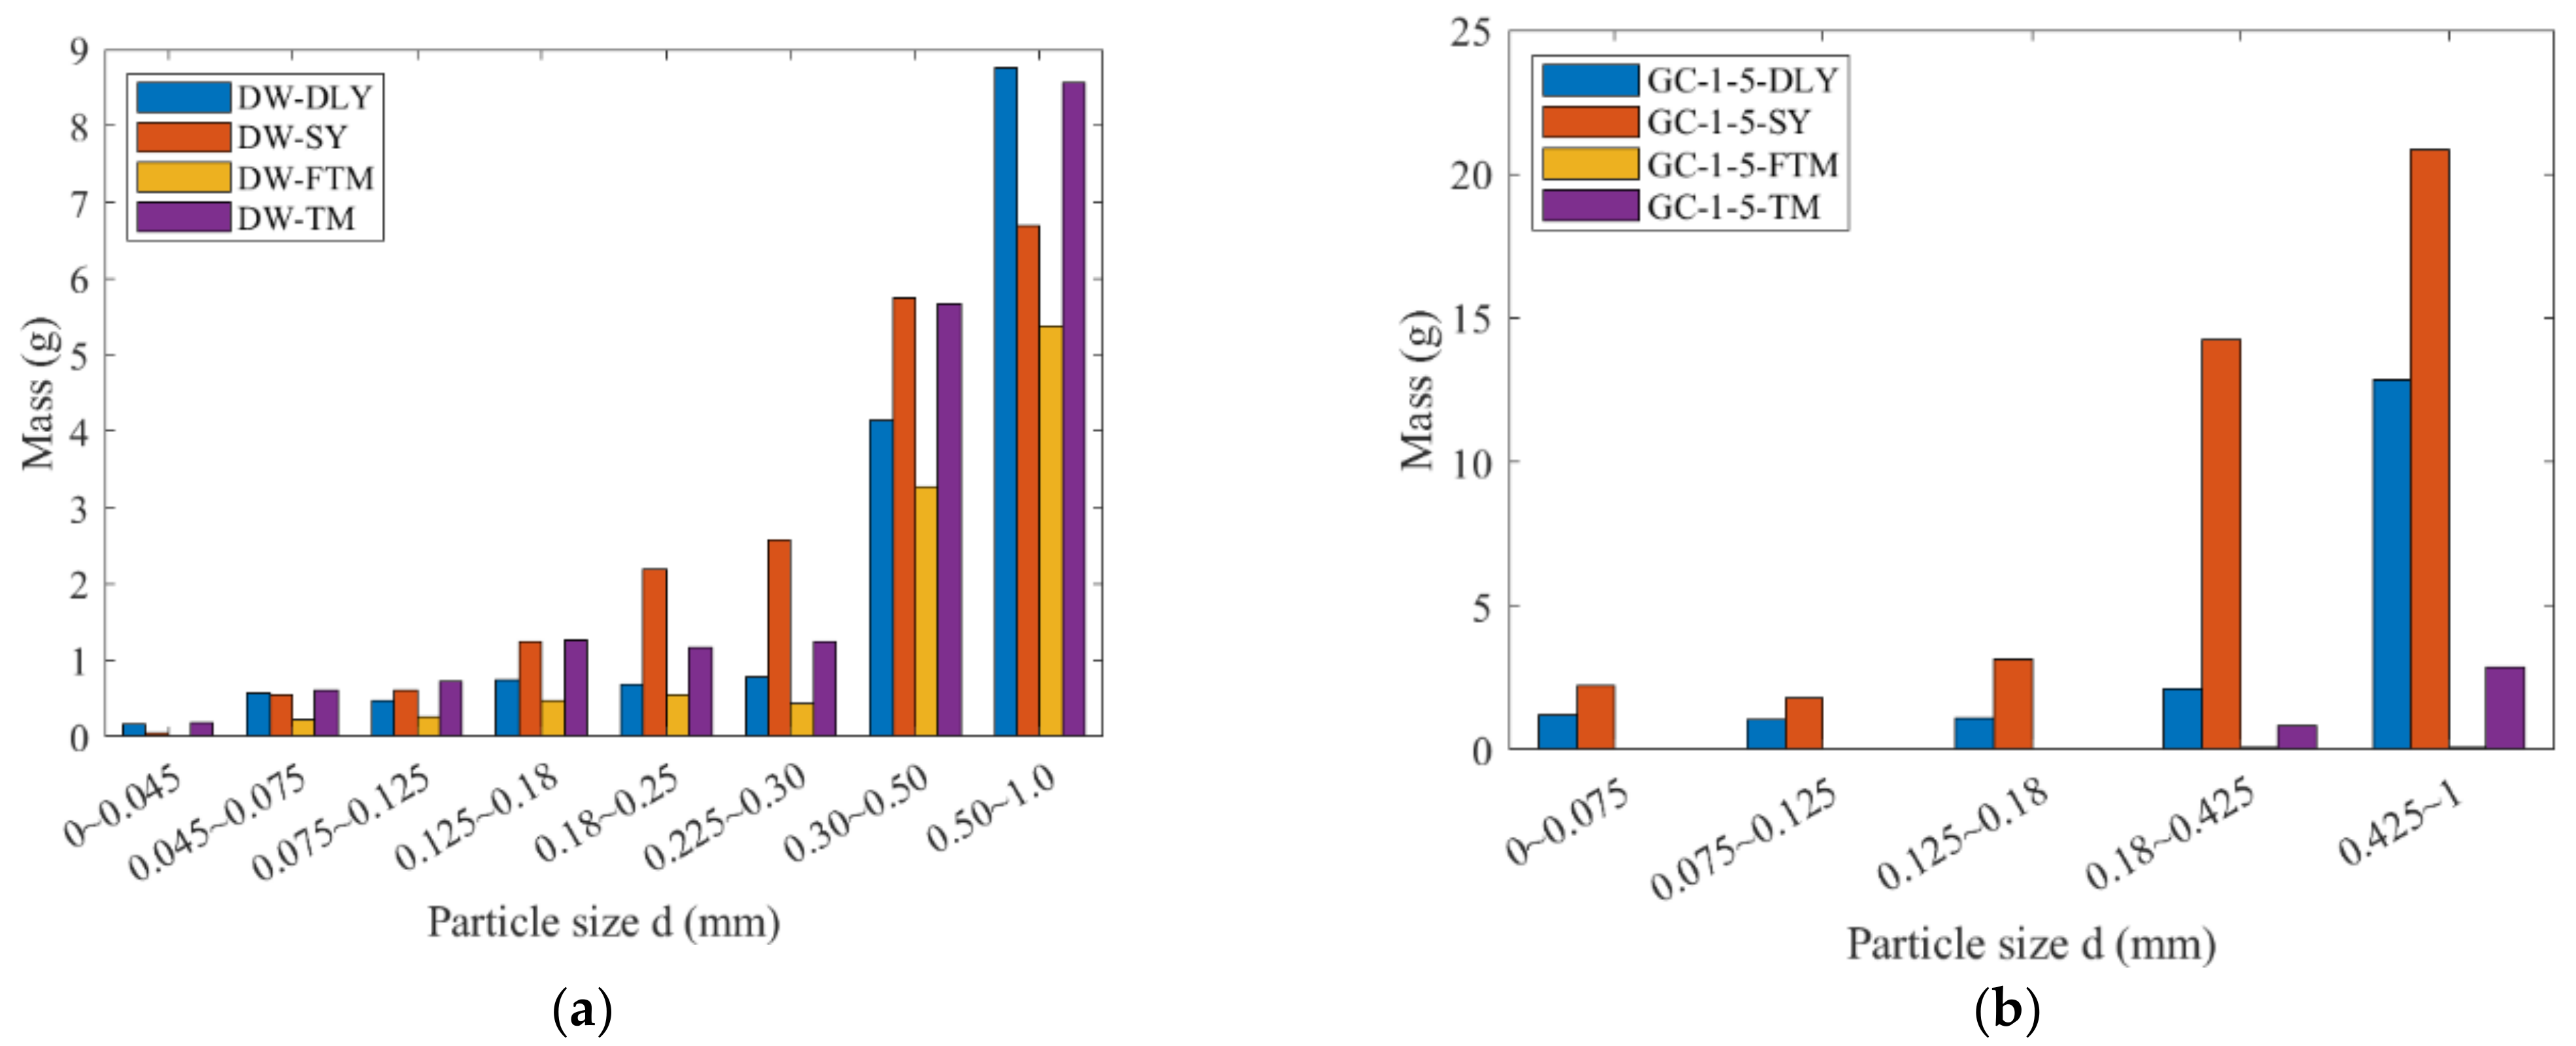
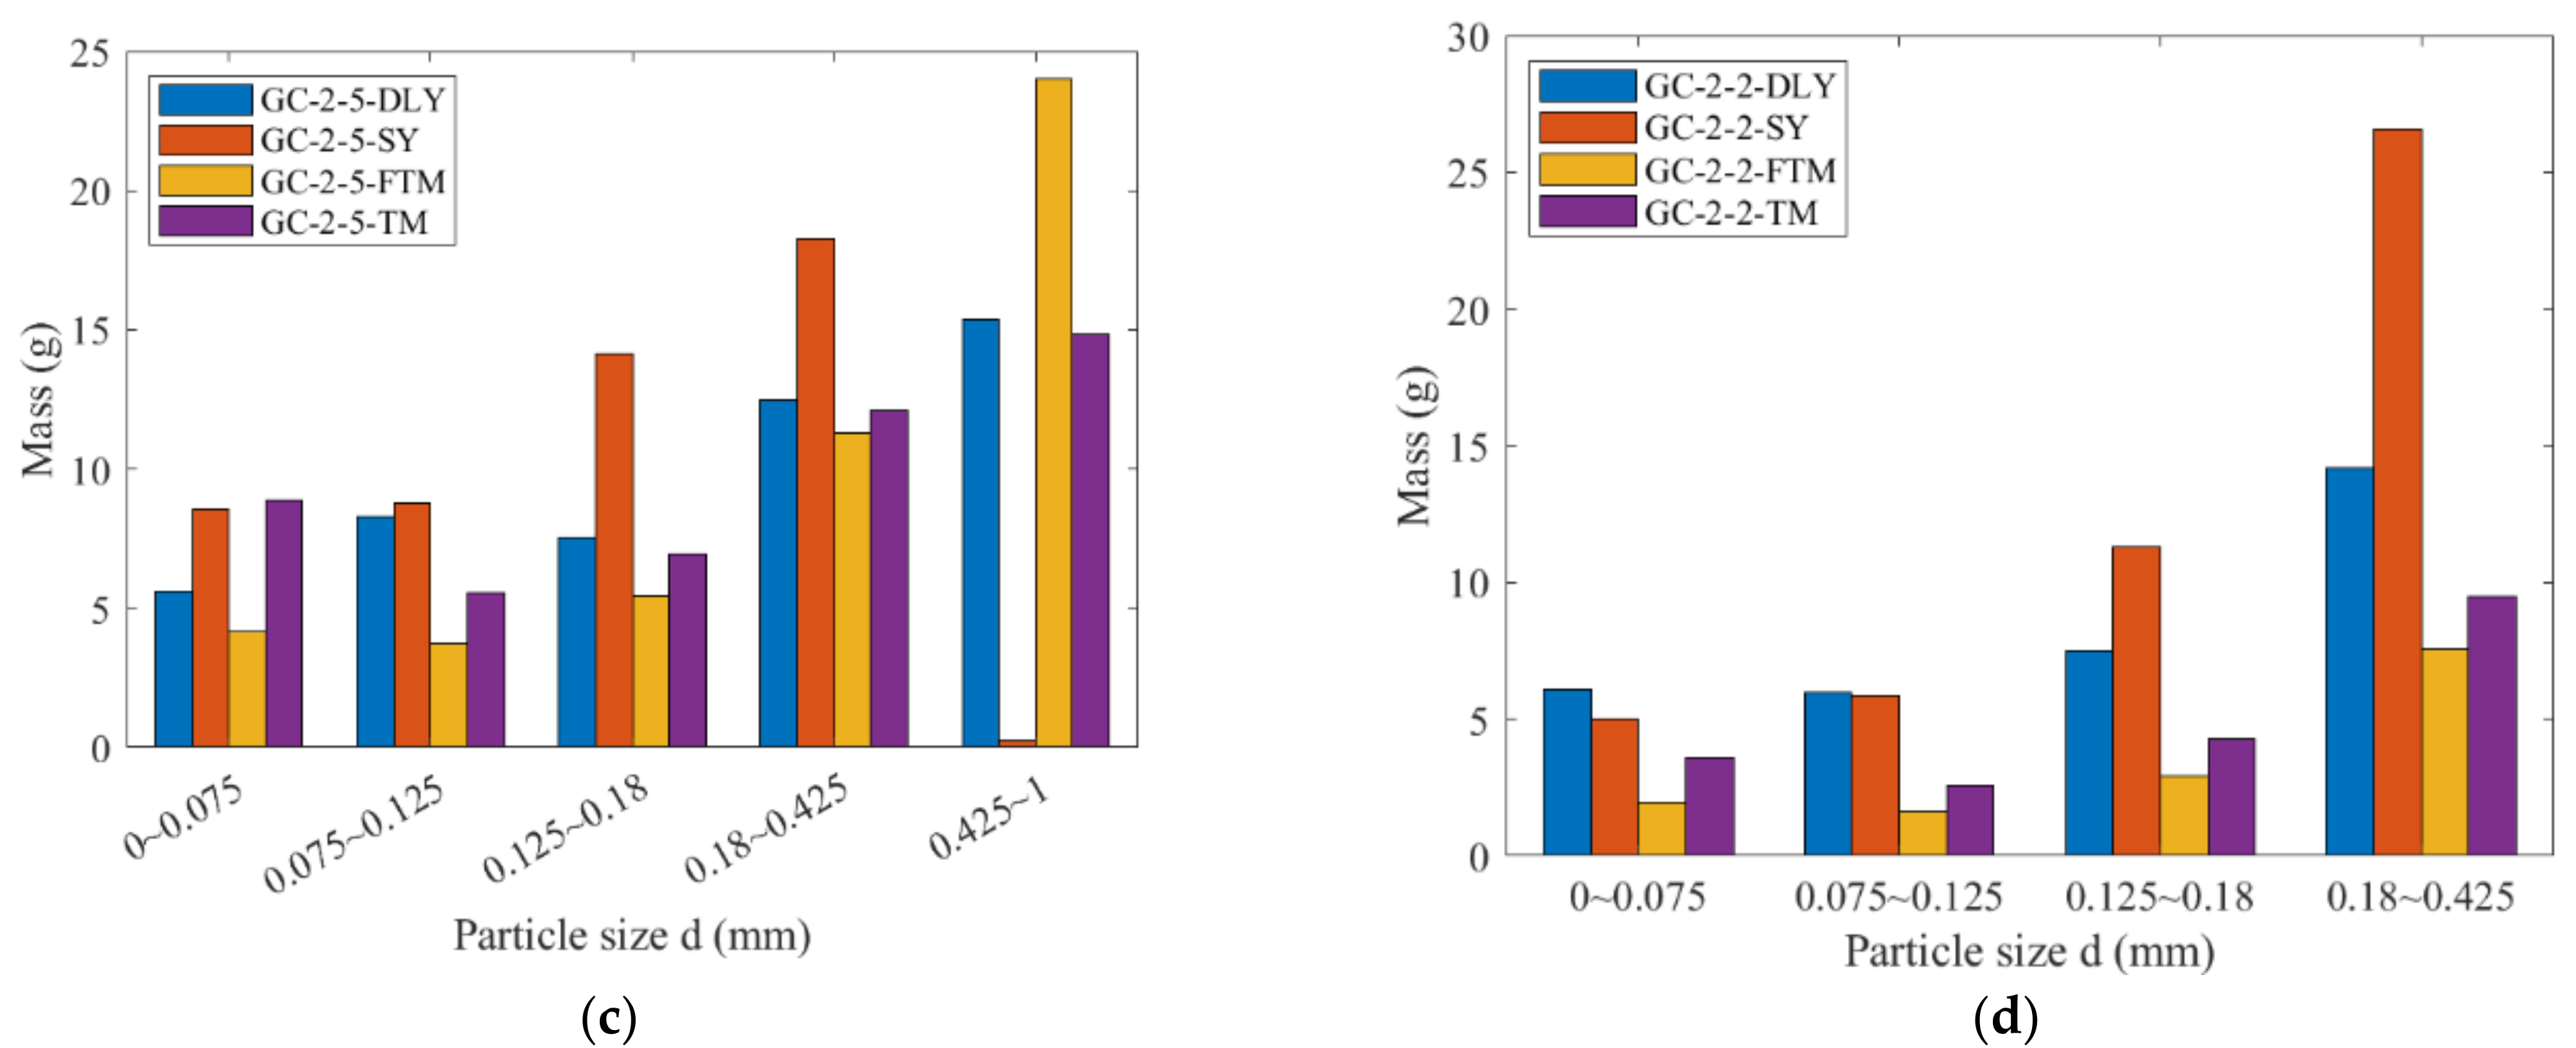
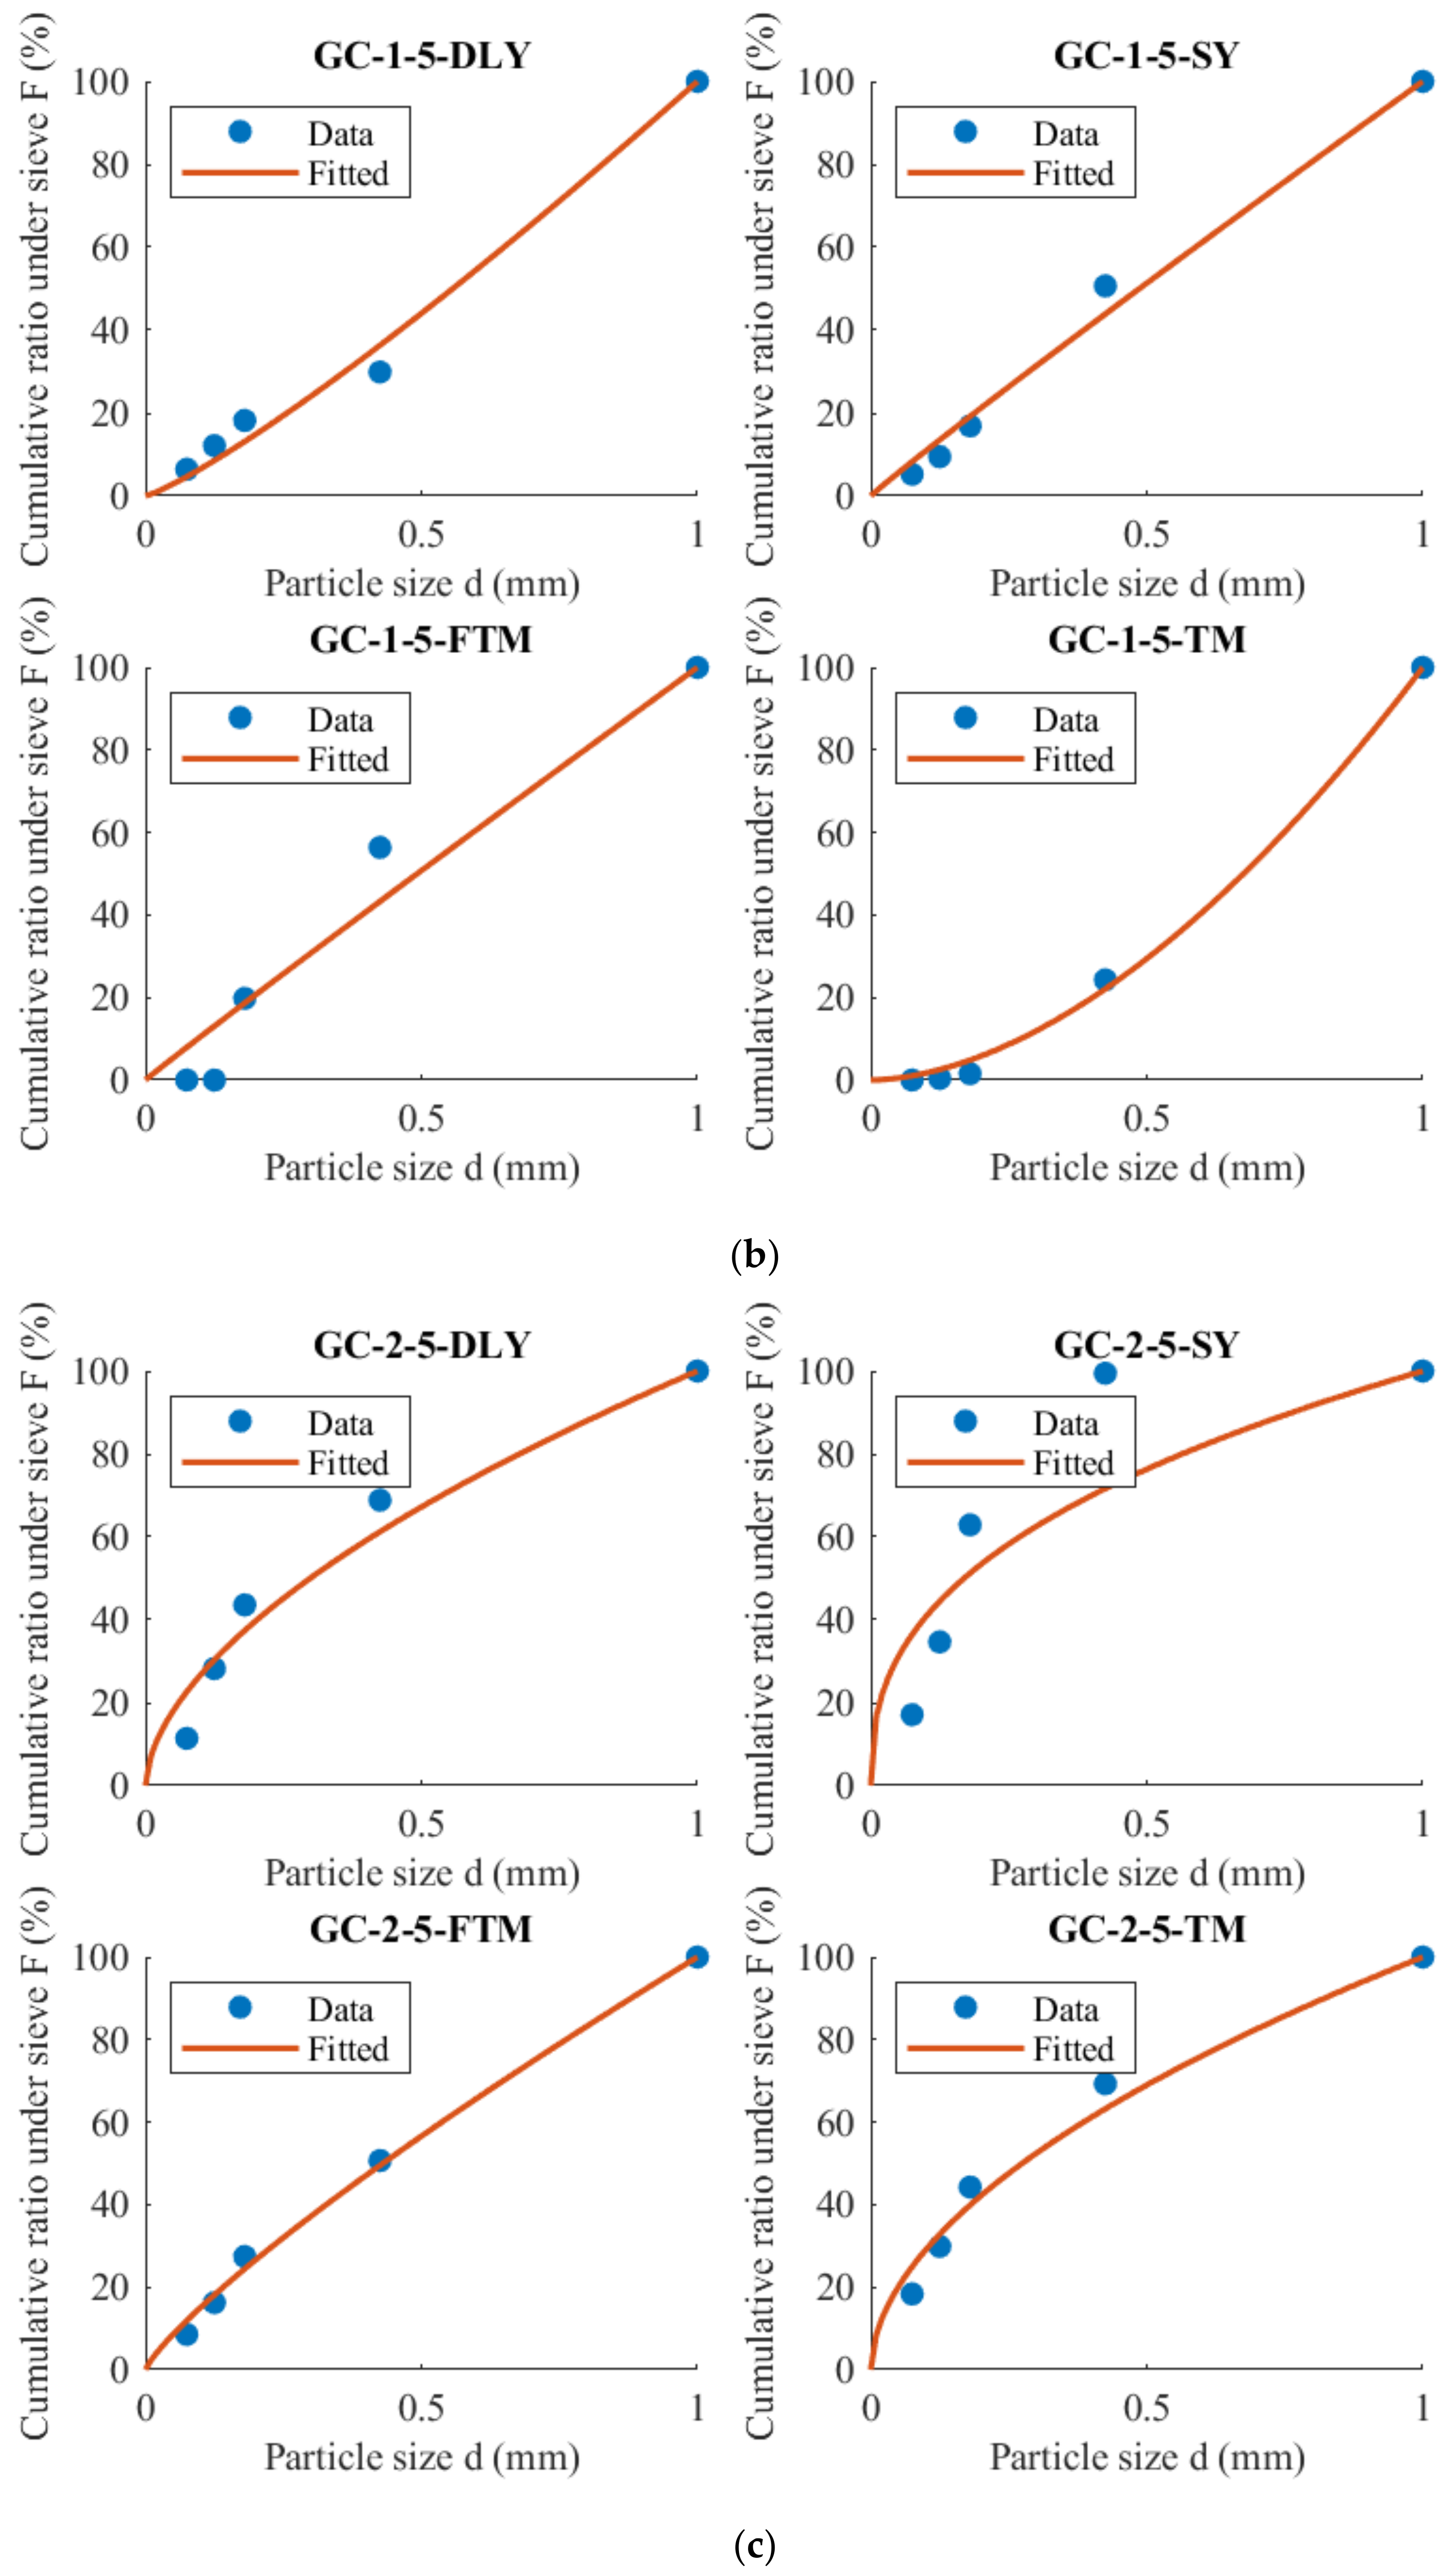
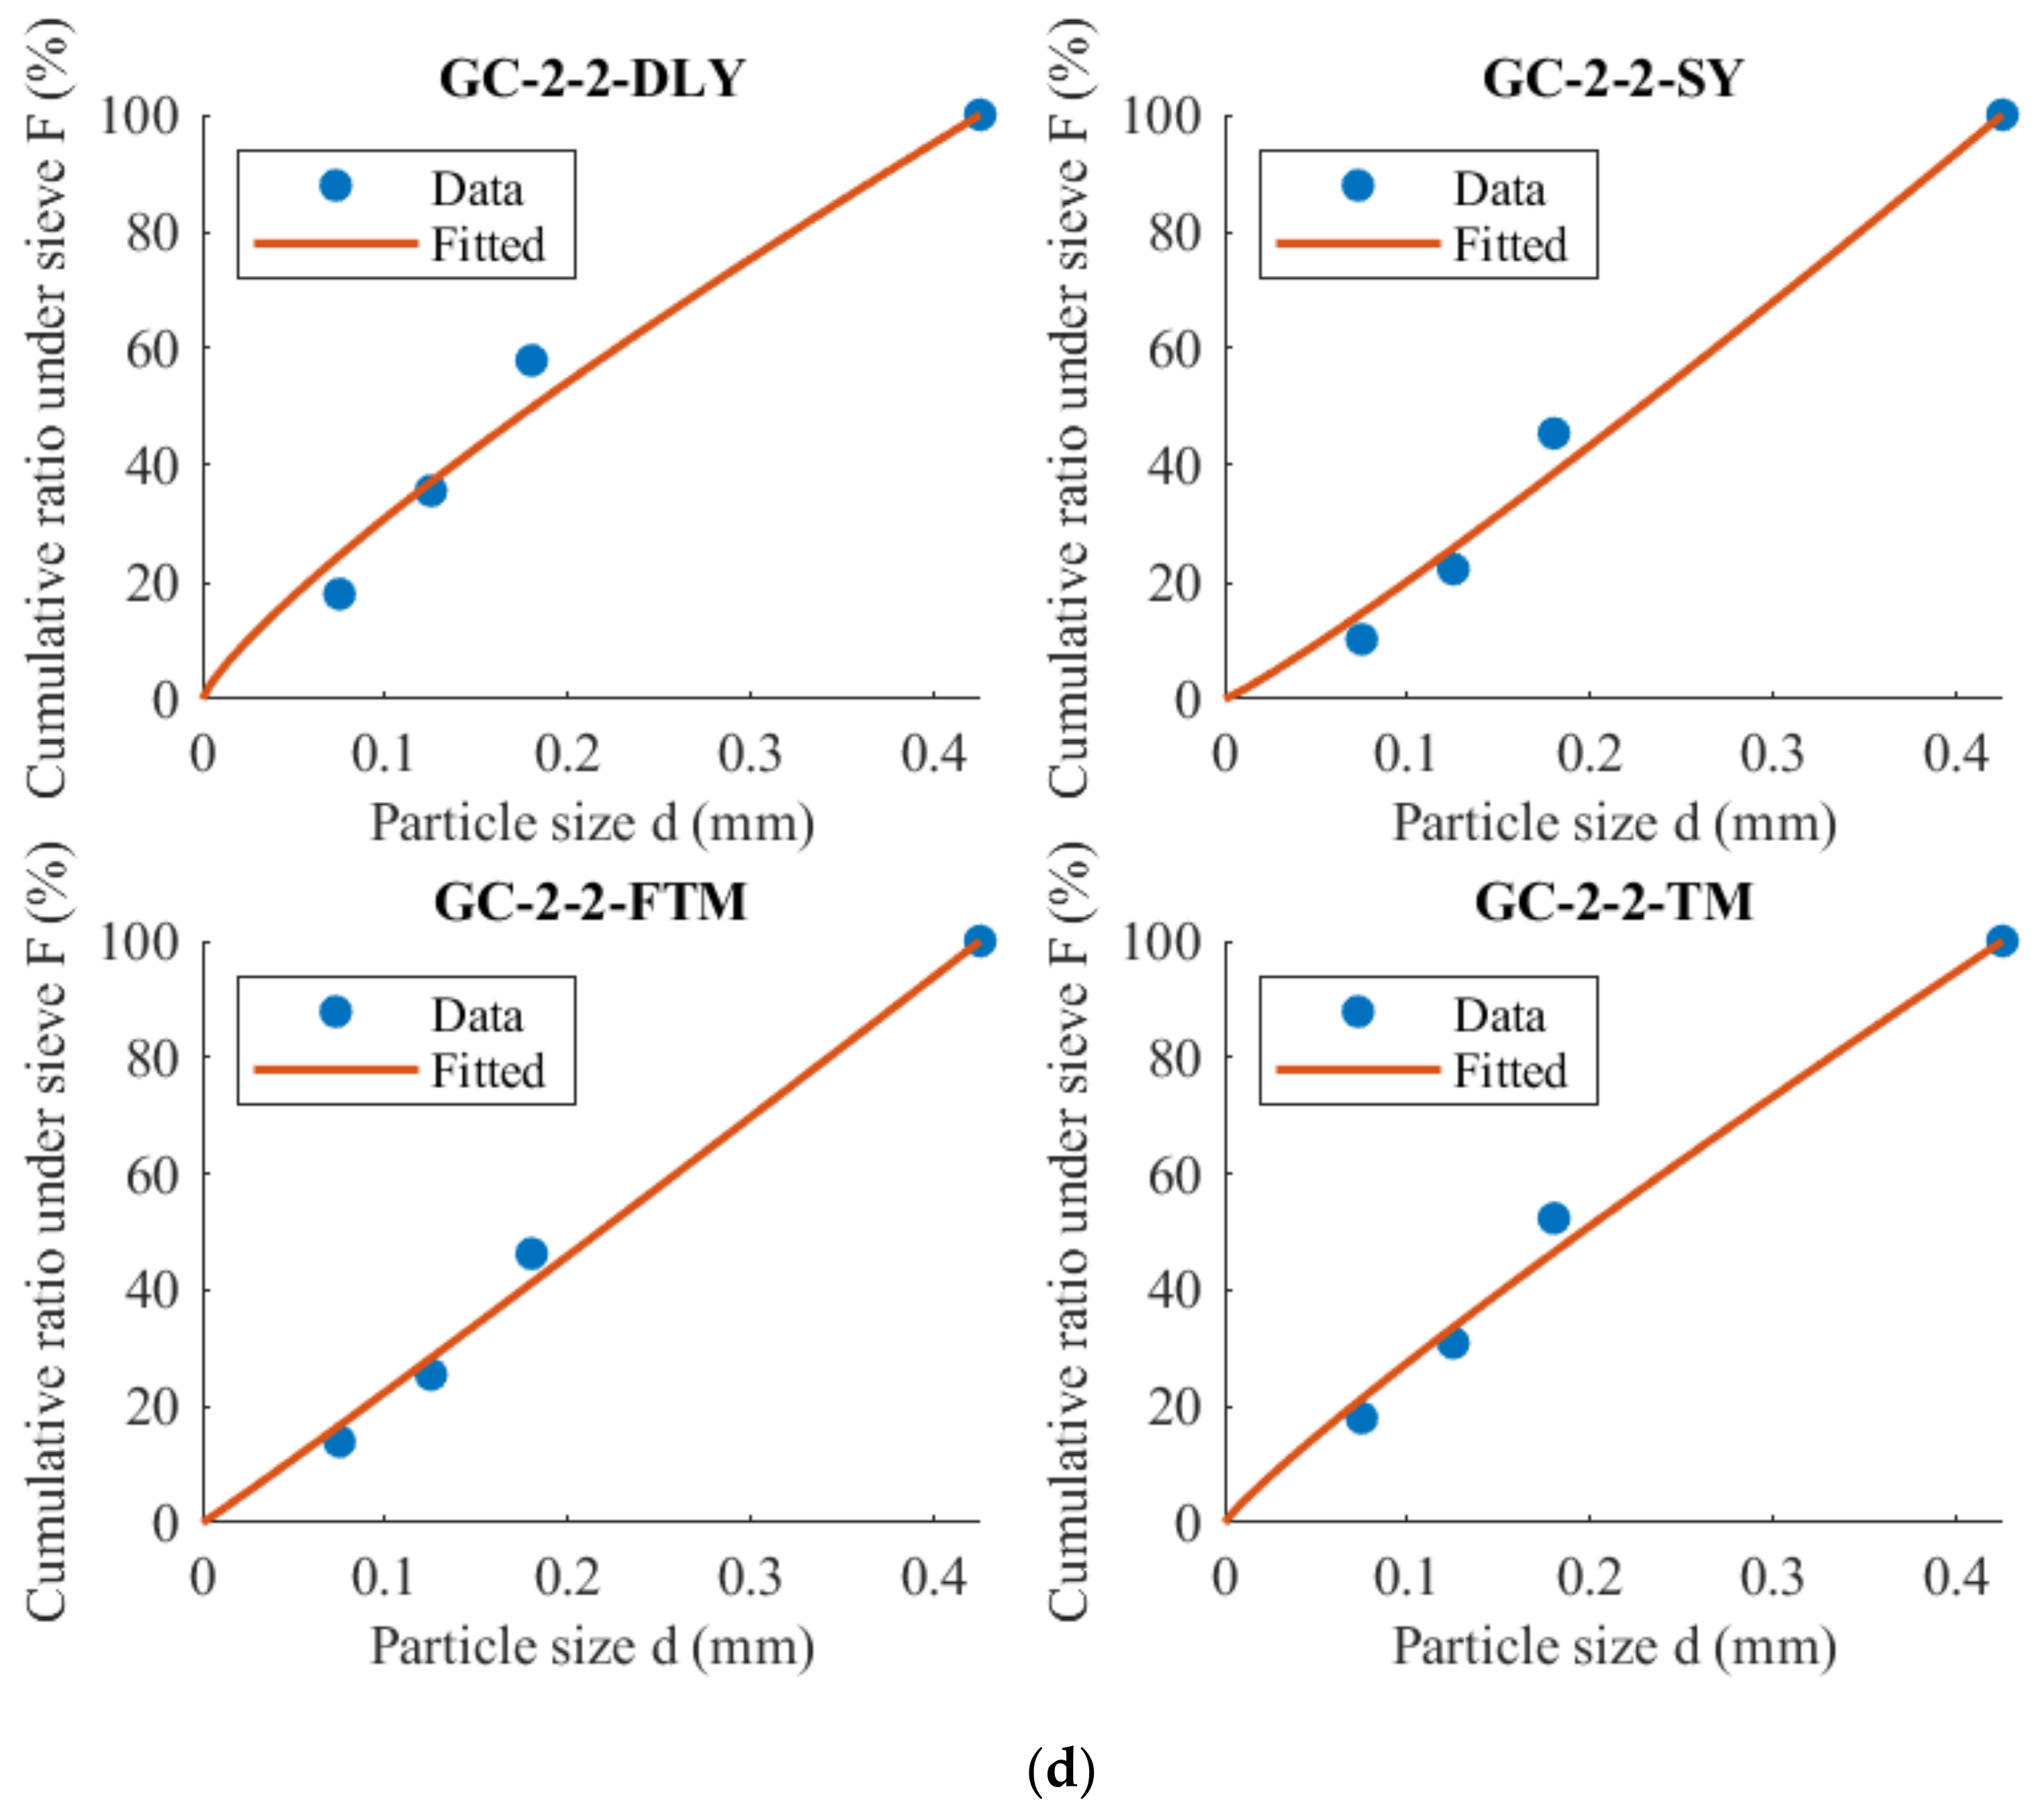
4.1. Drop Weight and Grinding Experiment
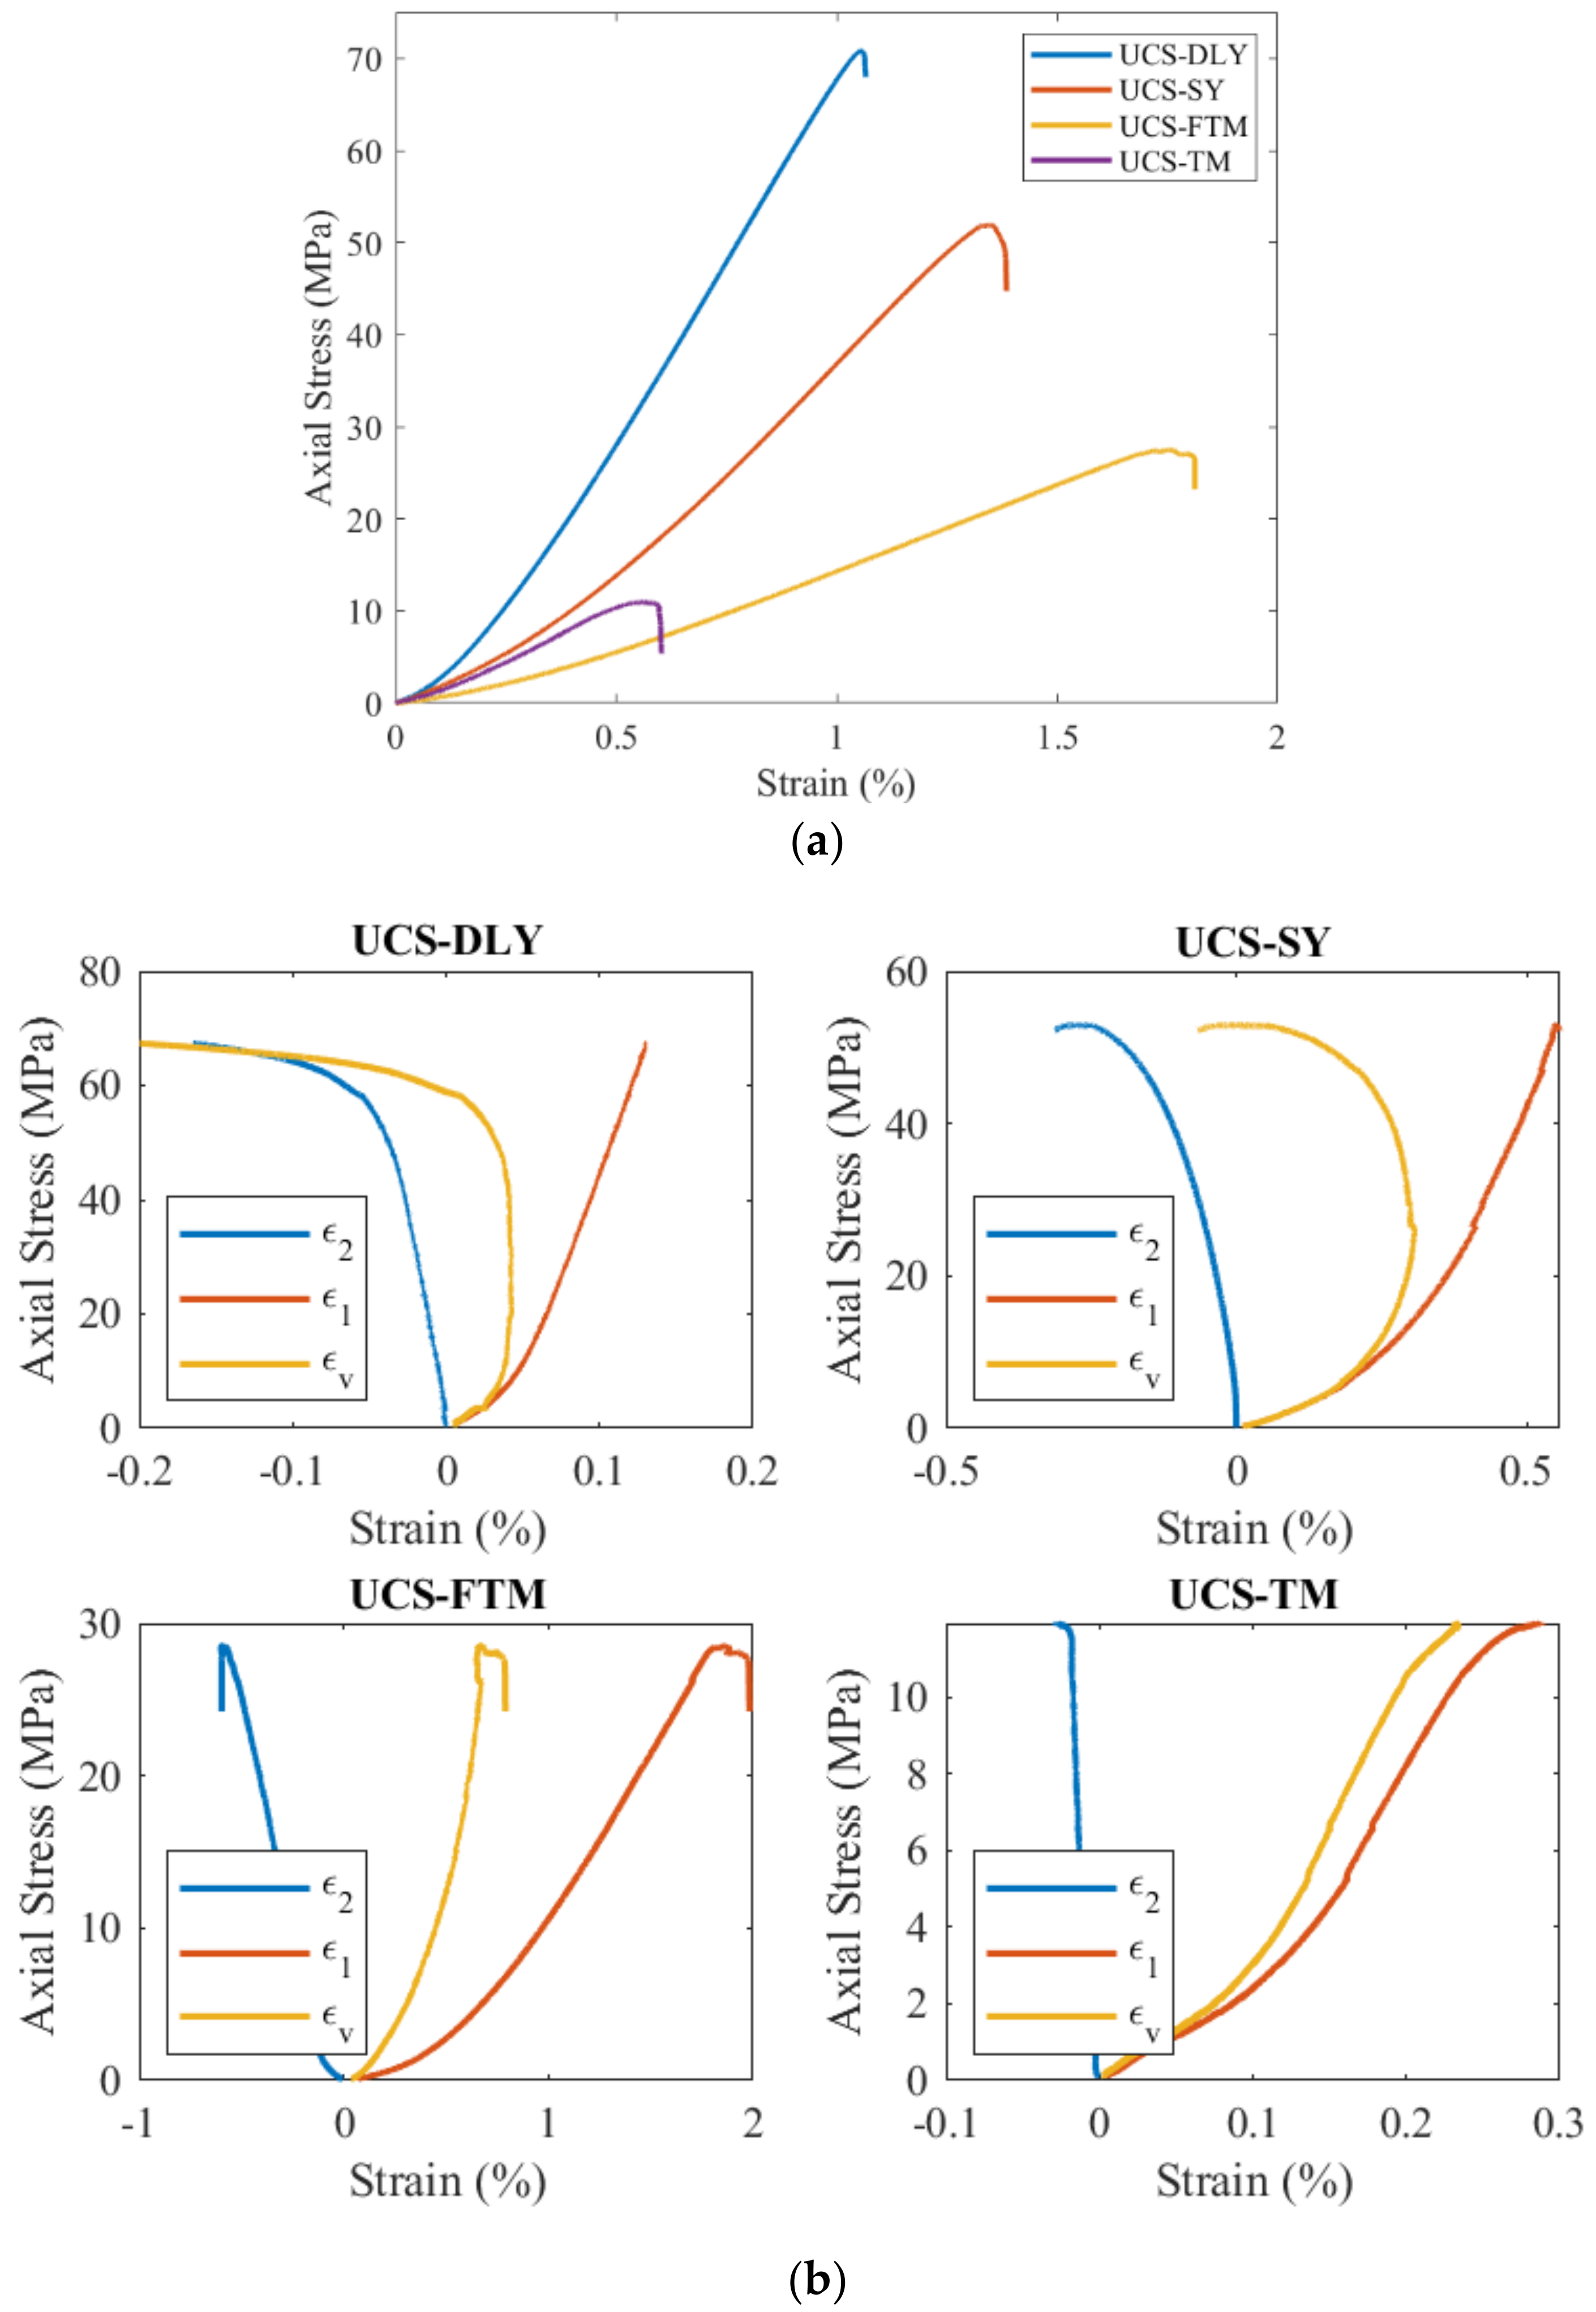
4.2. Uniaxial Compression Experiment
4.3. Three-Point Bending Experiment
5. Discussion
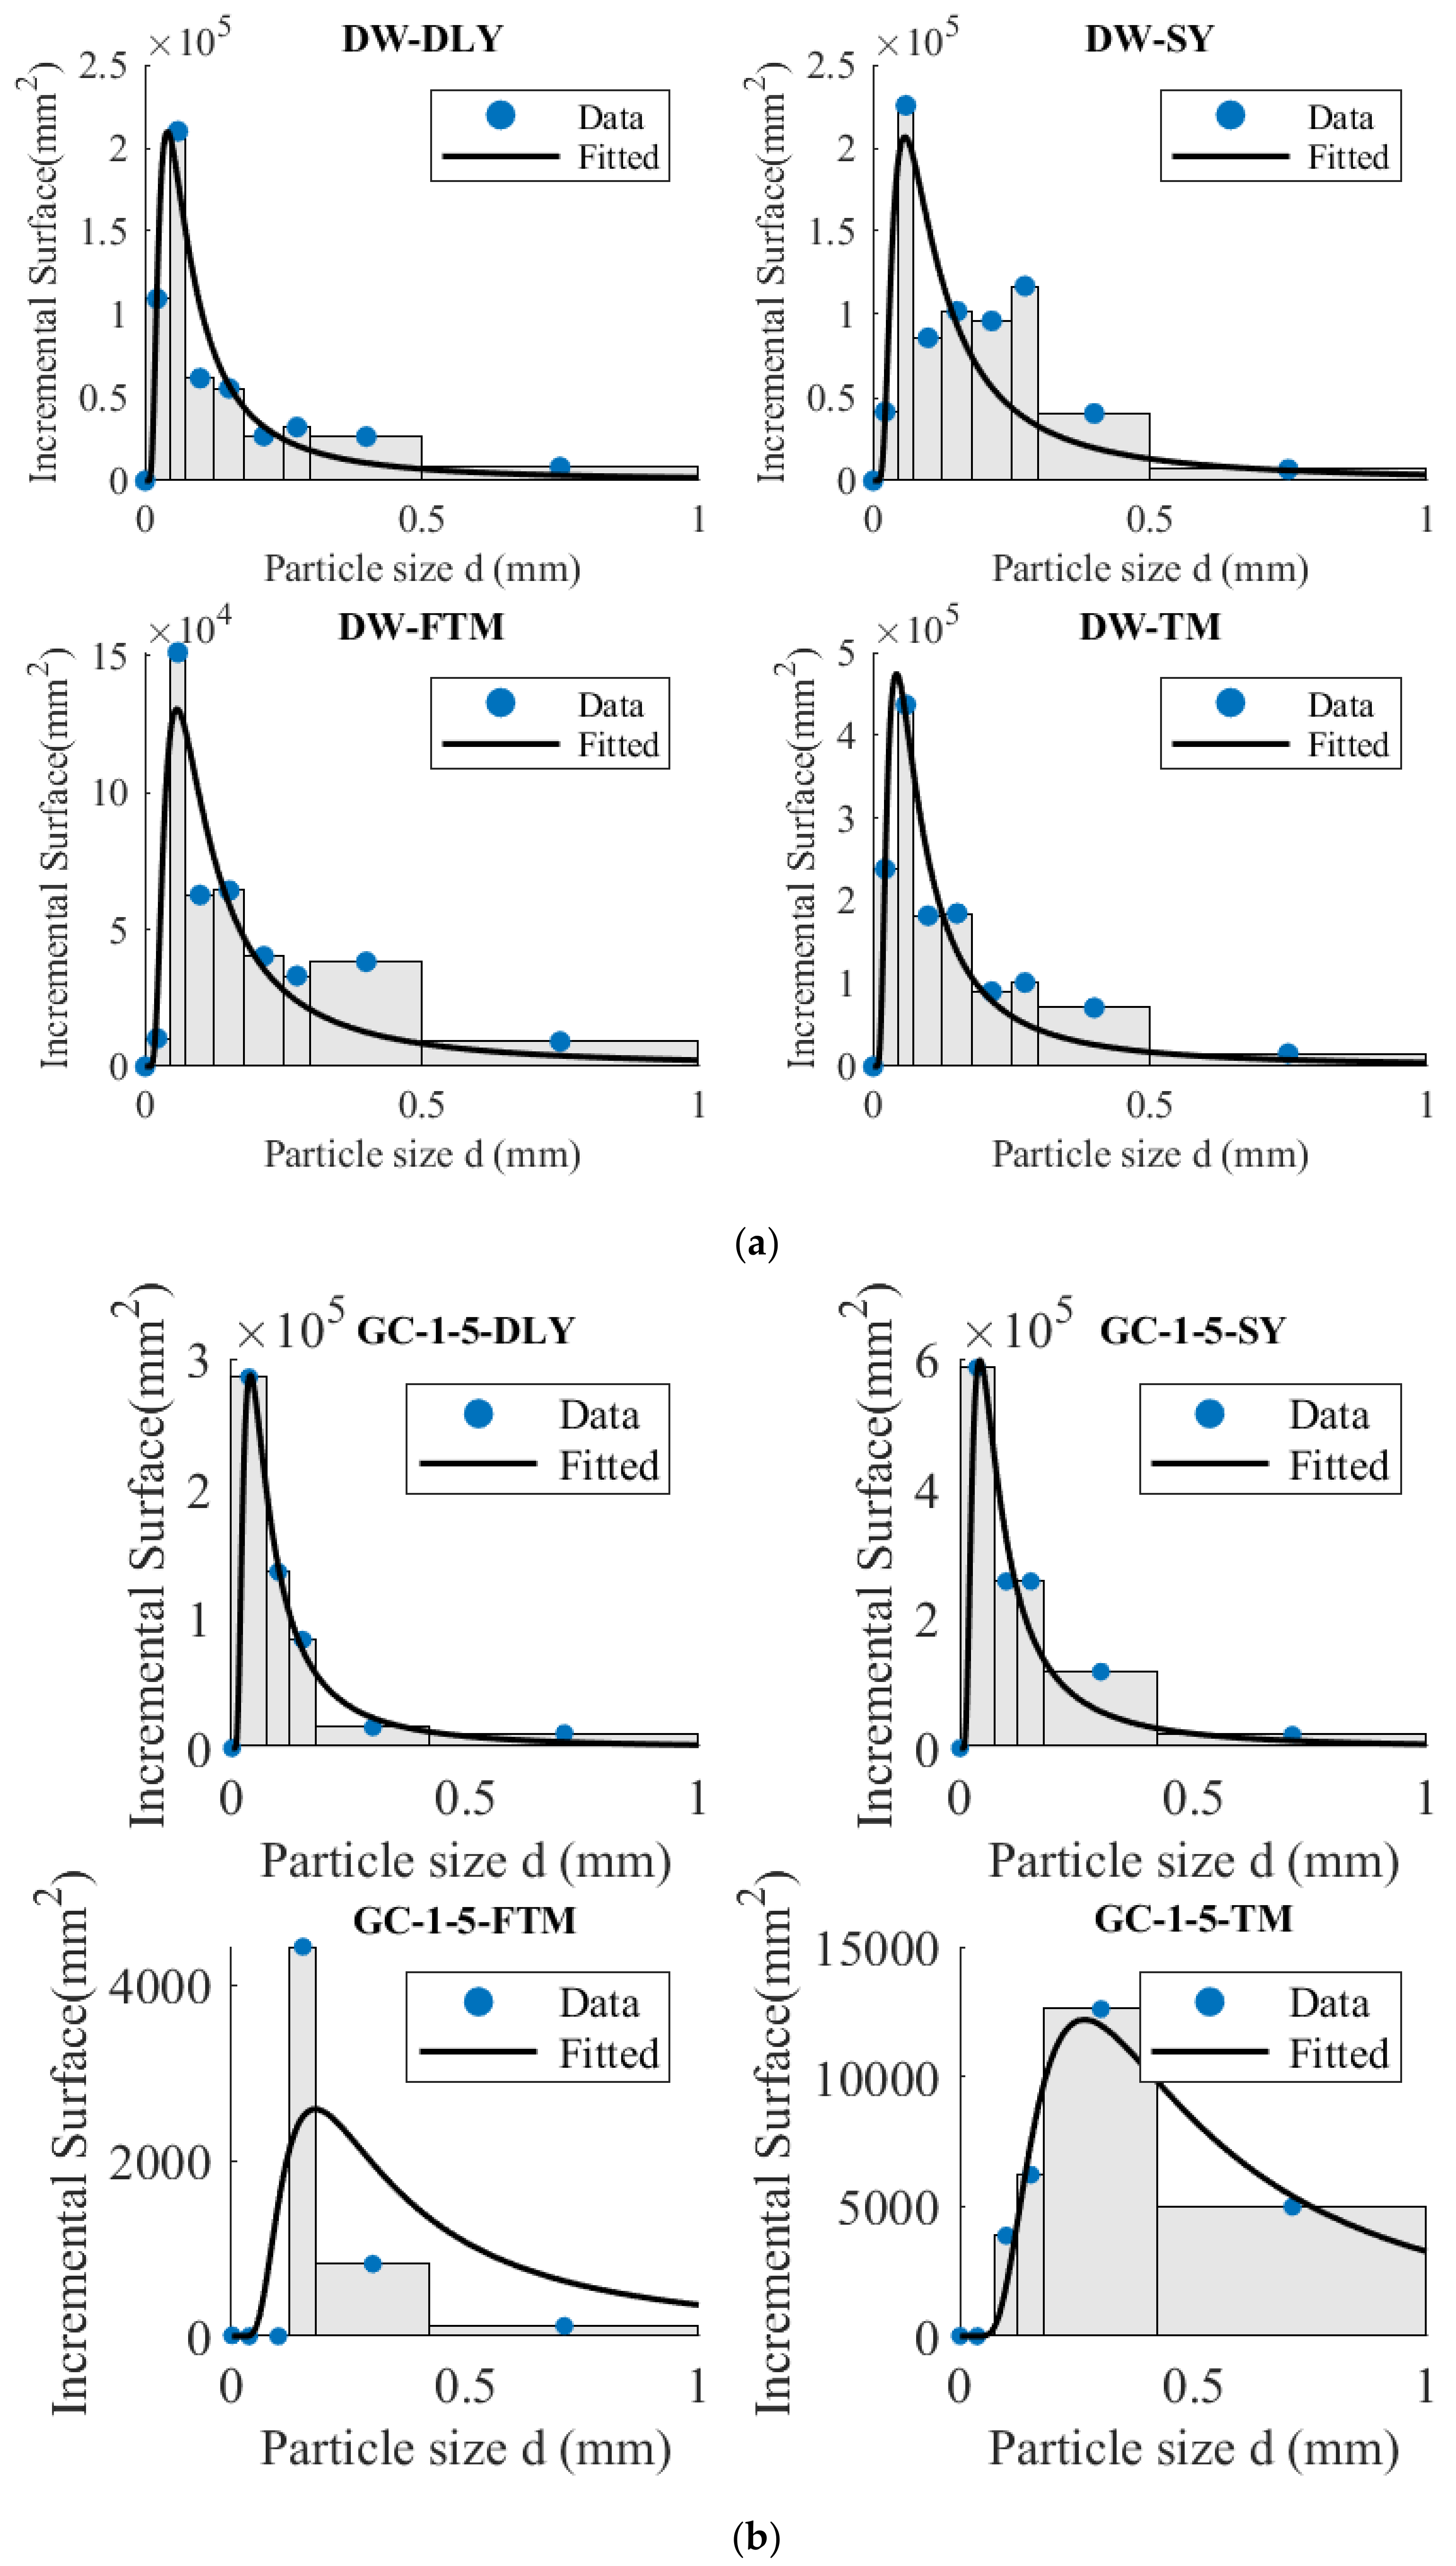
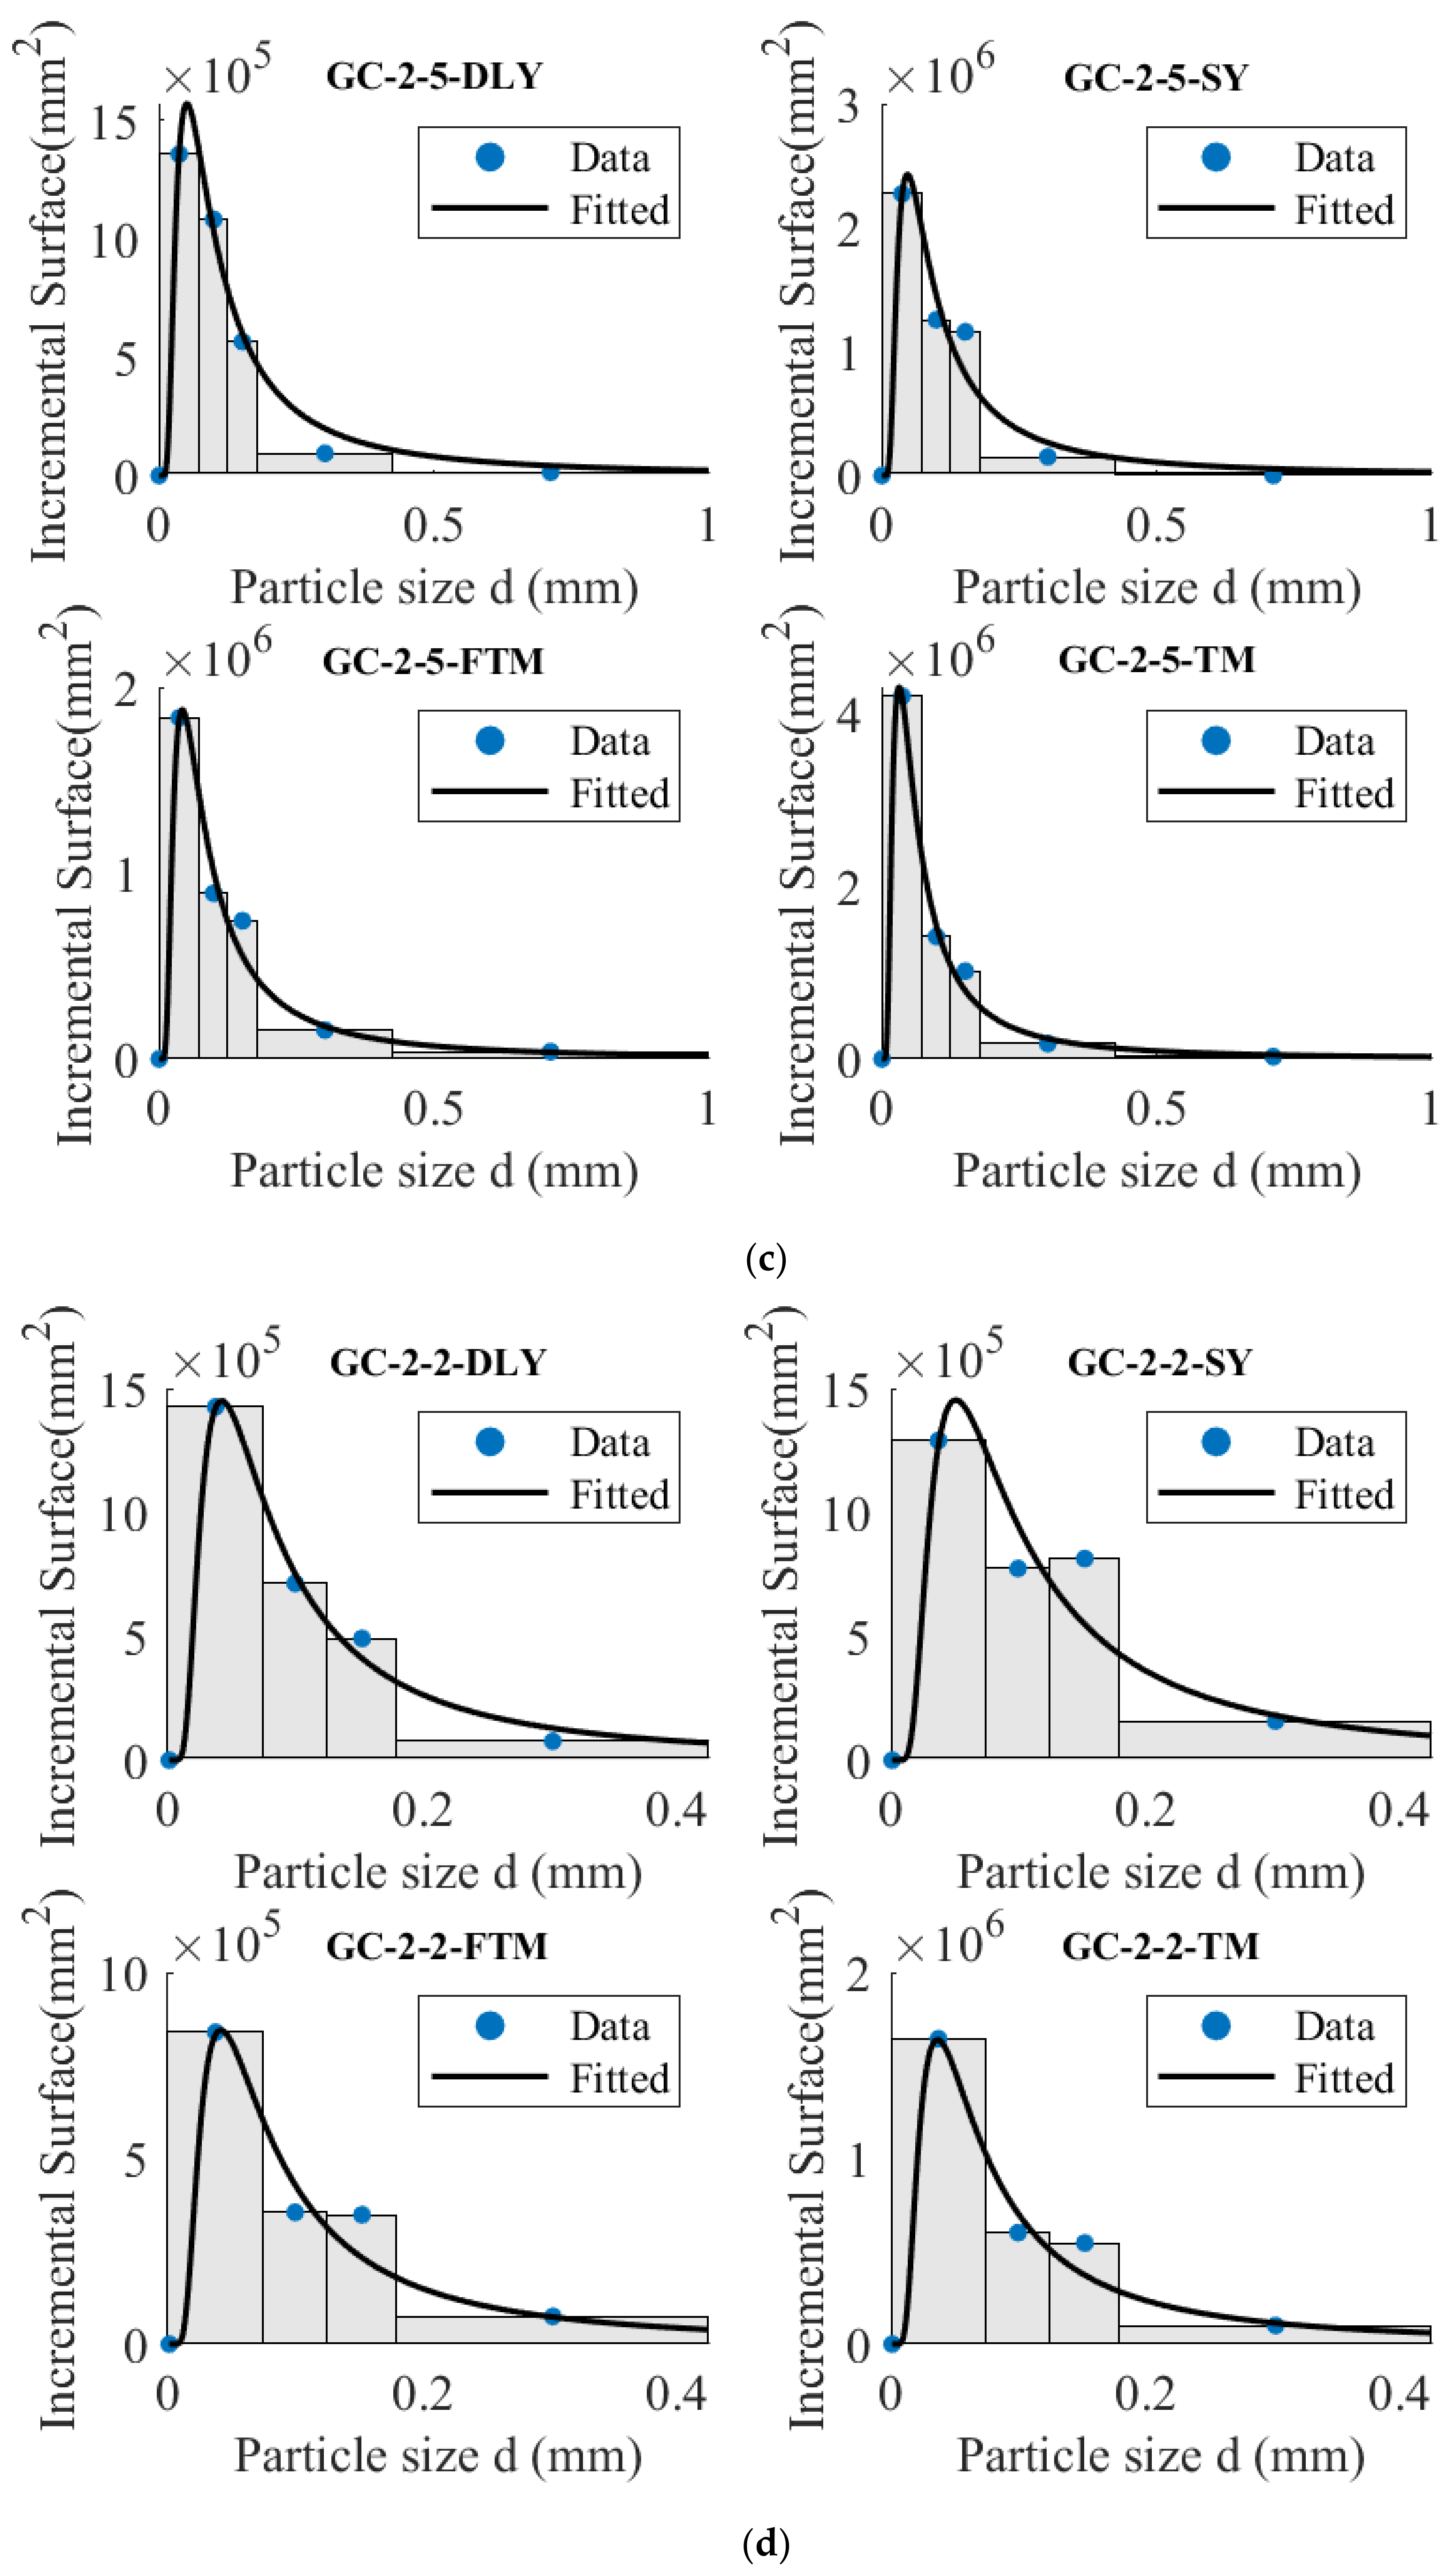
5.1. Distribution of New Area
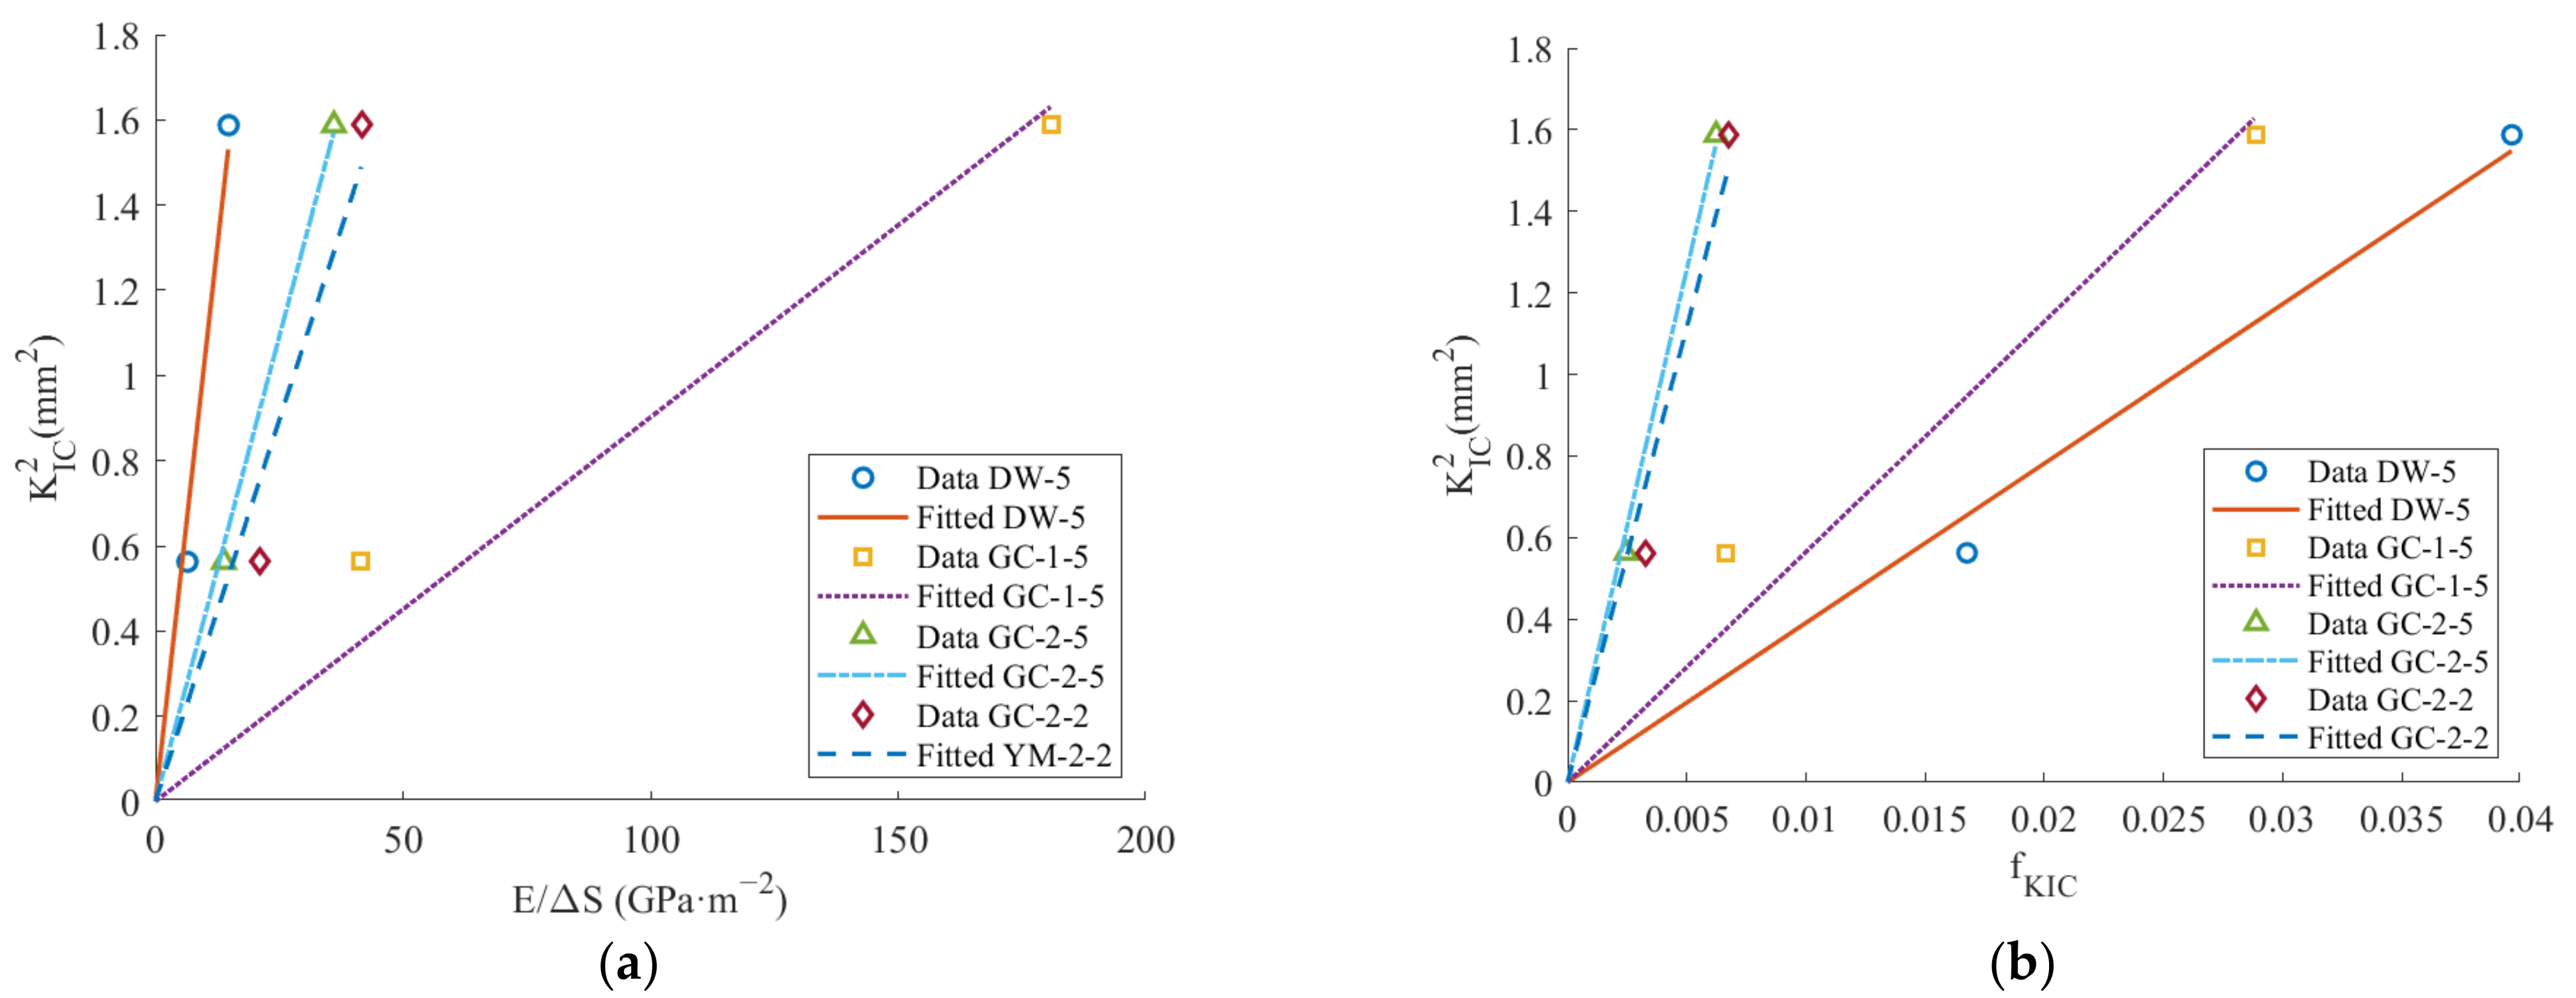
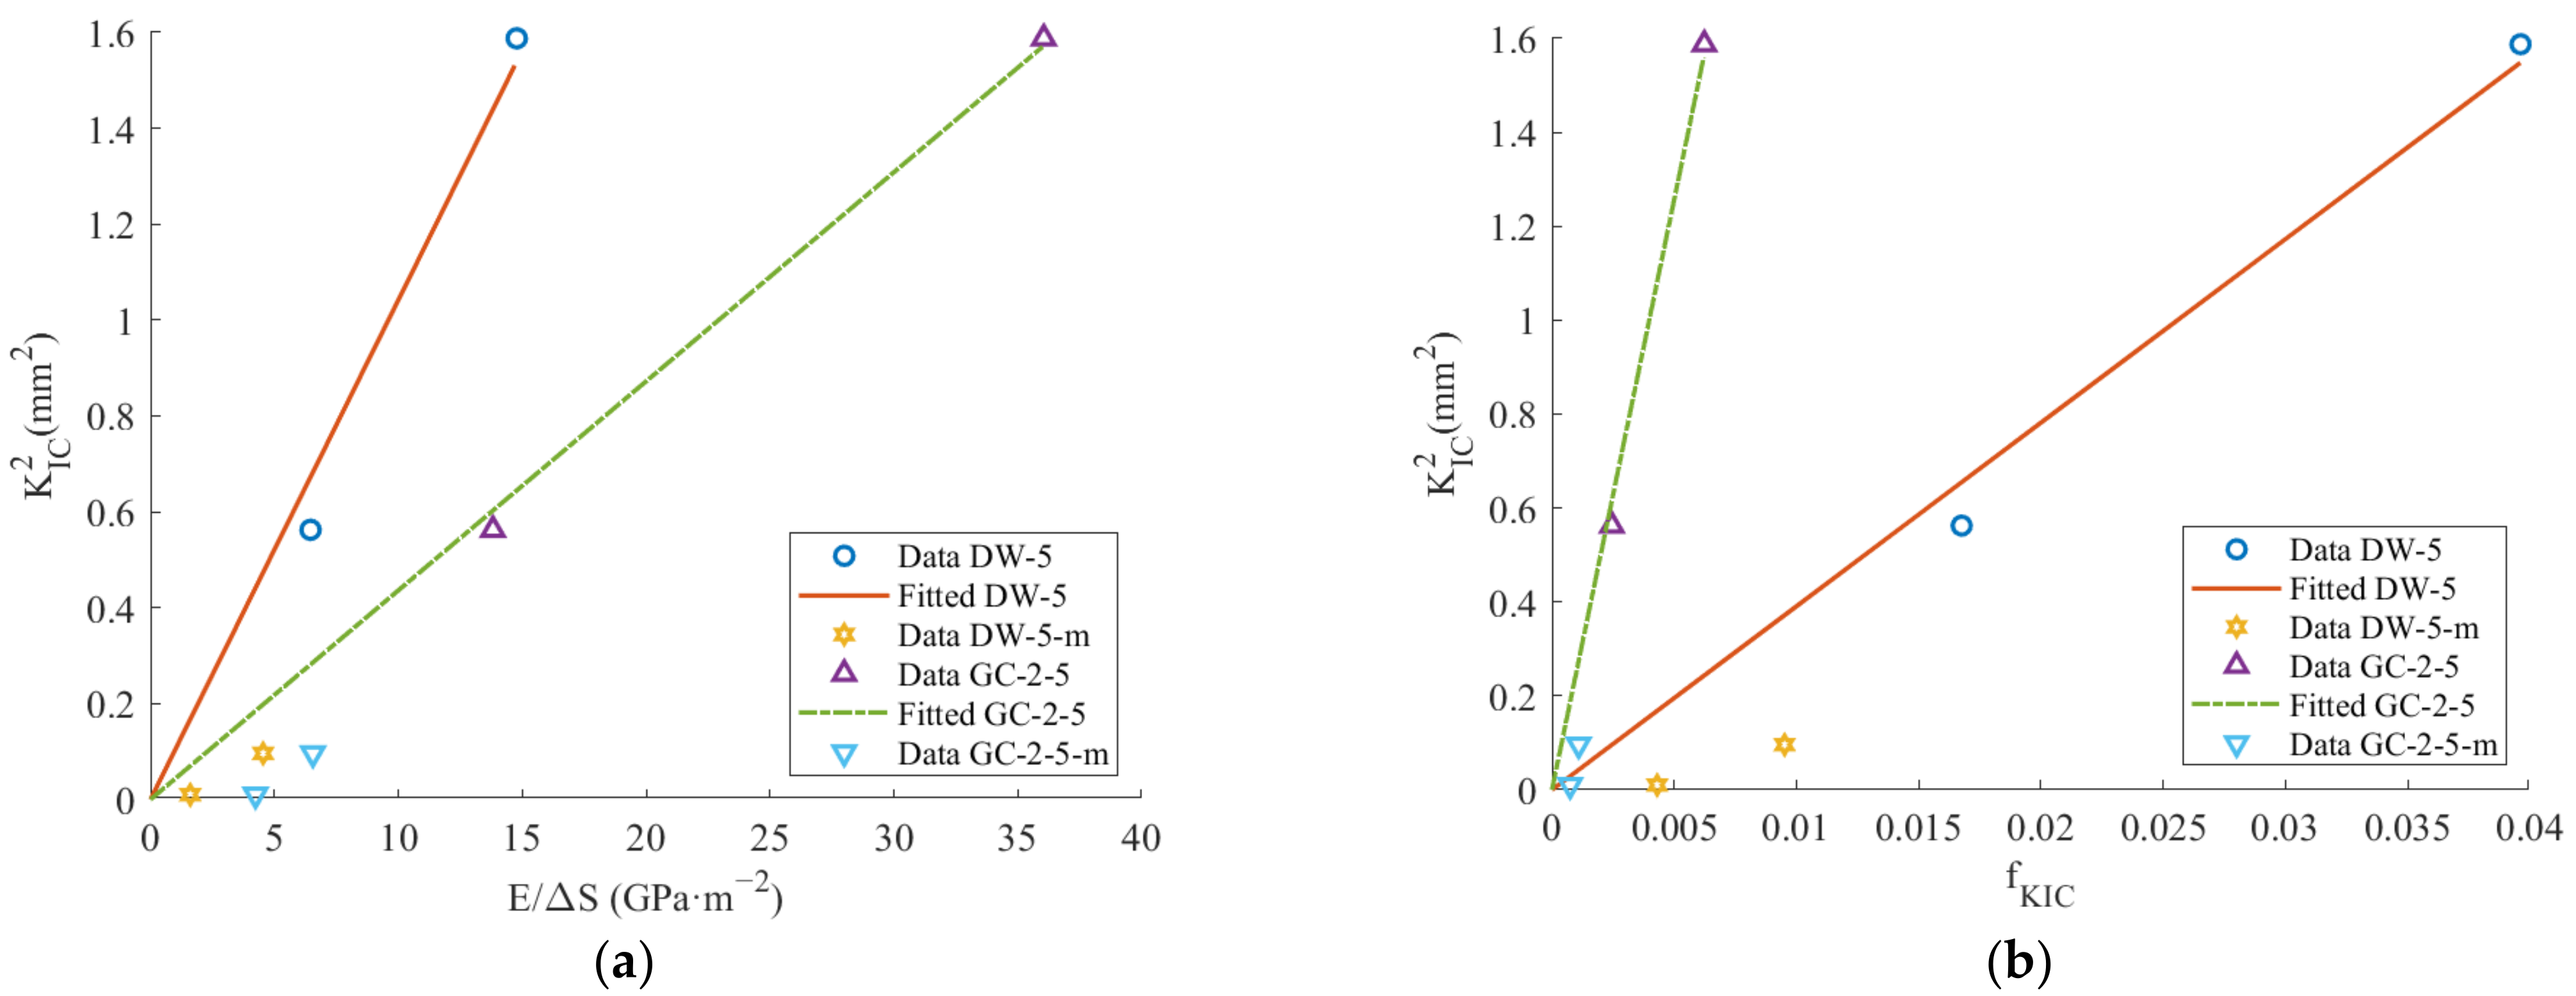
5.2. Determining Fracture Toughness of Coal
6. Conclusions
- The hardness coefficient of coal rock varies directly with the crushing work ratio and inversely with the average equivalent diameter, as determined by crushing energy;
- The square of the fracture toughness of coal and rock is directly proportional to the crushing work ratio, inversely proportional to the newly added area, directly proportional to the mean equivalent diameter and directly proportional to the hardness coefficient;
- The Mode-I fracture toughness of coal and rock can be quickly determined through the density, the equivalent diameter after crushing and the elastic modulus;
- Considering that smaller particle sizes are more resistant to breakage, the paper establishes the distribution mode of new surface areas after particle breakage, which is influenced by the initial particle size and the energy of a single broken particle. This law further elucidates that smaller particles necessitate more energy for crushing.
Author Contributions
Funding
Institutional Review Board Statement
Informed Consent Statement
Data Availability Statement
Conflicts of Interest
References
- Shi, X.; Zhao, Y.; Gong, S.; Wang, W.; Yao, W. Co-effects of bedding planes and loading condition on Mode-I fracture toughness of anisotropic rocks. Theor. Appl. Fract. Mech. 2022, 117, 103158. [Google Scholar] [CrossRef]
- An, F.; Yuan, Y.; Chen, X.; Li, Z.; Li, L. Expansion energy of coal gas for the initiation of coal and gas outbursts. Fuel 2019, 235, 551–557. [Google Scholar] [CrossRef]
- Dutler, N.; Nejati, M.; Valley, B.; Amann, F.; Molinari, G. On the link between fracture toughness, tensile strength, and fracture process zone in anisotropic rocks. Eng. Fract. Mech. 2018, 201, 56–79. [Google Scholar] [CrossRef]
- Bearman, R.A. The use of the point load test for the rapid estimation of Mode I fracture toughness. Int. J. Rock Mech. Min. Sci. 1999, 36, 257–263. [Google Scholar] [CrossRef]
- Bhagat, R.B. Mode I fracture toughness of coal. Int. J. Min. Eng. 1985, 3, 229–236. [Google Scholar] [CrossRef]
- Chong, K.P.; Kuruppu, M.D.; Kuszmaul, J.S. Fracture toughness determination of layered materials. Eng. Fract. Mech. 1987, 28, 43–54. [Google Scholar] [CrossRef]
- Whittaker, B.N.; Singh, R.N.; Sun, G. Rock Fracture Mechanics: Principles, Design and Applications; Elsevier: New York, NY, USA, 1992; p. 570. [Google Scholar]
- Kuruppu, M.D.; Obara, Y.; Ayatollahi, M.R.; Chong, K.P.; Funatsu, T. ISRM-Suggested Method for Determining the Mode I Static Fracture Toughness Using Semi-Circular Bend Specimen. Rock Mech. Rock Eng. 2014, 47, 267–274. [Google Scholar] [CrossRef]
- Chong, K.P.; Kuruppu, M.D. Mixed mode fracture analysis using new semi-circular specimens. Comput. Struct. 1988, 30, 905–908. [Google Scholar] [CrossRef]
- Kuruppu, M.D.; Chong, K.P. Fracture toughness testing of brittle materials using semi-circular bend (SCB) specimen. Eng. Fract. Mech. 2012, 91, 133–150. [Google Scholar] [CrossRef]
- Lim, I.L.; Johnston, I.W.; Choi, S.K.; Boland, J.N. Fracture testing of a soft rock with semi-circular specimens under three-point bending. Part 2—Mixed-mode. Int. J. Rock Mech. Min. Sci. Geomech. Abstr. 1994, 31, 199–212. [Google Scholar] [CrossRef]
- Lim, I.L.; Johnston, I.W.; Choi, S.K.; Boland, J.N. Fracture testing of a soft rock with semi-circular specimens under three-point bending. Part 1—Mode I. Int. J. Rock Mech. Min. Sci. Geomech. Abstr. 1994, 31, 185–197. [Google Scholar] [CrossRef]
- Qiao, Y.; Zhang, Z.-X.; Zhang, S. An Experimental Study of the Relation between Mode I Fracture Toughness, KIc, and Critical Energy Release Rate, GIc. Materials 2023, 16, 1056. [Google Scholar] [CrossRef] [PubMed]
- Aliha, M.R.M.; Mahdavi, E.; Ayatollahi, M.R. The Influence of Specimen Type on Tensile Fracture Toughness of Rock Materials. Pure Appl. Geophys. 2017, 174, 1237–1253. [Google Scholar] [CrossRef]
- Nejati, M.; Aminzadeh, A.; Saar, M.O.; Driesner, T. Modified semi-circular bend test to determine the fracture toughness of anisotropic rocks. Eng. Fract. Mech. 2019, 213, 153–171. [Google Scholar] [CrossRef]
- Nejati, M.; Aminzadeh, A.; Amann, F.; Saar, M.O.; Driesner, T. Mode I fracture growth in anisotropic rocks: Theory and experiment. Int. J. Solids Struct. 2020, 195, 74–90. [Google Scholar] [CrossRef]
- Sakha, M.; Nejati, M.; Aminzadeh, A.; Ghouli, S.; Saar, M.O.; Driesner, T. On the validation of mixed-mode I/II crack growth theories for anisotropic rocks. Int. J. Solids Struct. 2022, 241, 111484. [Google Scholar] [CrossRef]
- Yin, Z.; Xie, G.; Hu, Z.; Zhu, C. Investigation on fracture mechanism of coal rock on three-point bending tests under different gas pressures. J. China Coal Soc. 2016, 41, 424–431. [Google Scholar]
- Wang, W.; Zhao, Y.; Teng, T.; Zhang, C.; Jiao, Z. Influence of Bedding Planes on Mode I and Mixed-Mode (I–II) Dynamic Fracture Toughness of Coal: Analysis of Experiments. Rock Mech. Rock Eng. 2021, 54, 173–189. [Google Scholar] [CrossRef]
- Zhao, Y.; Sun, Z.; Gao, Y.; Wang, X.; Song, H. Influence of bedding planes on fracture characteristics of coal under mode II loading. Theor. Appl. Fract. Mech. 2022, 117, 103131. [Google Scholar] [CrossRef]
- Sun, Z.; Zhao, Y.; Gao, Y.; Gao, S.; Elmo, D.; Wei, X. Effect of size and anisotropy on mode I fracture toughness of coal. Theor. Appl. Fract. Mech. 2024, 129, 104170. [Google Scholar] [CrossRef]
- Wang, Y.; Yang, R. Study of the dynamic fracture characteristics of coal with a bedding structure based on the NSCB impact test. Eng. Fract. Mech. 2017, 184, 319–338. [Google Scholar] [CrossRef]
- Liu, X.; Yuan, S.; Sieffert, Y.; Fityus, S.; Buzzi, O. Changes in Mineralogy, Microstructure, Compressive Strength and Intrinsic Permeability of Two Sedimentary Rocks Subjected to High-Temperature Heating. Rock Mech. Rock Eng. 2016, 49, 2985–2998. [Google Scholar] [CrossRef]
- Ma, Z.; Pathegama Gamage, R.; Zhang, C. Application of nanoindentation technology in rocks: A review. Geomech. Geophys. Geo-Energy Geo-Resour. 2020, 6, 60. [Google Scholar] [CrossRef]
- Manjunath, G.L.; Jha, B. Nanoscale fracture mechanics of Gondwana coal. Int. J. Coal Geol. 2019, 204, 102–112. [Google Scholar] [CrossRef]
- Sun, C.; Li, G.; Gomah, M.E.; Xu, J.; Rong, H. Experimental investigation on the mechanical properties of crushed coal samples based on the nanoindentation technique. J. China Coal Soc. 2020, 45 (Suppl. S2), 682–691. [Google Scholar]
- Liu, P.; Zhao, Y.; Baisheng, N.; Liu, X.; Deng, B.; He, H.; Cao, M. Probing nano-mechanical behavior of coal using nanoindentation tests. J. China Coal Soc. 2023, 1–17. [Google Scholar] [CrossRef]
- Meng, J.; Lyu, C.; Wang, J.; Wang, L.; Nie, B.; Lyu, Y.; Niu, J. Mechanical properties and failure mechanisms of different rank coals at the nanoscale. Fuel 2023, 345, 128209. [Google Scholar] [CrossRef]
- Cai, Z.; Huang, G.; Zheng, J.; Cheng, Q.; Geng, W. Experimental study on the relationship between mode I static fracture toughness and newly added surface area after crushing. Chin. J. Rock Mech. Eng. 2021, 40, 1570–1579. [Google Scholar]
- Bayat, H.; Rastgo, M.; Mansouri Zadeh, M.; Vereecken, H. Particle size distribution models, their characteristics and fitting capability. J. Hydrol. 2015, 529, 872–889. [Google Scholar] [CrossRef]
- Lassabatère, L.; Angulo-Jaramillo, R.; Soria Ugalde, J.M.; Cuenca, R.; Braud, I.; Haverkamp, R. Beerkan Estimation of Soil Transfer Parameters through Infiltration Experiments—BEST. Soil Sci. Soc. Am. J. 2006, 70, 521–532. [Google Scholar] [CrossRef]
- Irani, R.R.; Callis, C.F. Particle Size: Measurement, Interpretation, and Application; John Wiley & Sons, Inc.: New York, NY, USA; London, UK, 1963. [Google Scholar]
- Wang, L.; Wang, H.; Zhu, J.; Huang, W.; Zhao, Y. Experimental study on particle size distribution of impact crushed coal containing gas. Fuel 2022, 325, 124745. [Google Scholar] [CrossRef]
- Jiang, H.; Du, C.; Liu, S. The effects of impact velocity on energy and size distribution of rock crushing. J. China Coal Soc. 2013, 38, 604–609. [Google Scholar]
- Luo, J.; Huang, G.; Xiong, Y.; Zhang, L. Experimental study on the relationship between the distribution of micro coal particles and the crushing energy. J. China Coal Soc. 2016, 41, 3054–3061. [Google Scholar]
- Wang, C.; Cheng, Y.; Yi, M.; Lei, Y.; He, X. Powder Mass of Coal After Impact Crushing: A New Fractal-Theory-Based Index to Evaluate Rock Firmness. Rock Mech. Rock Eng. 2020, 53, 4251–4270. [Google Scholar] [CrossRef]
- Li, C.; Hao, M.; Geng, Z.; He, Y.; Wei, S. Drop-weight impact fragmentation of gas-containing coal particles. Particuology 2021, 55, 35–42. [Google Scholar] [CrossRef]
- Haidai, O.; Pavlychenko, A.; Koveria, A.; Ruskykh, V.V.; Lampika, T.V. Determination of granulometric composition of technogenic raw materials for producing composite fuel. Nauk. Visnyk Natsionalnoho Hirnychoho Universytetu 2022, 52–58. [Google Scholar] [CrossRef]
- Song, S.; Pang, M.; Guo, Y.; Zhang, L.; Zhang, T.; Pan, H. Experimental Investigation of the Non-Darcy Equivalent Permeability of Fractured Coal Bodies: The Role of Particle Size Distribution. Fractal Fract. 2023, 7, 423. [Google Scholar] [CrossRef]
- Lawn, B. Fracture of Brittle Solids; The Press Syndicate of the University of Cambridge: New York, NY, USA, 1993. [Google Scholar]
- GB/T 23561.12-2010; Methods for Determining the Physical and Mechanical Properties of Coal and Rock—Part 12: Methods for Determining Coal Hardiness Coefficient. The Standardization Administration of the People’s Republic of China: Beijing, China, 2011.
- GB/T 2565-2014; Determination of Grindability Index of Coal-Hardgrove Method. The Standardization Administration of the People’s Republic of China: Beijing, China, 2014.
- GB/T 23561.7-2009; Methods for Determining the Physical and Mechanical Properties of Coal and Rock—Part 7: Methods for Determining the Uniaxial Compressive Strength and Counting Softening Coefficient. The Standardization Administration of the People’s Republic of China: Beijing, China, 2009.
- GB/T 23561.8-2009; Methods for Determining the Physical and Mechanical Properties of Coal and Rock—Part 8: Methods for Determining the Deformation Parameters of Coal and Rock. The Standardization Administration of the People’s Republic of China: Beijing, China, 2009.


| Experiment Type | Condition | Number |
|---|---|---|
| DWE | The weight drops five times. | DW-5 |
| GCE | The rotation speed is 150 r/min; the duration is 5 min. | GC-1-5 |
| GCE | The rotation speed is 250 r/min; the duration is 5 min. | GC-2-5 |
| GCE | The rotation speed is 250 r/min; the duration is 2 min. | GC-2-2 |
| UCS | The loading rate is 0.1 mm/min. | UCS |
| TPB | The loading rate is 0.1 mm/min. | TPB |
| Sample | Sample Number | DW-5 | GC-1-5 | GC-2-5 | GC-2-2 | UCS | TPB |
|---|---|---|---|---|---|---|---|
| Marble | DLY | Particle size 1–2 mm 50 g/portion | Particle size 1–2 mm 50 g/portion | Particle size 1–2 mm 50 g/portion | Particle size 0.425–1 mm 50 g/portion | Φ50 × 100 | NSCB a = 15 m R = 37.5 mm b = 30 mm |
| Sandstone | SY | ||||||
| Non-outburst raw coal | FTM | ||||||
| Outburst raw coal | TM |
| Sample | DW-5 | GC-1-5 | GC-2-5 | GC-2-2 | UCS | TPB |
|---|---|---|---|---|---|---|
| Marble | DW-DLY | GC-1-5-DLY | GC-2-5-DLY | GC-2-2-DLY | UCS-DLY | TPB-DLY |
| Sandstone | DW-SY | GC-1-5-SY | GC-2-5-SY | GC-2-2-SY | UCS-SY | TPB-SY |
| Non-outburst raw coal | DW-FTM | GC-1-5-FTM | GC-2-5-FTM | GC-2-2-FTM | UCS-FTM | TPB-FTM |
| Outburst raw coal | DW-TM | GC-1-5-TM | GC-2-5-TM | GC-2-2-TM | UCS-TM | TPB-TM |
| Sample | DW-5 | GC-1-5 | GC-2-5 | GC-2-2 | ||||
|---|---|---|---|---|---|---|---|---|
| β | R2 | β | R2 | β | R2 | β | R2 | |
| Marble | 1.233 | 0.997 | 1.183 | 0.988 | 0.573 | 0.959 | 0.809 | 0.973 |
| Sandstone | 0.961 | 0.965 | 0.962 | 0.990 | 0.389 | 0.804 | 1.105 | 0.984 |
| Non-outburst raw coal | 1.280 | 0.990 | 0.978 | 0.954 | 0.821 | 0.995 | 1.031 | 0.991 |
| Outburst raw coal | 1.073 | 0.990 | 1.764 | 0.997 | 0.535 | 0.978 | 0.891 | 0.987 |
| Sample | ρ g/cm³ | σc/MPa | E/GPa | ν | Pmax/kN | KΙC/MPa·m1/2 |
|---|---|---|---|---|---|---|
| Marble | 2.74 | 70.82 | 7.84 | 0.20 | 3.00 | 1.26 |
| Sandstone | 2.49 | 51.88 | 4.62 | 0.17 | 1.76 | 0.75 |
| Non-outburst raw coal | 1.50 | 27.50 | 1.86 | 0.27 | 0.75 | 0.31 |
| Outburst raw coal | 1.40 | 10.93 | 2.12 | 0.10 | 0.24 | 0.10 |
| Sample | DW-5 | GC-1-5 | GC-2-5 | GC-2-2 | ||||||||
|---|---|---|---|---|---|---|---|---|---|---|---|---|
| c | E0 | R2 | c | E0 | R2 | c | E0 | R2 | c | E0 | R2 | |
| Marble | 232 | 0.116 | 0.904 | 294 | 0.113 | 0.997 | 3362 | 0.145 | 0.994 | 1725 | 0.119 | 0.991 |
| Sandstone | 639 | 0.163 | 0.711 | 780 | 0.122 | 0.948 | 4062 | 0.133 | 0.959 | 3048 | 0.143 | 0.911 |
| Non-outburst raw coal | 406 | 0.164 | 0.846 | 234 | 0.505 | 0.548 | 2416 | 0.122 | 0.980 | 950 | 0.116 | 0.958 |
| Outburst raw coal | 597 | 0.121 | 0.934 | 3672 | 0.753 | 0.950 | 2288 | 0.091 | 0.994 | 1277 | 0.103 | 0.976 |
| Experiment | DW-5 | GC-1-5 | GC-2-5 | GC-2-2 |
|---|---|---|---|---|
| c1 | R2 | c2 | R2 | |
| DW-5 | 0.104 | 0.999 | 39 | 0.999 |
| GC-1-5 | 0.009 | 0.999 | 56 | 0.999 |
| GC-2-5 | 0.043 | 0.999 | 251 | 0.999 |
| GC-2-2 | 0.035 | 0.999 | 223 | 0.999 |
| Sample | Ce-V | KIC-S | KIC-f | ||
| DW-E | GC-E | DW-E | GC-E | ||
| DLY | 1.26 | 1.241 | 1.254 | 1.244 | 1.252 |
| SY | 0.75 | 0.820 | 0.776 | 0.809 | 0.785 |
| FTM | 0.31 | 0.688 | 0.535 | 0.610 | 0.524 |
| TM | 0.10 | 0.409 | 0.430 | 0.410 | 0.432 |
Disclaimer/Publisher’s Note: The statements, opinions and data contained in all publications are solely those of the individual author(s) and contributor(s) and not of MDPI and/or the editor(s). MDPI and/or the editor(s) disclaim responsibility for any injury to people or property resulting from any ideas, methods, instructions or products referred to in the content. |
© 2024 by the authors. Licensee MDPI, Basel, Switzerland. This article is an open access article distributed under the terms and conditions of the Creative Commons Attribution (CC BY) license (https://creativecommons.org/licenses/by/4.0/).
Share and Cite
Cheng, Q.; Huang, G.; Zheng, J.; Liang, Q. New Method for Determining Mode-I Static Fracture Toughness of Coal Using Particles. Materials 2024, 17, 1765. https://doi.org/10.3390/ma17081765
Cheng Q, Huang G, Zheng J, Liang Q. New Method for Determining Mode-I Static Fracture Toughness of Coal Using Particles. Materials. 2024; 17(8):1765. https://doi.org/10.3390/ma17081765
Chicago/Turabian StyleCheng, Qiang, Gun Huang, Jie Zheng, and Qinming Liang. 2024. "New Method for Determining Mode-I Static Fracture Toughness of Coal Using Particles" Materials 17, no. 8: 1765. https://doi.org/10.3390/ma17081765