
Axial Compression Behavior of Circular Seawater and Sea Sand Concrete Columns Reinforced with Hybrid GFRP–Stainless Steel Bars

 ,
,  and
and
Abstract
1. Introduction
2. Test Procedure
2.1. Materials
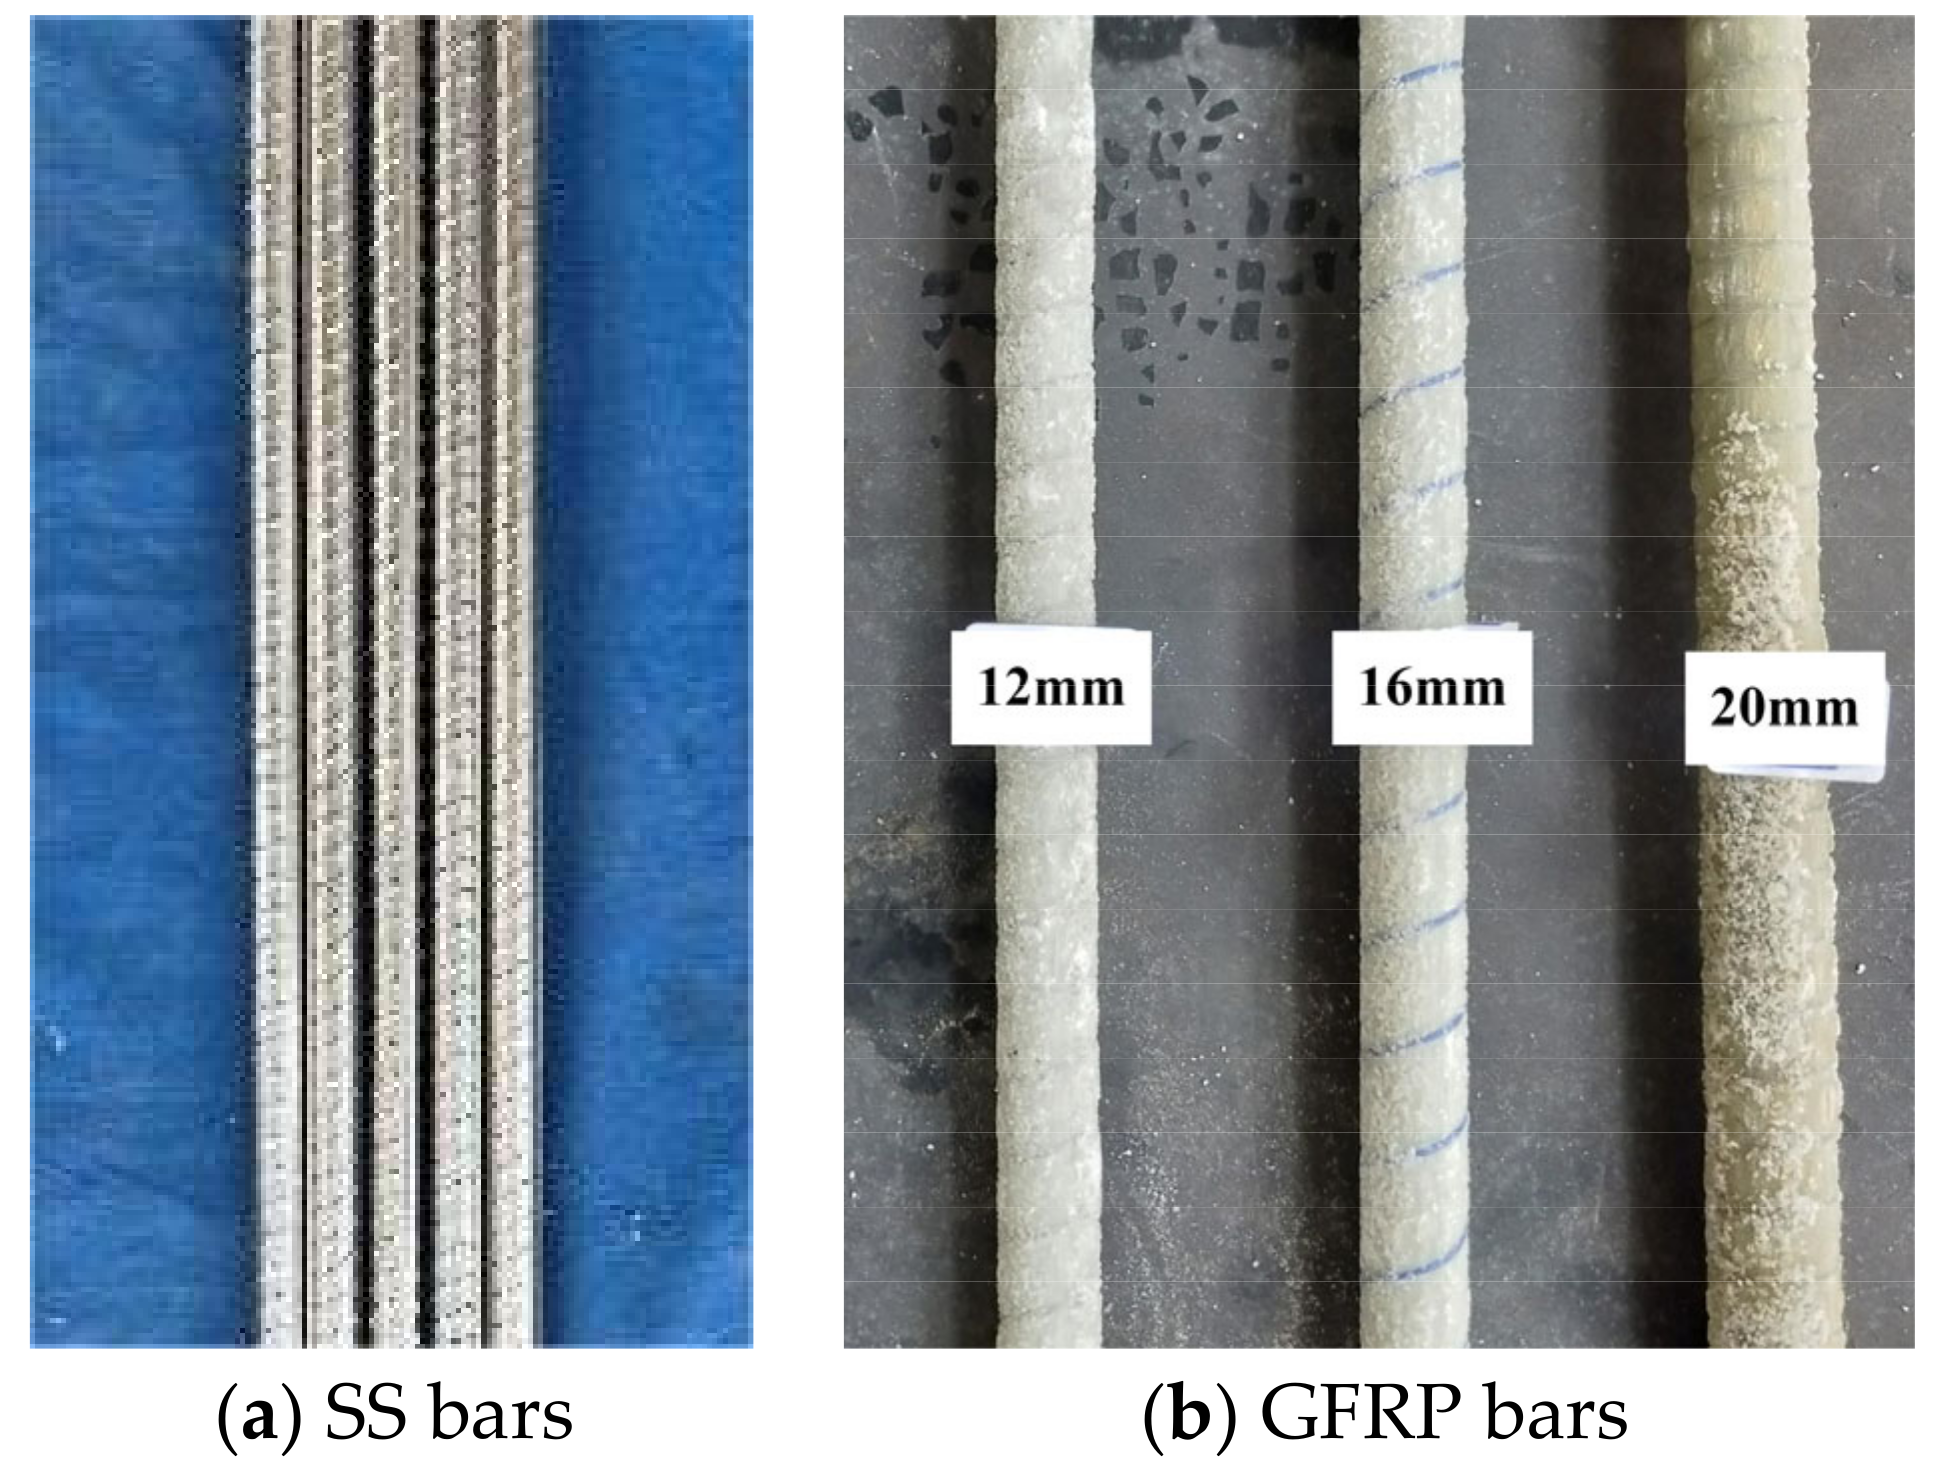
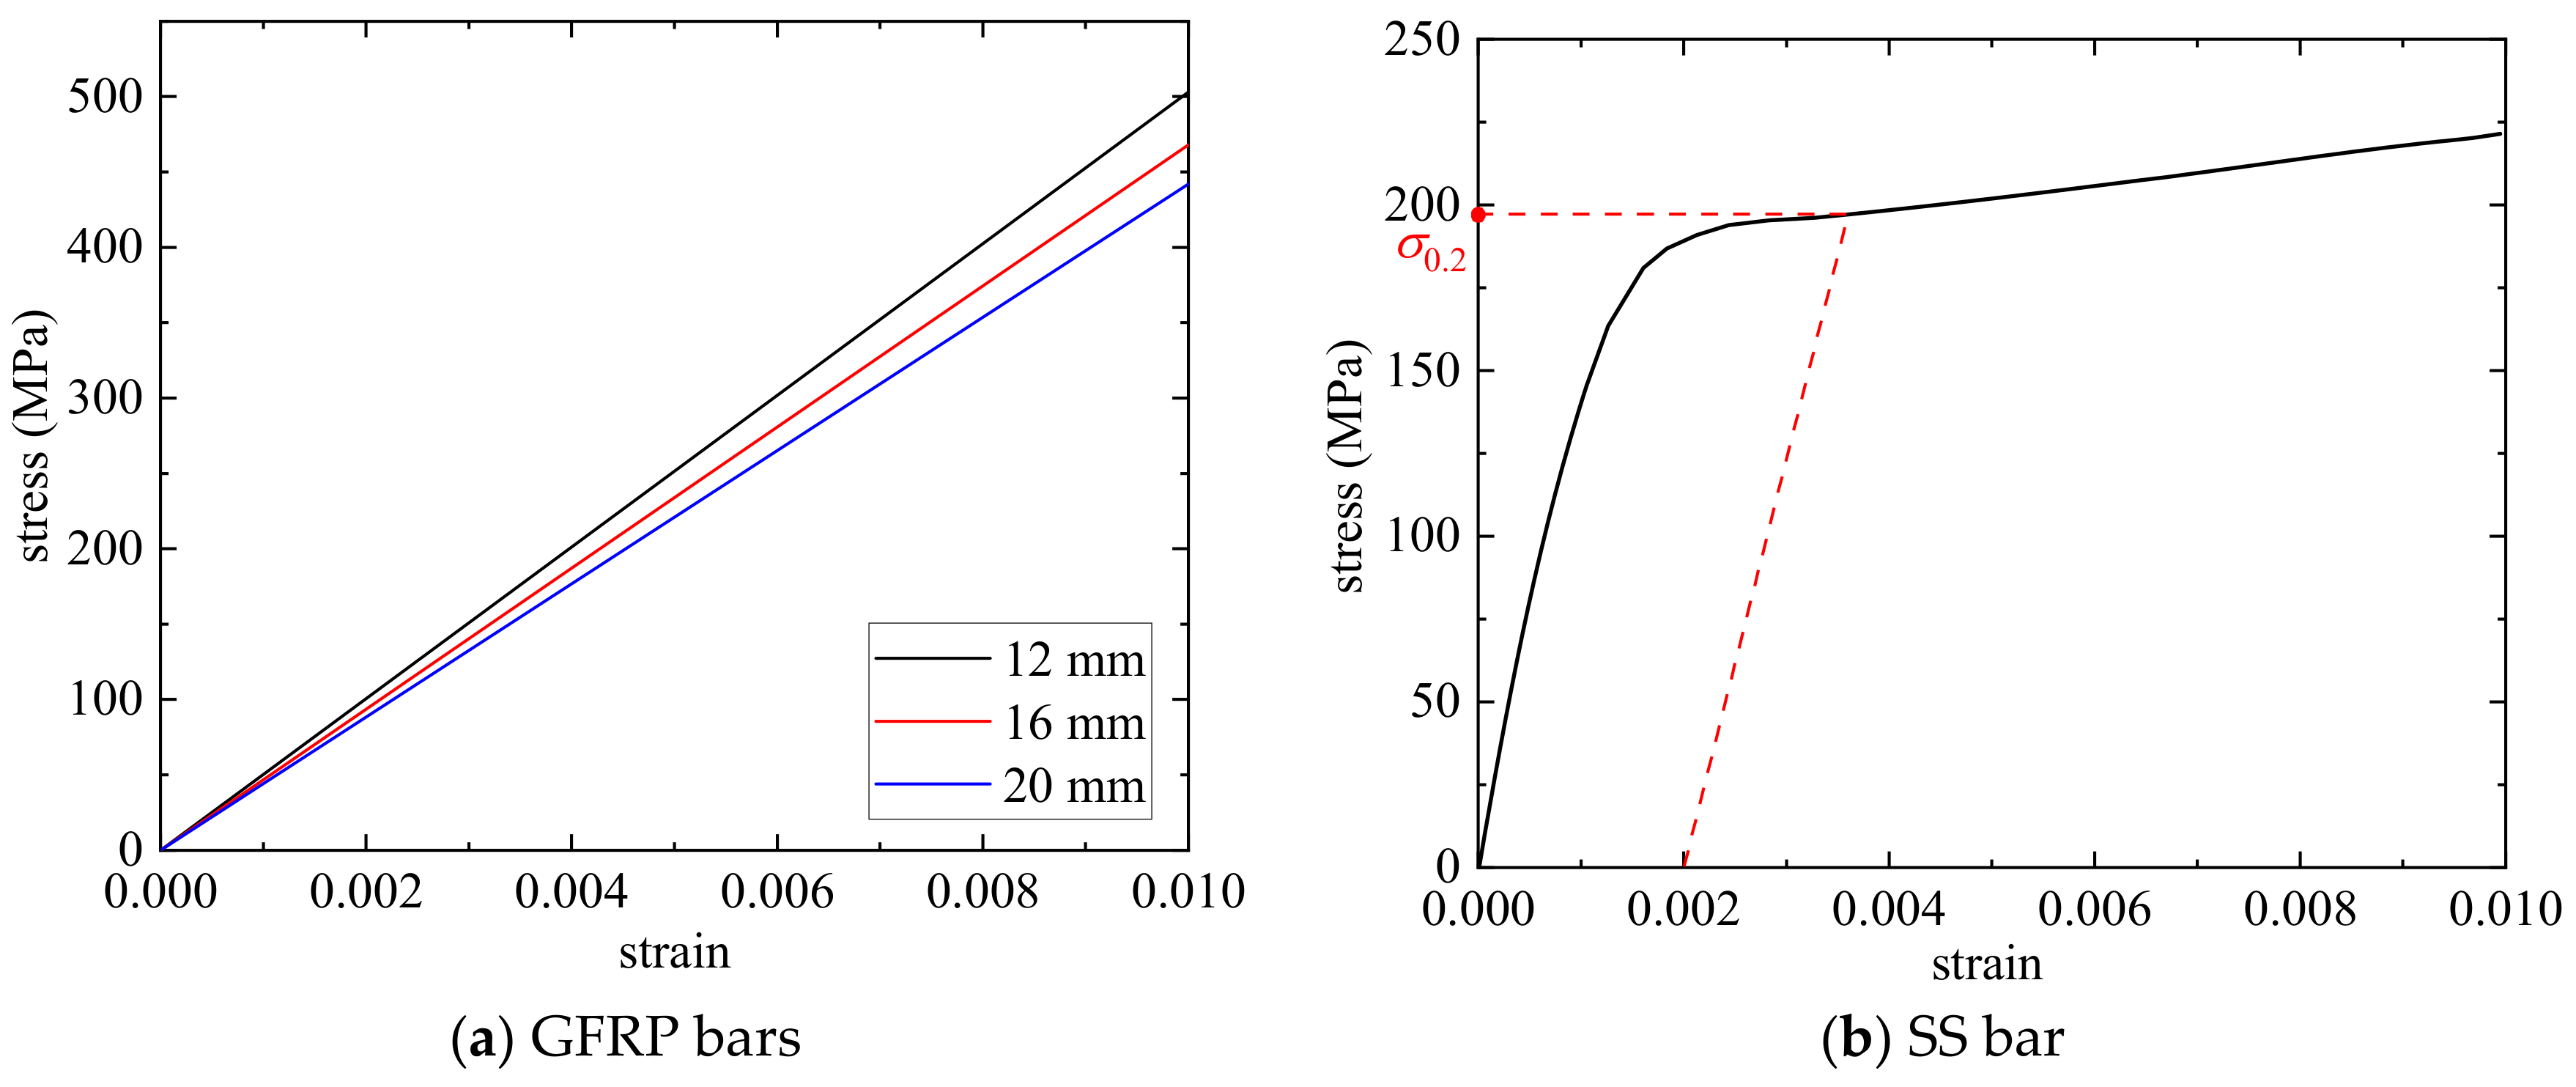
2.1.1. Rebars
2.1.2. SWSSC
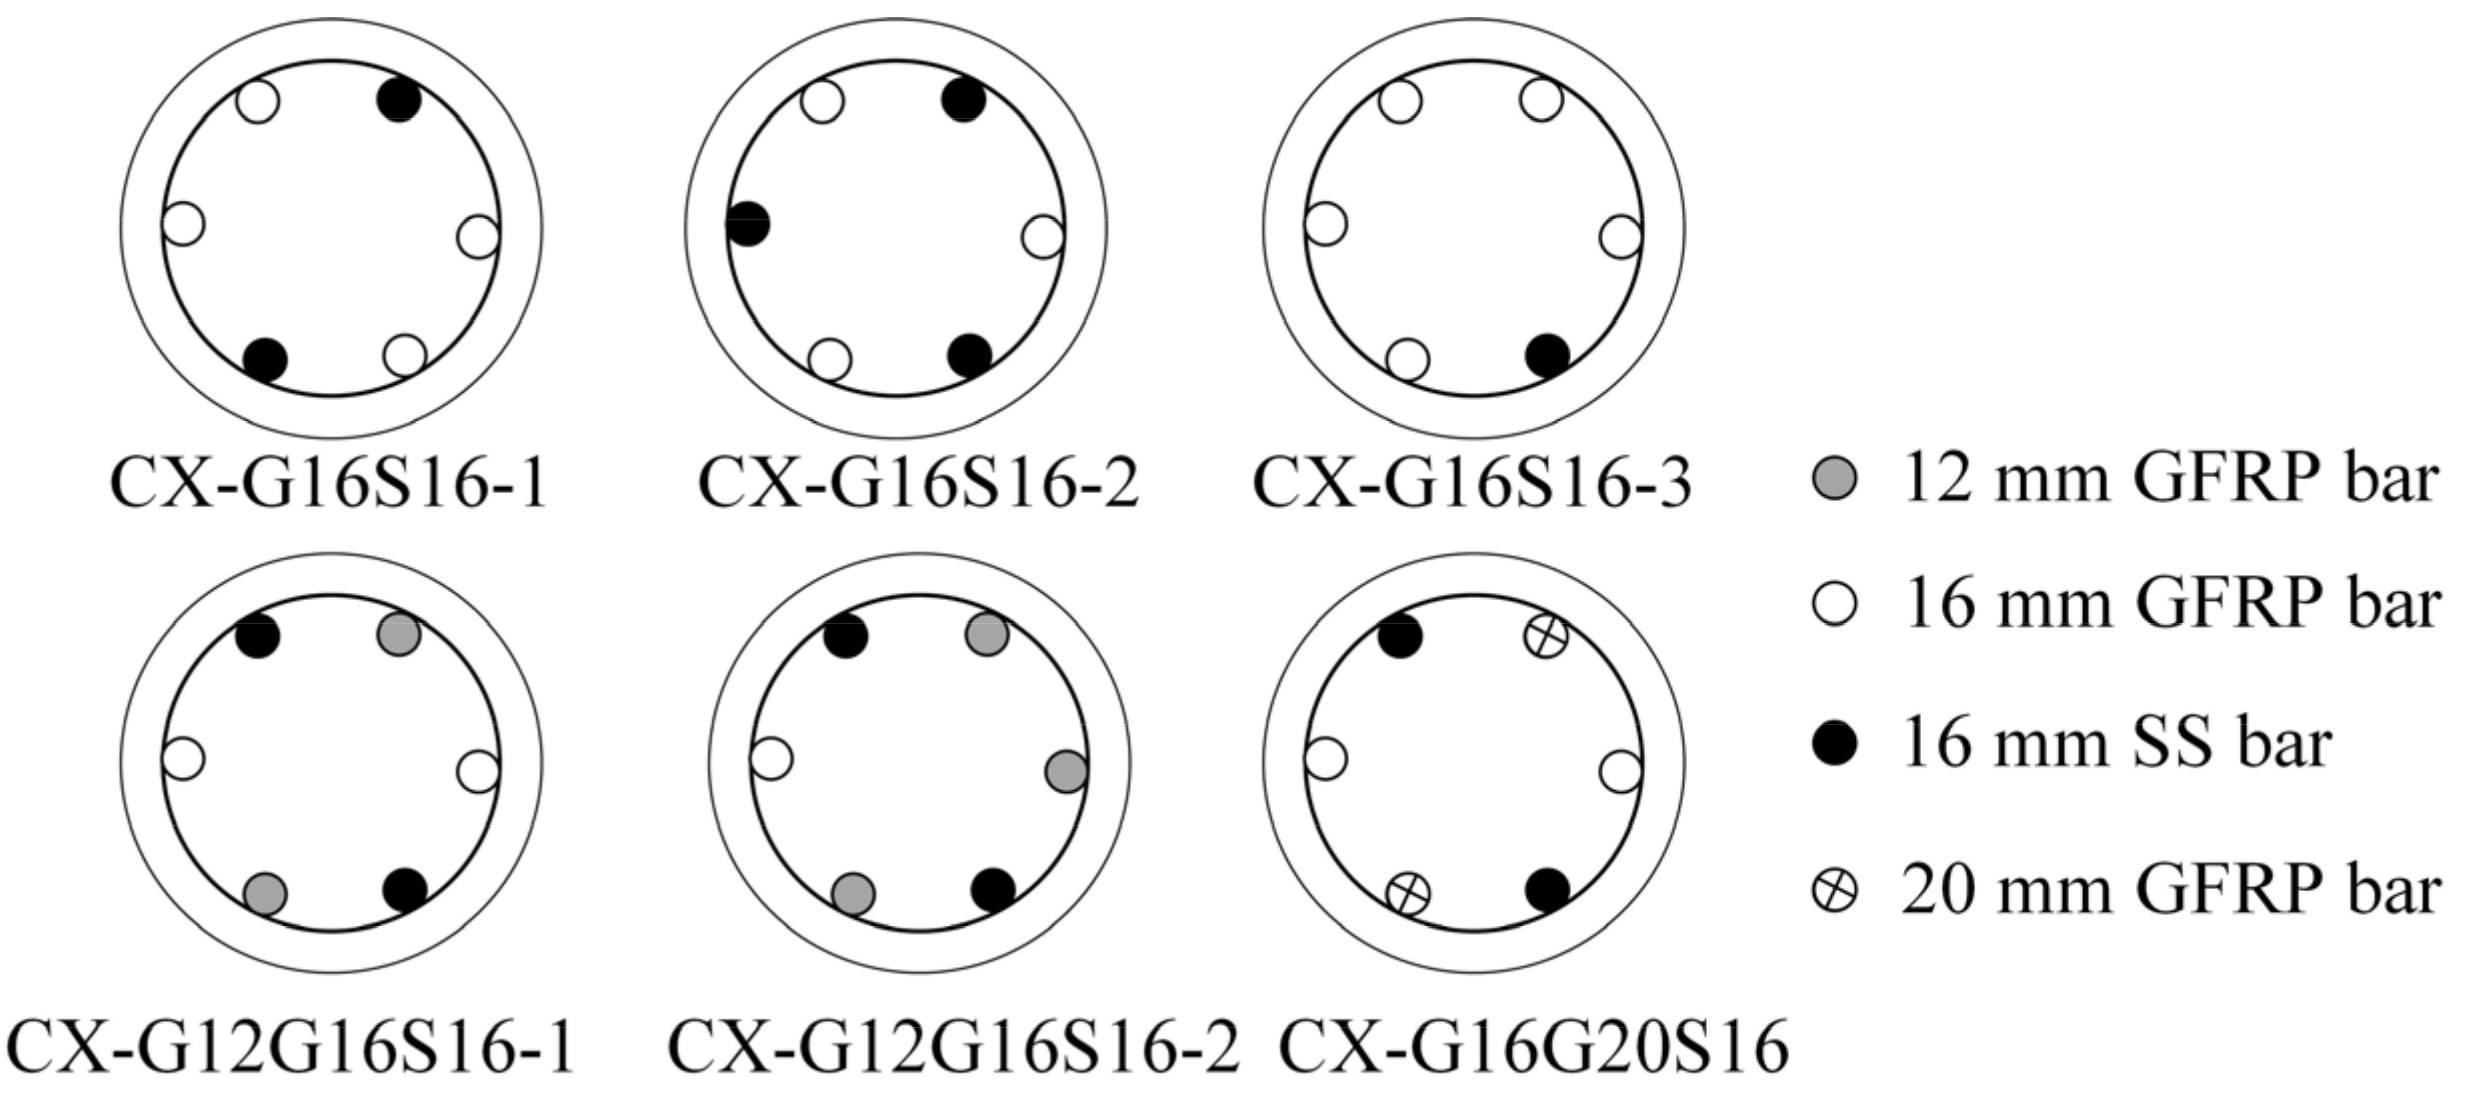
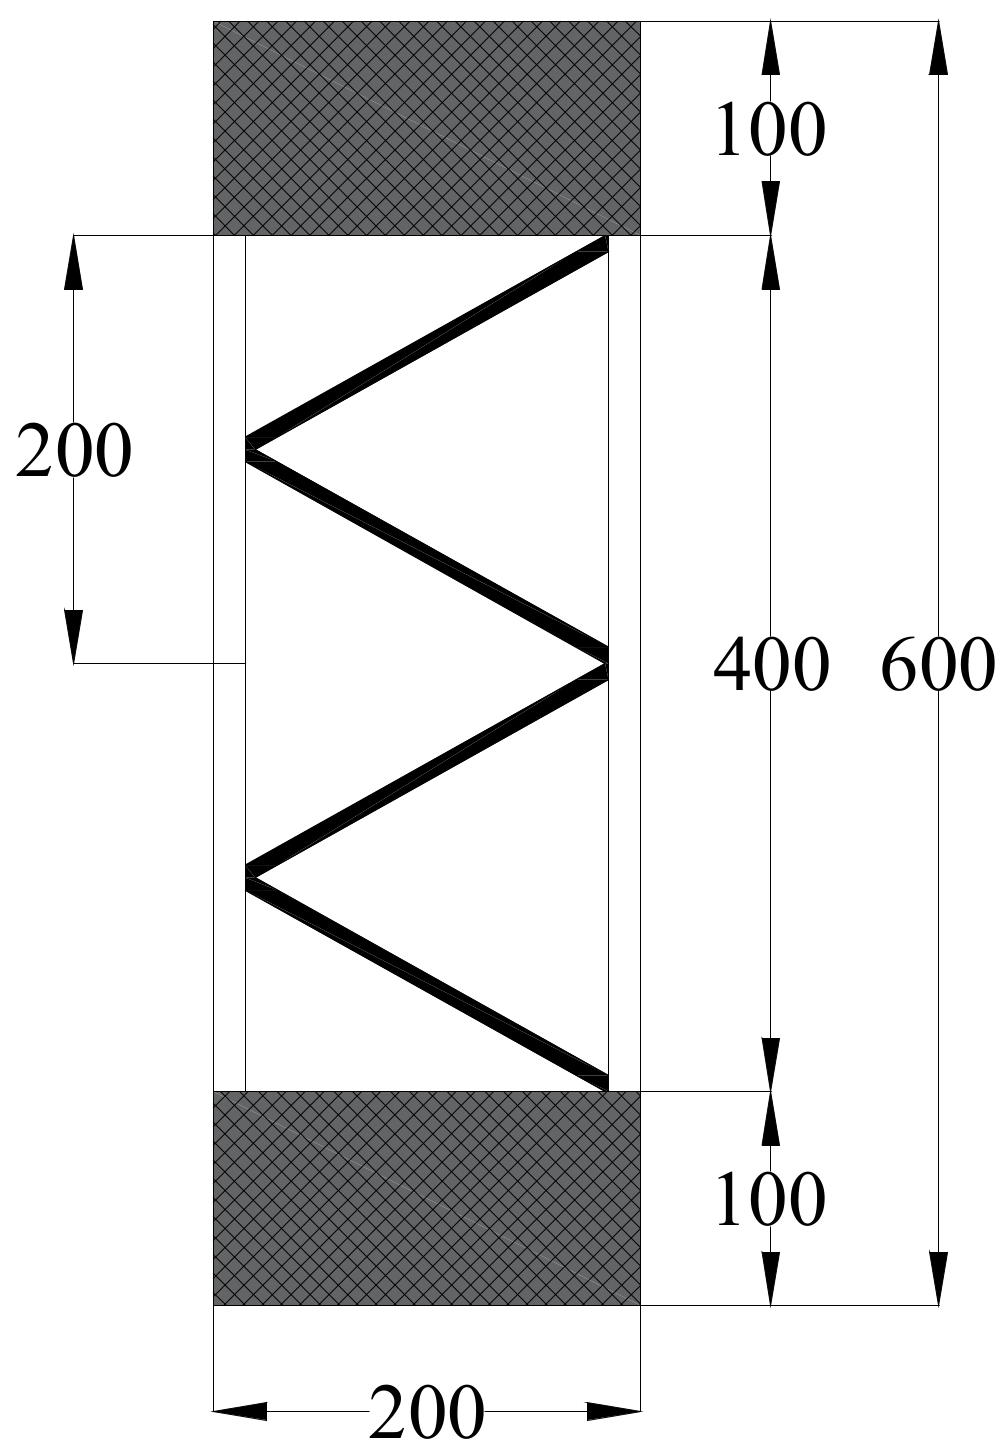
2.2. Specimen Design
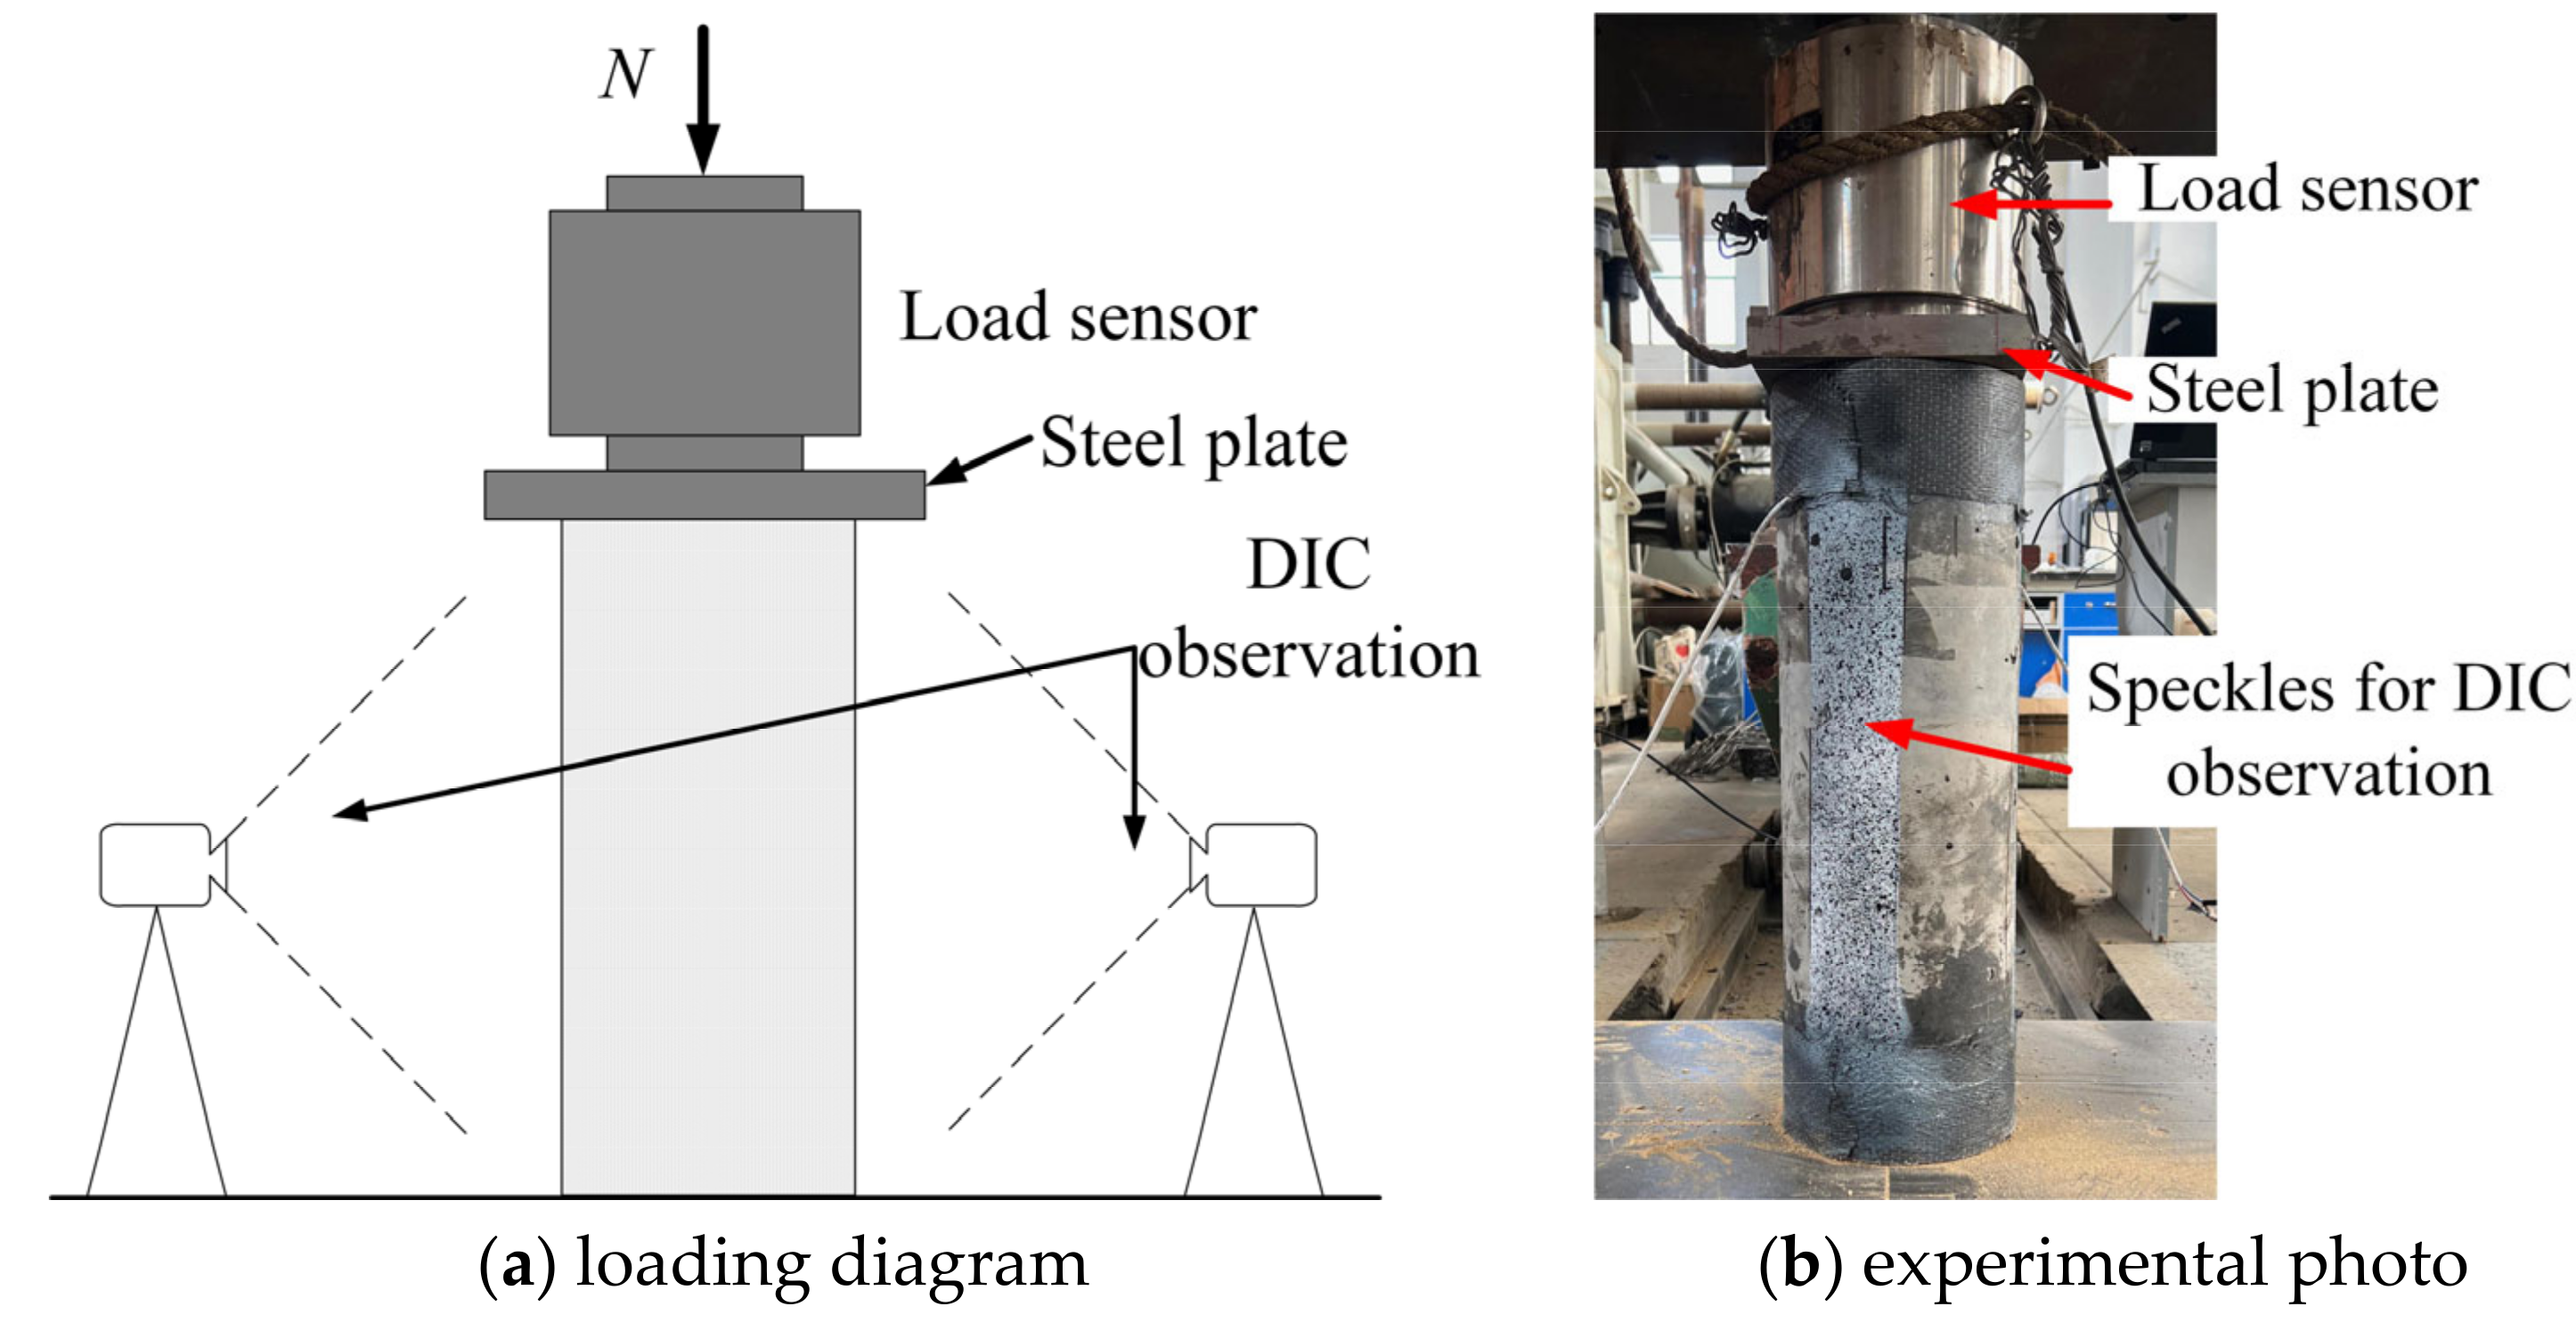
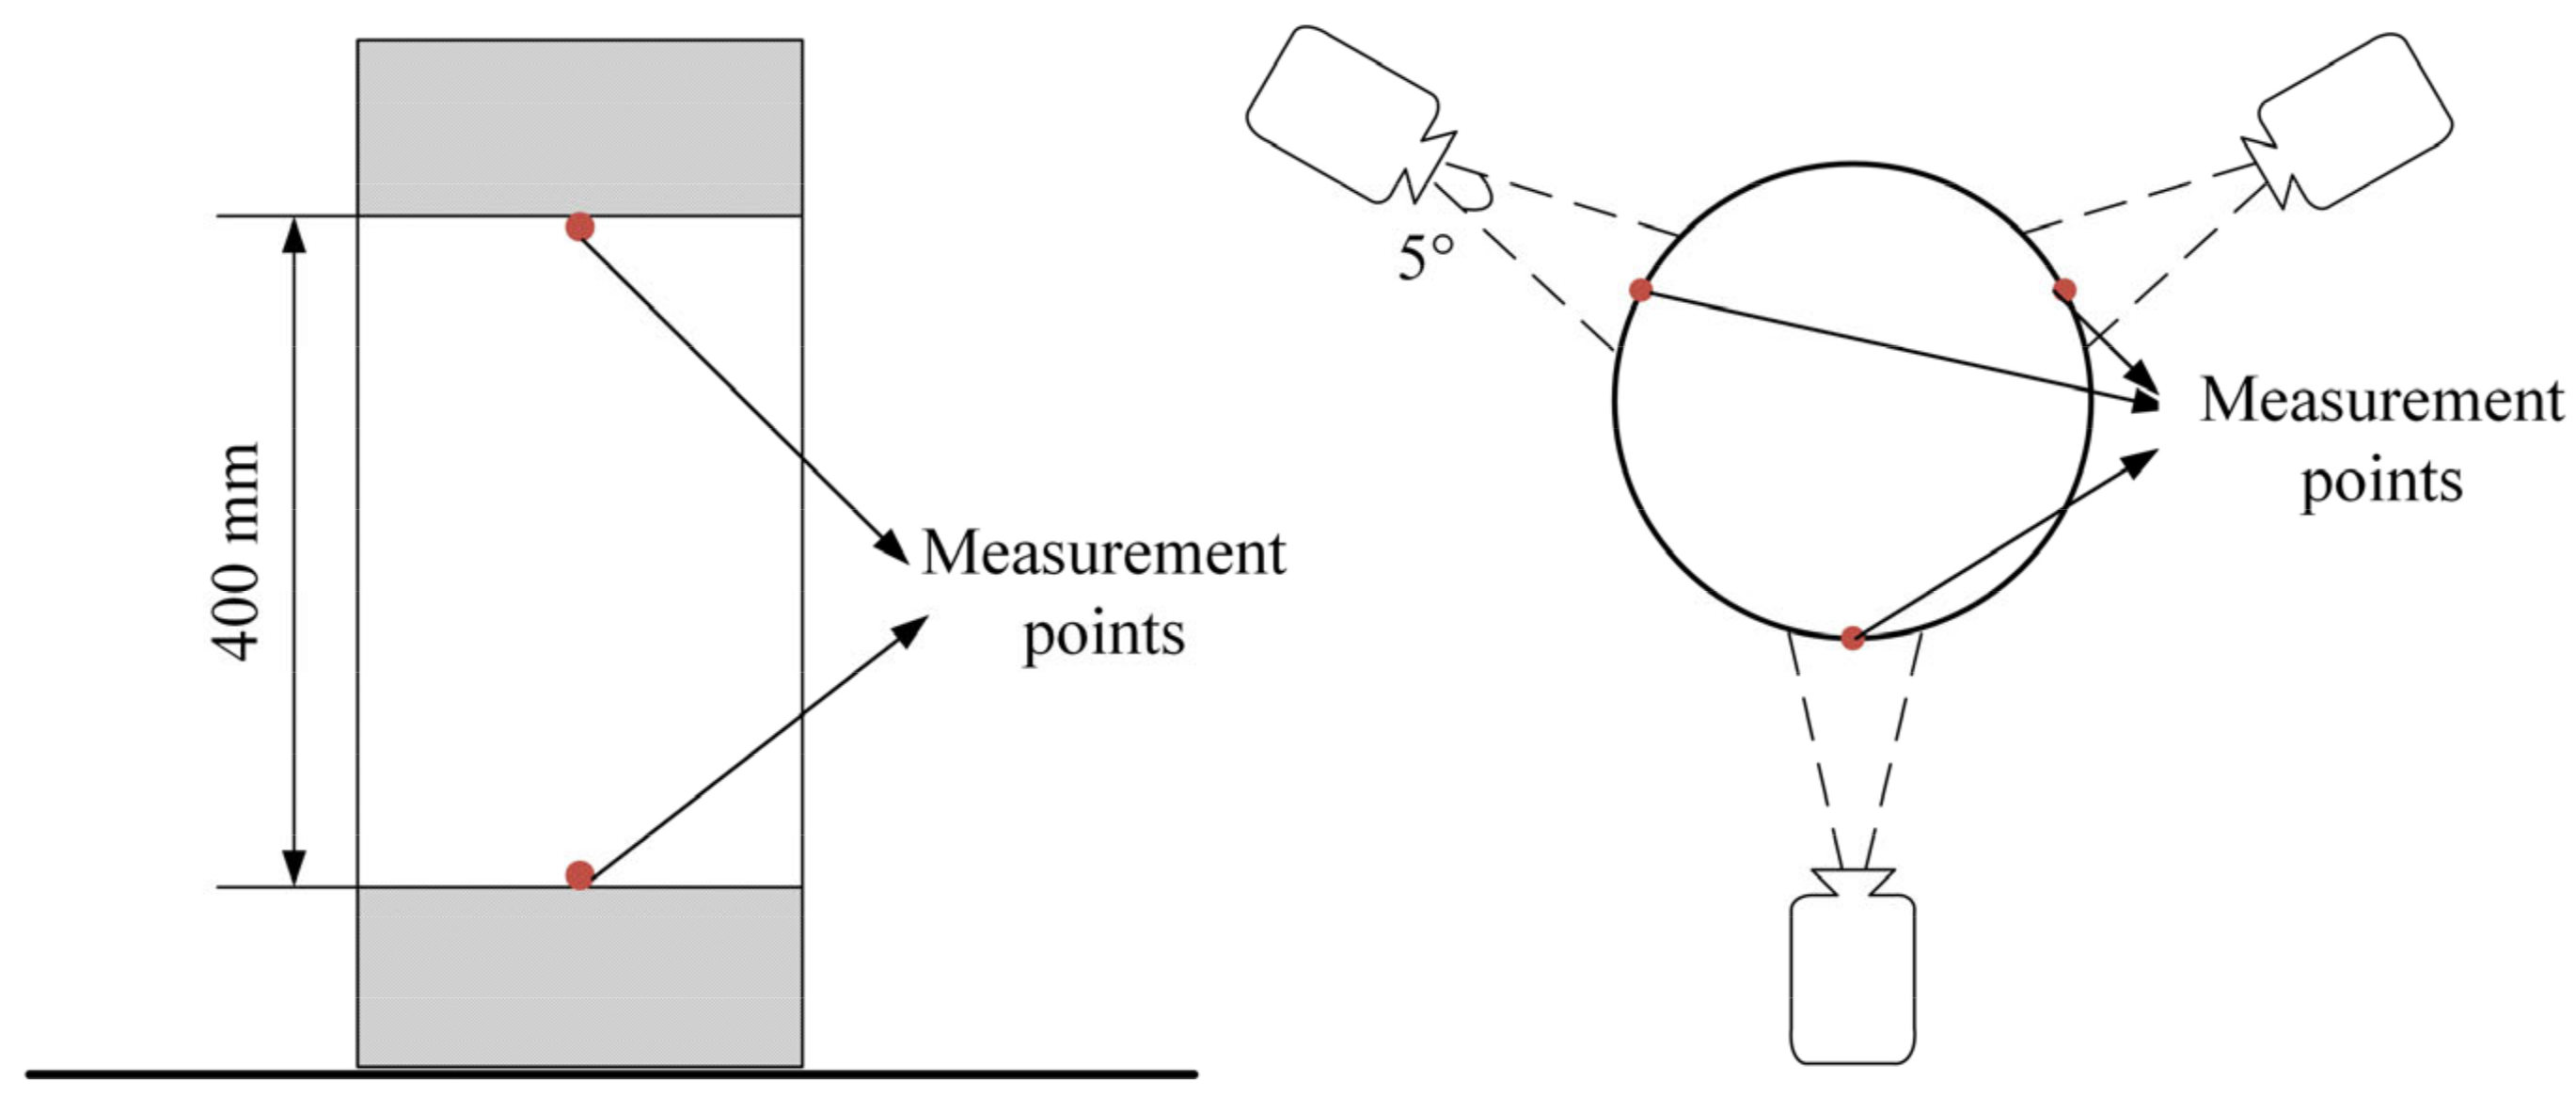
2.3. Instrumentation
3. Test Results and Discussions
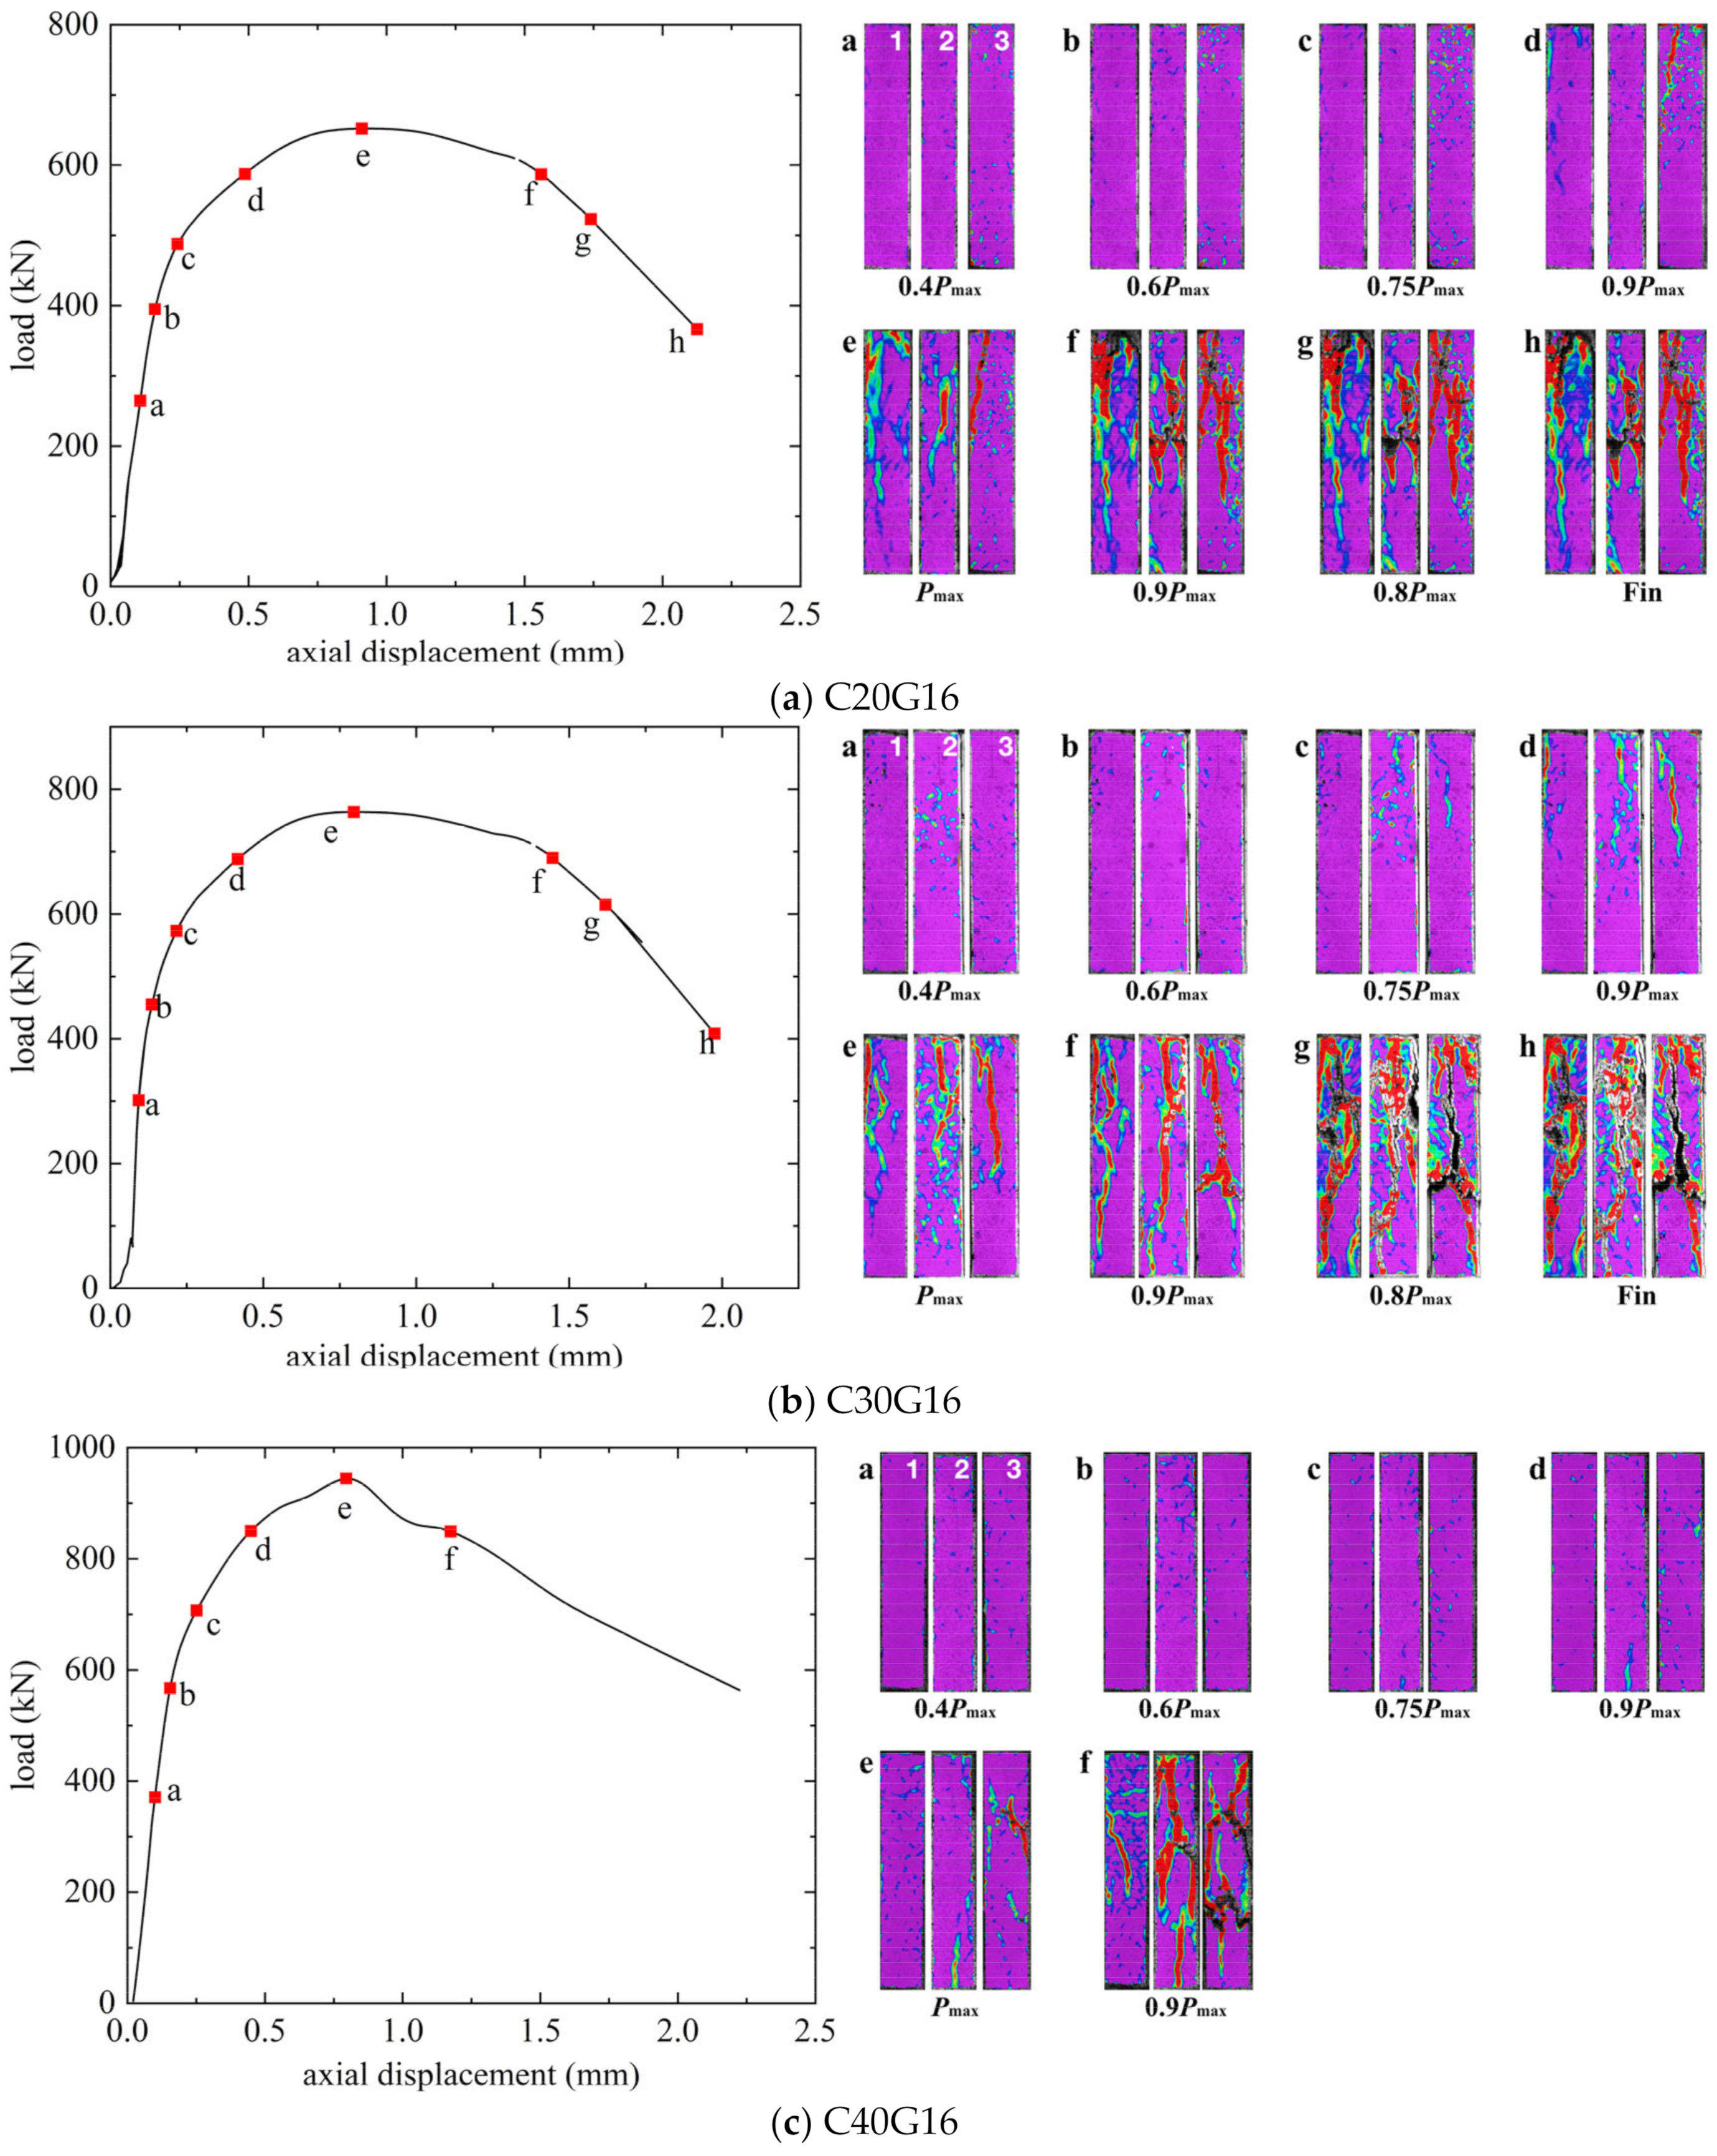
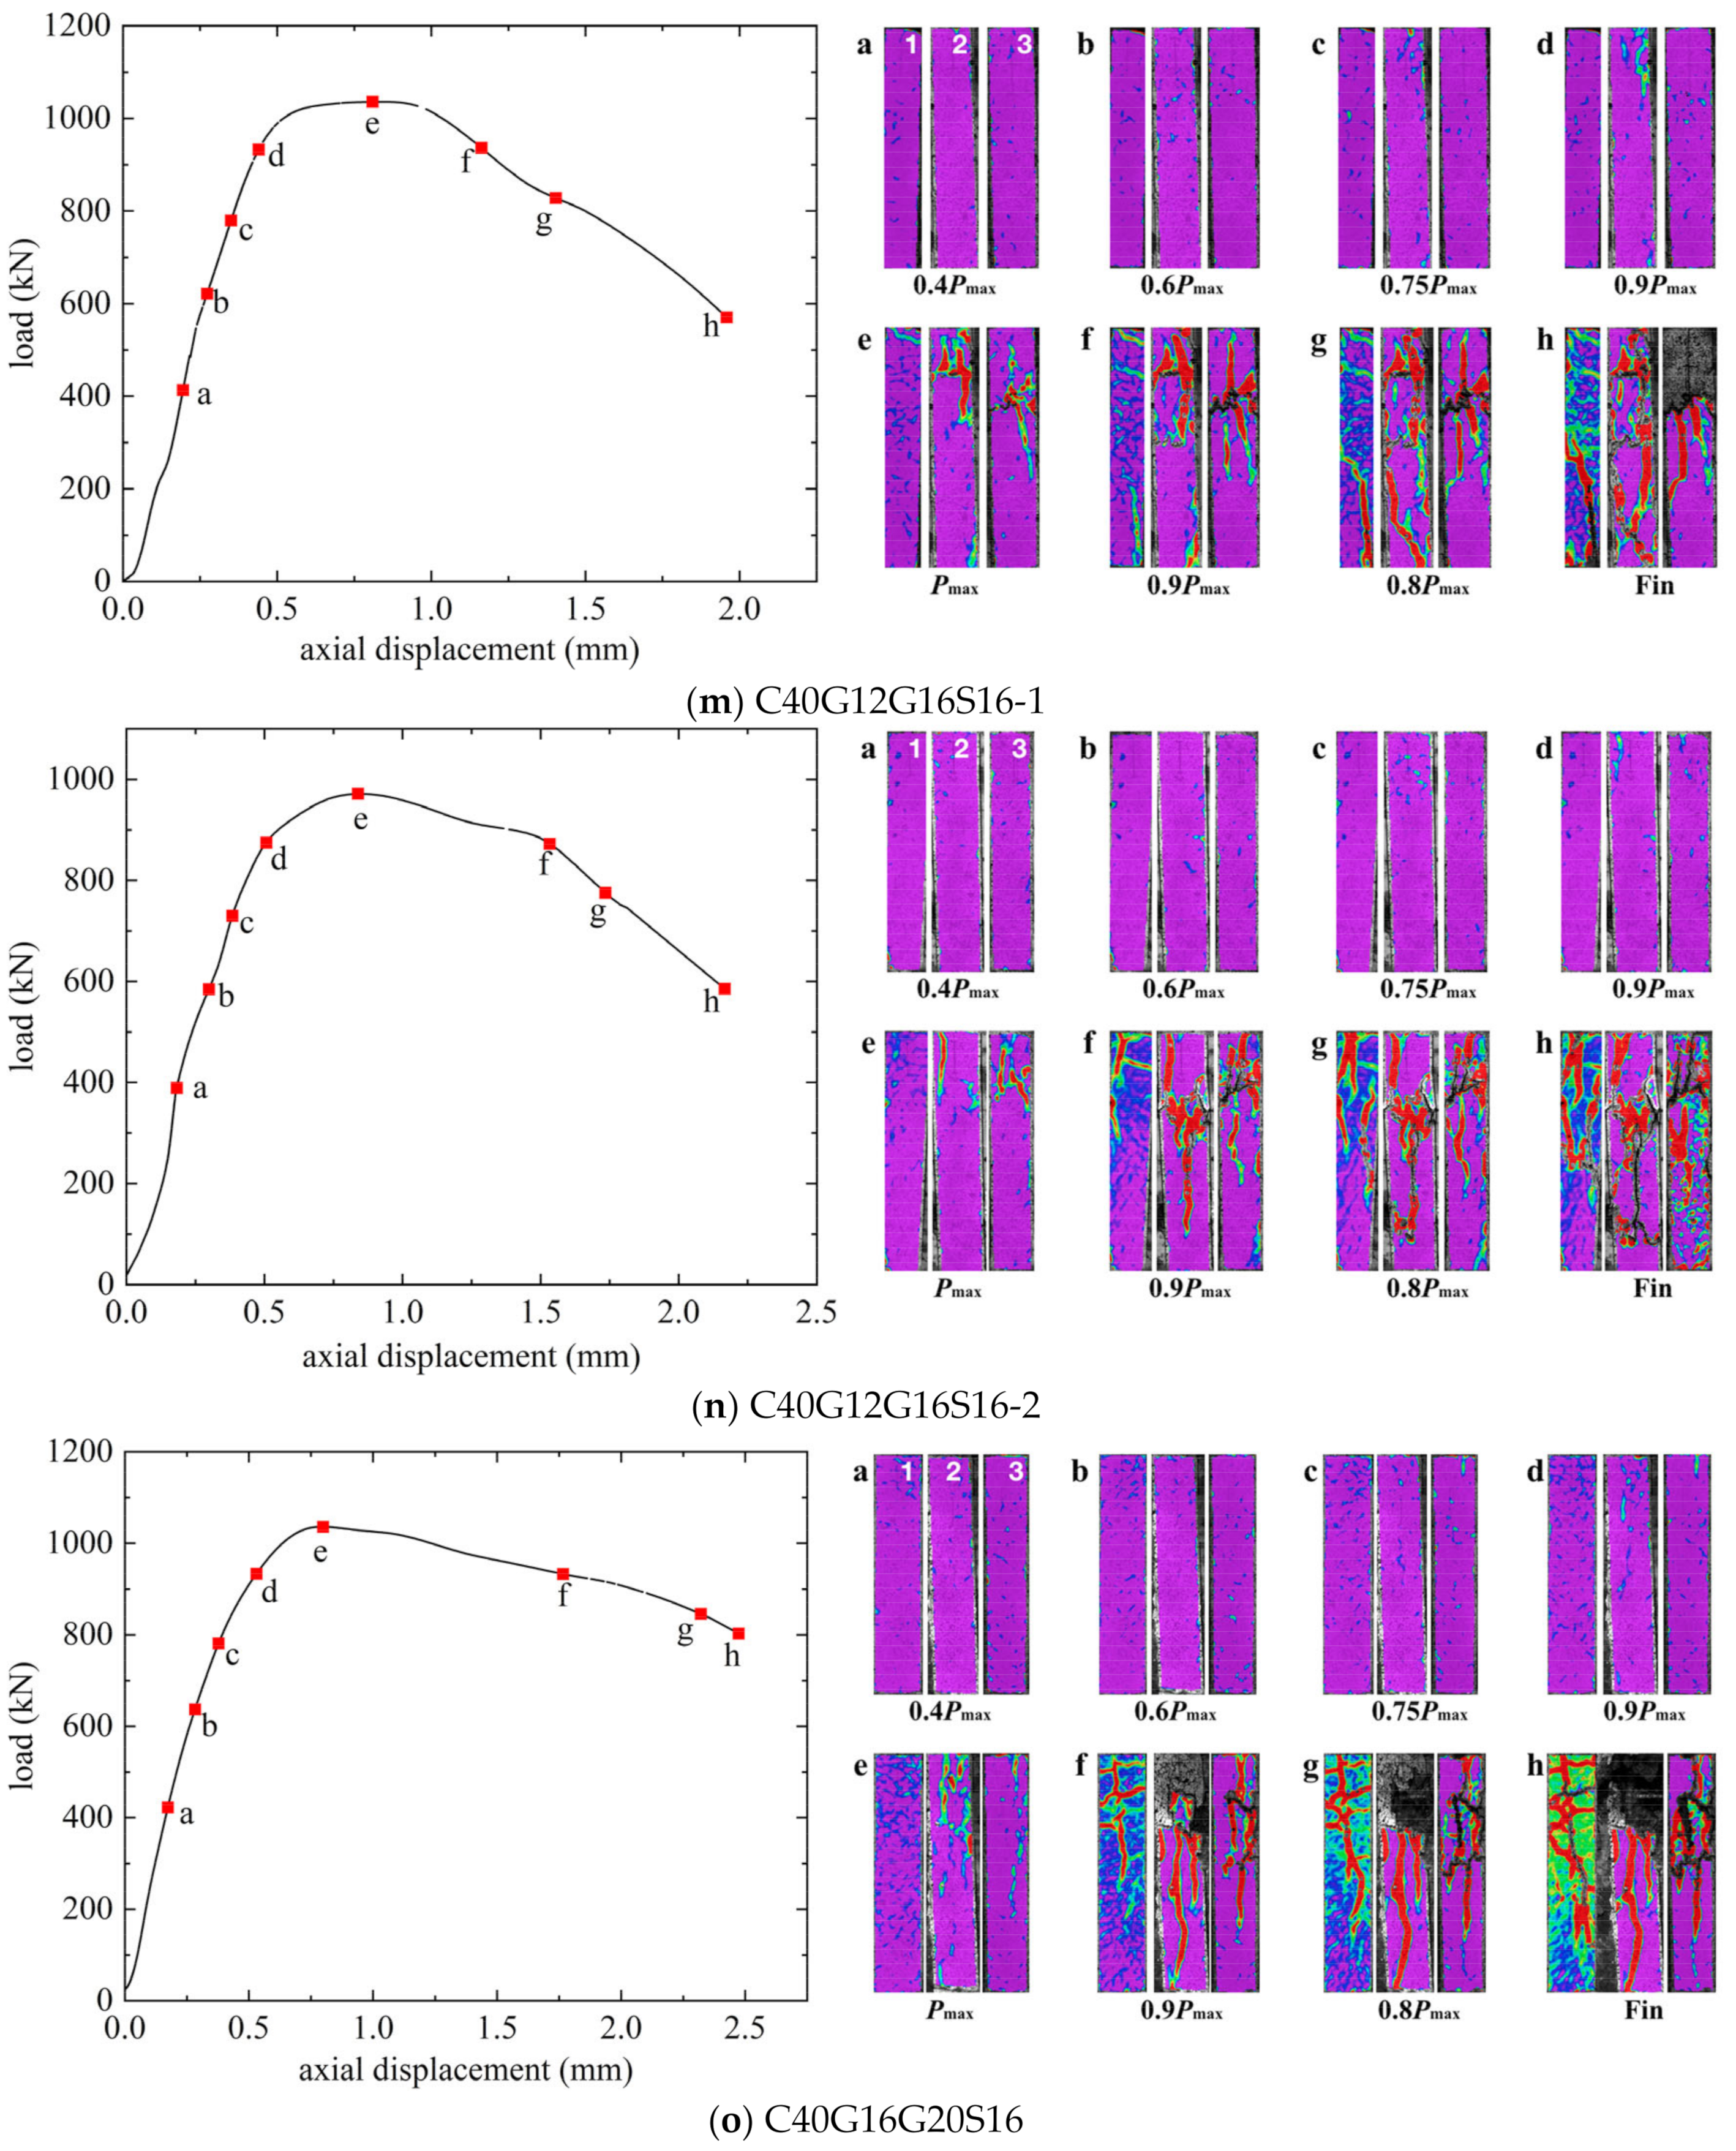
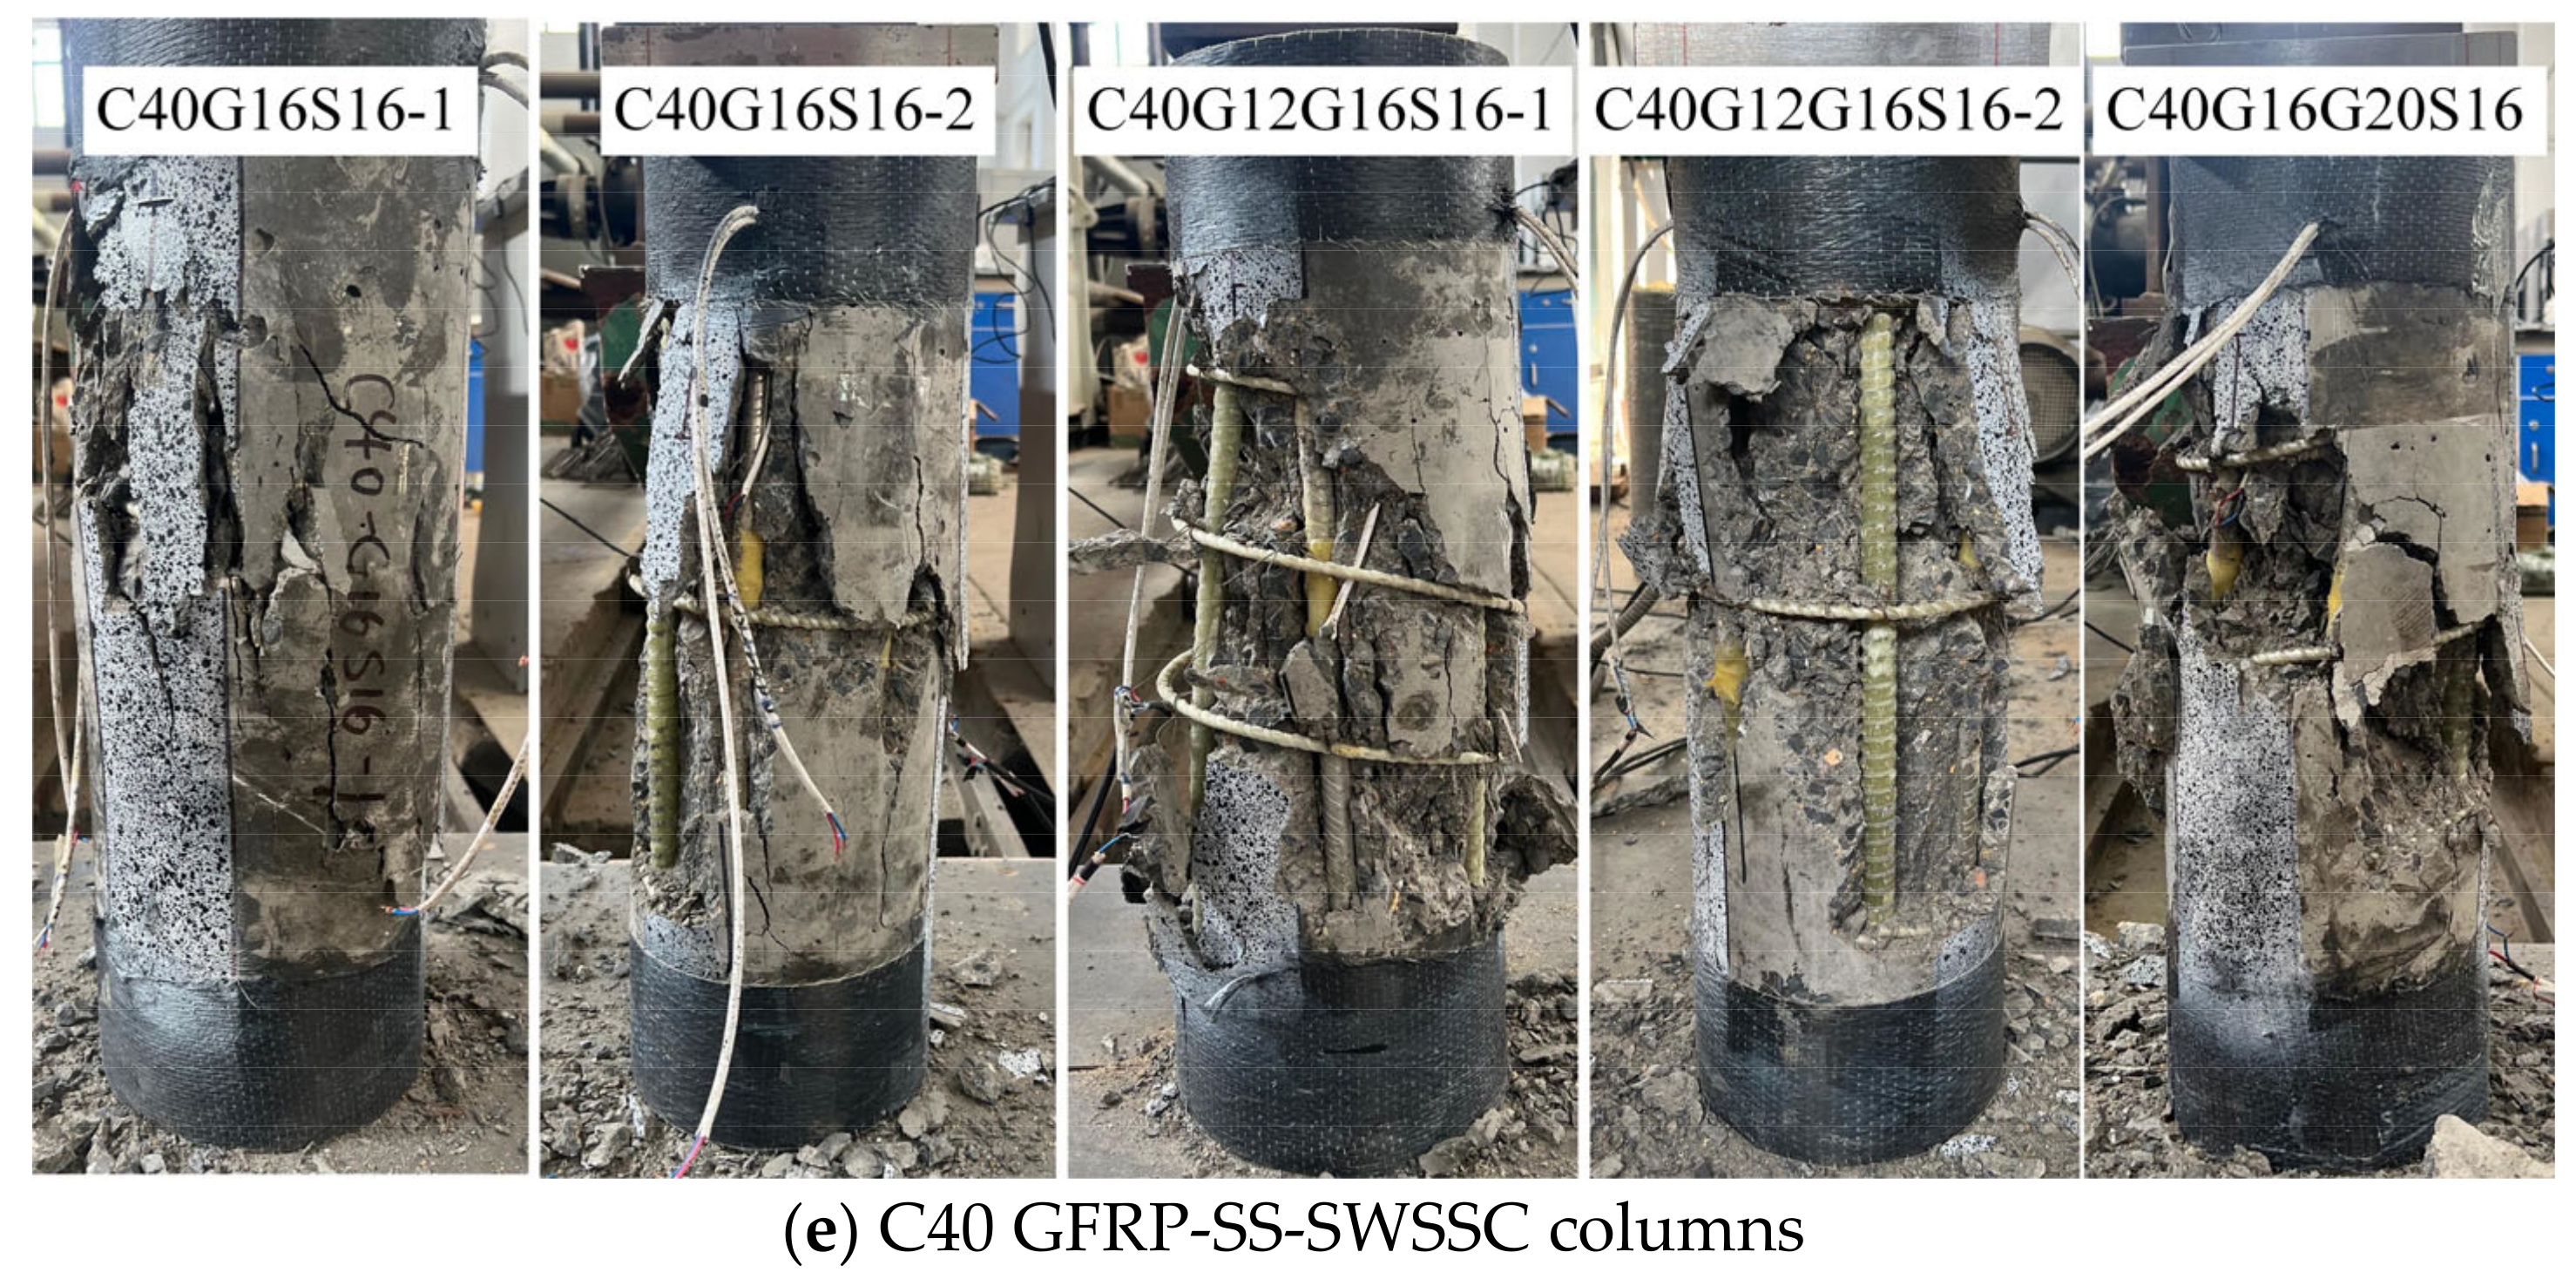
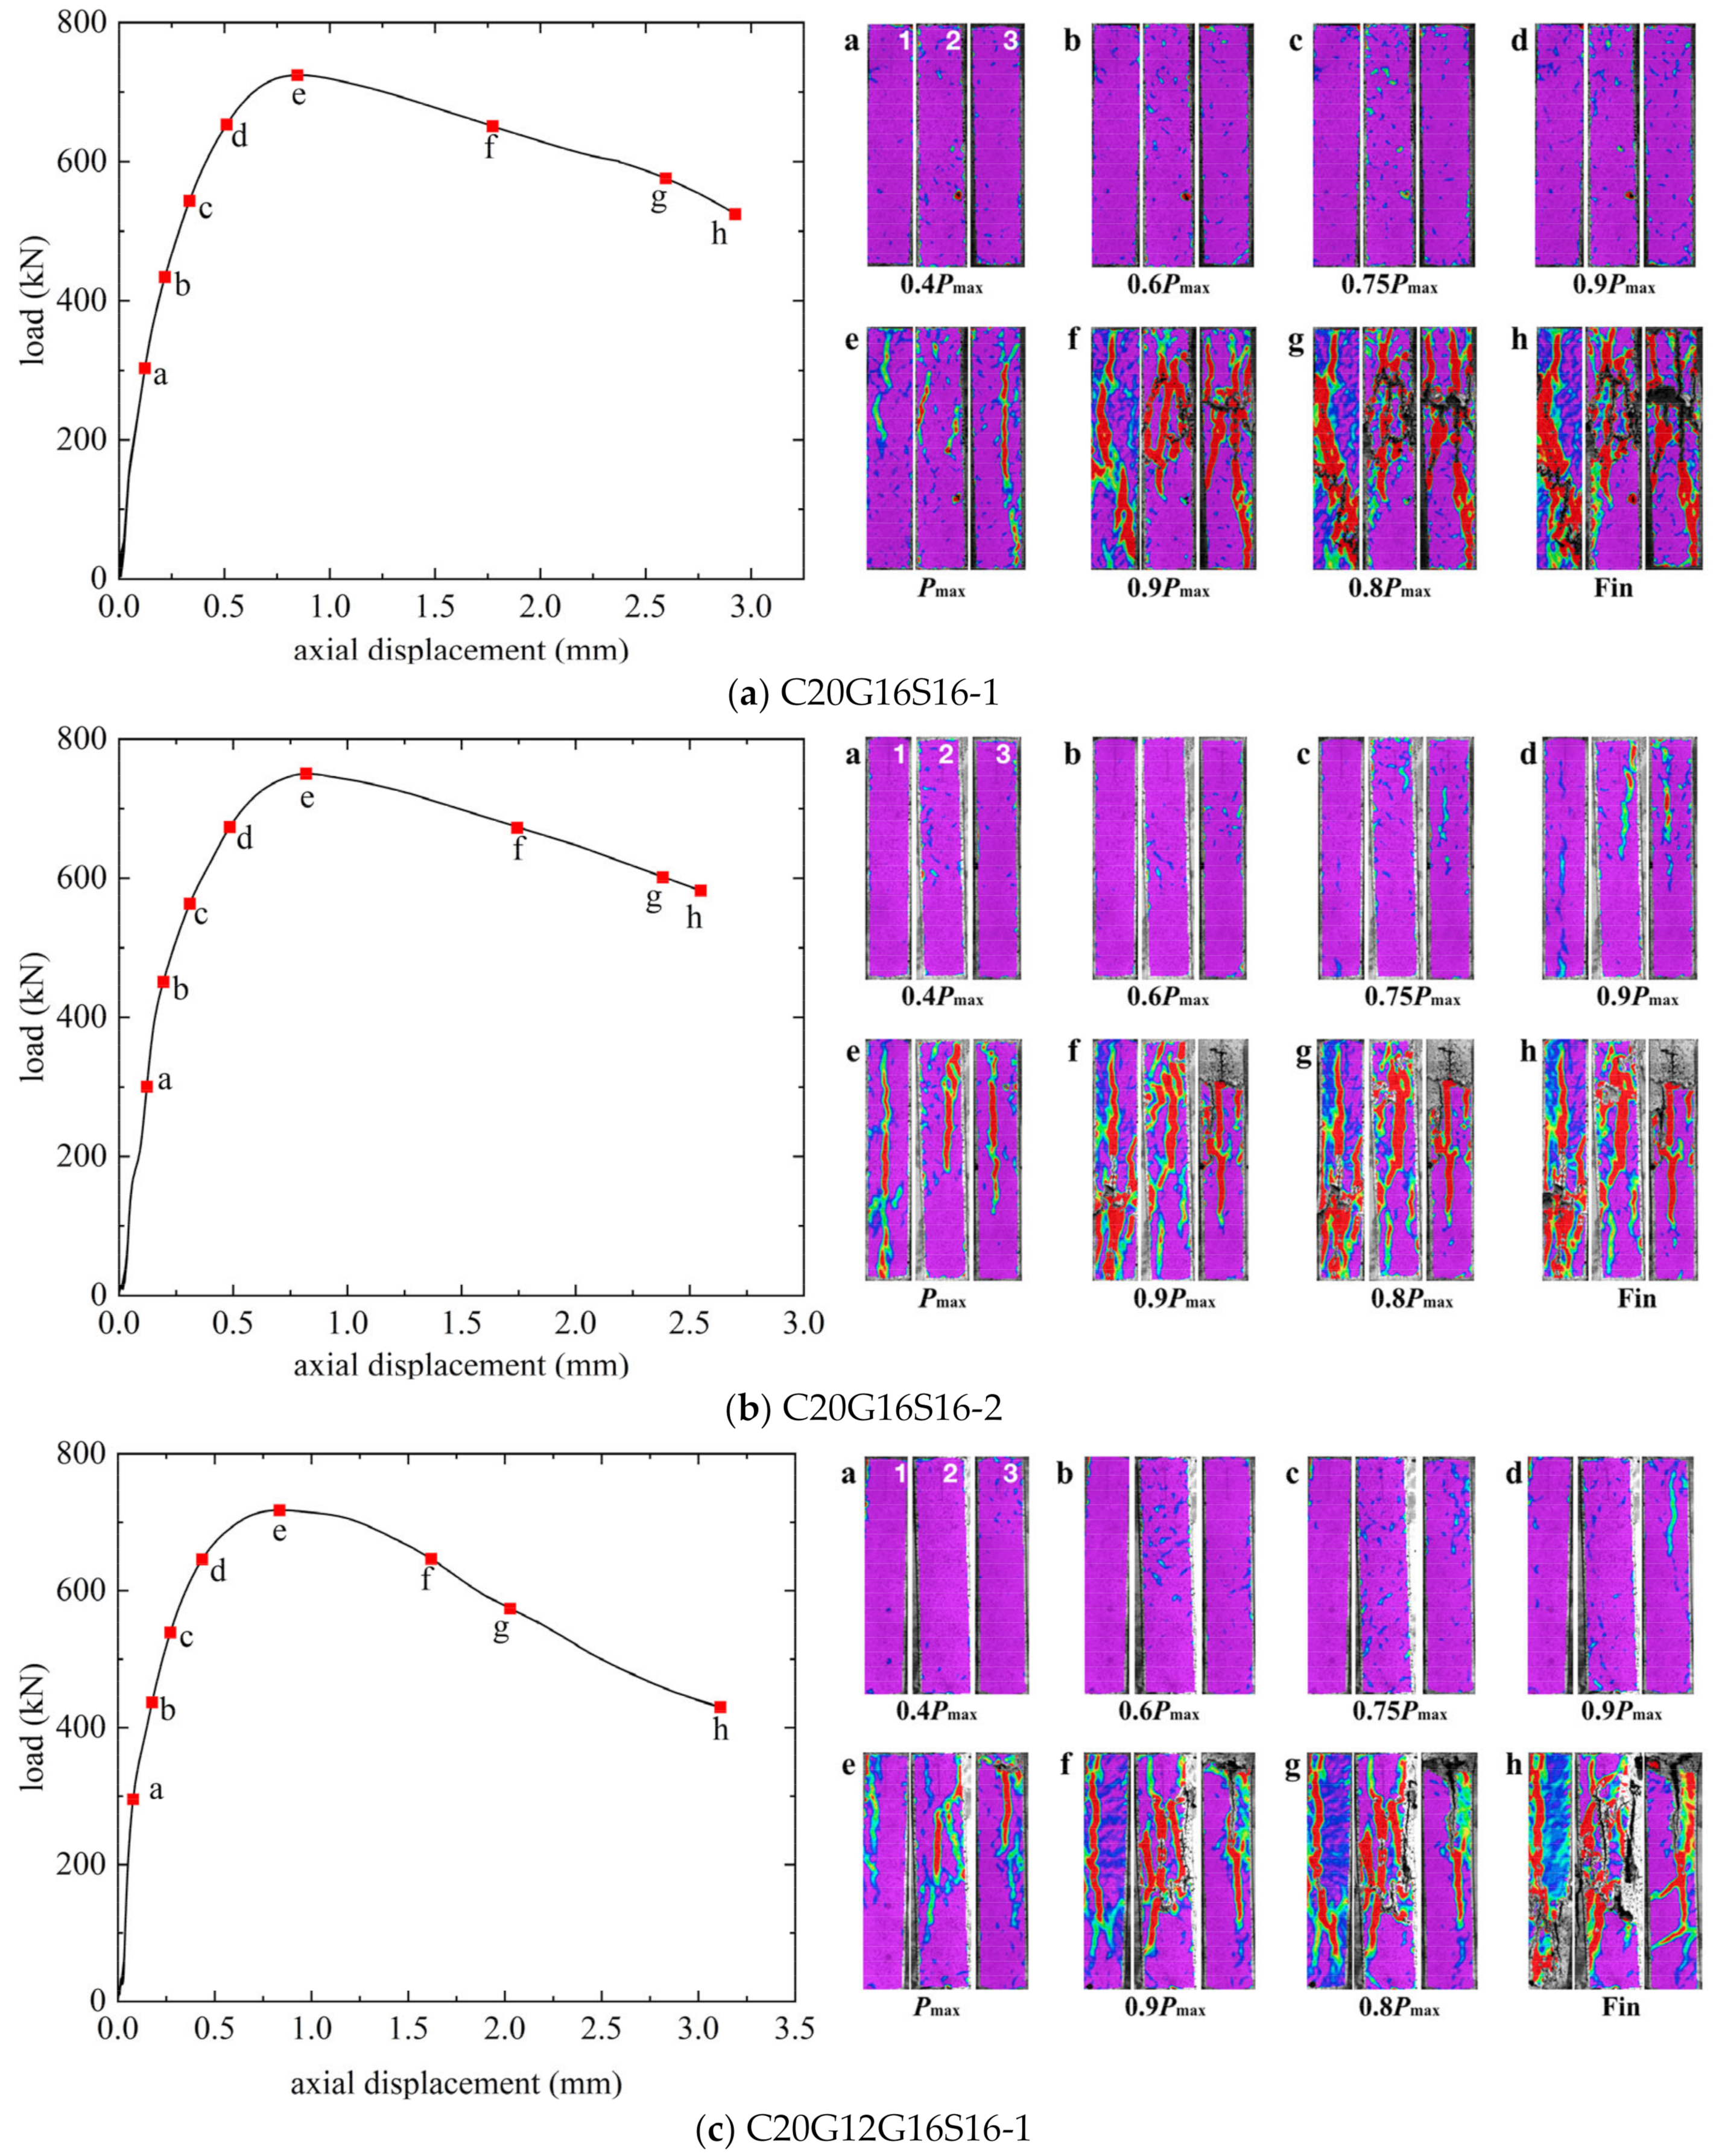
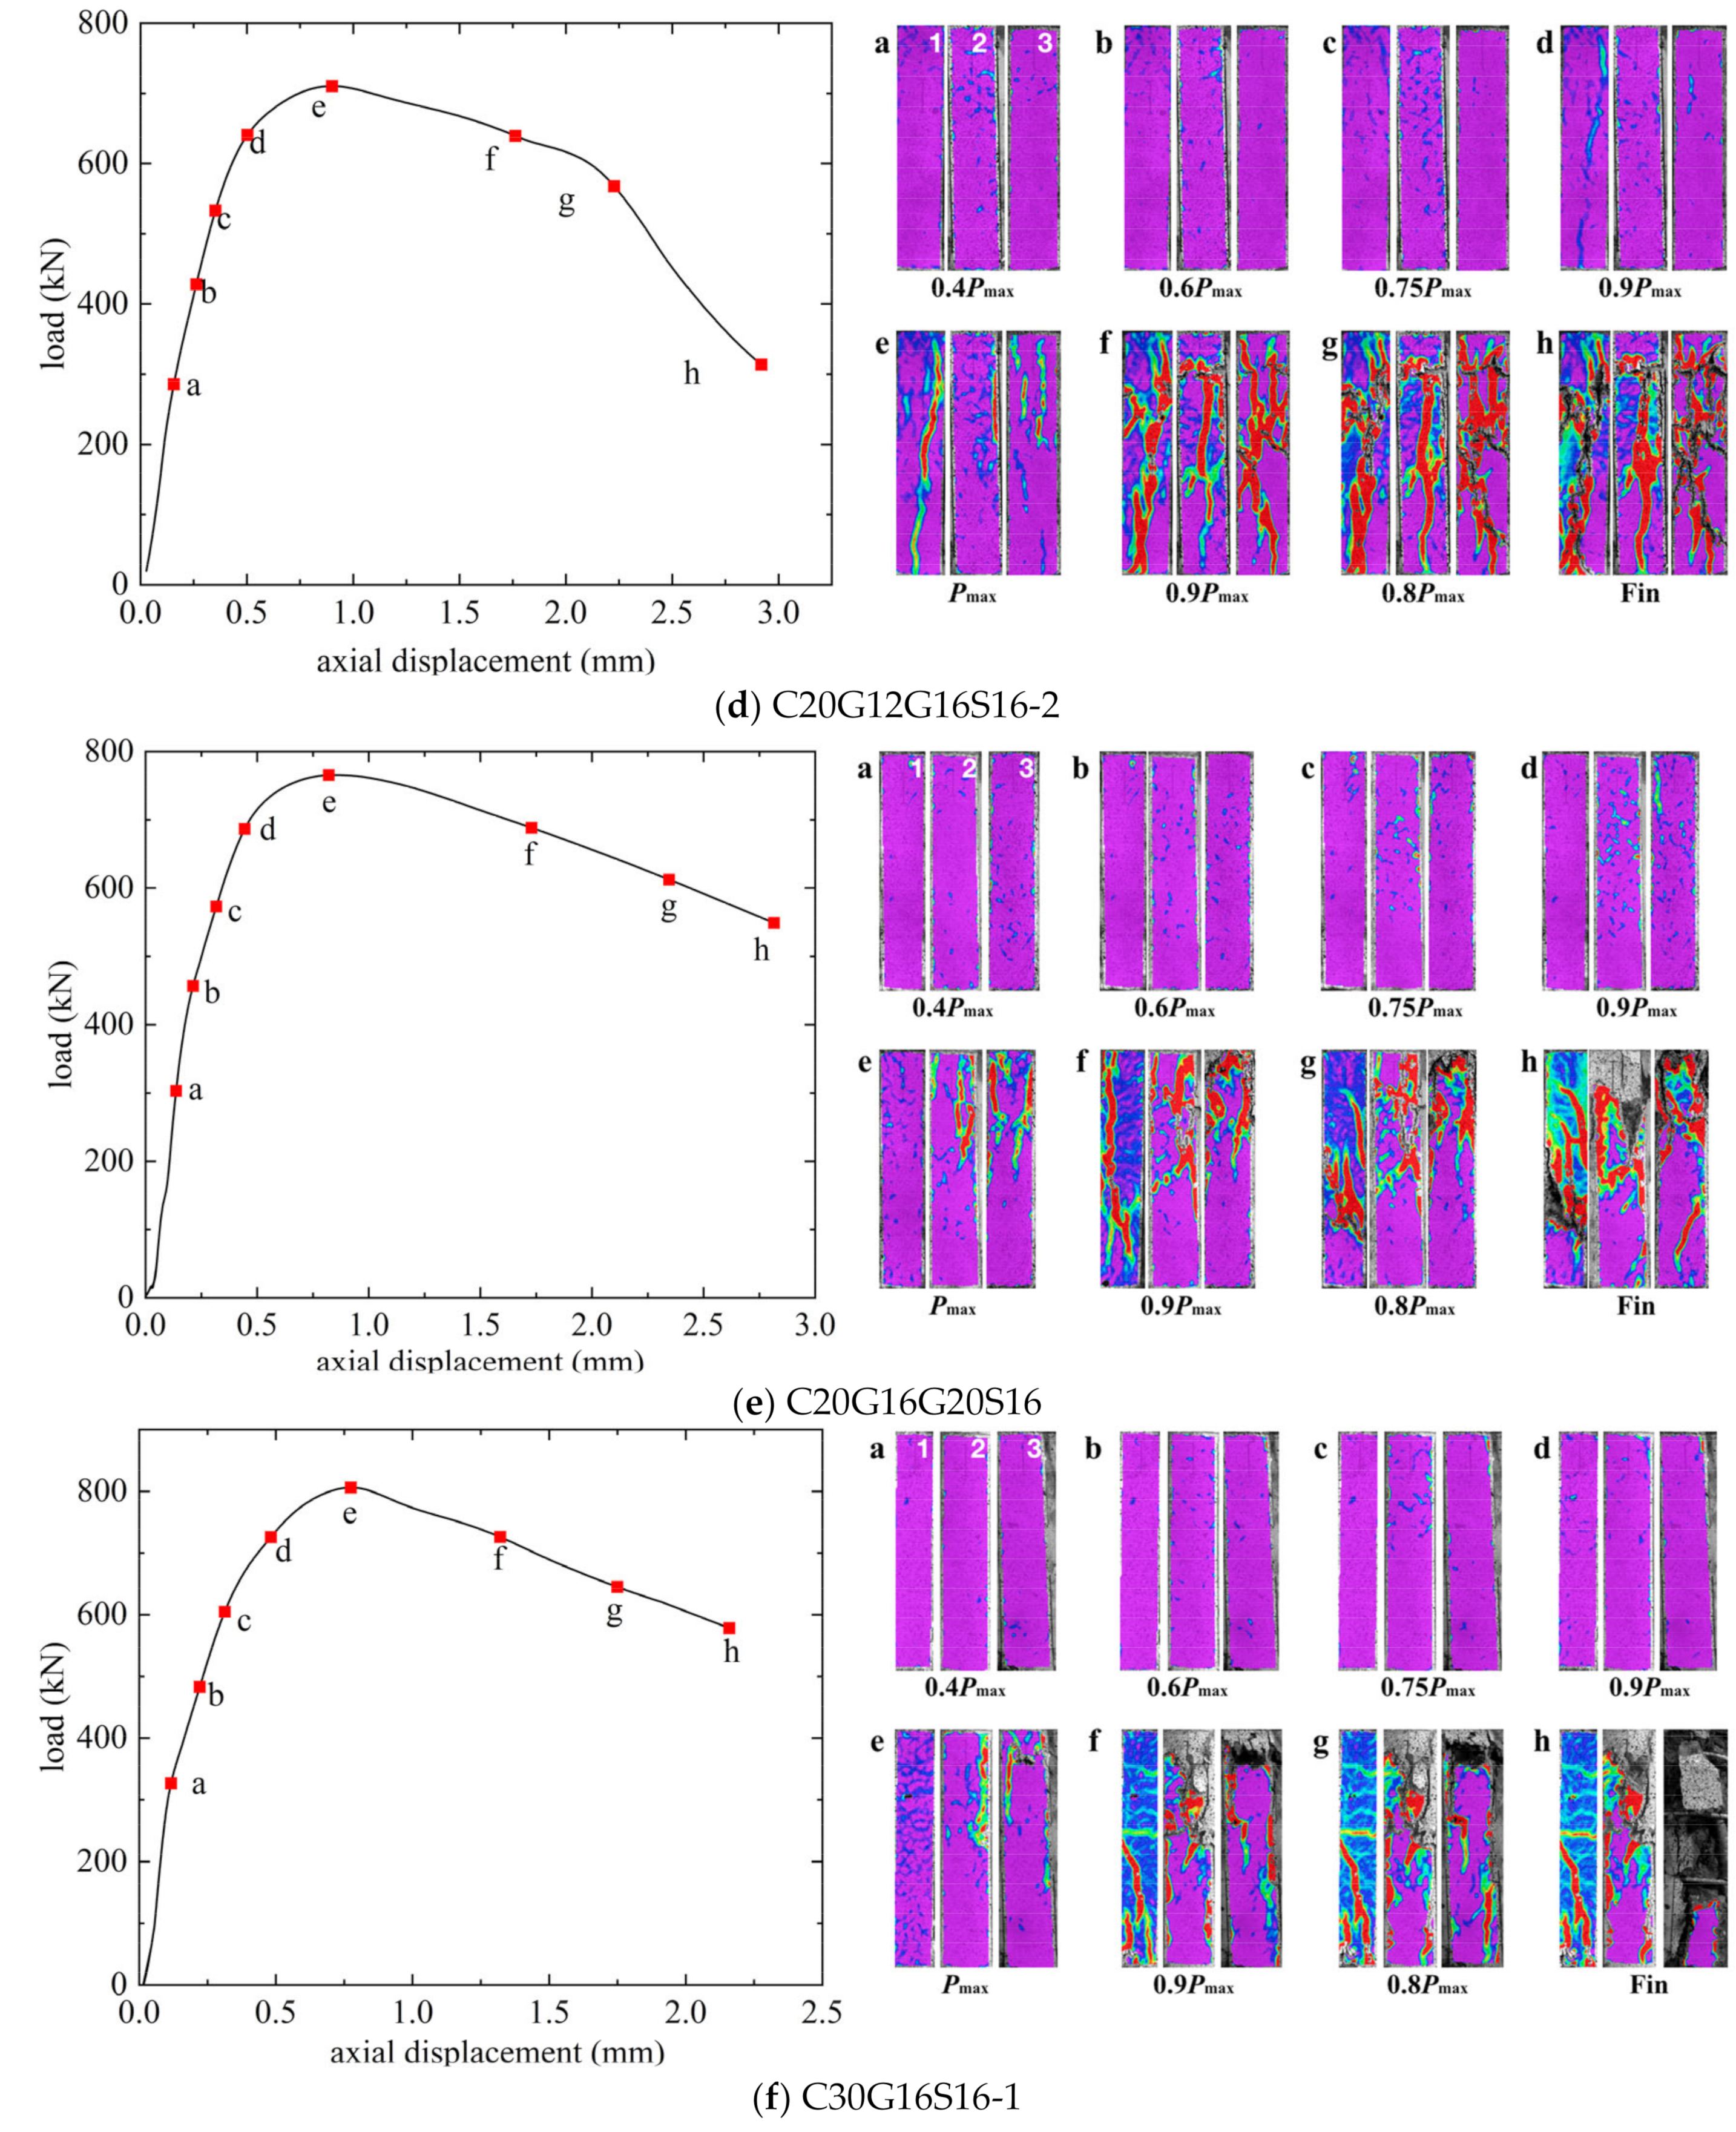
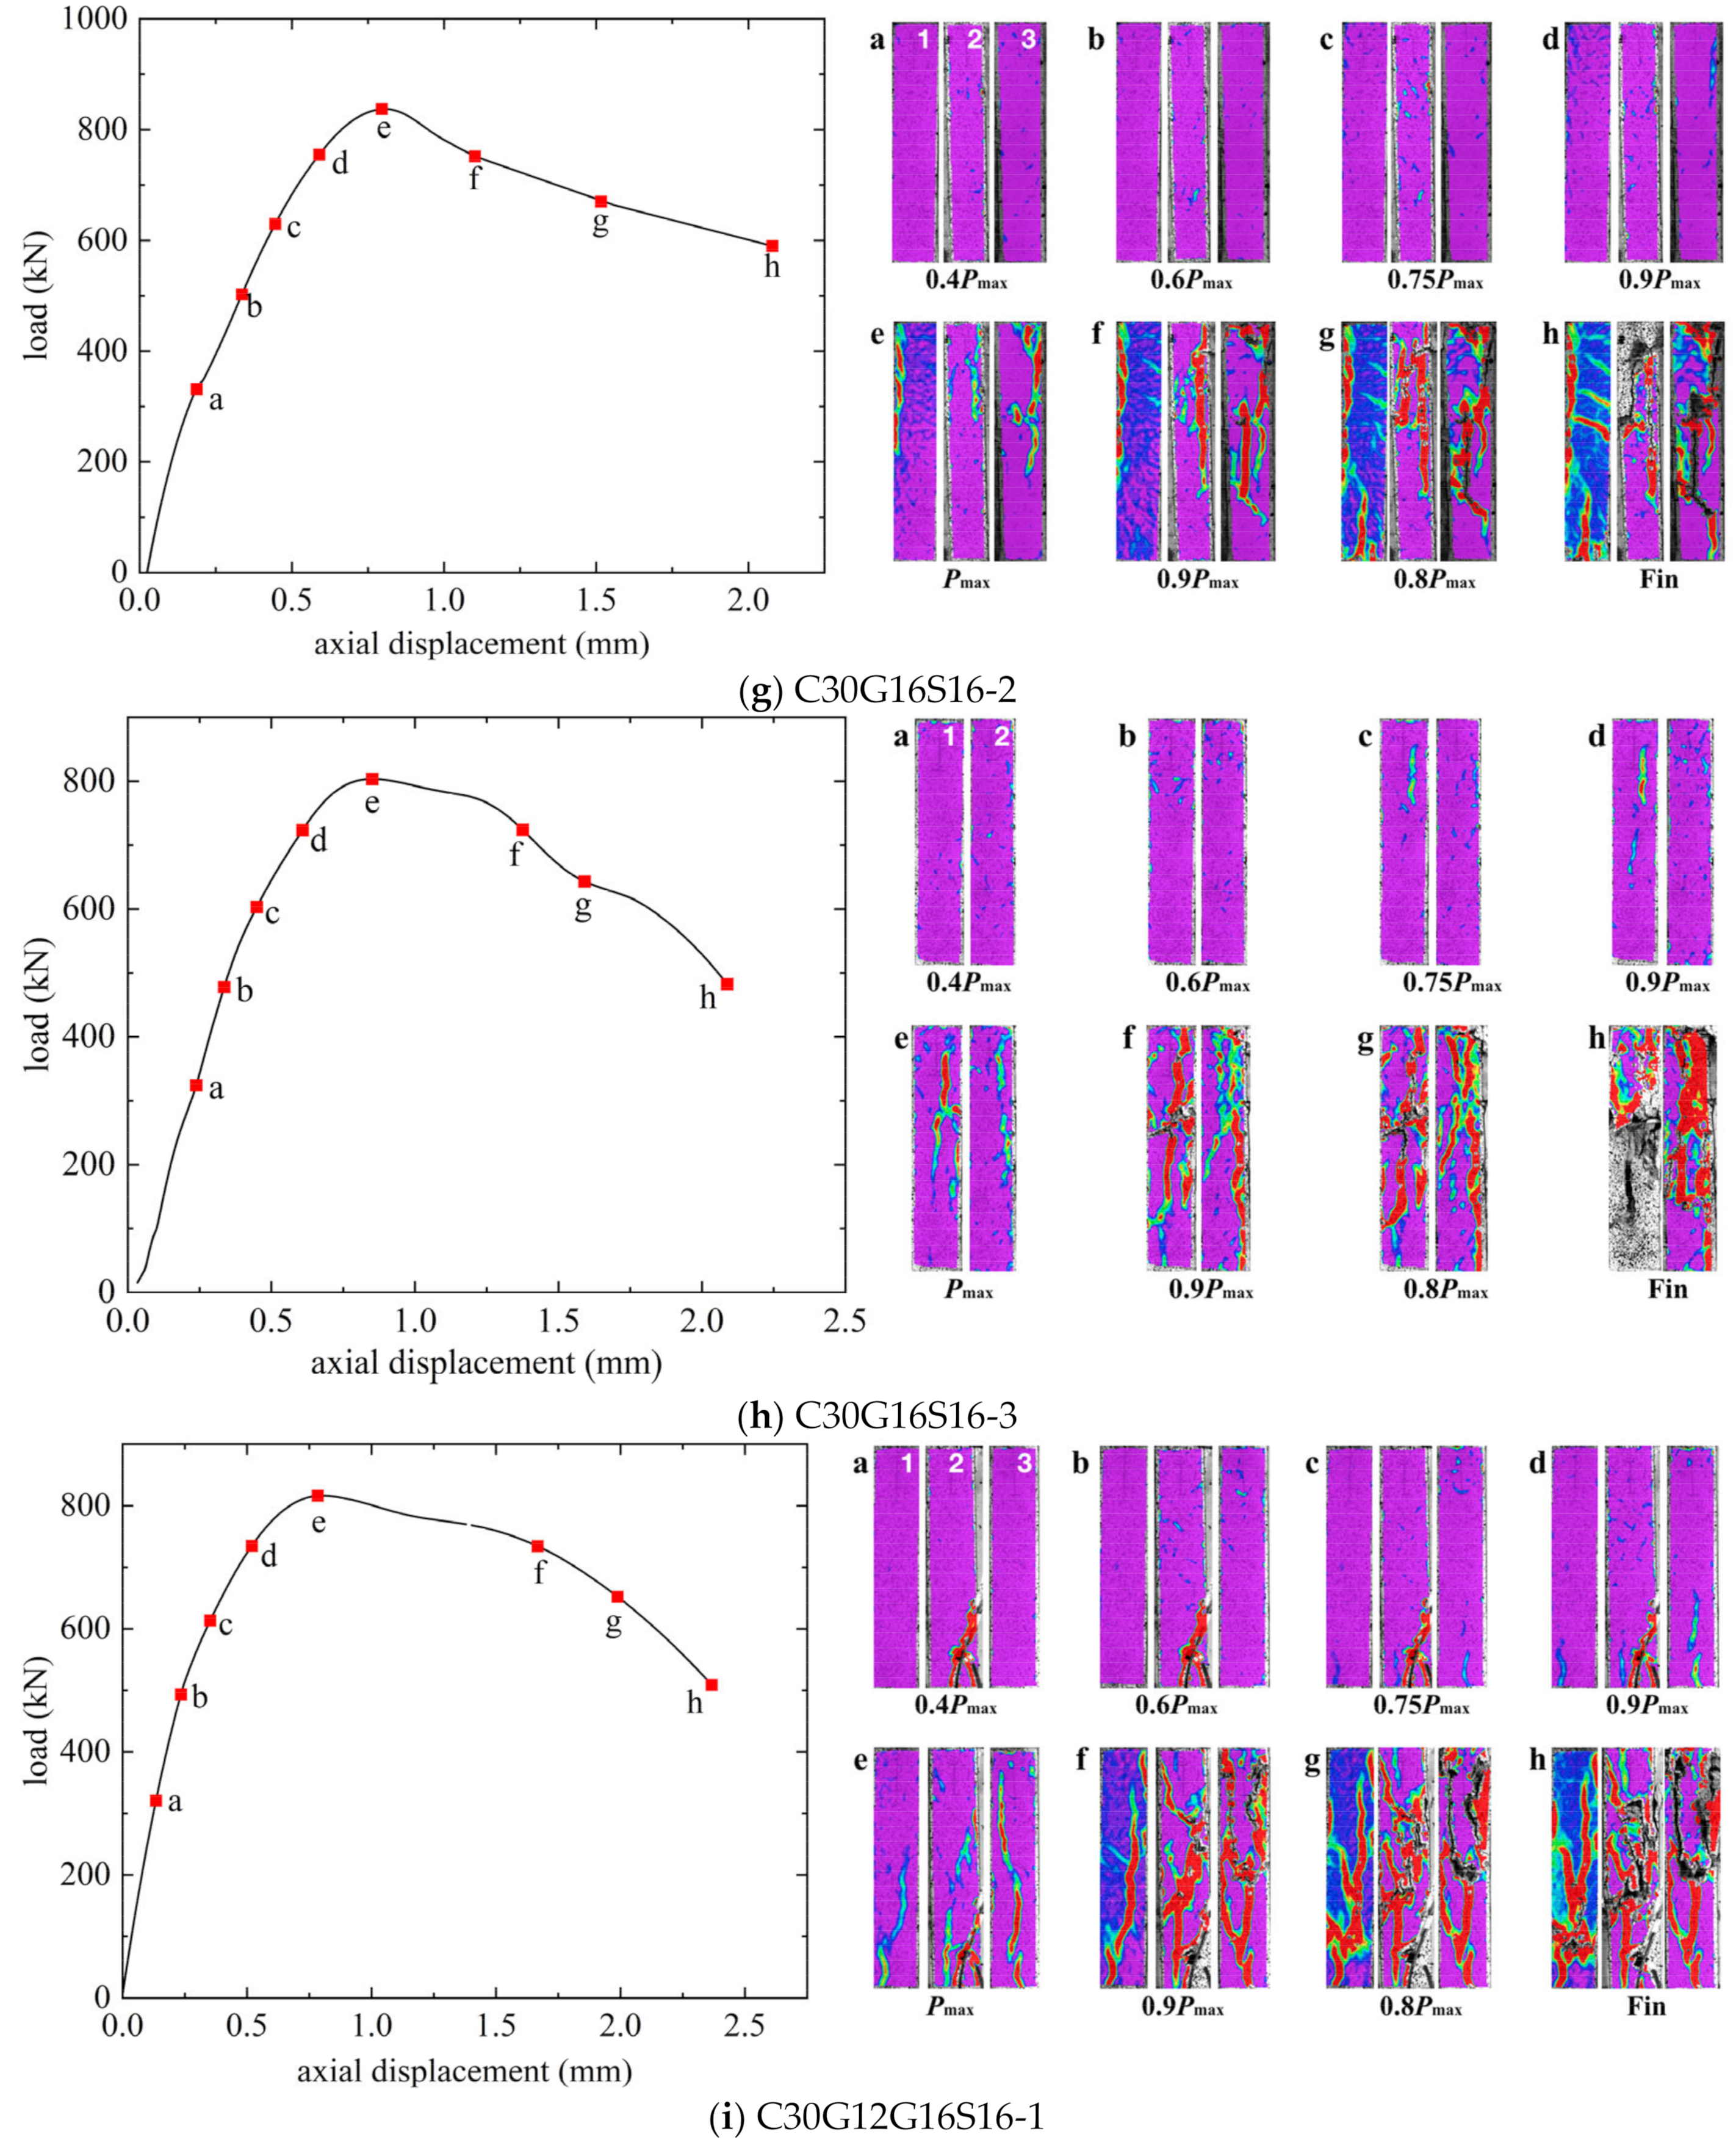
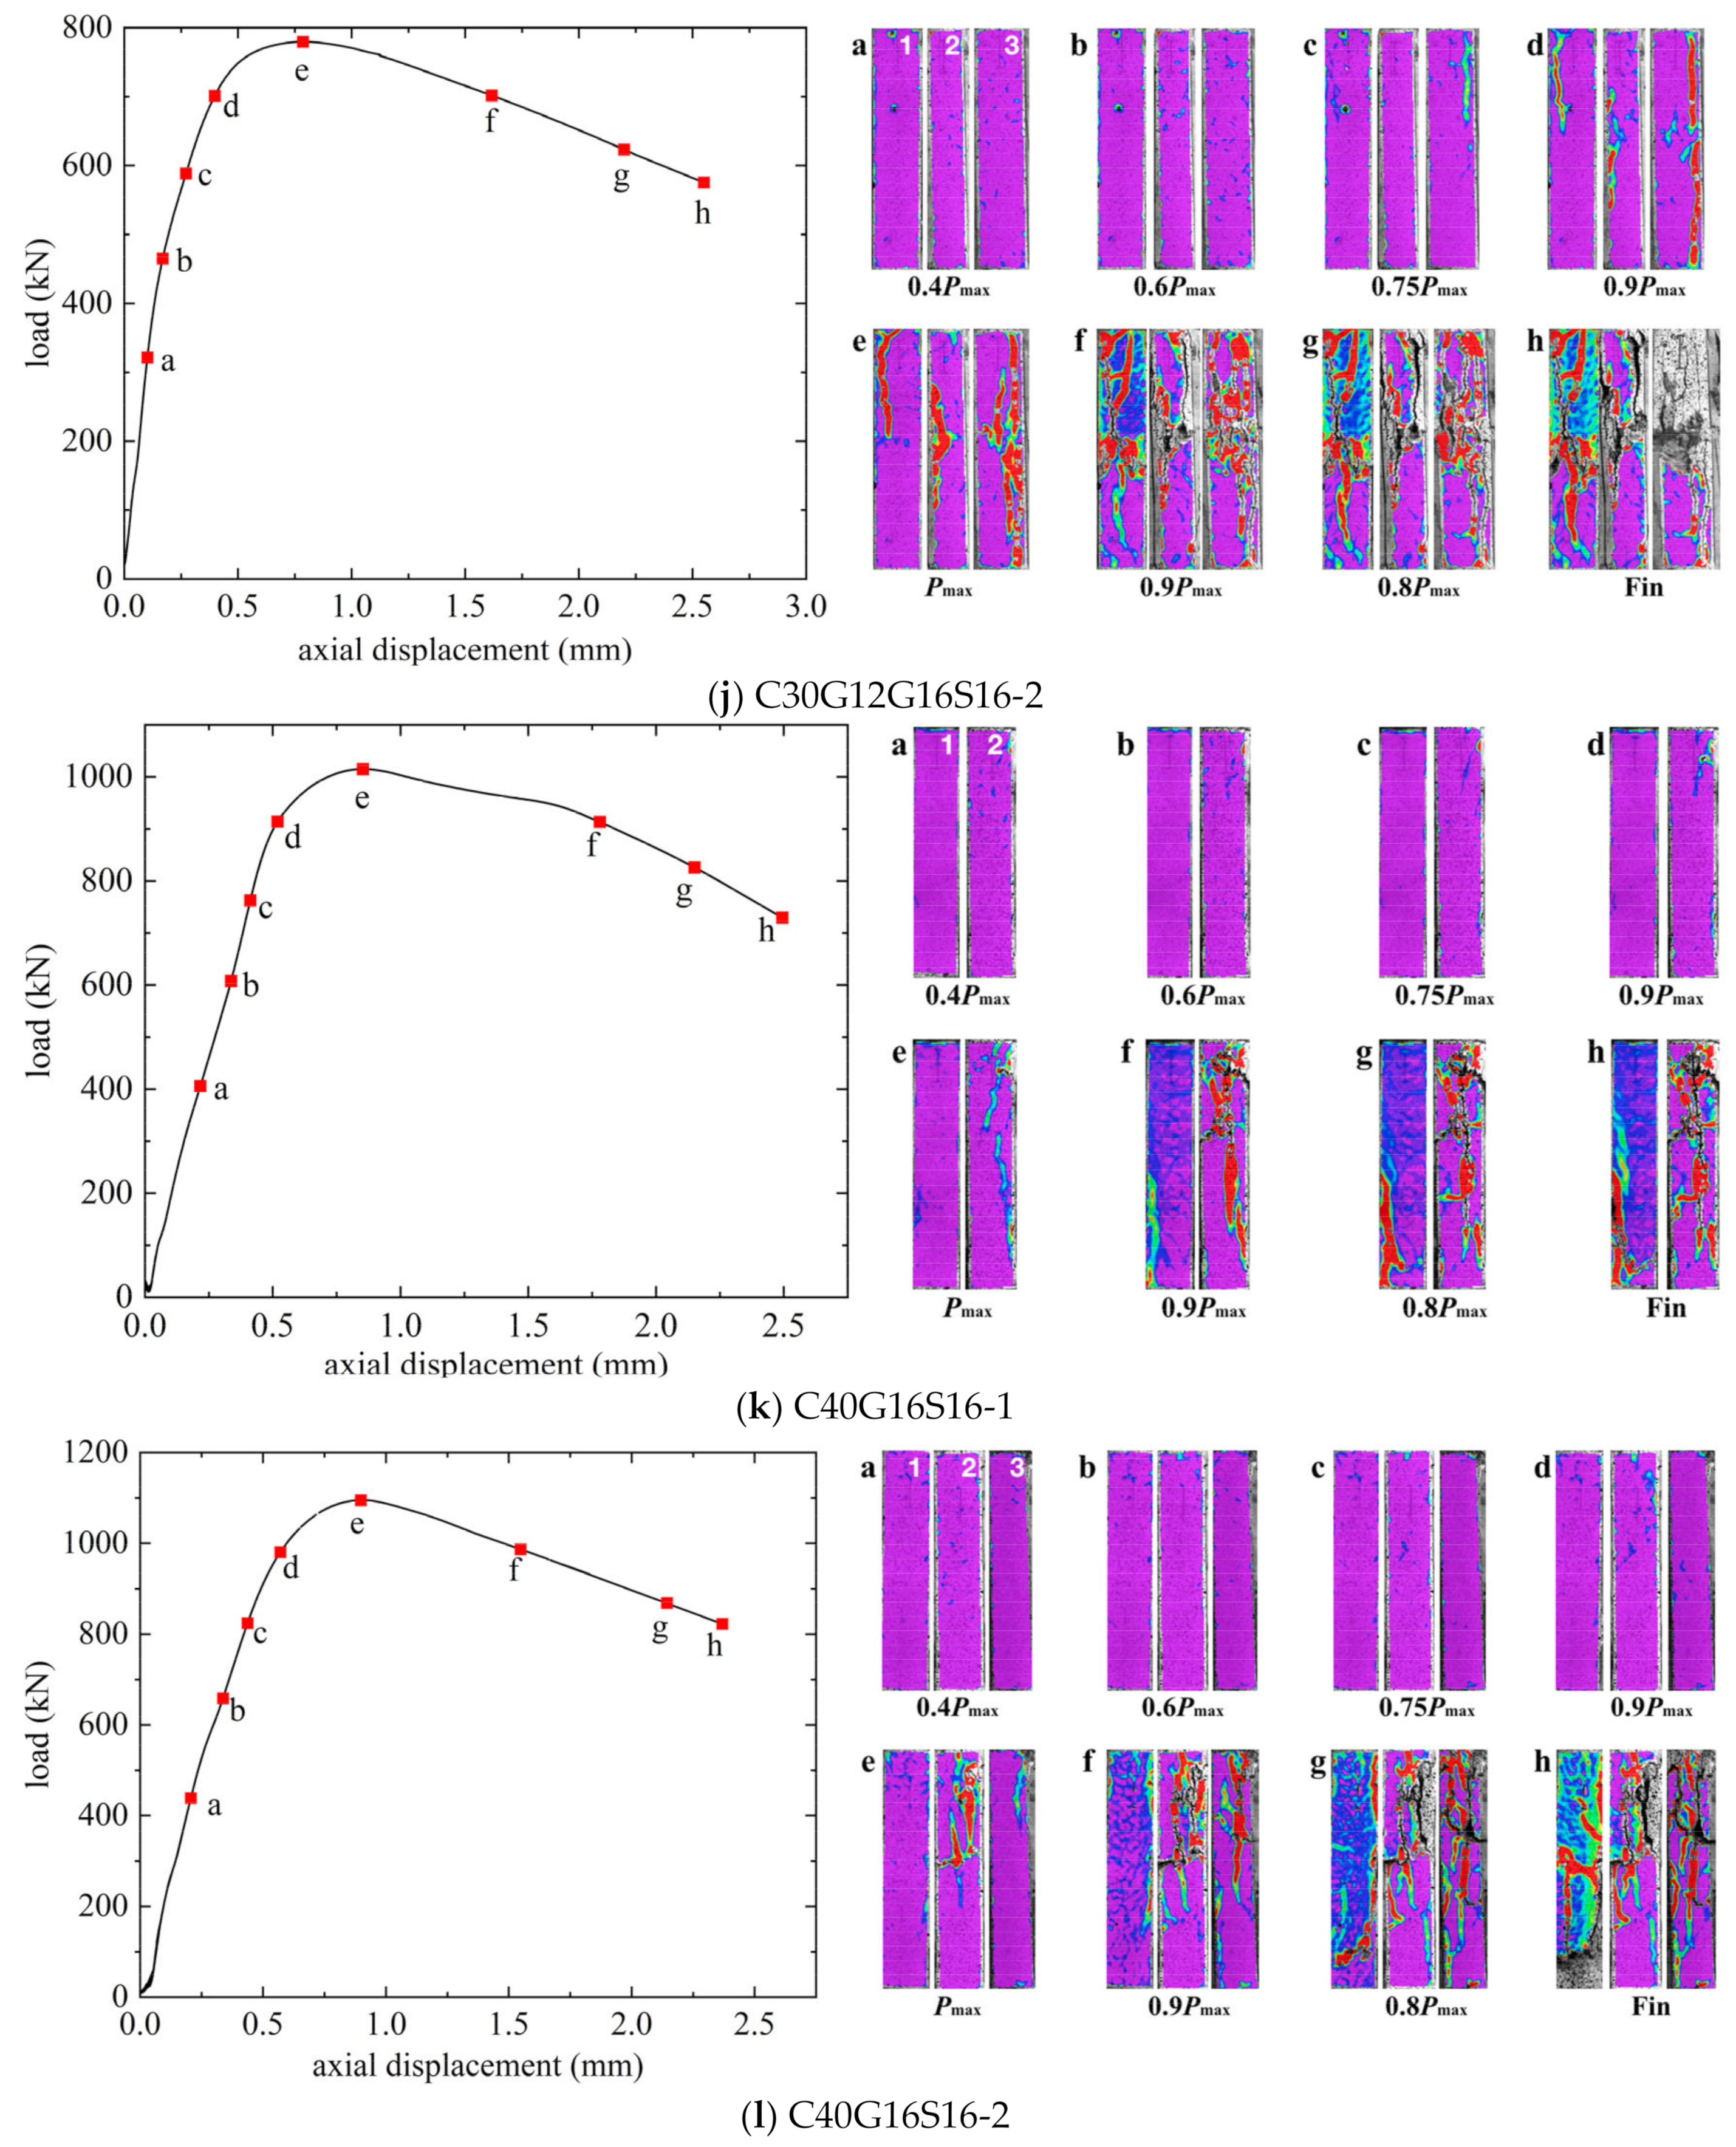
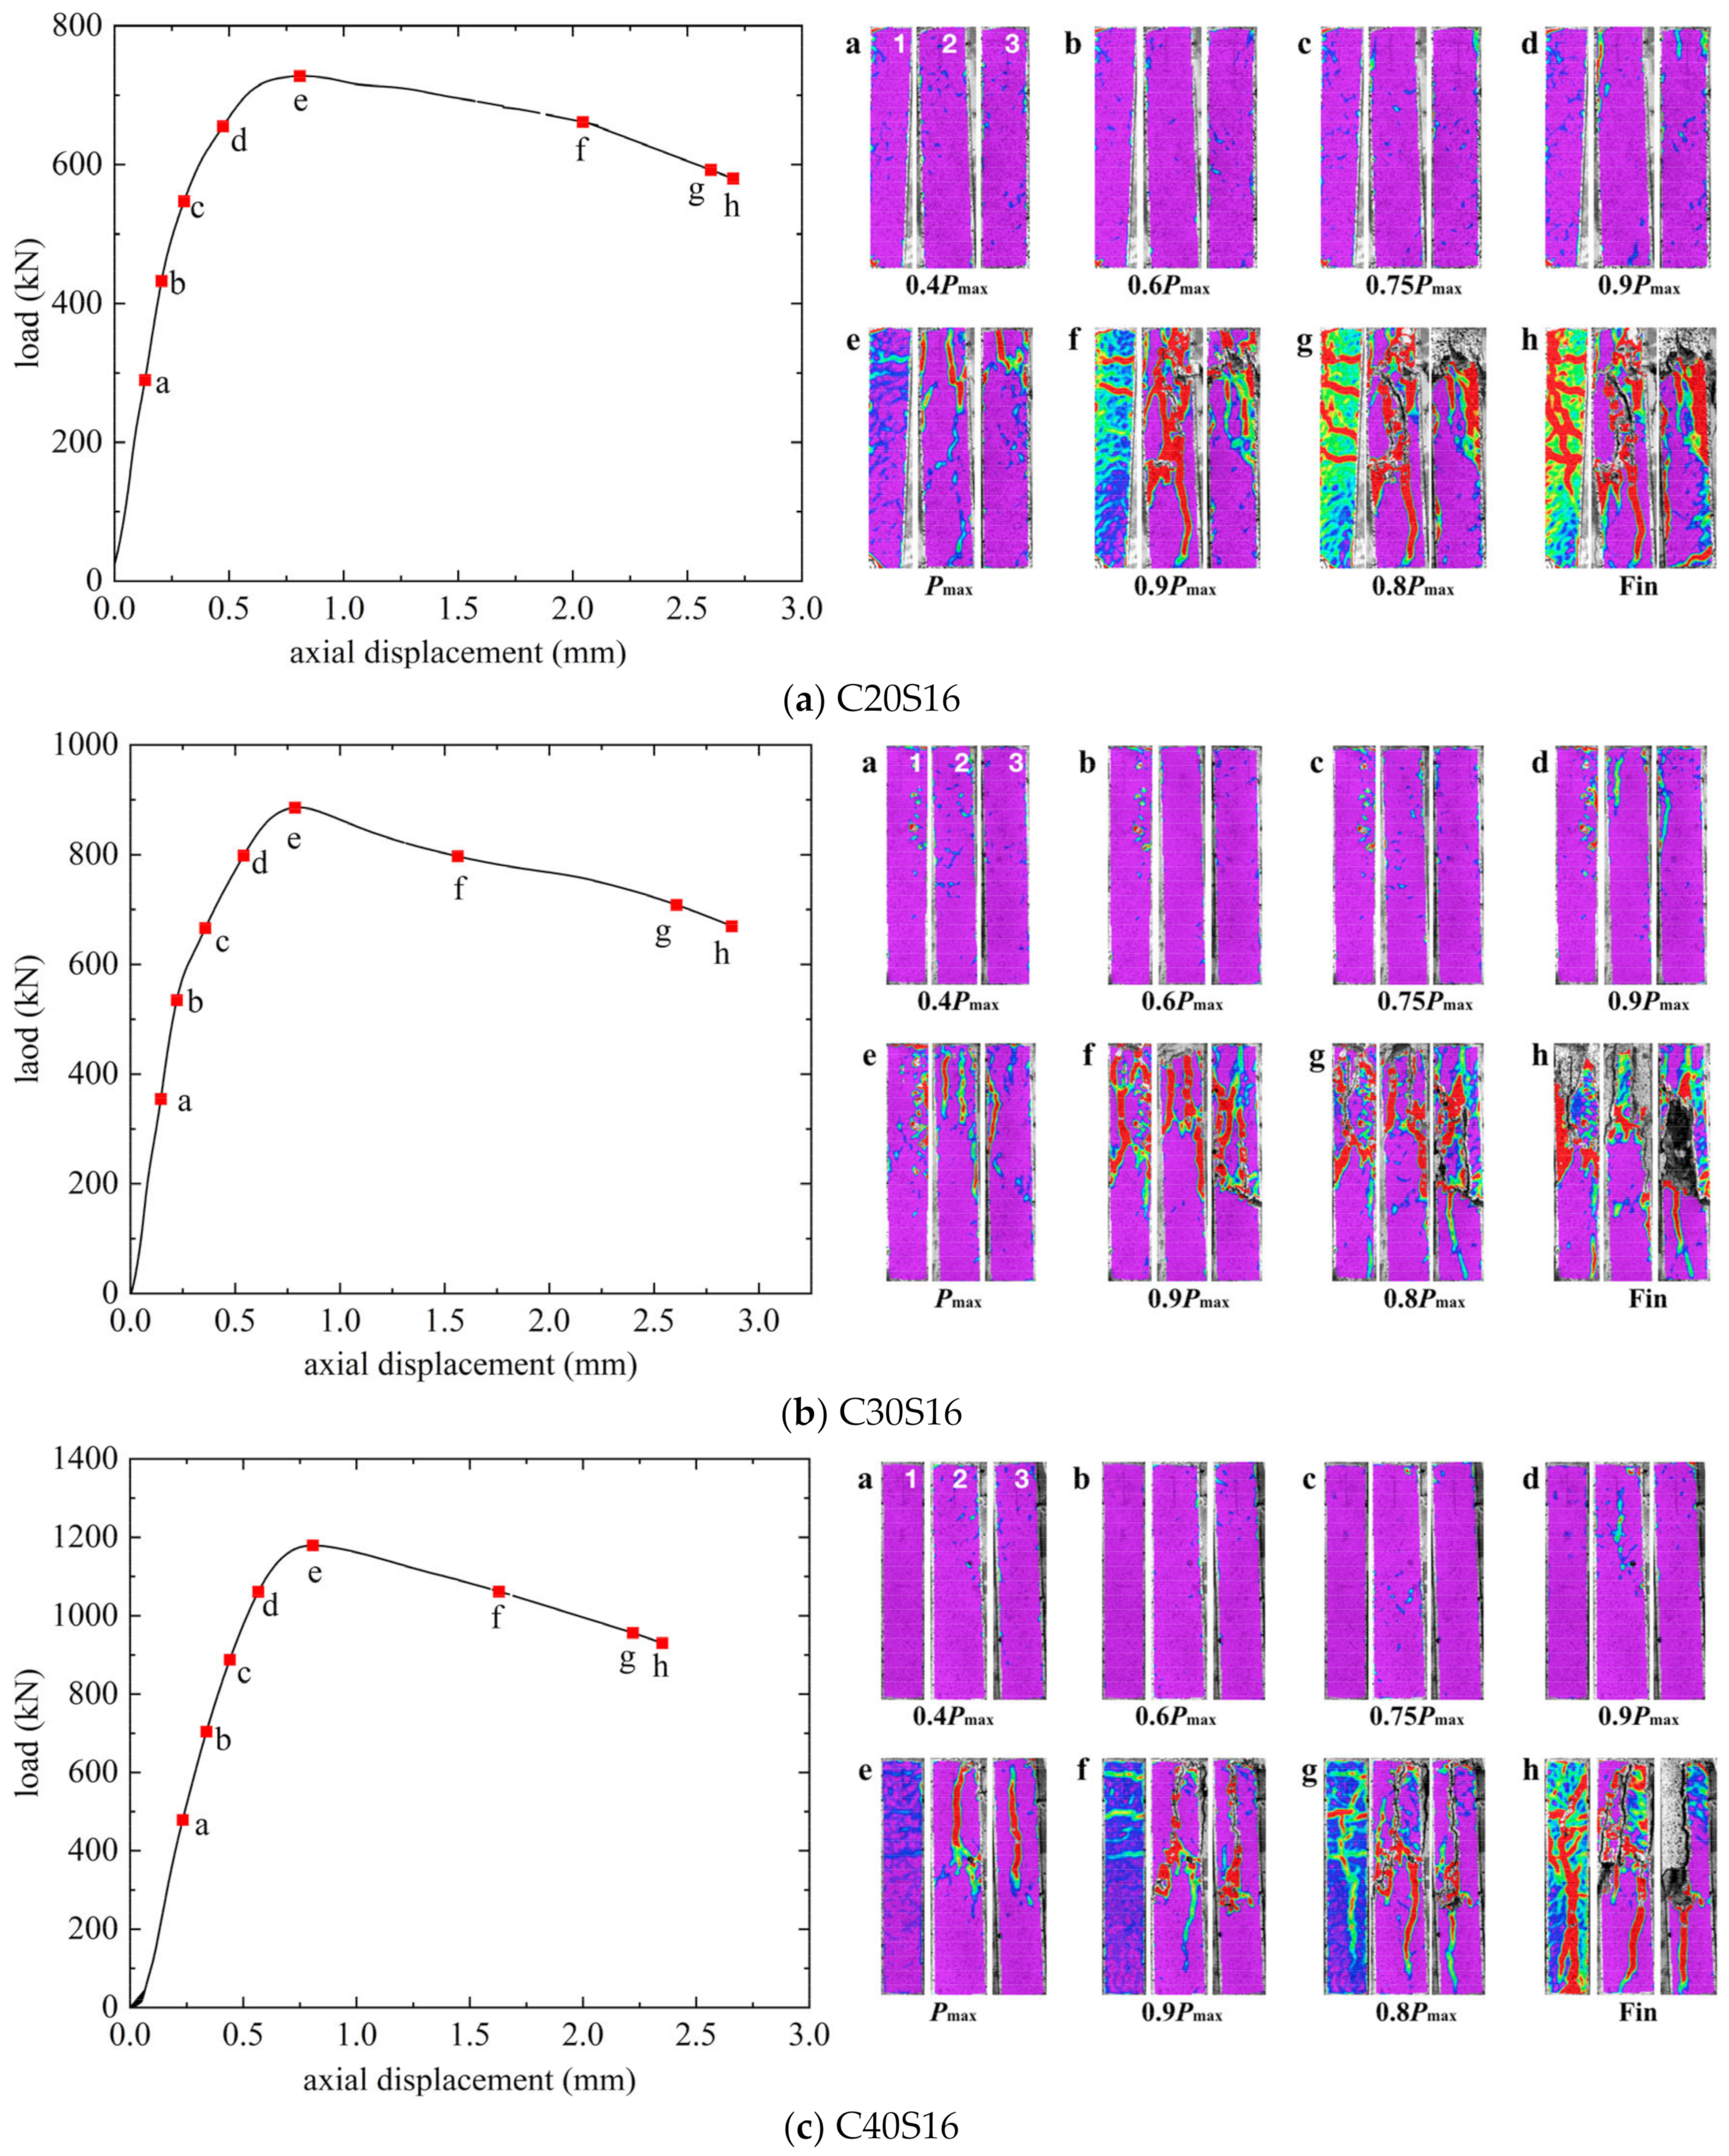
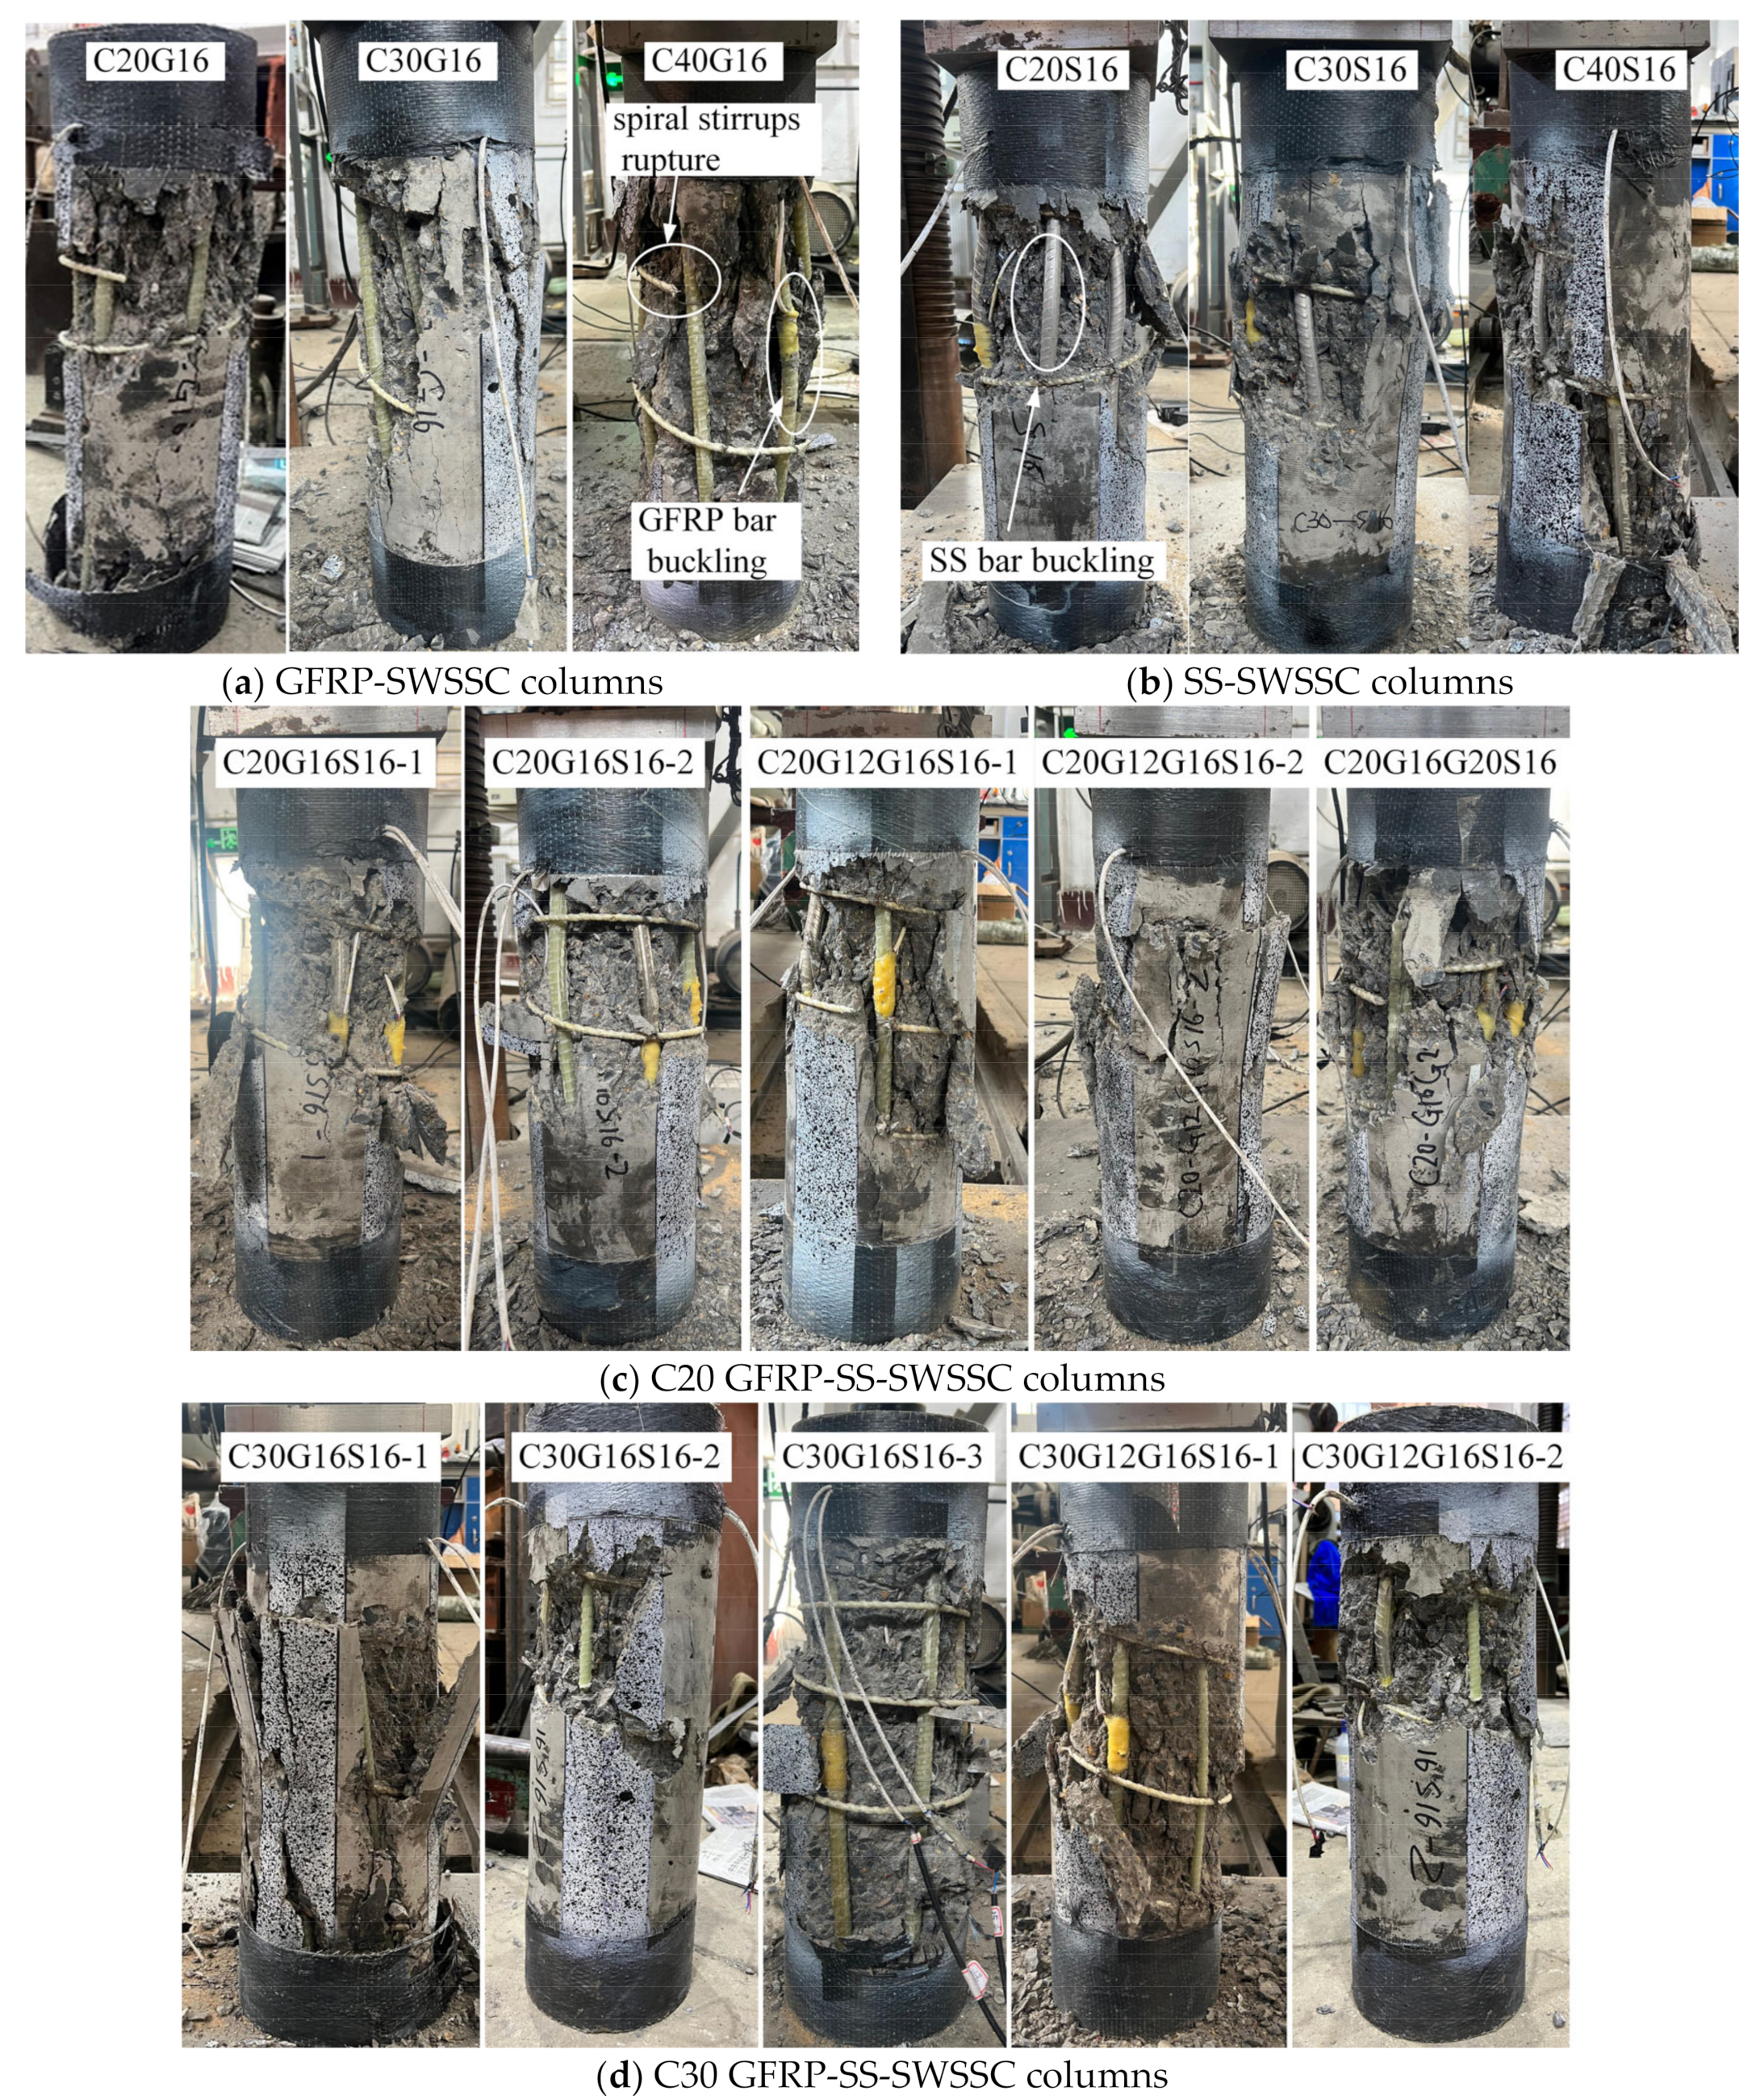
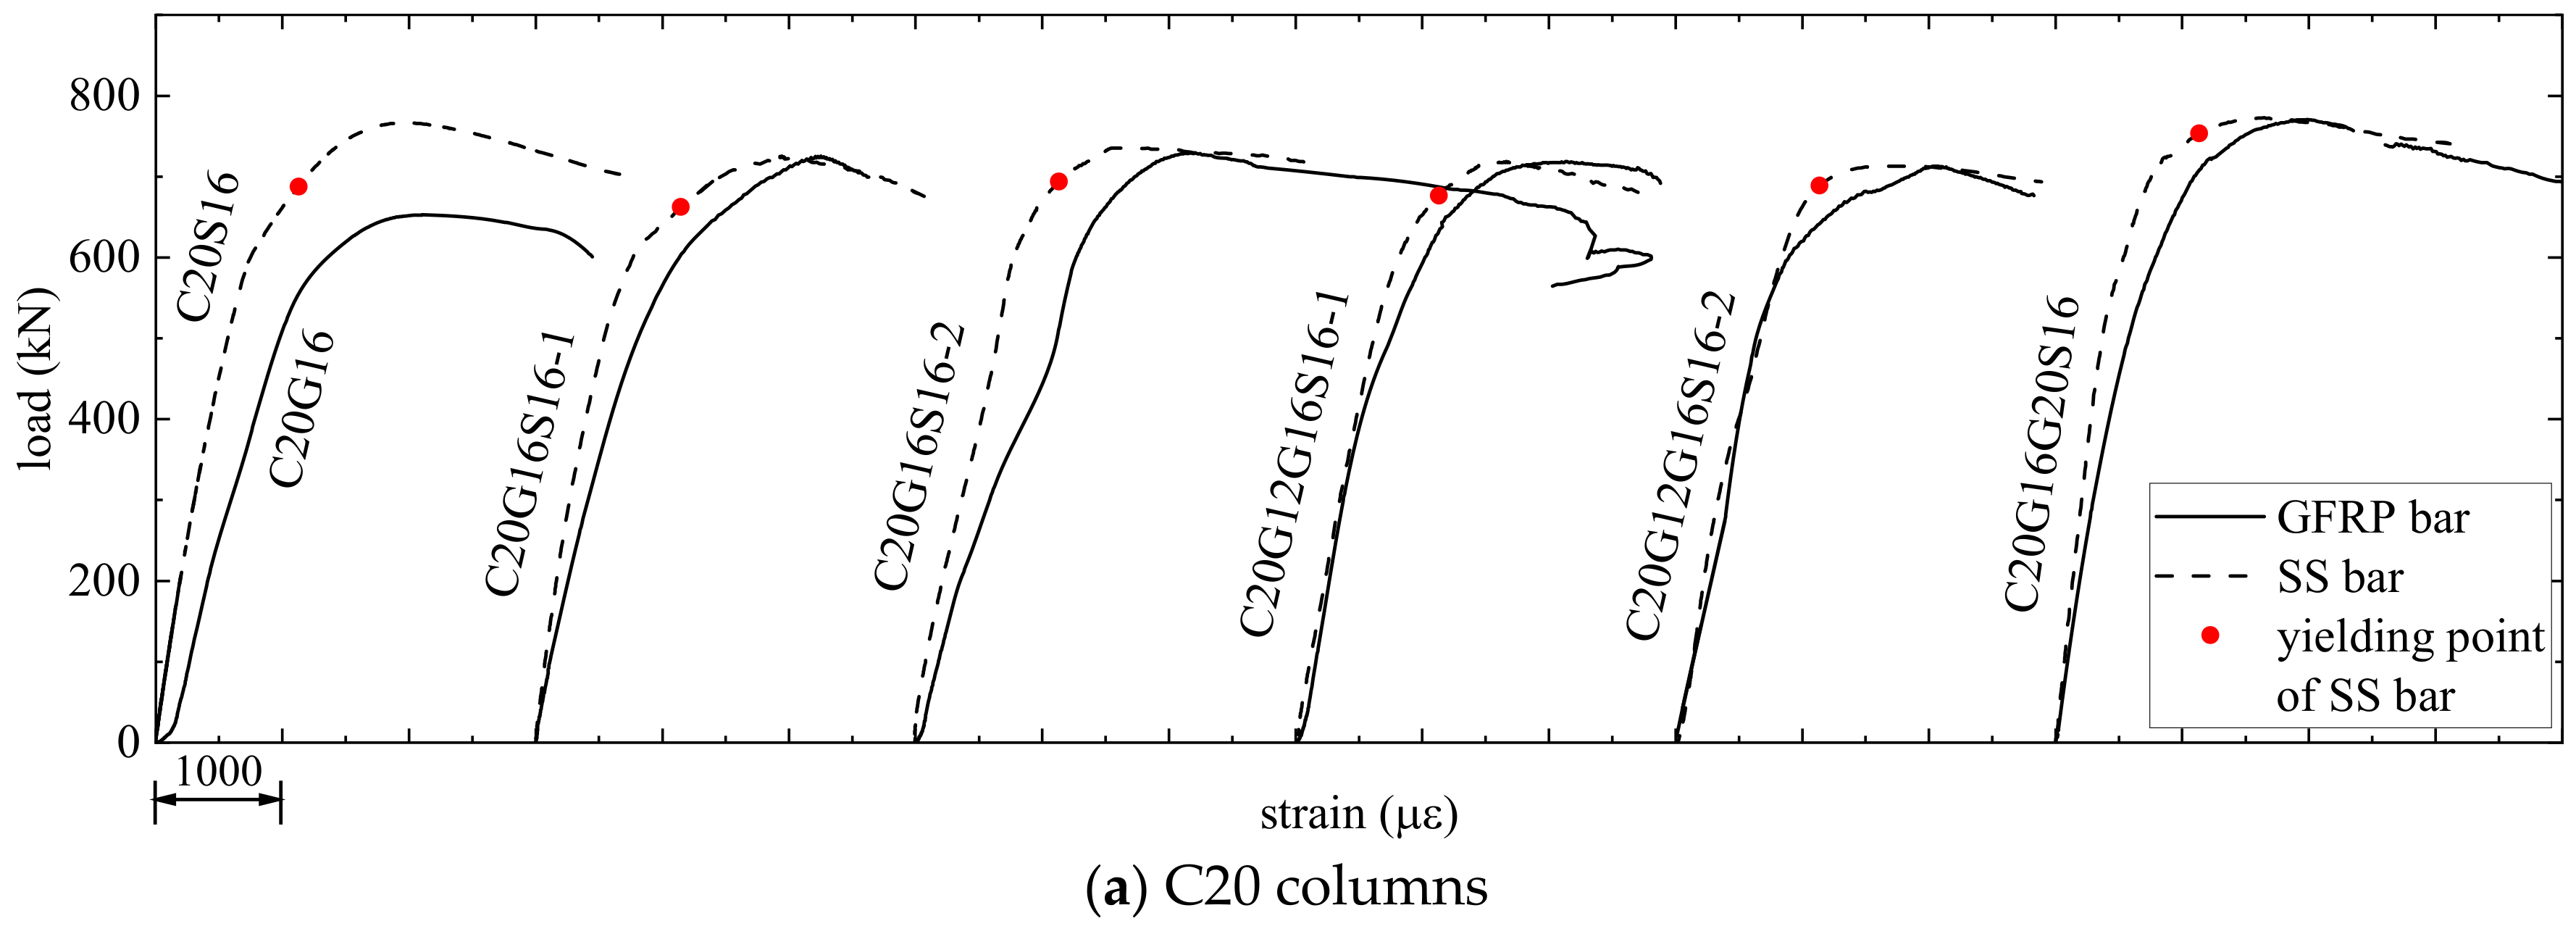
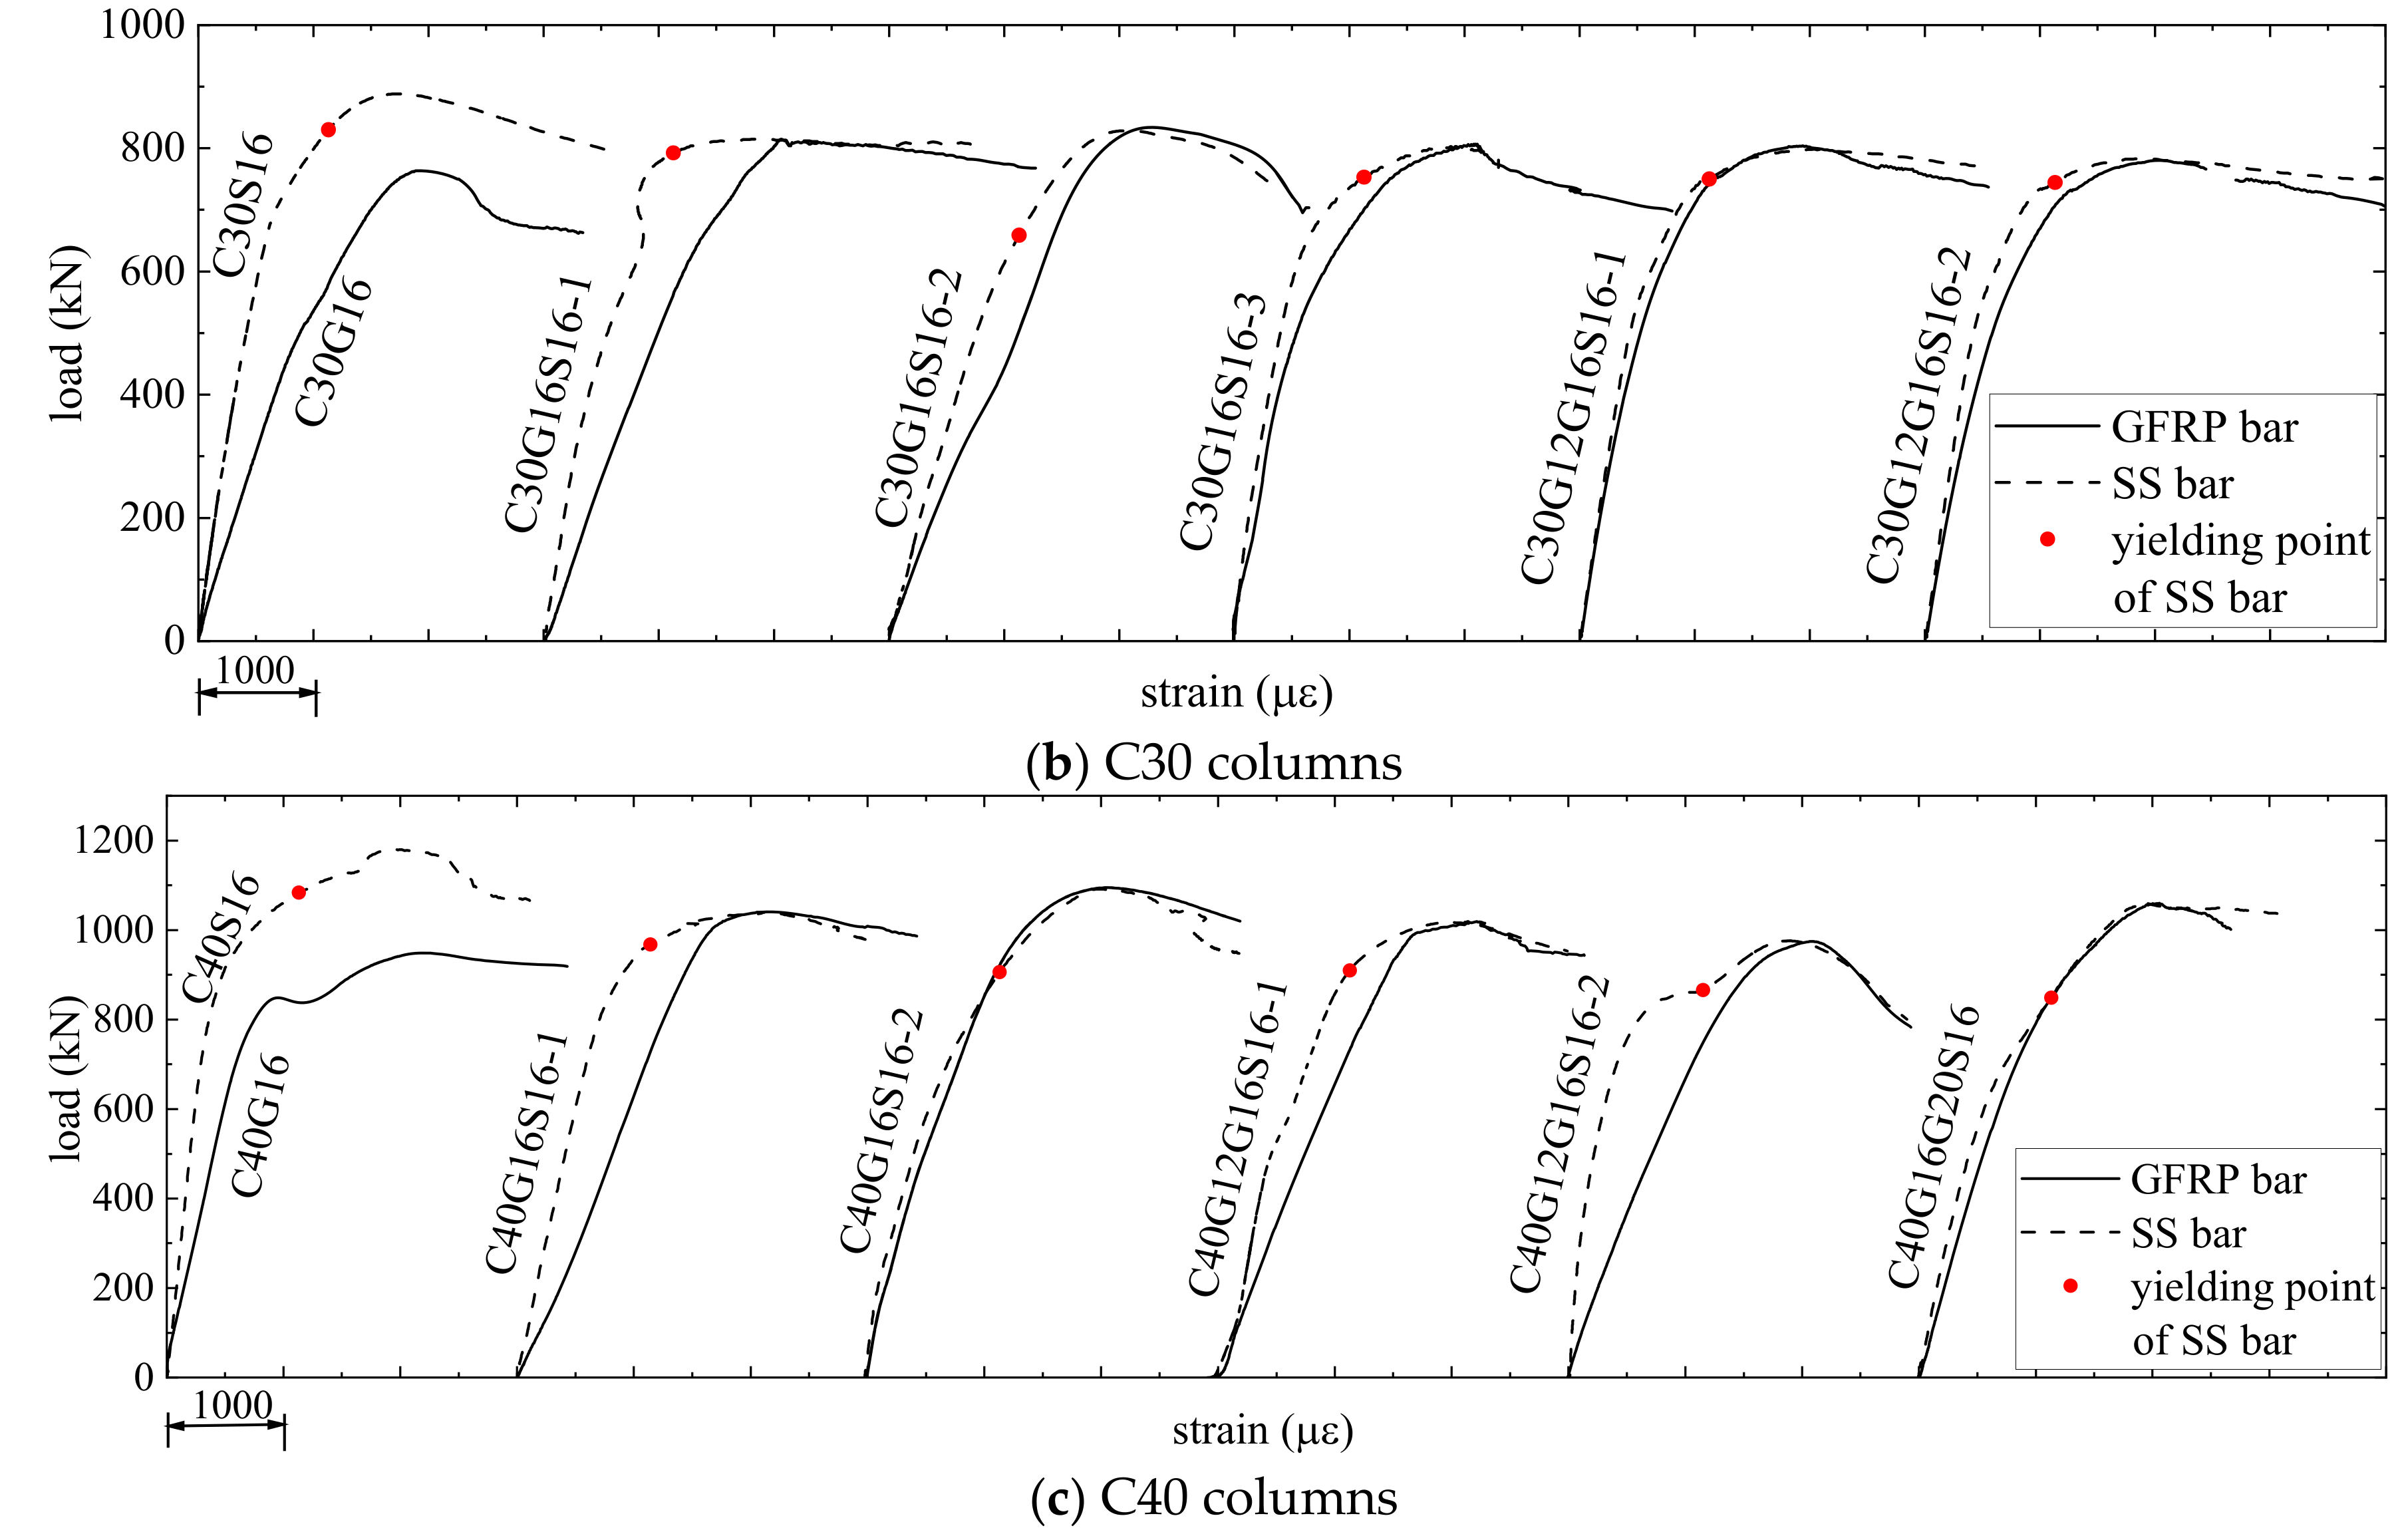
3.1. Load–Axial Displacement Curve and Failure Mode
3.2. Bearing Capacities
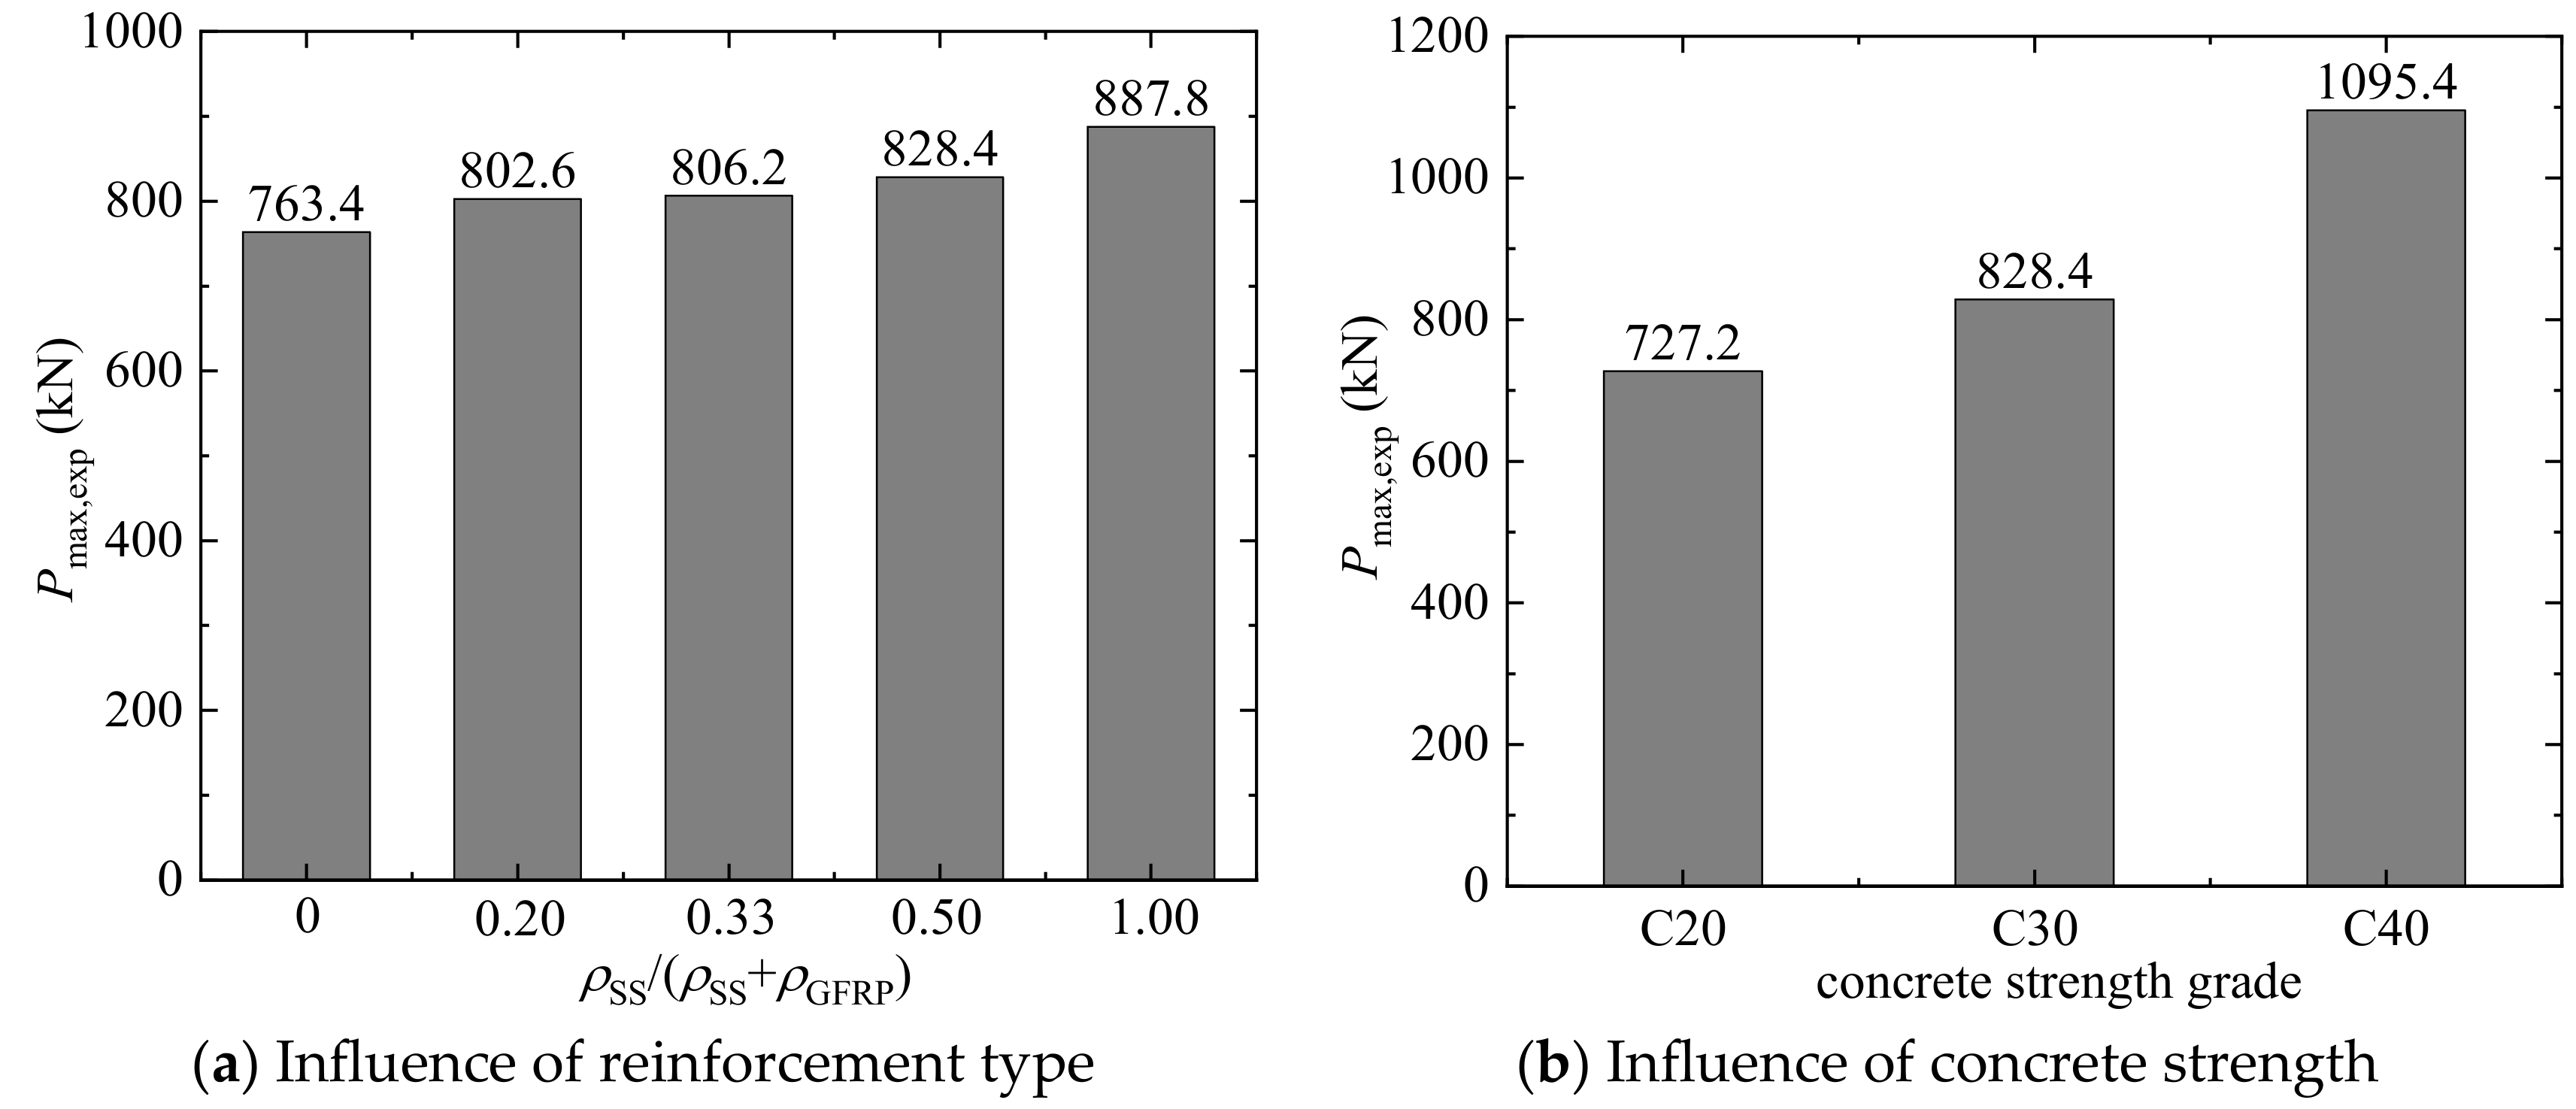
3.2.1. Experimental Bearing Capacities
3.2.2. Contribution of Longitudinal Bars to Bearing Capacity
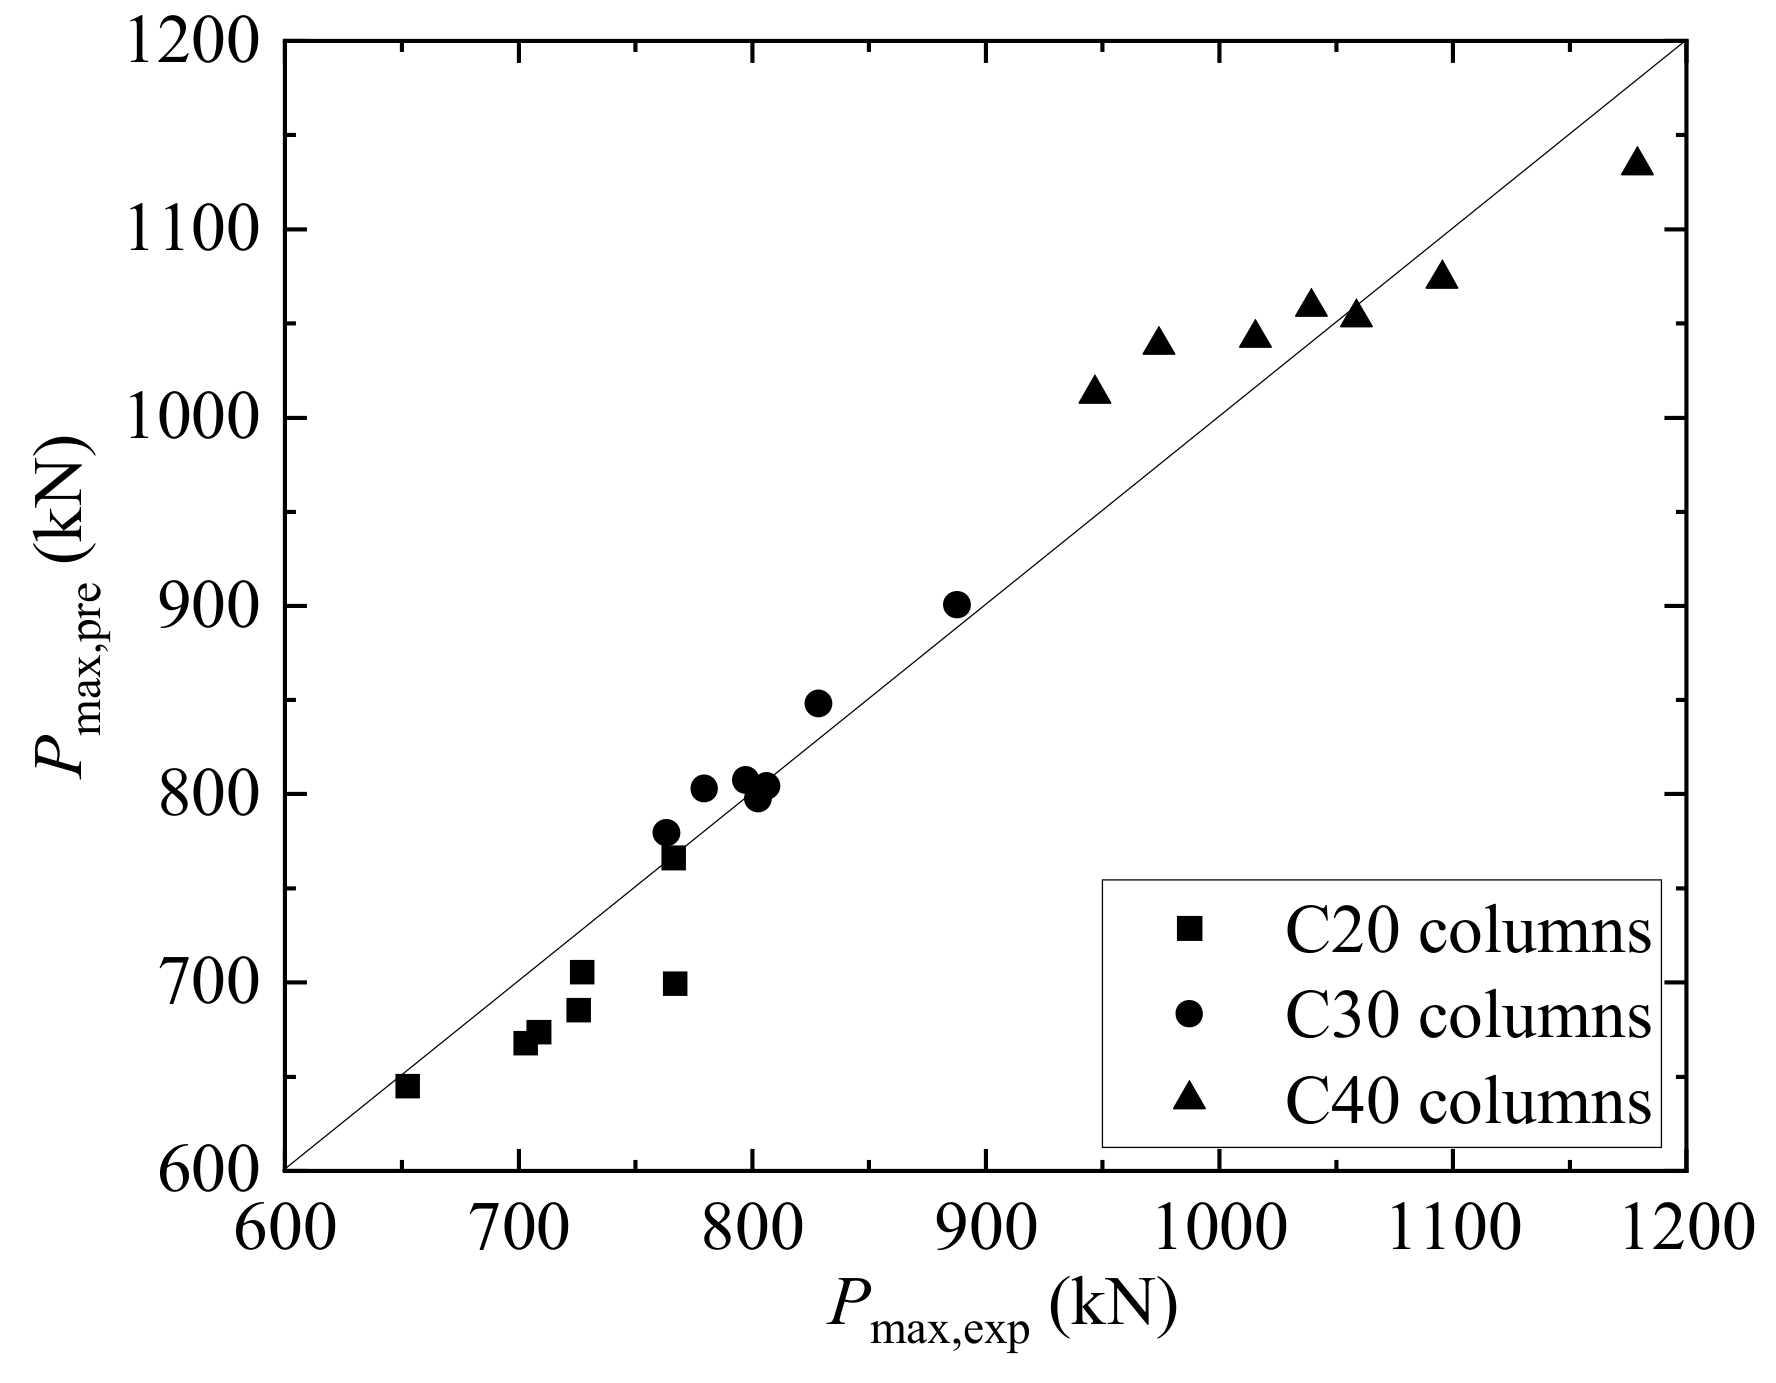
3.2.3. Prediction of Bearing Capacity
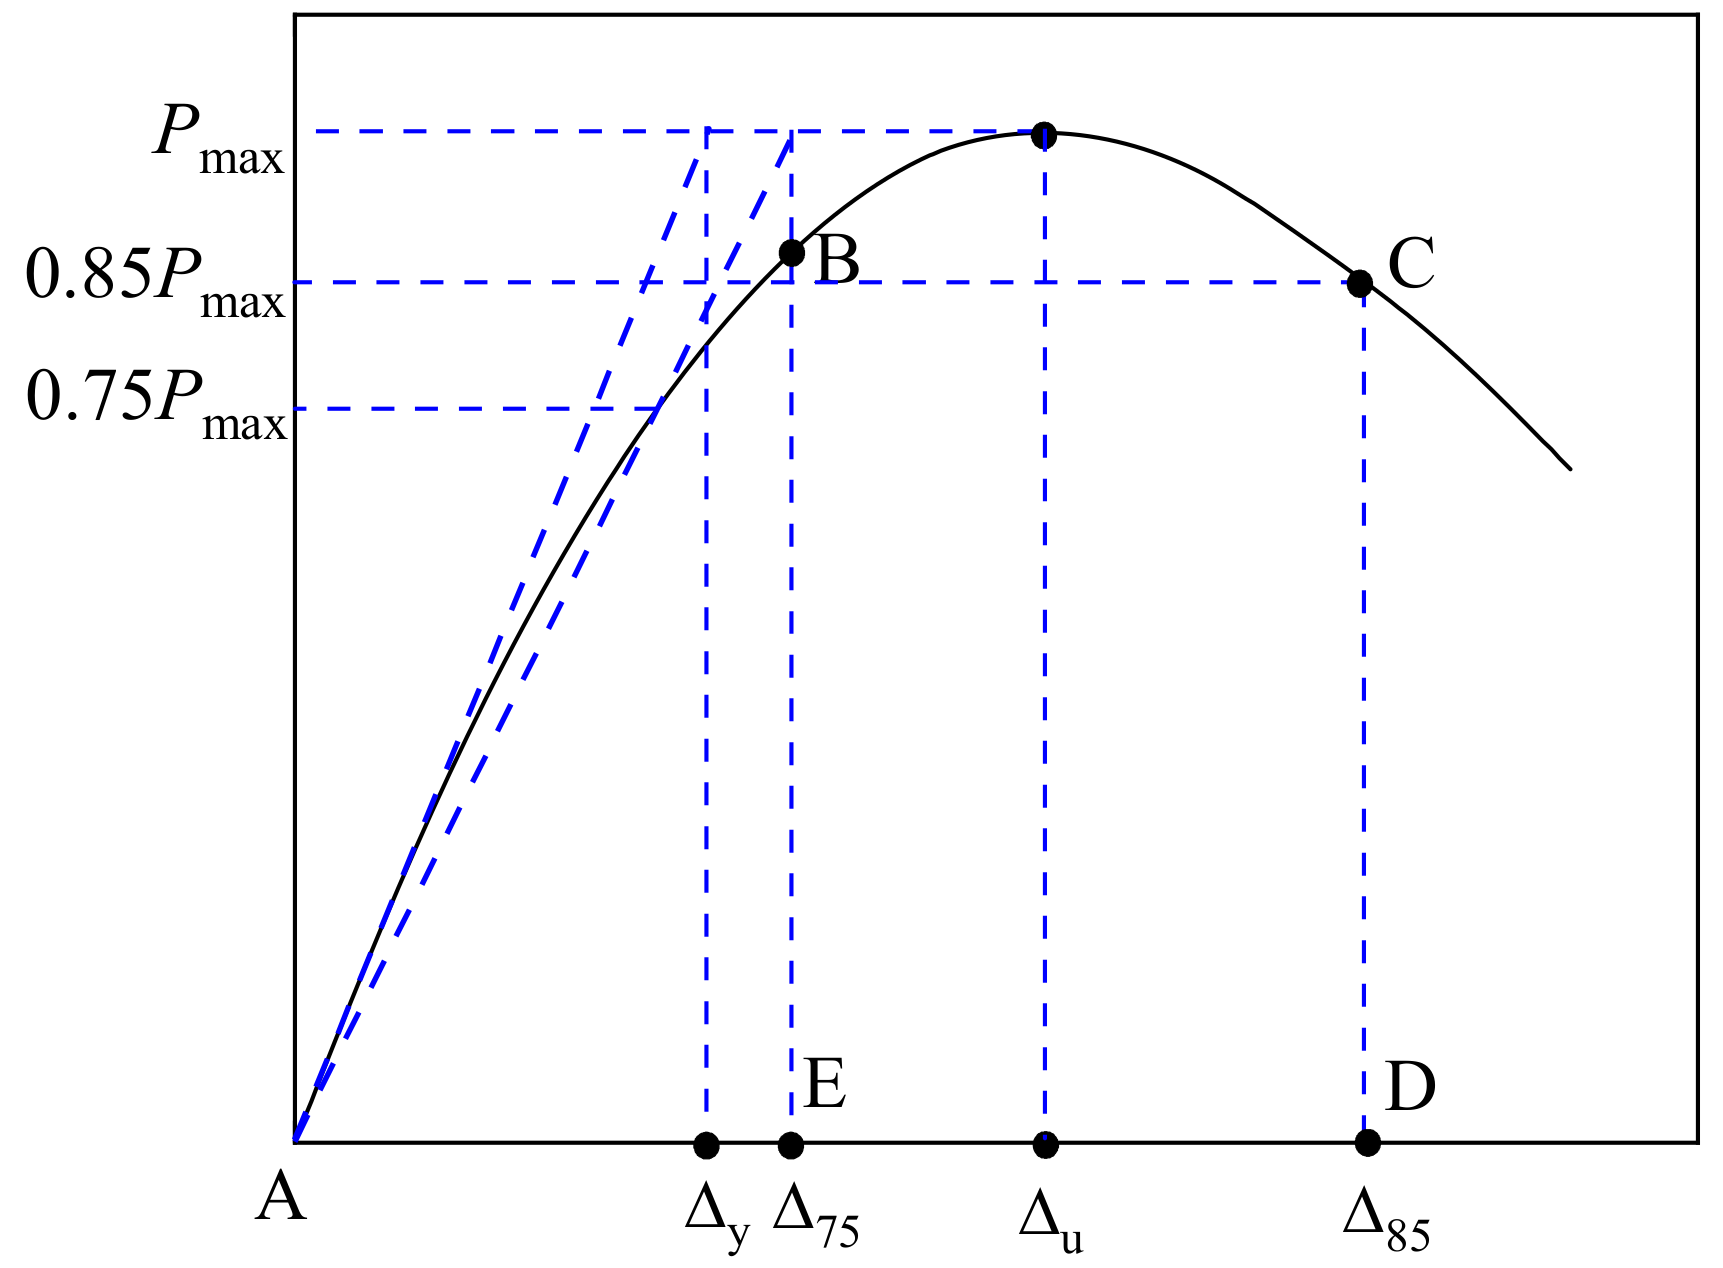
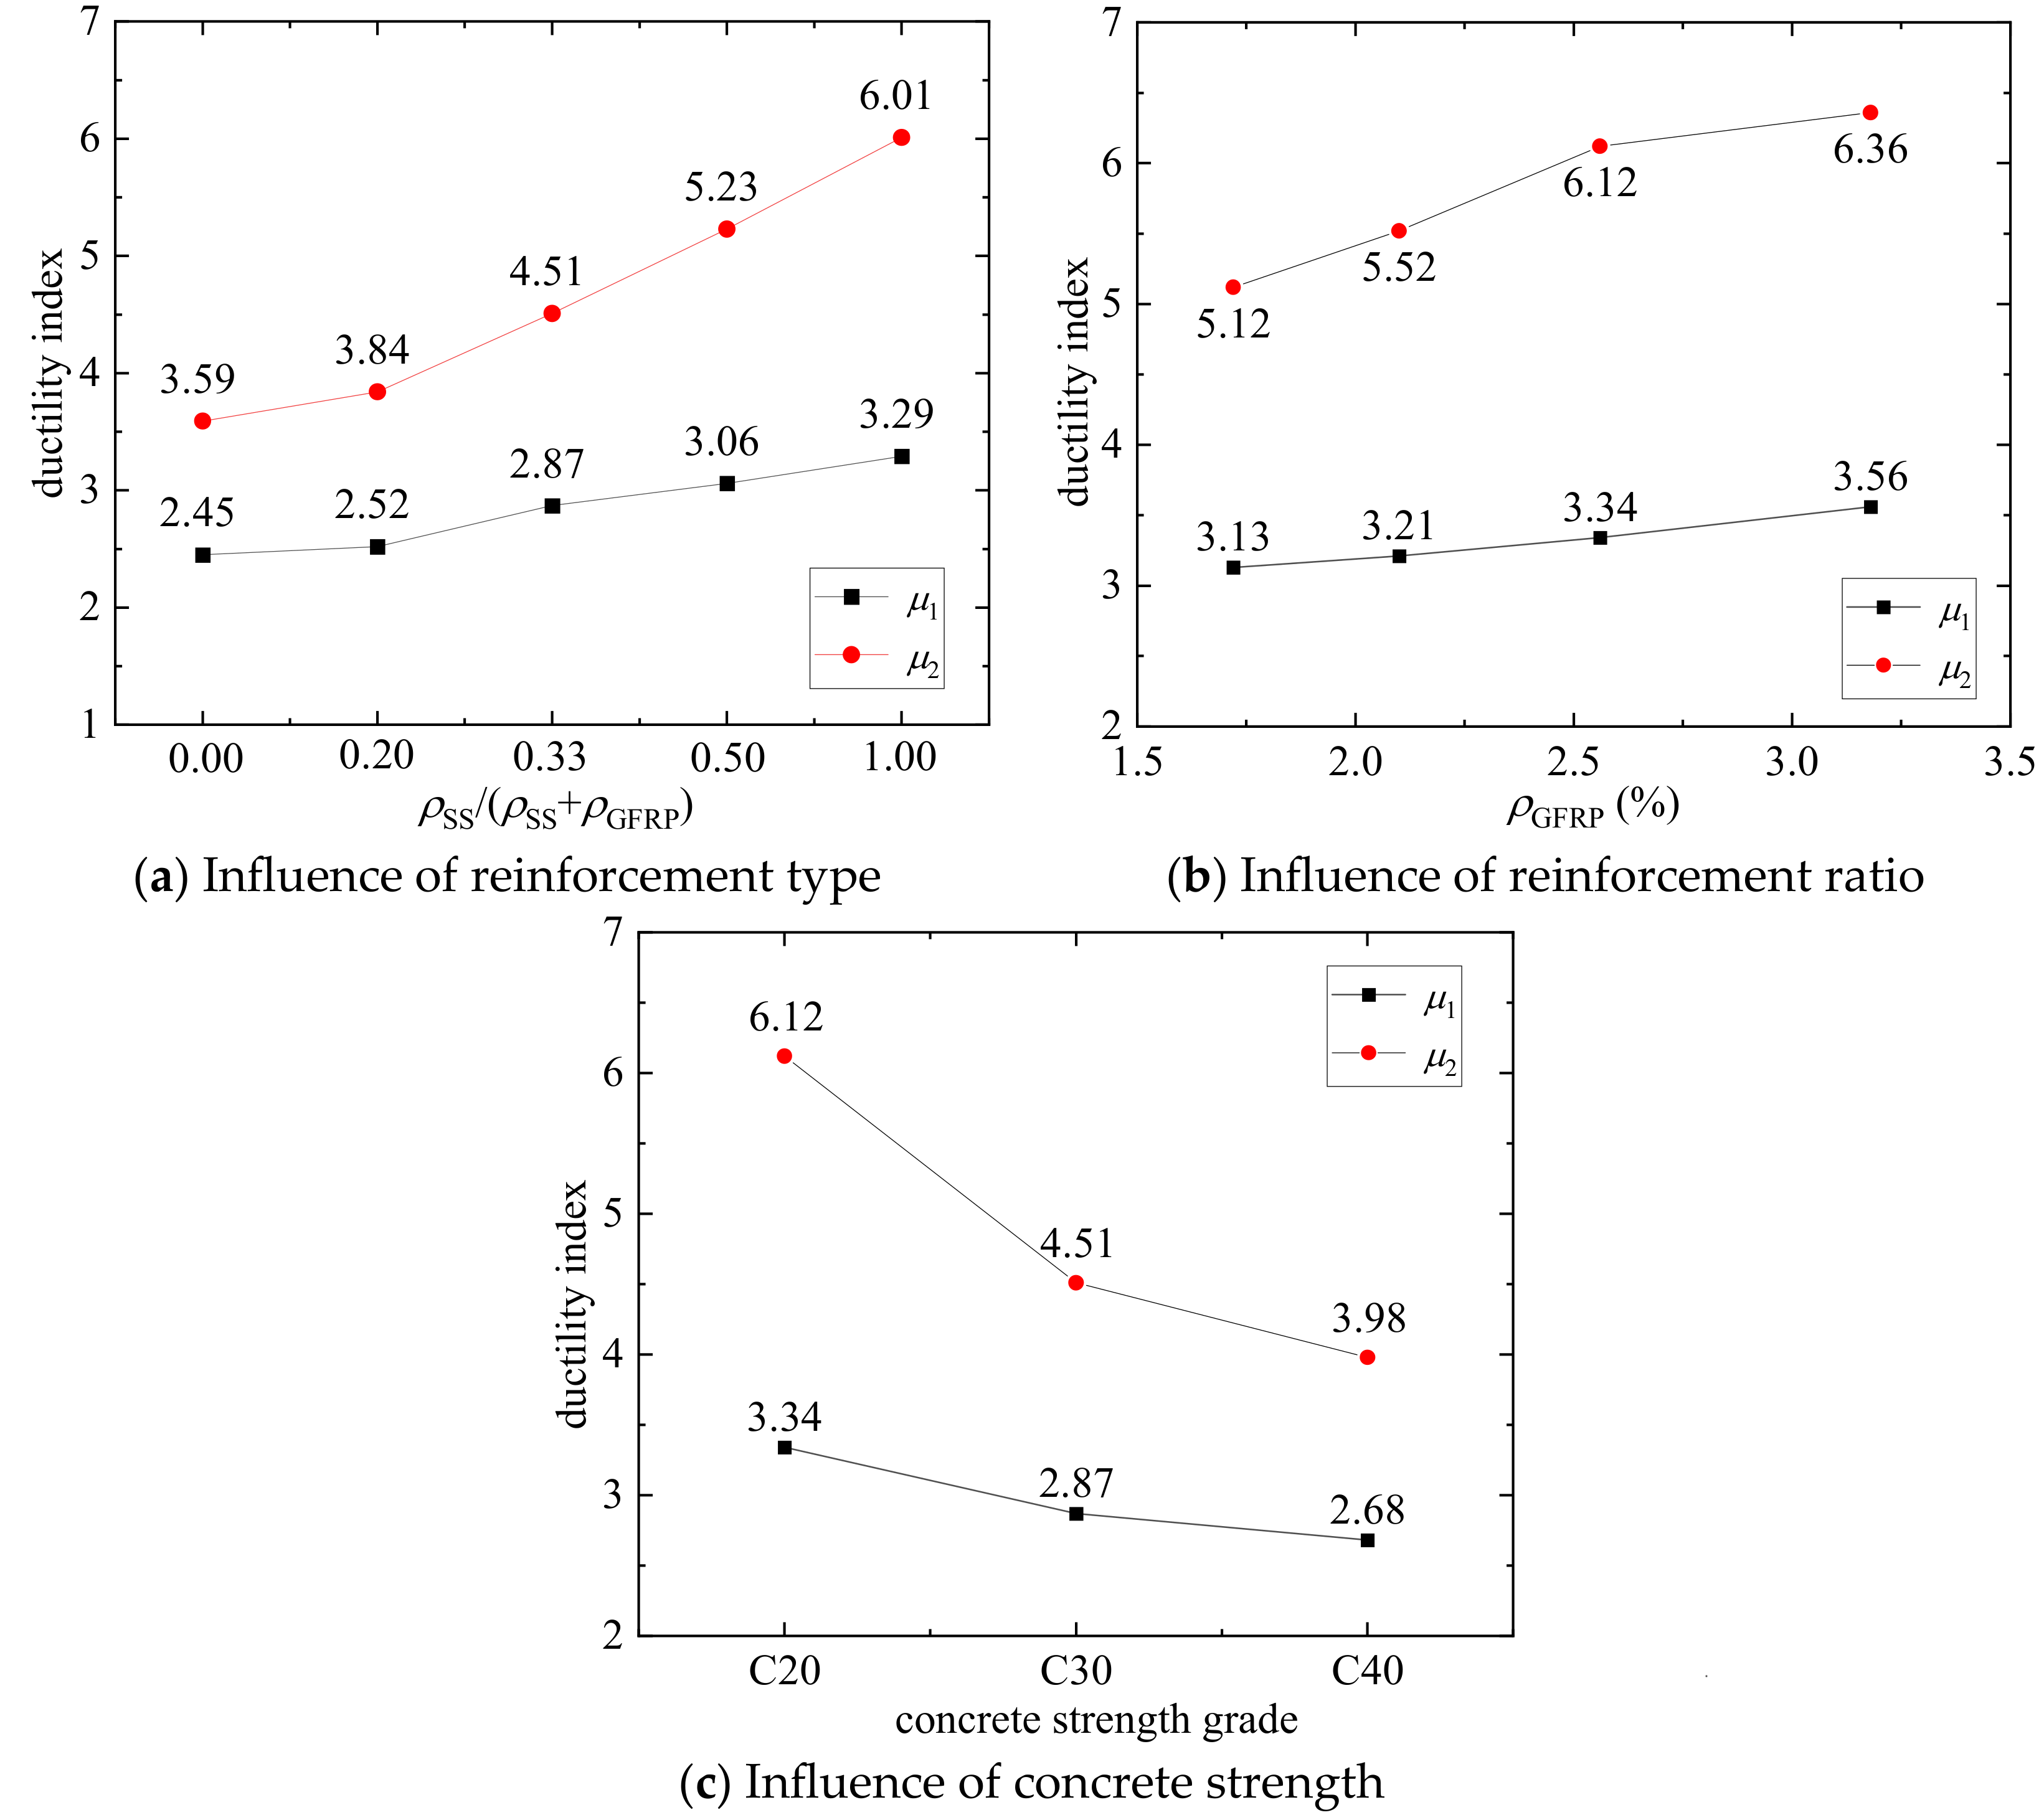
3.3. Ductility
4. Conclusions
- The GFRP-SWSSC columns suffered evident brittle failures, while the failures of the GFRP-SS-SWSSC and SS-SWSSC columns showed ductile characteristics. This indicates that hybrid reinforcement improves ductility;
- The load–axial displacement curves of all the columns showed similar behavior in the ascending part, with the displacement corresponding to the peak load ranging from 0.78 to 0.95 mm, while the descending parts of the columns varied under different reinforcement types. The load for GFRP-SWSSC columns dropped to approximately 50% of the peak load within a few seconds, whereas GFRP-SS-SWSSC and SS-SWSSC columns showed a gradual decline in load. This confirms the beneficial influence of hybrid reinforcement on enhancing ductility.
- The bearing capacity calculation equation with good accuracy for GFRP-SS-SWSSC axially compressed circular columns was proposed. Additionally, a compressive design strain of 0.002 for GFRP bars was suggested;
- By analyzing the energy ductility indexes of all the columns, note that the hybrid reinforcement of GFRP and SS bars improves the ductility of the GFRP-SWSSC columns, and the ductility indexes of the GFRP-SS-SWSSC columns are close to those of the SS-SWSSC columns when replacing half of the GFRP bars with SS bars.
Author Contributions
Funding
Data Availability Statement
Conflicts of Interest
References
- De Luca, A.; Matta, F.; Nanni, A. Behavior of full-scale glass fiber-reinforced polymer reinforced concrete columns under axial load. ACI Struct. J. 2010, 107, 589–596. [Google Scholar]
- Hadhood, A.; Mohamed, H.M.; Benmokrane, B. Experimental study of circular high-strength concrete columns reinforced with GFRP bars and spirals under concentric and eccentric loading. J. Compos. Constr. 2016, 21, 04016078. [Google Scholar] [CrossRef]
- Tobbi, H.; Farghaly, A.S.; Benmokrane, B. Concrete columns reinforced longitudinally and transversally with glass fiber reinforced polymer bars. ACI Struct. J. 2012, 109, 551–558. [Google Scholar]
- Afifi, M.Z.; Mohamed, H.M.; Benmokrane, B. Strength and axial behavior of circular concrete columns reinforced with CFRP bars and spirals. J. Compos. Constr. 2014, 18, 04013035. [Google Scholar] [CrossRef]
- Afifi, M.Z.; Mohamed, H.M.; Benmokrane, B. Axial capacity of circular concrete columns reinforced with GFRP bars and spirals. J. Compos. Constr. 2014, 18, 04013017. [Google Scholar] [CrossRef]
- Hadi, M.N.S.; Youssef, J. Experimental investigation of GFRP reinforced and GFRP-encased square concrete specimens under axial and eccentric load, and four-point bending test. J. Compos. Constr. 2016, 20, 04016020. [Google Scholar] [CrossRef]
- Elmessalami, N.; Abed, F.; El Refai, A. Concrete columns reinforced with GFRP and BFRP bars under concentric and eccentric loads: Experimental testing and analytical investigation. J. Compos. Constr. 2021, 25, 04021003. [Google Scholar] [CrossRef]
- Hadi, M.N.S.; Hasan, H.A.; Sheikh, M.N. Experimental investigation of circular high-strength concrete columns reinforced with glass fiber-reinforced polymer bars and helices under different loading conditions. J. Compos. Constr. 2017, 21, 04017005. [Google Scholar] [CrossRef]
- Hasan, H.A.; Sheikh, M.N.; Hadi, M.N.S. Maximum axial load carrying capacity of Fibre Reinforced-Polymer (FRP) bar reinforced concrete columns under axial compression. Structures 2019, 19, 227–233. [Google Scholar] [CrossRef]
- Tobbi, H.; Farghaly, A.S.; Benmokrane, B. Behavior of concentrically loaded fiber-reinforced polymer reinforced concrete columns with varying reinforcement types and ratios. ACI Struct. J. 2014, 111, 375–386. [Google Scholar] [CrossRef]
- Youssef, J.; Hadi, M.N.S. Axial load-bending moment diagrams of GFRP reinforced columns and GFRP encased square columns. Constr. Build. Mater. 2017, 135, 550–564. [Google Scholar] [CrossRef]
- Hadhood, A.; Mohamed, H.M.; Benmokrane, B. Strength of circular HSC columns reinforced internally with carbon-fiber-reinforced polymer bars under axial and eccentric loads. Constr. Build. Mater. 2017, 141, 366–378. [Google Scholar] [CrossRef]
- Mohamed, H.M.; Afifi, M.Z.; Benmokrane, B. Performance evaluation of concrete columns reinforced longitudinally with FRP bars and confined with FRP hoops and spirals under axial load. J. Bridge Eng. 2014, 19, 04014020. [Google Scholar] [CrossRef]
- Xue, W.; Peng, F.; Fang, Z. Behavior and design of slender rectangular concrete columns longitudinally reinforced with fiber reinforced polymer bars. ACI Struct. J. 2018, 115, 311–322. [Google Scholar] [CrossRef]
- Hadhood, A.; Mohamed, H.M.; Benmokrane, B. Axial load-moment interaction diagram of circular concrete columns reinforced with CFRP bars and spirals: Experimental and theoretical investigations. J. Compos. Constr. 2016, 21, 04016092. [Google Scholar] [CrossRef]
- Hadhood, A.; Mohamed, H.M.; Ghrib, F.; Benmokrane, B. Efficiency of glass-fiber-reinforced polymer (GFRP) discrete hoops and bars in concrete columns under combined axial and flexural loads. Compos. Part B 2017, 114, 223–236. [Google Scholar] [CrossRef]
- Xiong, Z.; Lin, L.H.; Qiao, S.H.; Li, L.J.; Li, Y.L.; He, S.H.; Li, Z.W.; Liu, F.; Chen, Y.L. Axial performance of seawater sea-sand concrete columns reinforced with basalt fibre-reinforced polymer bars under concentric compressive load. J. Build. Eng. 2022, 47, 103828. [Google Scholar] [CrossRef]
- Lau, D.; Pam, H.J. Experimental study of hybrid FRP reinforced concrete beams. Eng. Struct. 2010, 32, 3857–3865. [Google Scholar] [CrossRef]
- Qu, W.J.; Zhang, X.L.; Huang, H.Q. Flexural behavior of concrete beams reinforced with hybrid (GFRP and steel) bars. J. Compos. Constr. 2009, 13, 350–359. [Google Scholar] [CrossRef]
- Refai, A.E.; Abed, F.; Al-Rahmani, A. Structural performance and serviceability of concrete beams reinforced with hybrid (GFRP and steel) bars. Constr. Build. Mater. 2015, 96, 518–529. [Google Scholar] [CrossRef]
- Wright, J.W.; Pantelides, C.P. Axial compression capacity of concrete columns reinforced with corrosion-resistant hybrid reinforcement. Constr. Build. Mater. 2021, 302, 124209. [Google Scholar] [CrossRef]
- Tahir, M.; Isleem, H.F.; Wang, Z. Axial compressive stress-strain model for hybrid-reinforced concrete columns with FRP ties. Proc. Inst. Civ. Eng.-Struct. Build. 2021, 175, 215–229. [Google Scholar] [CrossRef]
- Sun, Z.Y.; Chen, Y.J.; Xu, S.Y.; Sun, Y.; Wu, G. Shaking table test of concrete columns hybrid reinforced by steel/FRP bars. J. Build. Eng. 2022, 48, 103938. [Google Scholar] [CrossRef]
- Sun, Z.Y.; Wu, G.; Zhang, J.; Zeng, Y.; Xiao, W. Experimental study on concrete columns reinforced by hybrid steel-fiber reinforced polymer (FRP) bars under horizontal cyclic loading. Constr. Build. Mater. 2017, 130, 202–211. [Google Scholar] [CrossRef]
- Xu, J.J.; Wu, Z.M.; Jia, H.B.; Yu, R.C.; Cao, Q. Axial compression of seawater sea sand concrete columns reinforced with hybrid FRP-stainless steel bars. Mag. Concr. Res. 2023, 75, 685–702. [Google Scholar] [CrossRef]
- ASTM D7205; Standard Test Method for Tensile Properties of Fiber-Reinforced Polymer Matrix Composite Bars. ASTM International: West Conshohocken, PA, USA, 2011.
- GB/T 228.1-2010; Metallic Materials-Tensile Testing—Part 1: Method of Test at Room Temperature. National Standards of the People’s Republic of China: Beijing, China, 2010.
- GB/T 14684-2011; Sand for Construction. National Standards of the People’s Republic of China: Beijing, China, 2011.
- GB 50010-2010; Code for Design of Concrete Structures. National Standards of the People’s Republic of China: Beijing, China, 2015.
- GB/T 50081-2019; Standard for Test Method of Mechanical Properties of Ordinary Concrete. National Standards of the People’s Republic of China: Beijing, China, 2019.
- Elchalakani, M.; Ma, G.W. Tests of glass fibre reinforced polymer rectangular concrete columns subjected to concentric and eccentric axial loading. Eng. Struct. 2017, 151, 93–104. [Google Scholar] [CrossRef]
- Foster, S.J.; Attard, M.M. Experimental tests on eccentrically loaded high-strength concrete columns. ACI Struct. J. 1997, 94, 295–303. [Google Scholar]
- Elchalakani, M.; Dong, M.; Karrech, A.; Ali, M. Circular concrete columns and beams reinforced with GFRP bars and spirals under axial, eccentric, and flexural loading. J. Compos. Constr. 2020, 24, 04020008. [Google Scholar] [CrossRef]
- Hadi, M.N.S.; Karim, H.; Sheikh, M.N. Experimental investigations on circular concrete columns reinforced with GFRP bars and helices under different loading conditions. J. Compos. Constr. 2016, 20, 04016009. [Google Scholar] [CrossRef]
- Pessiki, S.; Pieroni, A. Axial load behavior of large-scale spirally-reinforced high-strength concrete columns. ACI Struct. J. 1997, 94, 304–313. [Google Scholar]


| Diameter (mm) | ffu (MPa) | COV (%) | Ef (GPa) | COV (%) |
|---|---|---|---|---|
| 12 | 914 ± 10.20 | 1.12 | 50.3 ± 0.80 | 1.59 |
| 16 | 889 ± 8.83 | 0.99 | 46.8 ± 0.94 | 2.01 |
| 20 | 870 ± 13.14 | 1.51 | 44.2 ± 1.34 | 3.03 |
| Cl− | Na+ | SO42− | Mg2+ | Ca2+ | K+ |
|---|---|---|---|---|---|
| 18.61 | 9.88 | 2.58 | 1.17 | 0.37 | 0.36 |
| SWSSC Strength Grade | Water | Sand | Stones | Cement |
|---|---|---|---|---|
| C20 | 196 | 775 | 1161 | 272 |
| C30 | 196 | 697 | 1185 | 326 |
| C40 | 196 | 634 | 1175 | 399 |
| SWSSC Strength | fcu (MPa) | COV (%) | fc (MPa) | COV (%) | Ec (GPa) | COV (%) | ν | COV (%) |
|---|---|---|---|---|---|---|---|---|
| C20 | 27.21 ± 0.90 | 3.31 | 20.74 ± 1.38 | 6.65 | 33.60 ± 1.13 | 3.36 | 0.22 ± 0.02 | 9.09 |
| C30 | 36.13 ± 0.92 | 2.55 | 27.36 ± 1.17 | 4.28 | 34.57 ± 1.24 | 3.59 | 0.22 ± 0.01 | 4.54 |
| C40 | 48.64 ± 1.33 | 2.73 | 36.90 ± 1.46 | 3.96 | 35.80 ± 2.12 | 5.92 | 0.23 ± 0.01 | 4.35 |
| Column Identifier | Numbers of GFRP and SS Bars | ρSS + ρGFRP (%) | ρSS/(ρSS + ρGFRP) |
|---|---|---|---|
| C20G16 | 6 G16 | 0 + 3.84 | / |
| C20S16 | 6 S16 | 3.84 + 0 | / |
| C20G16S16-1 | 4 G16 + 2 S16 | 1.28 + 2.56 | 0.33 |
| C20G16S16-2 | 3 G16 + 3 S16 | 1.92 + 1.92 | 0.50 |
| C20G12G16S16-1 | 2 G12 + 2 G16 + 2 S16 | 1.28 + 2.00 | 0.43 |
| C20G12G16S16-2 | 3 G12 + 1 G16 + 2 S16 | 1.28 + 1.72 | 0.64 |
| C20G16G20S16 | 2 G16 + 2 G20 + 2 S16 | 1.28 + 3.28 | 0.39 |
| C30G16 | 6 G16 | 0 + 3.84 | / |
| C30S16 | 6 S16 | 3.84 + 0 | / |
| C30G16S16-1 | 4 G16 + 2 S16 | 1.28 + 2.56 | 0.33 |
| C30G16S16-2 | 3 G16 + 3 S16 | 1.92 + 1.92 | 0.50 |
| C30G16S16-3 | 5 G16 + 1 S16 | 0.64 + 3.20 | 0.20 |
| C30G12G16S16-1 | 2 G12 + 2 G16 + 2 S16 | 1.28 + 2.00 | 0.43 |
| C30G12G16S16-2 | 3 G12 + 1 G16 + 2 S16 | 1.28 + 1.72 | 0.64 |
| C40G16 | 6 G16 | 0 + 3.84 | / |
| C40S16 | 6 S16 | 3.84 + 0 | / |
| C40G16S16-1 | 4 G16 + 2 S16 | 1.28 + 2.56 | 0.33 |
| C40G16S16-2 | 3 G16 + 3 S16 | 1.92 + 1.92 | 0.50 |
| C40G12G16S16-1 | 2 G12 + 2 G16 + 2 S16 | 1.28 + 2.00 | 0.43 |
| C40G12G16S16-2 | 3 G12 + 1 G16 + 2 S16 | 1.28 + 1.72 | 0.64 |
| C40G16G20S16 | 2 G16 + 2 G20 + 2 S16 | 1.28 + 3.28 | 0.39 |
| Column Identifier | Pmax,exp (kN) | Δu (mm) | εcp (με) | εfp (με) | εsp (με) | Pbar (kN) | Pbar/ Pmax,exp | Pmax,pre (kN) | Pmax,pre/ Pmax,exp |
|---|---|---|---|---|---|---|---|---|---|
| C20G16 | 652.3 | 0.91 | 1999 | 2140 | / | 120.84 | 0.19 | 645.1 | 0.96 |
| C20S16 | 798.3 | 0.81 | 2026 | / | 2001 | 231.67 | 0.29 | 766.3 | 0.96 |
| C20G16S16-1 | 725.6 | 0.85 | 2056 | 2301 | 1958 | 163.85 | 0.23 | 684.0 | 0.94 |
| C20G16S16-2 | 727.2 | 0.82 | 1879 | 2100 | 1808 | 175.13 | 0.24 | 700.4 | 0.96 |
| C20G12G16S16-1 | 718.5 | 0.84 | 2001 | G12:2100 G16:2141 | 1852 | 141.42 | 0.20 | 672.4 | 0.94 |
| C20G12G16S16-2 | 712.9 | 0.90 | 1983 | G12:2004 G16:2060 | 1917 | 130.81 | 0.18 | 667.3 | 0.94 |
| C20G16G20S16 | 766.8 | 0.82 | 1810 | G16:2024 G20:1895 | 1717 | 167.95 | 0.22 | 699.9 | 0.90 |
| C30G16 | 763.4 | 0.95 | 1755 | 1897 | / | 107.12 | 0.14 | 779.5 | 1.02 |
| C30S16 | 887.8 | 0.79 | 1945 | / | 1940 | 231.67 | 0.26 | 900.6 | 1.01 |
| C30G16S16-1 | 806.2 | 0.78 | 1829 | 2087 | 1787 | 155.79 | 0.19 | 804.3 | 0.95 |
| C30G16S16-2 | 828.4 | 0.81 | 1981 | 2291 | 2098 | 180.52 | 0.22 | 848.2 | 1.02 |
| C30G16S16-3 | 802.6 | 0.85 | 1920 | 2058 | 1877 | 135.46 | 0.17 | 797.7 | 0.99 |
| C30G12G16S16-1 | 797.3 | 0.87 | 1841 | G12:2005 G16:1928 | 1974 | 136.33 | 0.17 | 807.6 | 1.01 |
| C30G12G16S16-2 | 779.5 | 0.78 | 1846 | G12:1979 G16:2133 | 1939 | 131.07 | 0.17 | 803.0 | 1.03 |
| C40G16 | 946.7 | 0.79 | 2050 | 2178 | / | 122.99 | 0.13 | 1012.7 | 1.07 |
| C40S16 | 1179.6 | 0.81 | 1987 | / | 1972 | 231.67 | 0.20 | 1133.9 | 0.96 |
| C40G16S16-1 | 1039.4 | 0.85 | 2231 | 2359 | 2149 | 166.03 | 0.16 | 1058.7 | 1.02 |
| C40G16S16-2 | 1095.4 | 0.90 | 1970 | 2010 | 1981 | 172.58 | 0.16 | 1073.6 | 0.98 |
| C40G12G16S16-1 | 1015.5 | 0.81 | 2085 | G12:2281 G16:2217 | 2040 | 144.91 | 0.14 | 1042.3 | 1.03 |
| C40G12G16S16-2 | 974.1 | 0.84 | 1980 | G12:2187 G16:2117 | 1980 | 134.47 | 0.14 | 1038.5 | 1.07 |
| C40G16G20S16 | 1058.6 | 0.80 | 1867 | G16:2078 G20:1987 | 1972 | 171.53 | 0.16 | 1053.1 | 0.99 |
| Average | / | / | 1954 | 2088 | 1942 | / | / | / | 0.99 |
| Column Identifier | Δy (mm) | Δ75 (mm) | Δ85 (mm) | Ey (J) | Eu (J) | μ1 | μ2 |
|---|---|---|---|---|---|---|---|
| C20G16 | 0.37 | 0.44 | 1.43 | 143.4 | 396.1 | 2.76 | 3.86 |
| C20S16 | 0.36 | 0.58 | 2.46 | 210.7 | 759.5 | 3.61 | 6.83 |
| C20G16S16-1 | 0.33 | 0.53 | 2.02 | 186.7 | 624.2 | 3.34 | 6.12 |
| C20G16S16-2 | 0.31 | 0.48 | 1.98 | 180.2 | 624.2 | 3.47 | 6.30 |
| C20G12G16S16-1 | 0.31 | 0.46 | 1.71 | 182.2 | 585.1 | 3.21 | 5.52 |
| C20G12G16S16-2 | 0.38 | 0.51 | 1.93 | 166.5 | 521.7 | 3.13 | 5.12 |
| C20G16G20S16 | 0.32 | 0.48 | 2.01 | 182.0 | 648.4 | 3.56 | 6.36 |
| C30G16 | 0.39 | 0.48 | 1.40 | 183.1 | 448.0 | 2.45 | 3.59 |
| C30S16 | 0.35 | 0.55 | 2.13 | 243.9 | 802.7 | 3.29 | 6.01 |
| C30G16S16-1 | 0.35 | 0.44 | 1.58 | 193.7 | 555.6 | 2.87 | 4.51 |
| C30G16S16-2 | 0.31 | 0.51 | 1.60 | 185.7 | 568.6 | 3.06 | 5.23 |
| C30G16S16-3 | 0.38 | 0.50 | 1.46 | 208.6 | 525.6 | 2.52 | 3.84 |
| C30G12G16S16-1 | 0.33 | 0.45 | 1.41 | 193.1 | 538.4 | 2.79 | 4.27 |
| C30G12G16S16-2 | 0.44 | 0.48 | 1.59 | 183.4 | 490.6 | 2.68 | 3.61 |
| C40G16 | 0.36 | 0.44 | 1.23 | 208.1 | 493.2 | 2.37 | 3.42 |
| C40S16 | 0.38 | 0.58 | 1.98 | 341.8 | 991.8 | 2.90 | 5.21 |
| C40G16S16-1 | 0.46 | 0.56 | 1.83 | 321.6 | 860.3 | 2.68 | 3.98 |
| C40G16S16-2 | 0.45 | 0.58 | 1.86 | 285.8 | 789.2 | 2.76 | 4.13 |
| C40G12G16S16-1 | 0.45 | 0.53 | 1.54 | 255.7 | 637.3 | 2.49 | 3.42 |
| C40G12G16S16-2 | 0.43 | 0.49 | 1.39 | 256.6 | 624.8 | 2.43 | 3.23 |
| C40G16G20S16 | 0.42 | 0.59 | 1.96 | 306.4 | 865.2 | 2.82 | 4.67 |
Disclaimer/Publisher’s Note: The statements, opinions and data contained in all publications are solely those of the individual author(s) and contributor(s) and not of MDPI and/or the editor(s). MDPI and/or the editor(s) disclaim responsibility for any injury to people or property resulting from any ideas, methods, instructions or products referred to in the content. |
© 2024 by the authors. Licensee MDPI, Basel, Switzerland. This article is an open access article distributed under the terms and conditions of the Creative Commons Attribution (CC BY) license (https://creativecommons.org/licenses/by/4.0/).
Share and Cite
Wang, H.; Xu, J.; Zhao, J.; Han, X.; Pan, K.; Yu, R.C.; Wu, Z. Axial Compression Behavior of Circular Seawater and Sea Sand Concrete Columns Reinforced with Hybrid GFRP–Stainless Steel Bars. Materials 2024, 17, 1767. https://doi.org/10.3390/ma17081767
Wang H, Xu J, Zhao J, Han X, Pan K, Yu RC, Wu Z. Axial Compression Behavior of Circular Seawater and Sea Sand Concrete Columns Reinforced with Hybrid GFRP–Stainless Steel Bars. Materials. 2024; 17(8):1767. https://doi.org/10.3390/ma17081767
Chicago/Turabian StyleWang, Hongwei, Jinjin Xu, Jiuzhang Zhao, Xiaoyan Han, Kaiming Pan, Rena C. Yu, and Zhimin Wu. 2024. "Axial Compression Behavior of Circular Seawater and Sea Sand Concrete Columns Reinforced with Hybrid GFRP–Stainless Steel Bars" Materials 17, no. 8: 1767. https://doi.org/10.3390/ma17081767
APA StyleWang, H., Xu, J., Zhao, J., Han, X., Pan, K., Yu, R. C., & Wu, Z. (2024). Axial Compression Behavior of Circular Seawater and Sea Sand Concrete Columns Reinforced with Hybrid GFRP–Stainless Steel Bars. Materials, 17(8), 1767. https://doi.org/10.3390/ma17081767