1. Introduction
The continuing improvement of techniques for measuring electro-optic effects requires sources of measurement errors to be considered that were previously neglected. One such source of measurement errors is the contribution of the immersion liquid to the electro-optical measurements of solid samples. An immersion liquid is often necessary to protect hygroscopic crystals against moisture. For example, immersion liquids are used to protect KDP and KD*P crystals, which are very commonly used in nonlinear optics. The immersion liquid also suppresses the effect of multiple reflections on the faces of the solid sample, reduces light scattering on surface irregularities, and protects against electrical breakdown. However, the lack of experimental data makes it difficult to select an optimal liquid that does not exhibit a significant electro-optical Kerr effect in the fringing electric field around the electrodes on the crystal.
The aim of this work is to provide reliable measurements of the quadratic electro-optic effect as a function of temperature and frequency of the applied electric field for several methyl silicone oils with viscosities ranging from 10 to 10,000 cSt. In order to perform measurements for many combinations of temperature, modulating field frequency, and oil viscosity, we have developed a new approach to electro-optical measurements that combines measurement speed with good accuracy. We propose the use of a standard polarimetric setup along with a new measurement procedure, in which the measurements are carried out for two operating points on the transmission characteristics of the electro-optic modulator. As will be demonstrated here, it is necessary to control only the relative position of these two points, for example, using an analyzer mounted on a stepper motor, which is much more precise and easier than controlling the absolute position of a single operating point, as in the traditional approach.
Our results show that the Kerr coefficient ranges from −8.83 × 10
−16 to −6.79 × 10
−16 m V
−2 for all oil samples in the entire temperature range from 25 to 80 °C and frequencies from 67 up to 1017 Hz. Since these values are very small and are smaller than almost all previously reported ones for many other liquids (e.g., [
1,
2,
3,
4,
5,
6,
7,
8]), methyl silicone oils seem to be particularly suitable as immersion liquids. There are many other transparent liquids with low Kerr coefficients of the order 10
−15 m V
−2, but most are unsuitable for use as immersion liquids because of their volatility, flammability, toxicity, low boiling point, hydrophilicity, or electrical conductivity. Organic oils may also have unstable electro-optical properties, which are caused by aging [
8] or by orientational ordering of molecules in an electric field, which can depend not only on the current temperature but also on the thermal history of the oil [
9]. However, methyl silicone oils do not appear to have these problems. Moreover, the low dielectric constant of these oils allows for an almost uniform electric field inside the solid sample between the electrodes.
We found that the absolute values of all types of electro-optic coefficients for all oil samples increase with increasing temperature, which cannot easily be explained by current theories. For liquids, the classical statistical-mechanical theory of Buckingham and Raab [
1] predicts a decreasing temperature dependence of the molecular Kerr constant, which can be expressed as
where
,
, and
are constants specific to a substance. The constant
A0 is proportional to the second-order hyperpolarizability of the molecule,
A1 is related to the first-order hyperpolarizability and polarizabilities for the frequency of the incident light and for the static electric field, and
A2 is related to the permanent dipole moment. Dependence (1) has been experimentally confirmed for nitrobenzene [
2], as well as for several organic liquids belonging to the homologous series of ketone, aldehyde, nitriles [
3], and many others. In the case of molecules without permanent dipole moments, the term
vanishes. A linearly decreasing dependence of
on
has been confirmed, for example, for carbon disulfide, mesitylene [
1], benzene, toluene [
4], and perfluoropolyether Fomblin M03 [
5]. Several other decreasing dependencies of the Kerr
K coefficient have been proposed, based on experimental data for specific liquids, such as
for water [
6], the Van ’t Hoff-type expression
for binary liquid mixtures of aprotic-aprotic molecules [
7], or the linear dependence
, with
, for fresh and aged transformer oil [
8]. It should be noted that the mentioned papers provided only absolute values of
or
K without determining their sign. To our knowledge, very little data on methyl silicone oils have been available to date. The increasing temperature dependence of the absolute value of the Kerr coefficient was previously reported for a single sample of Polsil OM-3000 oil [
10], but the obtained values are several times overestimated compared to the results obtained later in ref. [
11] and in this study. Work [
11] focuses on the fact that the Kerr coefficient at room temperature has slightly smaller values for oils of lower molecular mass, and no temperature or frequency dependences are measured within the study. In the case of solid crystals, the typical temperature dependencies of various electro-optical coefficients also decrease when the measurements do not involve phase transitions [
12,
13,
14,
15,
16].
The decreasing temperature dependence of the dielectric constant in methyl silicone oils means that electro-optic coefficients traditionally considered to be less temperature-dependent, such as those defined in terms of polarization by Geusic [
12] and Miller [
13] or the molecular Kerr constant [
1], appear to grow even faster with increasing temperature than the usual electro-optic coefficients. Our results further show that the frequency dependence of the Kerr coefficient in methyl silicone oils is relatively weak.
2. Materials and Methods
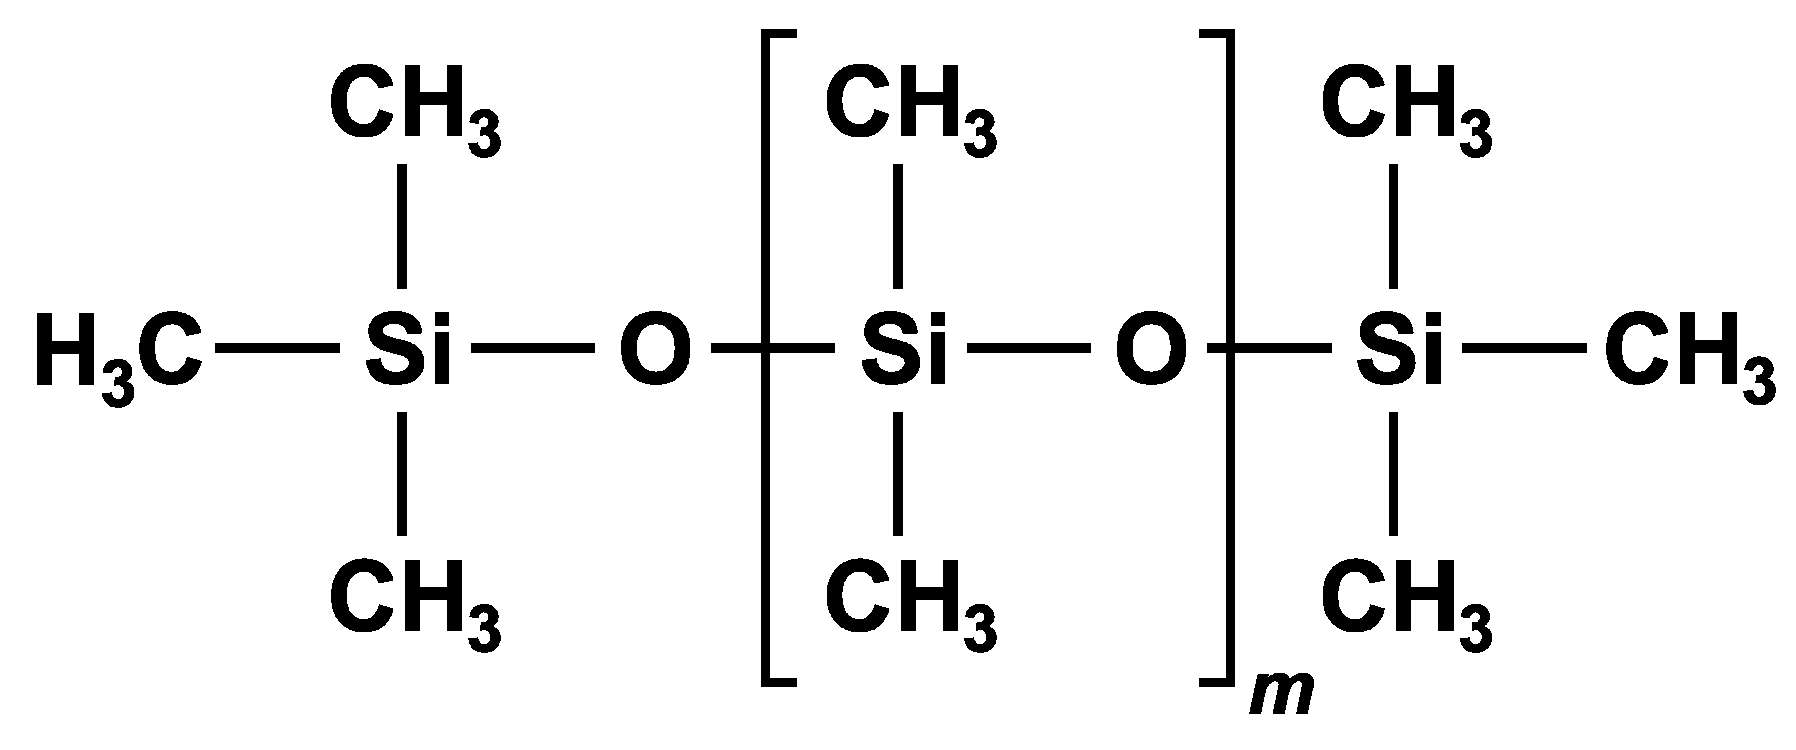
Methyl silicone oils are liquid organosilicon polymers composed of alternating silicon and oxygen atoms, which form a linear molecule with two methyl groups attached to each silicon atom (
Figure 1). These polymers have a wide range of useful properties, including transparency, very good dielectric properties, good surface wetting, hydrophobicity, and resistance to both low and high temperatures as well as to atmospheric and chemical factors. As a result, silicone oils have found numerous applications, including as liquid dielectrics, lubricants, hydraulic oils, heat exchanger oils, and as additives for cosmetics, paints, varnishes, car body creams, shoe and floor polishes, and furniture polishes.
There are many silicone oils with backbone chains consisting of alternating silicon and oxygen atoms. Multiple groups can be attached to tetravalent silicon centers. Some of these groups may be highly active, making them unsuitable for applications requiring resistance to multiple factors. Since the methyl group is highly stable and inactive, this determines the very low activity of the entire polymer molecule containing only methyl groups.
Methyl silicone oils are produced in a wide range of viscosities. The viscosity of the oil is related to the average number of dimethylsiloxane groups in the molecule (
Table 1). The measurements presented in this paper were made for six samples of POLSIL
® OM-10, OM-50, OM-300, OM-1000, OM-3000, and OM-10000 oils, where the number means the viscosity given in cSt at 25 °C. All tested oils were manufactured by Silikony Polskie Ltd., Nowa Sarzyna, Poland.
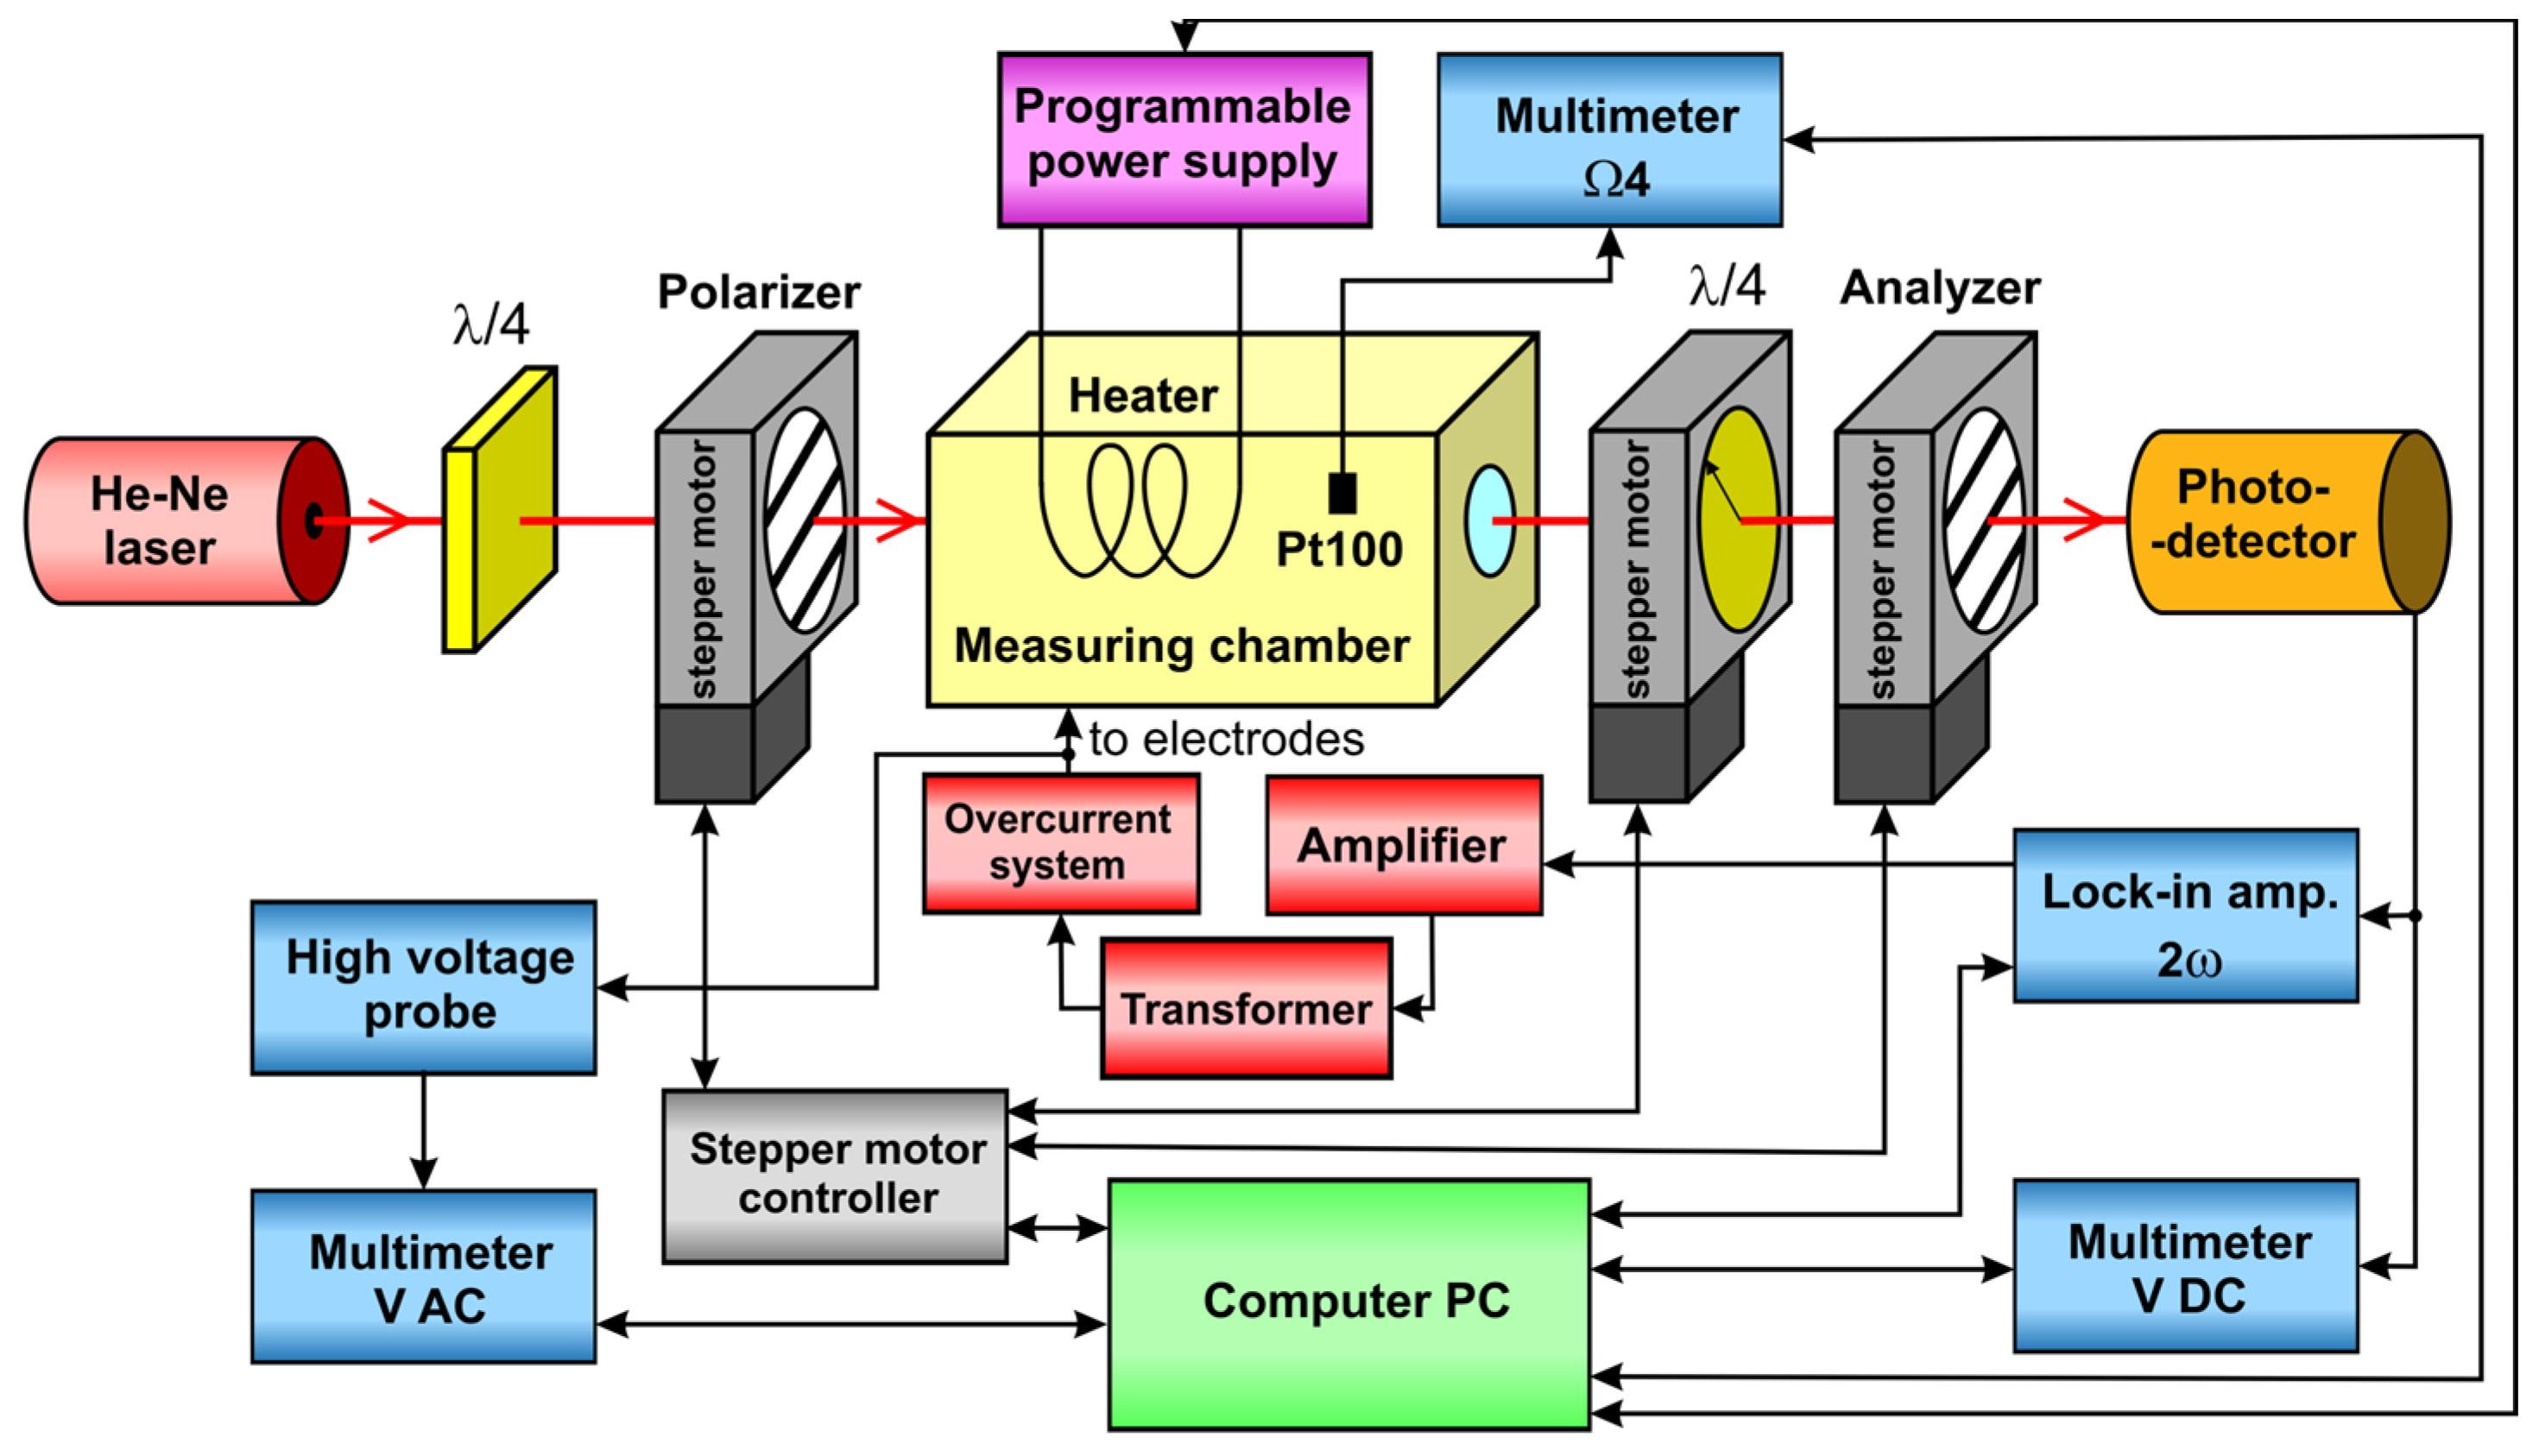
To measure the electro-optical properties of the methyl silicone oils, we used a standard polarimetric system consisting of a laser, a linear polarizer, the sample, a retardation plate, and a linear analyzer. In our experiment, an electric field
E was applied to the sample in a direction perpendicular to the light beam. We assume that the azimuths of all components are given relative to the direction of the field
E, which indicates the 0° azimuth. In an optimal case, the dependence of the transmitted light intensity
I on the phase difference induced in the sample by the applied field should be strongest and almost linear. When the sample is non-dichroic and optically inactive, and when the azimuth of the fast wave in the sample subjected to the field is 0° or 90°, the azimuth of the polarizer should be α = −45° or +45°, the azimuth of the analyzer should be β = −45° or +45°, and the azimuth of the fast wave in the retardation plate should be θ = 0° or 90° [
18]. These eight optimal measurement configurations lead to the following dependency for a theoretical system composed of ideal elements:
where
is the maximum value of
I; the signs “+” and “−” correspond to the parallel (
) and perpendicular (
) polarizers, respectively; γ and Γ are the phase differences appearing in the retardation plate and in the sample, respectively; and
for θ = 0° or
for θ = 90°. Here, Γ is used to represent the phase difference between a 0° polarized wave and a 90° polarized wave, which can take both positive and negative values, while γ always represents a positive value. It is convenient to consider Γ as the sum of the field-free
value and the small change
induced in the sample by the field. When the symmetry of the sample excludes the linear electro-optic effect, we obtain
where
L is the length of the sample and
K is the Kerr coefficient.
Let us now consider a dynamic method with a sinusoidal modulating field, as follows:
where the amplitude of the applied field results from the RMS voltage
applied to the electrodes with a distance
d, as follows:
The changes in the phase difference caused by the quadratic electro-optic effect are usually very small. Therefore,
,
, and the contribution of the rectified quadratic electro-optic effect
is negligibly small compared with the total field-free phase difference
. These approximations and Equations (2)–(4) lead to
The light passing through the modulator causes a voltage
at the photodetector output. Equation (6) shows that the voltage
U contains a DC component
and a second harmonic component of the modulating field. Following the convention used in lock-in amplifiers, we describe the second harmonic with the non-negative RMS voltage
and the phase
as
We easily find from Equations (6) and (7) that
takes only two values, −90° and +90°, and its sign is related to the configuration of the experimental setup and the sign of the Kerr coefficient. To simplify the notation, we define the modulation depth at the second harmonic frequency as a signed value, as follows:
From Equations (5)–(8), we find that
In practice, measurements often involve samples that are not expected to be naturally birefringent, such as isotropic liquids and solids or uniaxial crystals with light propagating along the optical axis. In such cases,
, and a quarter-wave plate is traditionally used to ensure optimal measurement conditions at
. If this condition is satisfied exactly, Equation (9) is simplified to
According to Equation (10), all eight optimal measurement configurations should lead to the same result for
. However, in our measurements, we often observed significant systematic discrepancies between the results obtained for different configurations, which cannot be explained by errors in the measuring instruments or by an imperfect alignment of the sample and optical elements. We found that this problem was mainly due to deviations in the total field-free phase difference
from the ideal value of 90°, which is difficult to avoid in practice. Consequently, Formula (10) yields an inaccurate result for
, instead of the exact
K (9). The relative error is
According to our observations, there are three main reasons for the deviation of the actual phase difference from the intended value of 90°:
The inaccuracies of commercially available quarter-wave plates are of the order of several degrees or, according to some researchers, up to 10° [
19].
The mechanical stress in glass and quartz cuvettes may cause a phase difference of up to 4°. This value varies depending on the temperature and where the light beam passes through on the faces of the cuvettes. We observed that even cuvettes of the same type are unique, but the fast-wave azimuth is typically almost parallel or perpendicular to the long edges of the optical windows. Thus, the phase difference introduced by a cuvette simply adds or subtracts from that introduced by the quarter wave plate and the sample in the cuvette.
The orientational ordering of elongated particles in an applied electric field also causes a phase difference. For highly viscous liquids in a field with a frequency of tens of hertz or more, we mainly observed the DC component of this phase difference, rather than the harmonic components. We have previously that this phase difference can reach values on the order of several tens of degrees at a distance of 50 mm shown for mineral transformer oil [
9]. Even if this effect in a given liquid is weak, it cannot be presumed due to the limited data in the literature.
The actual phase difference introduced by the quarter-wave plate can be measured and included in the calculations based on Equation (9). However, this approach is not suitable for suppressing the errors caused by the unstable birefringences mentioned in points 2 and 3. The solution to this problem proposed in the literature is to compensate for birefringence in a Sénarmont-type system [
18], in a photoelastic dynamic retarder used instead of a static quarter-wave plate [
20,
21], or in a sample using a DC bias voltage [
22]. Such systems should be readjusted after changing any parameters that could affect the total phase difference. Because this is time-consuming and difficult, we propose performing measurements without controlling the actual total phase difference in the present study. The systematic error given by Equation (11) can be eliminated by performing measurements for the two orientations of the analyzer while maintaining the positions of the polarizer and quarter-wave plate. These two measurements allow the determination of two modulation depths,
and
, for β = −45° and +45°, respectively, and for the corresponding two imprecise values
and
resulting from Equation (10). Considering, for example, a deviation of the total phase difference
up to ±10° from the ideal value of 90°, we obtain a relative measurement error Δ
K (11) of up to −16%...+19%. It is important that when one of the two inaccurate values
or
is underestimated, the other is overestimated, and the accurate value
K must lie between them. Using the basic trigonometric relations in Equations (9) and (10), it can be shown that the geometric mean of
and
is independent of
and equal to the exact absolute value |
K|, as follows:
The sign of
K can be taken to be the same as the signs of
and
.
Our proposed method offers good accuracy and speed, which is important for extensive research involving many combinations of various parameters. However, the method is not suitable for samples with high birefringence, which may result in an incorrect sign of K. Additionally, when the total phase difference is close to zero, the accuracy of the measurements decreases rapidly. This can be detected easily from the large discrepancy in the modulation depths and .
It is worth noting that if the measurements of and were made for two orientations of the polarizer α = −45° and +45°, with the analyzer azimuth unchanged, theoretically it should again lead to Formula (12). Unfortunately, in real systems, the rotation of the polarizer may slightly change the direction of the light beam passing through the sample in the cuvette and quarter-wave plate, which means that we cannot be sure that is kept constant.
4. Results
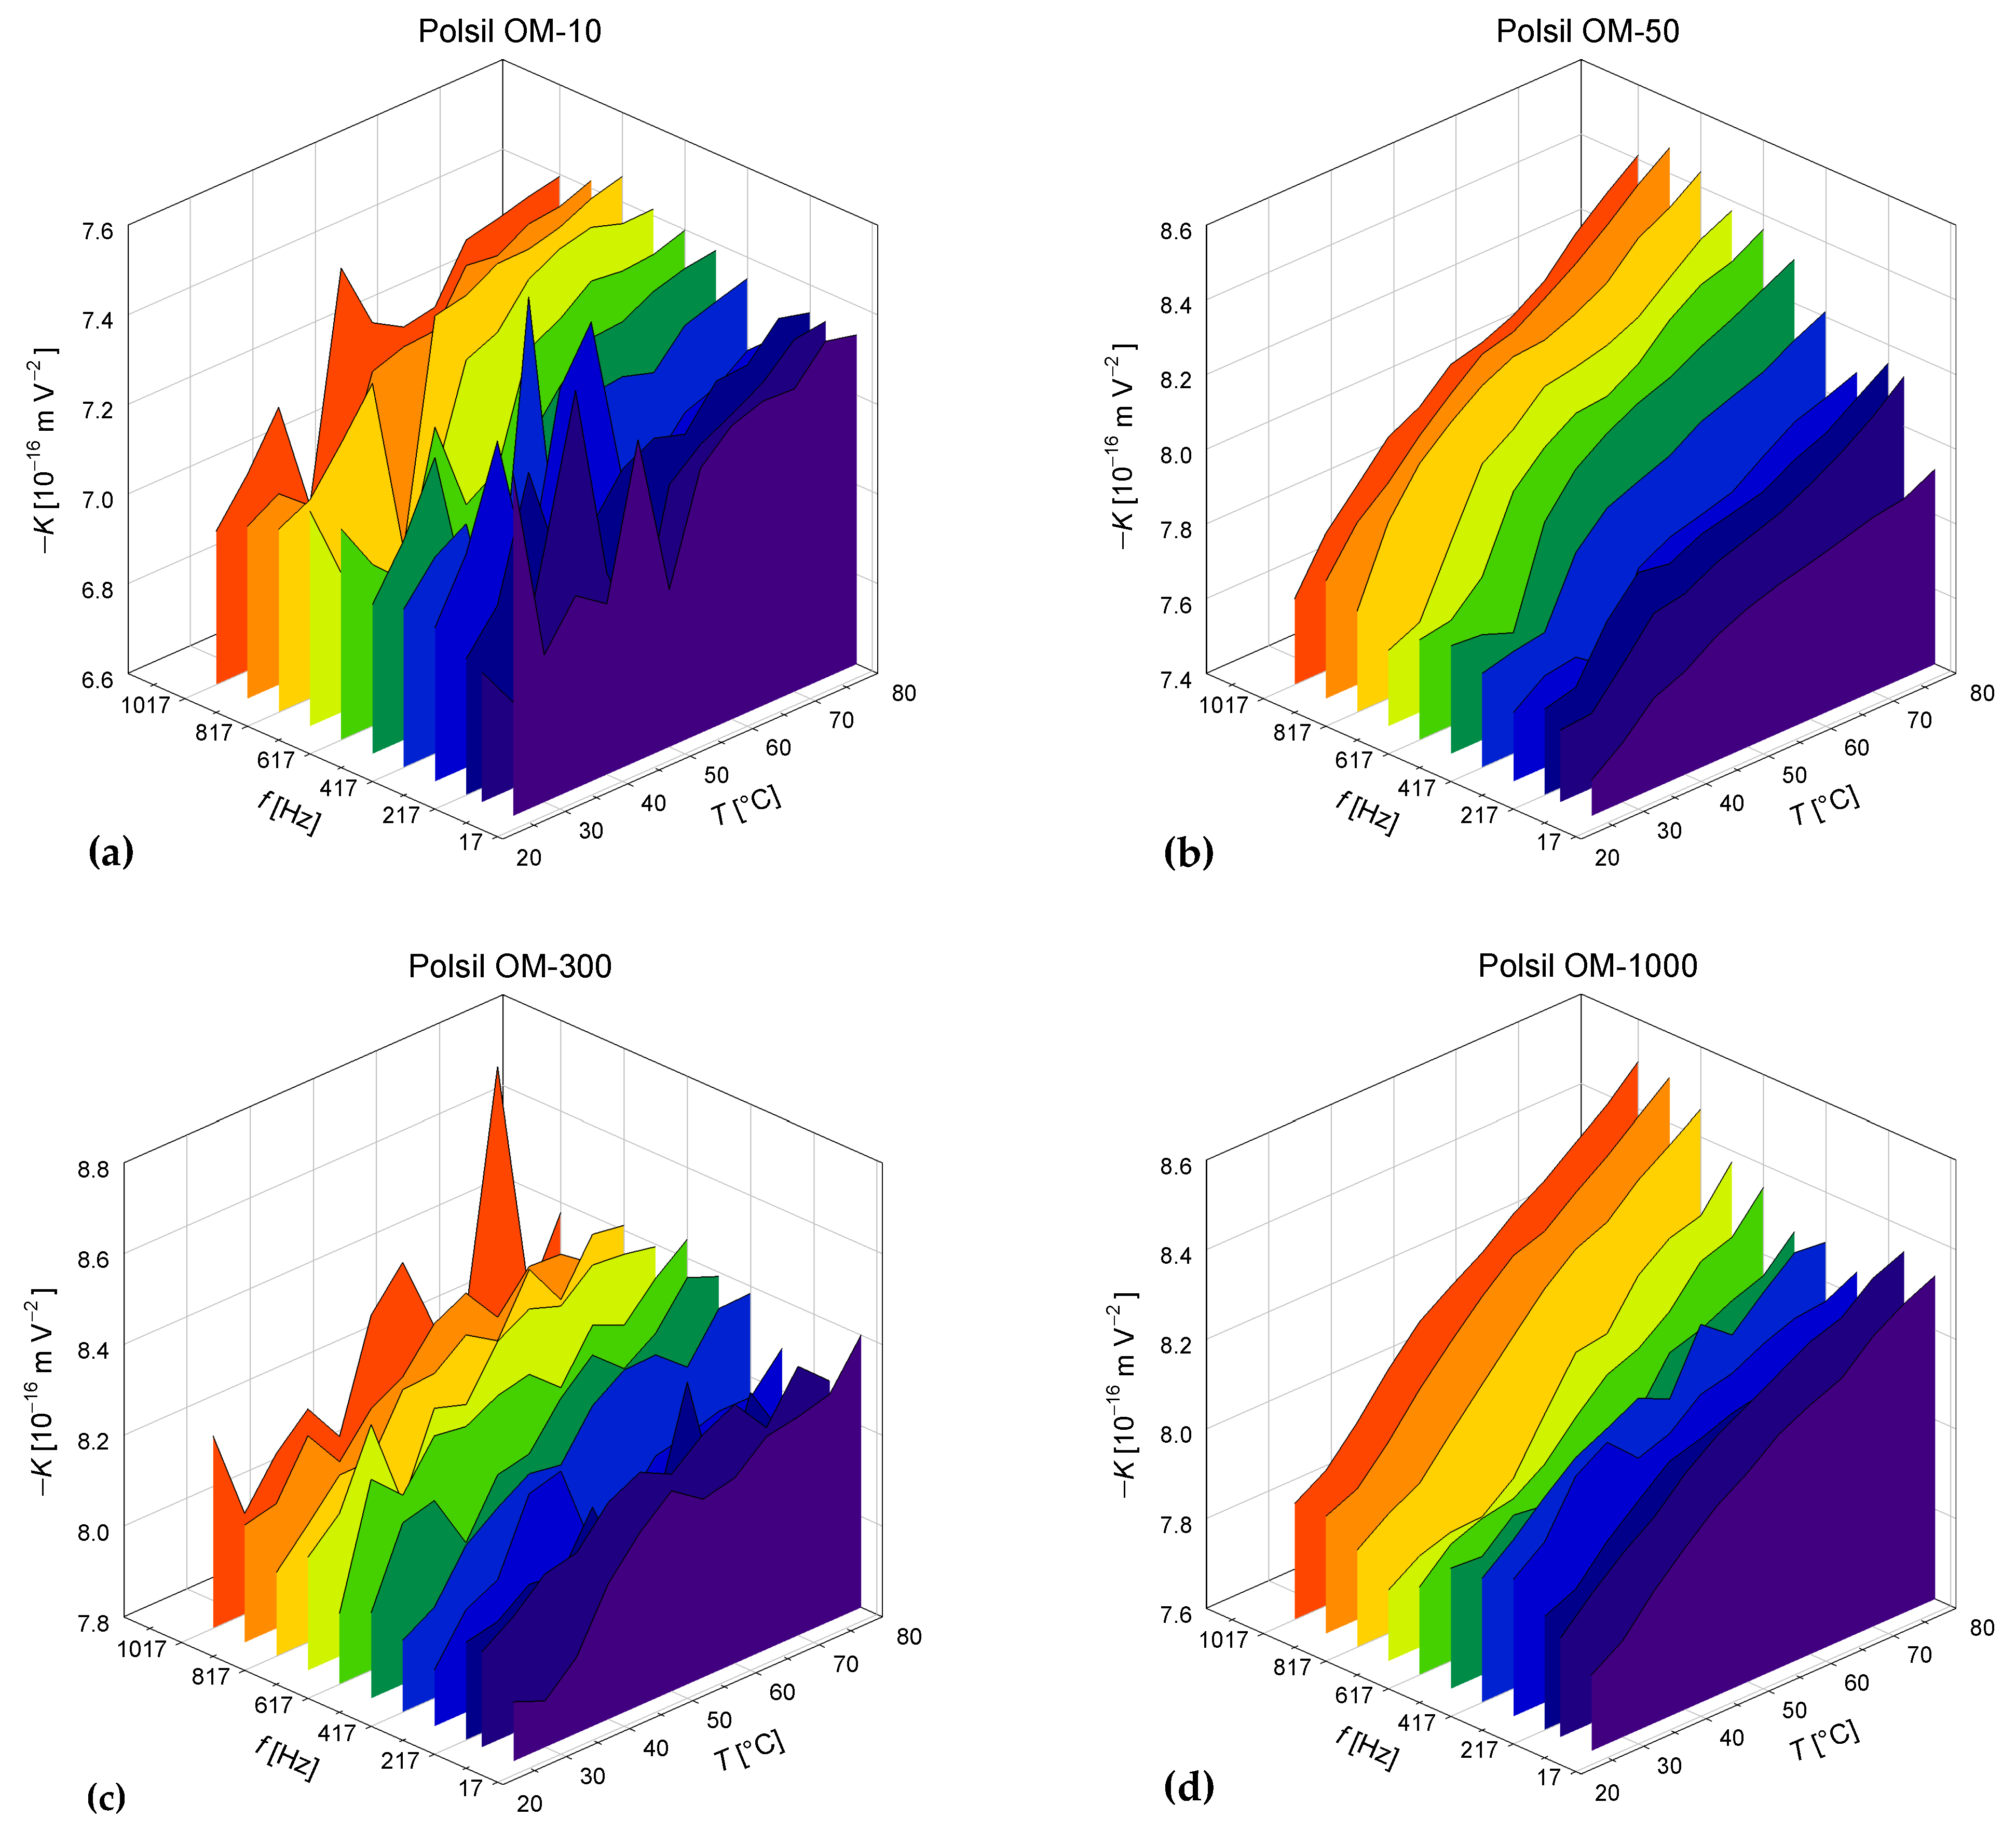
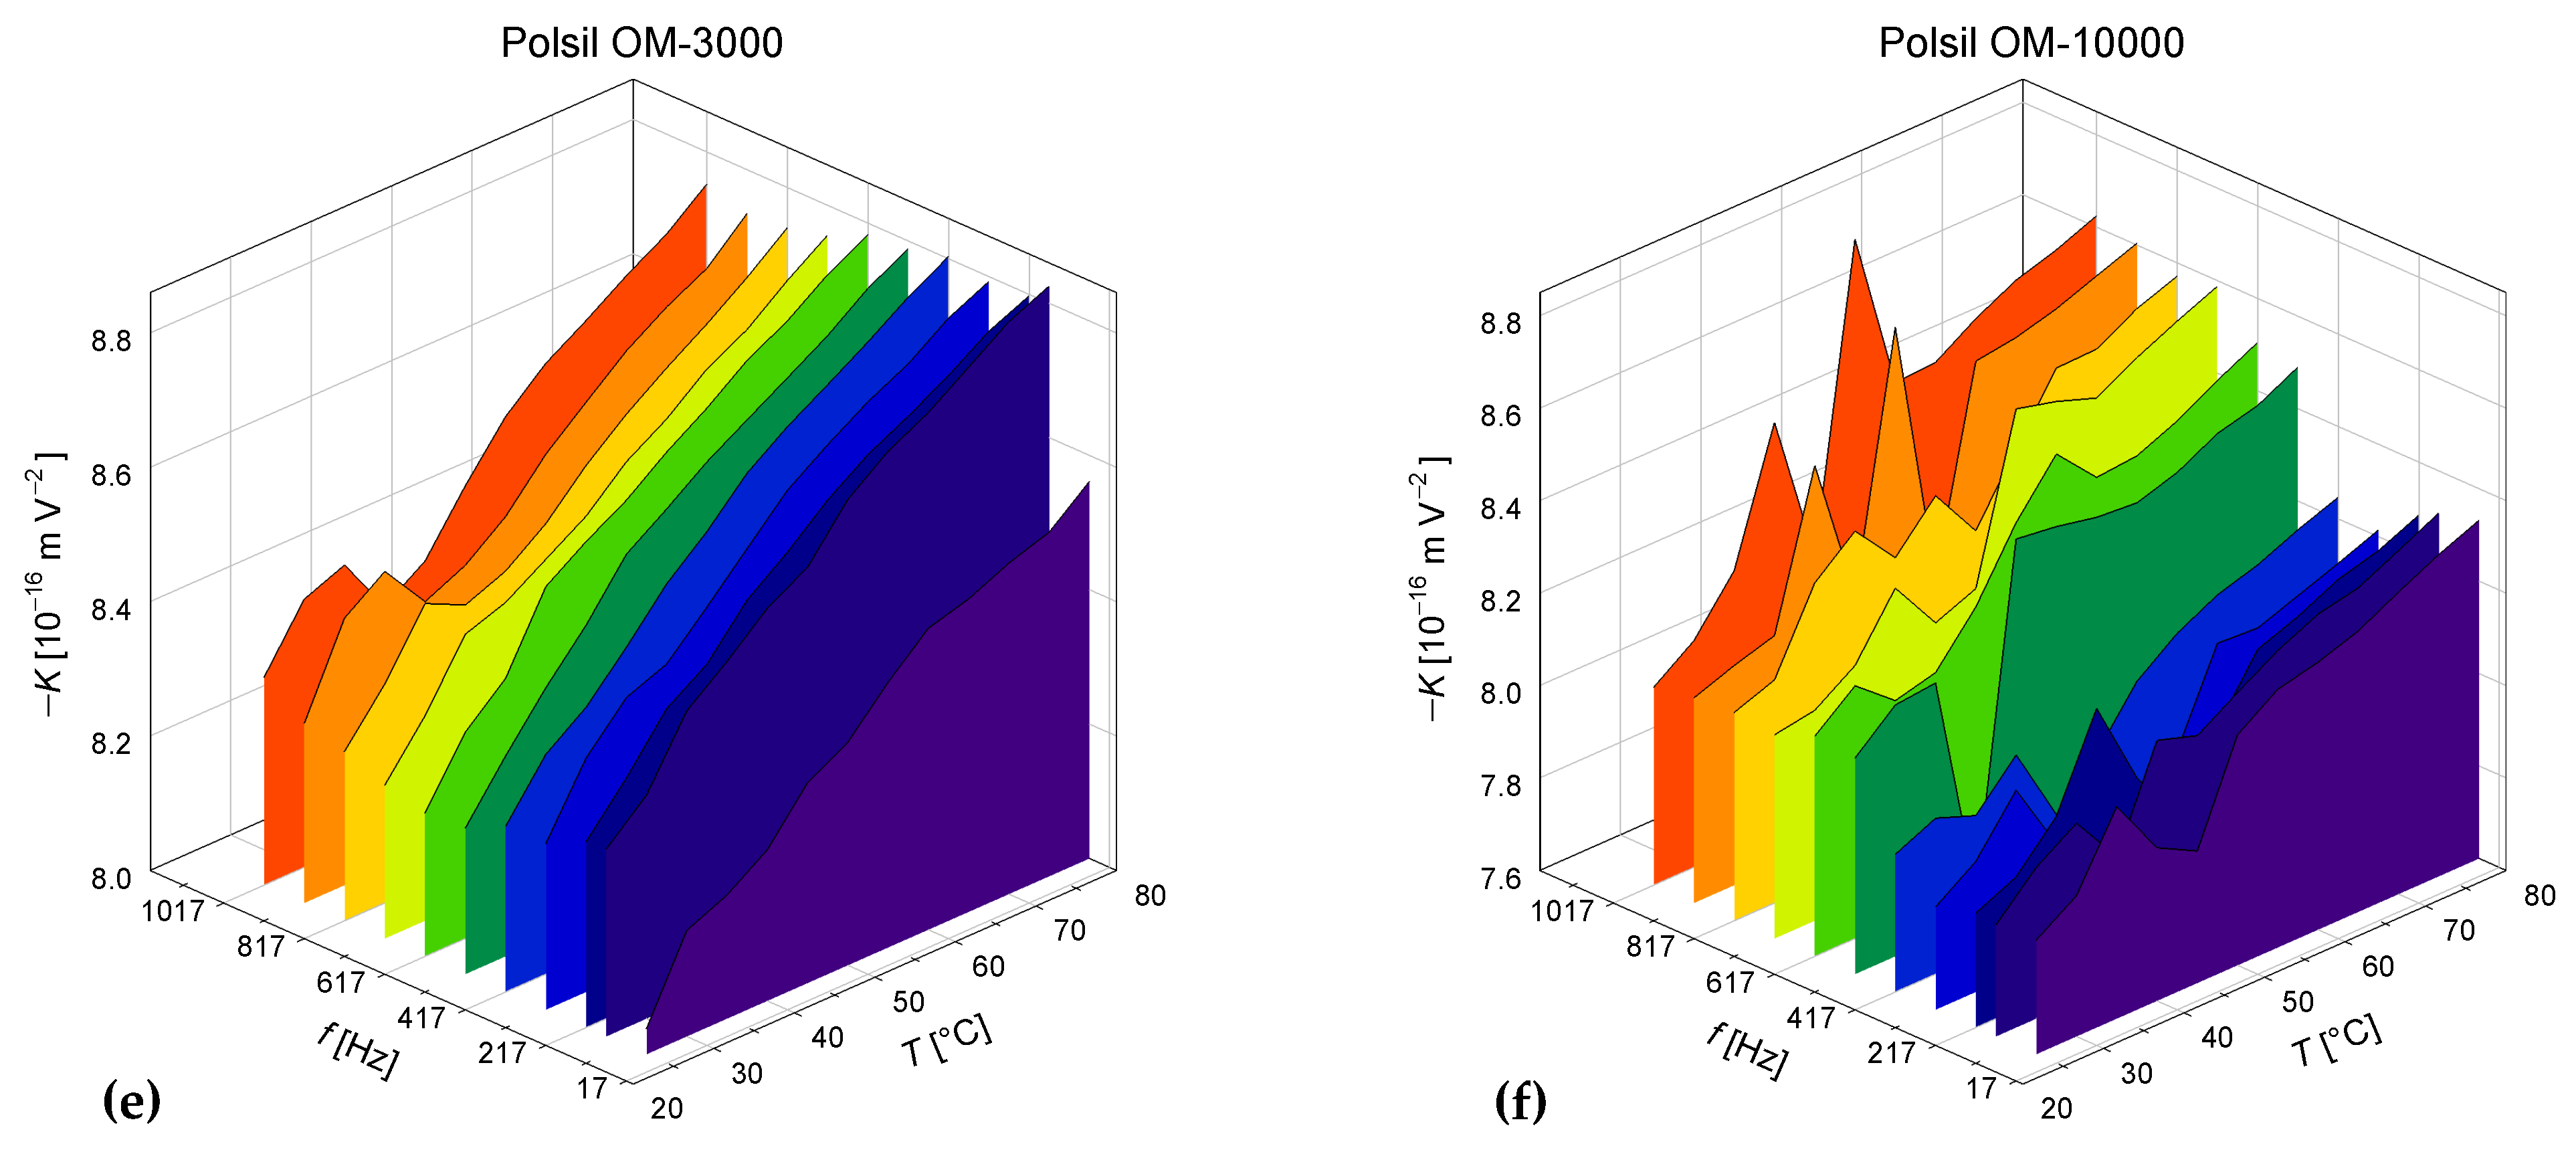
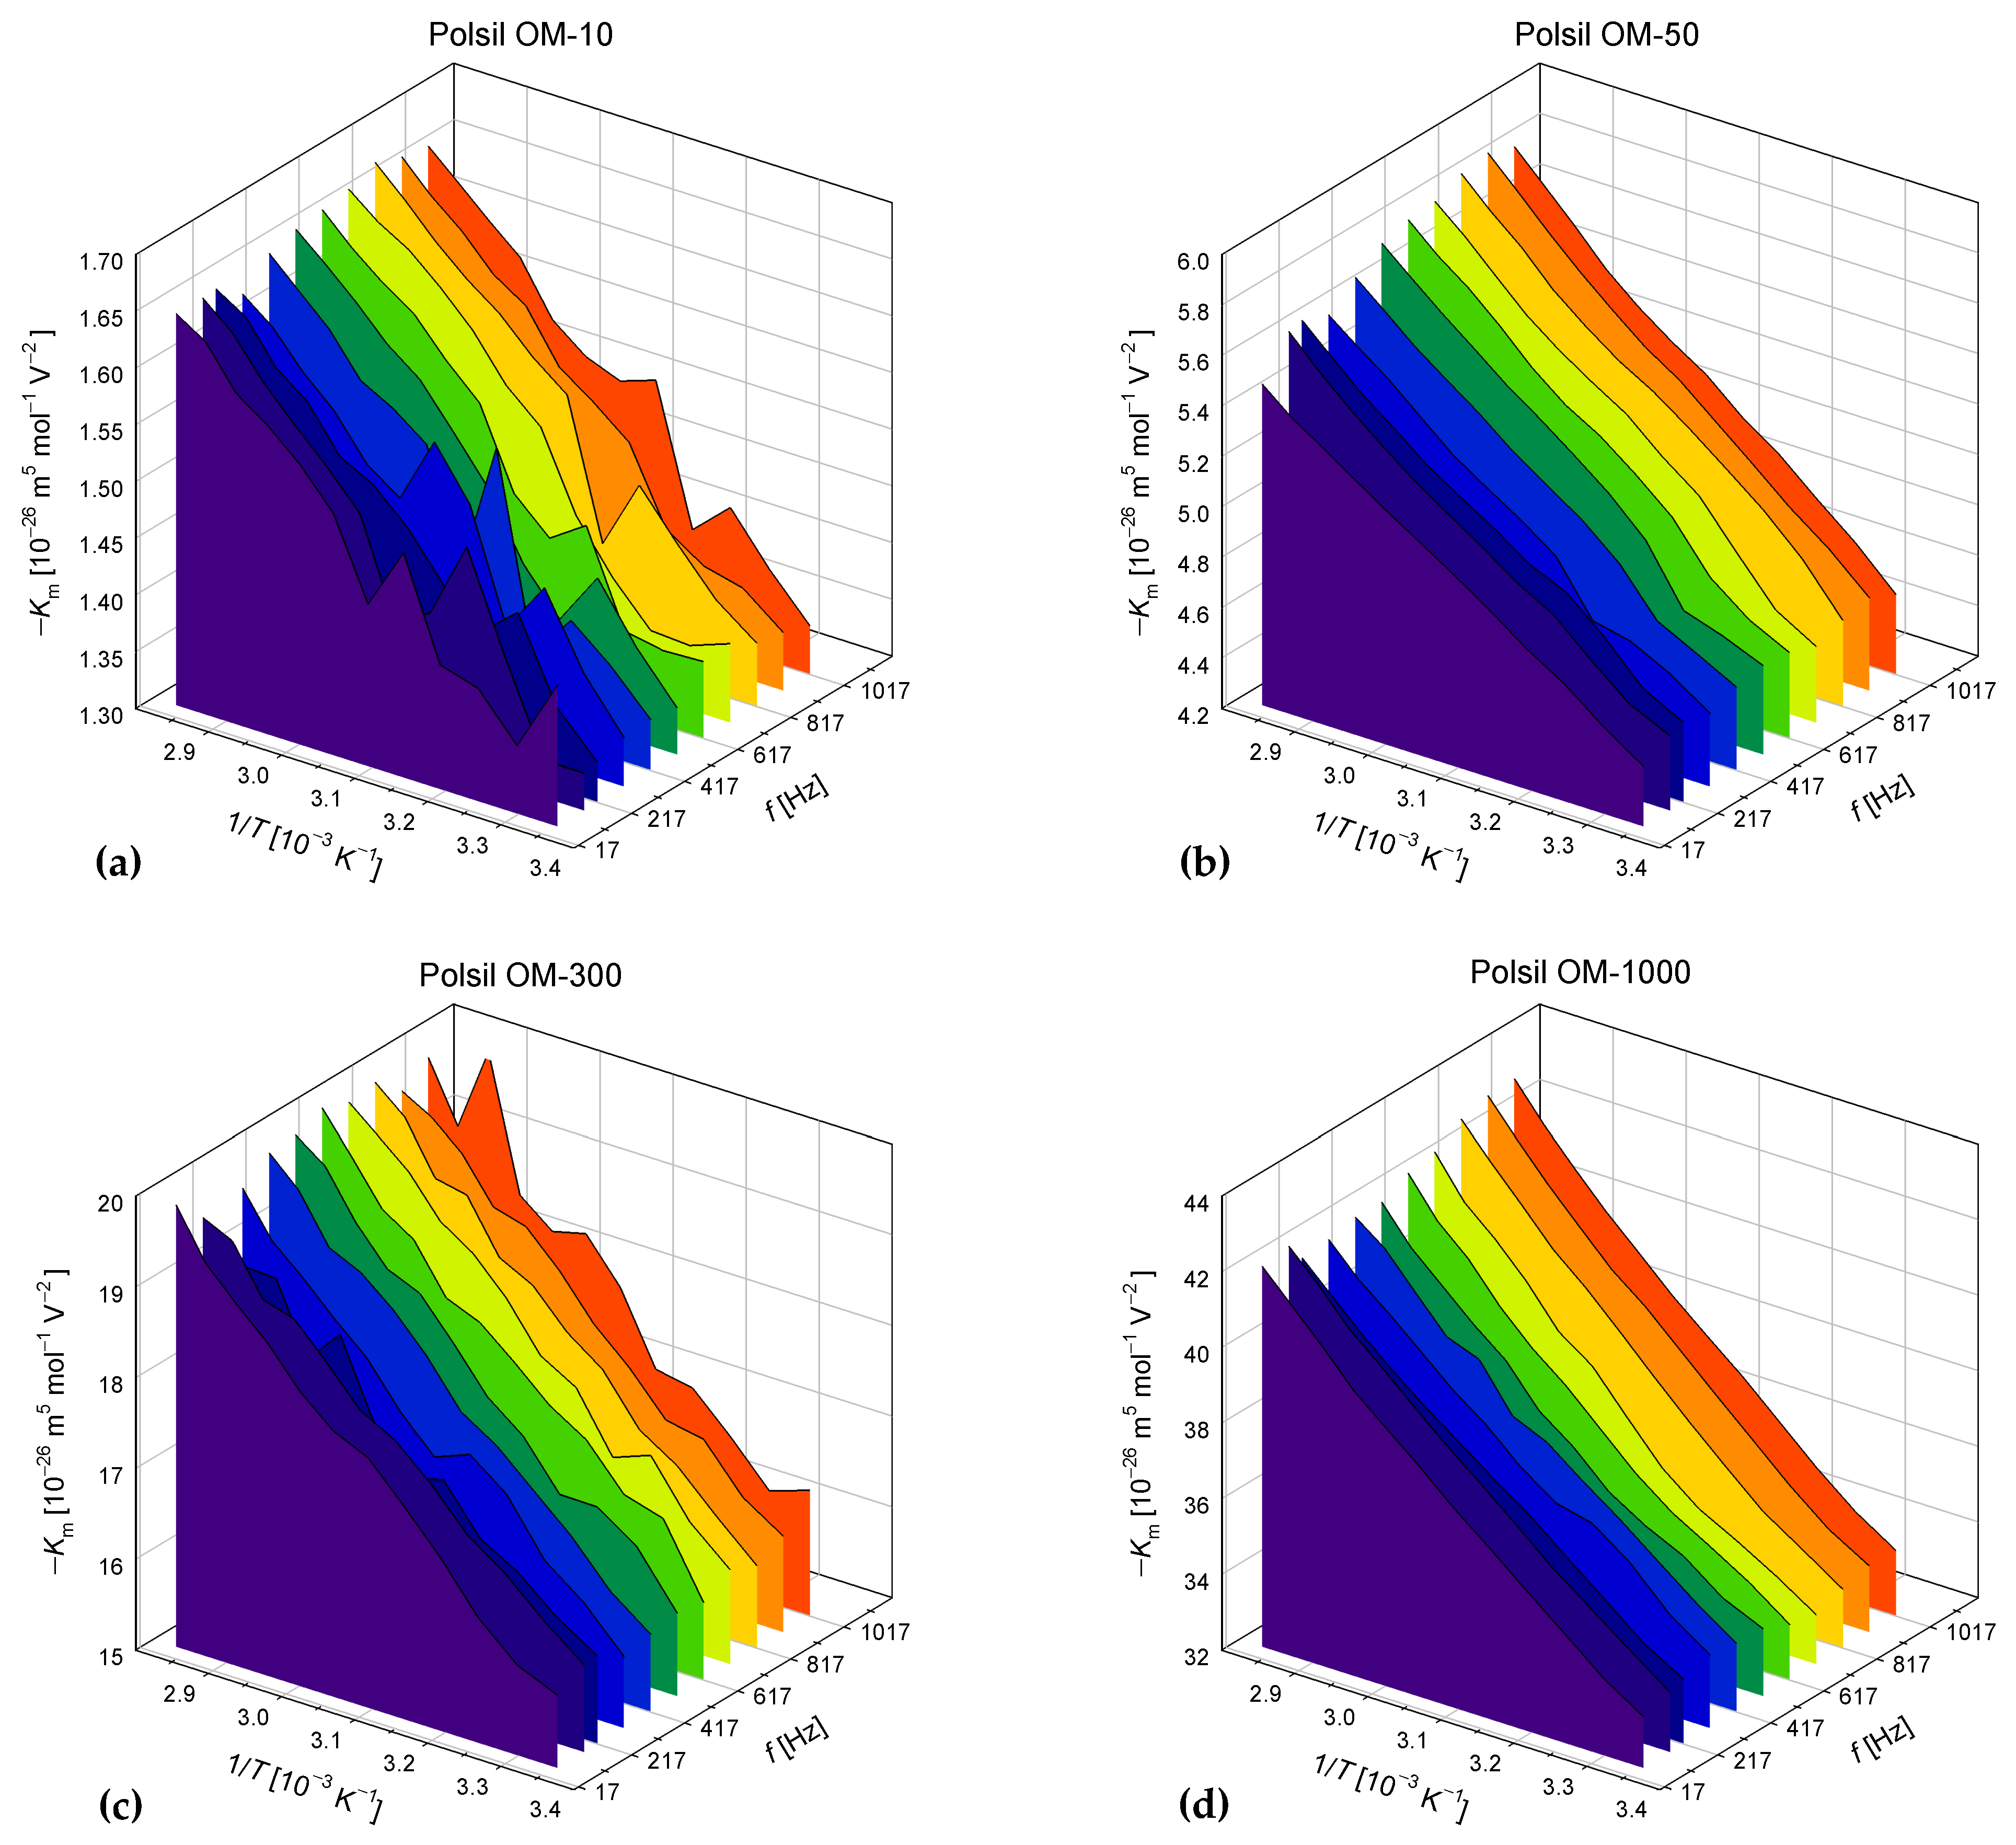
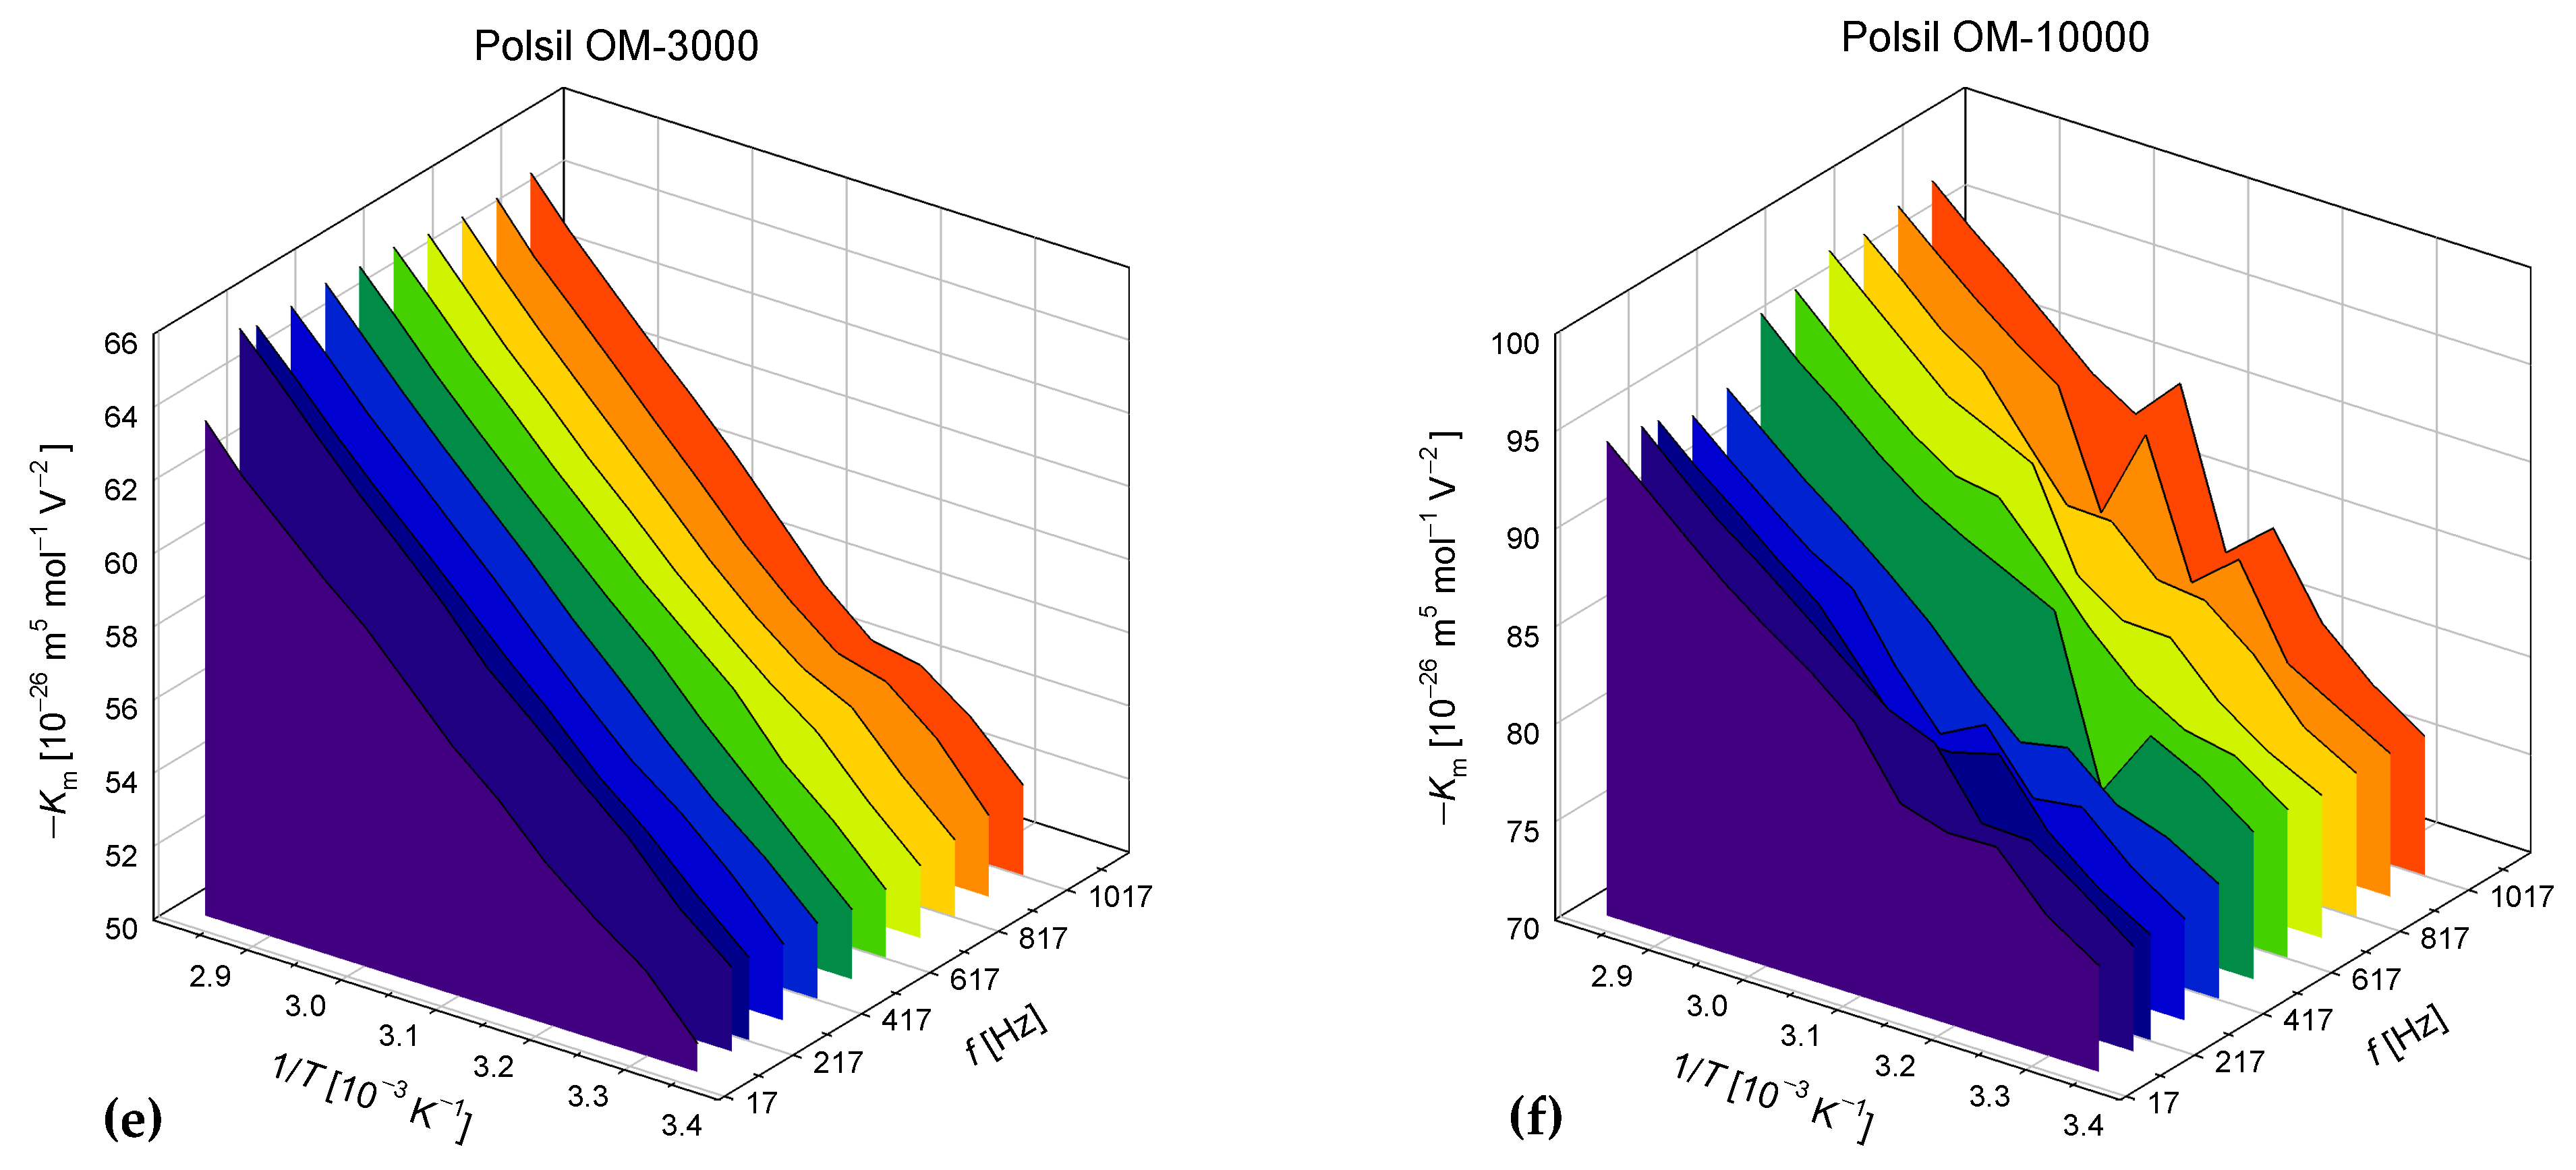
The temperature and frequency dependencies of the Kerr coefficient measured for the six methyl silicone oils with various viscosities are shown in
Figure 3. All obtained values are negative. Although the dependencies have some local disturbances, there is a clear positive correlation between the absolute value of the Kerr coefficient and temperature visible for all samples. Because such a dependence is unusual and the range of observed changes is relatively narrow, we made every effort to exclude the influence of the measuring equipment or procedure. In particular, we performed measurements for other liquids and solids, which confirmed the typical decreasing dependence of
K on
T. Moreover, all electro-optical measurements were repeated for eight optimal configurations of the measurement system, including two polarizer azimuths of −90° and +90°, two quarter-wave plate azimuths of 0° and 90°, and two analyzer azimuths of −90° and +90°. The results obtained for configurations differing only in the azimuth of the analyzer were averaged using the geometric mean (12), which, according to the model described in
Section 2, should make the results independent of the deviations of the total phase shift in the measurement system from the ideal value of 90°. The four geometric means obtained had very similar values, and their arithmetic means are presented in this paper.
The electro-optical properties of substances are traditionally described by several coefficients whose temperature dependencies may vary significantly. In addition to the Kerr coefficient, electro-optic coefficients are commonly used, which are defined by expanding the components
of the impermeability tensor at optical frequencies into the following power series [
23]:
where
is the Kronecker delta;
represents the field-free principal refractive indices;
and
are the coefficients of the linear and quadratic electro-optic effects, respectively; and
represents the components of the applied low-frequency electric field.
Assuming the form of the
tensor for an isotropic medium with ∞∞ symmetry [
23] and the measurement configuration given in
Section 2, we obtain the relation
where λ is the wavelength of light. It should be noted that when the orientational ordering of the molecules in the applied field is slow compared to the period of the field oscillation, this can be considered as lowering the symmetry to ∞2. In this case, by neglecting small differences between the
coefficients, we should input the effective electro-optic coefficient
instead of
in Equation (14).
The quadratic electro-optic effect can also be described by the so-called intrinsic coefficients defined in terms of electric polarization instead of the applied field [
12,
13], as follows:
where
is the vacuum permittivity and ε is the low-frequency dielectric constant.
In addition, we consider the molecular Kerr constant
, which is related to the usual Kerr coefficient
K in the following formula [
1]:
where
is the molar volume.
To investigate the temperature dependence of the
,
, and
coefficients, the temperature dependence of the refractive index
must be known. As the data available in the literature are only fragmentary, we performed our measurements using an Abbe refractometer. We found that the refractive index decreased linearly with increasing temperature for all samples of methyl silicone oils measured over a temperature range of approximately 20–80 °C (
Table 2).
To calculate the
and
coefficients, the values of ε as a function of temperature and frequency were also required. Because data are available only for selected temperatures and frequencies, we performed our own measurements using the LCR meter GW INSTEK LCR-6100. We found that the dielectric constant of all the oil samples showed no frequency dependence in the tested range from 67 Hz to 1017 Hz. The observed temperature dependencies clearly decreased for all samples. Because these dependencies could not be described satisfactorily by a linear function or a Curie–Weiss function, we used second-degree polynomials (
Table 3).
The molecular Kerr constant
depends on the molar volume
. Because of the lack of data in the literature, we calculated
using the temperature dependence of the density of methyl silicone oils
given in [
17] and the densities of oils at 25 °C [
24]. The atomic mass
M was calculated based on the chemical structure shown in
Figure 1 and the average number
m of dimethylsiloxane segments. Because the manufacturer does not provide such data for oils with viscosities of 300 cSt and 3000 cSt, we estimated
m using the smoothed dependence of
m on the viscosity fitted to the data for seven other oils (
Table 1).
The obtained the dependencies of
on the frequency and reciprocal of temperature, which are presented in
Figure 4. The temperature dependencies can be approximated by the function
predicted for non-polar liquids. However, it is surprising that
and
for all oil samples, which cannot be correctly described by Buckingham’s classical theory (see
Section 5—Discussion). The coefficient
depends strongly on the oil viscosity, which results from different values of the molar volume in Formula (16), while the values of
turn out to be almost independent of the viscosity. The values of the
ratio are within a narrow range from –192 to –162 K for all oil samples and frequencies.
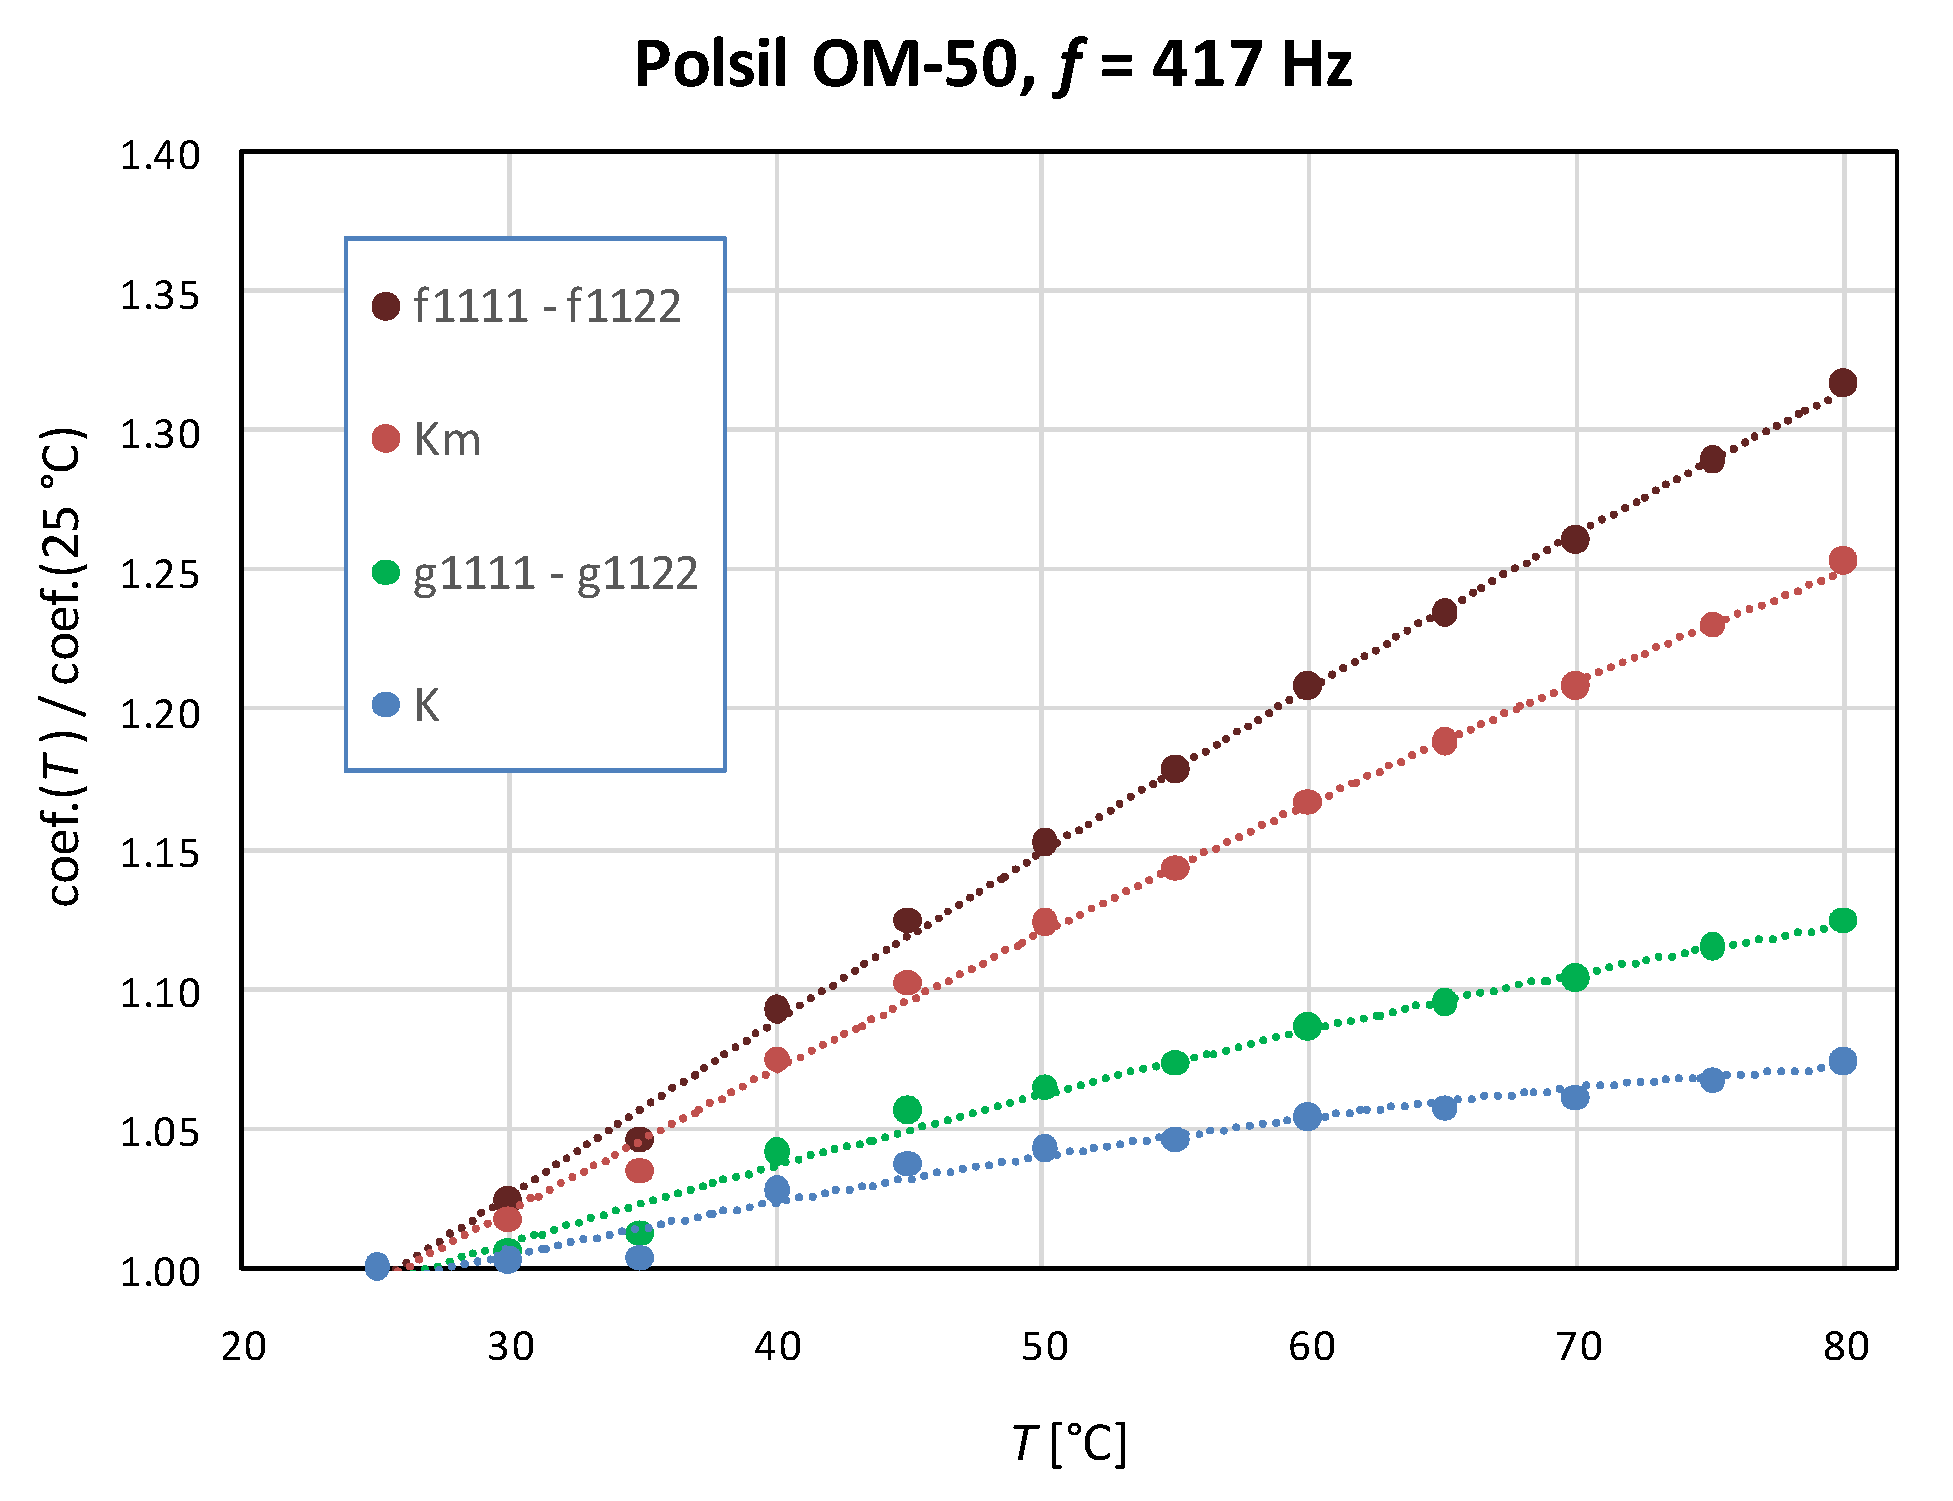
Owing to the decreasing temperature dependence of the refractive index for all oils, the coefficient
increases noticeably faster with the increasing temperature than
K (
Figure 5). Moreover, the decreasing temperature dependence of the dielectric constant results in an even stronger increasing temperature dependence of the intrinsic electro-optic coefficient
than that obtained for
. The temperature dependence of
is always intermediate between those observed for
and
.
Due to the large amount of data and similar dependencies obtained for all individual samples and frequencies, only some results are included here. All obtained values of the coefficients
,
,
,
, and
are available in
Tables S1–S5, respectively, located in the
Supplementary Materials.
5. Discussion
Despite the huge differences in the viscosity of the methyl silicone oil samples, all values for the Kerr coefficient obtained at λ = 632.8 nm fall within a relatively narrow range from −8.83 × 10
−16 to −6.79 × 10
−16 m V
−2 across all studied temperatures and frequencies. To our knowledge, these values are lower than almost all previously reported ones, including remarkably low values such as 12.3 × 10
−16 m V
−2 for methyl n-Propyl Ketone, 13.6 × 10
−16 m V
−2 for butyraldehyde [
3], or 18 × 10
−16 m V
−2 for fresh transformer oil at room temperature [
8]. A similar value of 7.63 × 10
−16 m V
−2 at room temperature was reported only for 1,4-dioxane [
25], which is not suitable for being used as an immersion liquid due to its hygroscopicity, volatility, and toxicity. Our values for the Kerr constant are also at least two orders of magnitude smaller than those typical for the solid crystals used in nonlinear optics, for example,
K = 8.3 × 10
−14 m V
−2 for the KDP crystal at room temperature and λ = 632.8 nm (calculated according to Formula (14) for
given in [
16]). Therefore, we expect that the electro-optical measurements of solid crystals immersed in methyl silicone oil will not be significantly affected by the fringing electric field around the electrodes on the crystal.
The experimental temperature dependencies of
shown in
Figure 4 match the theoretical dependence (1) with
predicted for non-polar molecules. However, the interpretation of negative
in combination with positive
values resulting from our measurements may raise considerable doubts. Although negative values of the Kerr constant in liquids are already known from the literature (e.g., [
25,
26,
27]), the increasing temperature dependence of the absolute value of
has probably not been reported. According to Buckingham’s theory for non-polar substances [
1],
where
and
are the principal polarizabilities of a molecule in the optical frequency and static/low-frequency fields, respectively;
,
are the components of the hyperpolarizability tensor;
N is Avogadro’s number; and
k is the Boltzmann constant. Fitting the dependence (17) to our experimental data leads to relatively large negative values of the temperature-independent term and smaller positive values of the term proportional to 1/
T. This result seems questionable and is contrary to the data presented, for example, in [
1], which show that the temperature-independent term should be much less important at room temperature. The theoretical dependence (17) was derived under the assumption that long-range ordering does not contribute to
because, for an assembly of non-polar molecules, the interaction potential energies do not depend on their orientation. Another assumption is to use the
and
polarizabilities as temperature-independent molecular constants. However, both assumptions seem inconsistent with the recent observations of efficient hydrogen bonding in polydimethylsiloxanes, where local ordering of chains occurs with more or less parallel alignment of individual chain backbones in lamellar domains [
28]. Because hydrogen bonds are relatively weak, long-range ordering disappears with increasing thermal motions.
The intrinsic electro-optic coefficients
, i.e., the coefficients defined in terms of induced electric polarization, are widely used to describe solid crystals because they show less material dependence [
12,
13] and less temperature dependence [
14,
16,
29] than the
coefficients. The intrinsic coefficients have probably not been applied to liquids. The results obtained in this study show that the conclusions formulated earlier for solid crystals cannot be simply extended to methyl silicone oils, in which the temperature dependence of the
coefficient is stronger than that of the
K,
, and
coefficients. It is also worth noting the significant difference between the temperature dependence of the
K and
coefficients. Because the values of
are more difficult to find, dependence (1) has been applied directly to
K in some previous studies, and it has no theoretical justification.
The maximum measurement uncertainty, estimated based on the accuracy of the measuring instruments used, does not exceed 1% for the
K and
coefficients or 1.5% for
. However, we observed that the effect of the frequency of the modulating field clearly exceeds these uncertainties. The frequency effect manifests as slightly lower absolute values of the Kerr coefficient for the lowest frequencies (
Figure 3), while at higher frequencies, we only observe fluctuations specific to a given oil sample. These fluctuations are repeatable in all series of measurements made for different orientations of the polarizer and quadrant of the plate. Because no theoretical general dependence of the Kerr coefficient on frequency is currently known for liquids and there is insufficient experimental data for other liquids, we cannot formulate any general rule.
We observed slightly smaller values of the Kerr constant for oils with the lowest viscosities, especially for the Polsil OM-10 oil, which confirms the previous results presented in [
10]. This effect is probably due to the lower density of the oils with the lowest viscosities and atomic masses, while the density becomes almost independent of the atomic mass for viscosities above 300 cSt [
24]. However, it should be noted that these are average data, and, in practice, oil of a given viscosity can be produced by mixing oils of other viscosities, which may slightly affect its density.
6. Conclusions
We performed electro-optical measurements of methyl silicone oils with viscosities from 10 to 10,000 cSt (at 25 °C) at temperatures from 25 to 80 °C and frequencies from 67 to 1017 Hz. All obtained values of the Kerr coefficient were negative and fell within a relatively narrow range from −8.83 × 10⁻¹⁶ to −6.79 × 10⁻¹⁶ m V−2. The coefficient of the quadratic electro-optic effect ranged from 3.16 × 10⁻²² to 4.23 × 10⁻²² m2 V−2, which are among the lowest values reported for liquids thus far. Methyl silicone oils also offer several other advantageous properties, such as a low dielectric constant, high electrical resistivity, transparency, chemical stability, non-volatility, non-flammability, hydrophobicity, and non-toxicity, making them very suitable as immersion liquids for electro-optical studies of solid crystals and other solid materials.
Unusually, increasing temperature dependencies were observed for the absolute values of the Kerr coefficient, molecular Kerr constant, and quadratic electro-optic coefficient of all oil samples over the entire studied temperature range. Such dependencies have not been reported for other liquids and cannot be properly described by Buckingham’s classical molecular theory of the Kerr effect. Moreover, the intrinsic quadratic electro-optic coefficient (i.e., the coefficient defined in terms of induced polarization) increased even faster with increasing temperature than any other electro-optical quantities. This result completely contrasts the results of previous studies, in which particularly weak temperature dependencies of various intrinsic coefficients were observed for many solids.
To investigate the influence of several factors, we needed a method that could ensure both rapid and precise electro-optical measurements at the same time. The improved dynamic polarimetric method proposed in this paper used two operating points on the transmission characteristics of the electro-optical modulator, and only their relative positions needed to be controlled carefully. Because the change in the position of the operating point can be controlled precisely, easily, and quickly using a rotary stepper motor, our approach is more effective than traditional dynamic methods, in which measurement accuracy strongly depends on control over the absolute position of a single operating point.


