
Artificial Weathering Test Methods of Waterborne Acrylic Coatings for Steel Structure Corrosion Protection


Abstract
:1. Introduction
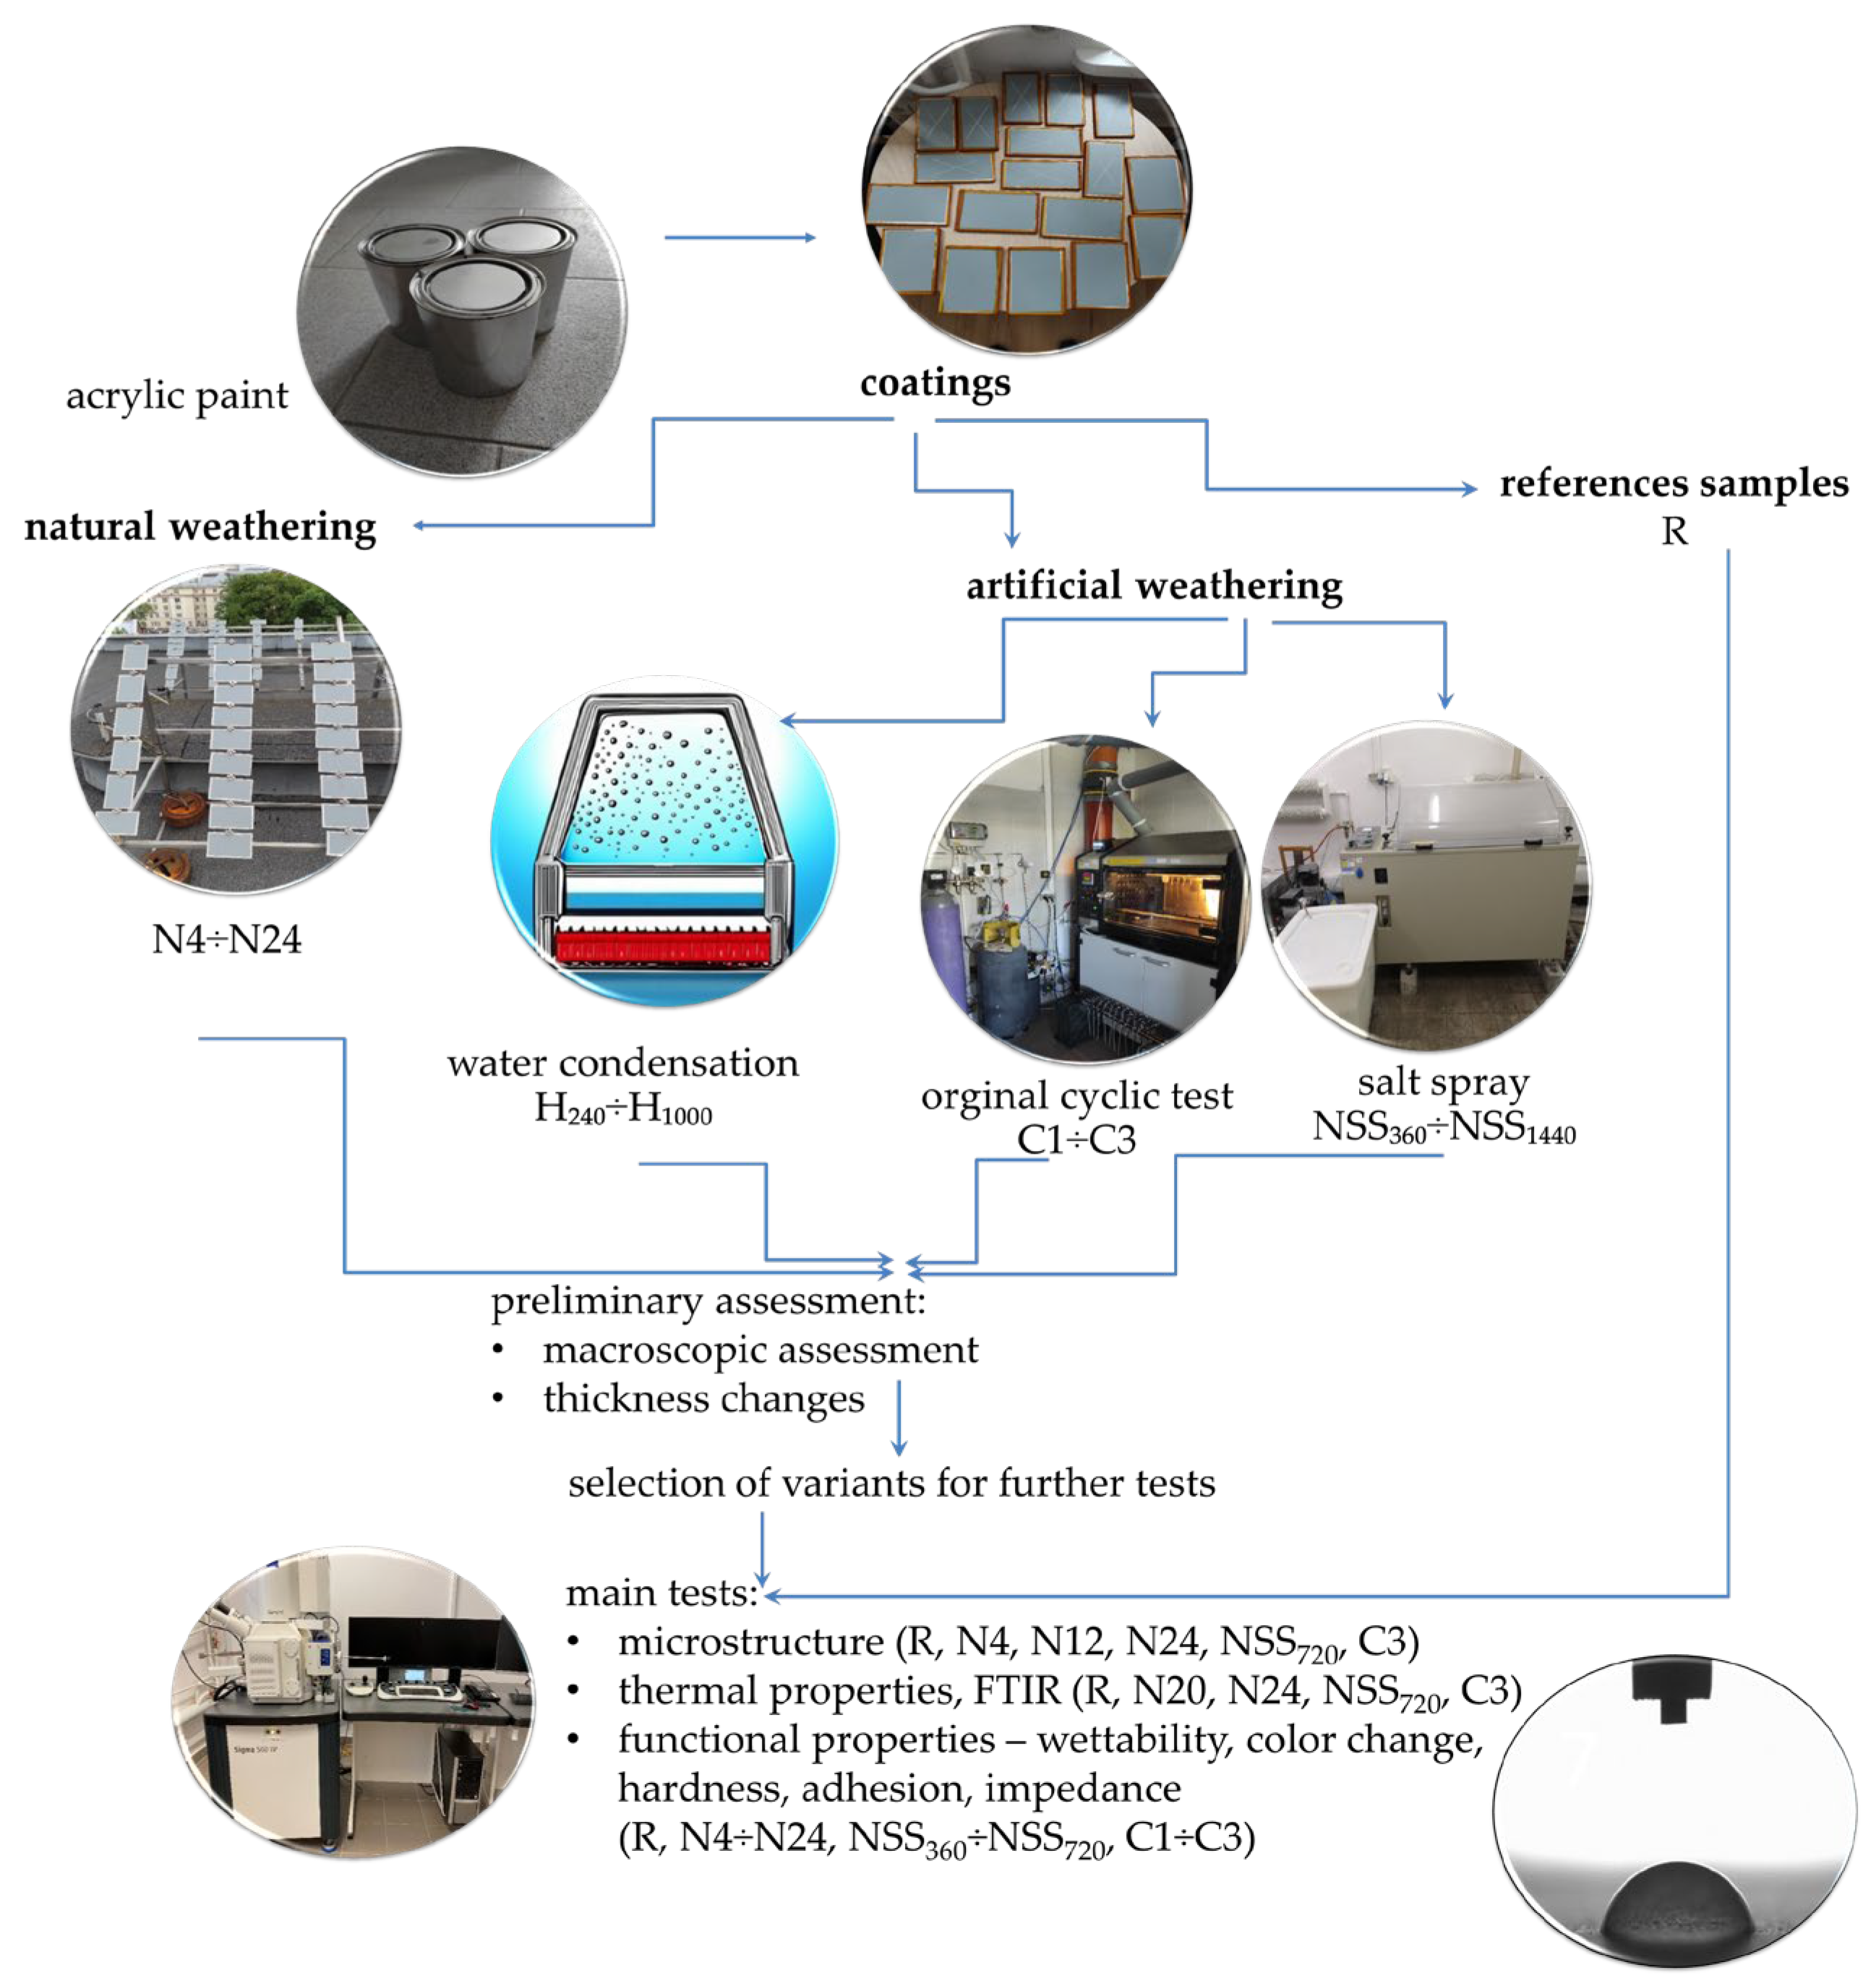
2. Materials and Methods
2.1. Coatings
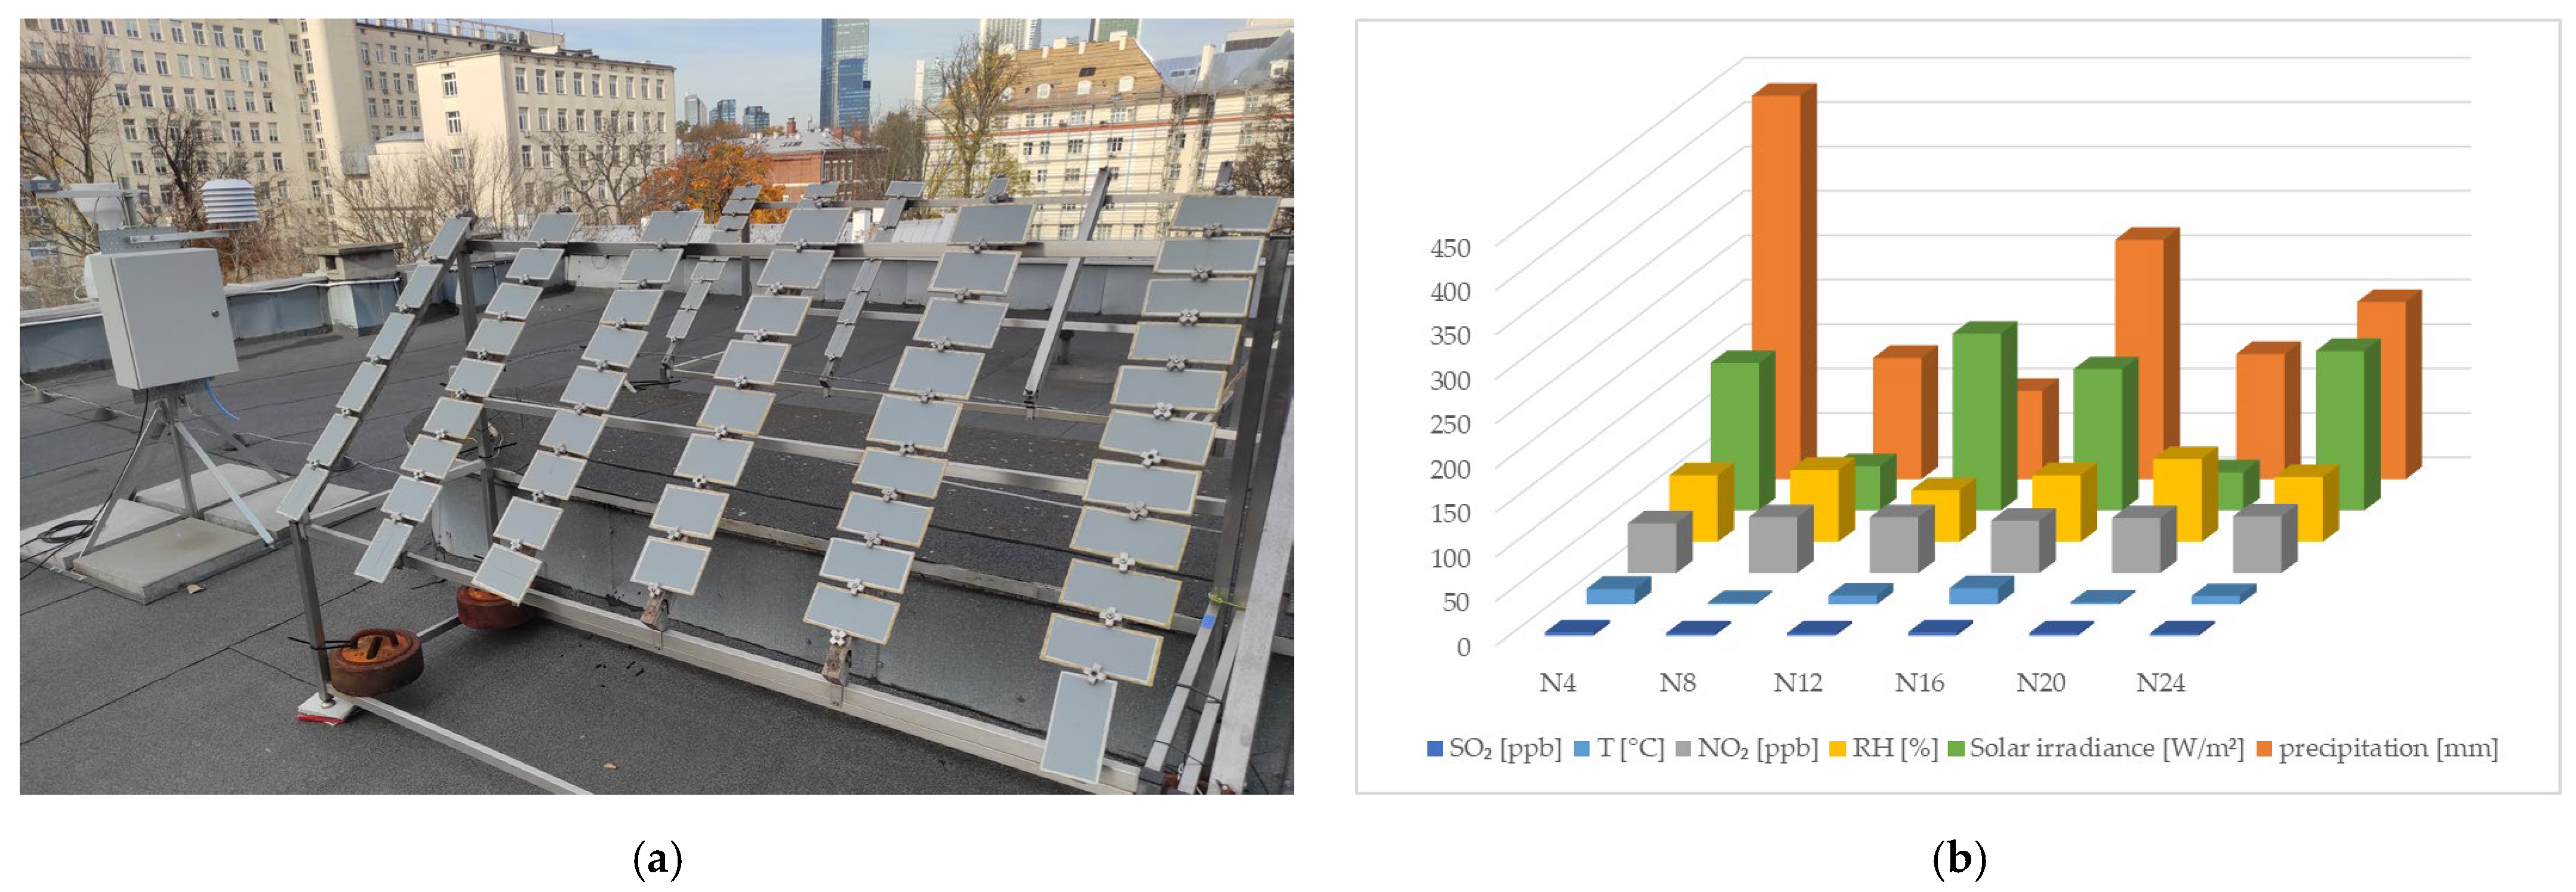
2.2. Exposure to Natural Weathering
2.3. Exposure to Artificial Weathering
2.4. Macroscopic Evaluation
2.5. Thickness
2.6. Microstructure Analysis
2.7. Thermal Properties
2.8. Fourier-Transform Infrared Spectroscopy
2.9. Performance
3. Results and Discussion
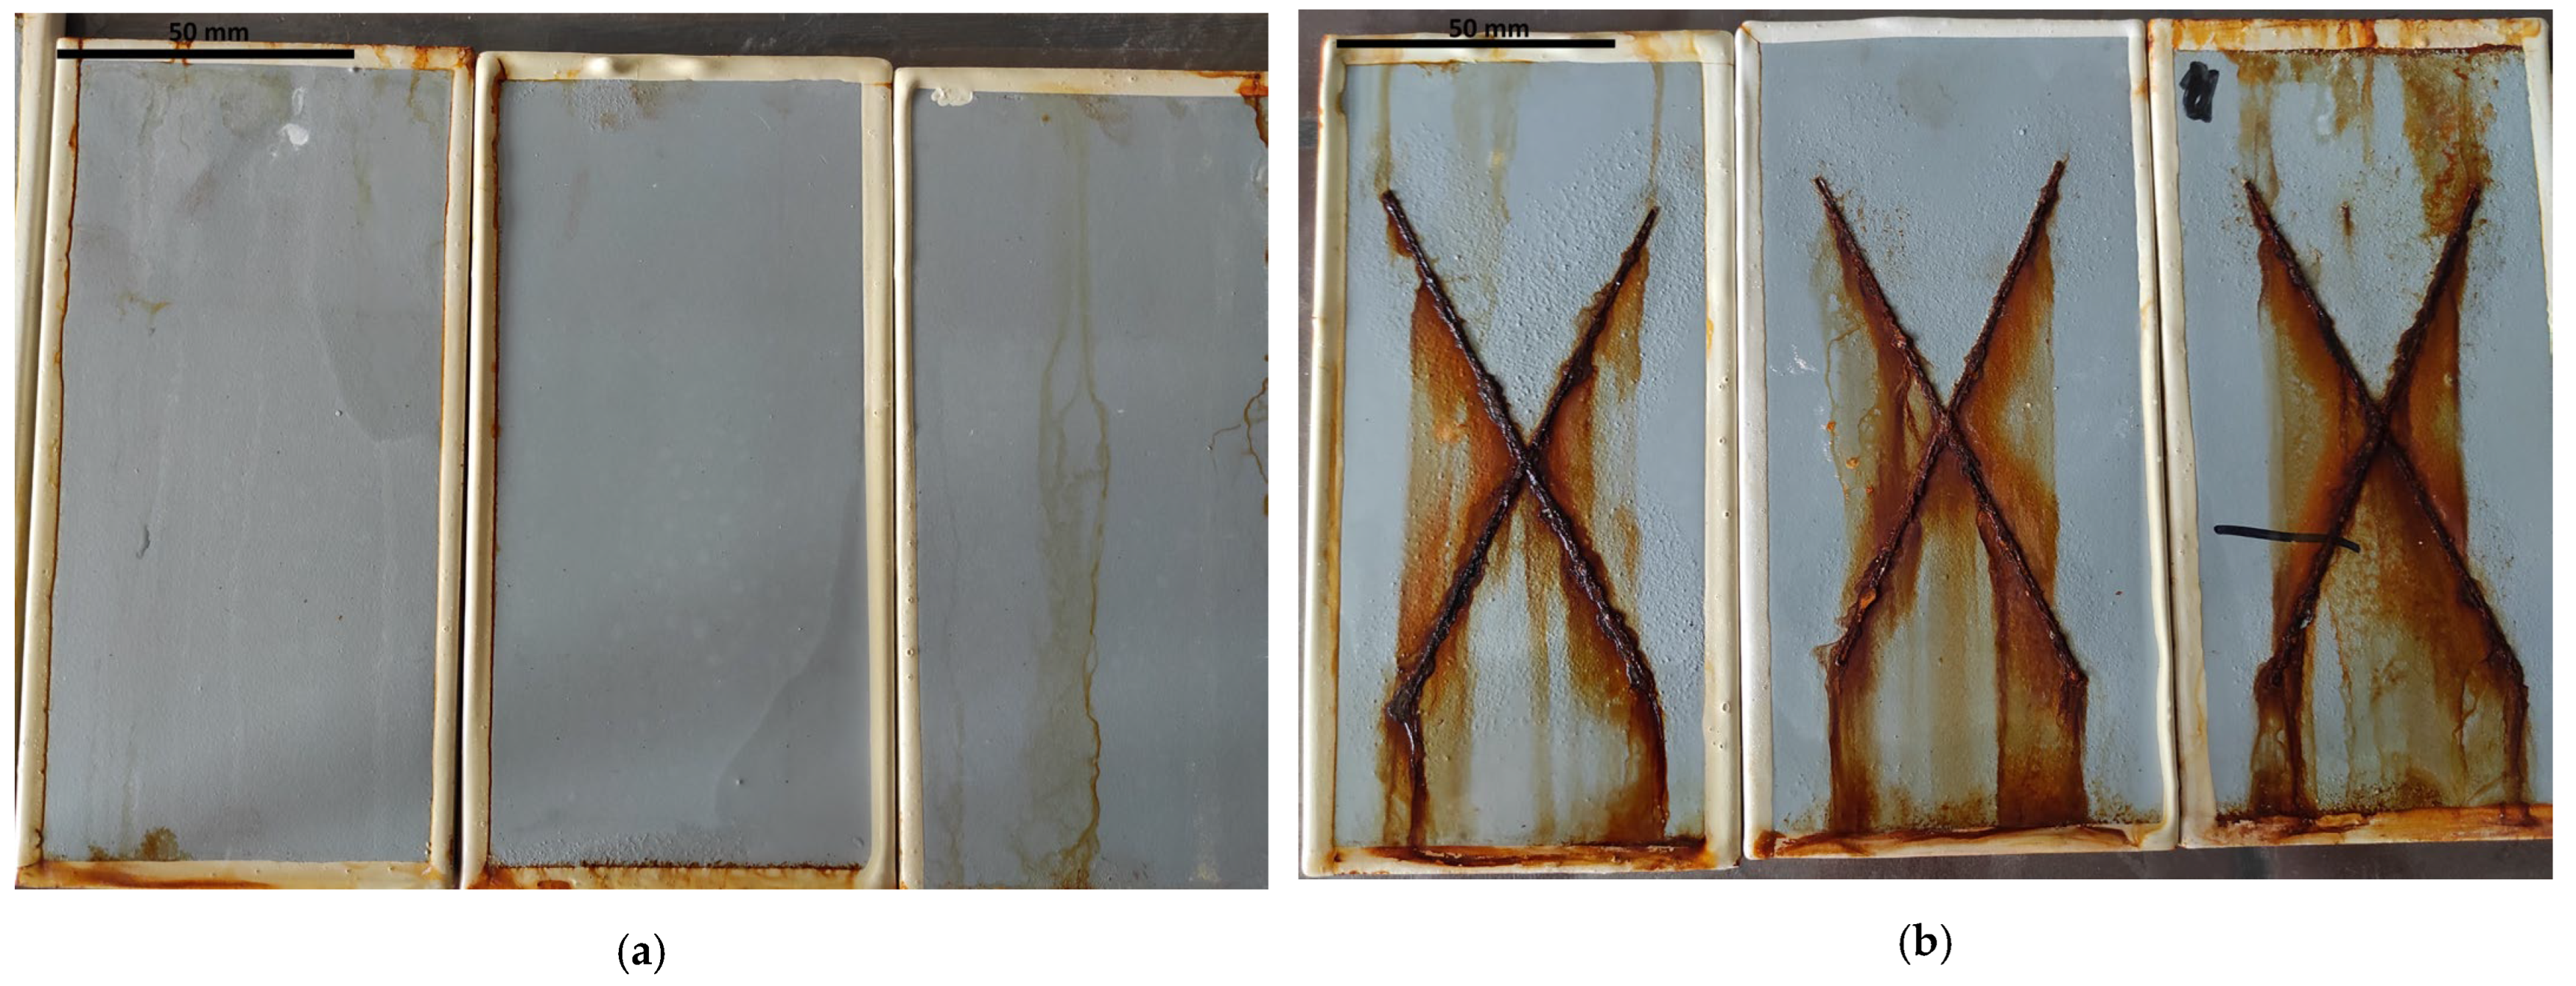
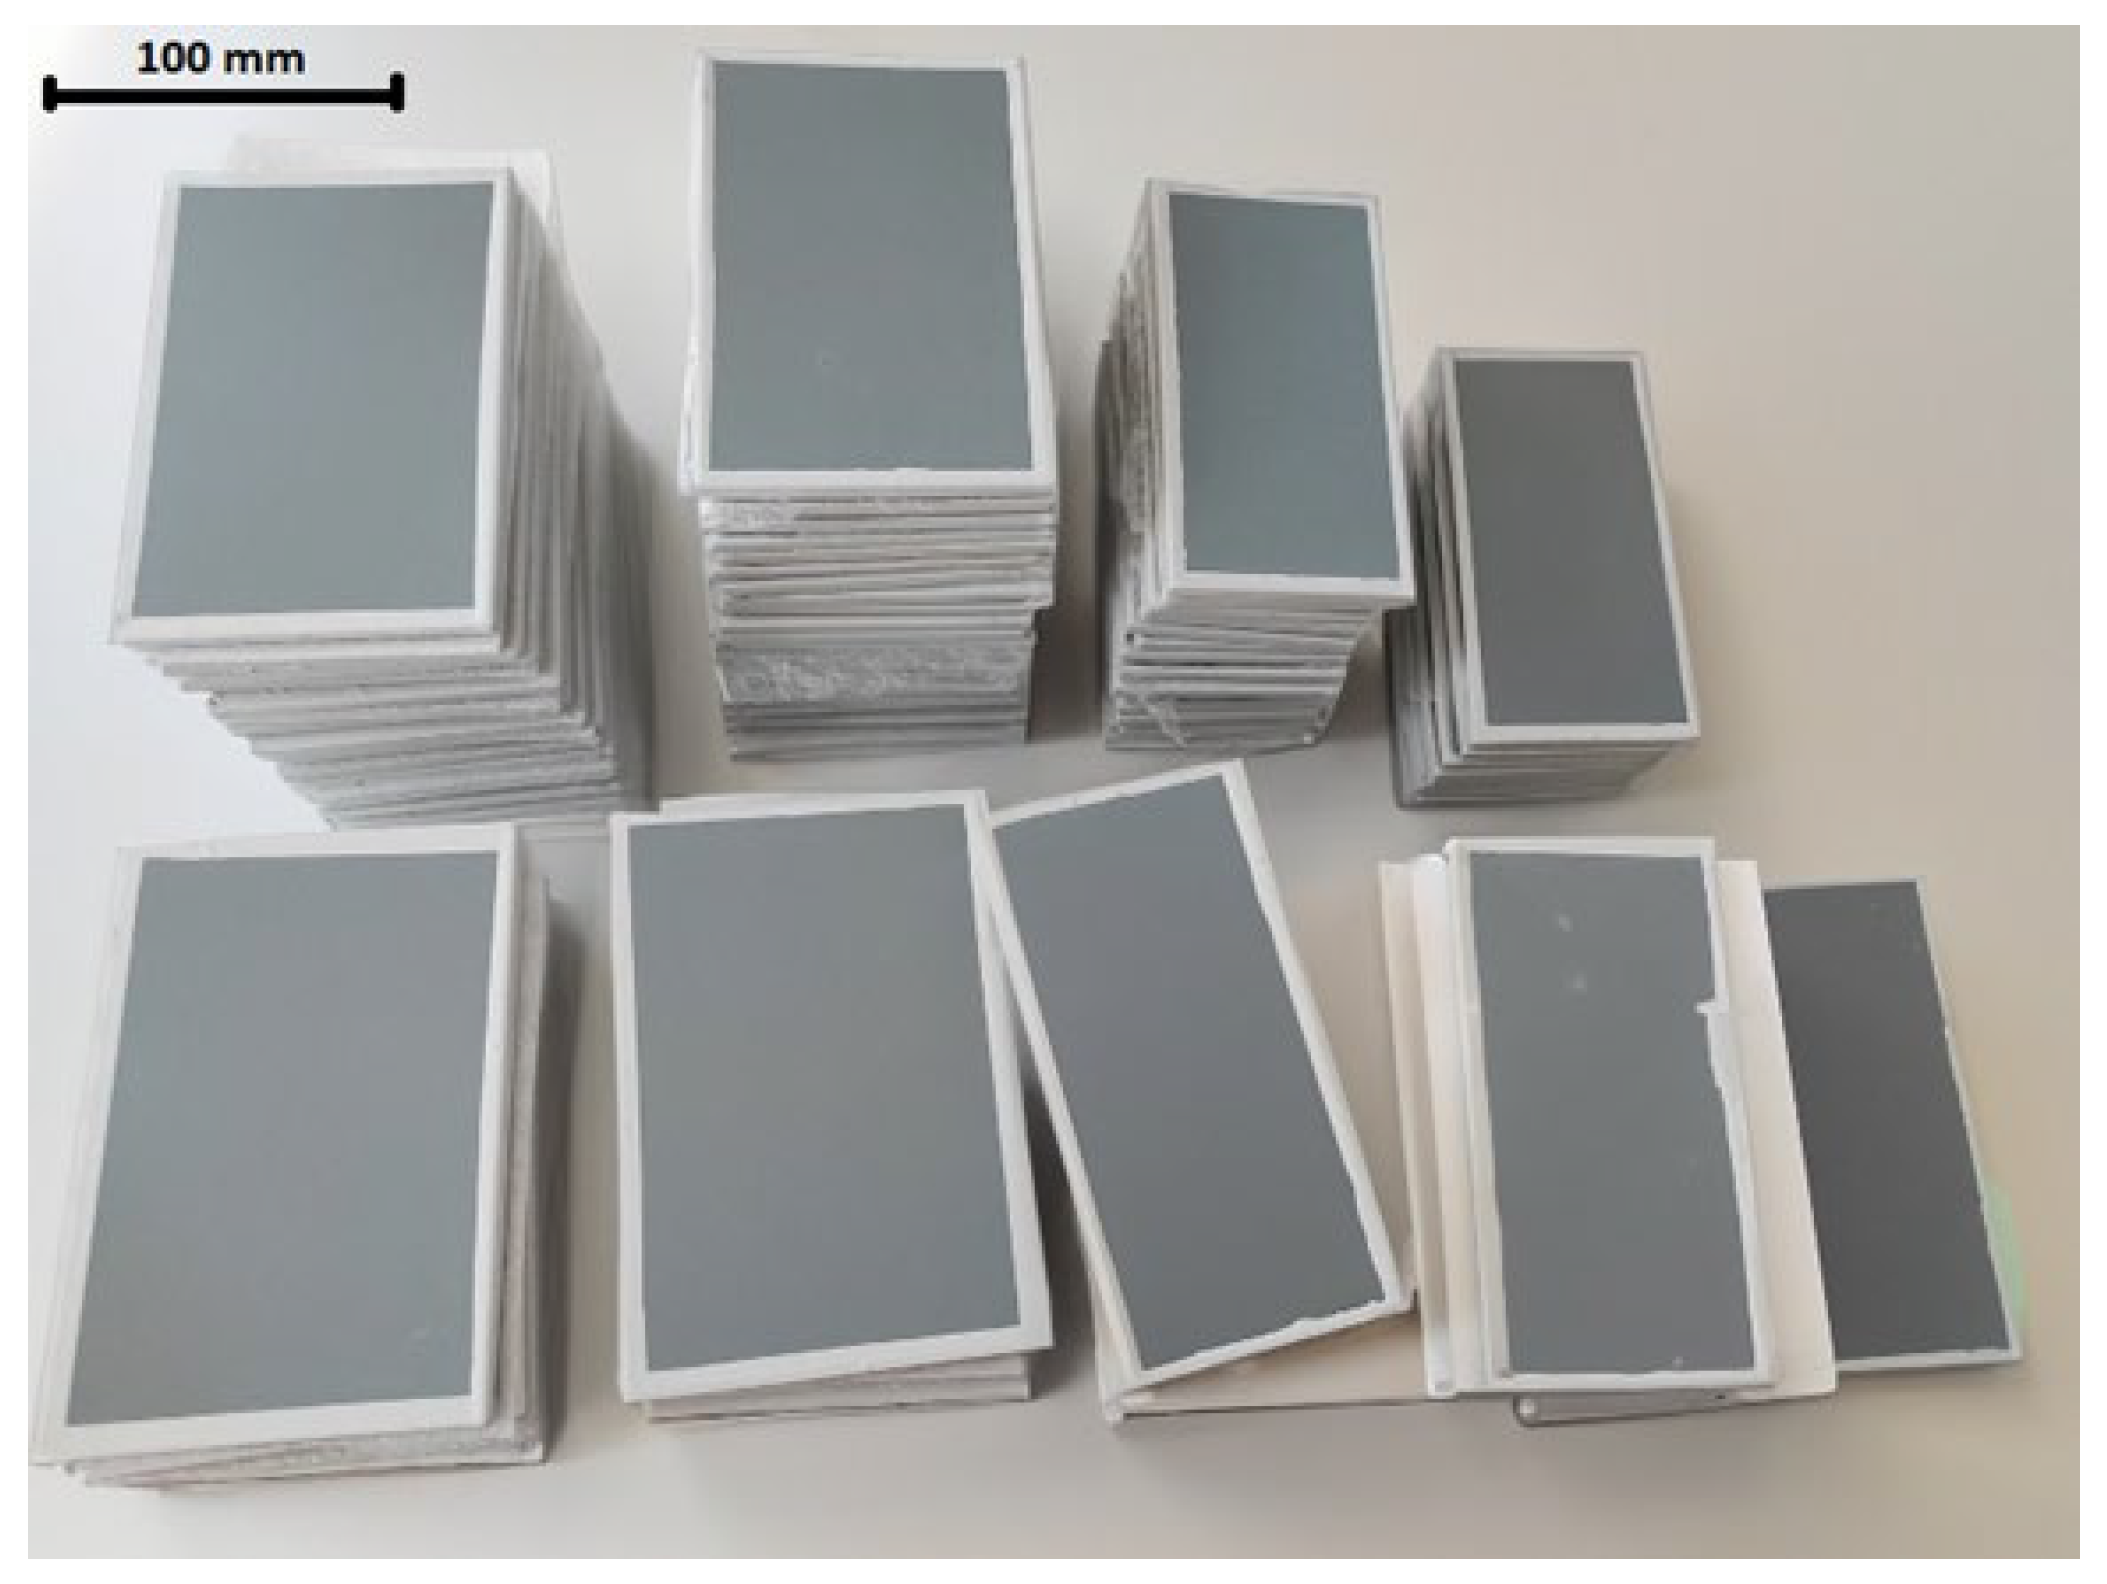
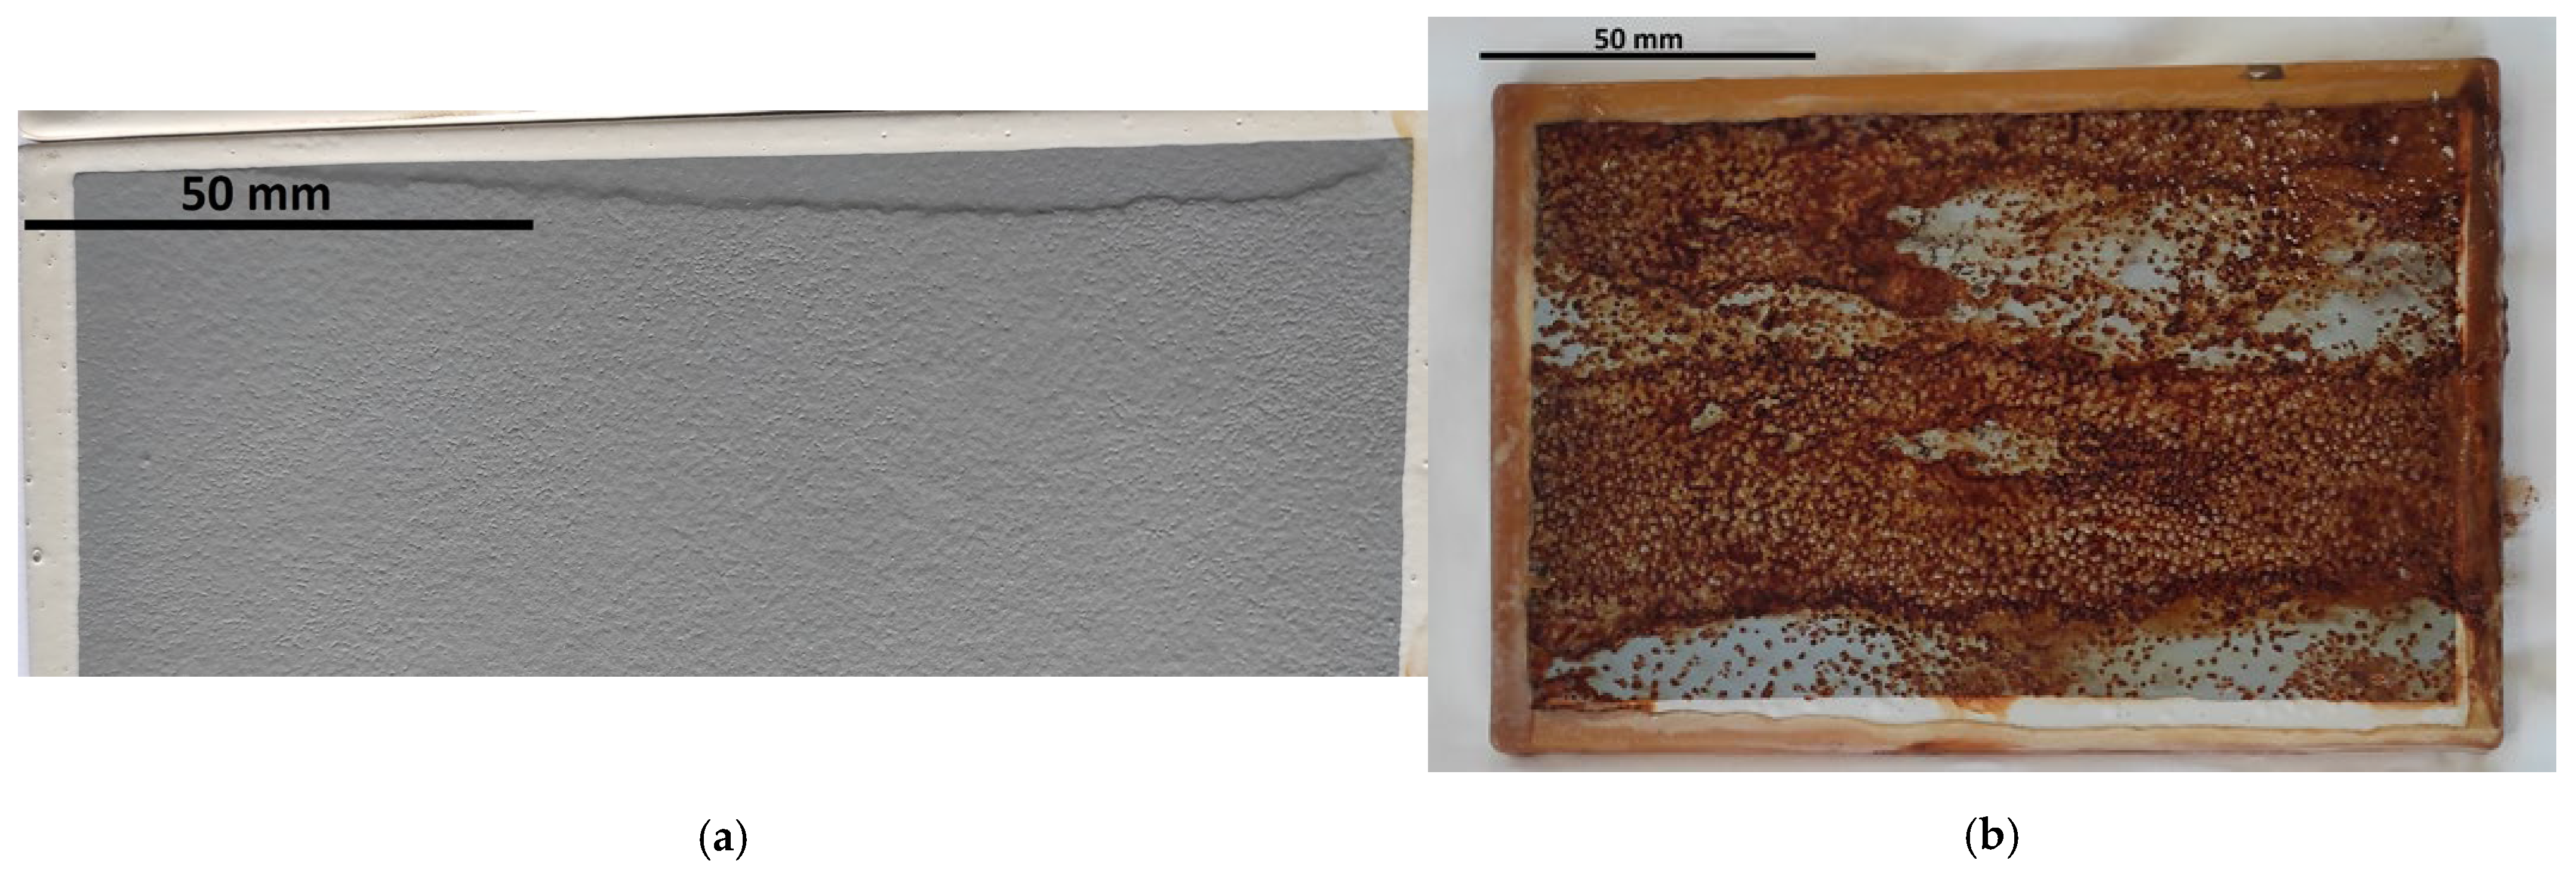
3.1. Macroscopic Evaluation
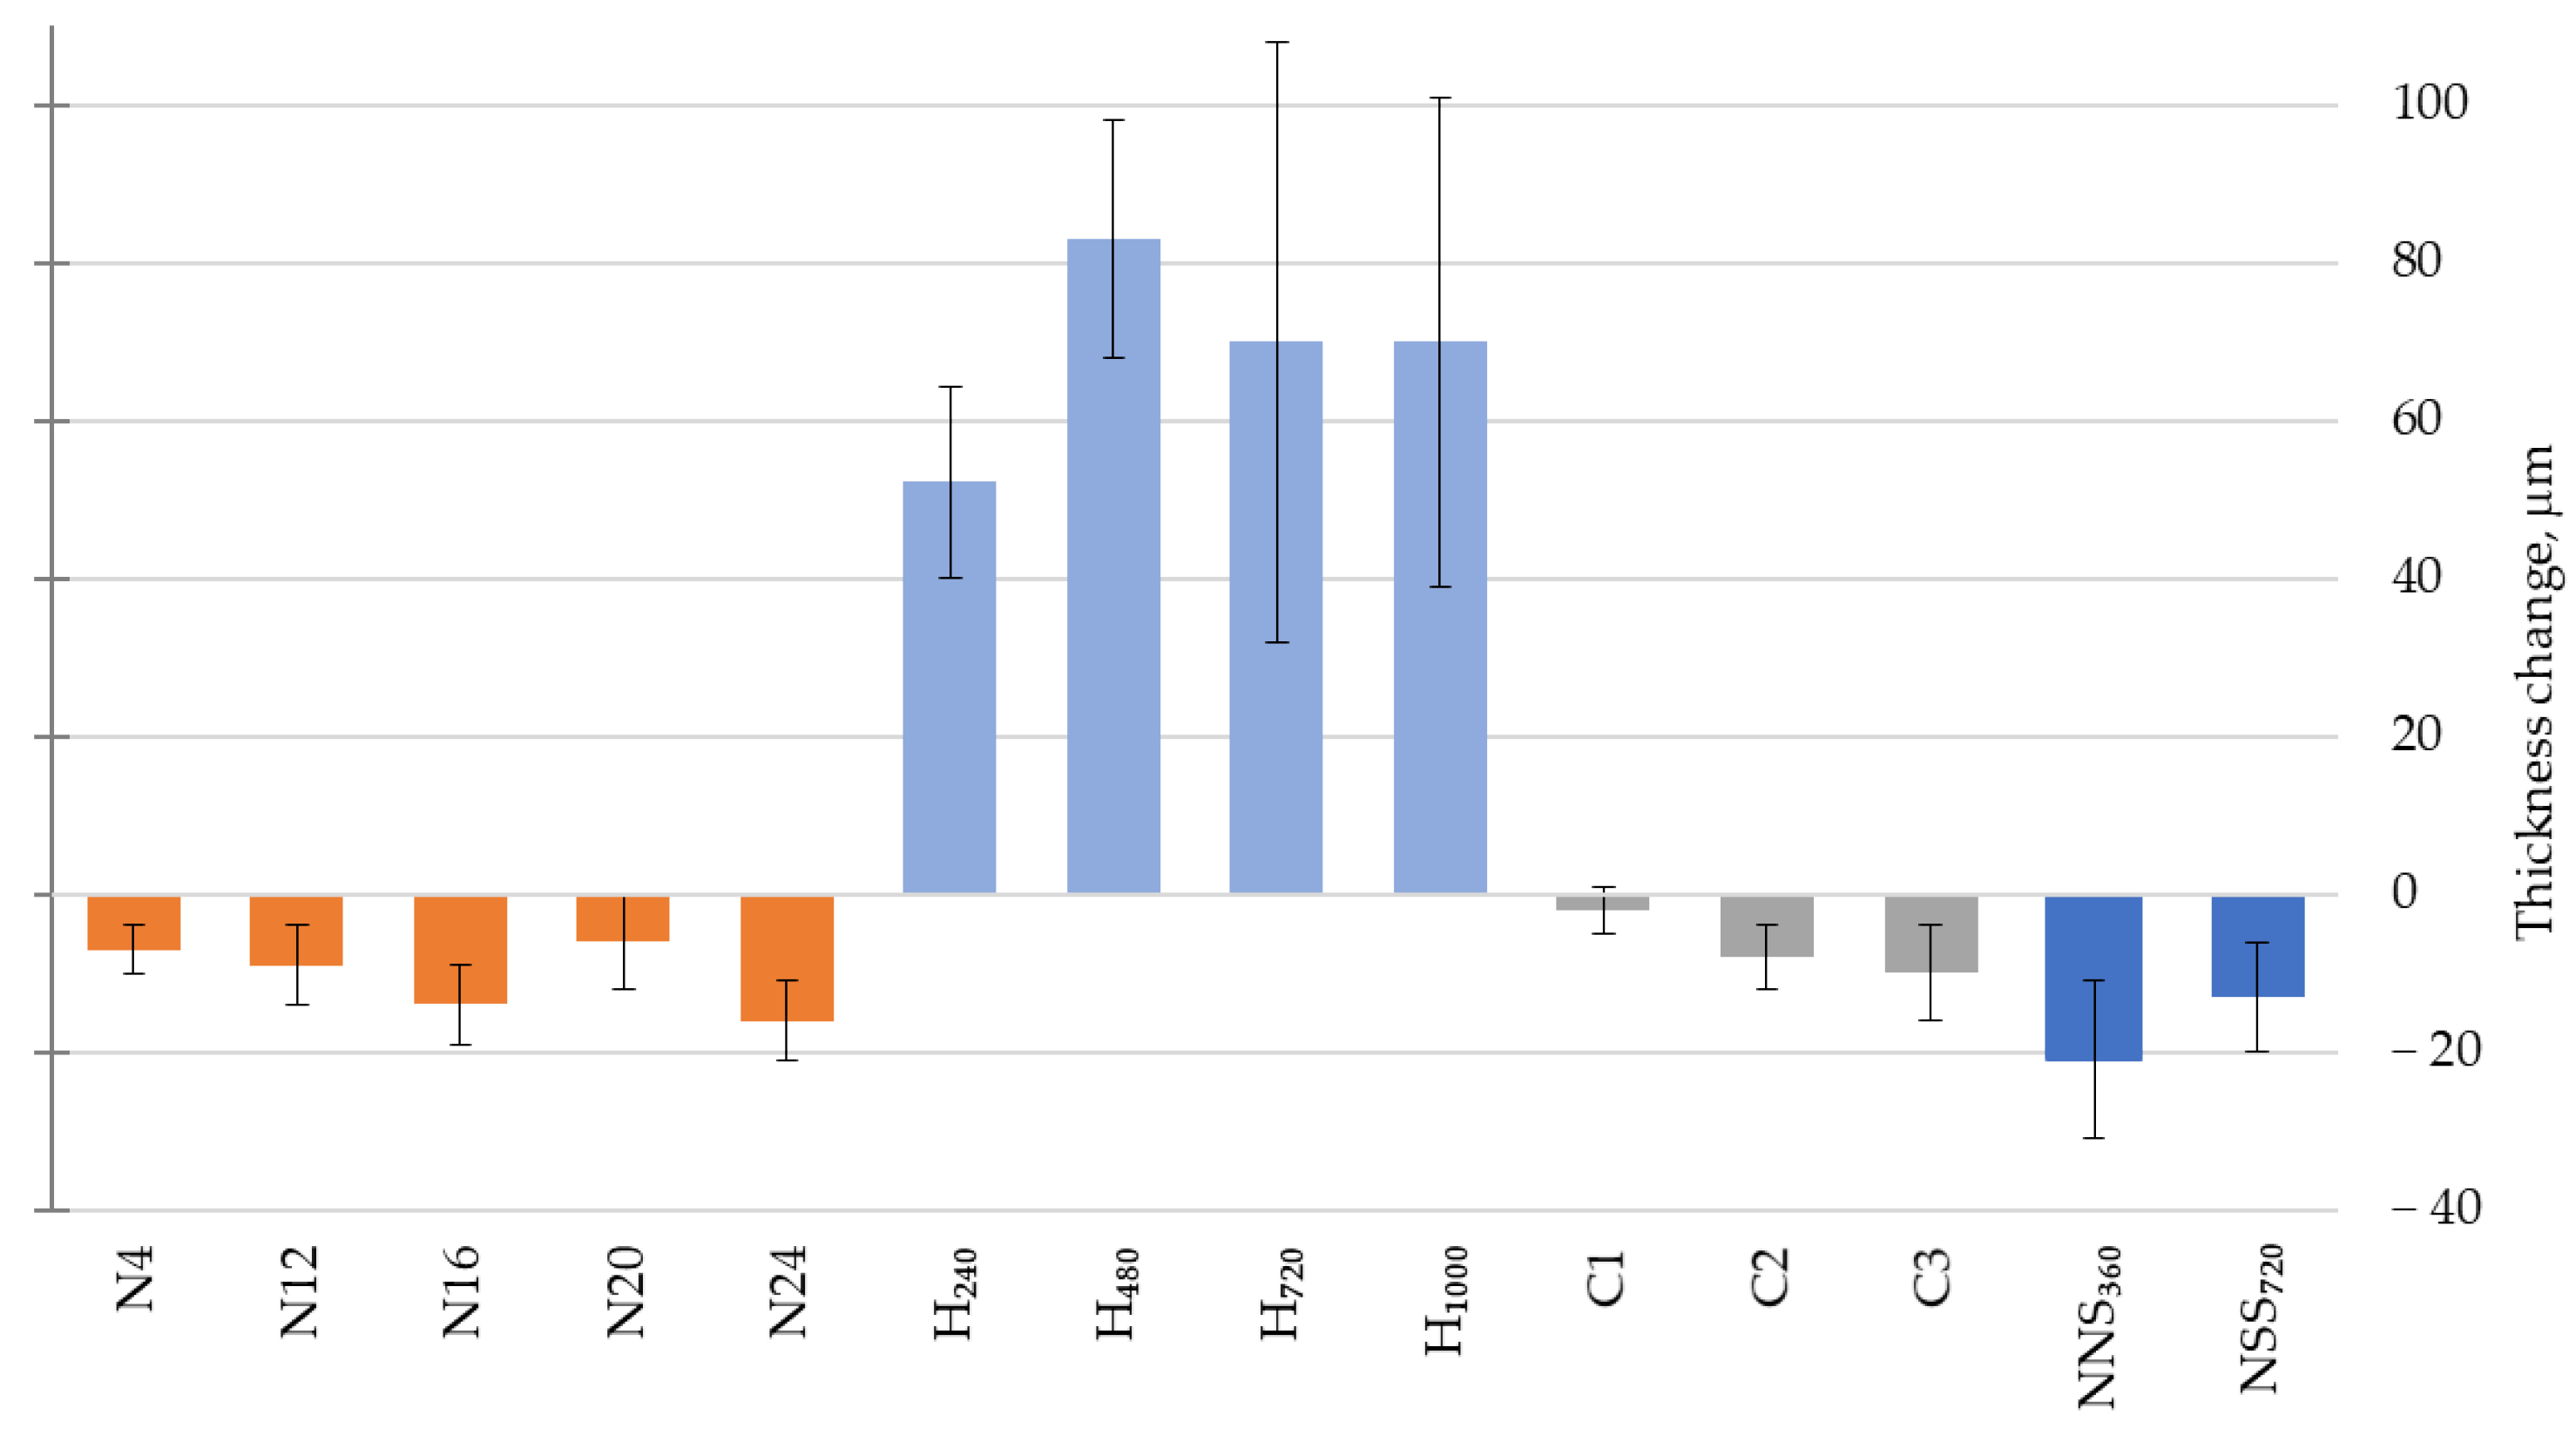
3.2. Thickness
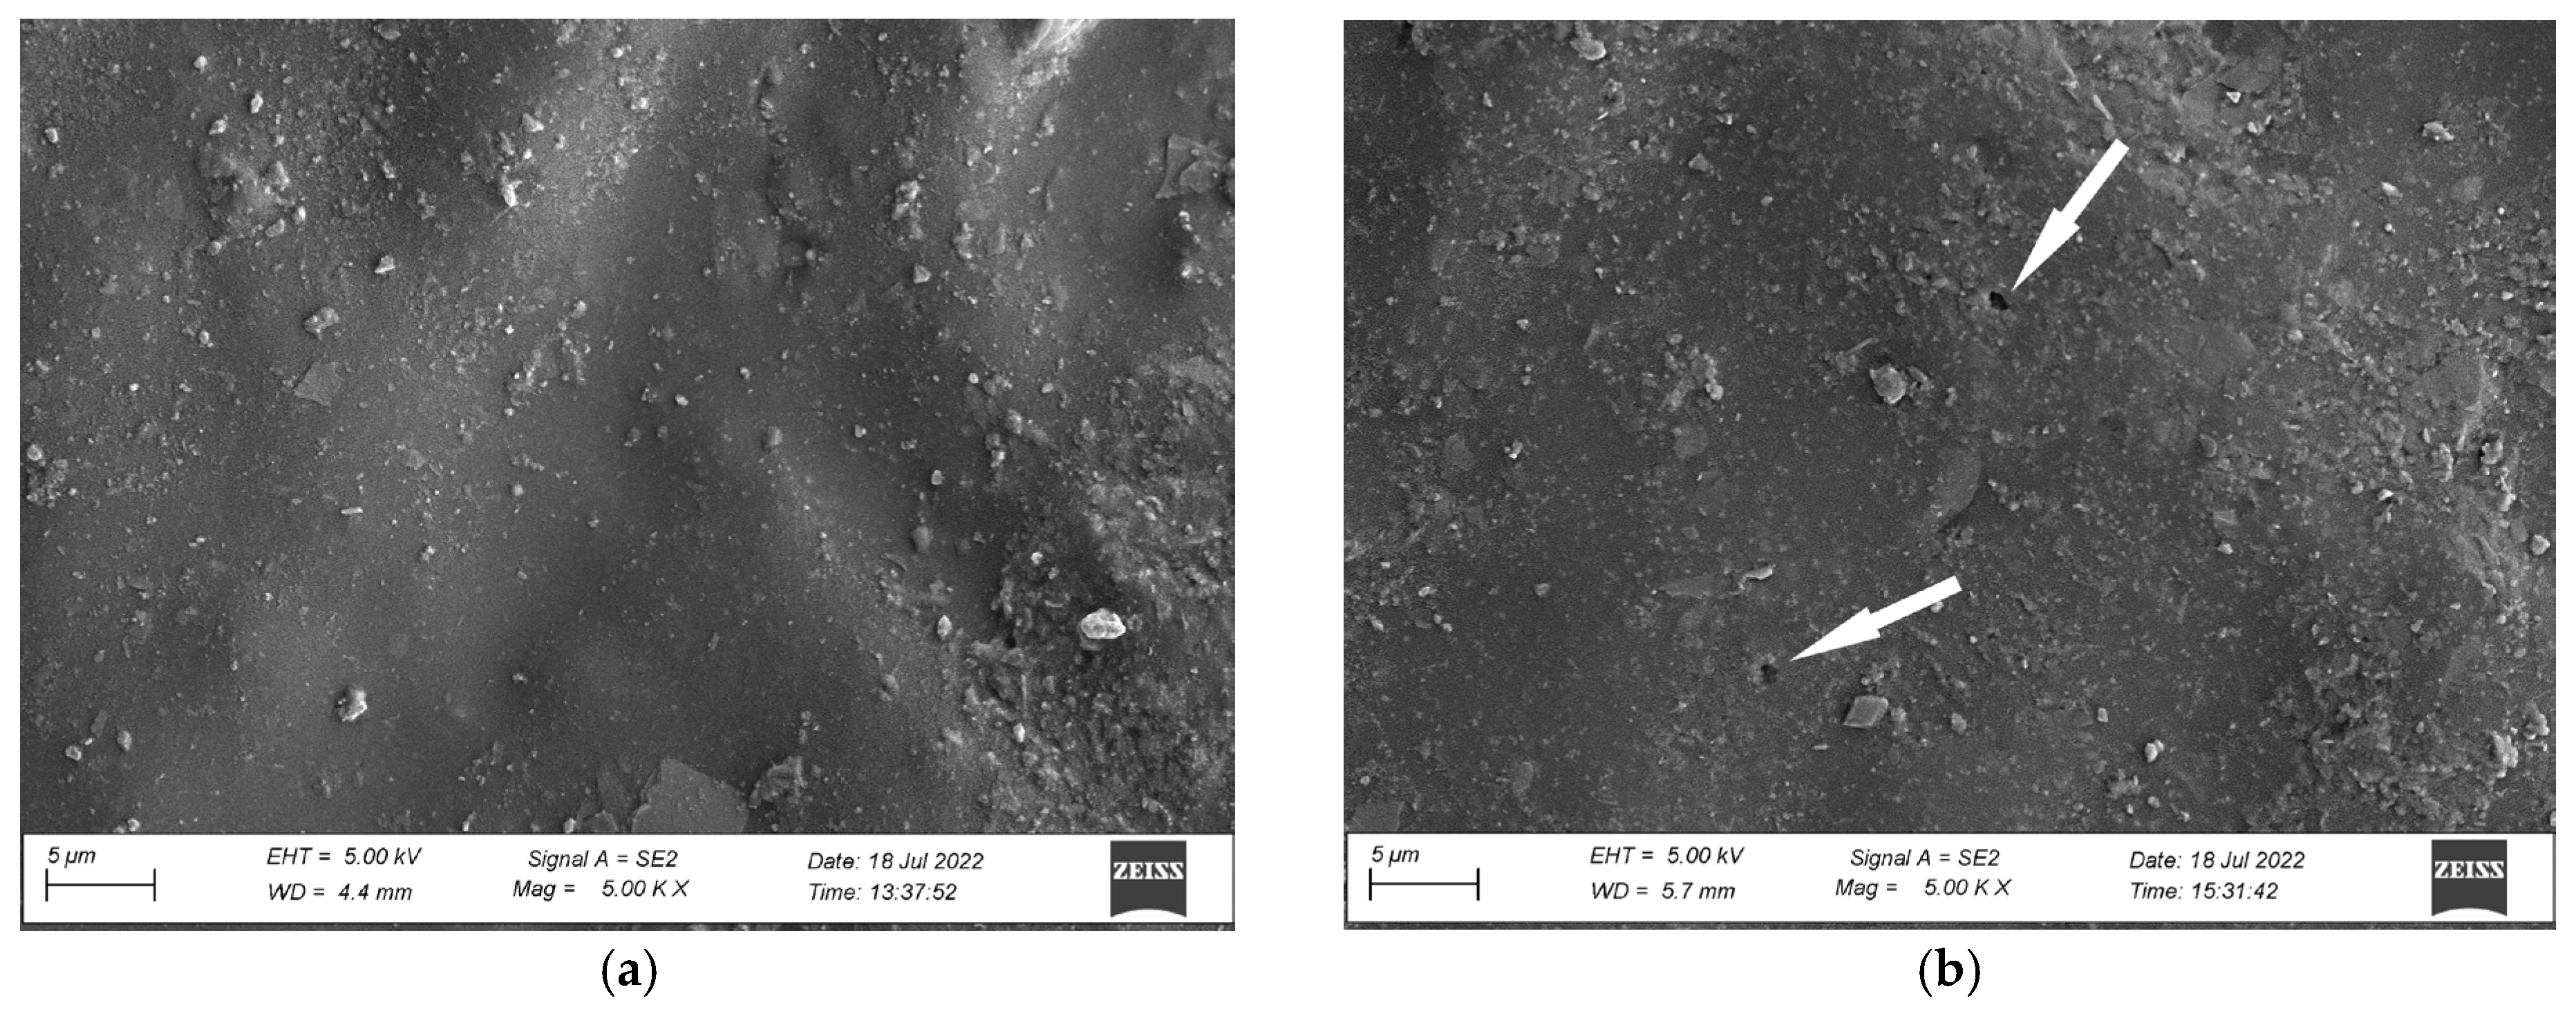
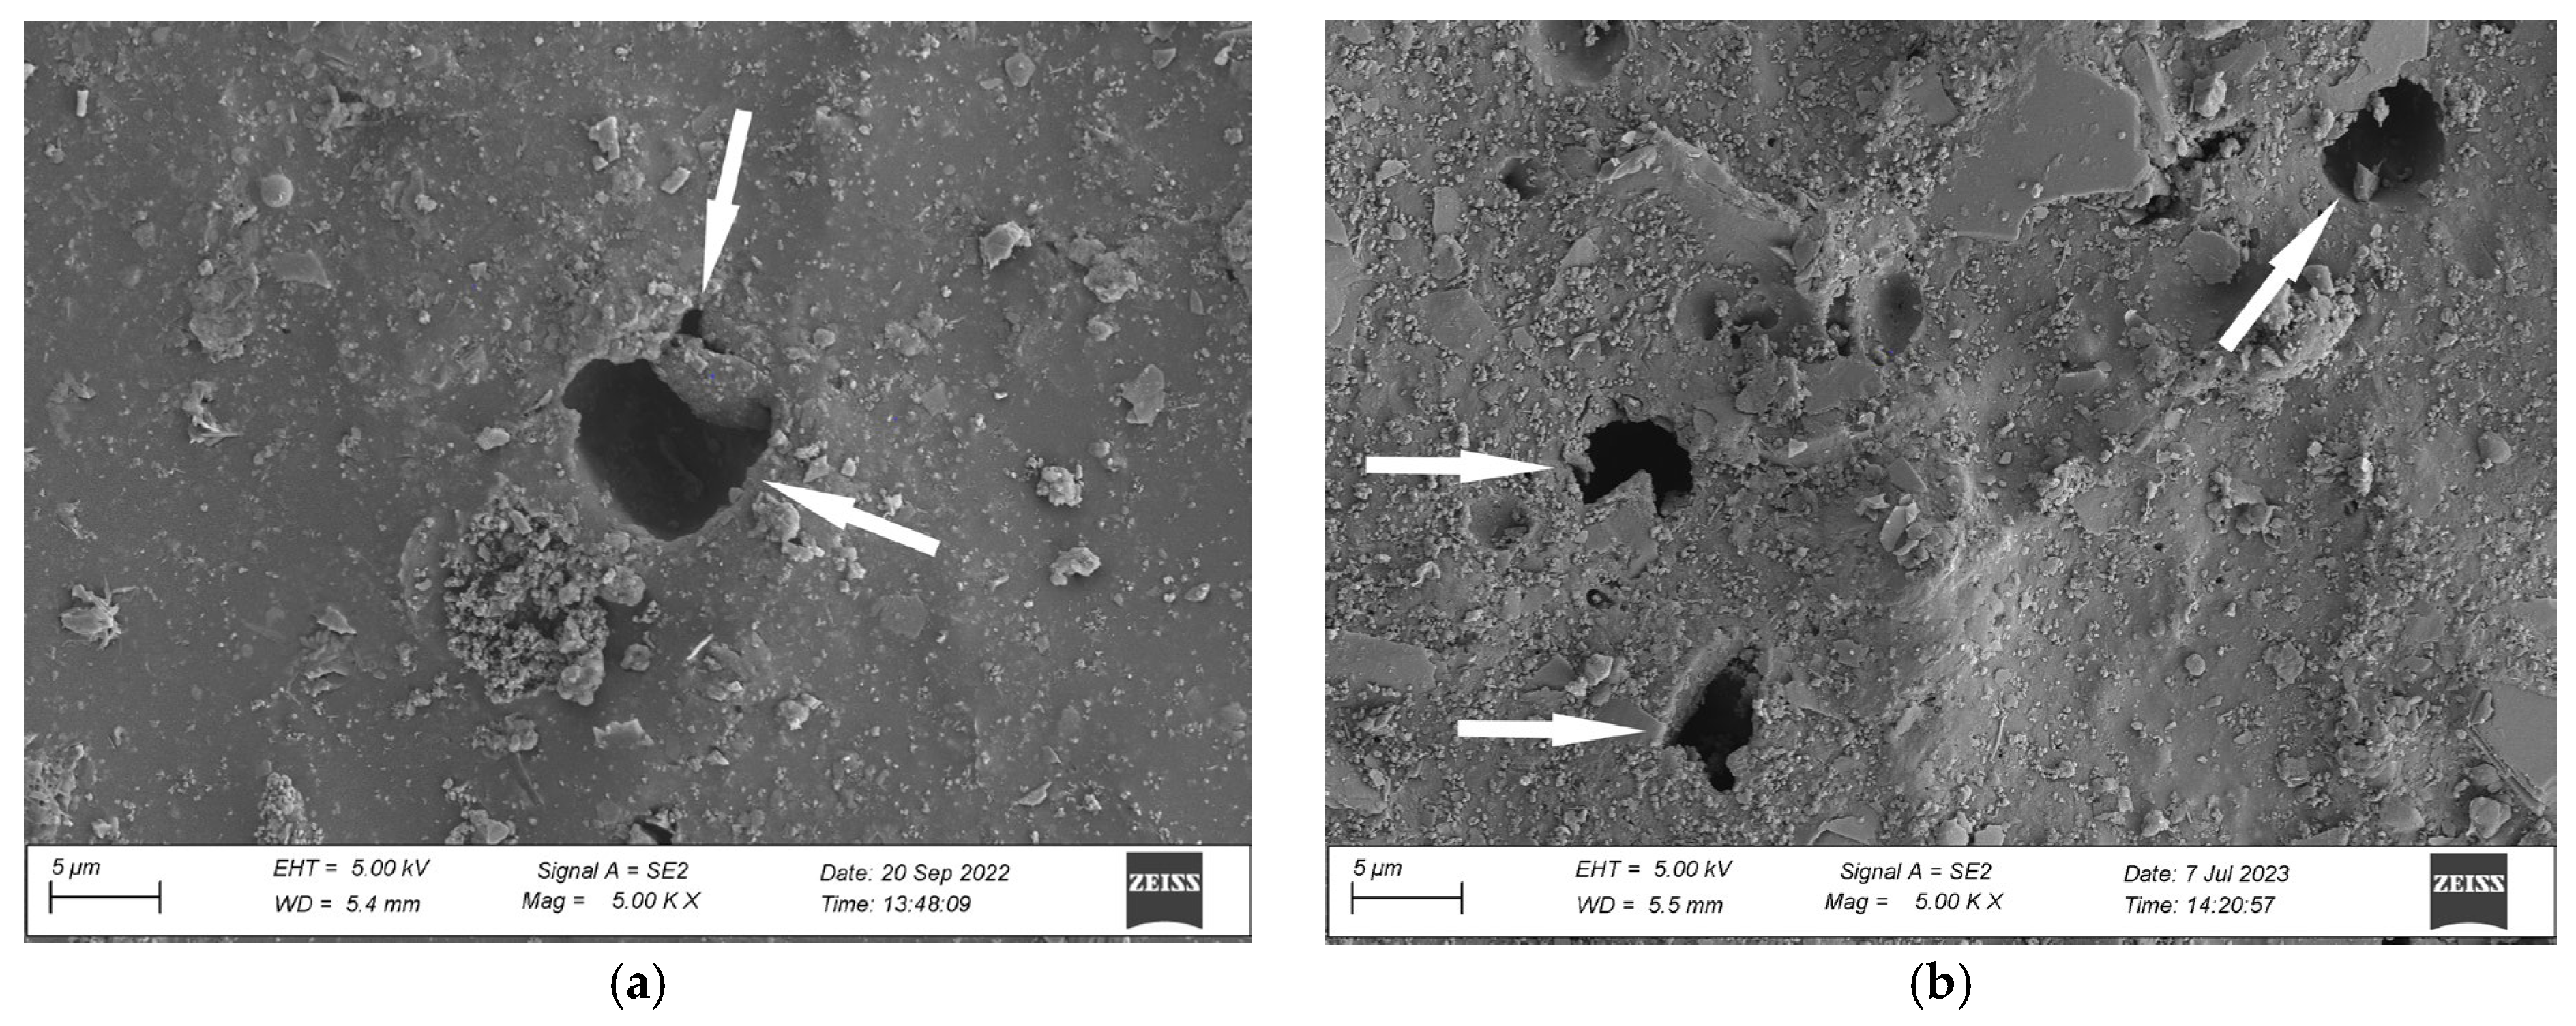
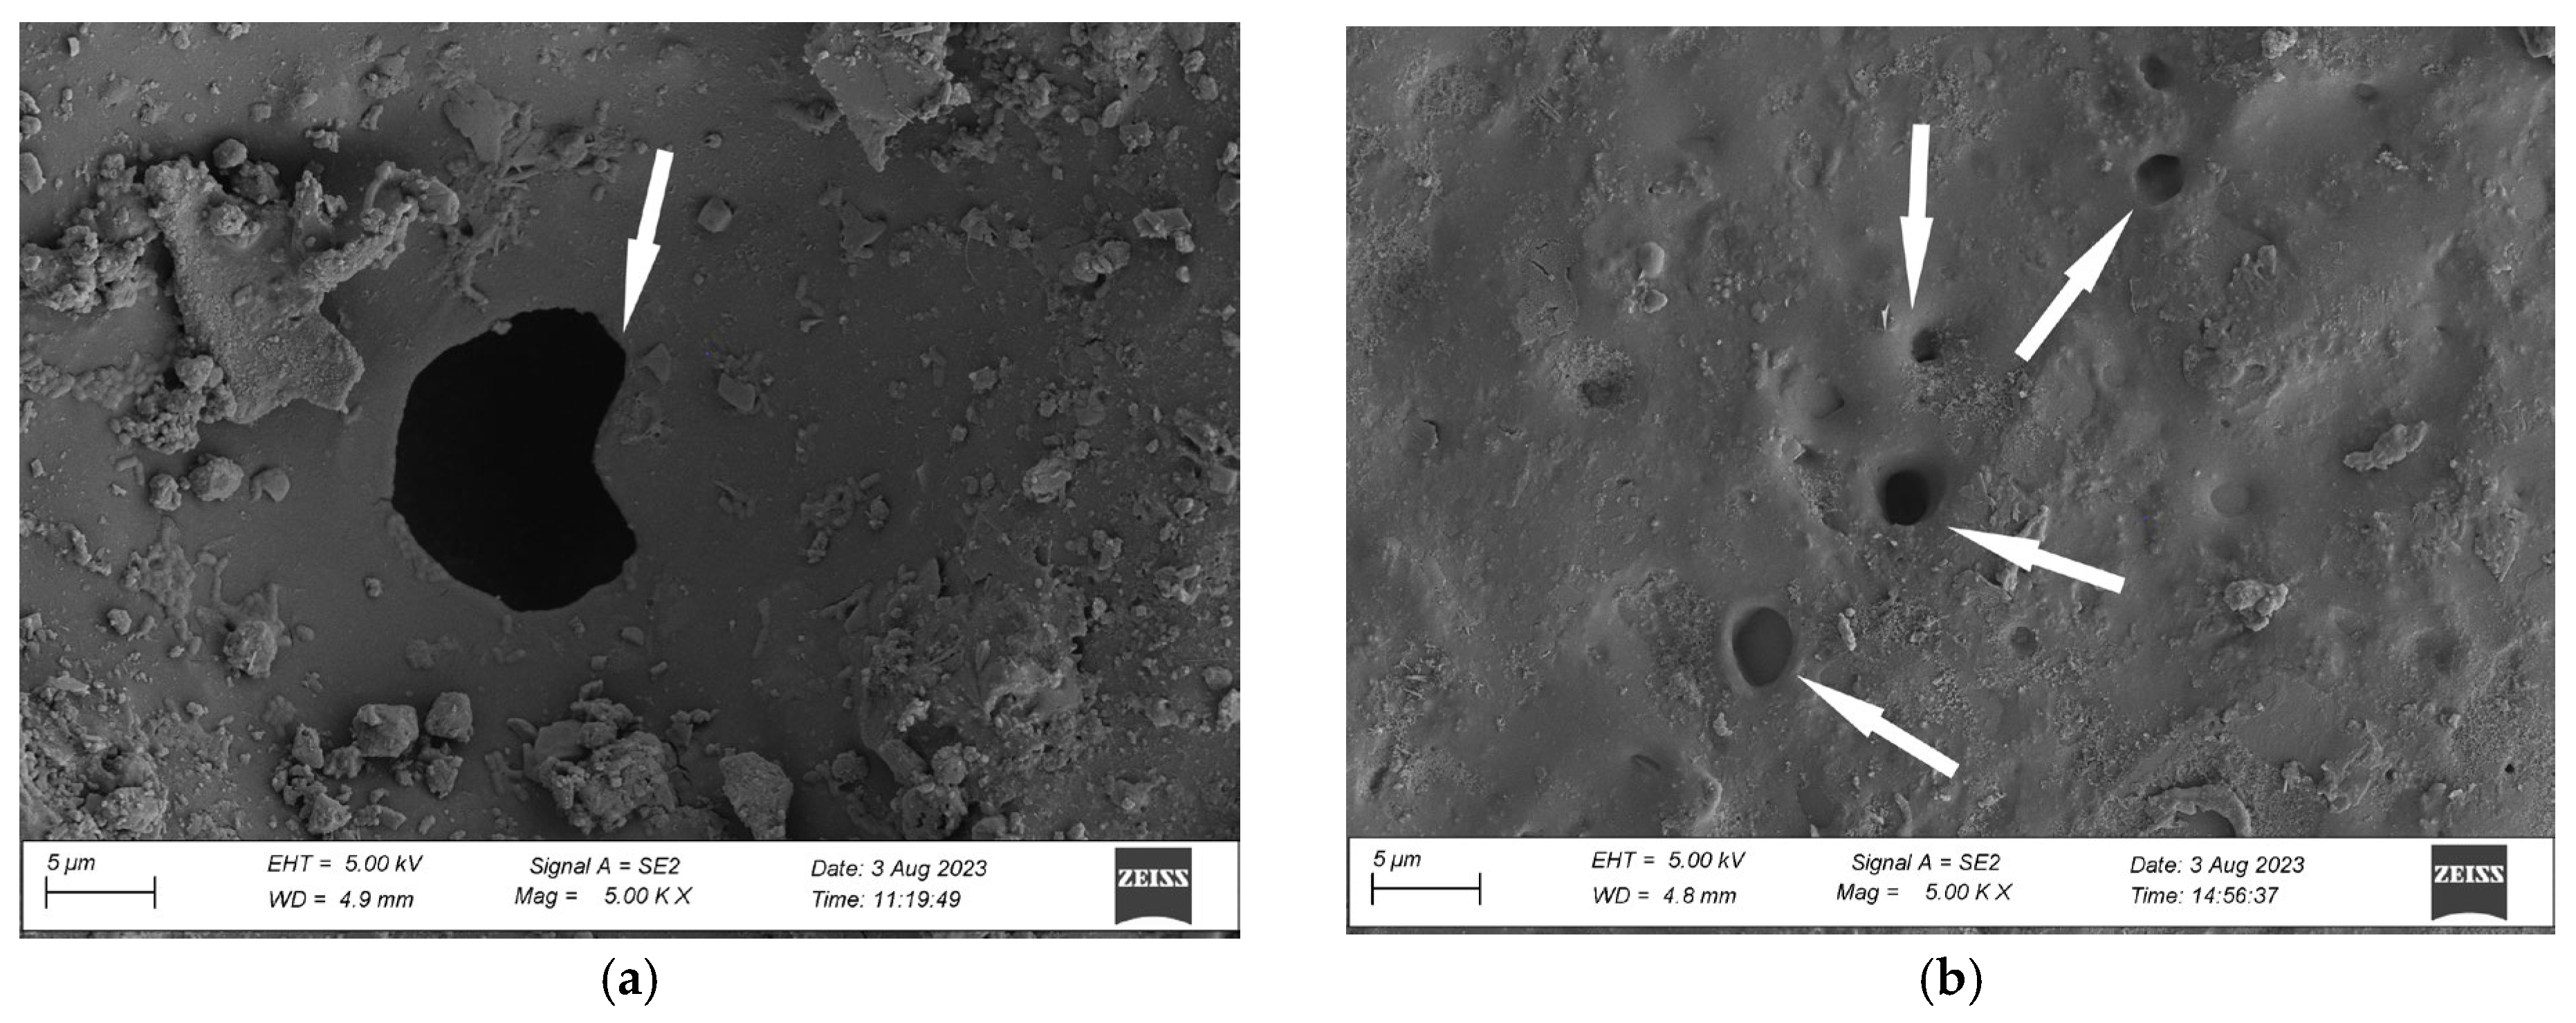
3.3. Microstructure Analysis
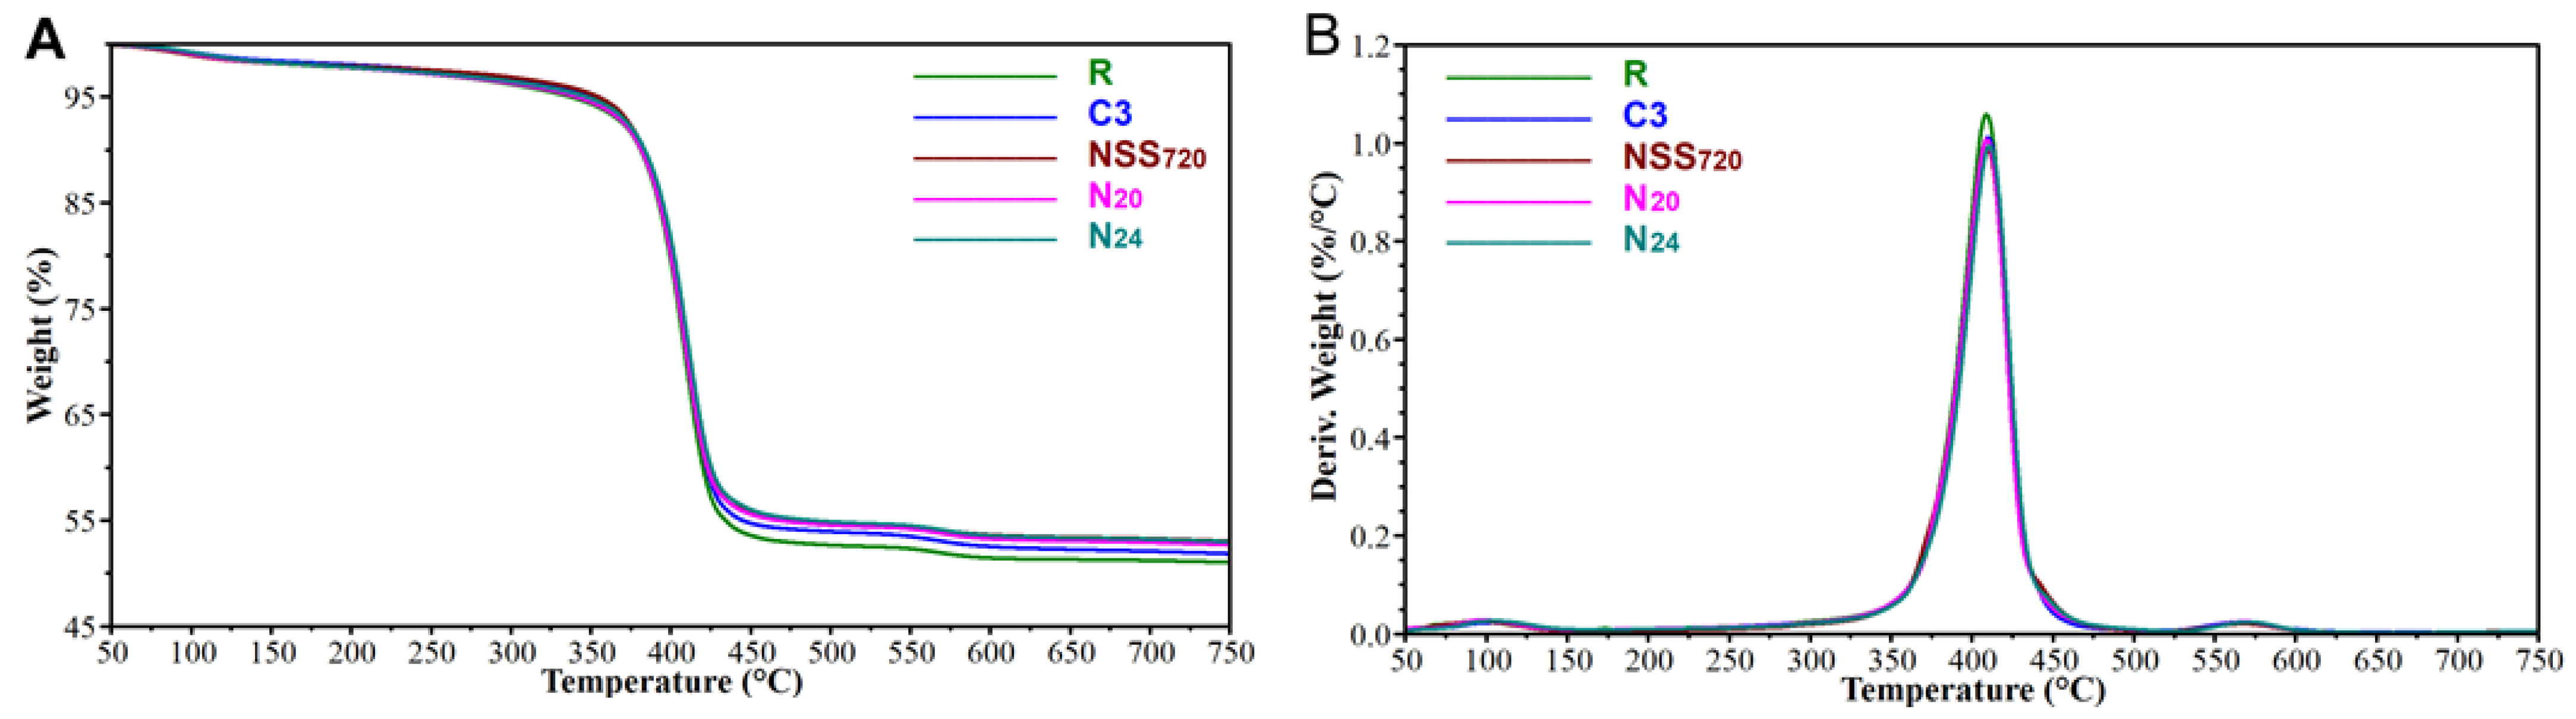
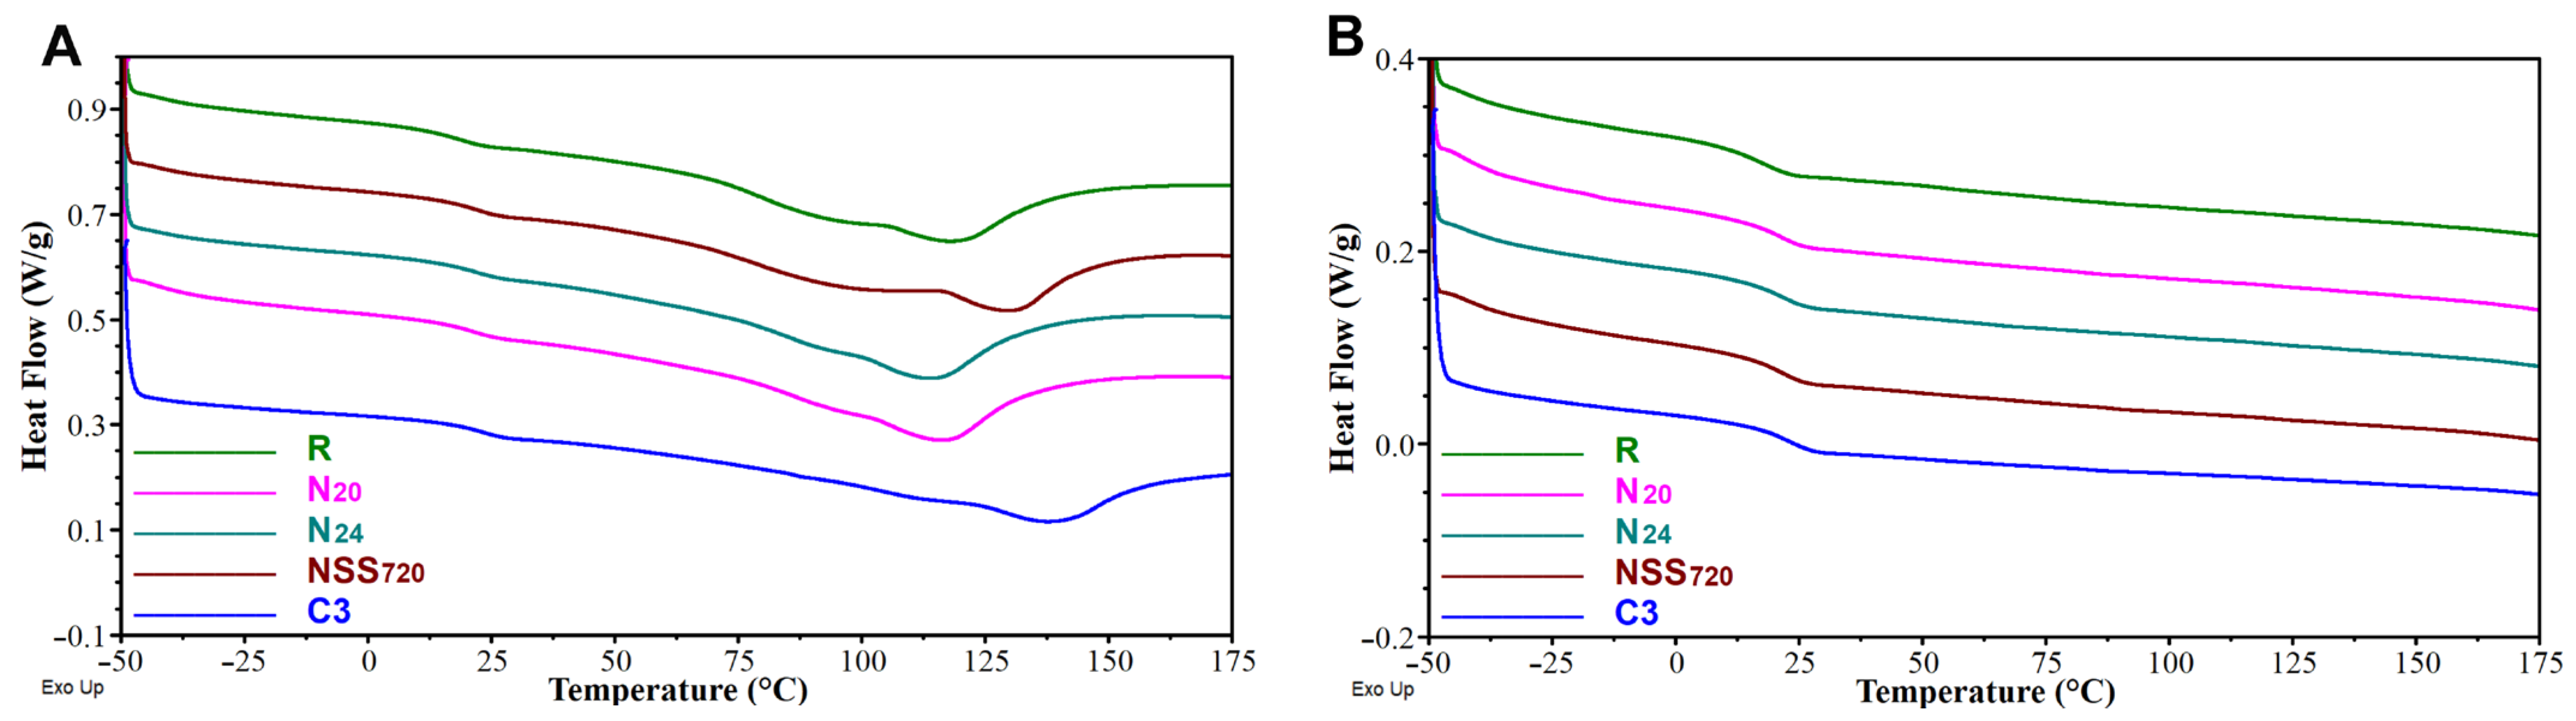
3.4. Thermal Characteristics
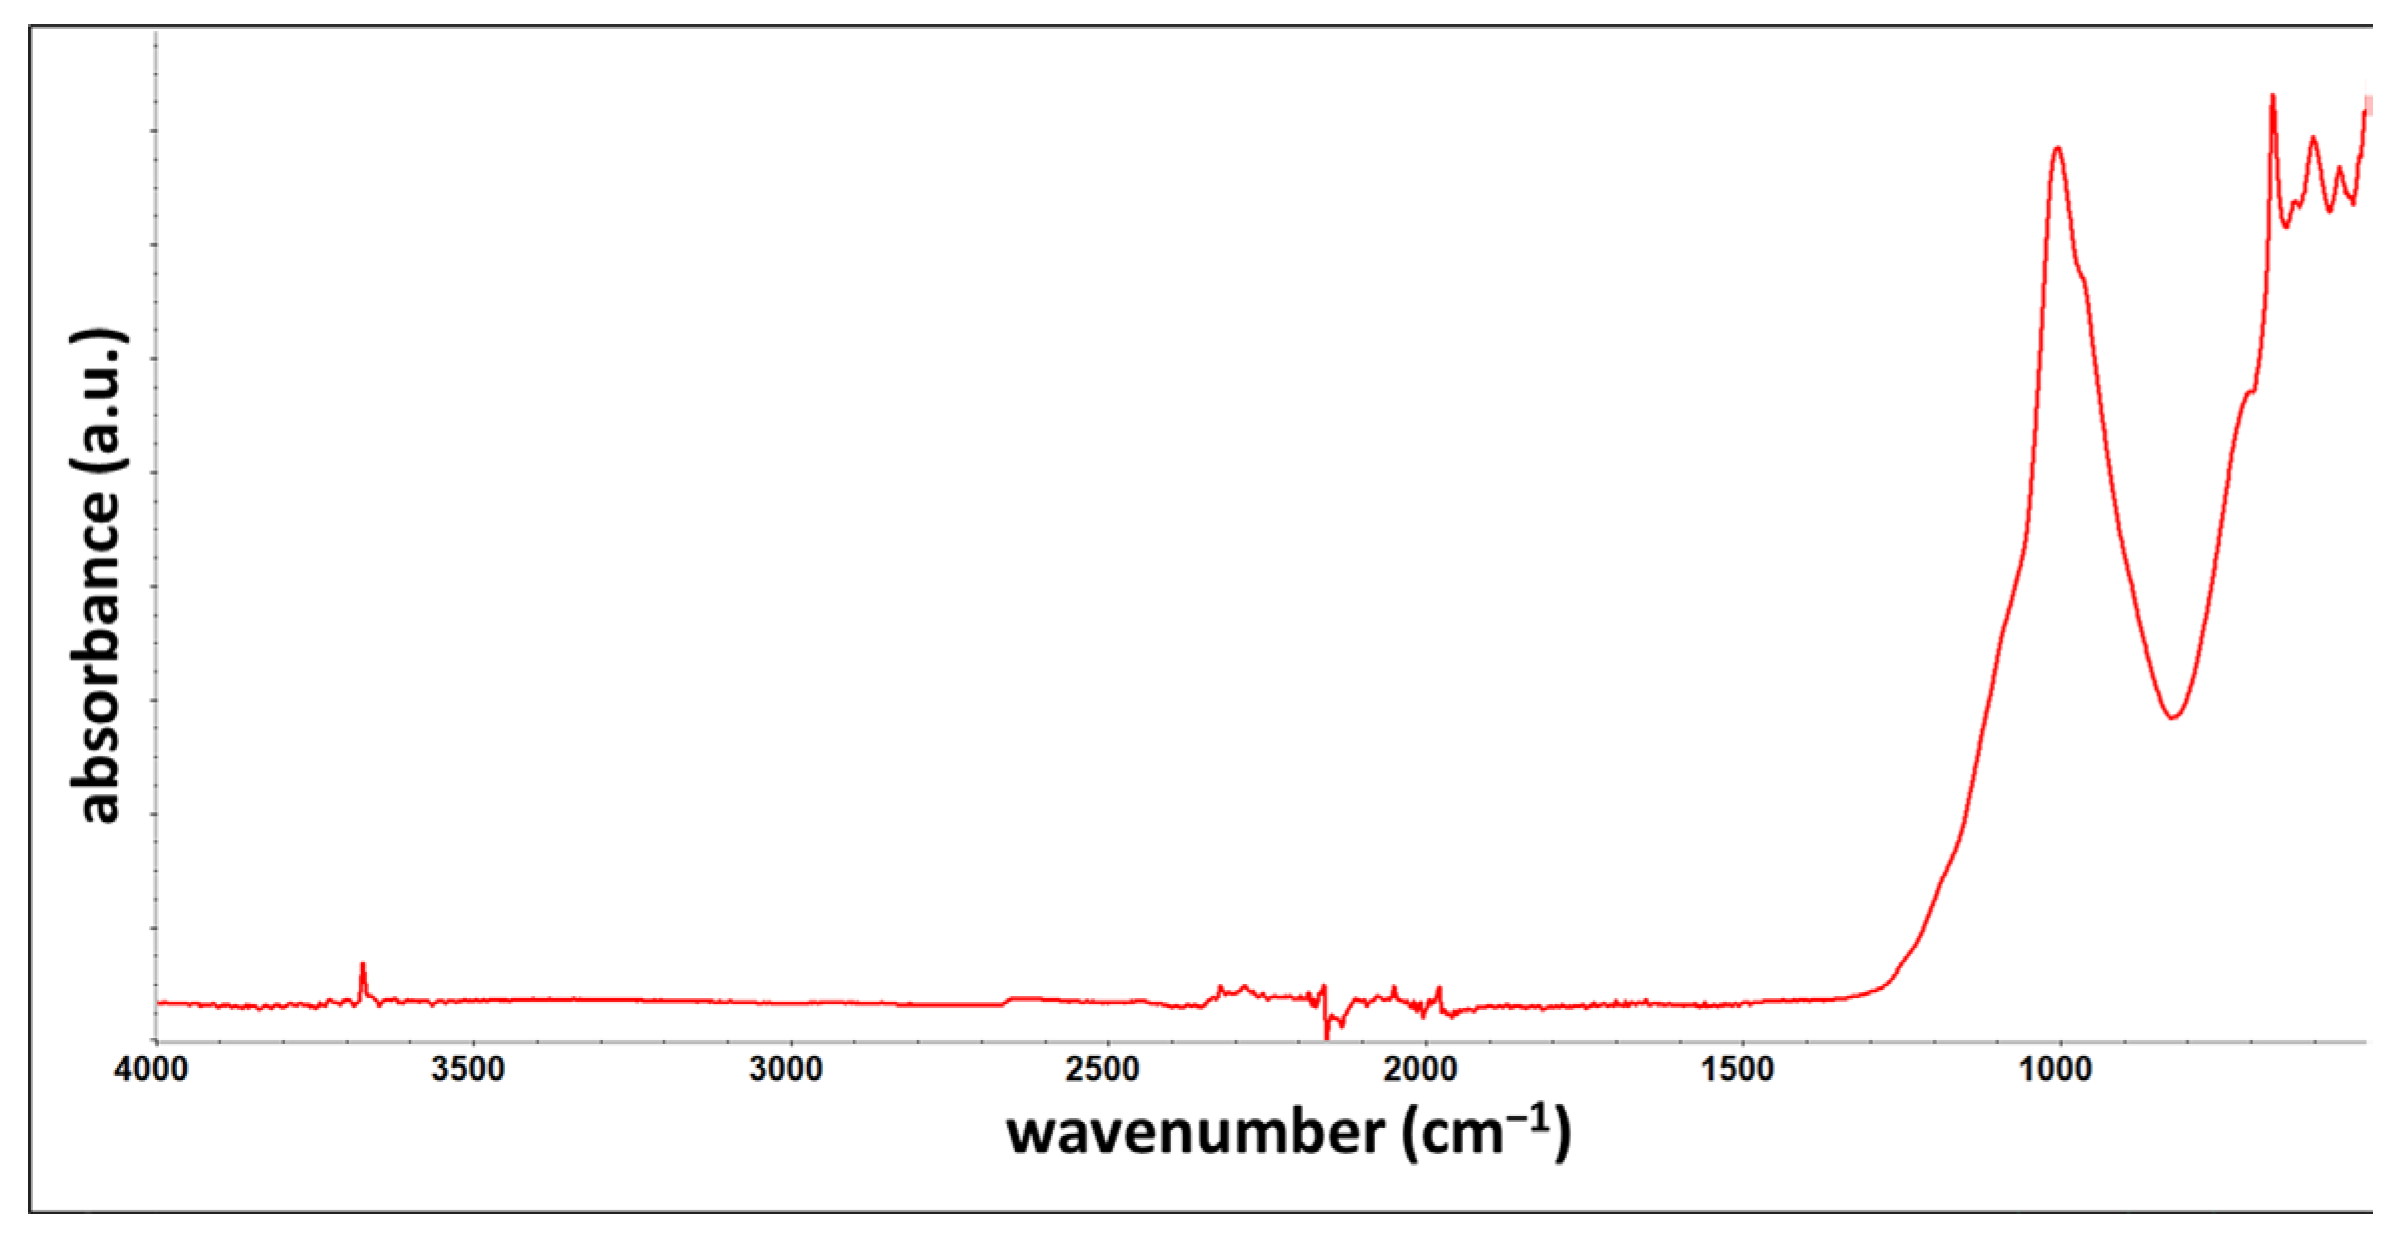
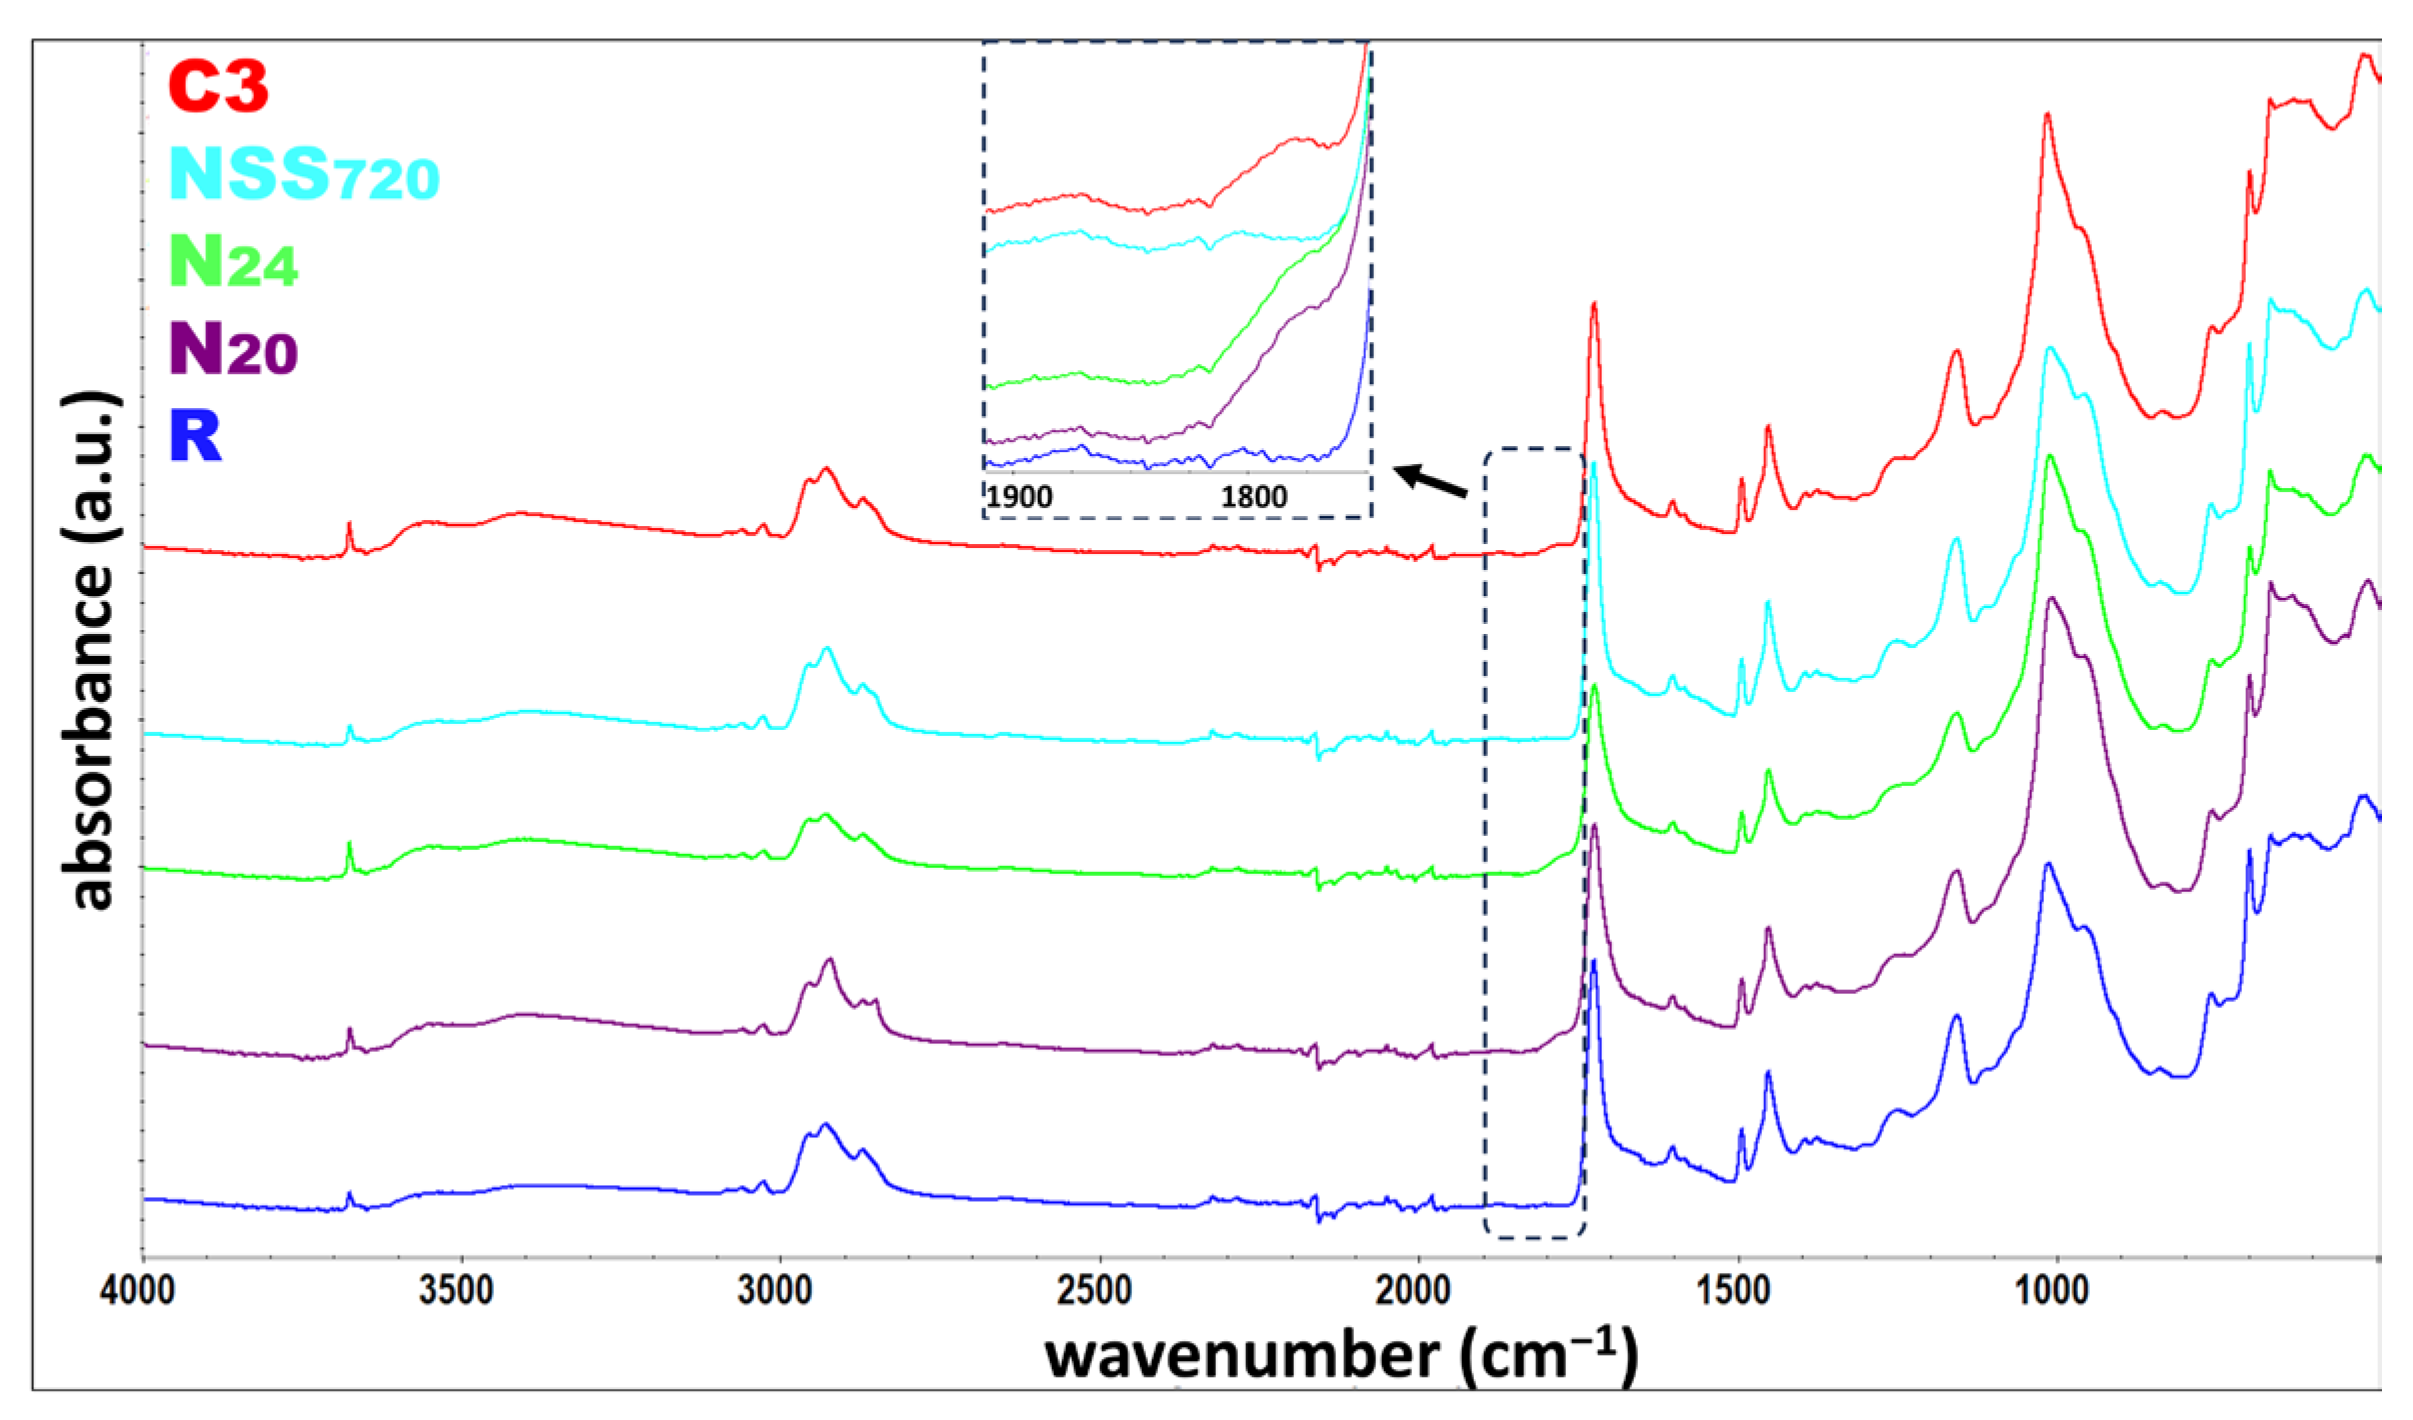
3.5. FTIR
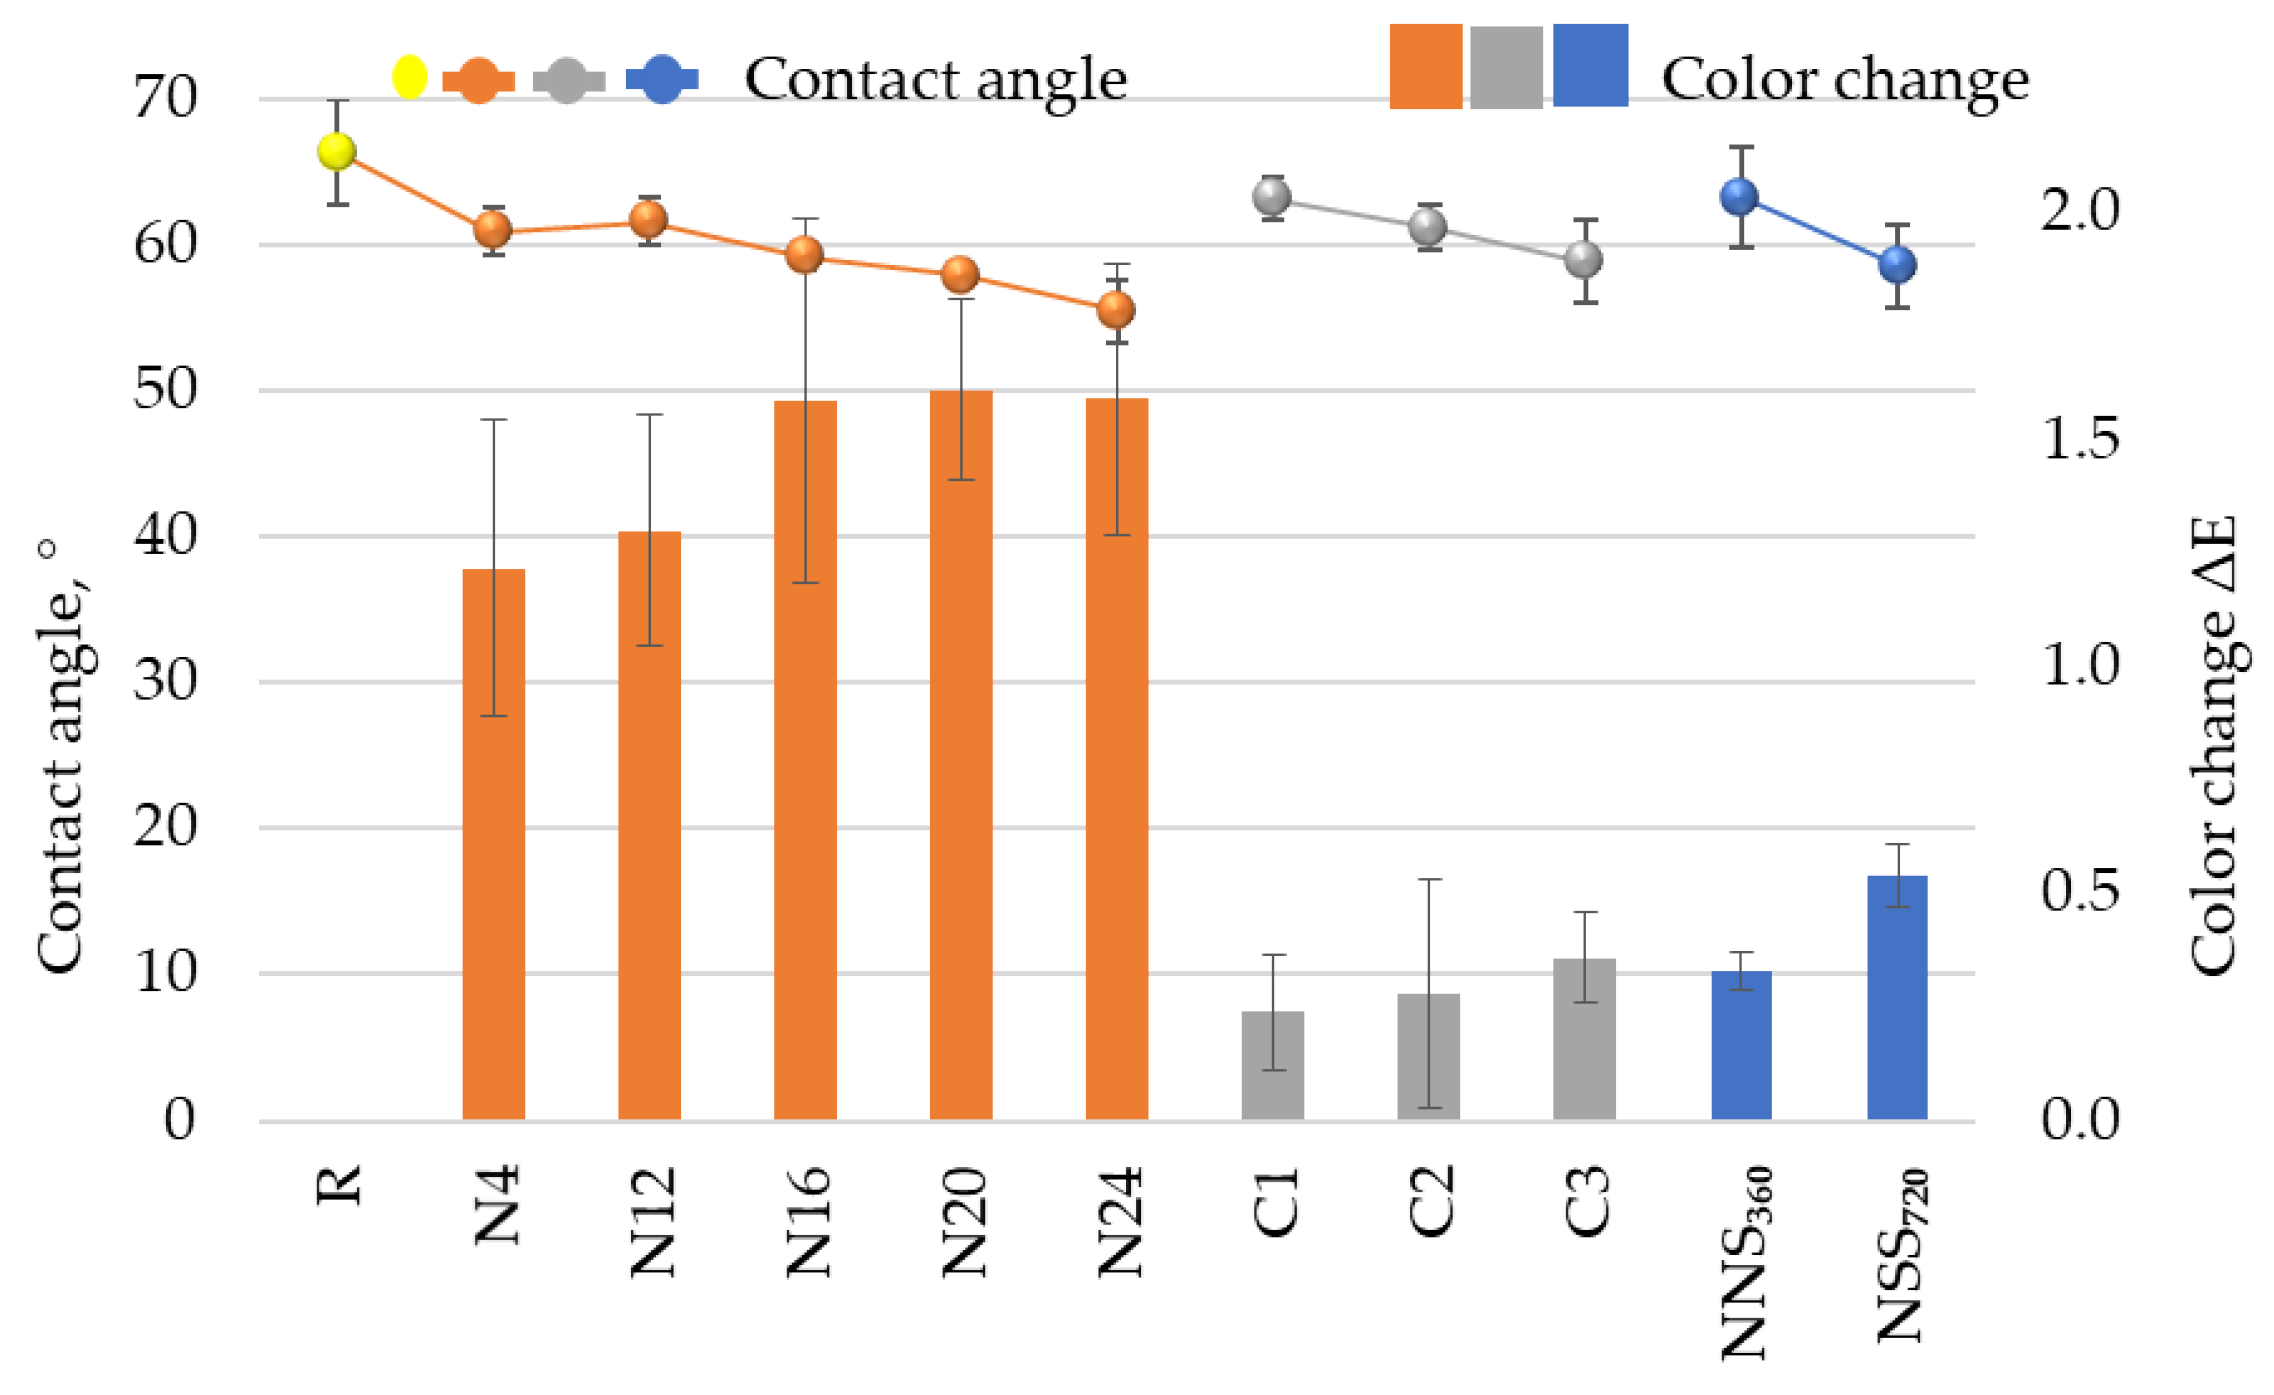
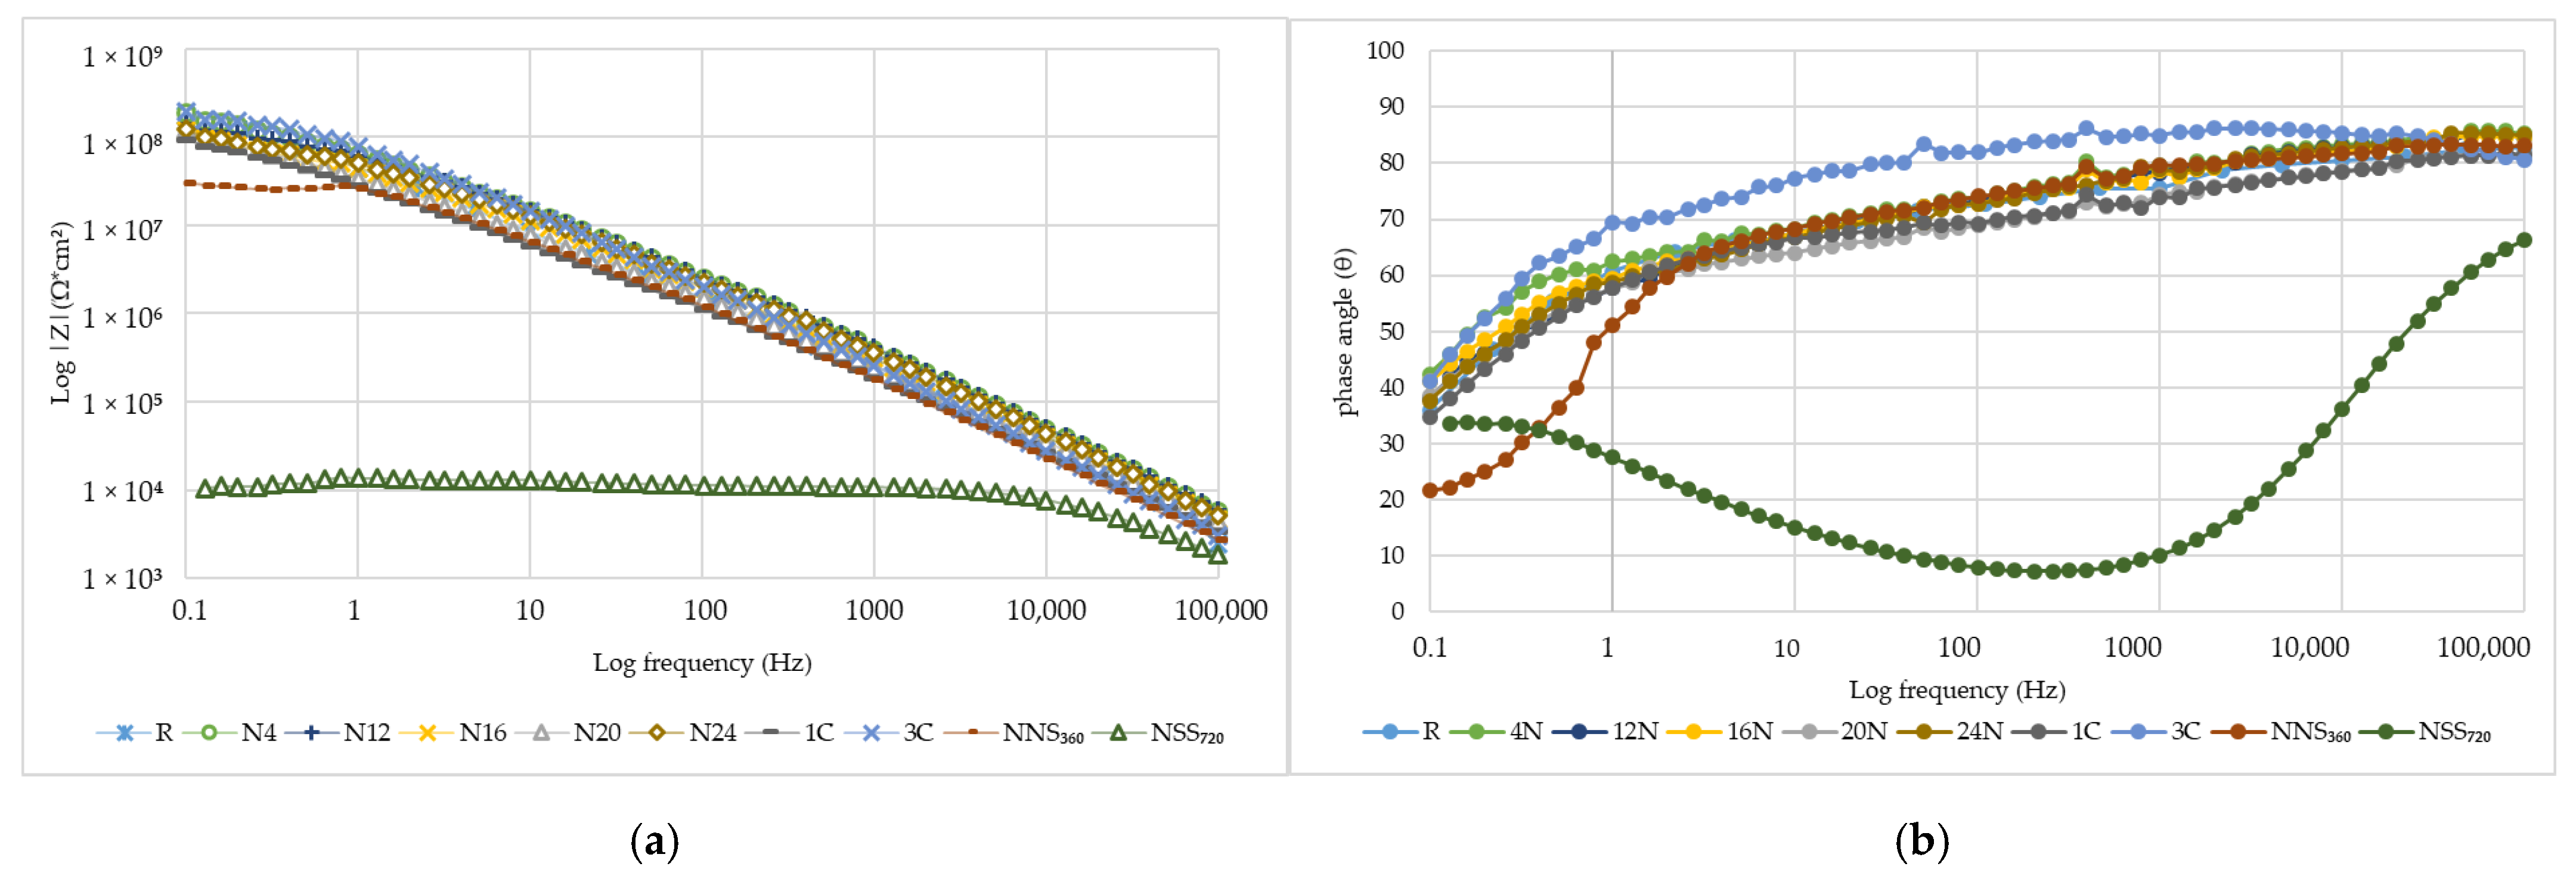
3.6. Performance
4. Conclusions
- Accelerated weathering test methods established for solvent-based paints caused significantly different degradations of acrylic coatings than observed under natural conditions.
- An original cyclic weathering test for waterborne coatings was developed.
- After an original cyclic weathering test, degradations and changes were observed to be similar to that after two years of exposure on the test site for the following properties: surface morphology, colour, hardness, nature of failure and the impedance.
Author Contributions
Funding
Institutional Review Board Statement
Informed Consent Statement
Data Availability Statement
Conflicts of Interest
References
- Nash, W.; Zheng, L.; Birbilis, N. Deep Learning Corrosion Detection with Confidence. Npj Mater. Degrad. 2022, 6, 26. [Google Scholar] [CrossRef]
- Yin, B.; Considine, T.A.; Emdad, F.; Kelley, J.V.; Jensen, R.E.; Rundensteiner, E.A. Corrosion Assessment: Data Mining for Quantifying Associations between Indoor Accelerated and Outdoor Natural Tests. In Proceedings of the 2020 IEEE International Conference on Big Data (Big Data), Atlanta, GA, USA, 10–13 December 2020; pp. 2929–2936. [Google Scholar]
- Wan Mohamad Kamaruzzaman, W.M.I.; Shaifudin, M.S.; Mohd Nasir, N.A.; Syafiq Mohd Hamidi, N.A.; Yusof, N.; Adnan, A.; Jew, L.O.; Norsani Wan Nik, W.M.; Mohd Ghazali, M.S. Eggshells Biowaste Filler for Improving the Anticorrosive Behaviour of Waterborne Polyurethane Coatings on Mild Steel in Artificial Seawater. J. Mater. Res. Technol. 2022, 21, 3815–3827. [Google Scholar] [CrossRef]
- Stojanović, I.; Cindrić, I.; Turkalj, L.; Kurtela, M.; Rakela-Ristevski, D. Durability and Corrosion Properties of Waterborne Coating Systems on Mild Steel Dried under Atmospheric Conditions and by Infrared Radiation. Materials 2022, 15, 8001. [Google Scholar] [CrossRef] [PubMed]
- Ecco, L.G.; Fedel, M.; Deflorian, F.; Becker, J.; Iversen, B.B.; Mamakhel, A. Waterborne Acrylic Paint System Based on Nanoceria for Corrosion Protection of Steel. Prog. Org. Coat. 2016, 96, 19–25. [Google Scholar] [CrossRef]
- Dhar, M.; Mishra, C.; Das, A.; Manna, U. Polymerization of Monomer Aggregates for Tailoring and Patterning Water Wettability. Chem. Commun. 2024, 60, 444–447. [Google Scholar] [CrossRef] [PubMed]
- Roselli, S.N.; Romagnoli, R.; Deyá, C. The Anti-Corrosion Performance of Water-Borne Paints in Long Term Tests. Prog. Org. Coat. 2017, 109, 172–178. [Google Scholar] [CrossRef]
- Nguyen, T.V.; Le, X.H.; Dao, P.H.; Decker, C.; Nguyen-Tri, P. Stability of Acrylic Polyurethane Coatings under Accelerated Aging Tests and Natural Outdoor Exposure: The Critical Role of the Used Photo-Stabilizers. Prog. Org. Coat. 2018, 124, 137–146. [Google Scholar] [CrossRef]
- Rodrigues Peruchi, A.B.; Zuchinali, F.F.; Bernardin, A.M. Development of a Water-Based Acrylic Paint with Resistance to Efflorescence and Test Method to Determine the Appearance of Stains. J. Build. Eng. 2021, 35, 102005. [Google Scholar] [CrossRef]
- Kumar, S.; Dhar, M.; Prusty, B.M.; Sarkar, D.; Das, A.; Manna, D.; Manna, U. Amidation Reaction to Derive Waterborne, Tolerant, and Optically Transparent Solid Slippery and Superhydrophobic Coatings. Chem. Eng. J. 2023, 465, 142776. [Google Scholar] [CrossRef]
- Nguyen, T.V.; Dao, P.H.; Nguyen, T.A.; Dang, V.H.; Ha, M.N.; Nguyen, T.T.T.; Vu, Q.T.; Nguyen, N.L.; Dang, T.C.; Nguyen-Tri, P.; et al. Photocatalytic Degradation and Heat Reflectance Recovery of Waterborne Acrylic Polymer/ZnO Nanocomposite Coating. J. Appl. Polym. Sci. 2020, 137, 49116. [Google Scholar] [CrossRef]
- Zhou, Z.; Meng, Q.; Wang, J.; Ren, P.; Li, C.; Wang, Z.; Tan, H. Impact of Marine Atmospheric Corrosion on the Thermophysical Properties of Building Coatings. J. Build. Eng. 2024, 85, 108704. [Google Scholar] [CrossRef]
- Meng, Y.; Gao, Y.; Li, J.; Liu, J.; Wang, X.; Yu, F.; Wang, T.; Gao, K.; Zhang, Z. Preparation and Characterization of Cross-Linked Waterborne Acrylic/PTFE Composite Coating with Good Hydrophobicity and Anticorrosion Properties. Colloids Surf. A Physicochem. Eng. Asp. 2022, 653, 129872. [Google Scholar] [CrossRef]
- Liu, M.; Mao, X.; Zhu, H.; Lin, A.; Wang, D. Water and Corrosion Resistance of Epoxy-Acrylic-Amine Waterborne Coatings: Effects of Resin Molecular Weight, Polar Group and Hydrophobic Segment. Corros. Sci. 2013, 75, 106–113. [Google Scholar] [CrossRef]
- Pagnin, L.; Calvini, R.; Wiesinger, R.; Schreiner, M. SO2− and NOx− Initiated Atmospheric Degradation of Polymeric Films: Morphological and Chemical Changes, Influence of Relative Humidity and Inorganic Pigments. Microchem. J. 2021, 164, 106087. [Google Scholar] [CrossRef]
- Cogulet, A.; Blanchet, P.; Landry, V. Evaluation of the Impacts of Four Weathering Methods on Two Acrylic Paints: Showcasing Distinctions and Particularities. Coatings 2019, 9, 121. [Google Scholar] [CrossRef]
- Deflorian, F.; Rossi, S.; Fedel, M. Organic Coatings Degradation: Comparison between Natural and Artificial Weathering. Corros. Sci. 2008, 50, 2360–2366. [Google Scholar] [CrossRef]
- Fedel, M.; Rossi, S.; Deflorian, F. Comparison between Natural and Artificial Weathering of E-Coated Galvanized Steel Panels. Prog. Org. Coat. 2013, 76, 194–203. [Google Scholar] [CrossRef]
- Scrinzi, E.; Rossi, S.; Orian, F.D. Influence of Natural and Artifi Cial Weathering on Aesthetic and Protective Properties of Organic Coatings. Corros. Rev. 2011, 29, 275–285. [Google Scholar] [CrossRef]
- Jacques, L.F.E. Accelerated and Outdoor/Natural Exposure Testing of Coatings. Prog. Polym. Sci. 2000, 25, 1337–1362. [Google Scholar] [CrossRef]
- Davalos-Monteiro, R.; D’Ambrosio, G.; Zhou, X.; Gibbon, S.; Curioni, M. Relationship between Natural Exposure Testing and Cyclic Corrosion Testing ISO 20340 for the Assessment of the Durability of Powder-Coated Steel. Corros. Eng. Sci. Technol. 2021, 56, 742–752. [Google Scholar] [CrossRef]
- Pélissier, K.; Le Bozec, N.; Thierry, D.; Larché, N. Evaluation of the Long-Term Performance of Marine and Offshore Coatings System Exposed on a Traditional Stationary Site and an Operating Ship and Its Correlation to Accelerated Test. Coatings 2022, 12, 1758. [Google Scholar] [CrossRef]
- Ramdé, T.; Ecco, L.G.; Rossi, S. Visual Appearance Durability as Function of Natural and Accelerated Ageing of Electrophoretic Styrene-Acrylic Coatings: Influence of Yellow Pigment Concentration. Prog. Org. Coat. 2017, 103, 23–32. [Google Scholar] [CrossRef]
- Valverde, J.C.; Moya, R. Correlation and Modeling between Color Variation and Quality of the Surface between Accelerated and Natural Tropical Weathering in Acacia Mangium, Cedrela Odorata and Tectona Grandis Wood with Two Coating. Color Res. Appl. 2014, 39, 519–529. [Google Scholar] [CrossRef]
- Cristoforetti, A.; Rossi, S.; Deflorian, F.; Fedel, M. Comparative Study between Natural and Artificial Weathering of Acrylic-Coated Steel, Aluminum, and Galvanized Steel. Mater. Corros. 2023, 74, 1429–1438. [Google Scholar] [CrossRef]
- Shang, B.; Zhang, L.; Zhu, Y.; Wu, S.; Teng, J.; He, Q.; Su, Y. Corrosion Degradation of Two Coating Systems Exposed for Three Years in a Tropical Oceanic Atmospheric Environment. Int. J. Electrochem. Sci. 2021, 16, 151010. [Google Scholar] [CrossRef]
- Deflorian, F.; Rossi, S.; Fedrizzi, L.; Zanella, C. Comparison of Organic Coating Accelerated Tests and Natural Weathering Considering Meteorological Data. Prog. Org. Coat. 2007, 59, 244–250. [Google Scholar] [CrossRef]
- ISO 8501-1; Preparation of Steel Substrates before Application of Paints and Related Products Visual Assessment of Surface Cleanliness. Part 1: Rust Grades and Preparation Grades of Uncoated Steel Substrates and of Steel Substrates after Overall Removal of Previous Coatings. International Organization for Standardization ISO: Geneva, Switzerland, 2007.
- ISO 12944-2; Paints and Varnishes Corrosion Protection of Steel Structures by Protective Paint Systems—Part 2: Classification of Environments. International Organization for Standardization ISO: Geneva, Switzerland, 2017.
- ISO 6270-1; Paints and Varnishes Determination of Resistance to Humidity—Part 1: Condensation (Single-Sided Exposure). International Organization for Standardization ISO: Geneva, Switzerland, 2017.
- ISO 9227; Corrosion Tests in Artificial Atmospheres Salt Spray Tests. International Organization for Standardization ISO: Geneva, Switzerland, 2017.
- ISO 16474-3; Paints and Varnishes Methods of Exposure to Laboratory Light Sources—Part 3: Fluorescent UV Lamps. International Organization for Standardization ISO: Geneva, Switzerland, 2021.
- ISO 3231; Paints and Varnishes Determination of Resistance to Humid Atmospheres Containing Sulfur Dioxide. International Organization for Standardization ISO:: Geneva, Switzerland, 1993.
- ISO 4628; Paints and Varnishes Evaluation of Degradation of Coatings—Designation of Quantity and Size of Defects, and Intensity of Uniform Changes in Appearance. International Organization for Standardization: Geneva, Switzerland, 2016.
- ISO 4624; Paints and Varnishes Pull-Off Test for Adhesion. International Organization for Standardization ISO: Geneva, Switzerland, 2016.
- ISO 2815; Paints and Varnishes Buchholz Indentation Test. International Organization for Standardization ISO: Geneva, Switzerland, 2003.
- Effendy, S.; Zhou, T.; Eichman, H.; Petr, M.; Bazant, M.Z. Blistering Failure of Elastic Coatings with Applications to Corrosion Resistance. Soft Matter 2021, 17, 9480–9498. [Google Scholar] [CrossRef]
- Gao, J.; Li, C.; Lv, Z.; Wang, R.; Wu, D.; Li, X. Correlation between the Surface Aging of Acrylic Polyurethane Coatings and Environmental Factors. Prog. Org. Coat. 2019, 133, 98–105. [Google Scholar] [CrossRef]
- Bauer, F.; Decker, U.; Naumov, S.; Riedel, C. Photoinitiator-Free UV Curing and Matting of Acrylate-Based Nanocomposite Coatings: Part 3. Prog. Org. Coat. 2014, 77, 1085–1094. [Google Scholar] [CrossRef]
- Kotnarowska, D.; Stanisławek, D. Influence of Climatic Ageing on Acrylic Coatings Adhesion. Autobusy 2018, 6, 518–522. [Google Scholar] [CrossRef]
- Hurley, C.J.; Zahavi, J.; Schmitt, G.F. UV Radiation Exposure Effects on the Rain Erosion Resistance of Coated Monolithic Poly(Carbonate) Transparencies. Wear 1983, 87, 9–28. [Google Scholar] [CrossRef]
- Schulz, U.; Trubiroha, P.; Schernau, U.; Baumgart, H. The Effects of Acid Rain on the Appearance of Automotive Paint Systems Studied Outdoors and in a New Artificial Weathering Test. Prog. Org. Coat. 2000, 40, 151–165. [Google Scholar] [CrossRef]
- Pan, T.; Yu, Q. Long-Term Anti-Corrosion Performance of a Conducting Polymer-Based Coating System for Steels. J. Mater. Eng. Perform. 2016, 25, 2384–2394. [Google Scholar] [CrossRef]
- Fyfe, C.A.; McKinnon, M.S. Investigation of the Thermal Degradation of Poly(Acrylic Acid) and Poly(Methacrylic Acid) by High-Resolution Carbon-13 CP/MAS NMR Spectroscopy. Macromolecules 1986, 19, 1909–1912. [Google Scholar] [CrossRef]
- Gohari, G.; Mohammadi, A.; Akbari, A.; Panahirad, S.; Dadpour, M.R.; Fotopoulos, V.; Kimura, S. Titanium Dioxide Nanoparticles (TiO2 NPs) Promote Growth and Ameliorate Salinity Stress Effects on Essential Oil Profile and Biochemical Attributes of Dracocephalum Moldavica. Sci. Rep. 2020, 10, 912. [Google Scholar] [CrossRef] [PubMed]
- Guzmán-Aponte, L.; Mejia, R.; Maury-Ramirez, A. Metakaolin-Based Geopolymer with Added TiO 2 Particles: Physicomechanical Characteristics. Coatings 2017, 7, 233. [Google Scholar] [CrossRef]
- Mai, Q.; Zhou, H.; Ou, L. Flotation Separation of Chalcopyrite and Talc Using Calcium Ions and Calcium Lignosulfonate as a Combined Depressant. Metals 2021, 11, 651. [Google Scholar] [CrossRef]
- Shameli, K.; Ahmad, M.B.; Yunus, W.Z.W.; Ibrahim, N.A.; Darroudi, M. Synthesis and Characterization of Silver/Talc Nanocomposites Using the Wet Chemical Reduction Method. Int. J. Nanomed. 2010, 5, 743–751. [Google Scholar] [CrossRef] [PubMed]
- Djangang, C.N.; Mbey, J.A.; Ekani, C.J.; Tiam, S.T.; Blanchart, P.; Njopwouo, D. Improved Microstructure and Free Efflorescence Geopolymer Binders. SN Appl. Sci. 2020, 2, 2167. [Google Scholar] [CrossRef]
- Corona, J.C.; Jenkins, D.M.; Dyar, M.D. The Experimental Incorporation of Fe into Talc: A Study Using X-Ray Diffraction, Fourier Transform Infrared Spectroscopy, and Mössbauer Spectroscopy. Contrib. Mineral. Petrol. 2015, 170, 29. [Google Scholar] [CrossRef]
- Pintus, V.; Wei, S.; Schreiner, M. Accelerated UV Ageing Studies of Acrylic, Alkyd, and Polyvinyl Acetate Paints: Influence of Inorganic Pigments. Microchem. J. 2016, 124, 949–961. [Google Scholar] [CrossRef]
- Özgenç, Ö.; Durmaz, S.; Şahin, S.; Boyaci, İ.H. Evaluation of the Weathering Resistance of Waterborne Acrylic- and Alkyd-Based Coatings Containing HALS, UV Absorber, and Bark Extracts on Wood Surfaces. J. Coat. Technol. Res. 2020, 17, 461–475. [Google Scholar] [CrossRef]
- Kotnarowska, D. Epoxy Coating Destruction as a Result of Sulphuric Acid Aqueous Solution Action. Prog. Org. Coat. 2010, 67, 324–328. [Google Scholar] [CrossRef]
- Sun, W.; Xing, C.; Tang, X.; Zuo, Y.; Tang, Y.; Zhao, X. Comparative Study on the Degradation of a Zinc-Rich Epoxy Primer/Acrylic Polyurethane Coating in Different Simulated Atmospheric Solutions. J. Coat. Technol. Res. 2021, 18, 397–413. [Google Scholar] [CrossRef]
- Zhang, H.; Dun, Y.; Tang, Y.; Zuo, Y.; Zhao, X. Correlation between Natural Exposure and Artificial Ageing Test for Typical Marine Coating Systems. J. Appl. Polym. Sci. 2016, 133. [Google Scholar] [CrossRef]
- Shao, V.; Wang, X.; Xing, W.; Zhang, G. Correlation Analysis of Natural Environment Test and Laboratory Accelerated Test. In Proceedings of the 2017 Second International Conference on Reliability Systems Engineering (ICRSE), Beijing, China, 10–12 July 2017; ISBN 978 1 5386 0918 7. [Google Scholar]


| Ingredient Name | % |
|---|---|
| titanium dioxide | ≥10–≤25 |
| trizinc bis(orthophosphate) | ≥5–≤10 |
| 2-butoxyethanol | ≥1–≤3 |
| zinc oxide | ≤0.9 |
| trimethylolpropane | ≤0.3 |
| ammonia | ≤0.3 |
| Density (g/cm3) | Apparent Viscosity (Pa·s) | Content of Non-Volatile Ingredients (%) | Surface Drying Time (min) |
|---|---|---|---|
| 1.308–1.339 | 0.69–0.71 | 61.2–61.8 | 30–35 (50 µm) |
| Exposure Type | Water Condensation (H) | Neutral Salt Spray (NSS) | Original Cyclic Test (C) | |||||||
|---|---|---|---|---|---|---|---|---|---|---|
| Exposure time, h | 240 | 480 | 720 | 1000 | 360 | 720 | 1440 | 360 (1 cycle) | 720 (2 cycles) | 1080 (3 cycles) |
| Series marking | H240 | H480 | H720 | H1000 | NSS360 | NSS720 | NSS1440 | C1 | C2 | C3 |
| Days 1–5 (120 h) UV—ISO 16474-3 | Days 6–12 (168 h) NSS Test—ISO 9227 | Day 13 (24 h) Freezing | Days 14–15 (2 × 24 h) Kesternich Test |
|---|---|---|---|
One cycle included:
| air temperature in the chamber: 35 ± 2 °C salt solution concentration: 5% NaCl (50 g NaCl/1 L distilled water) | temperature −20 ± 2 °C | One cycle included:
|
| Series Designation | Blistering ISO 4628-2 | Rusting ISO 4628-3 | Cracking ISO 4628-4 | Flaking ISO 4628-5 | Chalking ISO 4628-6 | Corrosion around a Scribe, mm ISO 4628-8 |
|---|---|---|---|---|---|---|
| N4, N8, N12, N16, N20, N24 | 0S(0) | Ri0 | 0S(0) | 0S(0) | 0S(0) | 0 |
| H240, H480, H7200 | 0S(0) | Ri0 | 0S(0) | 0S(0) | 0S(0) | not evaluated |
| H1000 | 1S(1) | Ri0 | 0S(0) | 0S(0) | 0S(0) | not evaluated |
| NSS360 | 2(S1)/5(S2) | Ri3 | 0S(0) | 0S(0) | 0S(0) | 0.5 |
| NSS720 | 3(S2) | Ri4 | 0S(0) | 0S(0) | 0S(0) | 0.5 |
| NSS1440 | 5(S3) | Ri5 | 0S(0) | 0S(0) | 0S(0) | 2.0 |
| C1 | 0S(0) | Ri0 | 0S(0) | 0S(0) | 0S(0) | 0 |
| C2 | 0S(0)/4(S2) | Ri0 | 0S(0) | 0S(0) | 0S(0) | 1.0 |
| C3 | 0S(0)/4(S2) | Ri1 | 0S(0) | 0S(0) | 0S(0) | 1.0 |
| No. | Sample | m1 (%) | m2 (%) | Td5% (°C) | Tmax (°C) | Res750 (%) |
|---|---|---|---|---|---|---|
| 1 | R | 1.9 | 45.5 | 337 | 409 | 51.0 |
| 2 | N20 | 1.8 | 43.7 | 341 | 409 | 52.7 |
| 3 | N24 | 1.7 | 43.4 | 347 | 411 | 53.0 |
| 4 | NSS720 | 1.7 | 43.4 | 354 | 409 | 53.0 |
| 5 | C3 | 1.6 | 44.5 | 350 | 410 | 51.8 |
| Test Series | Tg 1 (°C) | Tg 2 (°C) | Tm 1 (°C) | ΔH 1 (J/g) |
|---|---|---|---|---|
| R | 19.2 | 17.0 | 117.2 | 29.5 |
| N20 | 21.1 | 21.2 | 115.8 | 27.4 |
| N24 | 21.8 | 22.5 | 113.7 | 25.3 |
| NSS720 | 20.9 | 22.2 | 129.2 | 31.5 |
| C3 | 23.3 | 23.6 | 137.1 | 20.5 |
| Band/Material | R | N20 | N24 | NSS720 | C3 |
|---|---|---|---|---|---|
| * O-H stretching | 3676 cm−1 | 3675 cm−1 | 3676 cm−1 | 3675 cm−1 | 3676 cm−1 |
| C-H stretching | 2956 cm−1 2928 cm−1 2873 cm−1 | 2956 cm−1 2924 cm−1 2872 cm−1 | 2957 cm−1 2928 cm−1 2873 cm−1 | 2956 cm−1 2928 cm−1 2872 cm−1 | 2956 cm−1 2928 cm−1 2872 cm−1 |
| C=O stretching | 1726 cm−1 | 1725 cm−1 | 1725 cm−1 | 1726 cm−1 | 1725 cm−1 |
| C=C stretching | 1603 cm−1 1494 cm−1 | 1603 cm−1 1494 cm−1 | 1603 cm−1 1494 cm−1 | 1603 cm−1 1494 cm−1 | 1603 cm−1 1494 cm−1 |
| C-H bending | 1453 cm−1 698 cm−1 | 1453 cm−1 698 cm−1 | 1452 cm−1 698 cm−1 | 1453 cm−1 698 cm−1 | 1453 cm−1 698 cm−1 |
| C-O stretching | 1158 cm−1 | 1159 cm−1 | 1158 cm−1 | 1158 cm−1 | 1158 cm−1 |
| C-H rock | 840 cm−1 | 831 cm−1 | 830 cm−1 | 840 cm−1 | 836 cm−1 |
| * Si-O stretching | 1014 cm−1 665 cm−1 | 1008 cm−1 665 cm−1 | 1011 cm−1 666 cm−1 | 1011 cm−1 665 cm−1 | 1015 cm−1 666 cm−1 |
Disclaimer/Publisher’s Note: The statements, opinions and data contained in all publications are solely those of the individual author(s) and contributor(s) and not of MDPI and/or the editor(s). MDPI and/or the editor(s) disclaim responsibility for any injury to people or property resulting from any ideas, methods, instructions or products referred to in the content. |
© 2024 by the authors. Licensee MDPI, Basel, Switzerland. This article is an open access article distributed under the terms and conditions of the Creative Commons Attribution (CC BY) license (https://creativecommons.org/licenses/by/4.0/).
Share and Cite
Ładosz, Ł.; Sudoł, E.; Kozikowska, E.; Choińska, E. Artificial Weathering Test Methods of Waterborne Acrylic Coatings for Steel Structure Corrosion Protection. Materials 2024, 17, 1857. https://doi.org/10.3390/ma17081857
Ładosz Ł, Sudoł E, Kozikowska E, Choińska E. Artificial Weathering Test Methods of Waterborne Acrylic Coatings for Steel Structure Corrosion Protection. Materials. 2024; 17(8):1857. https://doi.org/10.3390/ma17081857
Chicago/Turabian StyleŁadosz, Łukasz, Ewa Sudoł, Ewelina Kozikowska, and Emilia Choińska. 2024. "Artificial Weathering Test Methods of Waterborne Acrylic Coatings for Steel Structure Corrosion Protection" Materials 17, no. 8: 1857. https://doi.org/10.3390/ma17081857
APA StyleŁadosz, Ł., Sudoł, E., Kozikowska, E., & Choińska, E. (2024). Artificial Weathering Test Methods of Waterborne Acrylic Coatings for Steel Structure Corrosion Protection. Materials, 17(8), 1857. https://doi.org/10.3390/ma17081857