
Fatigue Life Prediction of FRP-Strengthened Reinforced Concrete Beams Based on Soft Computing Techniques

Abstract
1. Introduction
2. Algorithm Introduction
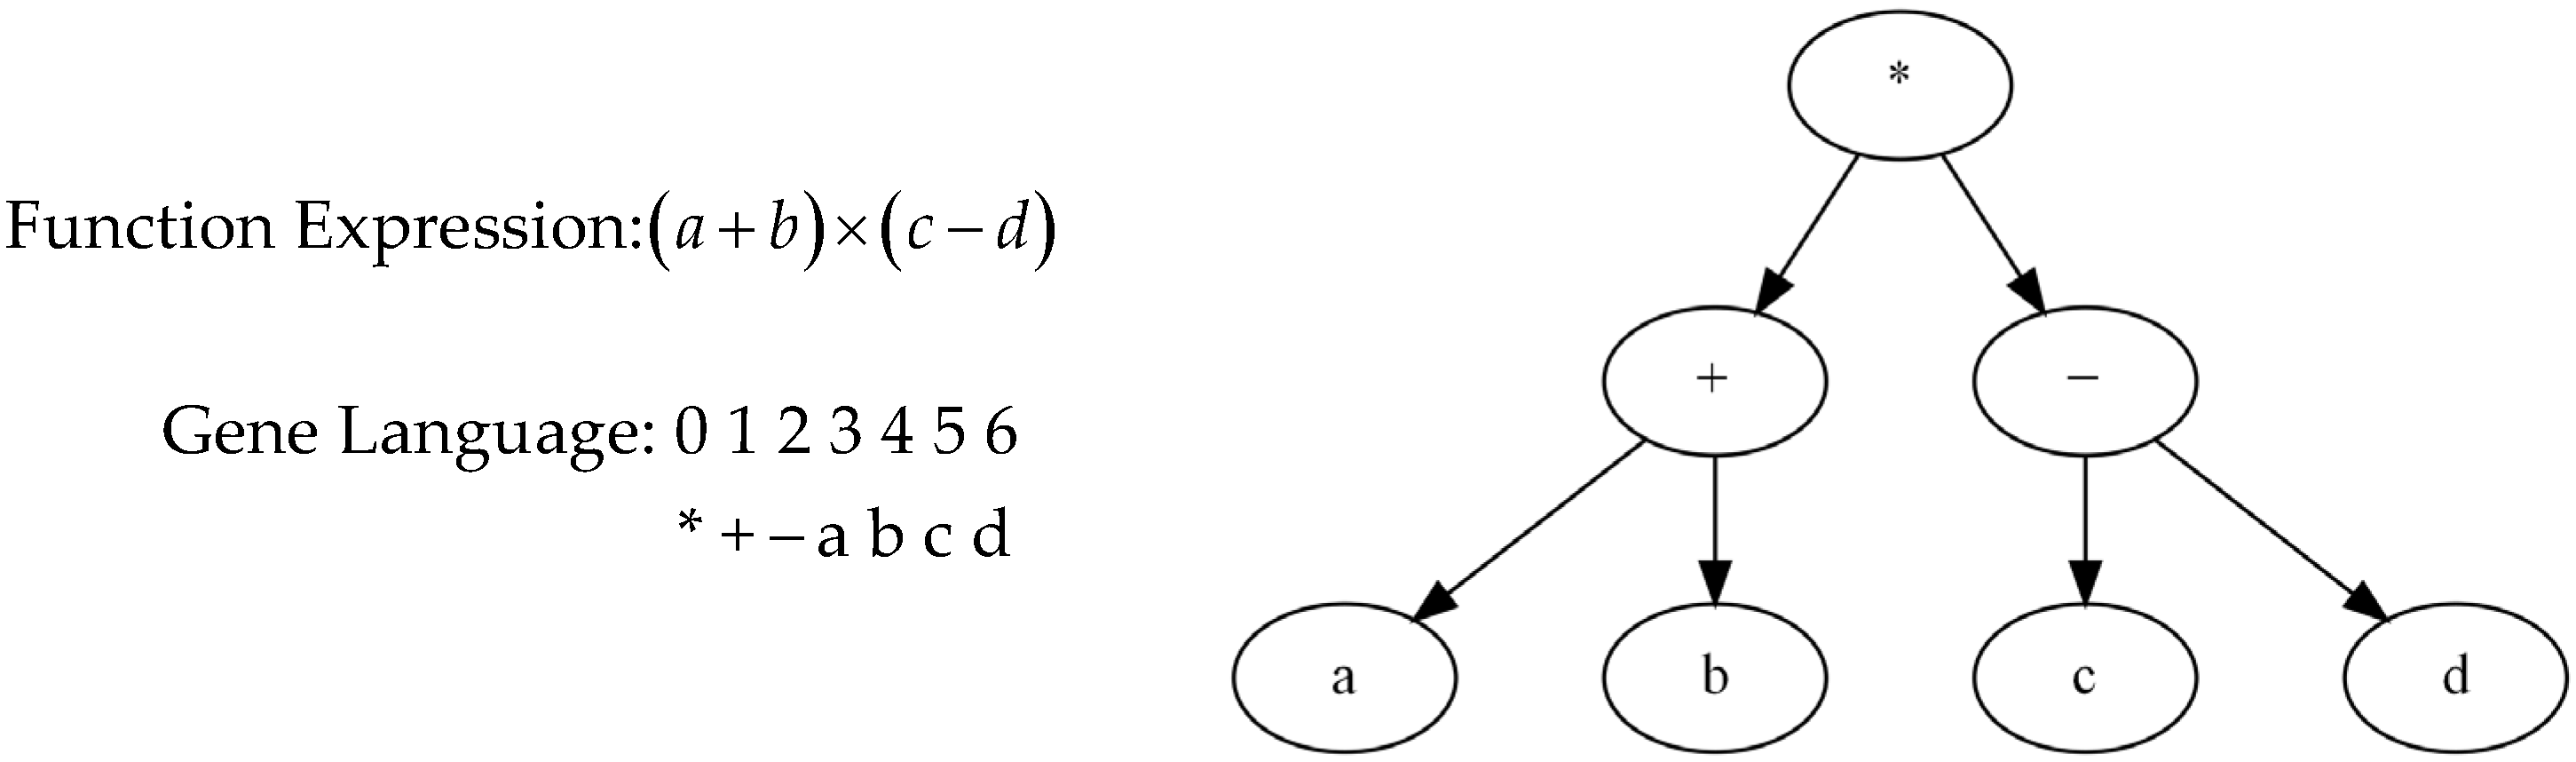
2.1. GEP
2.2. MOGA-EPR
3. Model Development
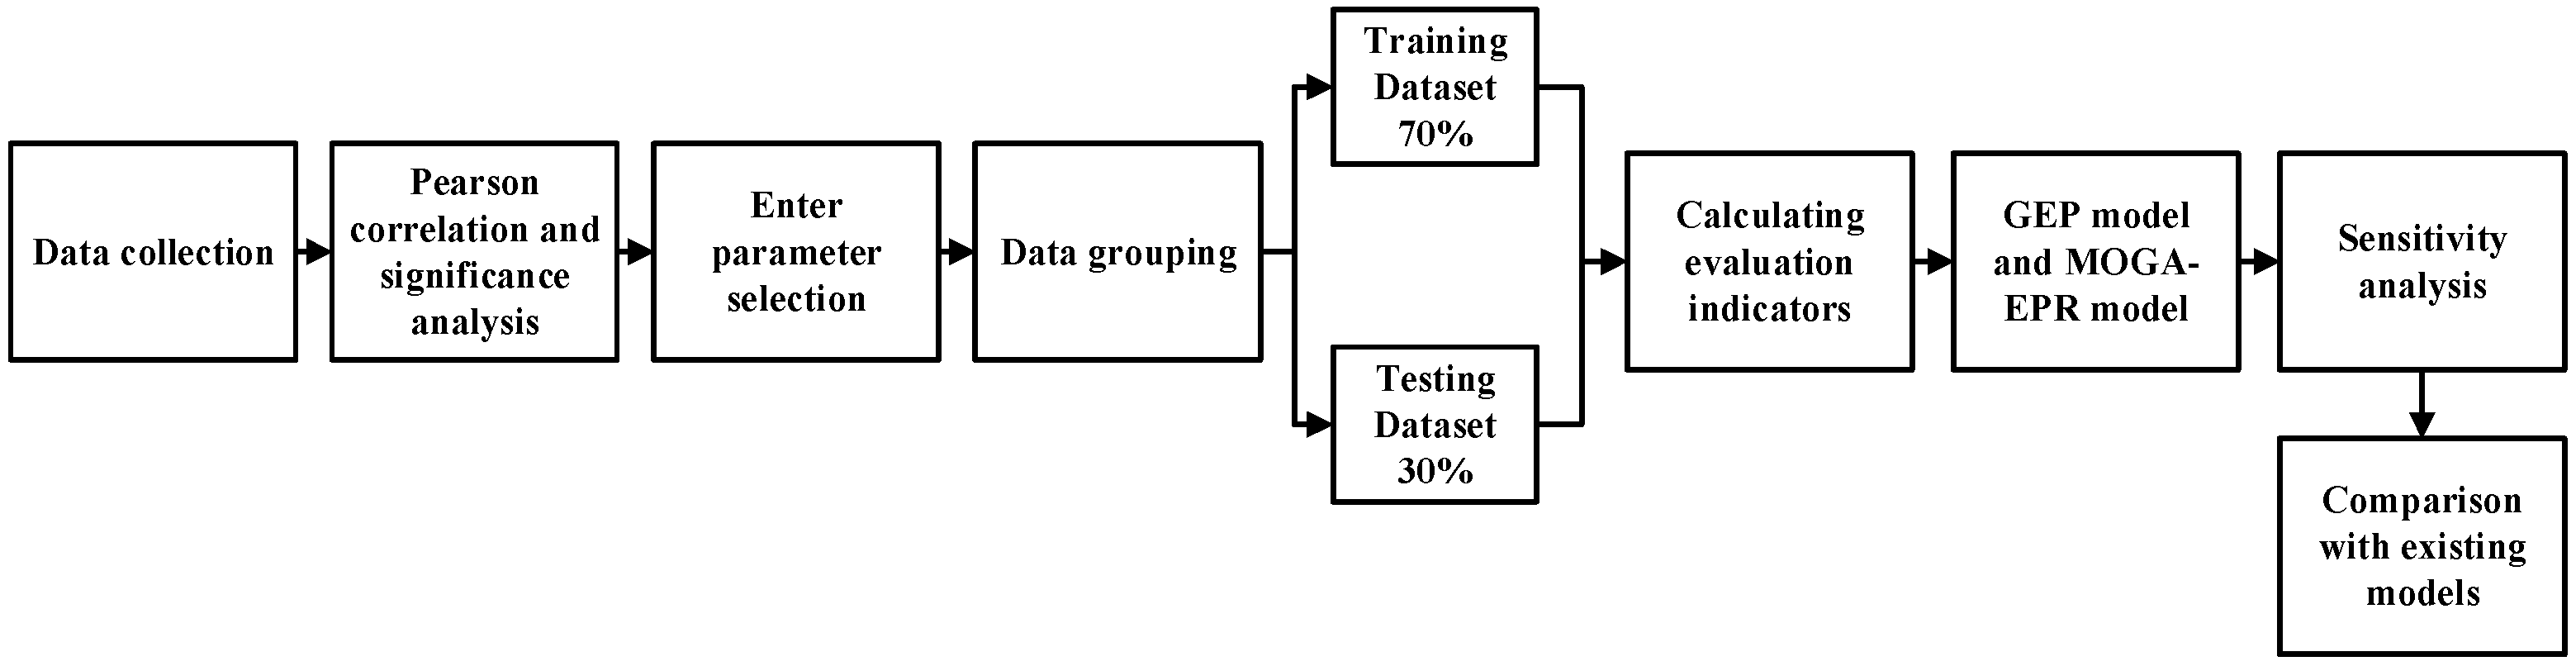
3.1. Methodology
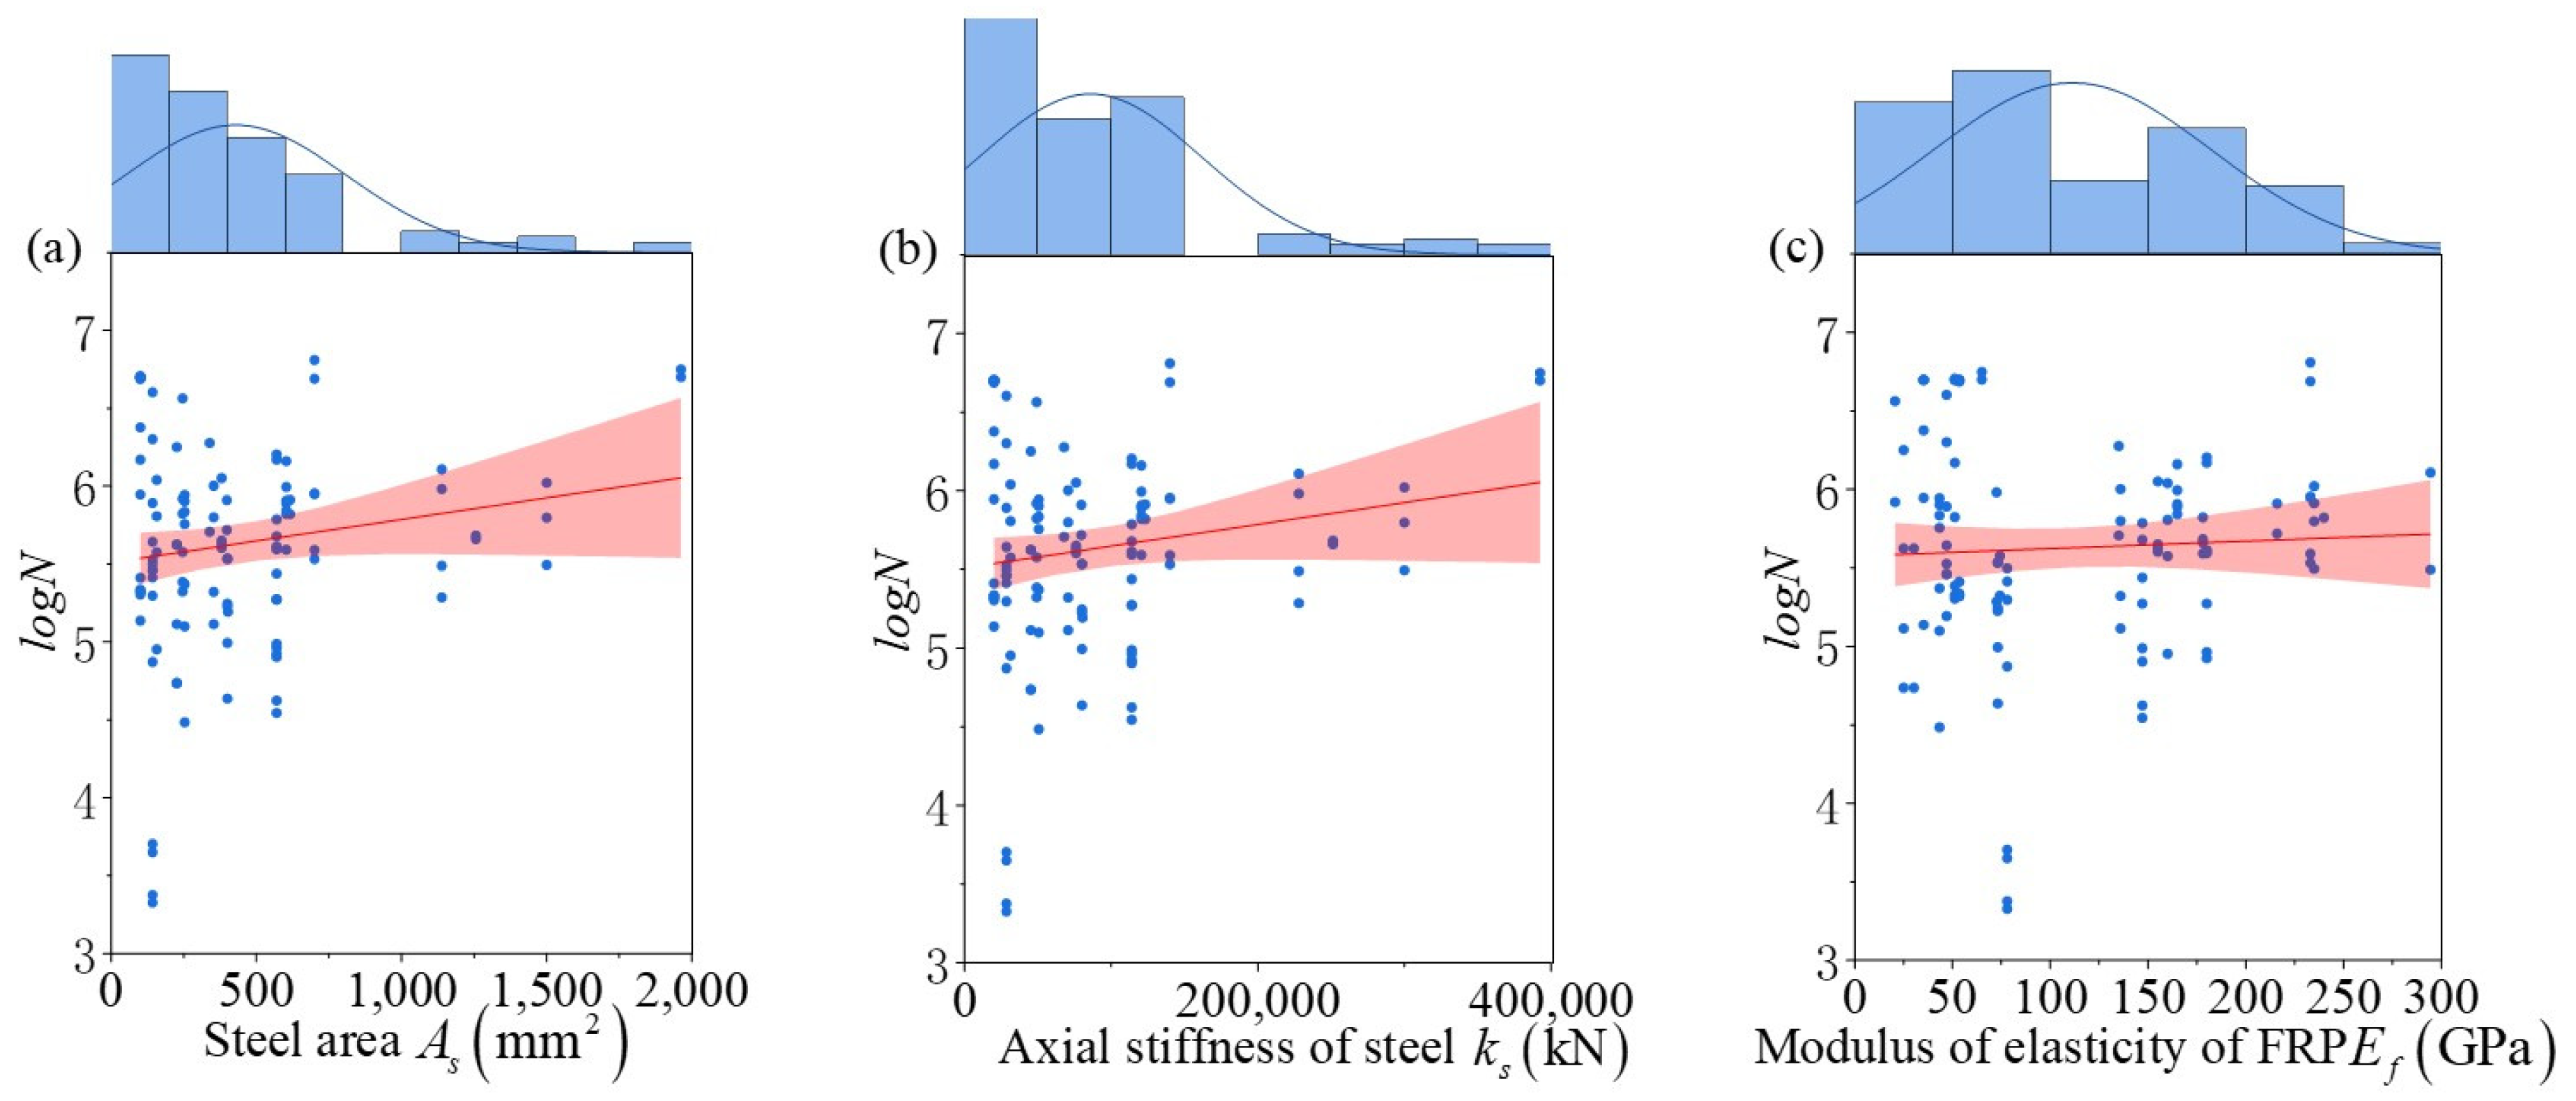
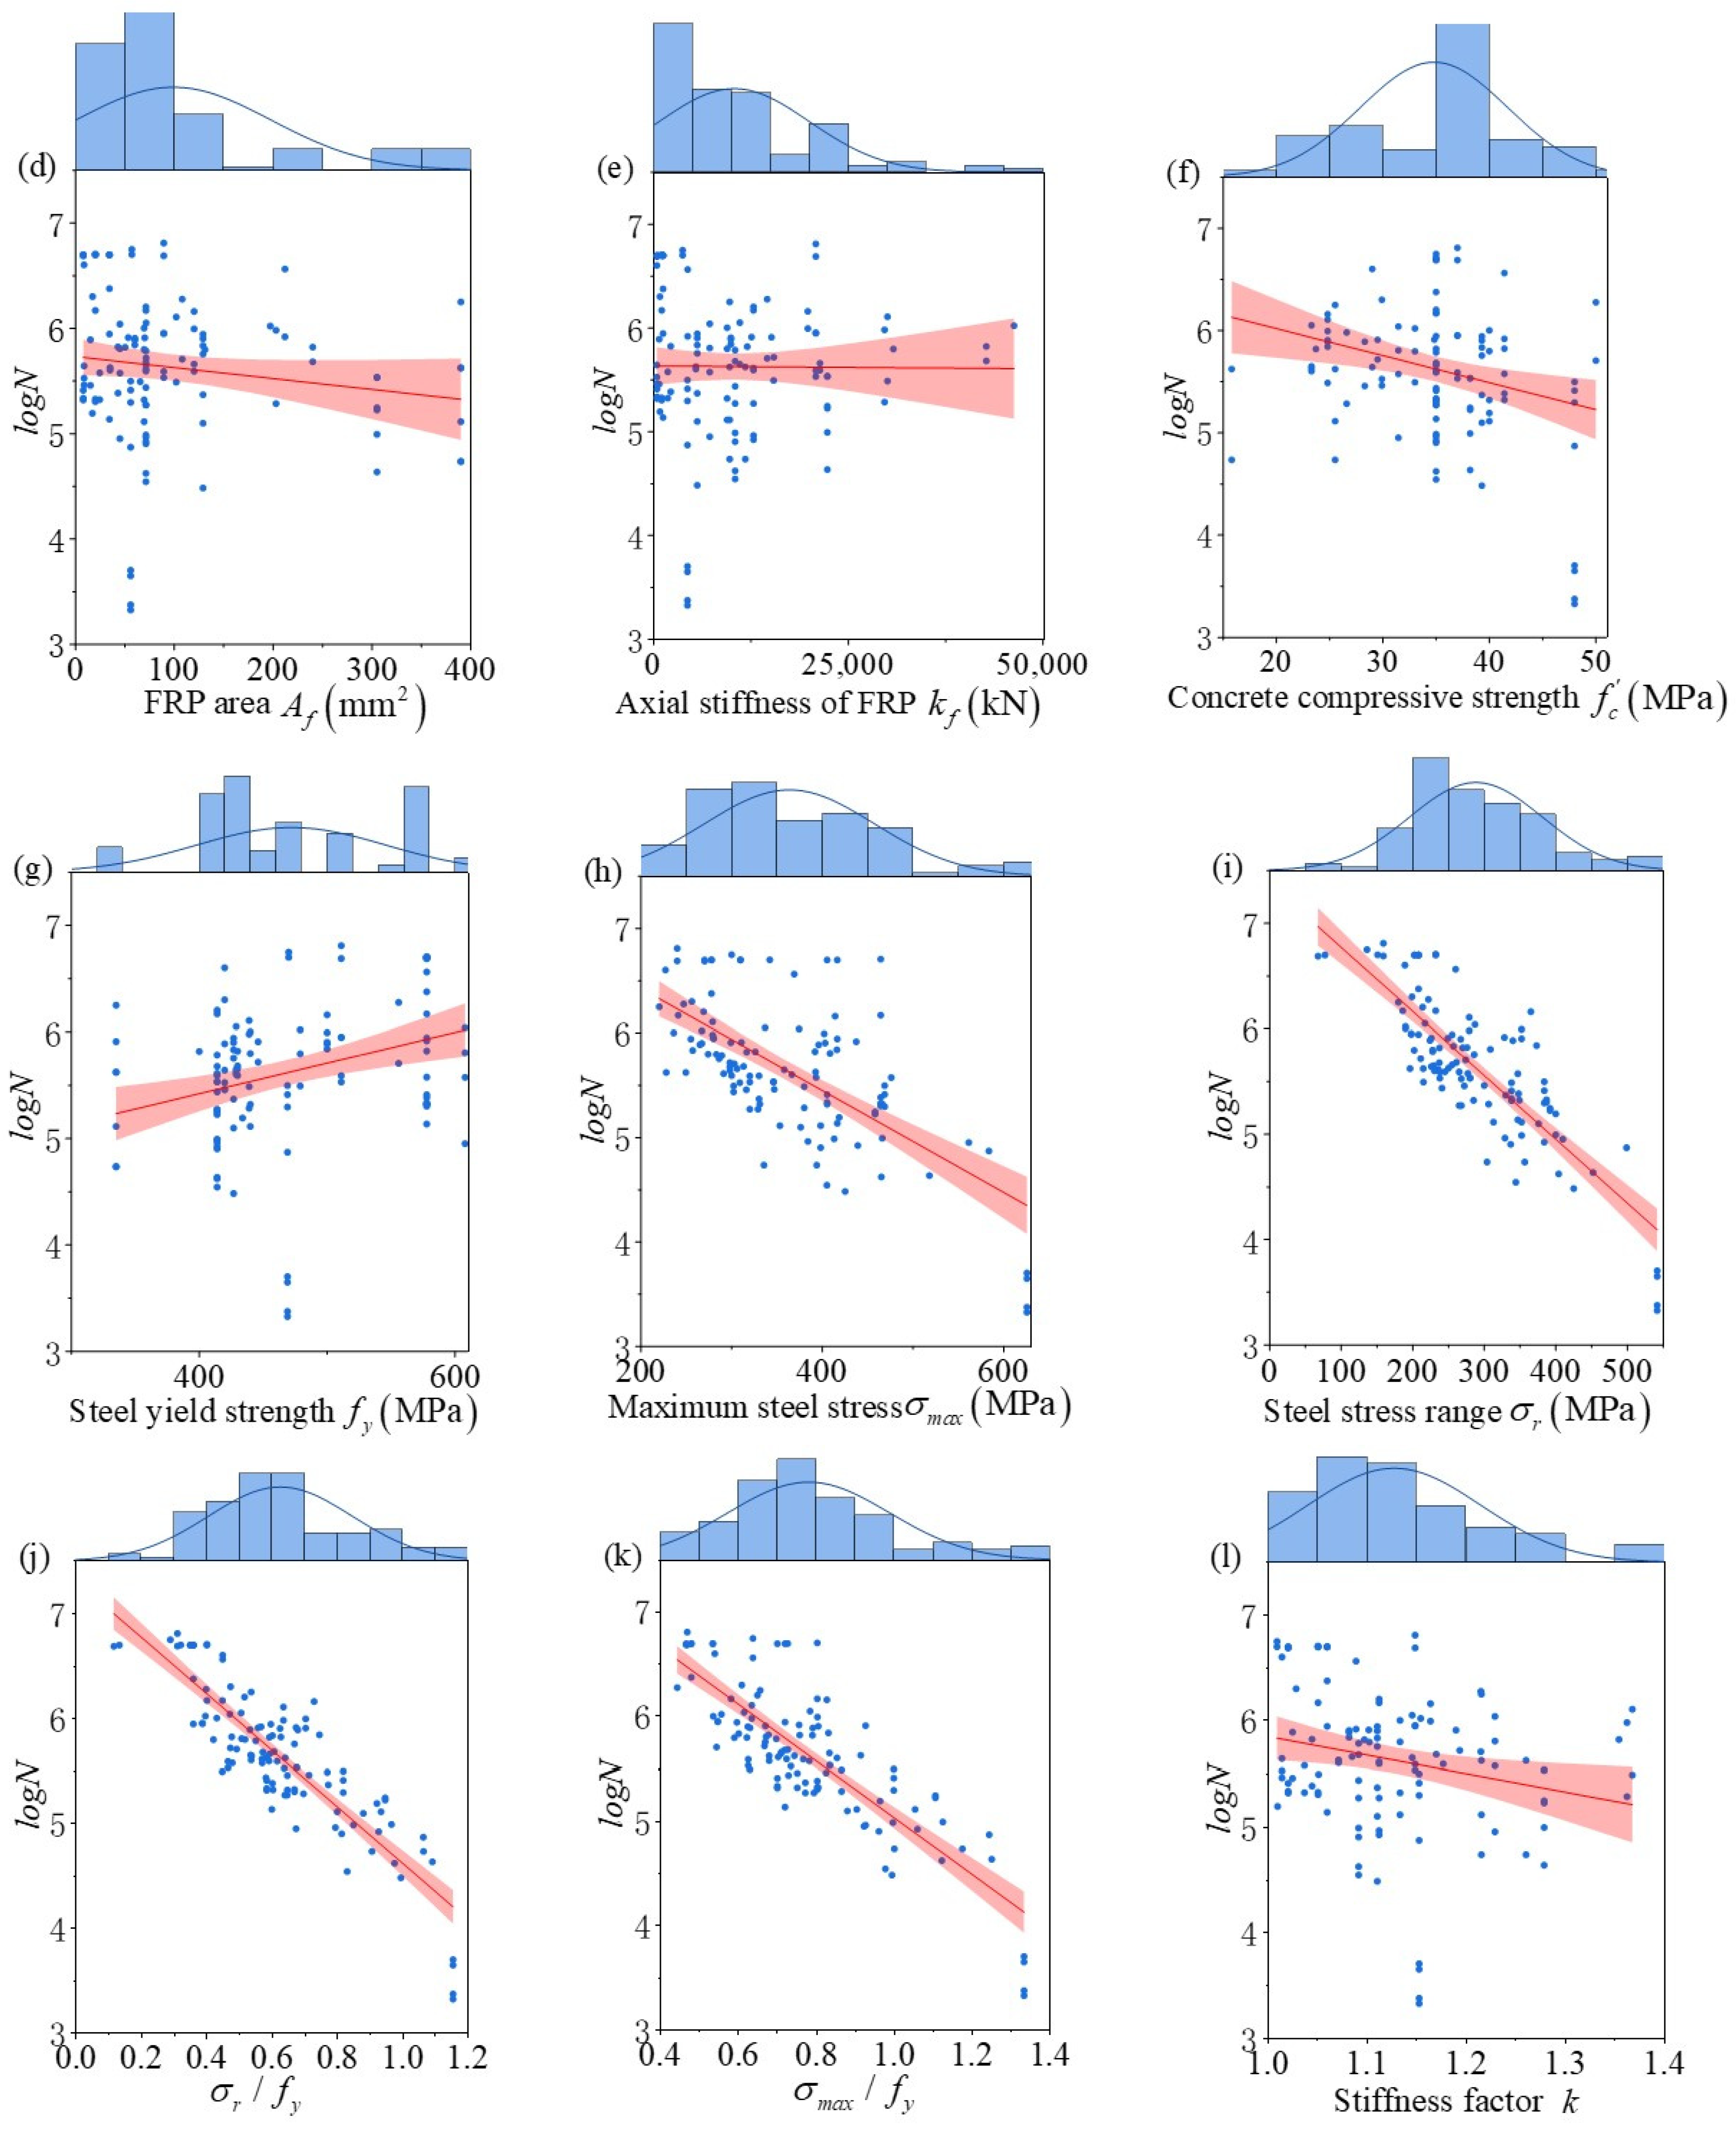
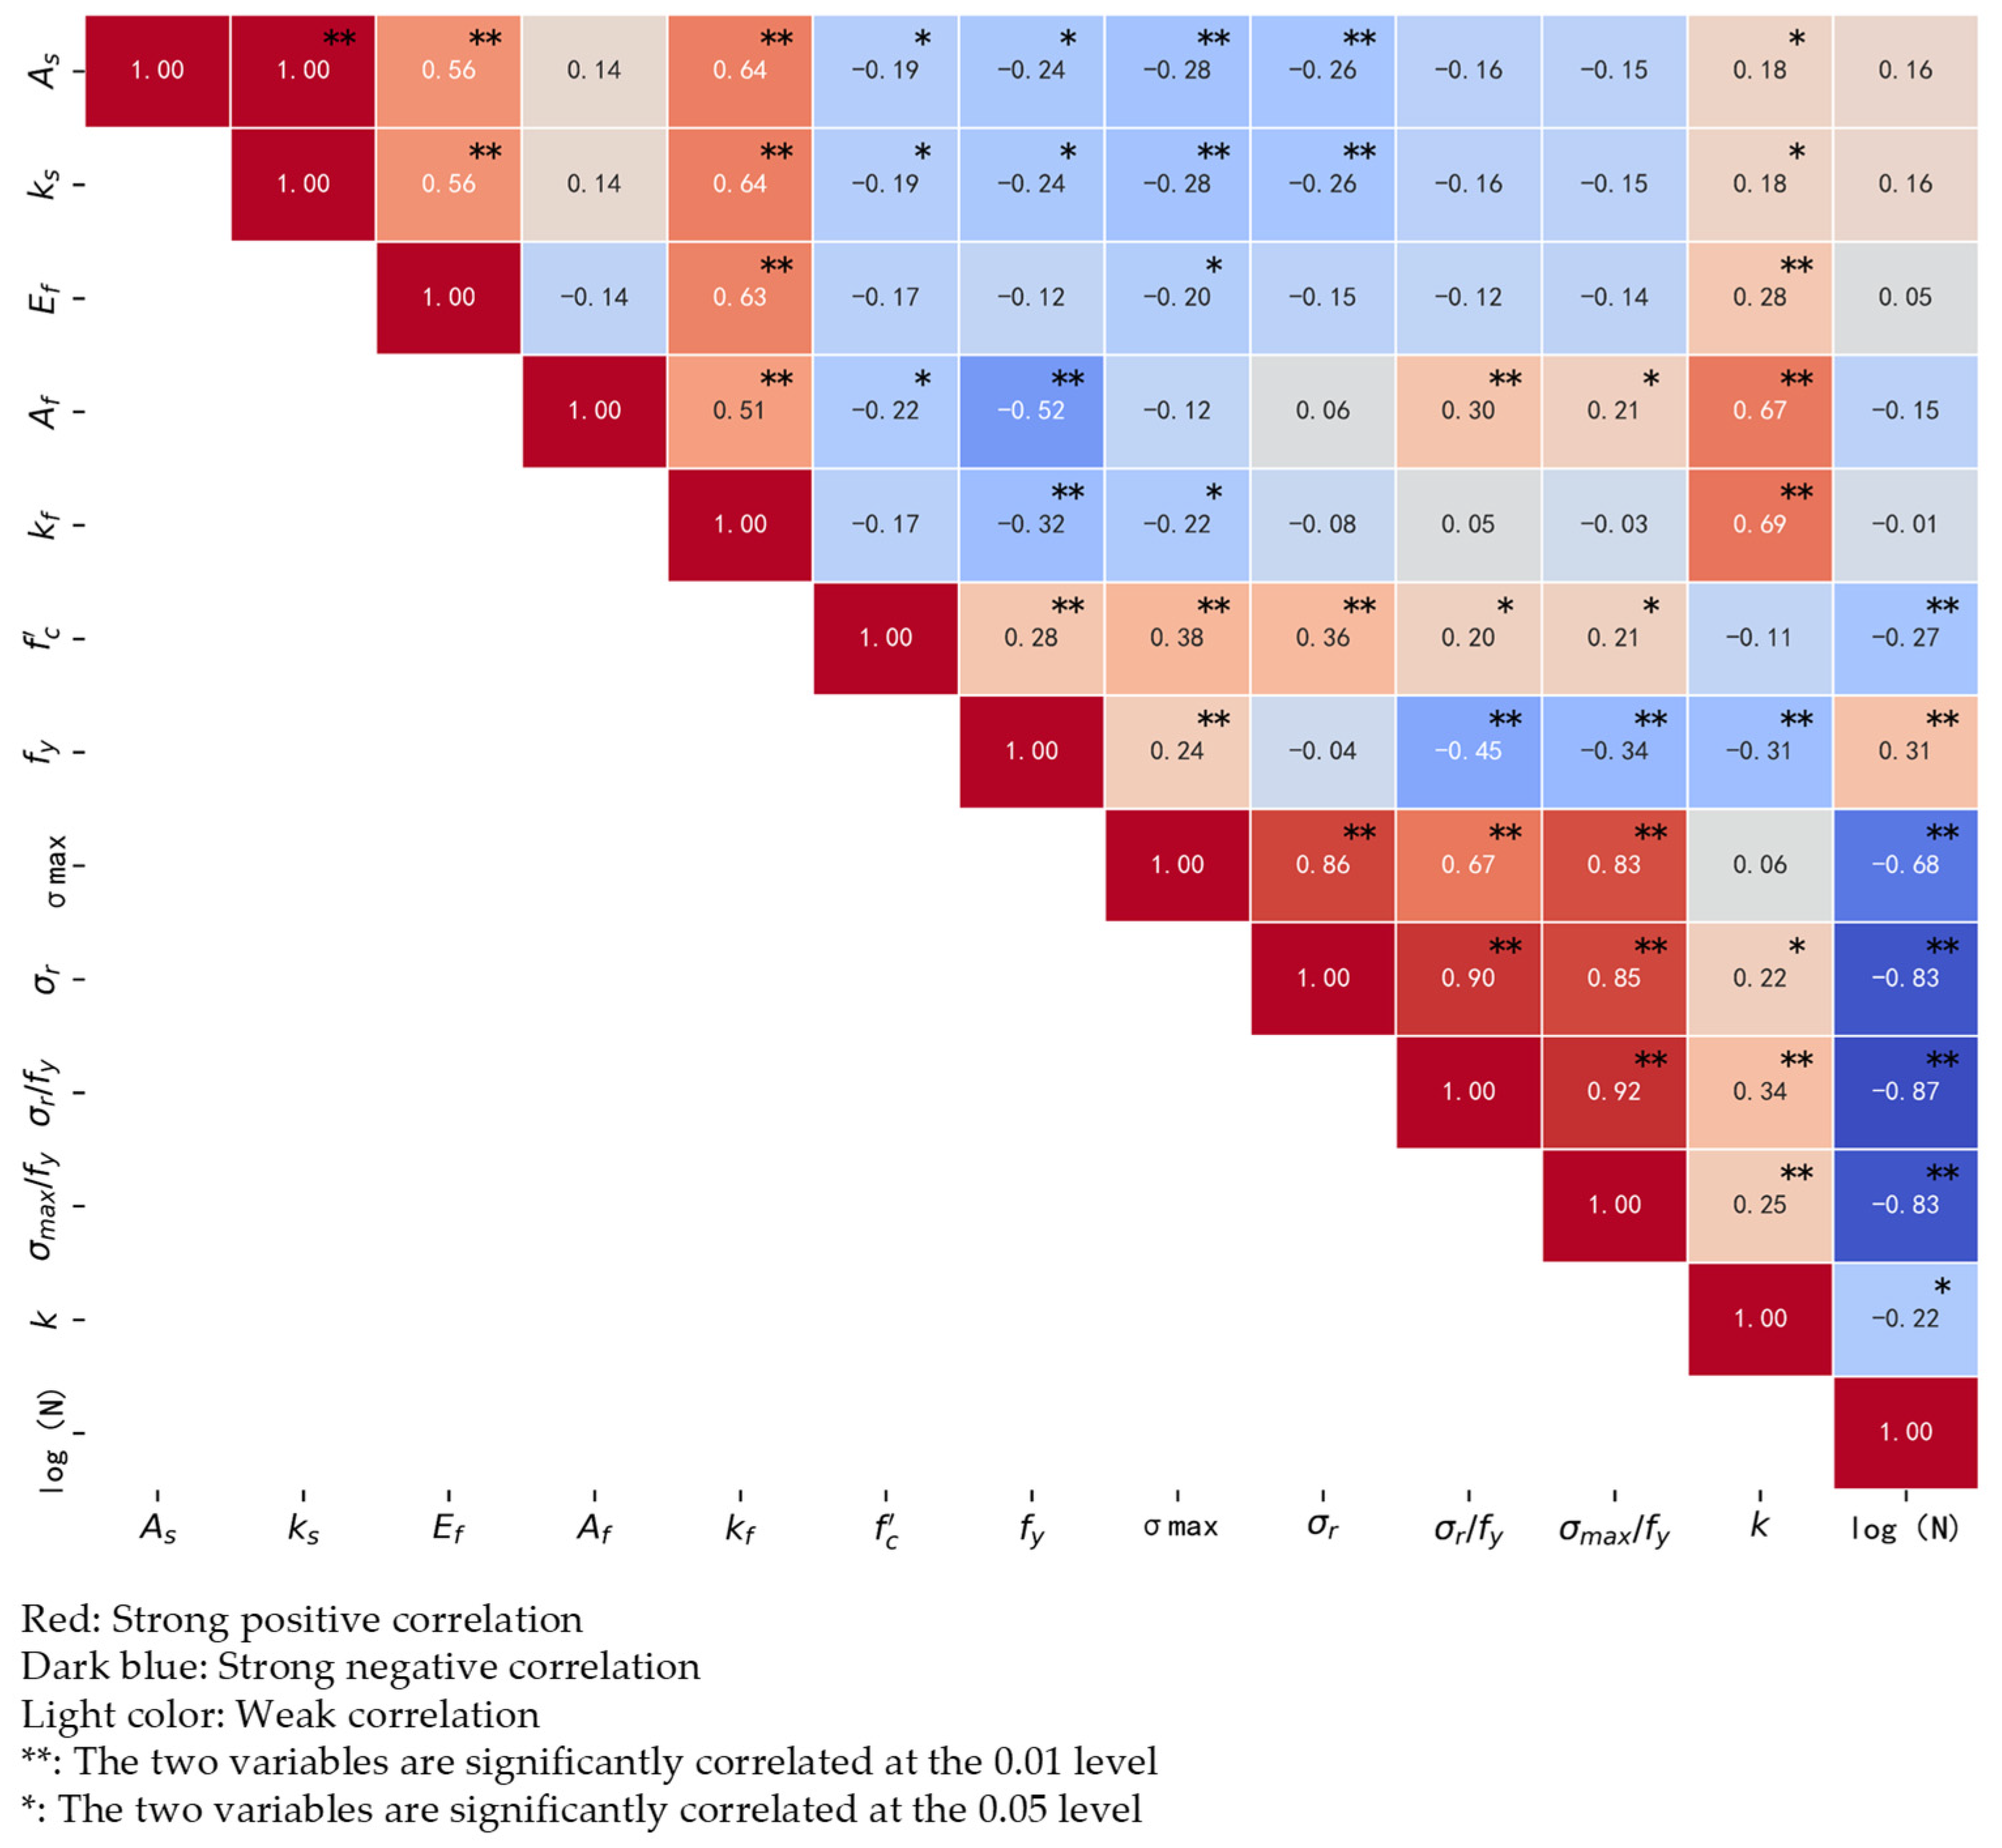
3.2. Data Analysis
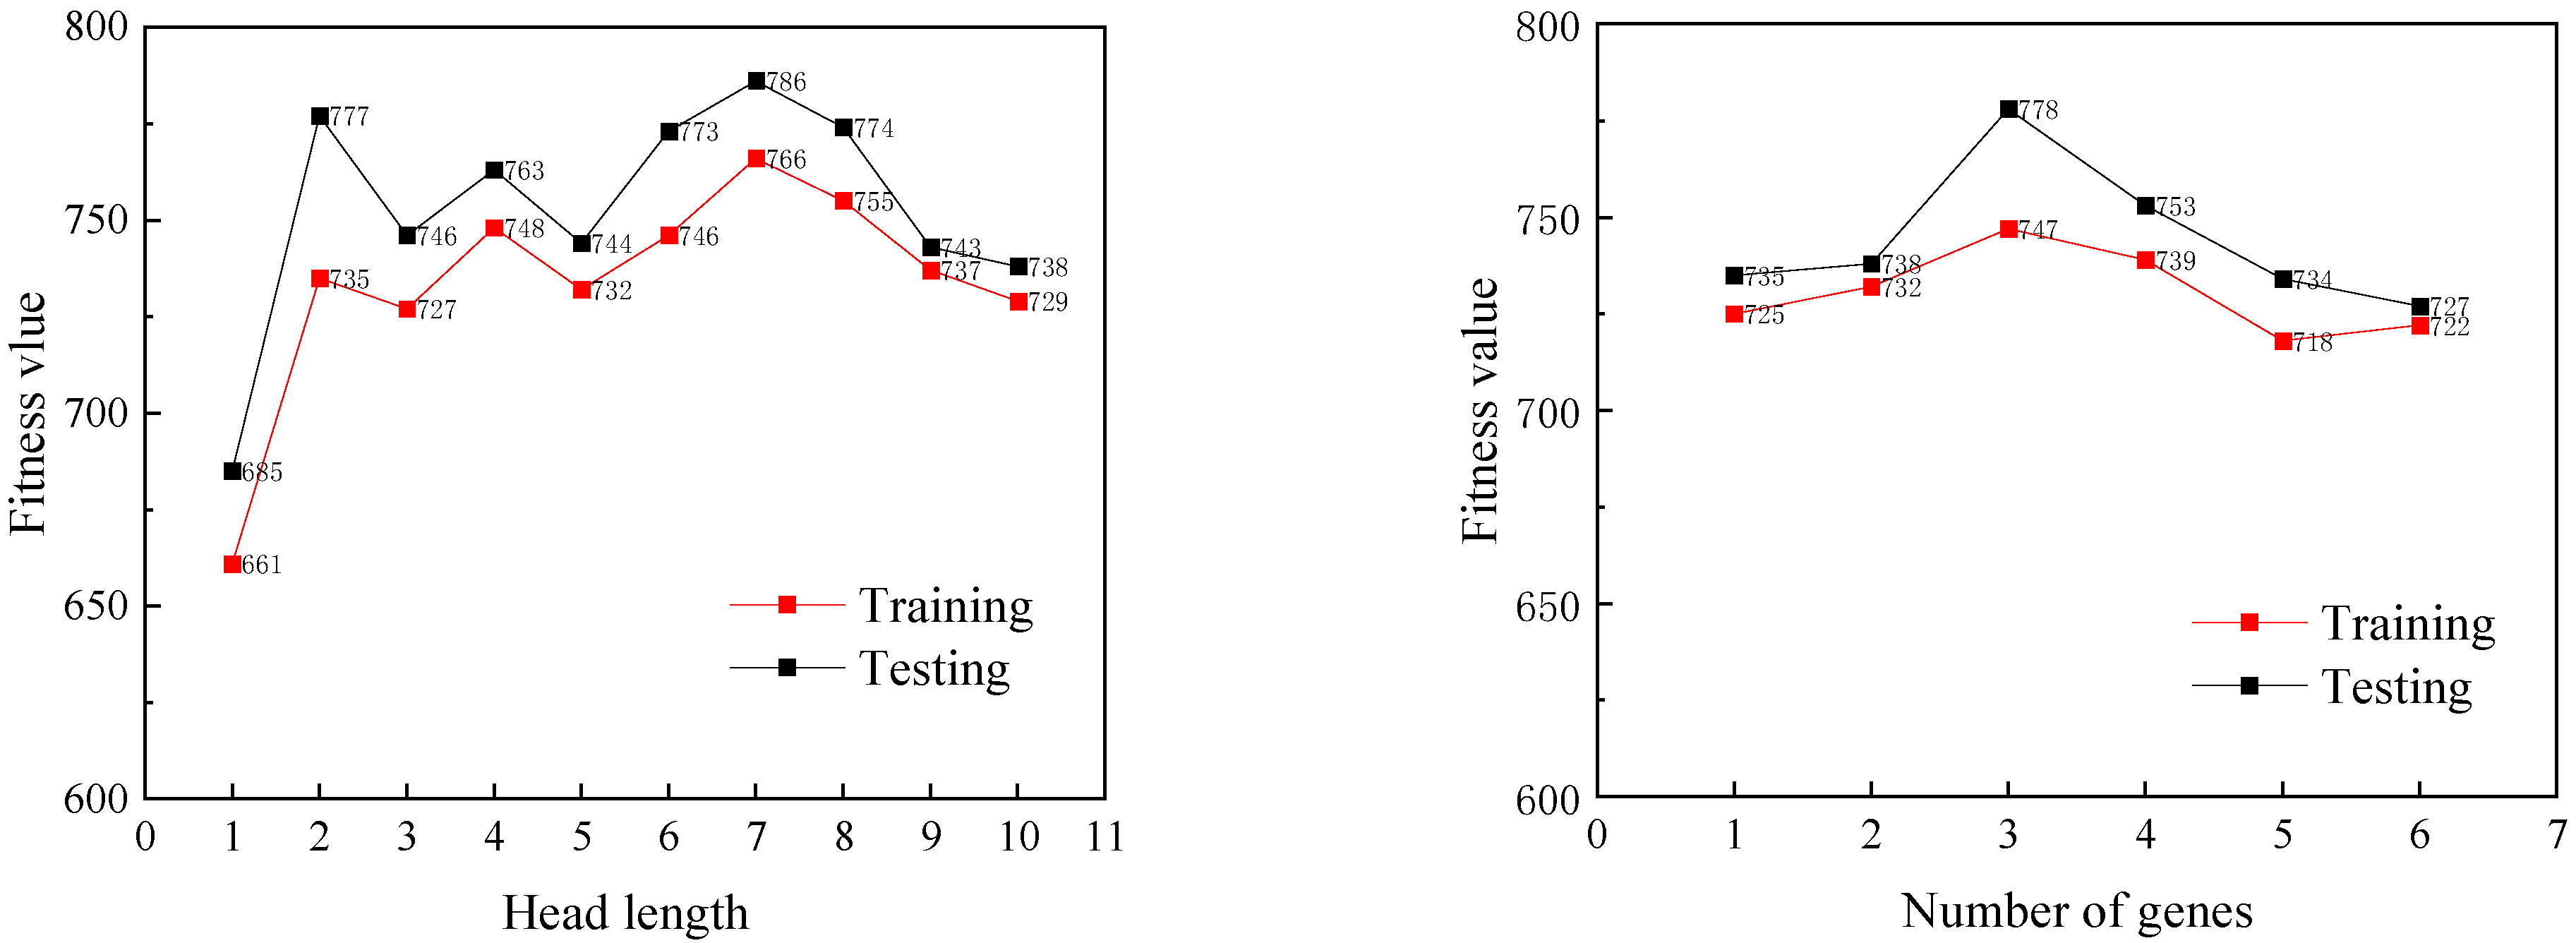
3.3. Software Parameter Settings
3.4. Selection of Optimal Input Form
3.5. MOGA-EPR Model
3.6. Sensitivity Analysis of the Models
4. Comparison of the Proposed Model with Existing Ones
5. Conclusions
- (1)
- Utilizing a compiled dataset of 117 samples, five different input forms were proposed based on the input parameters of existing models and the outcomes of Pearson correlation and significance analysis from this study’s database. The programs were evaluated using five indicators to find the optimal input form. The optimal input forms are the ratio of steel reinforcement stress range to yield strength, concrete compressive strength, and stiffness factor.
- (2)
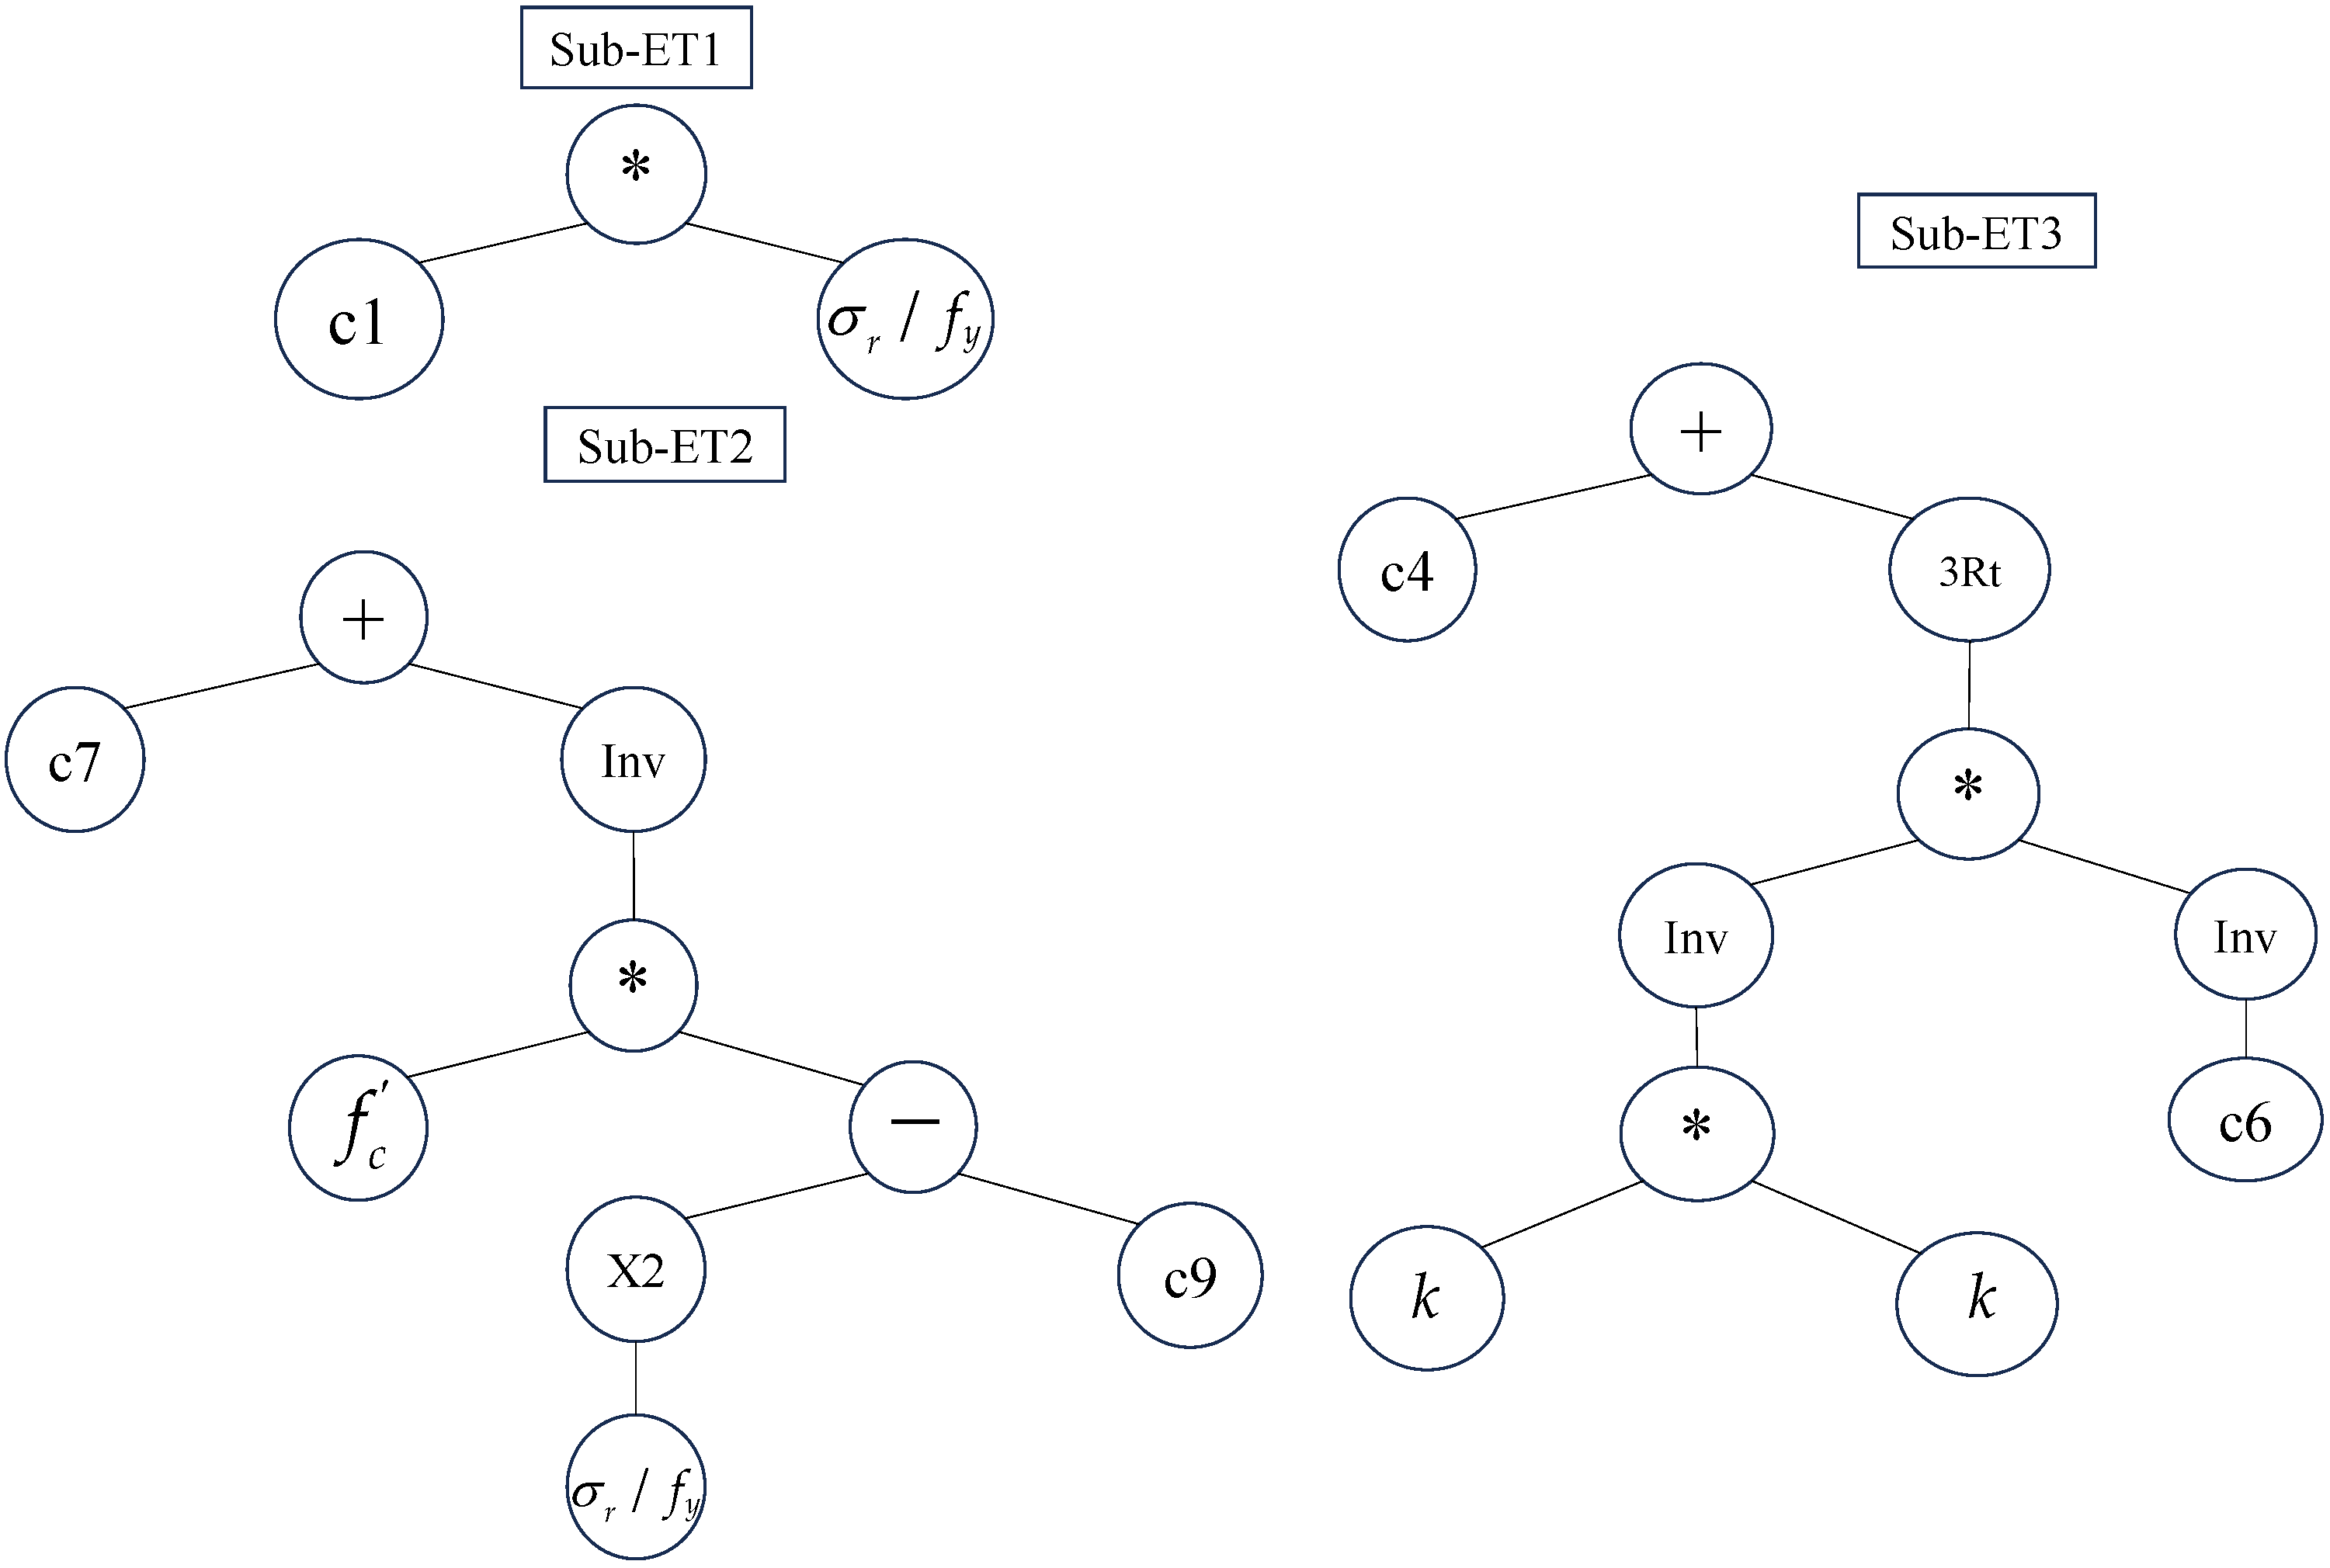
- The GEP and MOGA-EPR models that can predict the fatigue life of FRP-strengthened reinforced concrete beams are developed. The feasibility of the models in this paper is further analyzed by sensitivity analysis. The sensitivity analysis results are consistent with the experimental findings that have been published in the literature, and the models can correctly reflect the effects of each input parameter on the fatigue life.
- (3)
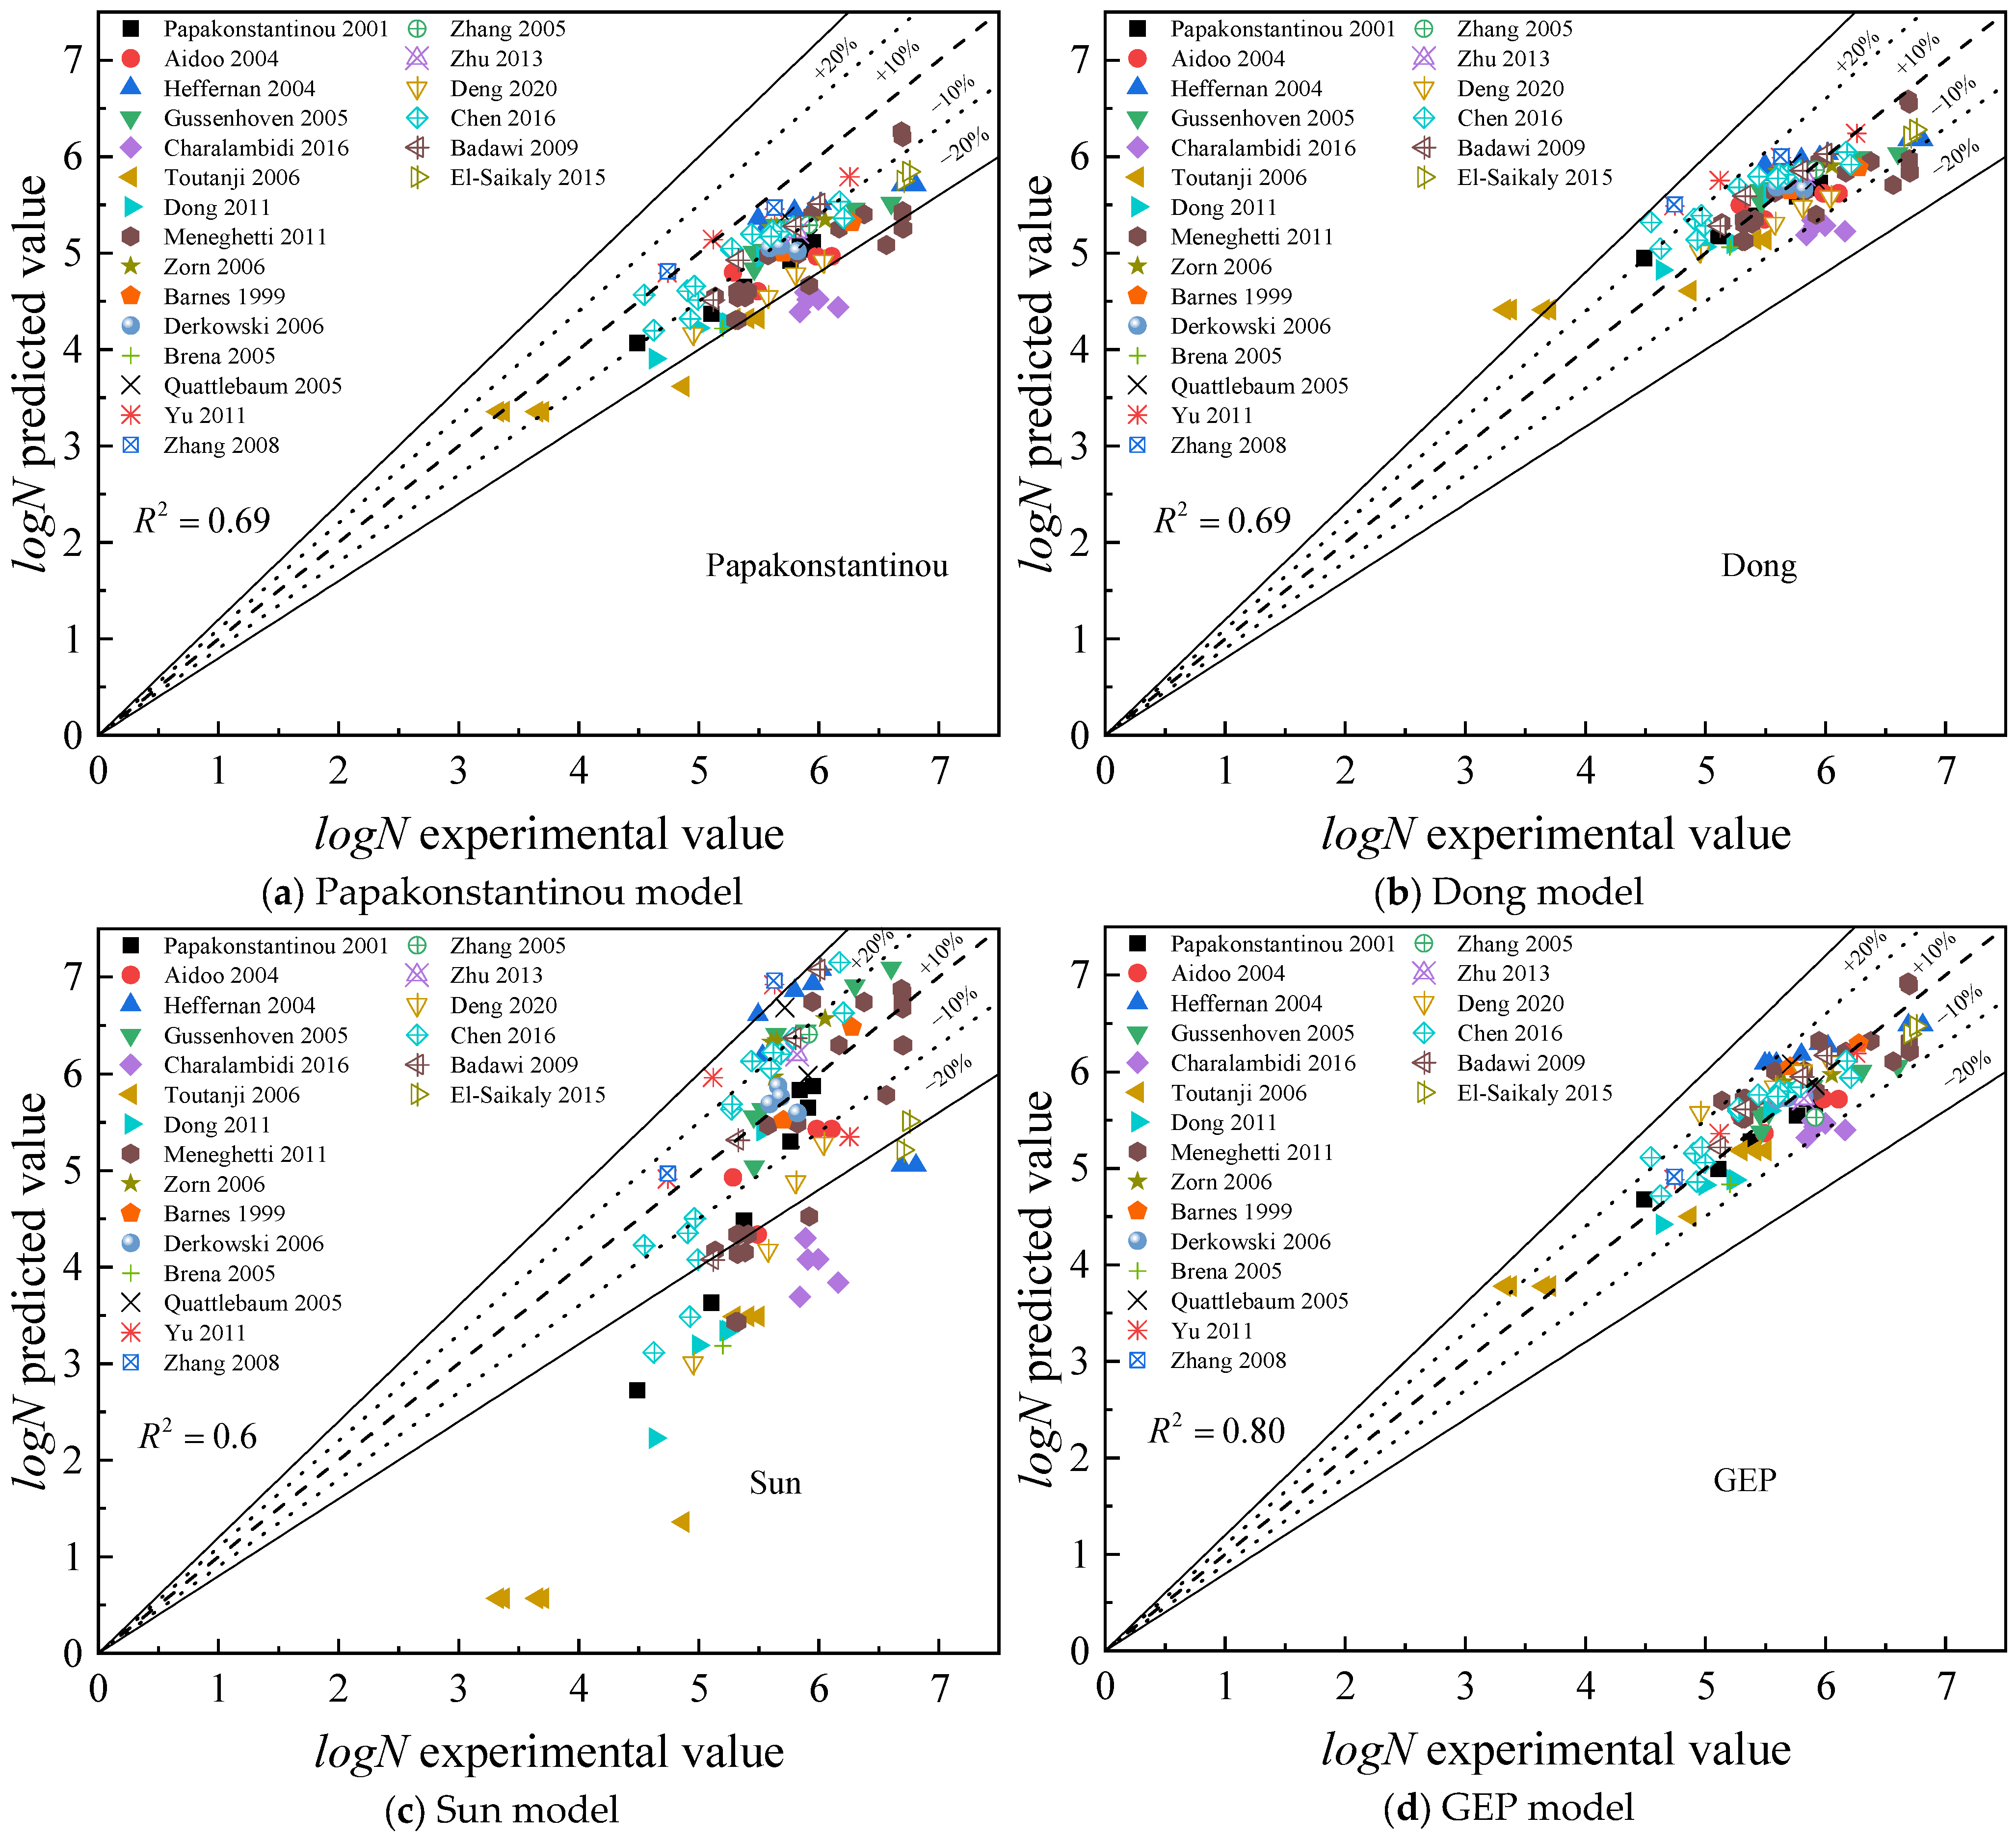
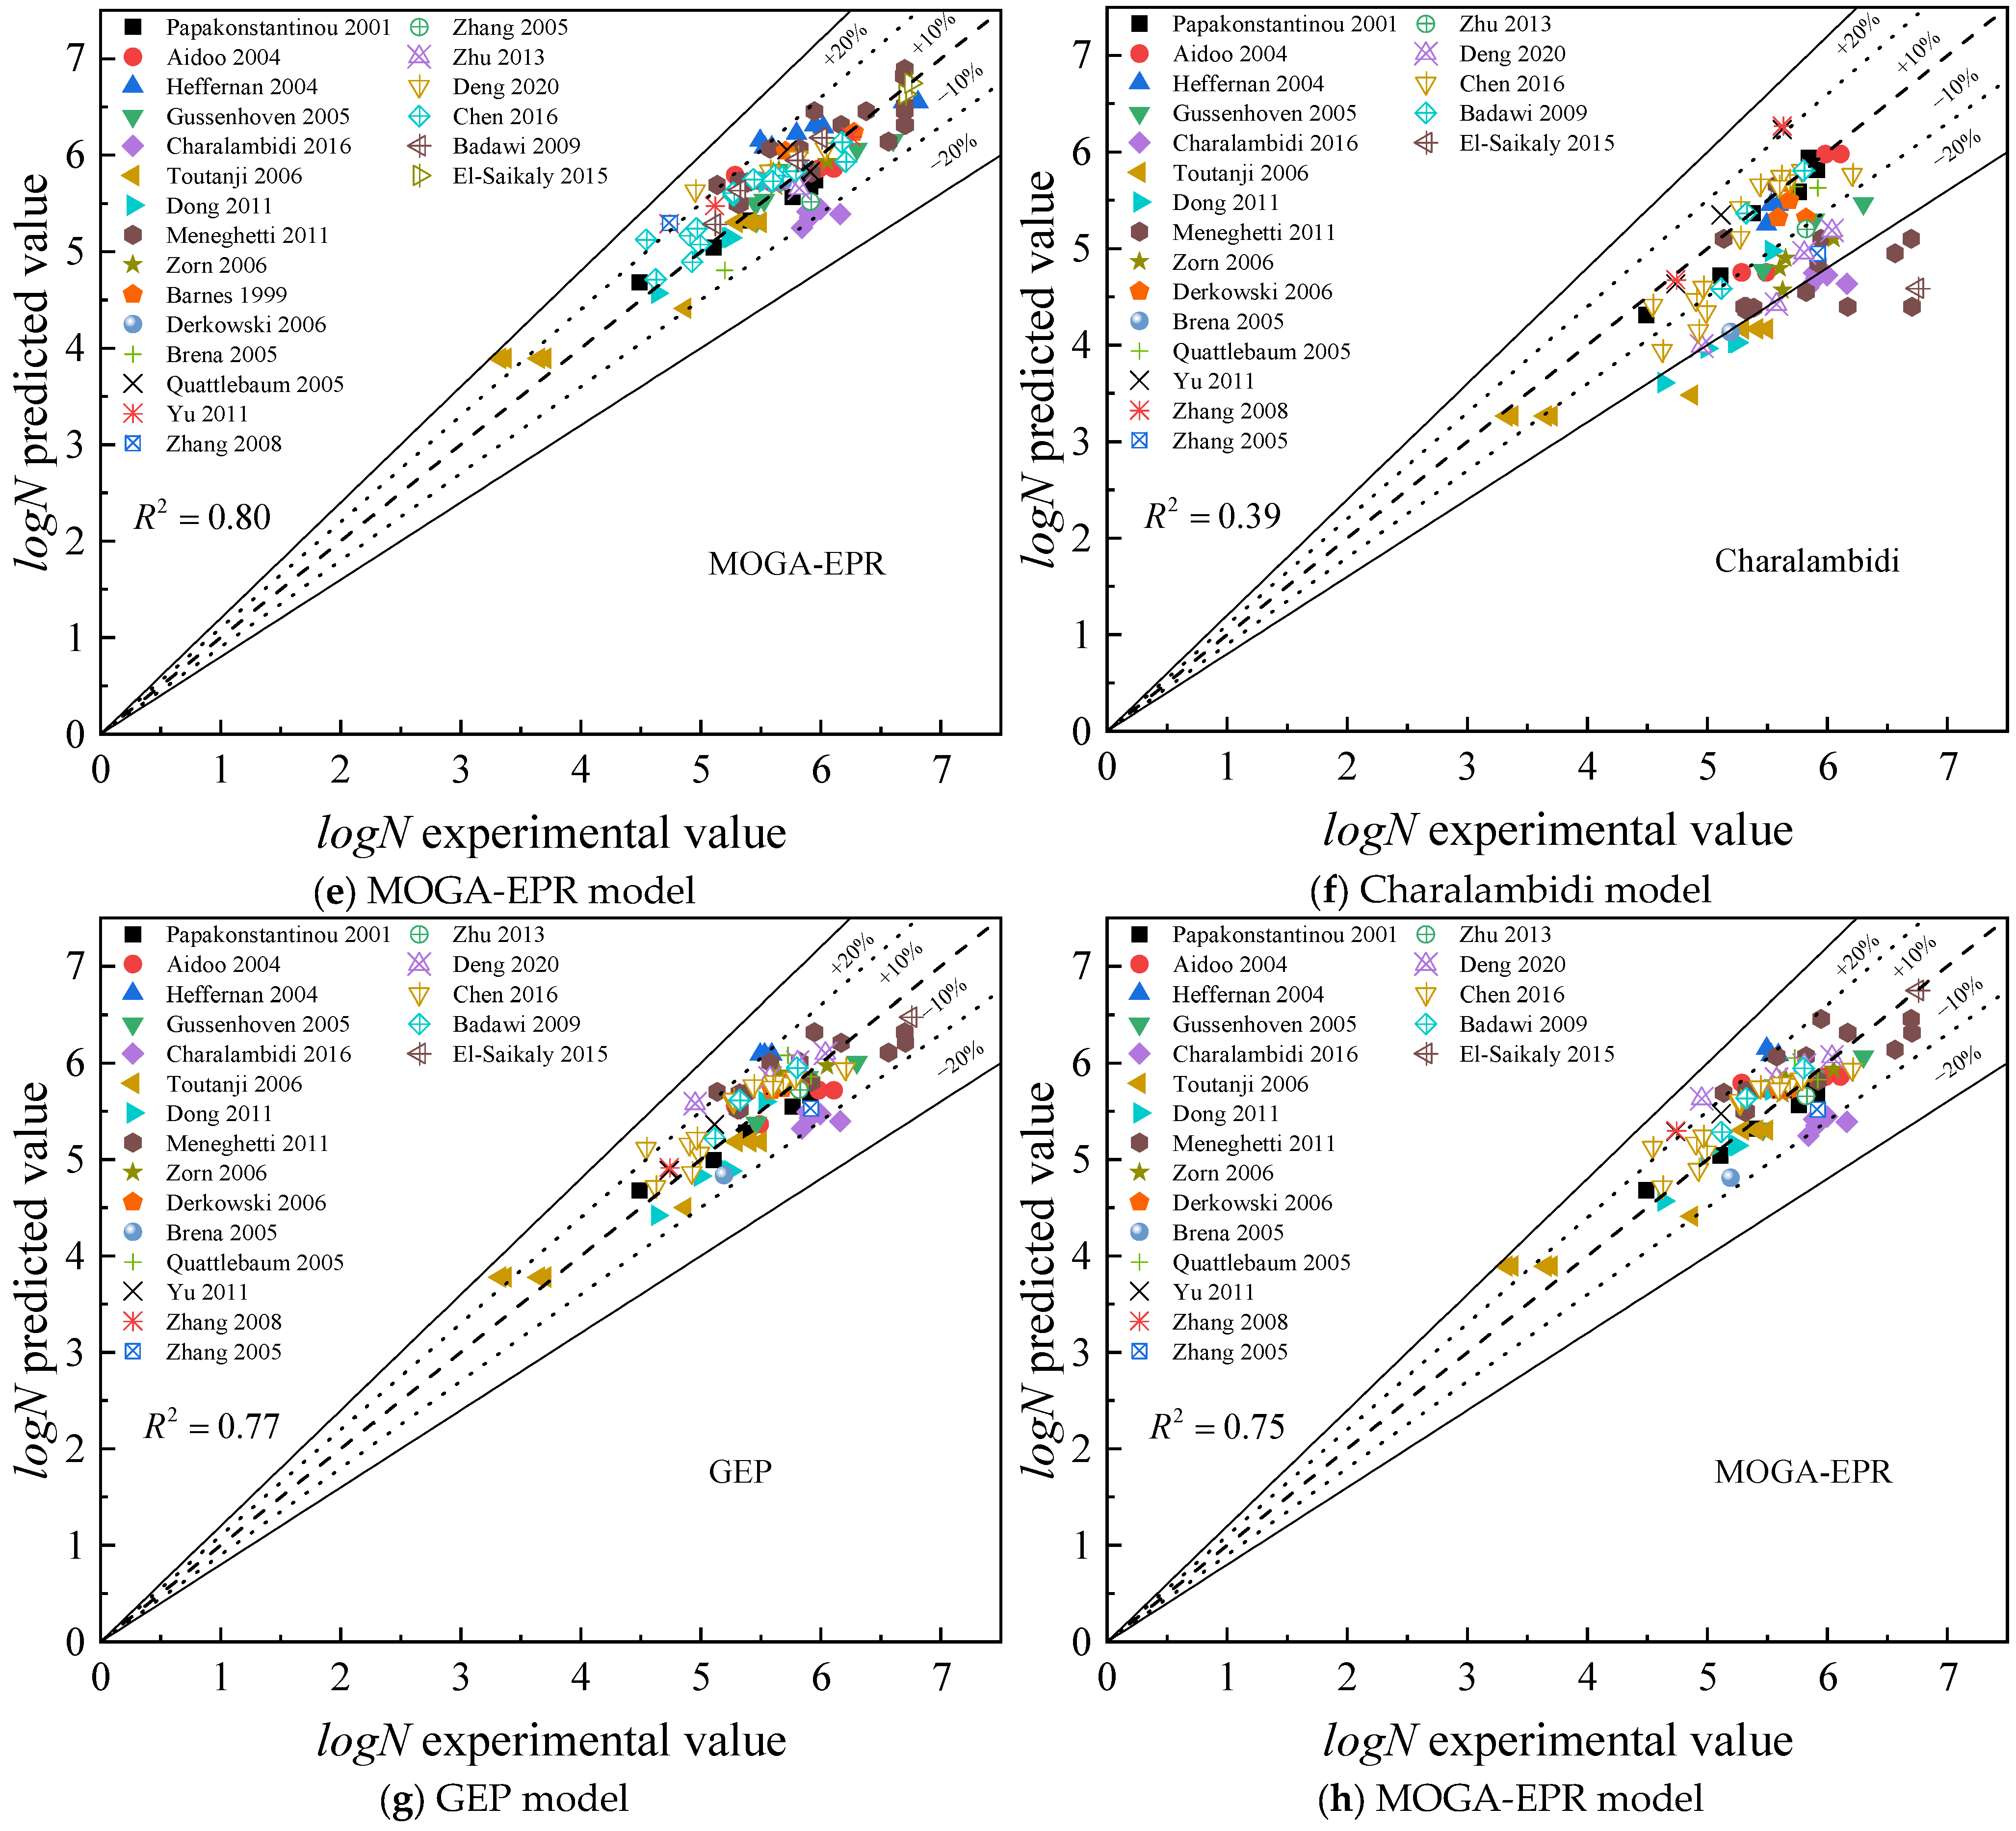
- Comparative analysis of GEP and MOGA-EPR models with existing models revealed that the coefficient of determination for existing models is significantly lower than that of the GEP and MOGA-EPR models, exhibiting lower mean absolute errors among other metrics. The comparison of the predictive values from the GEP and MOGA-EPR models with experimental values shows their high predictive accuracy. This demonstrates that the models developed in this study have significant advantages in capturing nonlinear relationships within the data and are highly applicable for predicting fatigue life.
- (4)
- The GEP model has a more succinct expression form than the MOGA-EPR model.
Author Contributions
Funding
Institutional Review Board Statement
Informed Consent Statement
Data Availability Statement
Conflicts of Interest
References
- D’Antino, T.; Carloni, C.; Sneed, L.; Pellegrino, C. Fatigue and post-fatigue behavior of PBO FRCM-concrete joints. Int. J. Fatigue 2015, 81, 91–104. [Google Scholar] [CrossRef]
- Rezazadeh, M. Innovative Methodologies for the Enhancement of the Flexural Strengthening Performance of NSM CFRP Technique for RC Beams; Universidade do Minho: Braga, Portugal, 2015. [Google Scholar]
- Khorasani, A.M.; Esfahani, M.R.; Sabzi, J. The effect of transverse and flexural reinforcement on deflection and cracking of GFRP bar reinforced concrete beams. Compos. Part B Eng. 2019, 161, 530–546. [Google Scholar] [CrossRef]
- Gattulli, V.; Lofrano, E.; Paolone, A.; Pirolli, G. Performances of FRP reinforcements on masonry buildings evaluated by fragility curves. Comput. Struct. 2017, 190, 150–161. [Google Scholar] [CrossRef]
- Aidoo, J.; Harries, K.A.; Petrou, M.F. Fatigue behavior of carbon fiber reinforced polymer-strengthened reinforced concrete bridge girders. J. Compos. Constr. 2004, 8, 501–509. [Google Scholar] [CrossRef]
- Barnes, R.A.; Mays, G.C. Fatigue performance of concrete beams strengthened with CFRP plates. J. Compos. Constr. 1999, 3, 63–72. [Google Scholar] [CrossRef]
- Shahawy, M.; Beitelman, T.E. Static and fatigue performance of RC beams strengthened with CFRP laminates. J. Struct. Eng. 1999, 125, 613–621. [Google Scholar] [CrossRef]
- Zhang, S.W.; Zhang, Q.L.; Wang, Y.Z. Study on fatigue performance of reinforced concrete beams strengthened with externally bonded aramid fiber reinforced plastics. Compos. Sci. Eng. 2005, 06, 8–11. [Google Scholar]
- Charalambidi, B.G.; Rousakis, T.C.; Karabinis, A.I. Analysis of the fatigue behavior of reinforced concrete beams strengthened in flexure with fiber reinforced polymer laminates. Compos. Part B Eng. 2016, 96, 69–78. [Google Scholar] [CrossRef]
- Papakonstantinou, C.G.; Petrou, M.F.; Harries, K.A. Fatigue behavior of RC beams strengthened with GFRP sheets. J. Compos. Constr. 2001, 5, 246–253. [Google Scholar] [CrossRef]
- Dong, Y.; Ansari, F.; Karbhari, V.M. Fatigue performance of reinforced concrete beams with externally bonded CFRP reinforcement. Struct. Infrastruct. Eng. 2011, 7, 229–241. [Google Scholar] [CrossRef]
- Sun, X.Y.; Wang, L.W.; Wang, H.L.; Zhang, Z.C. Experimentally confirmed fatigue performance prediction model for reinforced concrete flexural girder strengthened with Fiber-Reinforced Polymers. J. Zhejiang Univ. (Eng. Sci.) 2014, 48, 2230–2237. [Google Scholar]
- Al-Hamd, R.K.S.; Albostami, A.S.; Alzabeebee, S.; Al-Bander, B. An optimized prediction of FRP bars in concrete bond strength employing soft computing techniques. J. Build. Eng. 2024, 86, 108883. [Google Scholar] [CrossRef]
- Murad, Y.; Tarawneh, A.; Arar, F.; Al-Zu’bi, A.; Al-Ghwairi, A.; Al-Jaafreh, A.; Tarawneh, M. Flexural strength prediction for concrete beams reinforced with FRP bars using gene expression programming. Structures 2021, 33, 3163–3172. [Google Scholar] [CrossRef]
- Naderpour, H.; Kheyroddin, A.; Amiri, G.G. Prediction of FRP-confined compressive strength of concrete using artificial neural networks. Compos. Struct. 2010, 92, 2817–2829. [Google Scholar] [CrossRef]
- Zhang, R.L.; Xue, X.H. A predictive model for the bond strength of near-surface-mounted FRP bonded to concrete. Compos. Struct. 2021, 262, 113618. [Google Scholar] [CrossRef]
- Ferreira, C. Gene expression programming: A new adaptive algorithm for solving problems. arXiv 2001, arXiv:cs/0102027. [Google Scholar]
- Ferreira, C. Gene expression programming in problem solving. In Soft Computing and Industry: Recent Applications; Springer: Berlin/Heidelberg, Germany, 2002; pp. 635–653. [Google Scholar]
- Giustolisi, O.; Savic, D. Advances in data-driven analyses and modelling using EPR-MOGA. J. Hydroinformatics 2009, 11, 225–236. [Google Scholar] [CrossRef]
- Creaco, E.; Berardi, L.; Sun, S.; Giustolisi, O.; Savic, D. Selection of relevant input variables in storm water quality modeling by multiobjective evolutionary polynomial regression paradigm. Water Resour. Res. 2016, 52, 2403–2419. [Google Scholar] [CrossRef]
- Alzabeebee, S. Application of EPR-MOGA in computing the liquefaction-induced settlement of a building subjected to seismic shake. Eng. Comput. 2022, 38, 437–448. [Google Scholar] [CrossRef]
- Giustolisi, O.; Savic, D.A. A symbolic data-driven technique based on evolutionary polynomial regression. J. Hydroinformatics 2006, 8, 207–222. [Google Scholar] [CrossRef]
- Badawi, M.; Soudki, K. Fatigue behavior of RC beams strengthened with NSM CFRP rods. J. Compos. Constr. 2009, 13, 415–421. [Google Scholar] [CrossRef]
- Brena, S.F.; Benouaich, M.A.; Kreger, M.E.; Wood, S.L. Fatigue tests of reinforced concrete beams strengthened using carbon fiber-reinforced polymer composites. ACI Struct. J. 2005, 102, 305. [Google Scholar]
- Charalambidi, B.G.; Rousakis, T.C.; Karabinis, A.I. Fatigue behavior of large-scale reinforced concrete beams strengthened in flexure with fiber-reinforced polymer laminates. J. Compos. Constr. 2016, 20, 04016035. [Google Scholar] [CrossRef]
- Chen, C.; Cheng, L. Fatigue behavior and prediction of NSM CFRP-strengthened reinforced concrete beams. J. Compos. Constr. 2016, 20, 04016033. [Google Scholar] [CrossRef]
- Deng, L.; Liu, Y.; Liao, L.; Xie, H.; Huang, X.; Lai, S.; Zhong, M. Investigation of Flexural Fatigue Behavior of Concrete Beams Reinforced with Intelligent CFRP-OFBG Plates. Adv. Civ. Eng. 2020, 2020, 1062592. [Google Scholar] [CrossRef]
- Derkowski, W. Fatigue life of reinforced concrete beams under bending strengthened with composite materials. Arch. Civ. Mech. Eng. 2006, 6, 33–47. [Google Scholar] [CrossRef]
- El-Saikaly, G.; Chaallal, O. Extending the fatigue life of reinforced concrete T-beams strengthened in shear with externally bonded FRP: Upgrading versus repairing. J. Compos. Constr. 2015, 19, 04014027. [Google Scholar] [CrossRef]
- Gussenhoven, R.; Brena, S. Fatigue Behavior of Reinforced Concrete Beams Strengthened with Different FRP Laminate Configurations. In SP-230: 7th International Symposium on Fiber-Reinforced (FRP) Polymer Reinforcement for Concrete Structures; American Concrete Institute: Farmington Hills, MI, USA, 2005; Volume 230, pp. 613–630. [Google Scholar]
- Heffernan, P.; Erki, M. Fatigue behavior of reinforced concrete beams strengthened with carbon fiber reinforced plastic laminates. J. Compos. Constr. 2004, 8, 132–140. [Google Scholar] [CrossRef]
- Meneghetti, L.C.; Garcez, M.R.; Silva Filho, L.C.P.d.; Gastal, F.d.P.S.L. Fatigue life regression model of reinforced concrete beams strengthened with FRP. Mag. Concr. Res. 2011, 63, 539–549. [Google Scholar] [CrossRef]
- Quattlebaum, J.B.; Harries, K.A.; Petrou, M.F. Comparison of three flexural retrofit systems under monotonic and fatigue loads. J. Bridge Eng. 2005, 10, 731–740. [Google Scholar] [CrossRef]
- Toutanji, H.; Zhao, L.; Deng, Y.; Zhang, Y.; Balaguru, P. Cyclic behavior of RC beams strengthened with carbon fiber sheets bonded by inorganic matrix. J. Mater. Civ. Eng. 2006, 18, 28–35. [Google Scholar] [CrossRef]
- Yu, T.; Li, C.; Lei, J.; Zhang, H. Fatigue of concrete beams strengthened with glass-fiber composite under flexure. J. Compos. Constr. 2011, 15, 557–564. [Google Scholar] [CrossRef]
- Zhang, B.; Ai, J. Study on fatigue behavior of RC beam strengthened with advanced glass-fiber composites. Earthq. Eng. Eng. Dyn. 2008, 28, 108. [Google Scholar]
- Zhang, K.; Ye, L.; Yue, Q. Experimental study on flexural fatigue behavior of RC beams strengthened with prestressed CFRP sheets. Ind. Constr. 2005, 8, 13–19. [Google Scholar]
- Zorn, A.V. Effect of Adhesive Stiffness and CFRP Geometry on the Behavior of Externally Bonded CFRP Retrofit Measures Subject to Fatigue Loads; University of Pittsburgh: Pittsburgh, PA, USA, 2006. [Google Scholar]
- Zhu, Q.; Wu, H.; Su, H. The fatigue experimental research on CFRP strengthened reinforced concrete beam. Shanxi Archit. 2013, 39, 19–21. [Google Scholar]


| Parameter | Max | Min | Average | Median | Standard Deviation |
|---|---|---|---|---|---|
| As (mm2) | 1962.50 | 100 | 429.20 | 339.30 | 380 |
| ks (kN) | 392,500 | 20,100 | 85,845.70 | 67,860 | 76,185 |
| Ef (GPa) | 294 | 20.63 | 111.37 | 77.90 | 71.27 |
| Af (mm2) | 390 | 7.80 | 99.13 | 71.20 | 98.60 |
| kf (kN) | 46,295 | 408.90 | 10,348.77 | 9438.40 | 9657.80 |
| f’c (MPa) | 50 | 15.8 | 34.5 | 35 | 7.57 |
| fy (MPa) | 608 | 335 | 472 | 440 | 74.10 |
| σmax (MPa) | 625.43 | 176 | 362 | 339 | 95.2 |
| σr (MPa) | 541.7 | 67.50 | 287.1 | 268 | 93.5 |
| σr/fy | 1.15 | 0.12 | 0.62 | 0.59 | 0.22 |
| σmax/fy | 1.33 | 0.44 | 0.78 | 0.74 | 0.21 |
| k | 1.37 | 1 | 1.13 | 1.11 | 0.09 |
| logN | 6.80 | 3.33 | 5.63 | 5.63 | 0.68 |
| Parameters | Parameters Setting |
|---|---|
| Number of genes | 3 |
| Number of chromosomes | 30 |
| Head length | 7 |
| Connection function | + |
| Mutation probability | 0.00138 |
| Permutation probability | 0.00546 |
| One-point recombination probability | 0.0027 |
| Two-point recombination probability | 0.0027 |
| Gene recombination probability | 0.0027 |
| Gene transposition probability | 0.0027 |
| Constant numbers | 10 |
| Model | Input Parameters | R2 | RMSE | MAE | RRSE | MAPE (%) |
|---|---|---|---|---|---|---|
| 1 | 0.69 | 0.38 | 0.32 | 0.56 | 5.7 | |
| 2 | 0.72 | 0.36 | 0.29 | 0.53 | 5.2 | |
| 3 | 0.75 | 0.34 | 0.28 | 0.50 | 5.2 | |
| 4 | 0.72 | 0.36 | 0.28 | 0.53 | 5.3 | |
| 5 | 0.80 | 0.30 | 0.26 | 0.45 | 4.7 |
| Reference | Fatigue Life Prediction Model |
|---|---|
| Papakonstantinu [10] (2001) | |
| Dong [11] (2011) | |
| Sun [12] (2014) | |
| Charalambidi [9] (2016) |
| Statistical Indicators | R2 | RMSE | MAE | RRSE | MAPE (%) |
|---|---|---|---|---|---|
| Papakonstantinou [10] | 0.69 | 0.81 | 0.72 | 1.20 | 12.4 |
| Dong [11] | 0.69 | 0.41 | 0.31 | 0.60 | 5.8 |
| Sun [12] | 0.6 | 1.24 | 0.95 | 1.84 | 18.3 |
| Charalambidi [9] | 0.39 | 0.85 | 0.65 | 1.32 | 11.7 |
| GEP | 0.80 | 0.30 | 0.26 | 0.45 | 4.7 |
| MOGA-EPR | 0.80 | 0.31 | 0.25 | 0.46 | 4.7 |
Disclaimer/Publisher’s Note: The statements, opinions and data contained in all publications are solely those of the individual author(s) and contributor(s) and not of MDPI and/or the editor(s). MDPI and/or the editor(s) disclaim responsibility for any injury to people or property resulting from any ideas, methods, instructions or products referred to in the content. |
© 2025 by the authors. Licensee MDPI, Basel, Switzerland. This article is an open access article distributed under the terms and conditions of the Creative Commons Attribution (CC BY) license (https://creativecommons.org/licenses/by/4.0/).
Share and Cite
Zhang, Z.; Wang, X. Fatigue Life Prediction of FRP-Strengthened Reinforced Concrete Beams Based on Soft Computing Techniques. Materials 2025, 18, 230. https://doi.org/10.3390/ma18020230
Zhang Z, Wang X. Fatigue Life Prediction of FRP-Strengthened Reinforced Concrete Beams Based on Soft Computing Techniques. Materials. 2025; 18(2):230. https://doi.org/10.3390/ma18020230
Chicago/Turabian StyleZhang, Zhimei, and Xiaobo Wang. 2025. "Fatigue Life Prediction of FRP-Strengthened Reinforced Concrete Beams Based on Soft Computing Techniques" Materials 18, no. 2: 230. https://doi.org/10.3390/ma18020230
APA StyleZhang, Z., & Wang, X. (2025). Fatigue Life Prediction of FRP-Strengthened Reinforced Concrete Beams Based on Soft Computing Techniques. Materials, 18(2), 230. https://doi.org/10.3390/ma18020230