
Effect of Inert Gas Cover on the Static and Fatigue Behavior of AA6061-T6 Aluminum Alloy Friction Stir Spot Lap-Shear Welds


Abstract
:1. Introduction
2. Materials and Methods
3. Results and Discussion
3.1. Micrograph
3.2. EDS Quantification
3.3. Micro-Hardness
3.4. Static Strength
3.5. Fatigue Behavior Under Cyclic Loading Conditions
3.5.1. Fatigue Strength
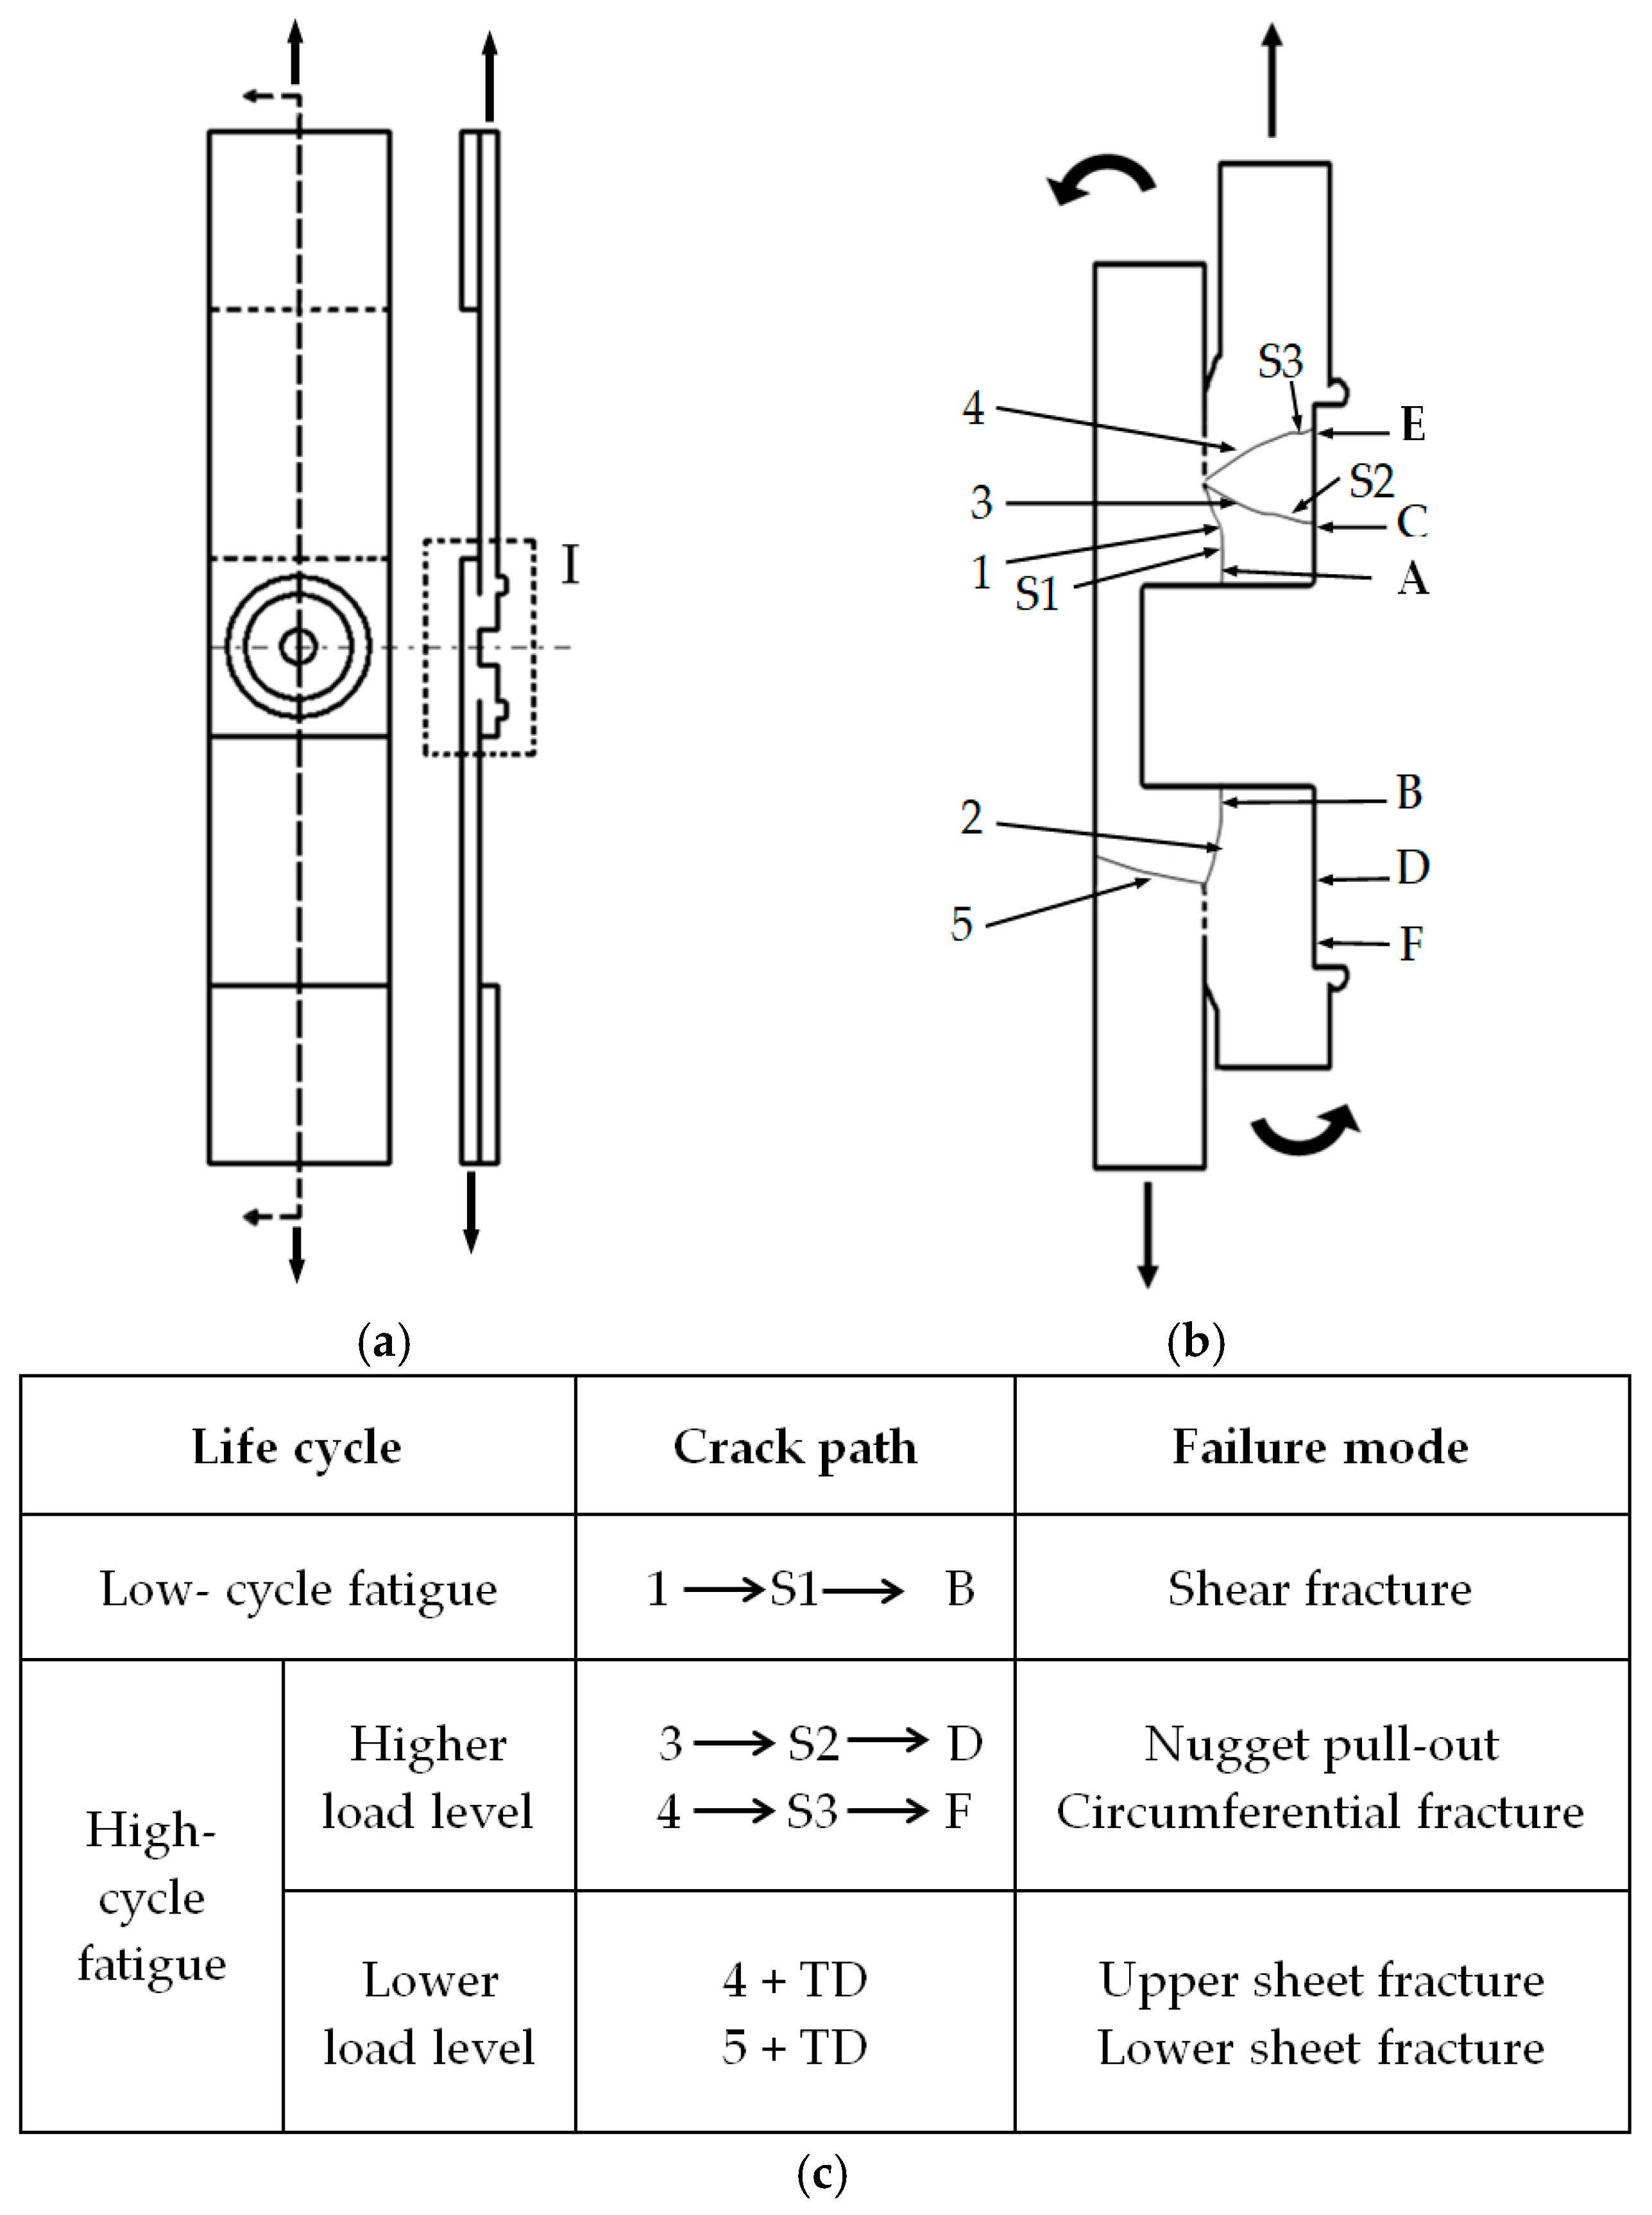
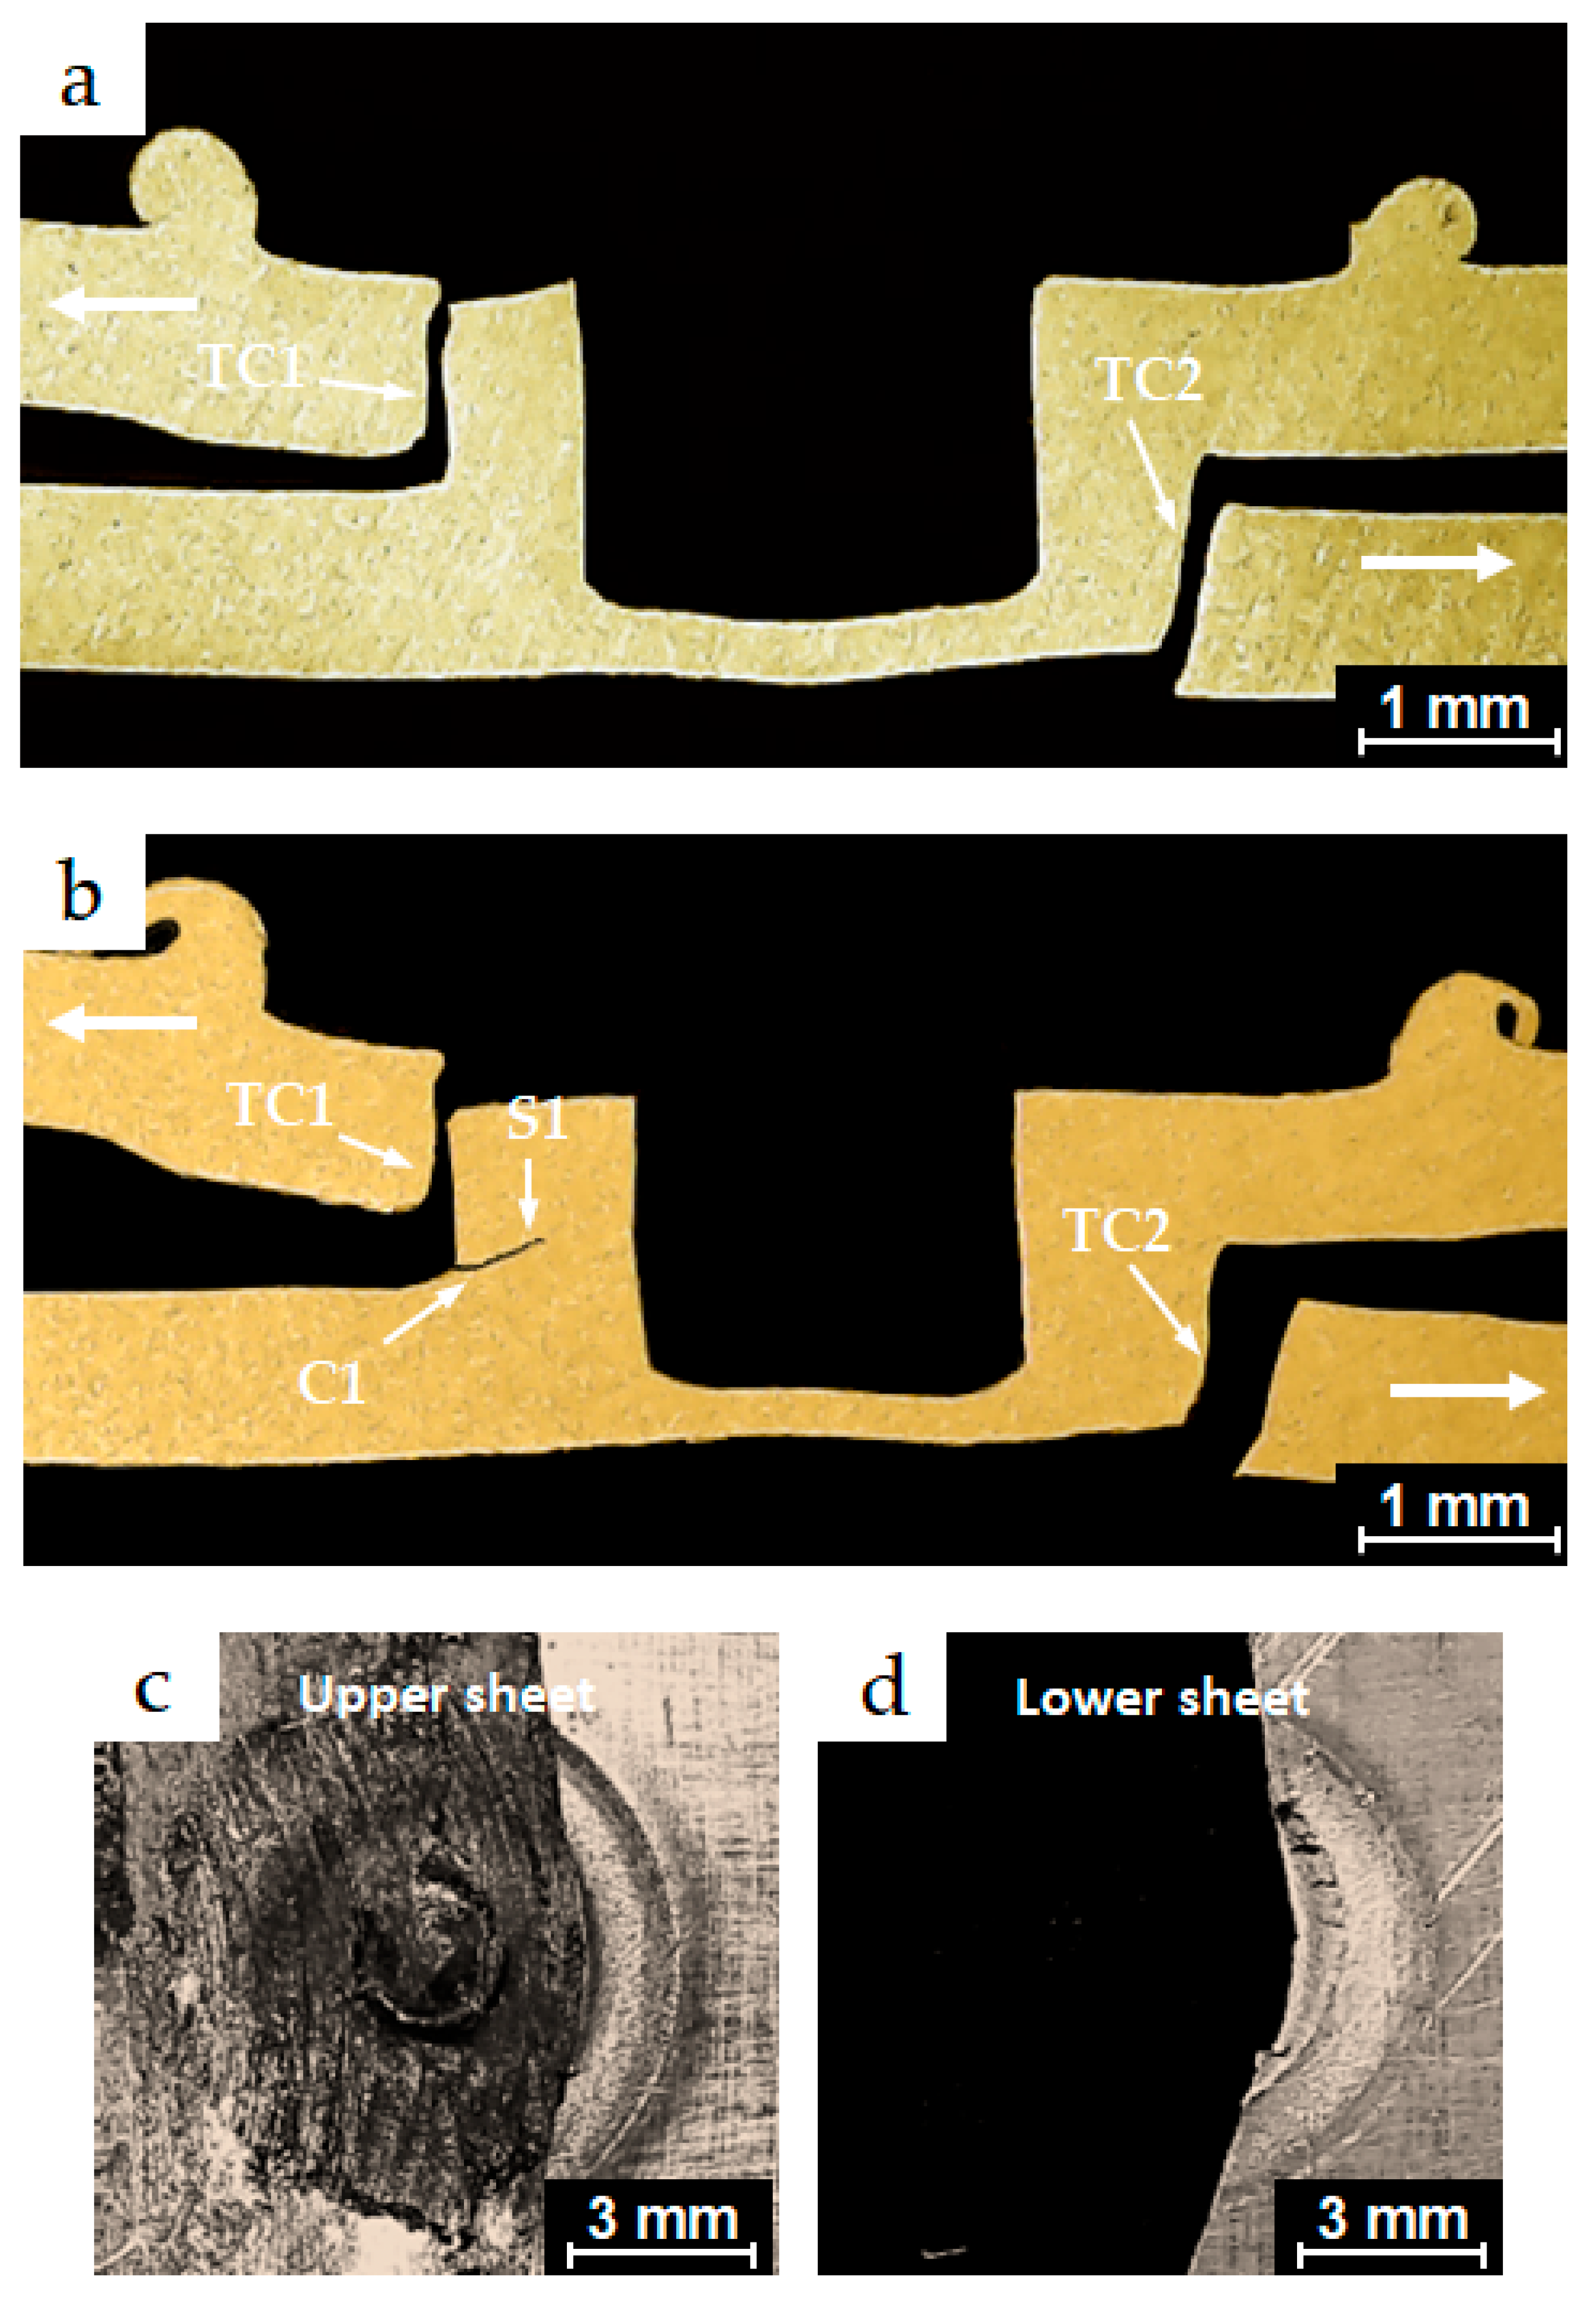
3.5.2. Failure Mechanism General Overview
3.5.3. Failure Modes
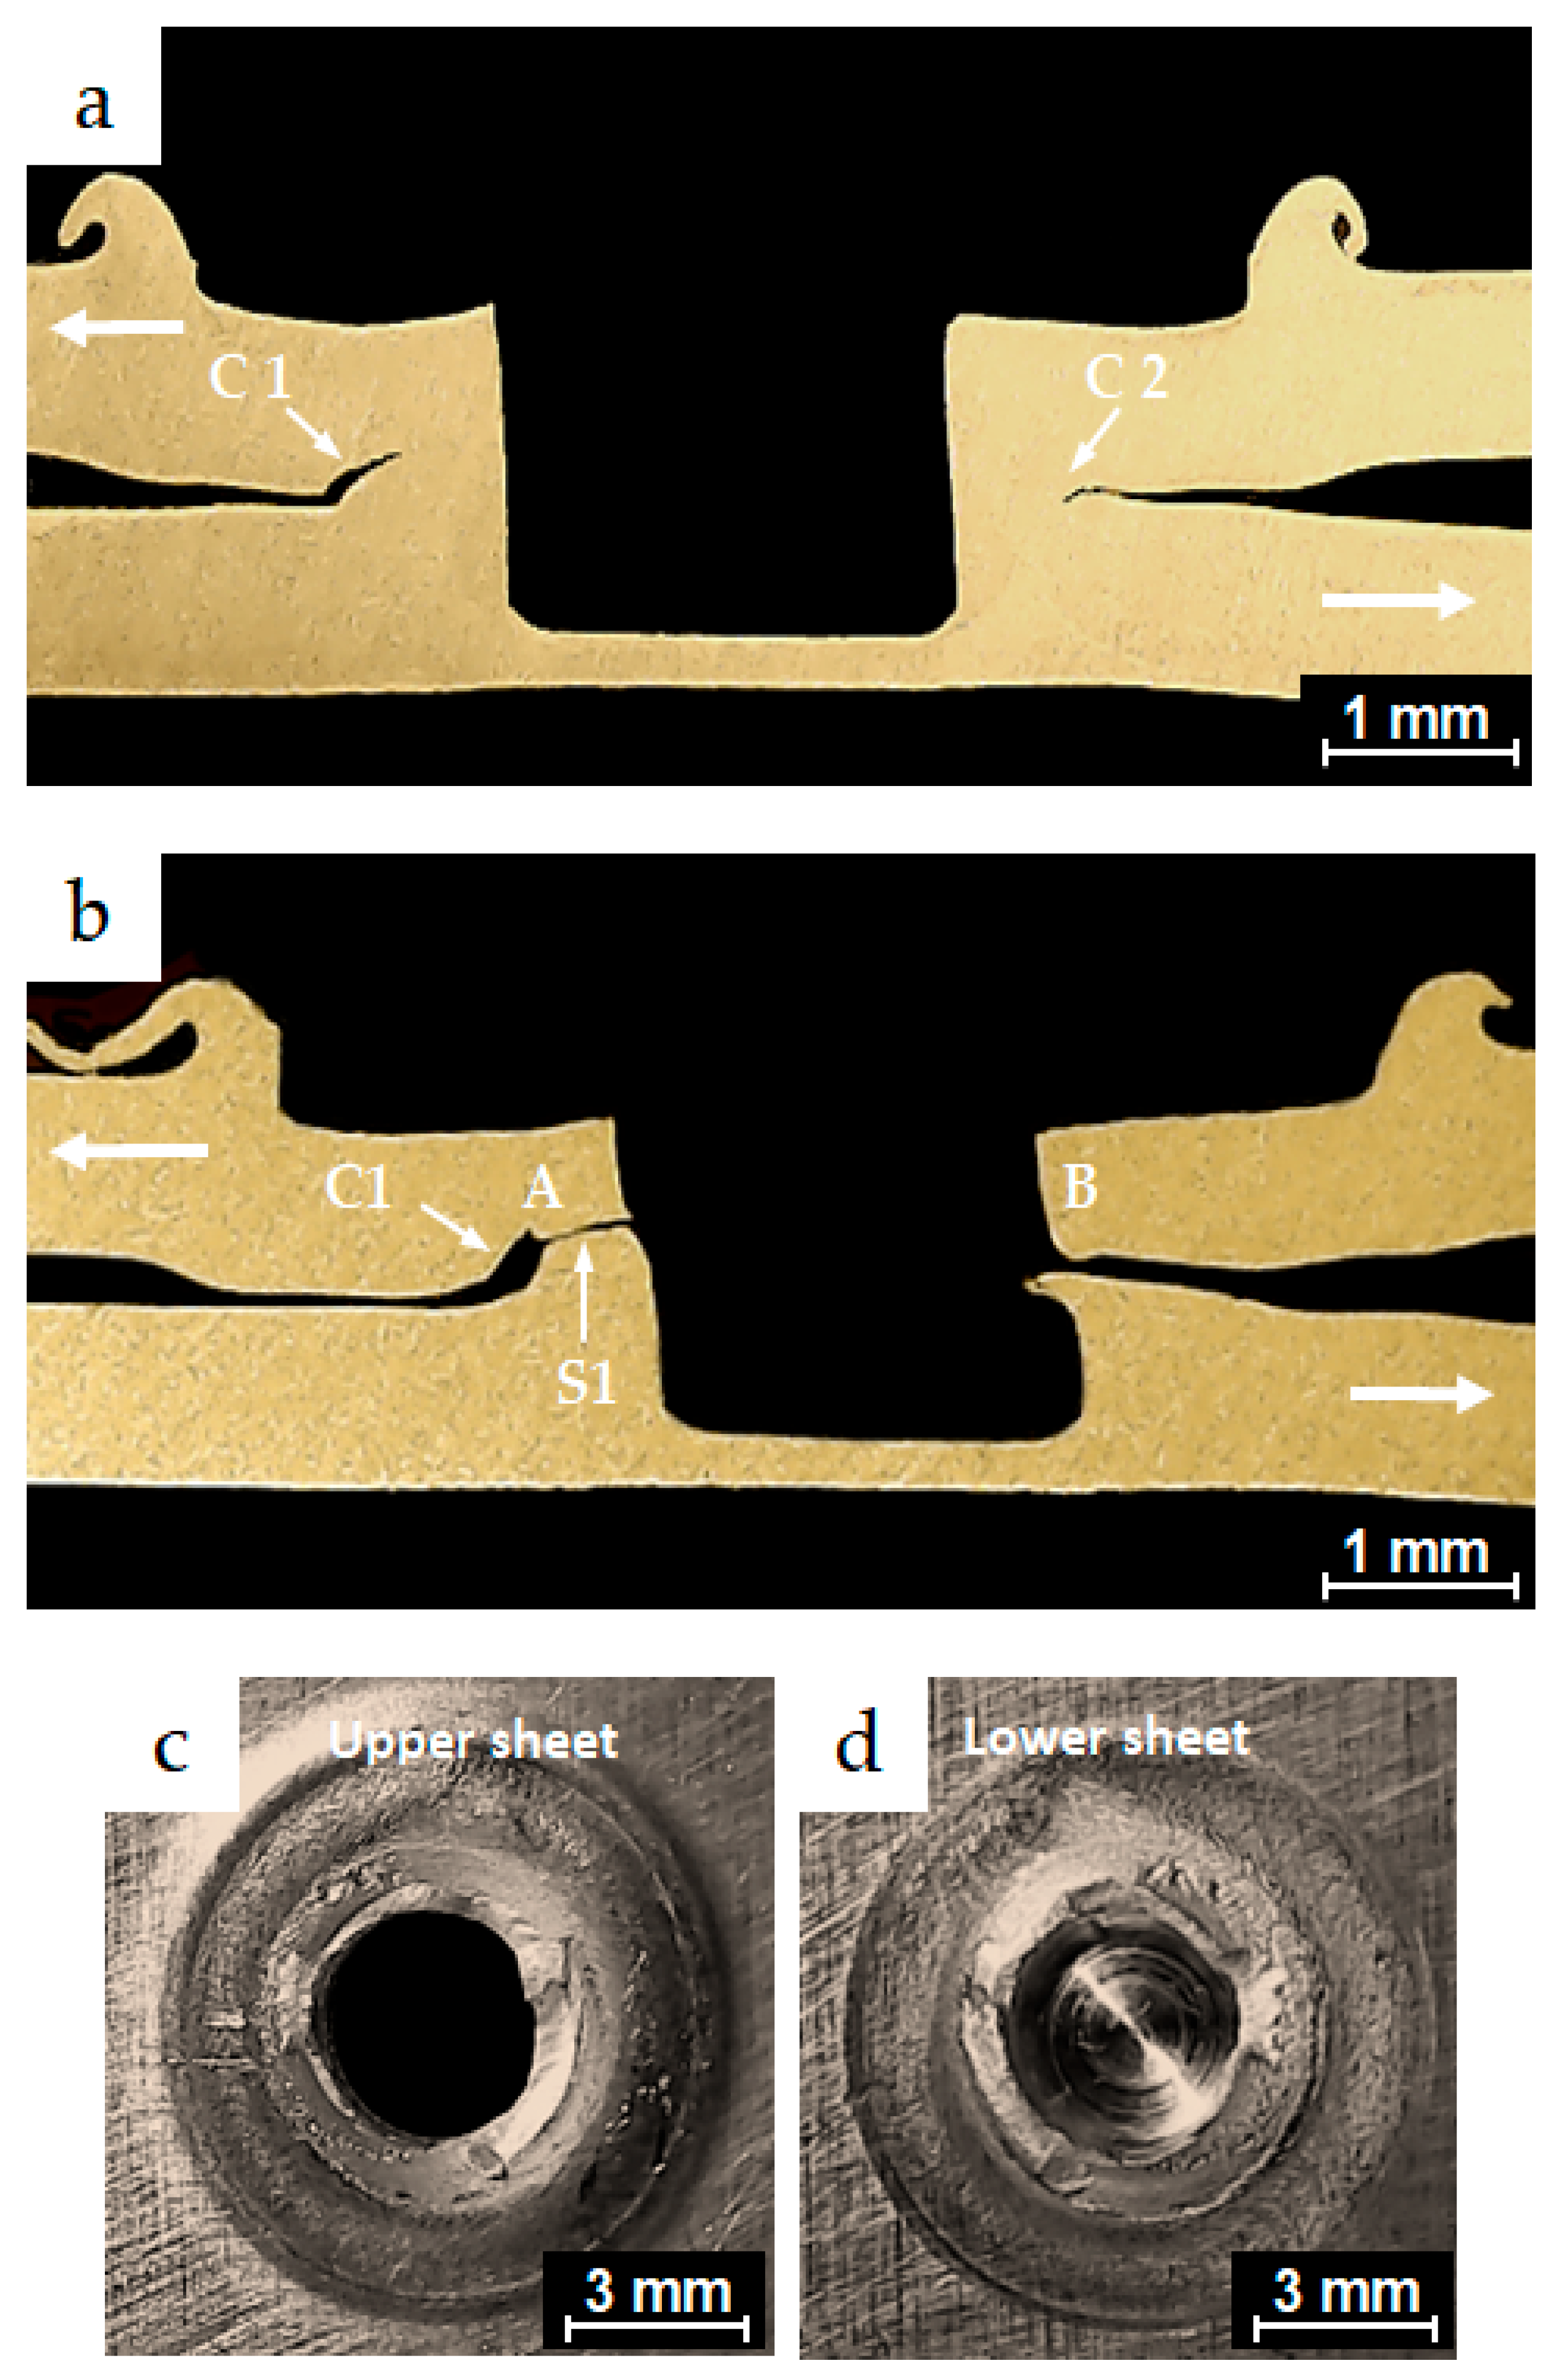
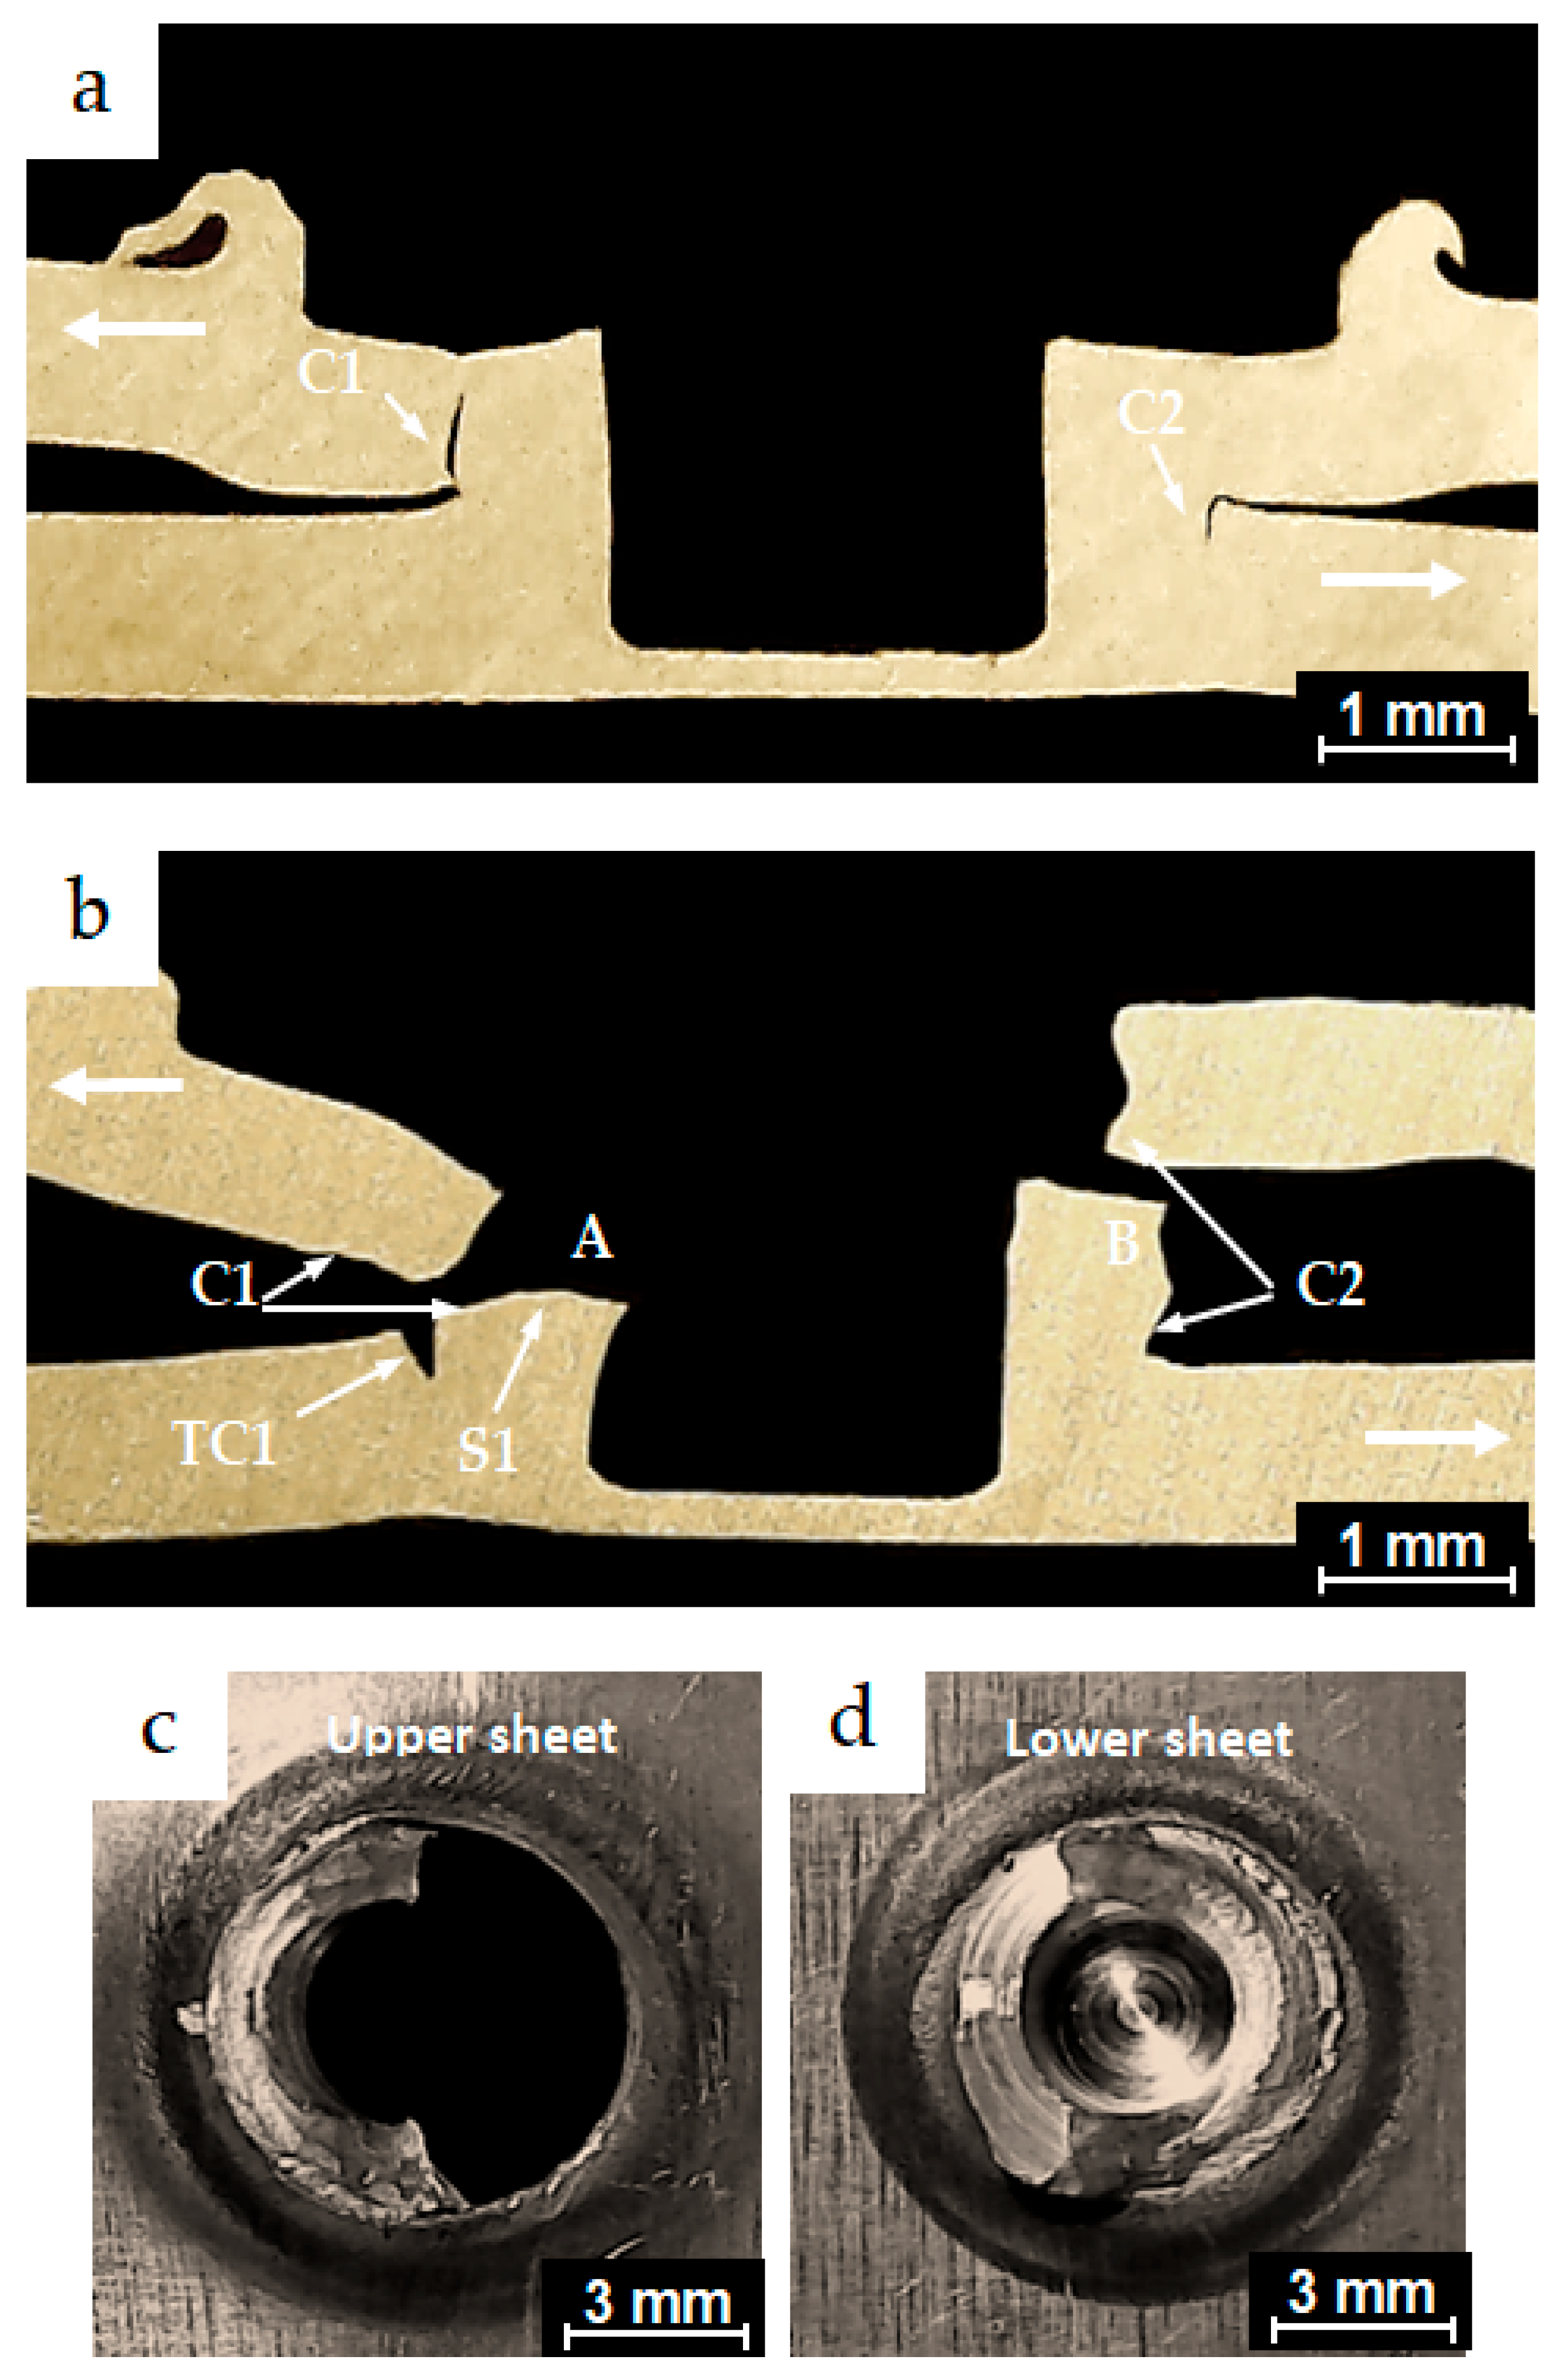
3.5.4. Failure Modes Under Low-Cycle Fatigue Conditions
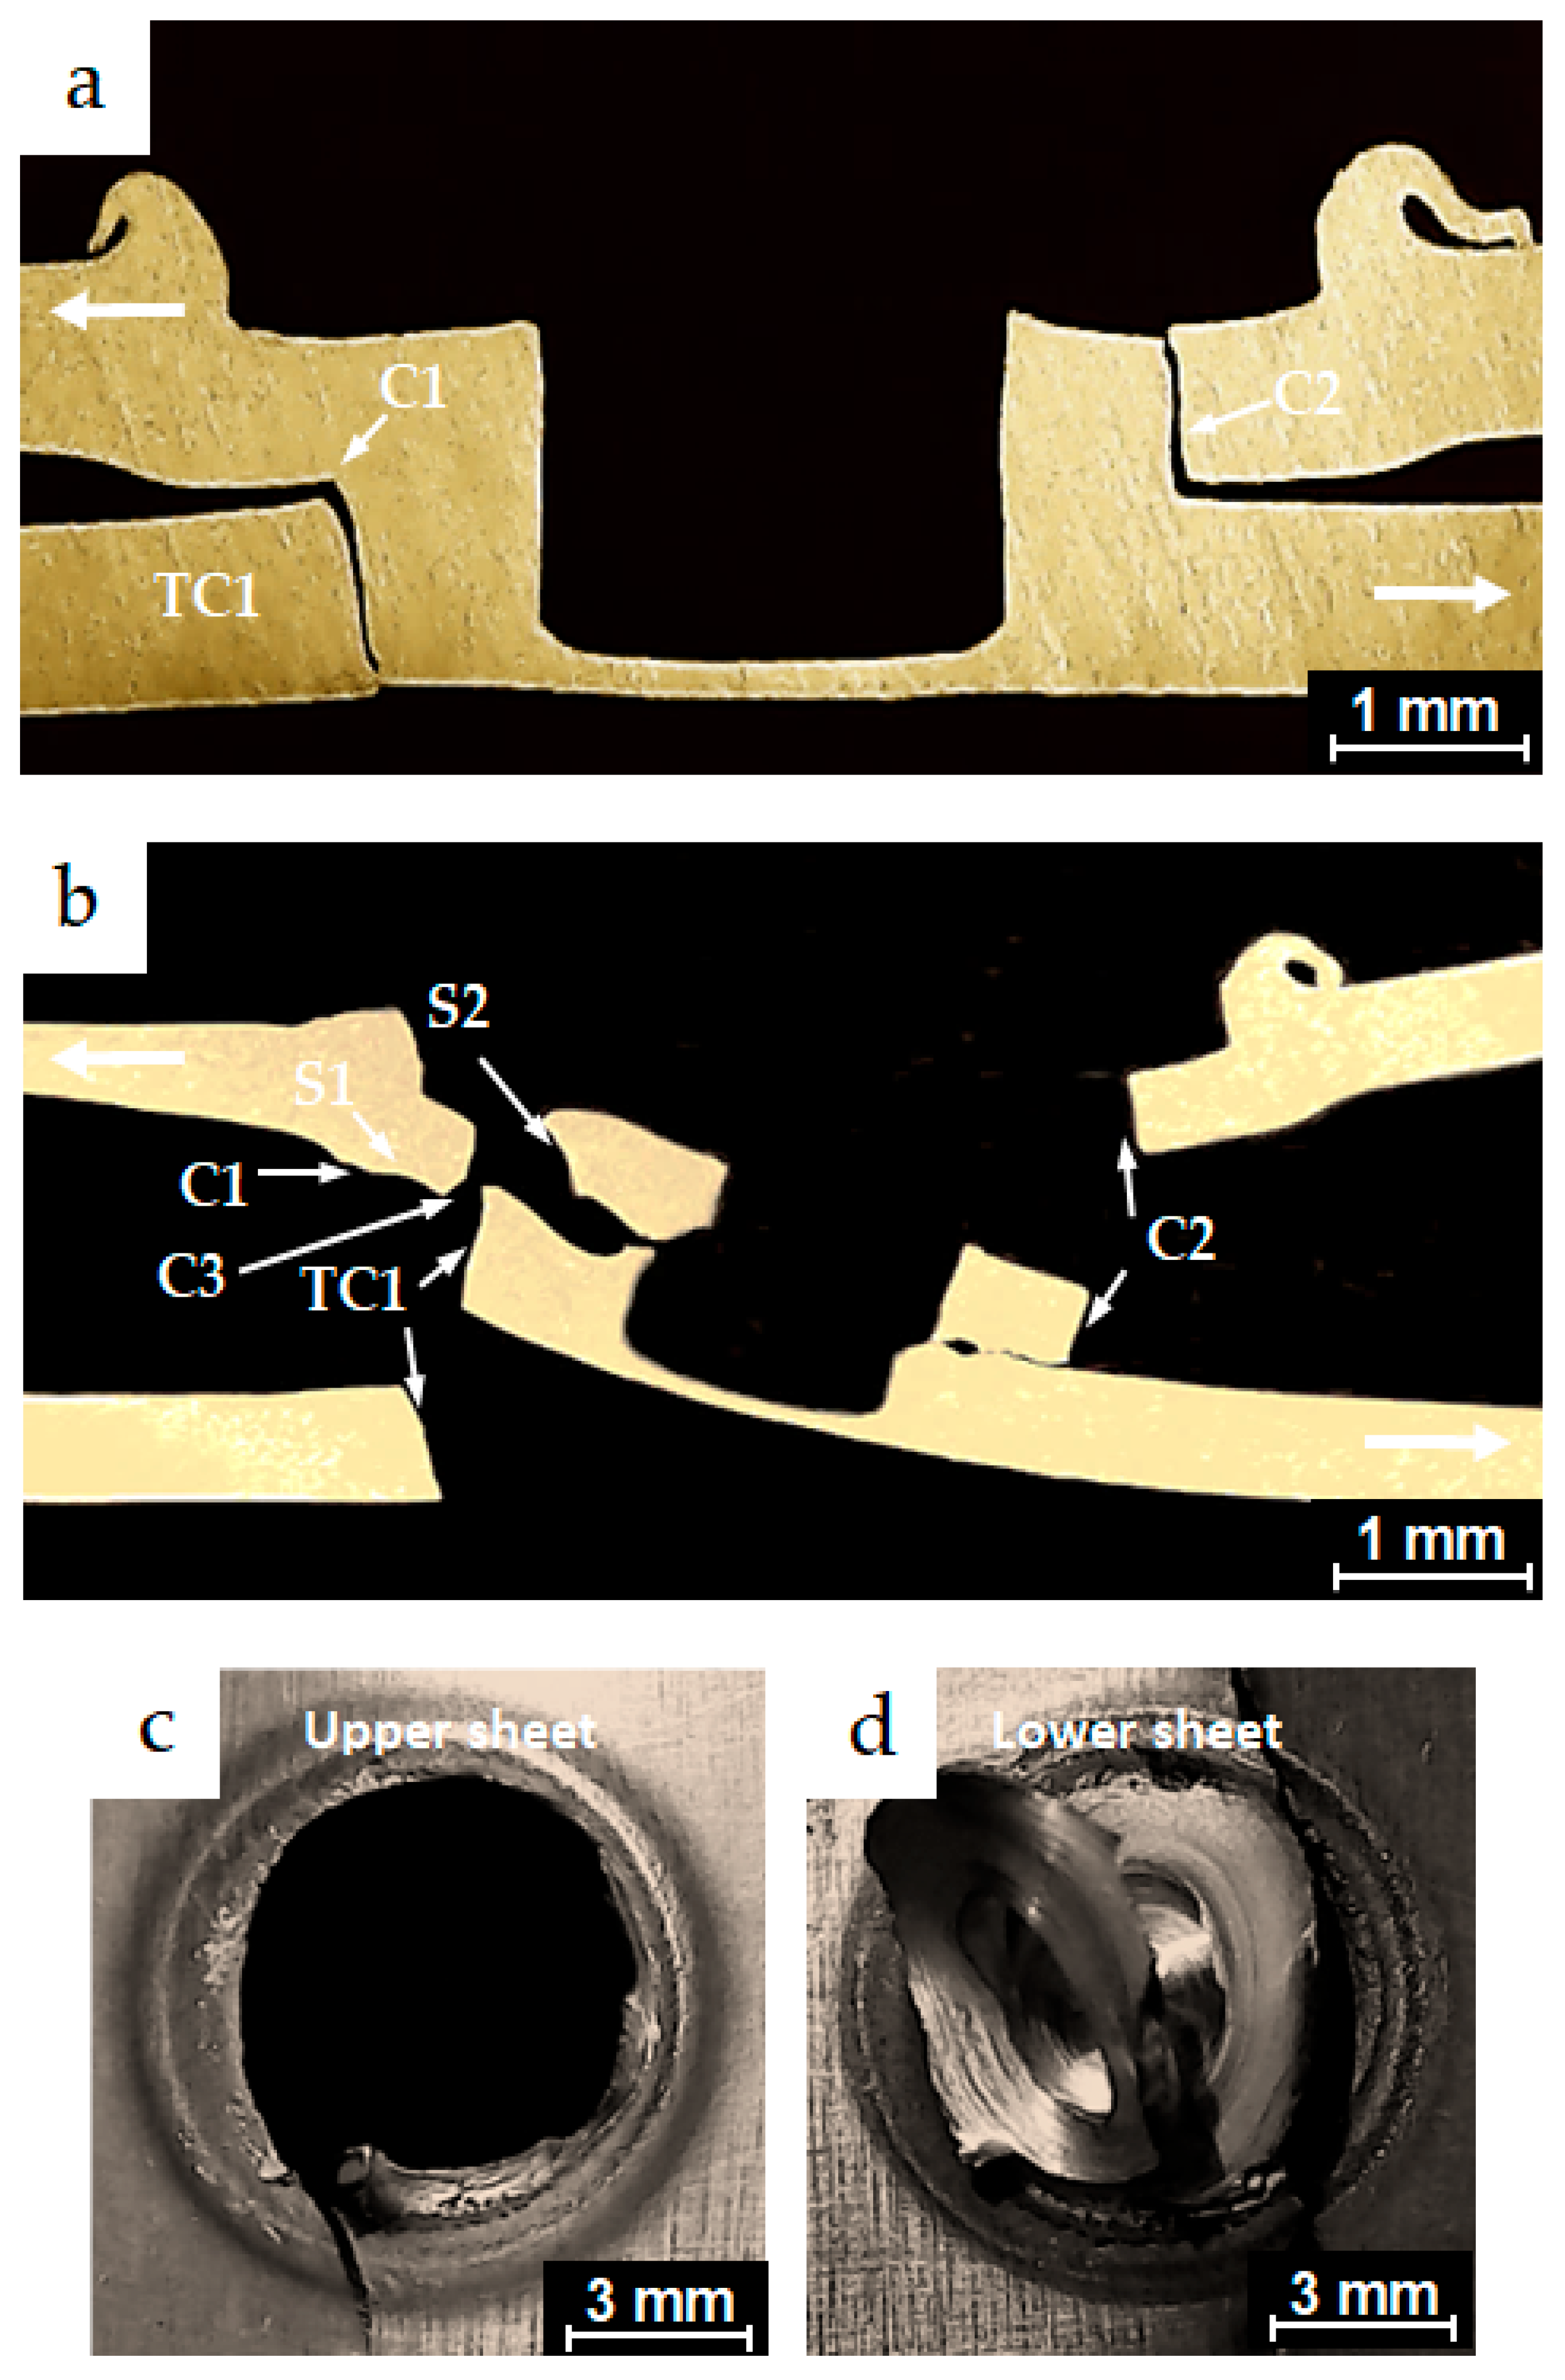
3.5.5. Failure Modes Under High-Cycle Fatigue Conditions
4. Conclusions
- (1)
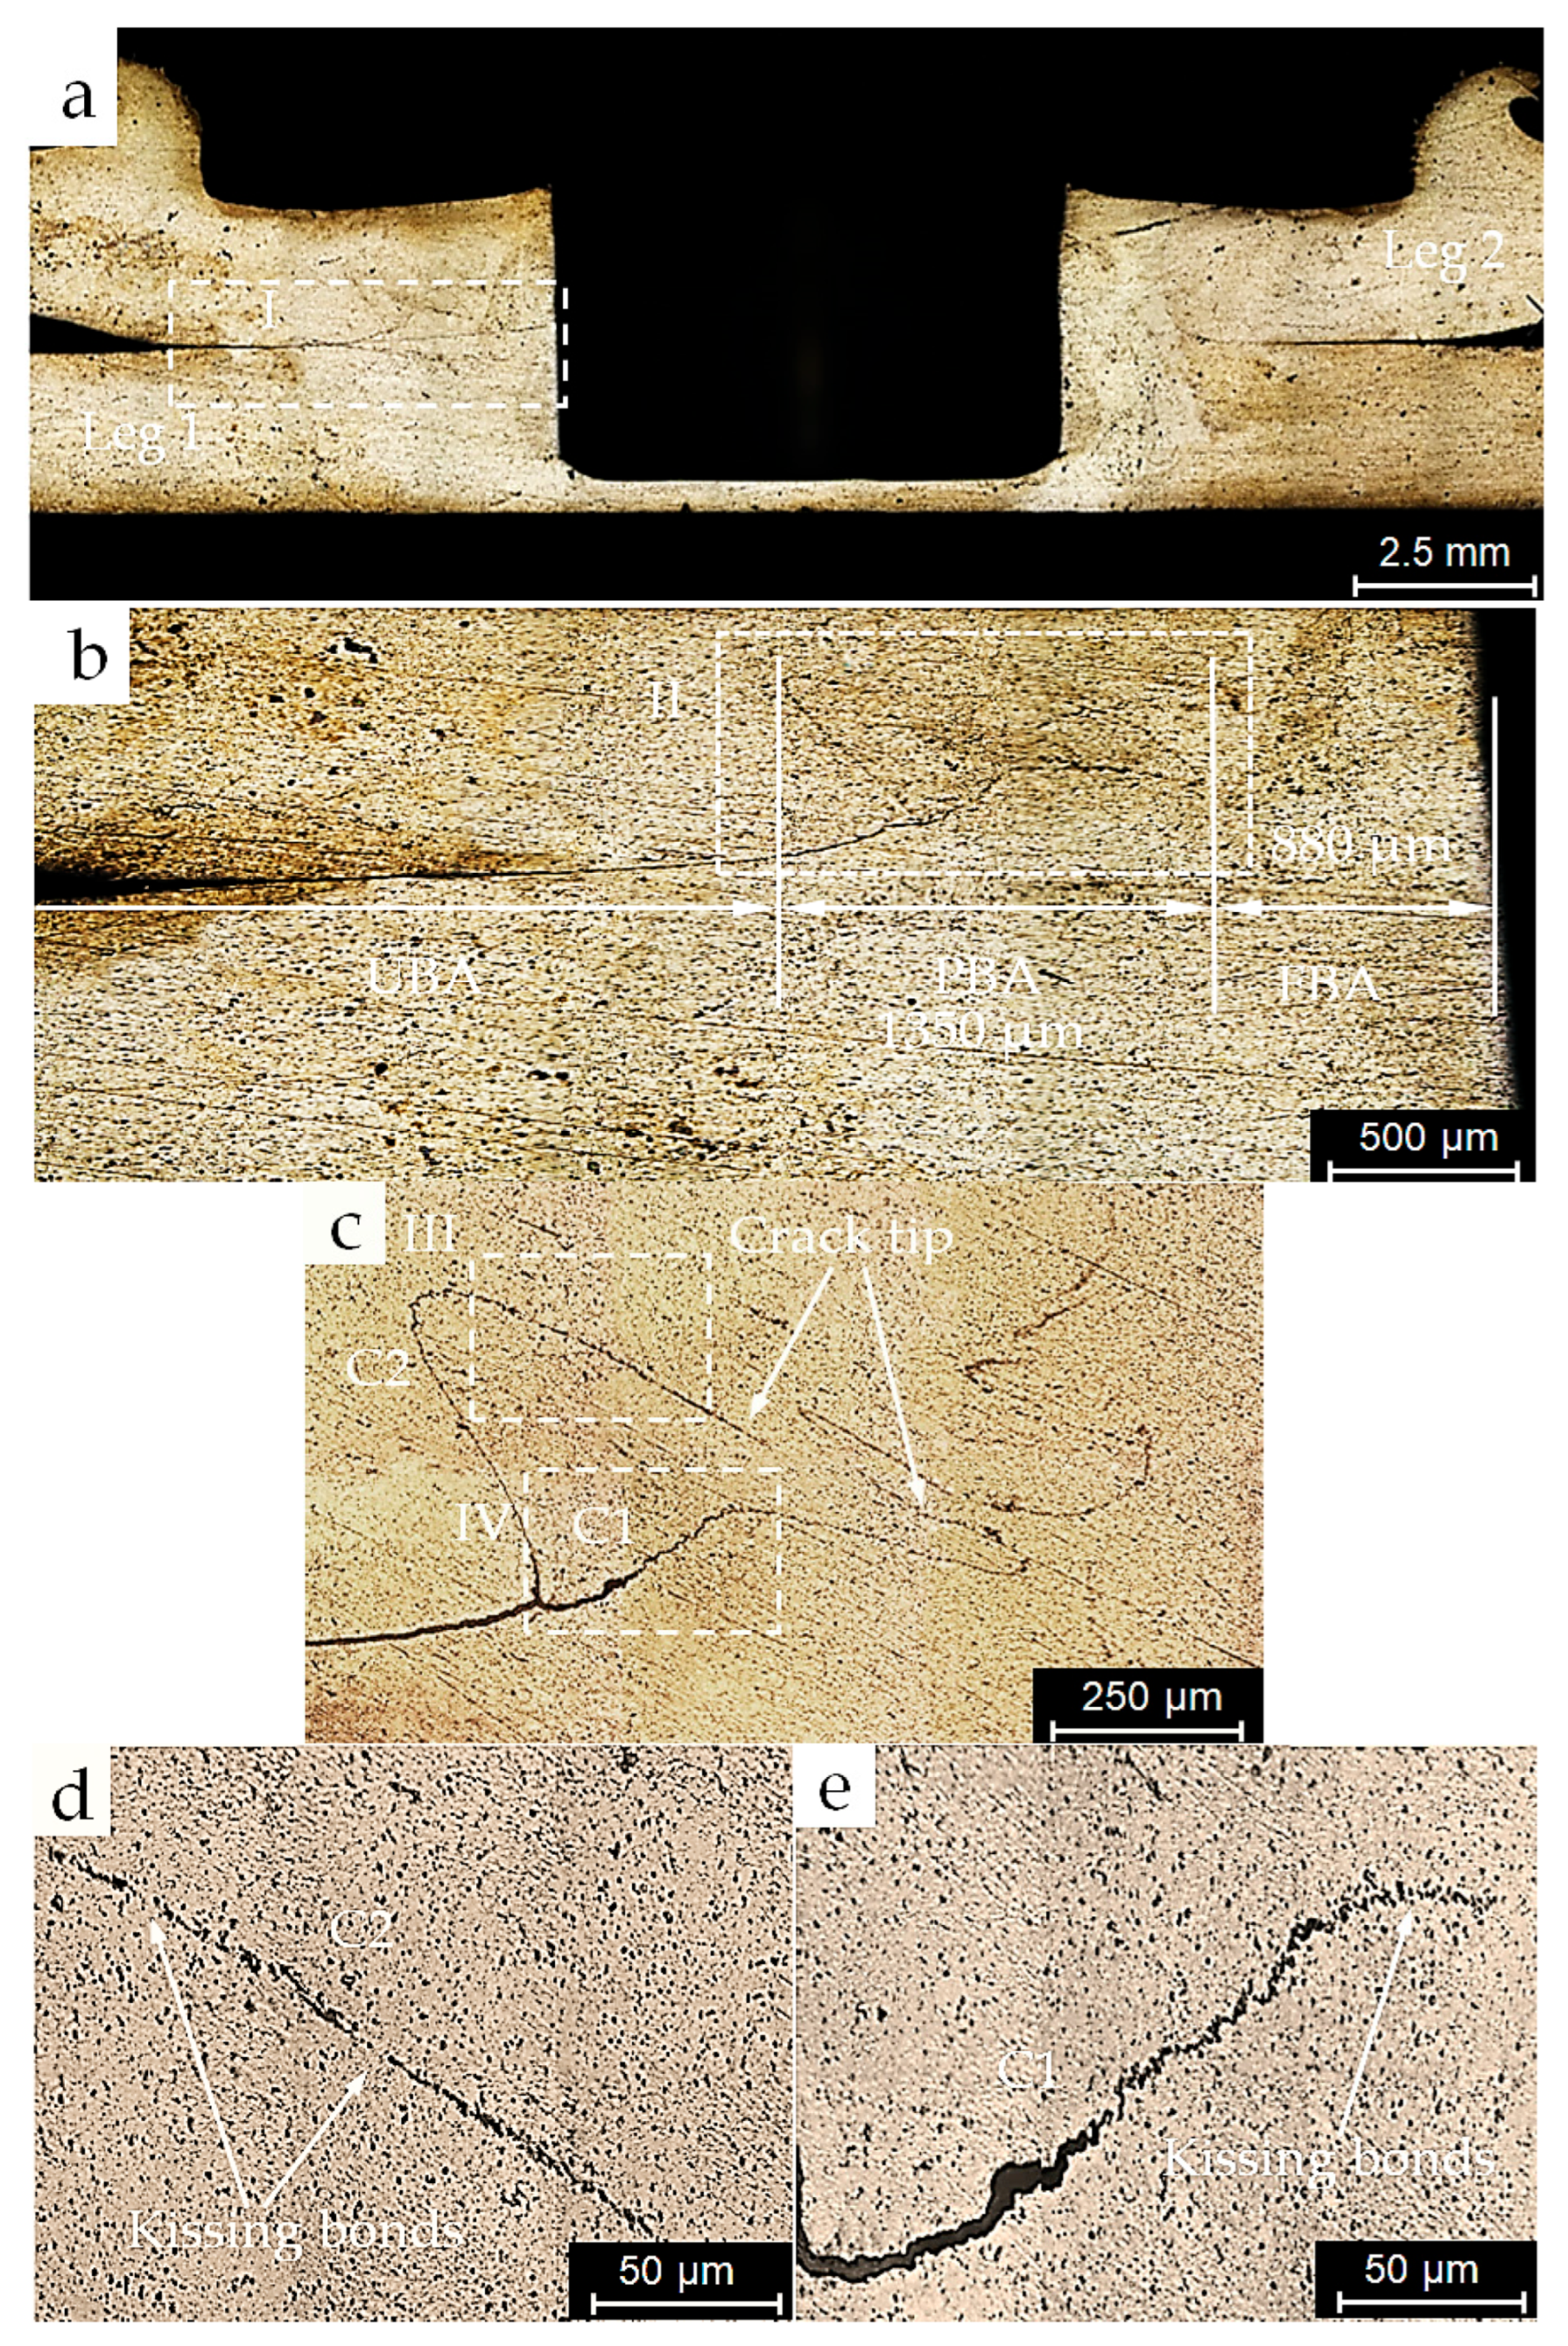
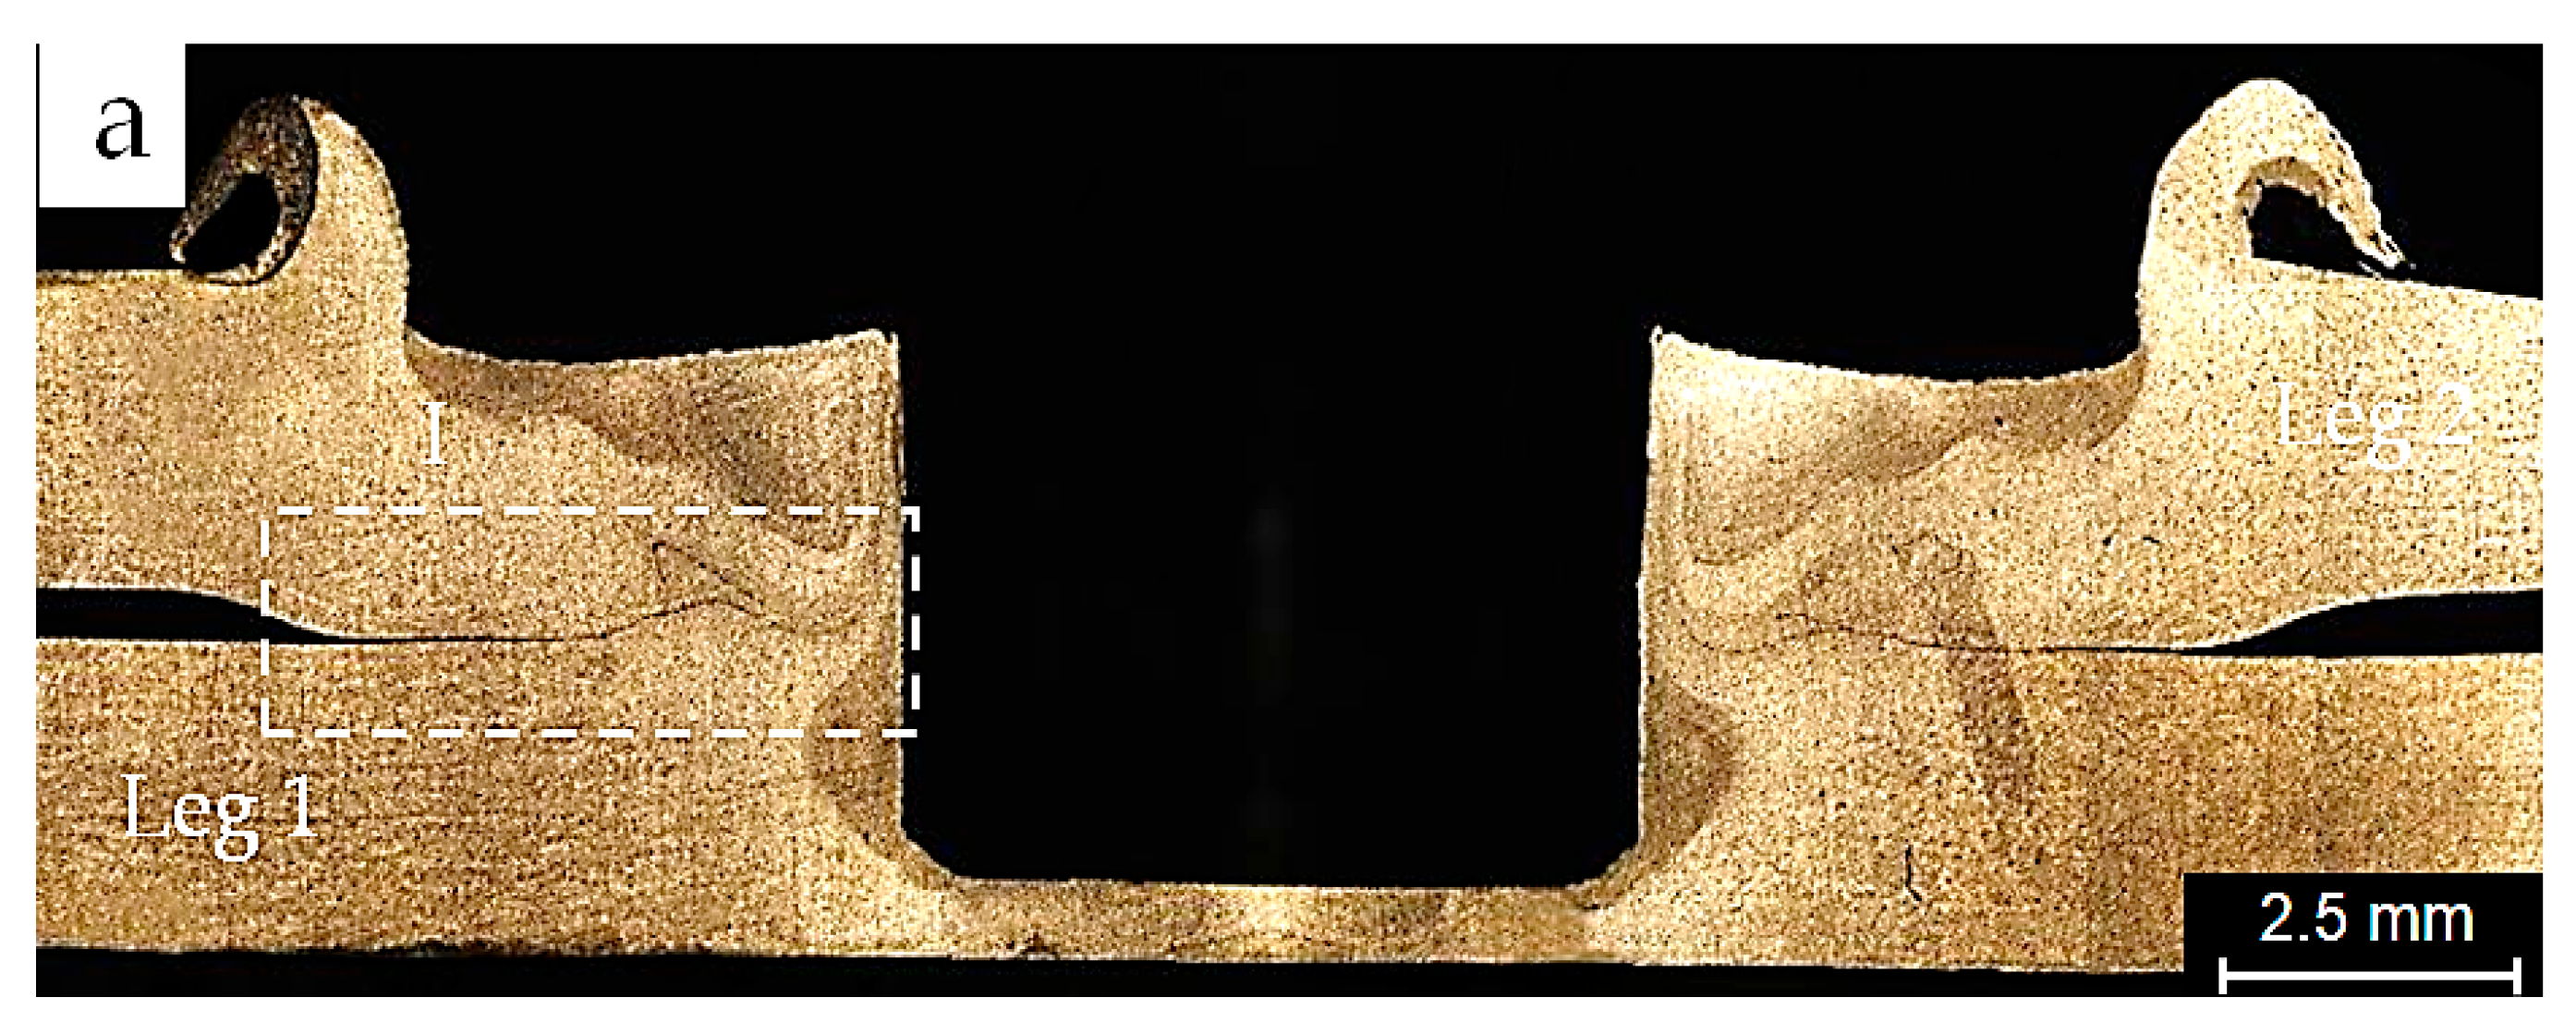
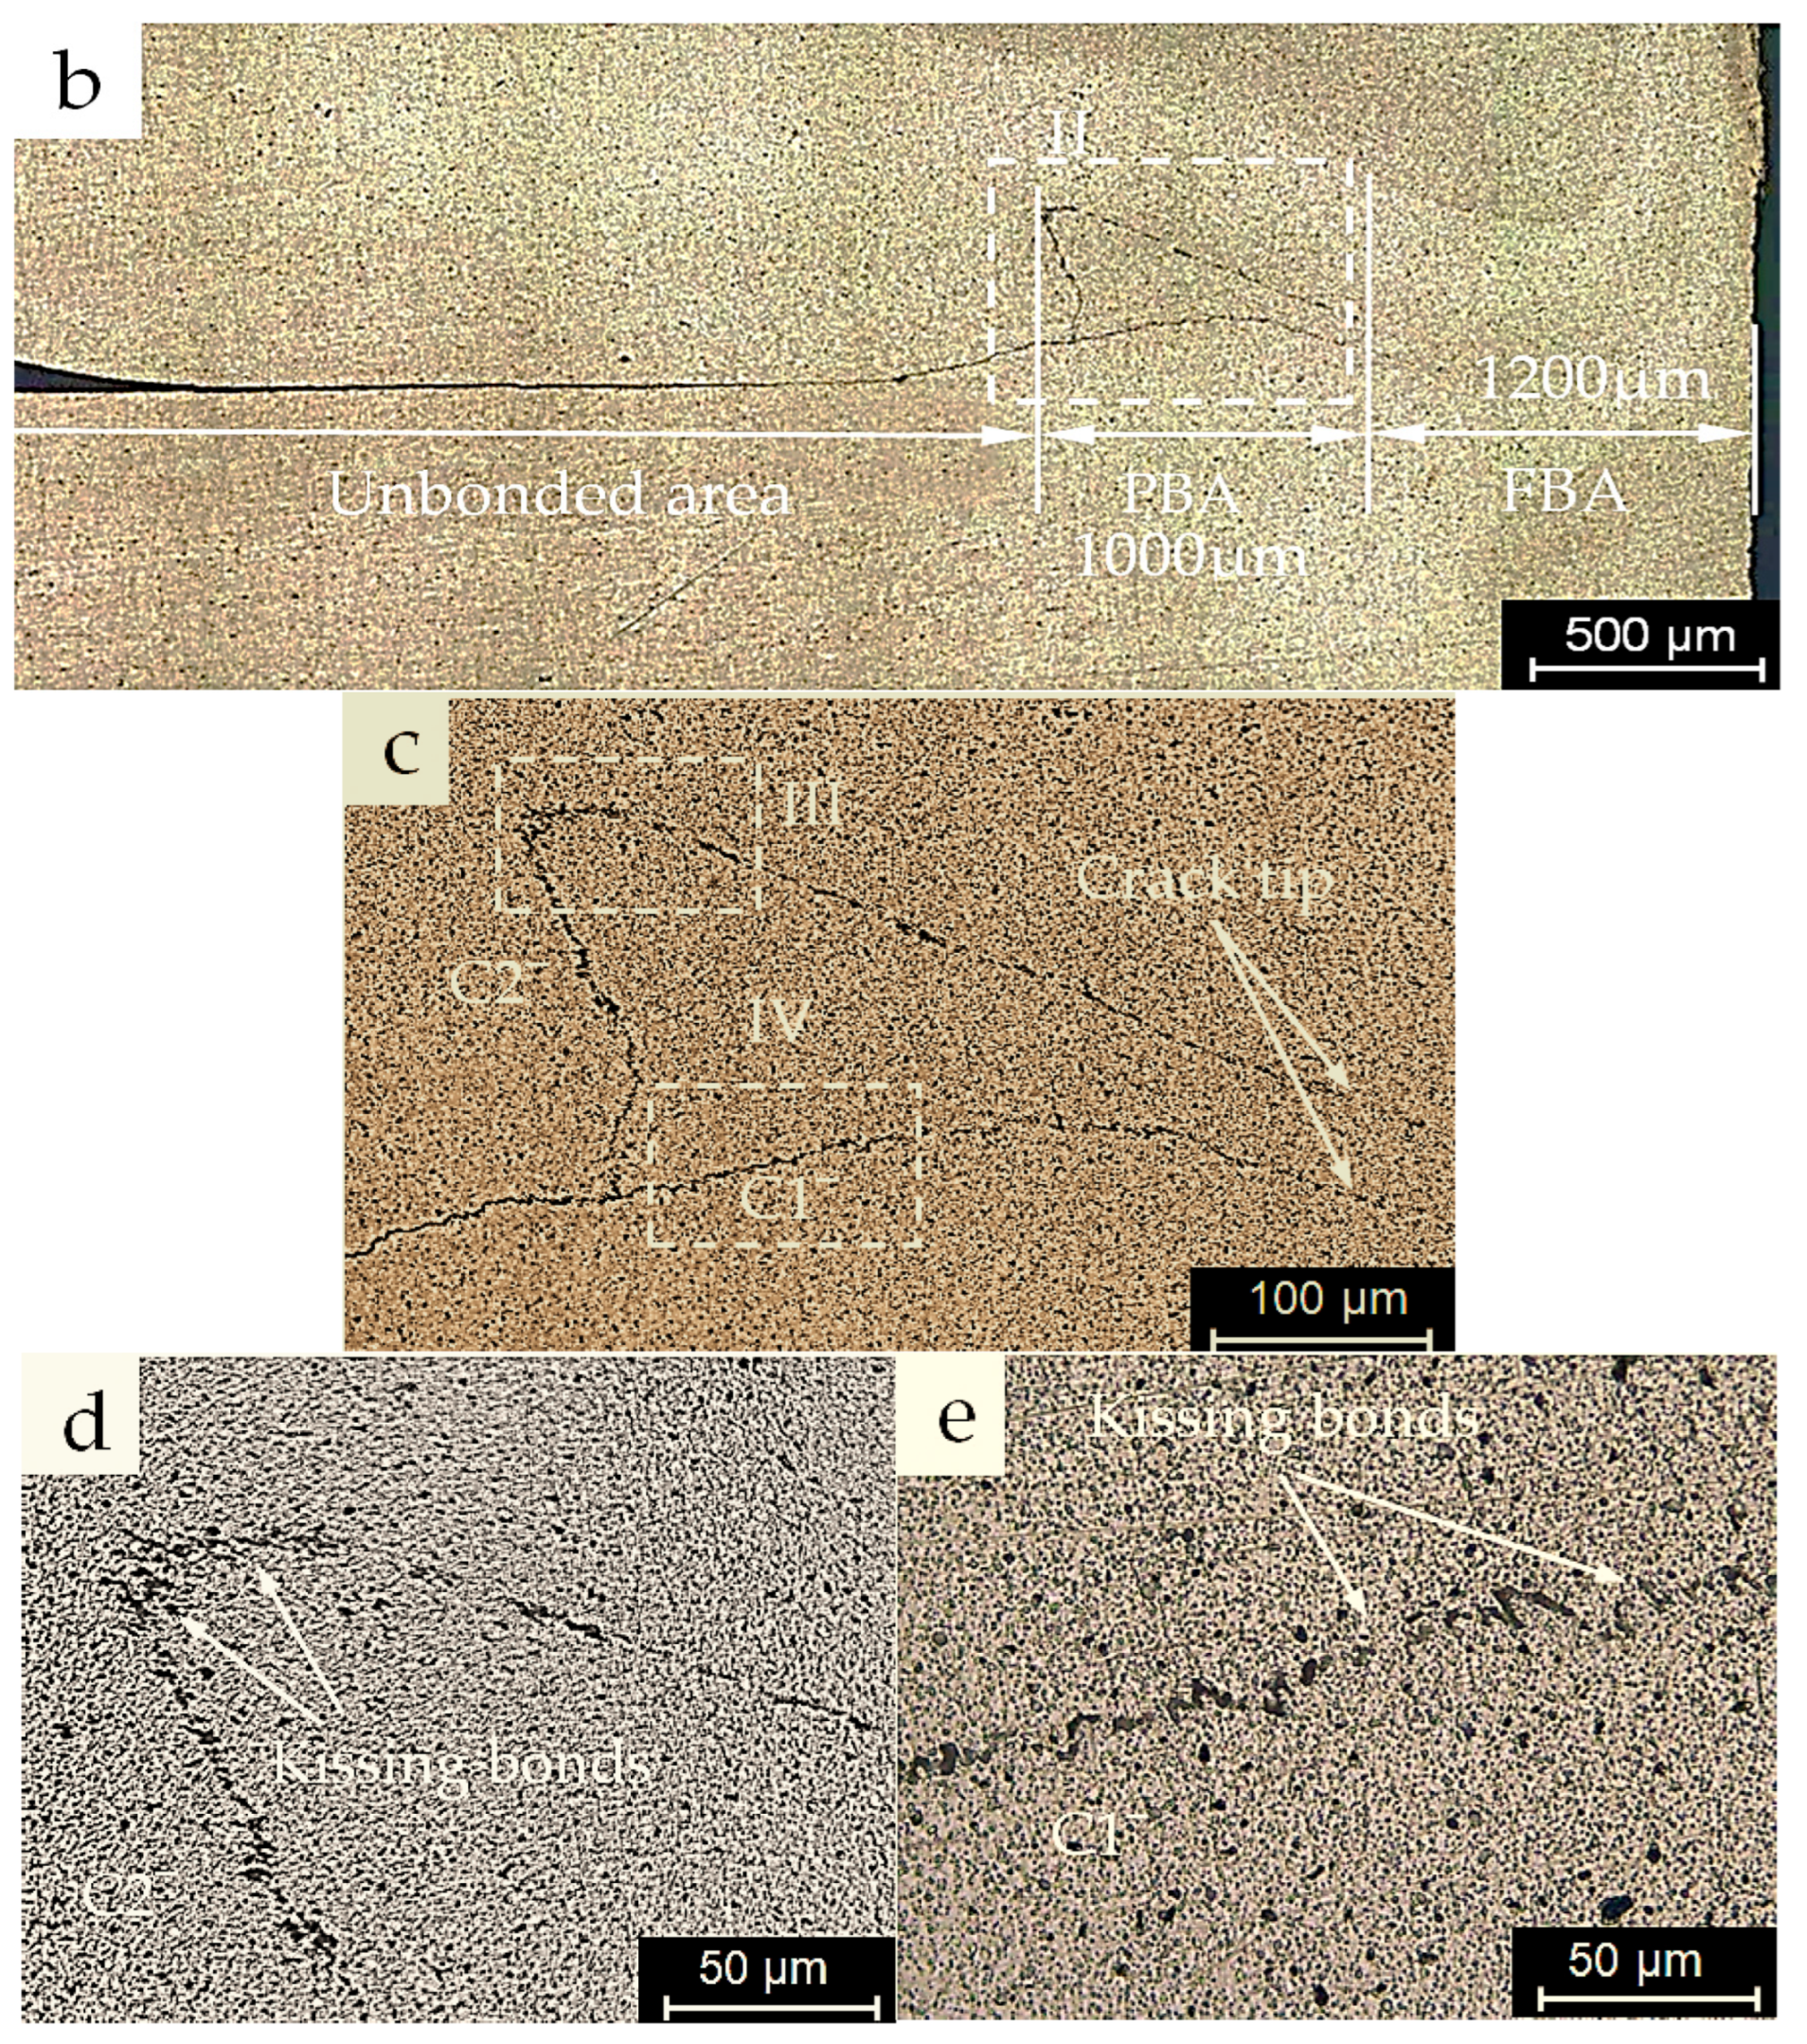
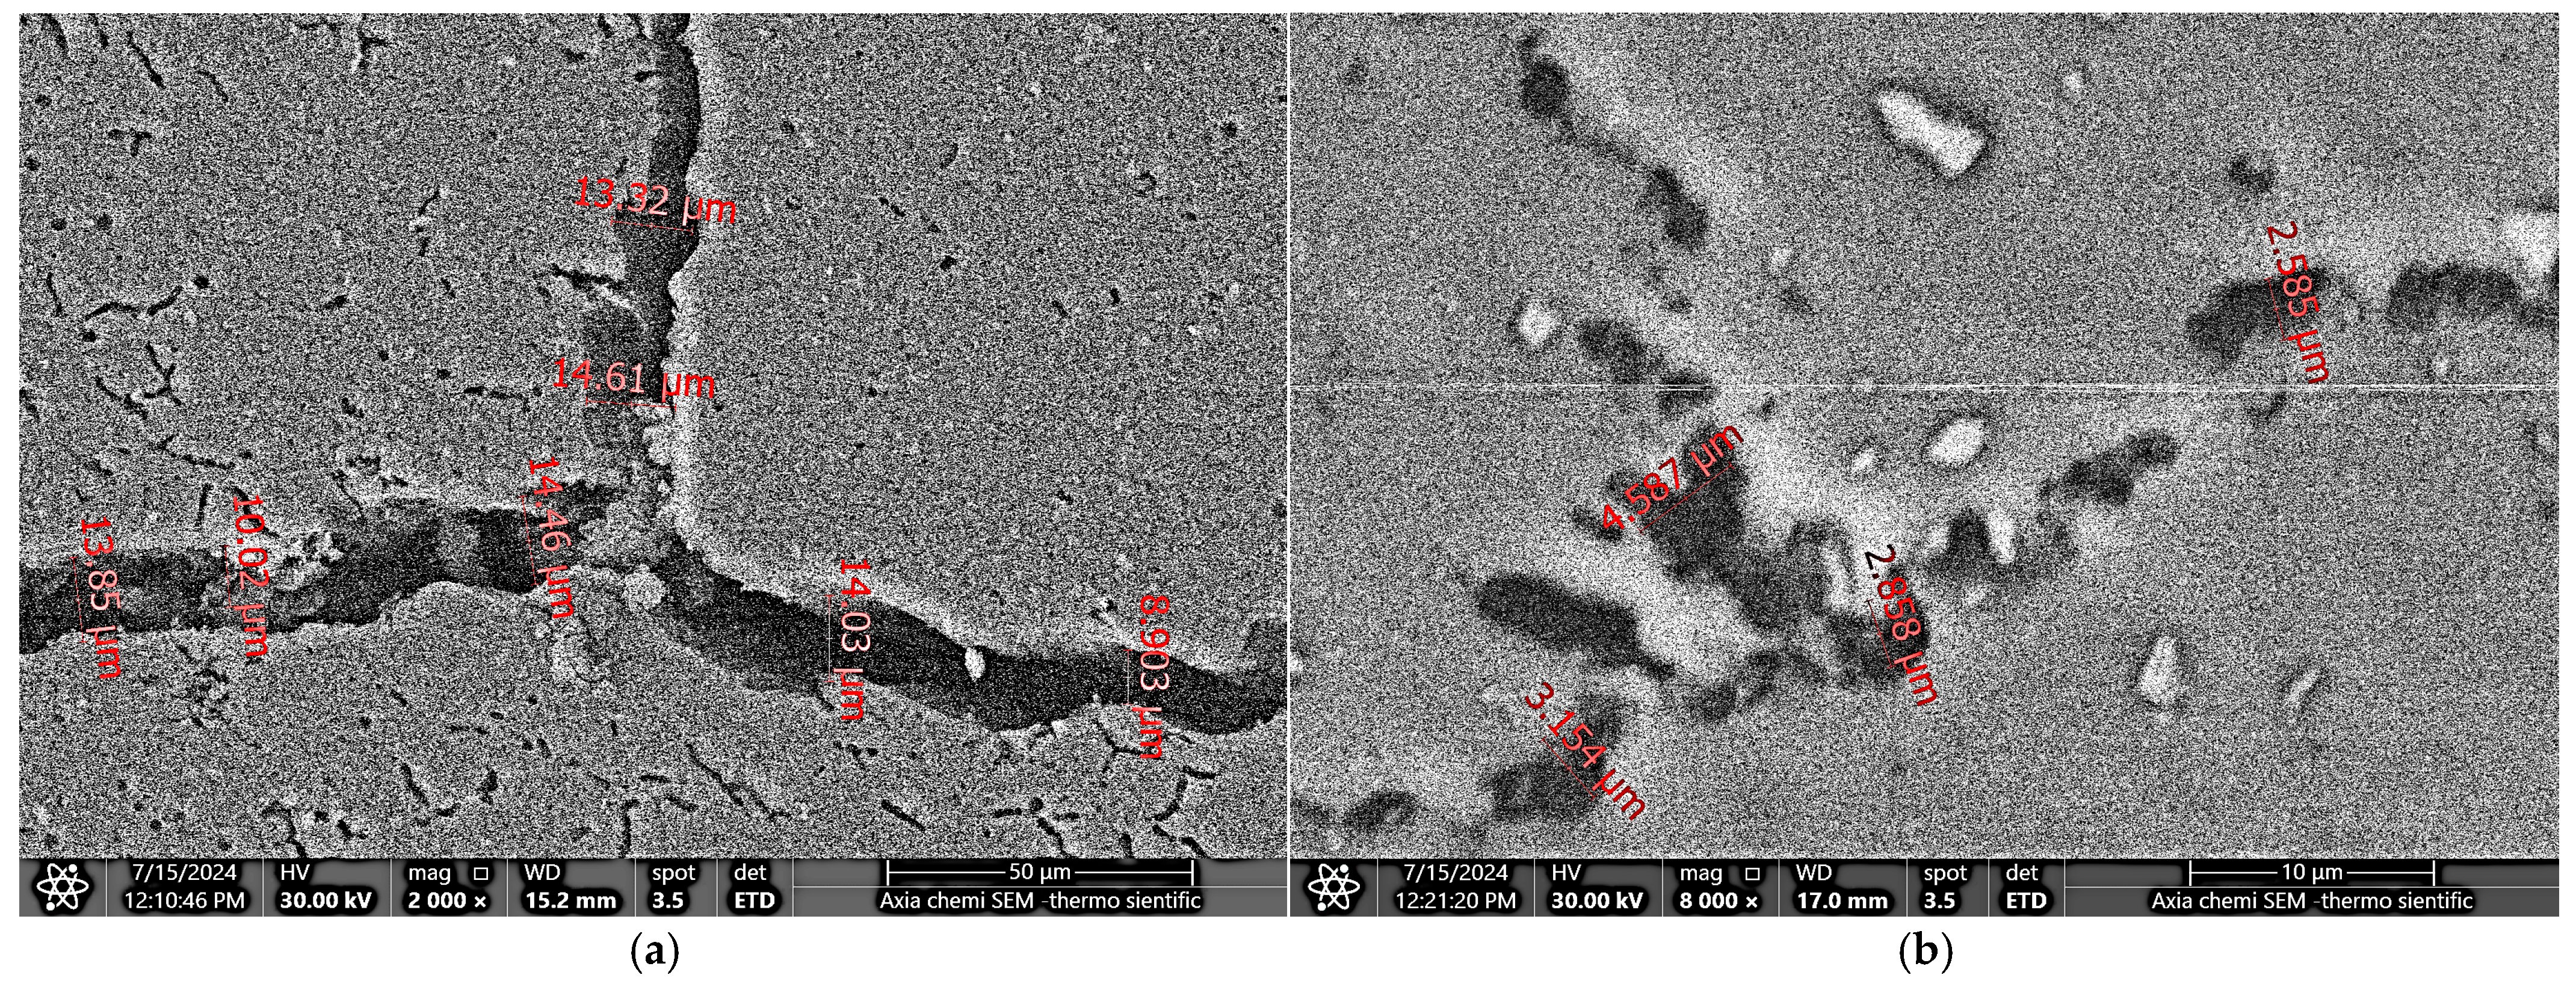
- Optical and scanning electron micrographs revealed that the FSSW specimens performed with the inert gas cover exhibited a significant enlargement in the fully bonded area (FBA) by approximately 33%, along with a reduced partially bonded area (PBA) by 33%, in addition to a lower width range of hook cracks compared to those of the conventional welding process;
- (2)
- The energy-dispersive spectroscopy (EDS) analysis showed a lower oxide inclusion, in terms of oxygen weight percentages (wt.%), in various hook crack regions within the joint bond line when the inert argon gas cover was used during the FSSW welding process. A reduction of 41% and 32% was achieved in the unbounded area (UBA) and the PBA, respectively, while no considerable oxide inclusion formed in the FBA due to the efficient stirring effect at the periphery of the welding tool pin;
- (3)
- Micro-hardness tests showed no significant differences in hardness distribution across the corresponding weld zones of both welding processes, attributed to the same material, identical welding parameters, and consistent tool geometry;
- (4)
- Specimens welded with the inert gas cover exhibited a 14% increase in tensile strength compared to those produced using the conventional process;
- (5)
- The fatigue life of the specimens welded with the inert gas cover was longer at all load ranges in both low-cycle and high-cycle fatigue conditions compared to the conventional process, with an improvement that varied between 60% and 26% at the higher load level of the low-cycle fatigue and the lower load level of the high-cycle fatigue, respectively;
- (6)
- Fatigue failure was primarily caused by dominant cracks initiating at the original interfacial crack tips of the FSSW lap-shear specimens and propagating under cyclic loading;
- (7)
- The fatigue crack initiation and tendency during propagating through the upper sheet thickness under cyclic loading conditions mainly depend on the applied load level, the hook crack morphology, and the bond line quality and purity. Consequently, the shear crack initiation site, the propagation path, and the mode of failure were suggested;
- (8)
- Under low-cycle fatigue conditions, the failed FSSW welds from the conventional process showed a shear fracture failure mode, whereas those welded with the inert gas cover specimens performed with the inert gas cover exhibited both shear fracture and a mixed mode of shear fracture and nugget pull-out failure modes. On the other hand, under high-cycle fatigue conditions, the failed welds from both processes showed different failure modes, including nugget pull-out, circumferential failure, upper sheet transverse failure, and lower sheet transverse failure.
Author Contributions
Funding
Institutional Review Board Statement
Informed Consent Statement
Data Availability Statement
Acknowledgments
Conflicts of Interest
References
- Shen, Z.; Ding, Y.; Chen, J.; Gerlich, A.P. Comparison of fatigue behavior in Mg/Mg similar and Mg/steel dissimilar refill friction stir spot welds. Int. J. Fatigue 2016, 92, 78–86. [Google Scholar] [CrossRef]
- Spot, K.; Welding, F.S.; Recrystallization, C.D. Friction stir spot welding of aluminum alloys. Symp. A Q. J. Mod. Foreign Lit. 2015, 2–3. [Google Scholar]
- Cox, C.D. Friction Stir Spot Welding: Engineering Analysis and Design. Ph.D. Thesis, Vanderbilt University, Nashville, TN, USA, 2014; 270p. [Google Scholar]
- Klobčar, D.; Tušek, J.; Skumavc, A.; Smolej, A. Parametric study of friction stir spot welding of aluminium alloy 5754. Metalurgija 2014, 53, 21–24. [Google Scholar]
- Miles, M.P.; Hartman, T.; Cunningham, C.; Saunders, N.; Hovanski, Y. High speed friction stir spot welding of advanced high strength steel. In Proceedings of the Material Science and Technology Conference and Exhibition Pittsburgh, Pittsburgh, PA, USA, 7–11 October 2012; pp. 299–307. [Google Scholar]
- Gerlich, A.; Su, P.; North, T.H. Peak temperatures and microstructures in aluminium and magnesium alloy friction stir spot welds. Sci. Technol. Weld. Join. 2005, 10, 647–652. [Google Scholar] [CrossRef]
- Alkhafaji, A.; Camas, D.; Lopez-Crespo, P.; Al-Asadi, H. The Influence of Tool Geometry on the Mechanical Properties and the Microstructure of AA6061-T6 Aluminum Alloy Friction Stir Spot Welding. Materials 2023, 16, 4135. [Google Scholar] [CrossRef]
- Chowdhury, S.H.; Chen, D.L.; Bhole, S.D.; Cao, X.; Wanjara, P. Lap shear strength and fatigue life of friction stir spot welded AZ31 magnesium and 5754 aluminum alloys. Mater. Sci. Eng. A 2012, 556, 500–509. [Google Scholar] [CrossRef]
- Rao, H.M.; Jordon, J.B.; Barkey, M.E.; Guo, Y.B.; Su, X.; Badarinarayan, H. Influence of structural integrity on fatigue behavior of friction stir spot welded AZ31 Mg alloy. Mater. Sci. Eng. A 2013, 564, 369–380. [Google Scholar] [CrossRef]
- Zhang, B.; Ma, Y.; Yu, F.; Liu, Y.; Zhou, E.; Fan, Z.; Ge, E.; Li, Y.; Lin, Z. Strengthening flat-die friction self-pierce riveting joints via manipulating stir zone geometry by tailored rivet structures. Int. J. Mach. Tools Manuf. 2024, 203, 104223. [Google Scholar] [CrossRef]
- Feizollahi, V.; Yousefi, M.; Elahifar, A.; Pourmirza, B.; Ghobeiti Hasab, M.; Heidary Moghadam, A. Effect of shoulder diameter, tool rotation speed, and arrangement of plates on mechanical and metallurgical properties of dissimilar aluminum 2024-T3 and 7075-T6 friction stir spot welding (FSSW). Eng. Fail. Anal. 2024, 163, 108548. [Google Scholar] [CrossRef]
- Alkhafaji, A.; Camas, D. Effect of Tool Rotational Speed and Dwell Time on the Joint Strength of Friction Stir Spot Welded AA6061-T6 Sheets. Eng. Proc. 2023, 56, 215. [Google Scholar] [CrossRef]
- Venukumar, S.; Muthukumaran, S.; Yalagi, S.G.; Kailas, S.V. Failure modes and fatigue behavior of conventional and refilled friction stir spot welds in AA 6061-T6 sheets. Int. J. Fatigue 2014, 61, 93–100. [Google Scholar] [CrossRef]
- Davis, J.R. Aluminum and Aluminum Alloys; ASM International: Almere, The Netherlands, 1993. [Google Scholar]
- Alhetaa, S.; Zayanb, S.; Mahmoudc, T.; Gomaad, A. Optimization of Friction Stir Spot Welding Process Parameters for AA6061-T4 Aluminium Alloy Plates. Am. Sci. Res. J. Eng. Technol. Sci. 2016, 20, 244–253. [Google Scholar]
- Babu, N.B.K.; Kumar, A.P.; Davidson, M.J. A review of friction stir welding of AA6061 aluminum alloy. ARPN J. Eng. Appl. Sci. 2011, 6, 61–63. [Google Scholar]
- Yapici, G.G.; Ibrahim, I.J. On the fatigue and fracture behavior of keyhole-free friction stir spot welded joints in an aluminum alloy. J. Mater. Res. Technol. 2021, 11, 40–49. [Google Scholar] [CrossRef]
- Lee, J.; Park, S.Y.; Choi, B.H. Evaluation of fatigue characteristics of aluminum alloys and mechanical components using extreme value statistics and C-specimens. Metals 2021, 11, 1915. [Google Scholar] [CrossRef]
- Brooke, M.H.; Miller, R. Fatigue testing. Muscle Nerve 1990, 13, S35–S37. [Google Scholar] [CrossRef] [PubMed]
- Shen, Z.; Yang, X.; Zhang, Z.; Cui, L.; Yin, Y. Mechanical properties and failure mechanisms of friction stir spot welds of AA 6061-T4 sheets. Mater. Des. 2013, 49, 181–191. [Google Scholar] [CrossRef]
- Badarinarayan, H.; Yang, Q.; Zhu, S. Effect of tool geometry on static strength of friction stir spot-welded aluminum alloy. Int. J. Mach. Tools Manuf. 2009, 49, 142–148. [Google Scholar] [CrossRef]
- Bakavos, D.; Prangnell, P.B. Effect of reduced or zero pin length and anvil insulation on friction stir spot welding thin gauge 6111 automotive sheet. Sci. Technol. Weld. Join. 2009, 14, 443–456. [Google Scholar] [CrossRef]
- Sun, J.; Liu, X.; Tong, Y.; Deng, D. A comparative study on welding temperature fields, residual stress distributions and deformations induced by laser beam welding and CO2 gas arc welding. Mater. Des. 2014, 63, 519–530. [Google Scholar] [CrossRef]
- Chen, Y.B.; Lei, Z.L.; Li, L.Q.; Wu, L. Experimental study on welding characteristics of CO2 laser TIG hybrid welding process. Sci. Technol. Weld. Join. 2006, 11, 403–411. [Google Scholar] [CrossRef]
- Yaghoubi, S.; Shirazi, A. Mechanical properties and corrosion behavior of friction stir welded copper plates under shielding gas. Int. J. Fatigue 2021, 152, 106419. [Google Scholar] [CrossRef]
- Chen, H.; Tianli, Z.; Zhu, Z.; Xu, L.; Lin, S.; Yang, S.; Kou, S. Study on the effect of Ar–He shielding gas on the weld formation, microstructure and mechanical properties of 5083 aluminum alloy weld. J. Mater. Res. Technol. 2024, 28, 683–694. [Google Scholar] [CrossRef]
- Xia, H.; Tan, C.; Tian, R.; Meng, S.; Li, L.; Ma, N. Influence of shielding gas on microstructure and mechanical properties of laser welded–brazed Al/steel lapped joint. J. Manuf. Process. 2020, 54, 347–358. [Google Scholar] [CrossRef]
- Pehkonen, H. Design of Gas Shield for Friction Stir Welding Machine. Master’s Thesis, Linköping University, Linköping, Sweden, 2014. [Google Scholar]
- Björck, M.; Pehkonen, H.; Vuori, L.; Tigerström, M.; Lahtonen, K.; Valden, M.; Purhonen, T.; Cederqvist, L. Evaluation of a Gas Shield for Friction Stir Welding of Copper Canisters; Svensk Kärnbränslehantering AB: Solna, Sweden, 2017. [Google Scholar]
- Lin, P.C.; Pan, J.; Pan, T. Failure modes and fatigue life estimations of spot friction welds in lap-shear specimens of aluminum 6111-T4 sheets. Part 2: Welds made by a flat tool. Int. J. Fatigue 2008, 30, 90–105. [Google Scholar] [CrossRef]
- Choi, D.H.; Ahn, B.W.; Lee, C.Y.; Yeon, Y.M.; Song, K.; Jung, S.-B. Effect of pin shapes on joint characteristics of friction stir spot welded AA5J32 sheet. Mater. Trans. 2010, 51, 1028–1032. [Google Scholar] [CrossRef]
- Choi, S.G.; Hwang, I.; Kim, Y.M.; Kang, B.; Kang, M. Prediction of the weld qualities using surface appearance image in resistance spot welding. Metals 2019, 9, 831. [Google Scholar] [CrossRef]
- Tran, V.X.; Pan, J. Fatigue behavior of dissimilar spot friction welds in lap-shear and cross-tension specimens of aluminum and steel sheets. Int. J. Fatigue 2010, 32, 1167–1179. [Google Scholar] [CrossRef]
- Wang, D.A.; Chen, C.H. Fatigue lives of friction stir spot welds in aluminum 6061-T6 sheets. J. Mater. Process. Technol. 2009, 209, 367–375. [Google Scholar] [CrossRef]
- Shahani, A.R.; Farrahi, A. Effect of Sheet Thickness on Fatigue Behavior of Friction Stir Spot Weld of Al 6061-T6 Lap-shear Configuration Article info. J. Stress Anal. 2018, 3, 61–68. [Google Scholar]
- Shahani, A.R.; Farrahi, A. Experimental investigation and numerical modeling of the fatigue crack growth in friction stir spot welding of lap-shear specimen. Int. J. Fatigue 2019, 125, 520–529. [Google Scholar] [CrossRef]
- Tran, V.X.; Pan, J.; Pan, T. Fatigue behavior of aluminum 5754-O and 6111-T4 spot friction welds in lap-shear specimens. Int. J. Fatigue 2008, 30, 2175–2190. [Google Scholar] [CrossRef]
- Venukumar, S.; Yalagi, S.; Muthukumaran, S. Comparison of microstructure and mechanical properties of conventional and refilled friction stir spot welds in AA 6061-T6 using filler plate. Trans. Nonferrous Met. Soc. China 2013, 23, 2833–2842. [Google Scholar] [CrossRef]
- Hassan, K.S.; Alwan, A.S.; Abbas, S.A. Corrosion Behavior of Al alloys 6061-T6 Shot Peening in Different Aqueous Solution. Int. J. Eng. Innov. Technol. 2015, 4, 64–69. [Google Scholar]
- Bilici, M.K.; Yükler, A.I.; Kurtulmuş, M. Pin Profile and Shoulder Geometry Effects. Frict. Stir Spot Welded Polym. Sheets 2016, 5, 29–36. [Google Scholar]
- Agarwal, H.; Gokhale, A.M.; Graham, S.; Horstemeyer, M.F. Void growth in 6061-aluminum alloy under triaxial stress state. Mater. Sci. Eng. A 2003, 341, 35–42. [Google Scholar] [CrossRef]
- Song, X.; Ke, L.; Xing, L.; Liu, F.; Huang, C. Effect of plunge speeds on hook geometries and mechanical properties in friction stir spot welding of A6061-T6 sheets. Int. J. Adv. Manuf. Technol. 2014, 71, 2003–2010. [Google Scholar] [CrossRef]


| Element | Si | Fe | Cu | Mn | Mg | Zn | Cr | Ti | Al |
|---|---|---|---|---|---|---|---|---|---|
| wt (%) | 0.54 | 0.46 | 0.32 | 0.07 | 0.69 | 0.009 | 0.20 | 0.05 | Balance |
| 0.2% Yield Strength (MPa) | Tensile Strength (MPa) | Shear Strength (MPa) | Hardness (HV) |
|---|---|---|---|
| 276 | 310 | 207 | 107 |
| Spectrum | C | O | Mg | Al | Si | Fe | Cu | Cr | Cl | F | Mn | Total |
|---|---|---|---|---|---|---|---|---|---|---|---|---|
| A | 22.2 | 11.3 | 0.4 | 61.0 | 4.2 | 0.5 | 0.2 | 0.2 | − | − | − | 100.0 |
| B | 17.9 | 8.6 | 0.5 | 67.7 | 2.8 | 1.4 | − | − | 0.6 | 0.6 | − | 100.0 |
| C | 18.0 | 7.2 | 0.4 | 73.3 | − | 0.7 | − | − | − | − | 0.3 | 100.0 |
| D | 15.5 | 1.9 | 0.4 | 81.0 | 0.5 | 0.7 | − | − | − | − | − | 100.0 |
| Spectrum | C | O | Mg | Al | Si | Fe | Cu | Cr | Cl | Total |
|---|---|---|---|---|---|---|---|---|---|---|
| A′ | 18.8 | 6.6 | 0.4 | 72.5 | 0.5 | 0.9 | 0.3 | − | − | 100.0 |
| B′ | 18.0 | 5.8 | 0.5 | 74.4 | 0.3 | 0.7 | − | 0.2 | − | 100.0 |
| C′ | 17.2 | 4.9 | 0.5 | 76.4 | 0.4 | 0.6 | − | − | − | 100.0 |
| D′ | 16.5 | 1.8 | 0.5 | 80.2 | − | 0.7 | − | − | 0.2 | 100.0 |
| Load Level (%) | Load Value (kN) | Fracture Surfaces | Failure Mode | |
|---|---|---|---|---|
| Upper Sheet Bottom | Lower Sheet Top | |||
| 80 | 3.244 | 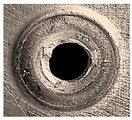 | 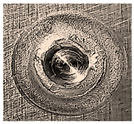 | Shear fracture |
| 70 | 2.838 | 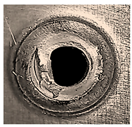 |  | Shear fracture |
| 60 | 2.433 | 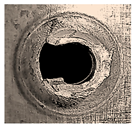 |  | Shear fracture + Nugget pull-out (Mixed mode) |
| 50 | 2.027 | 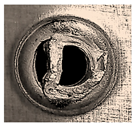 | 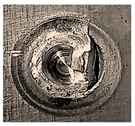 | Nugget pull-out |
| 40 | 1.622 |  | 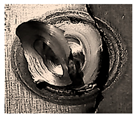 | Circumferential failure mode |
| 30 | 1.216 |  | 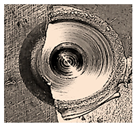 | Upper sheet transverse fracture |
| Load Level (%) | Load Value (kN) | Fracture Surfaces | Failure Mode | |
|---|---|---|---|---|
| Upper Sheet Bottom | Lower Sheet Top | |||
| 80 | 3.244 | 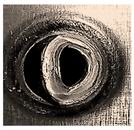 |  | Shear fracture |
| 70 | 2.838 | 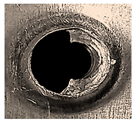 | 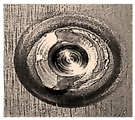 | Shear fracture + Nugget pull-out (Mixed mode) |
| 60 | 2.433 | 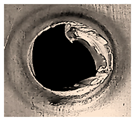 | 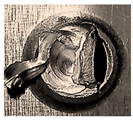 | Nugget pull-out |
| 50 | 2.027 | 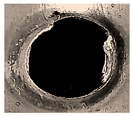 | 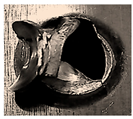 | Circumferential fracture |
| 40 | 1.622 |  |  | Lower sheet transverse fracture |
| 30 | 1.216 |  |  | Lower sheet transverse fracture |
Disclaimer/Publisher’s Note: The statements, opinions and data contained in all publications are solely those of the individual author(s) and contributor(s) and not of MDPI and/or the editor(s). MDPI and/or the editor(s) disclaim responsibility for any injury to people or property resulting from any ideas, methods, instructions or products referred to in the content. |
© 2025 by the authors. Licensee MDPI, Basel, Switzerland. This article is an open access article distributed under the terms and conditions of the Creative Commons Attribution (CC BY) license (https://creativecommons.org/licenses/by/4.0/).
Share and Cite
Alkhafaji, A.; Camas, D.; Al-Asadi, H. Effect of Inert Gas Cover on the Static and Fatigue Behavior of AA6061-T6 Aluminum Alloy Friction Stir Spot Lap-Shear Welds. Materials 2025, 18, 256. https://doi.org/10.3390/ma18020256
Alkhafaji A, Camas D, Al-Asadi H. Effect of Inert Gas Cover on the Static and Fatigue Behavior of AA6061-T6 Aluminum Alloy Friction Stir Spot Lap-Shear Welds. Materials. 2025; 18(2):256. https://doi.org/10.3390/ma18020256
Chicago/Turabian StyleAlkhafaji, Amir, Daniel Camas, and Hayder Al-Asadi. 2025. "Effect of Inert Gas Cover on the Static and Fatigue Behavior of AA6061-T6 Aluminum Alloy Friction Stir Spot Lap-Shear Welds" Materials 18, no. 2: 256. https://doi.org/10.3390/ma18020256
APA StyleAlkhafaji, A., Camas, D., & Al-Asadi, H. (2025). Effect of Inert Gas Cover on the Static and Fatigue Behavior of AA6061-T6 Aluminum Alloy Friction Stir Spot Lap-Shear Welds. Materials, 18(2), 256. https://doi.org/10.3390/ma18020256