Abstract
During the heat treatment of round steel bars, a heated charge in the form of a cylindrically formed bundle is placed in a furnace. This type of charge is a porous granular medium in which a complex heat flow occurs during heating. The following heat transfer mechanisms occur simultaneously in this medium: conduction in bars, conduction within the gas, thermal radiation between the surfaces of the bars, and contact conduction across the joints between the adjacent bars. This complex heat transfer can be quantified in terms of effective thermal conductivity. This article presents the original model of the effective thermal conductivity of a bundle of round steel bars. This model is based on the thermo-electric analogy. Each heat transfer mechanism is assigned an appropriate thermal resistance. As a result of the calculations, the impact of the following parameters on the intensity of heat transfer in the bundle was examined: temperature, the thermal conductivity of the bars, the thermal conductivity of the gas, diameter, and emissivity of the bar, and bundle porosity. Calculations were performed for a temperature range of 25–800 °C, covering a wide spectrum of variables, including bar diameters, bundle porosity, and type of gas. The knowledge obtained thanks to the calculations performed will facilitate the optimization of heat treatment processes for the considered charge. The greatest scientific value of the presented research is the demonstration that, thanks to the developed computational model, it is possible to analyze a very complex heat transfer phenomenon using relatively simple mathematical relationships.
1. Introduction
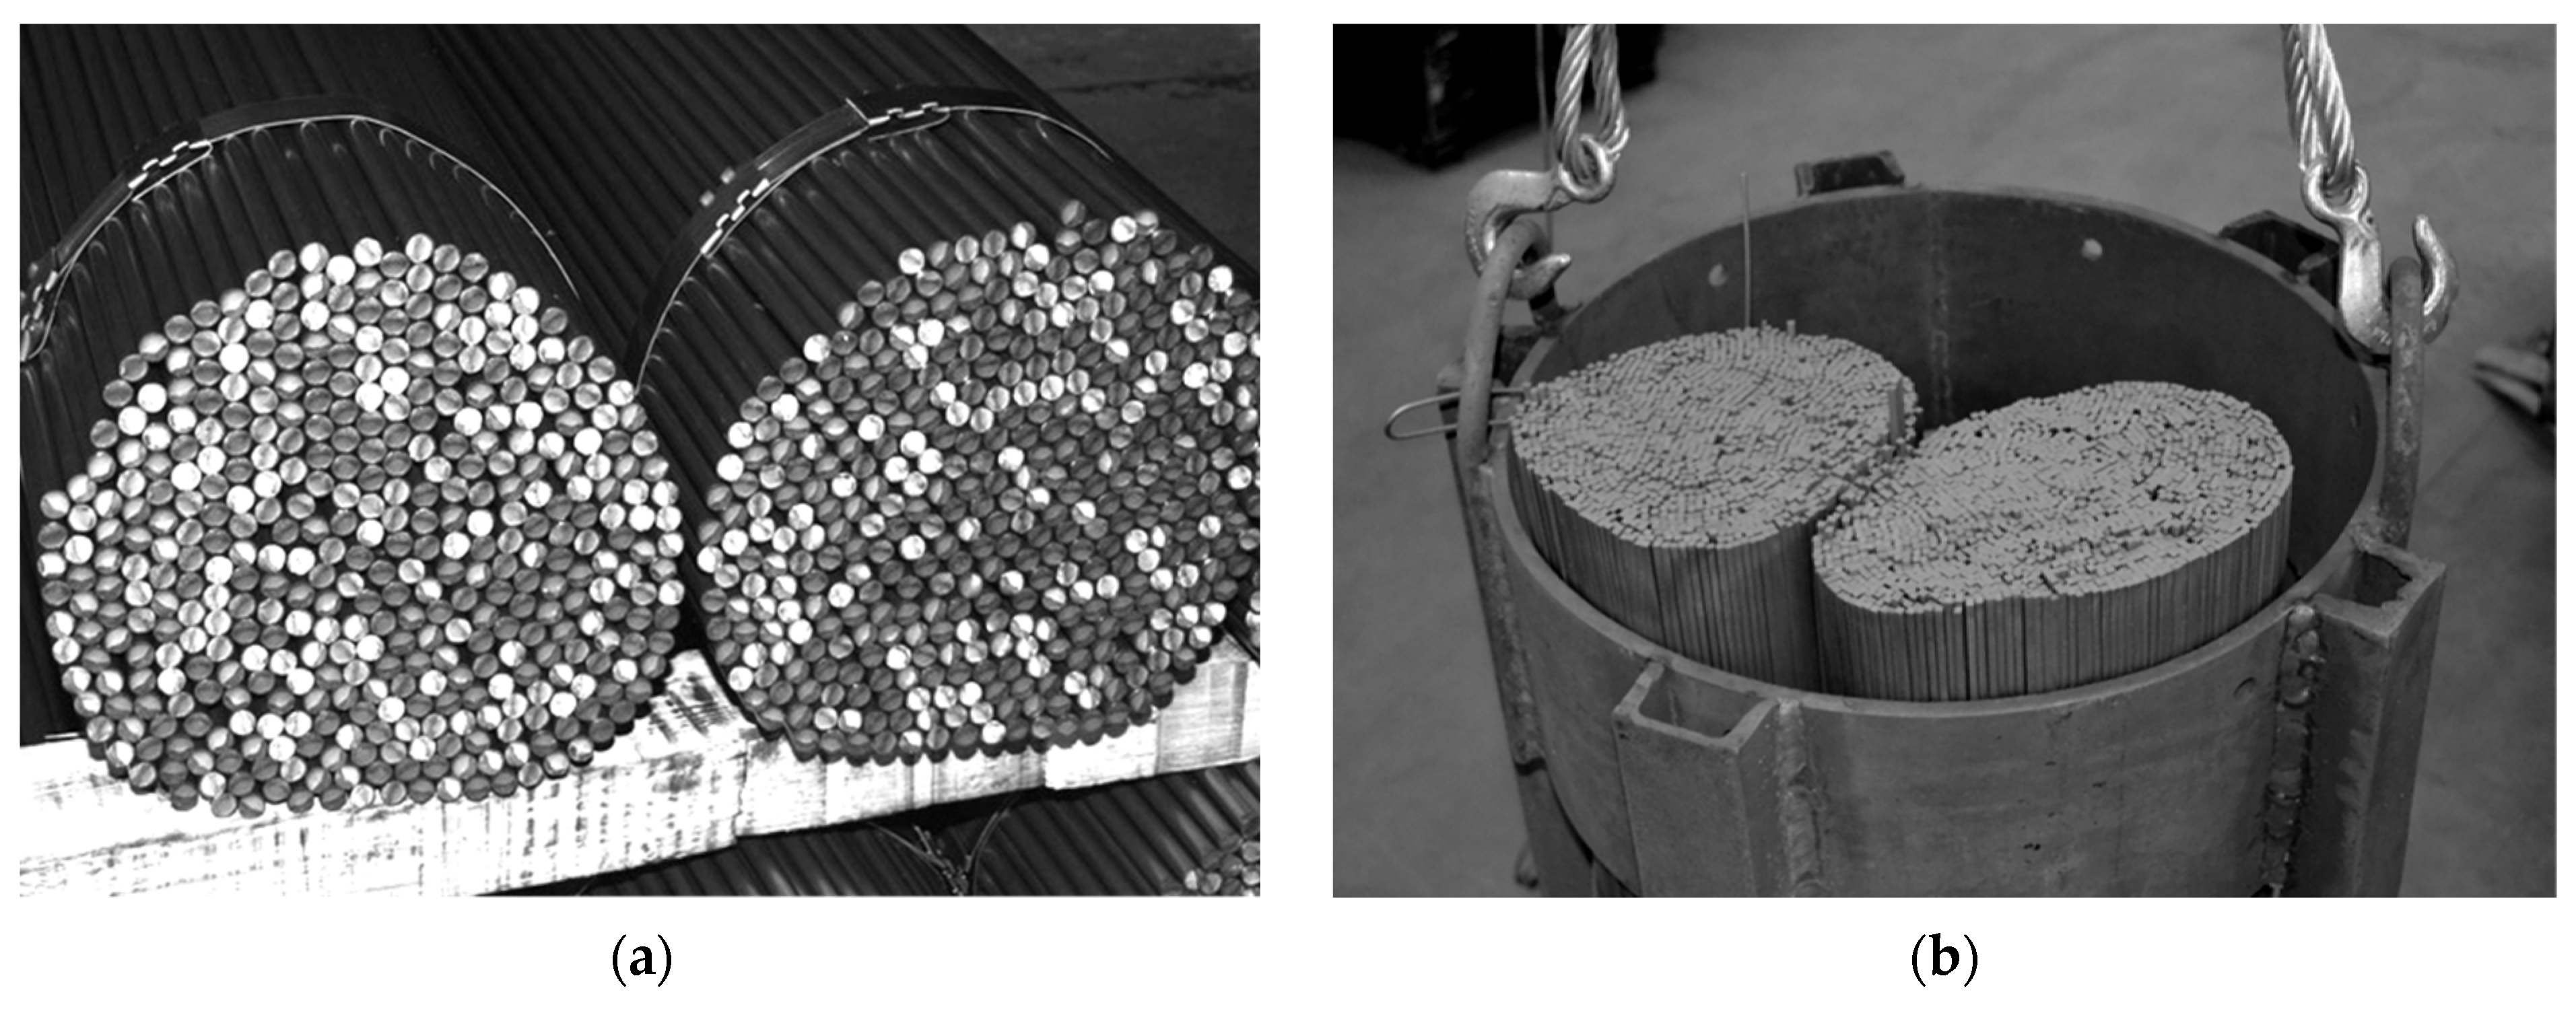
Amidst the climate crisis marked by global warming, numerous industries are pursuing technological advancements to lower energy usage and cut greenhouse gas emissions [1,2,3,4,5,6]. This issue also pertains to the metallurgical sector involved in the heat treatment of steel products [7,8,9,10,11]. For this reason, continuous research focuses on exploring different aspects of the heat treatment processes for steel products [12,13,14,15,16,17]. Efforts to improve the efficiency of heat treatment processes include the development of algorithms that enable the most accurate prediction of the current temperature of the heated element. This problem is particularly complex when the treated metal has a porous structure [18,19,20,21,22]. One example of such a charge are the cylindrical bundles of steel bars [23]. As illustrated in Figure 1, the analyzed elements feature gaps filled with gas and lack continuity of the solid phase in the radial direction. These specific characteristics significantly affect the heating process of the bundle. In such a medium, thermal energy is transferred through a combination of: (I) conduction within individual bars, (II) conduction through the gas, (III) contact conduction between adjacent bars, and (IV) thermal radiation between bar surfaces. The complexity of these mechanisms makes it difficult to create an exact mathematical model for the heating process of a bundle without accounting for many intricate relationships. However, this problem can be greatly reduced by introducing the concept of effective thermal conductivity (ETC or kef) This parameter is widely applied in the study of porous media [24,25,26,27]. The use of effective thermal conductivity enables the quantitative characterization of transient heat transfer within a bar bundle, facilitating the determination of its heating time [23,28,29].

Figure 1.
Bundles of bars as an example of a steel porous charge: (a) view of the bundle depicting its heterogeneous structure; (b) bundles prepared for heat treatment in a soaking furnace.
The most reliable way to determine the ETC is through experimental investigations. The steady-state method with a guarded hot plate apparatus is commonly used to measure the effective thermal conductivity of cellular and porous materials [30,31,32,33]. This method, however, demands specialized equipment, is time-intensive, and requires the preparation of specific test samples. A significant drawback of these measurements is their limited generalizability, as the results are specific to the tested material samples. Consequently, model calculations are frequently employed as a practical alternative for determining the ETC of porous materials [34].
Numerous analytical models for estimating the effective thermal conductivity of two-phase media (solid–gas) are available in the literature. The models used are generally divided into two groups. The first group consists of simple models, while the second group comprises complex models. The simple models, also referred to as “rigid”, express ETC solely based on the thermal conductivities of the solid phase (ks) and gas phase (kg), as well as the medium’s porosity (φ). The most commonly used simple models include structural models such as the parallel model, series model, Effective Medium Theory (EMT), and the Maxwell–Eucken model [35]. The complex models, also referred to as “flexible”, consider additional (secondary) parameters, such as thermal contact resistance (TCR) or thermal contact conductance (TCC), heat transfer through radiation, and the mean size of grains or voids [36]. Some of the more popular complex models are: the Krischer model (which is the weighted harmonic average of the parallel and series models) [35], Kunii–Smith [37], and Zehner–Schlünder [38]. As shown, the models mentioned above, both simple and complex are not appropriate for accurately determining the effective thermal conductivity of bar bundles [39]. This is due to the fact that these models do not account for the specific heat transfer processes that occur during the heating of the discussed charge. This particularly pertains to two phenomena: contact conduction and thermal radiation.
This article presents the original model of the effective thermal conductivity of a bundle of round steel bars. This model takes into account the following modes of heat transfer: conduction in the bars, conduction in the gas, contact conduction at the junctions of the bars, and thermal radiation between the surfaces of adjacent bars. The heat transfer analysis does not consider gas convection. As the experimental tests have shown, due to the small dimensions of the voids between the bars, this phenomenon can be neglected [40]. This is an analytical–empirical model because the function describing contact conduction occurring in its structure was determined on the basis of experimental research [41]. The greatest scientific value of the presented research is the demonstration that thanks to the developed mathematical model, it is possible to analyze a very complex heat transfer phenomenon using relatively simple mathematical relationships.
2. Materials and Methods
The presented model is based on the analysis of thermal resistances relating to individual heat transfer mechanisms that occur during the heating of the medium considered. This approach is based on the analogy of the two phenomena, namely electrical and thermal conduction, which results from the similarity of the mathematical description of Ohm and Fourier laws [42]. In numerous instances, this method serves as an efficient alternative for tackling intricate heat transfer issues in heterogeneous systems, providing a simpler solution compared to more advanced numerical techniques [43,44,45,46].
The basis for deriving the appropriate mathematical relationships is the geometric model of the medium. In this case, it is a layered, flat bed of round bars with a staggered arrangement, a fragment of which is shown in Figure 2a. Then, a periodically repeating element is isolated in this system, called a unit cell (Figure 2b). A unit cell approach is commonly used in heat transfer modeling in porous media [27,47]. This cell contains parts of bars from two adjacent layers—the upper layer was marked with the number 1, and the lower layer with the number 2. The free space (gap) between the bars is filled with gas. The cell is divided into three sections I–III (due to symmetry, sections I and III are the same). Thanks to such division, eight elements are distinguished in the cell. In sections I and III there are six elements (EI1, EIg, EI2, EIII1, EIII2, and EIIIg) corresponding to the part of the bars from the upper layer (EI1, EIII1) the part of gap (EIg, EIIIg) and the part of the bars from the lower layer (EI2, EIII2). In section II there are two elements relating to the part of the bar from the upper layer EII1 and the remaining part of the gap EIIg.

Figure 2.
Geometric model of the considered medium: (a) a fragment of flatbed of round bars with a staggered arrangement; (b) a unit cell.
The arrangement shown in Figure 2a represents the most general case of the considered charge when there is a gap between the bars—its width is determined by the value of the parameter xg from Equation (3). A special case is when xg = 0, in such a situation, the considered bed is closely packed (with minimal porosity). A charge with such porosity can be found in industrial practice, but it requires extraordinary care when arranging the bars. In most cases, heat-treated bar bundles are characterized by a lack of maximal packing—as shown in Figure 1a. Therefore, the system presented in Figure 2a is the most adequate for the analyzed issue.
It is assumed that a one-dimensional, steady heat flow takes place within the cell characterized by the heat flux vector q. The direction of the q vector is parallel to the planes of division of the cell into sections.
Two parameters are set to define the geometry of the system: the bar diameter db and the distance between the bars in layer lg, which is also the width of section II. These values determine the height of cell δc and the widths of sections I and III:
The parameter lg is defined as a fraction of the bar diameter:
The next quantity describing the system’s geometry is the length of the bars lb. Since the phenomenon is considered one-dimensional, a unit value was adopted for this parameter (lb = 1 m). Next, the relative heat transfer surface areas in individual sections are defined fI, fII, and fIII:
where
where AI–AIII are the surface areas of individual sections.
The value of ETC for the considered cell is calculated using the definition of thermal resistance to conduction through the plane wall [48]:
where Rto and δc are the total thermal resistance and the height of the cell. Due to the adopted cell division, the resistance Rto is calculated as the parallel combination of resistances of individual sections:
The resistance RI depends on the five resistances: conduction within the bars (RI1 and RI2), conduction in the gas RIg, contact conduction Rct, and radiation RIrd. Meanwhile, the resistance RII is a function of three resistances: conduction within the bar RII1, conduction in the gas RIIg, and radiation RIIrd. The resistances RI and RII are calculated using the following relationships:
If heat conduction in section I concerns a flat layer with dimensions lx and thermal conductivity kx, then its conduction resistance would be described by the relationship:
However, the conduction resistances (RI1, RI2, RIg, RII1, RIIg) appearing in Equations (10) and (11) pertain to elements with varying heights and, therefore, cannot be calculated using relationship (12). The values of these resistances are calculated according to a particular procedure, which is described in detail in the work [49]. The minimum and maximum dimensions of each element of the elementary cell are listed in Table 1 and are described by the following relationships:

Table 1.
Minimum and maximum dimensions of individual elements of a unit cell.
Thermal contact resistance Rct, occurring in sections I and III, describes the intensity of heat transfer through the contact areas between the bars of the individual layers of the bed. The resistance Rct about one section (due to the symmetry of the cell) is twice the total contact thermal resistance Rtct:
The resistance Rtct is the reciprocal of the thermal contact conductance hct [50,51,52]:
The authors in previous work [41] analyzed the issue of contact conduction in beds of round bars. It was established that for a bed of bars with a staggered arrangement, changes in the coefficient hct as a function of bar diameter db and bed temperature t could be described by the following relationship:
Therefore:
Radiation resistances RIrd and RIIrd are described by formulas:
Resistance Rrd is described by the following equation [53]:
where σc is the Stefan–Boltzmann constant, Tm is the mean absolute temperature of the considered medium, and Xrd is a coefficient, whose value depends on the emissivity of the bars εb, the shape, and the relative orientation of the surfaces limiting the area of radiative heat transfer within the elementary cell. In the analyzed case, this space is confined by fragments of the surfaces of three bars designated as AI, AIII, and A1. Since these surfaces do not entirely enclose the radiative heat transfer space, an apparent surface Aap is introduced in place of the gap surface AII. This is a standard procedure for analyzing radiative heat transfer in open systems [54]. Since the surface Aap does not reflect radiation, it possesses black body properties (εap = 1). The following relationships describe the areas of individual surfaces:
Next, the three surfaces from the bottom layer (two convex surfaces AI, AIII, and the flat surface Aap) are treated as one concave surface A2:
The surface A2 is assigned an equivalent emissivity εeq, which is determined as the weighted average of the emissivities of the AI and Aap surfaces:
Therefore, radiative heat transfer in the considered cell is reduced to the exchange of radiation between two enclosed surfaces (convex A1 and concave A2). The effective emissivity of such a system is described by the equation [54]:
Finally, the coefficient Xrd from Equation (23) is described by the relationship:
Therefore, the total thermal resistance of the elementary cell Rto is calculated as a combination of series and parallel connections of thirteen distinct thermal resistances related to: conduction within the bars (five resistances), conduction in the gas area (three resistances), contact conduction (two resistances), and thermal radiation (three resistances). The equivalent network of these resistances is shown in Figure 3.
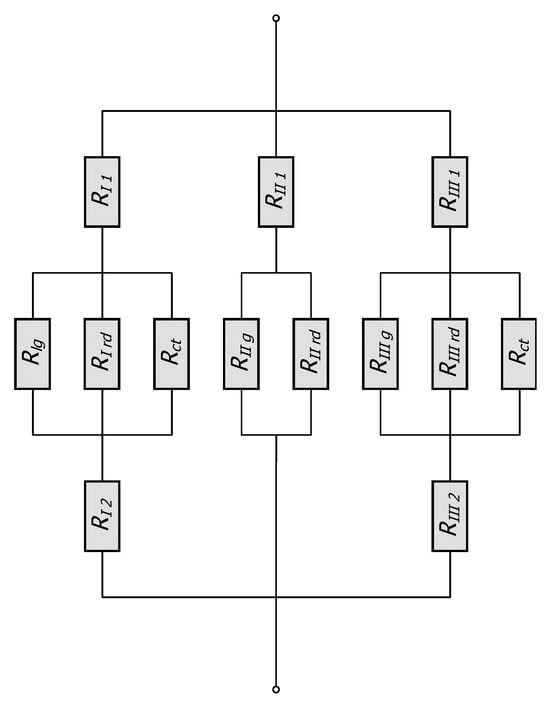
Figure 3.
Thermal resistance networks for the considered unit cell.
3. Results and Discussion
In the model calculations, the following parameters were the input data:
- bar diameter db;
- distance between the bars lg;
- thermal conductivity of steel ks;
- thermal conductivity of gas kg;
- thermal contact conductance hct;
- bar surface emissivity εb.
All calculations were performed for the temperature range 25–800 °C. The maximum value of this range is related to the annealing temperature of carbon steels. This parameter depends on the type of annealing and the carbon content in the steel. For instance, in stress-relief annealing, the temperature range is 500–650 °C, while for soft annealing, it is 680–750 °C [55]. Due to the large width of this range, it was assumed that the coefficients hct, ks, and kg vary with temperature. The changes in hct are described by Equation (19). Changes in the thermal conductivity of steel are described by the following equation [56]:
where t is steel temperature expressed in degrees Celsius and xc is the percentage of carbon in the steel.
Calculations were made for twelve different bundle geometries, assuming four bar diameters (10, 20, 30, and 40 mm) and three distances between the bars.
First, calculations were made for bundles of steel bars with a carbon content of 0.2% heated in air, which corresponds to heat treatment in a furnace without a protective atmosphere. The changes in air thermal conductivity in the temperature range of 25–800 °C are described by the equation:
Subsequently, calculations were also performed for the case when the gas filling the bundle voids is hydrogen. This gas as an atmosphere in heat treatment processes offers several benefits: helps prevent oxidation of metals and due to high thermal conductivity, enhances the uniformity of heating and cooling processes. These features can improve the overall quality of the treated materials. For this reason, hydrogen is often used in the annealing processes [57,58]. The thermal conductivity of hydrogen in the function of temperature was described by a linear equation:
Equations (32) and (33) were obtained by approximating tabulated data [59]. The values of the thermal conductivity of steel, air, and hydrogen for the temperatures 25 °C and 800 °C are listed in Table 2. It was also assumed that the emissivity of the bar surface is 0.7, which is a typical value for rolled steel products [60,61].
Table 2.
The thermal conductivities of steel, air, and hydrogen for temperatures 25 °C and 800 °C.
The results of ETC calculations for the case when the gas filling the bundle is air, divided by individual bar diameters, are shown in Figure 4. Each graph shows the results for three charge porosities φ in the temperature function. Parameter φ was regulated by changing the gap width lg as a multiple of the bar diameter (Equation (3)). Calculations were performed for three values of the coefficient xg: 0; 0.2 and 0.4. The porosities of the bundle corresponding to the respective values of xg are listed in Table 3.
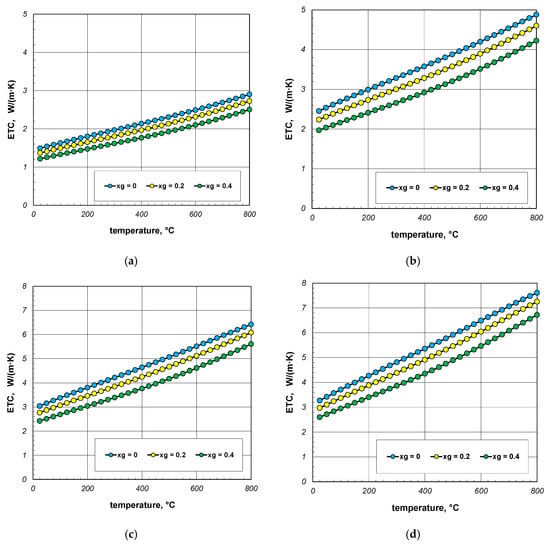
Figure 4.
Effective thermal conductivity of the bar bundle depending on the temperature and porosity: (a) 10 mm bars, (b) 20 mm bars, (c) 30 mm bars, and (d) 40 mm bars.
Table 3.
Porosity of the bundle depending on the value of the xg parameter from Equation (3).
As can be seen from the above graphs, ETC in each case increases linearly as a function of temperature. Thermal radiation between the surfaces of the bars is primarily responsible for this tendency of changes. ETC also increases as the bar diameter increases. To better show this last effect, additional graphs were prepared in Figure 5 and Figure 6. The graphs in Figure 5 show the results obtained for bundles with porosity 0.09 and 0.21. Each graph compares the results for individual bar diameters. It can be seen that for both bundle porosities, the effect of the bar diameter on ETC changes is very similar. The results from Figure 4 and Figure 5 further show that increasing the charge porosity causes a decrease in ETC.
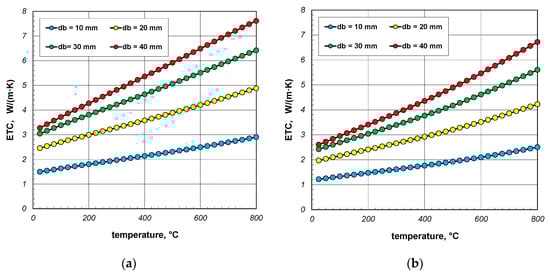
Figure 5.
Effective thermal conductivity of the bar bundle depending on the temperature and bar diameter: (a) bundle porosity 0.09 (xg = 0) and (b) bundle porosity 0.21 (xg = 0.4).
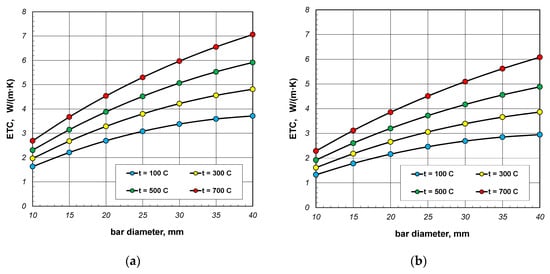
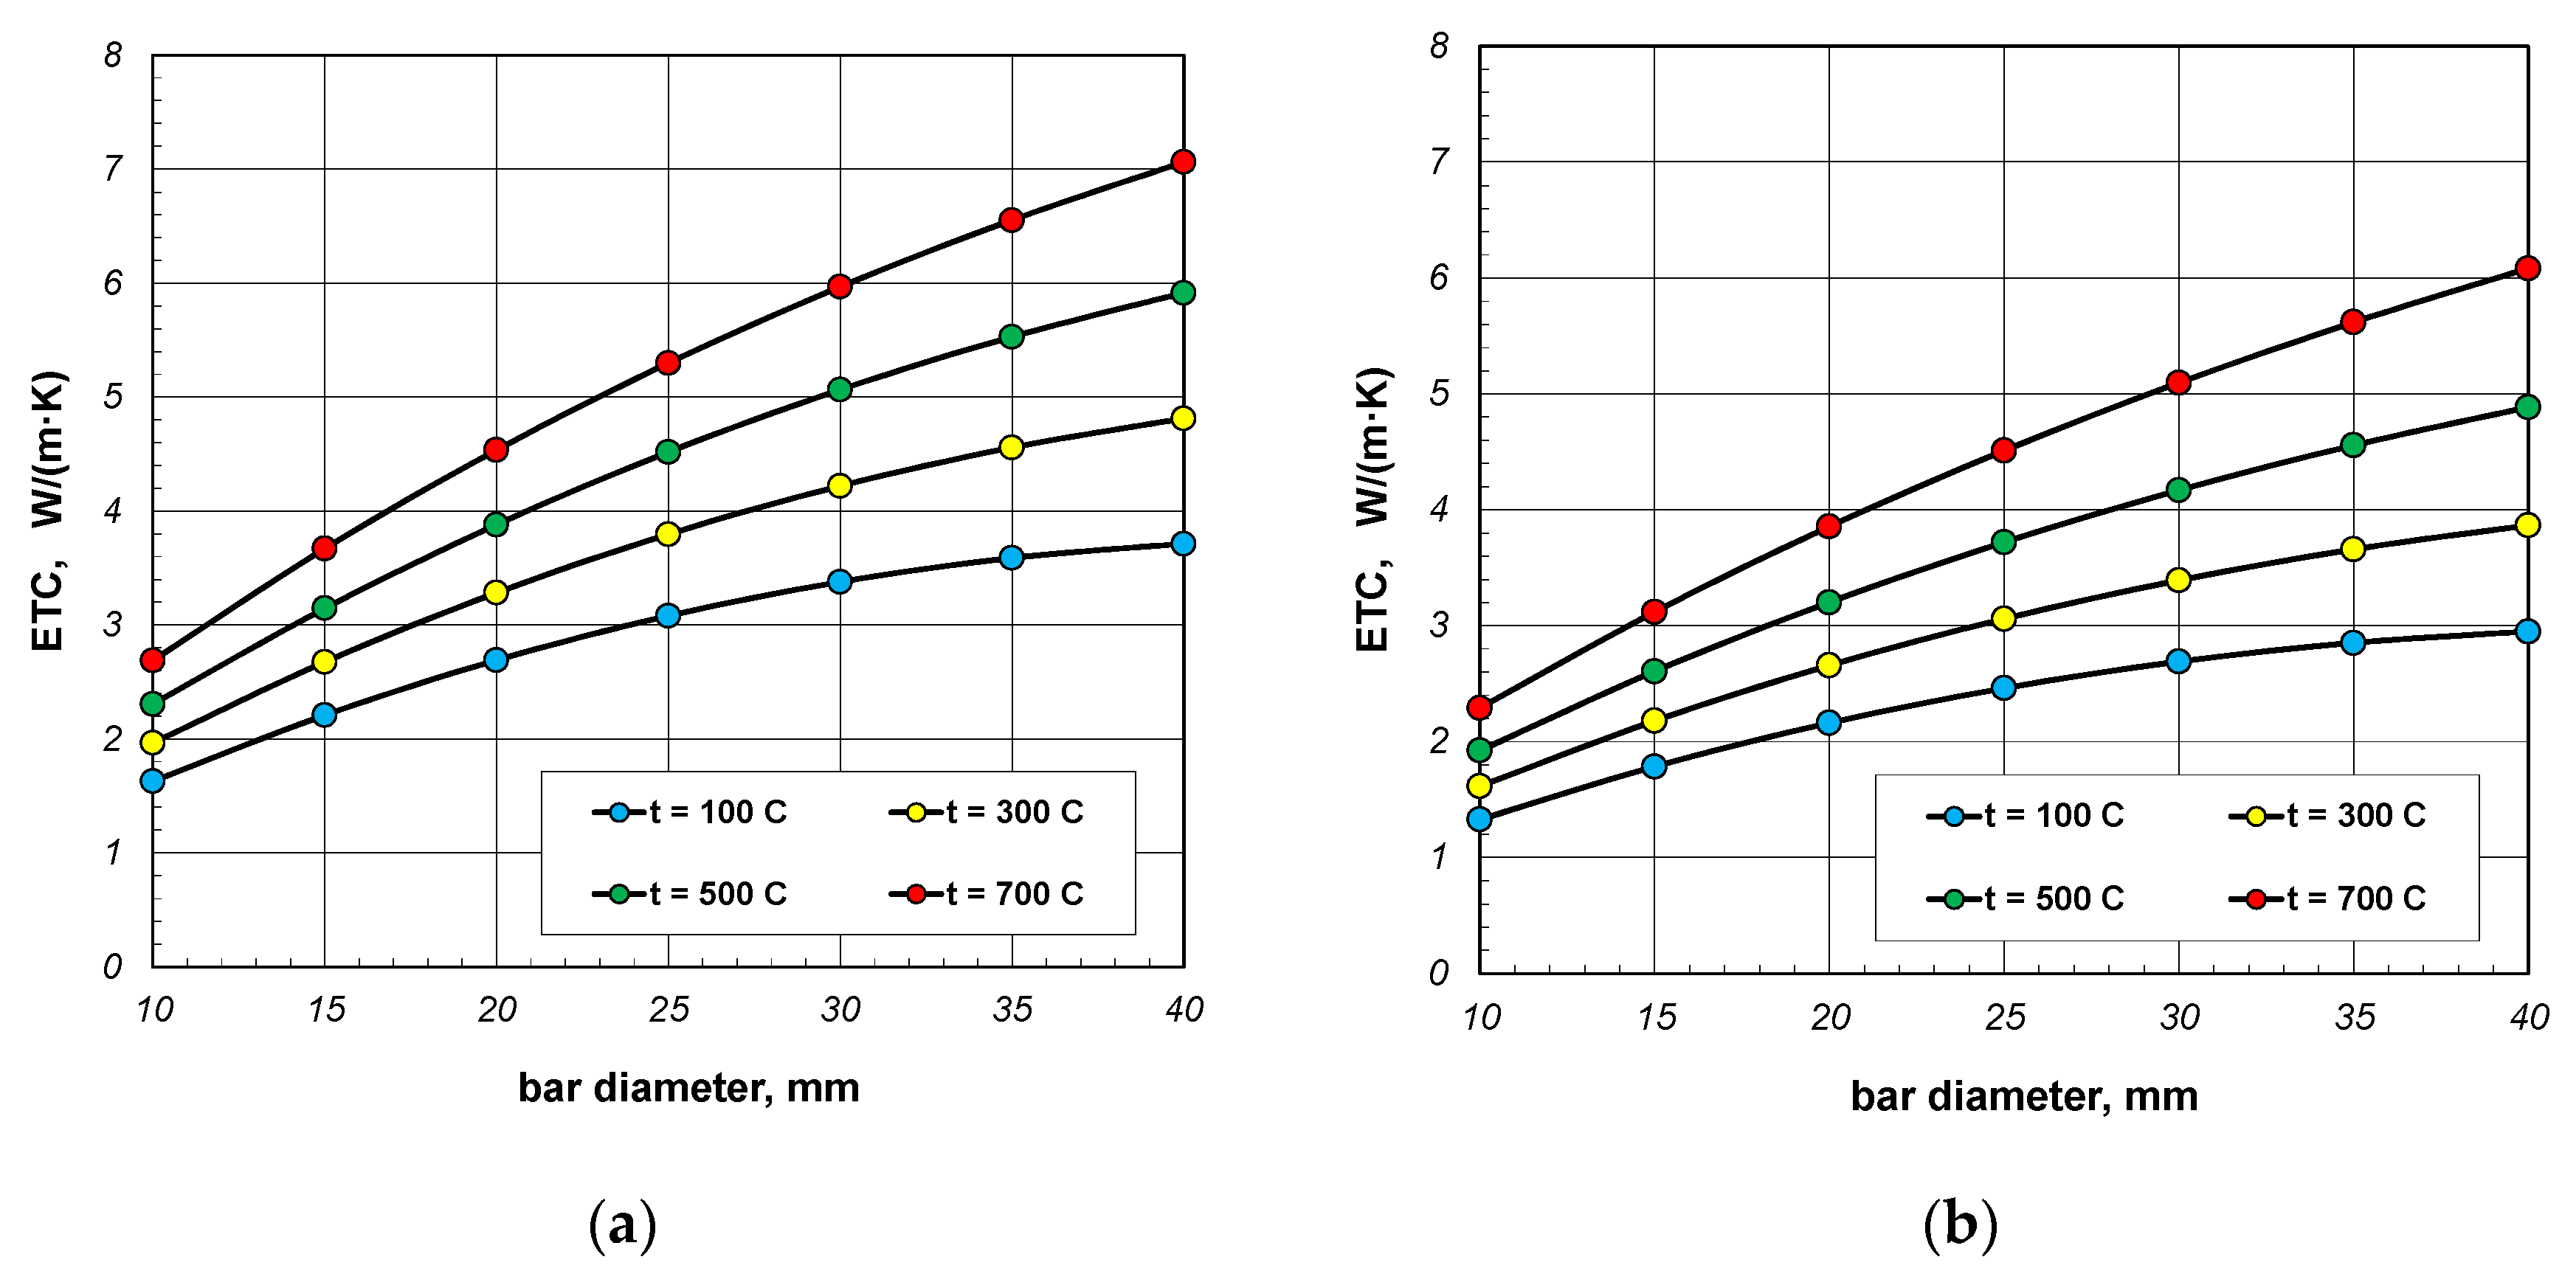
Figure 6.
Effective thermal conductivity of the bar bundle depending on bar diameter and temperature: (a) bundle porosity 0.09 (xg = 0) and (b) bundle porosity 0.21 (xg = 0.4).
The results from Figure 6 show the changes in ETC as a function of bar diameter for four values of charge temperature: 100, 300, 500, and 700 °C. The lines in these charts are not straight. The changes in bundle ETC as a function of bar diameter can be described using a second-degree polynomial:
where the constants A1, B1, and C1 depend on the temperature and porosity of the charge.
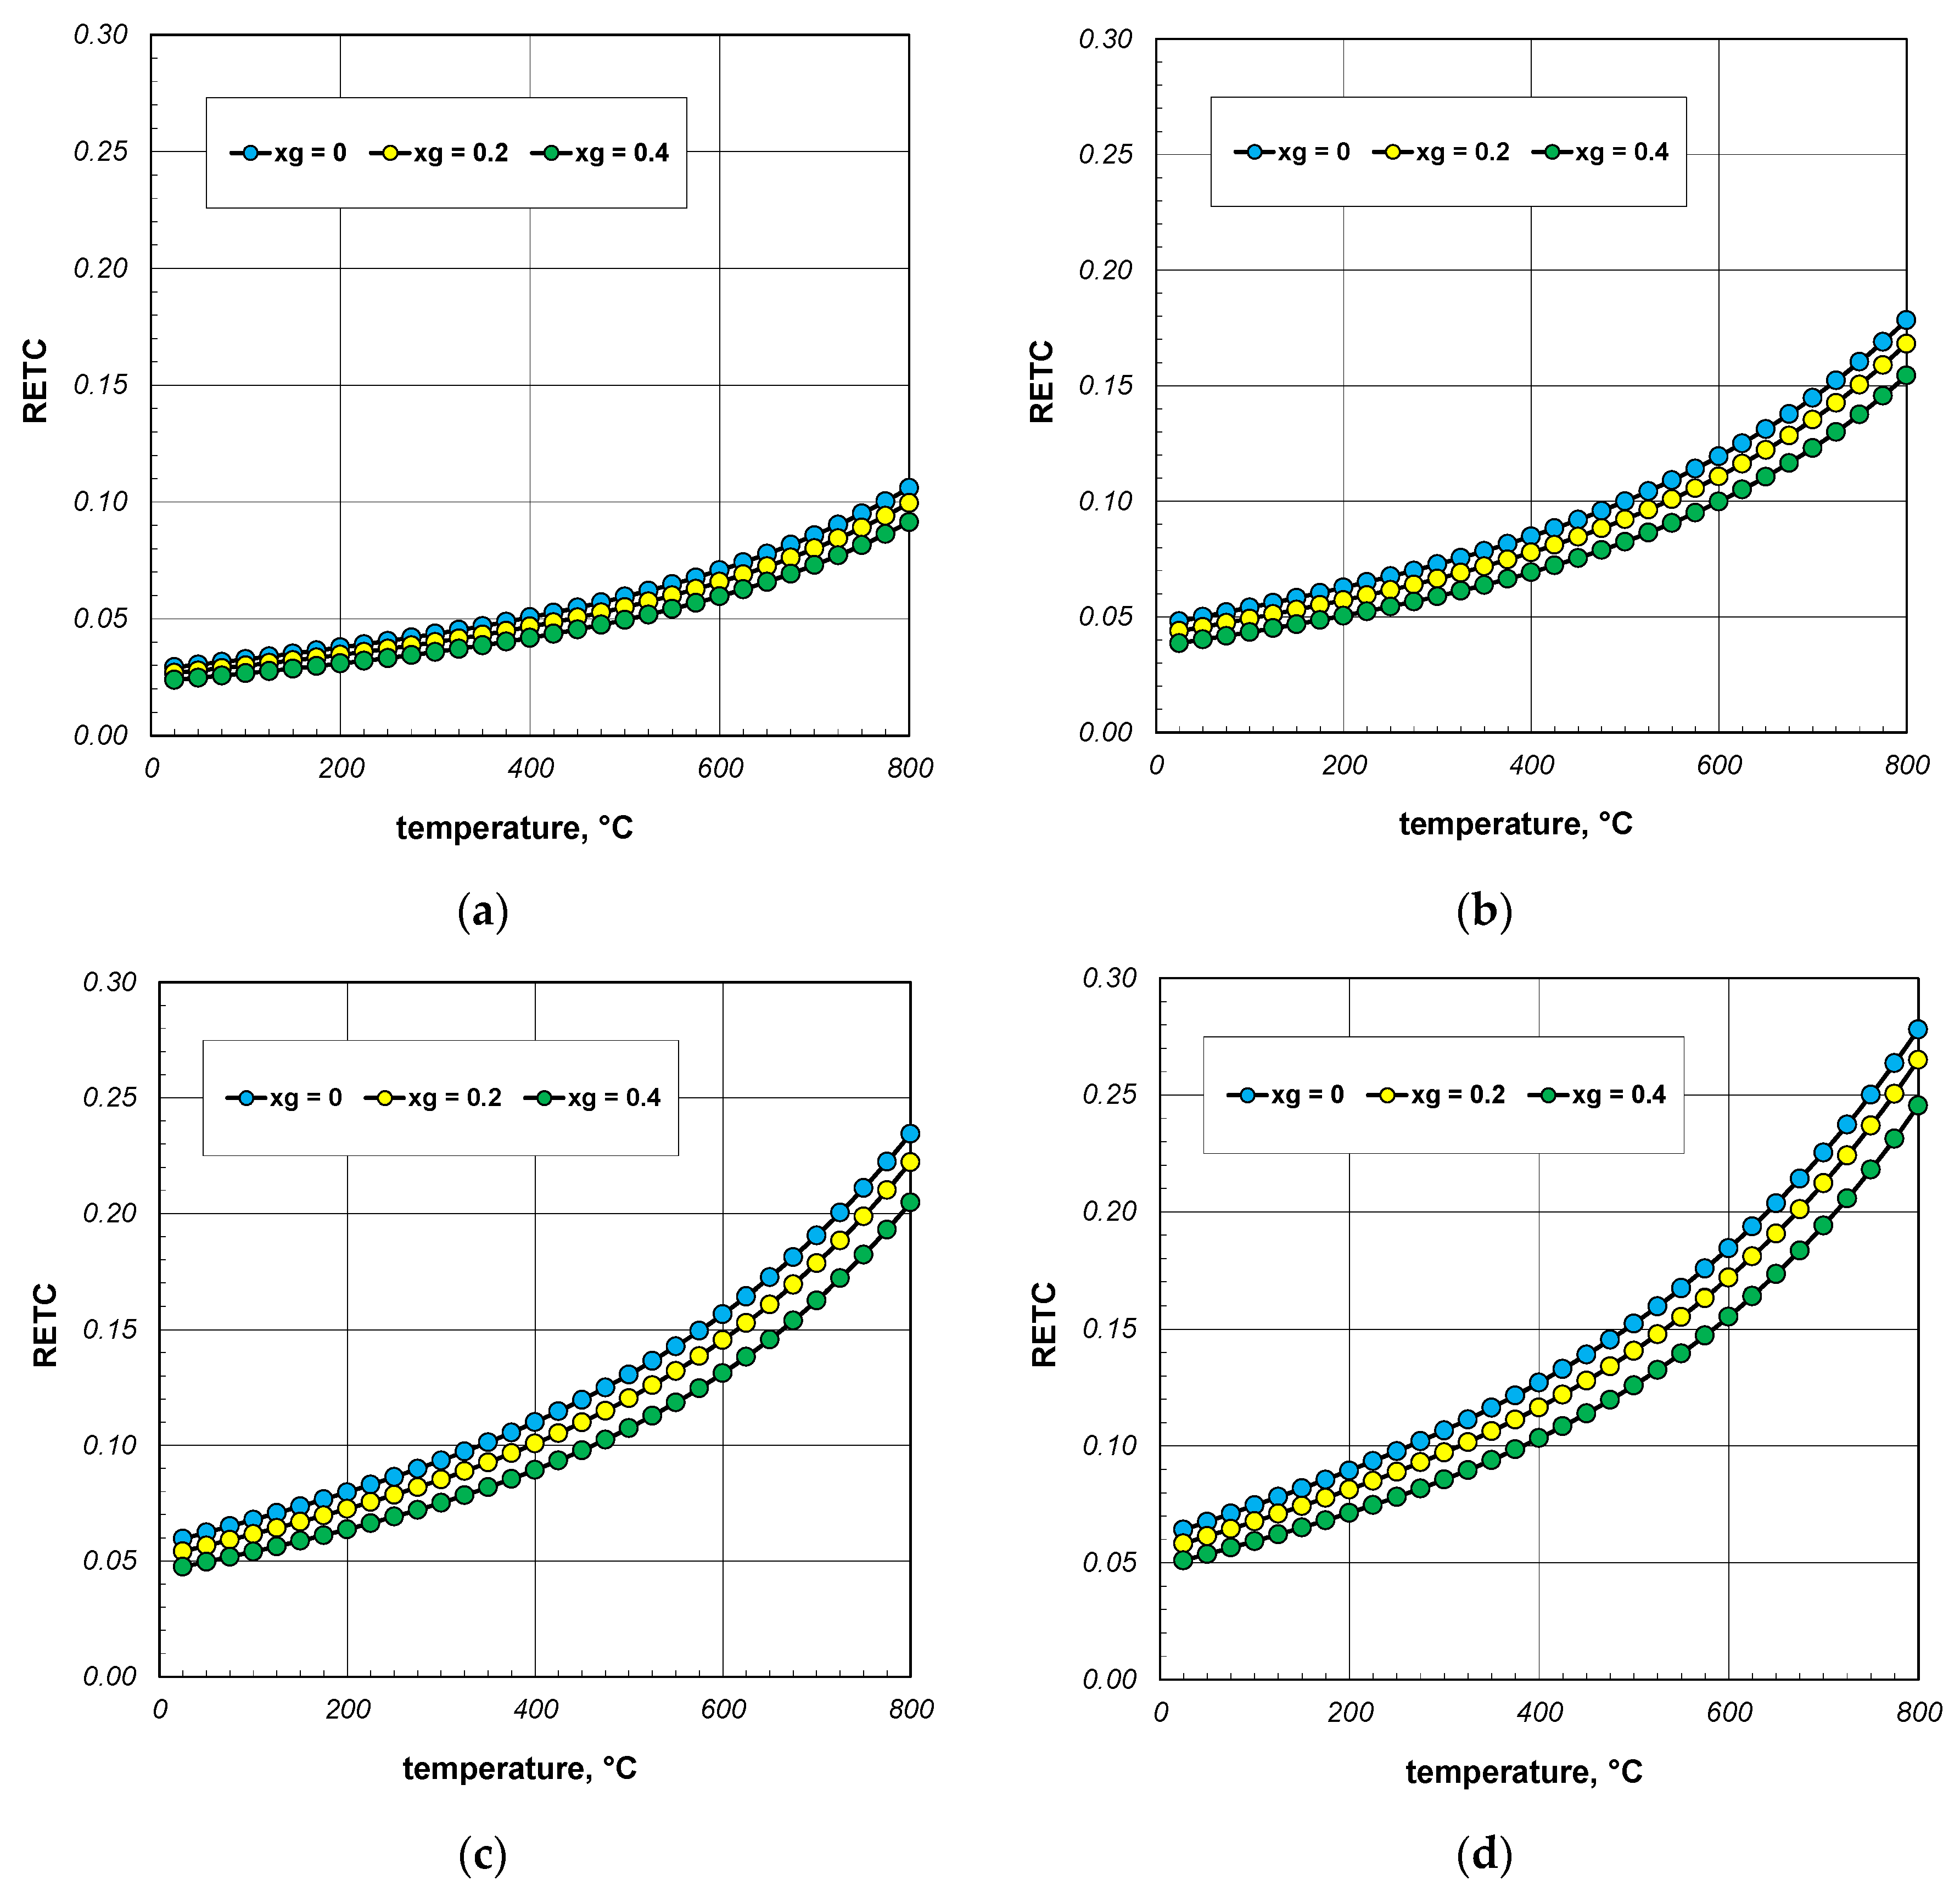
An important problem when analyzing the heat transfer in a bar bundle is the grade to which the ETC value differs from the thermal conductivity of the bars, expressed by the ks coefficient. The difference between the values of these two parameters shows the extent to which the process of heat flow in the bundle differs from heat conduction in the steel itself. This discrepancy was shown using a parameter called reduced effective thermal conductivity RETC, which was defined as the product of:
Graphs with the results of the RETC parameter calculations are presented in Figure 7. The discussed quantity increases significantly as a function of temperature. A similar effect, but with much less intensity, causes an increase in the bar diameter. For all cases considered, RETC ranges from 0.03 to 0.28, with an average value of approximately 0.12. These results indicate that the intensity of heat flow in the bar bundle is approximately an order of magnitude smaller than that of conduction in the bars. This shows how different the physical process of heating a bundle is from that of heating a solid steel charge.
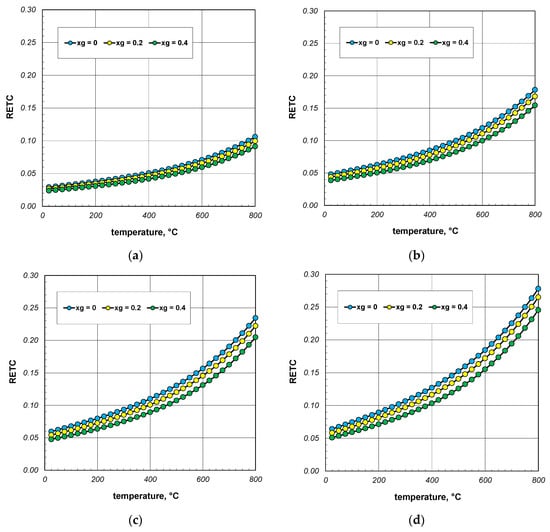
Figure 7.
Reduced effective thermal conductivity of the bar bundle depending on the temperature and porosity: (a) 10 mm bars, (b) 20 mm bars, (c) 30 mm bars, and (d) 40 mm bars.
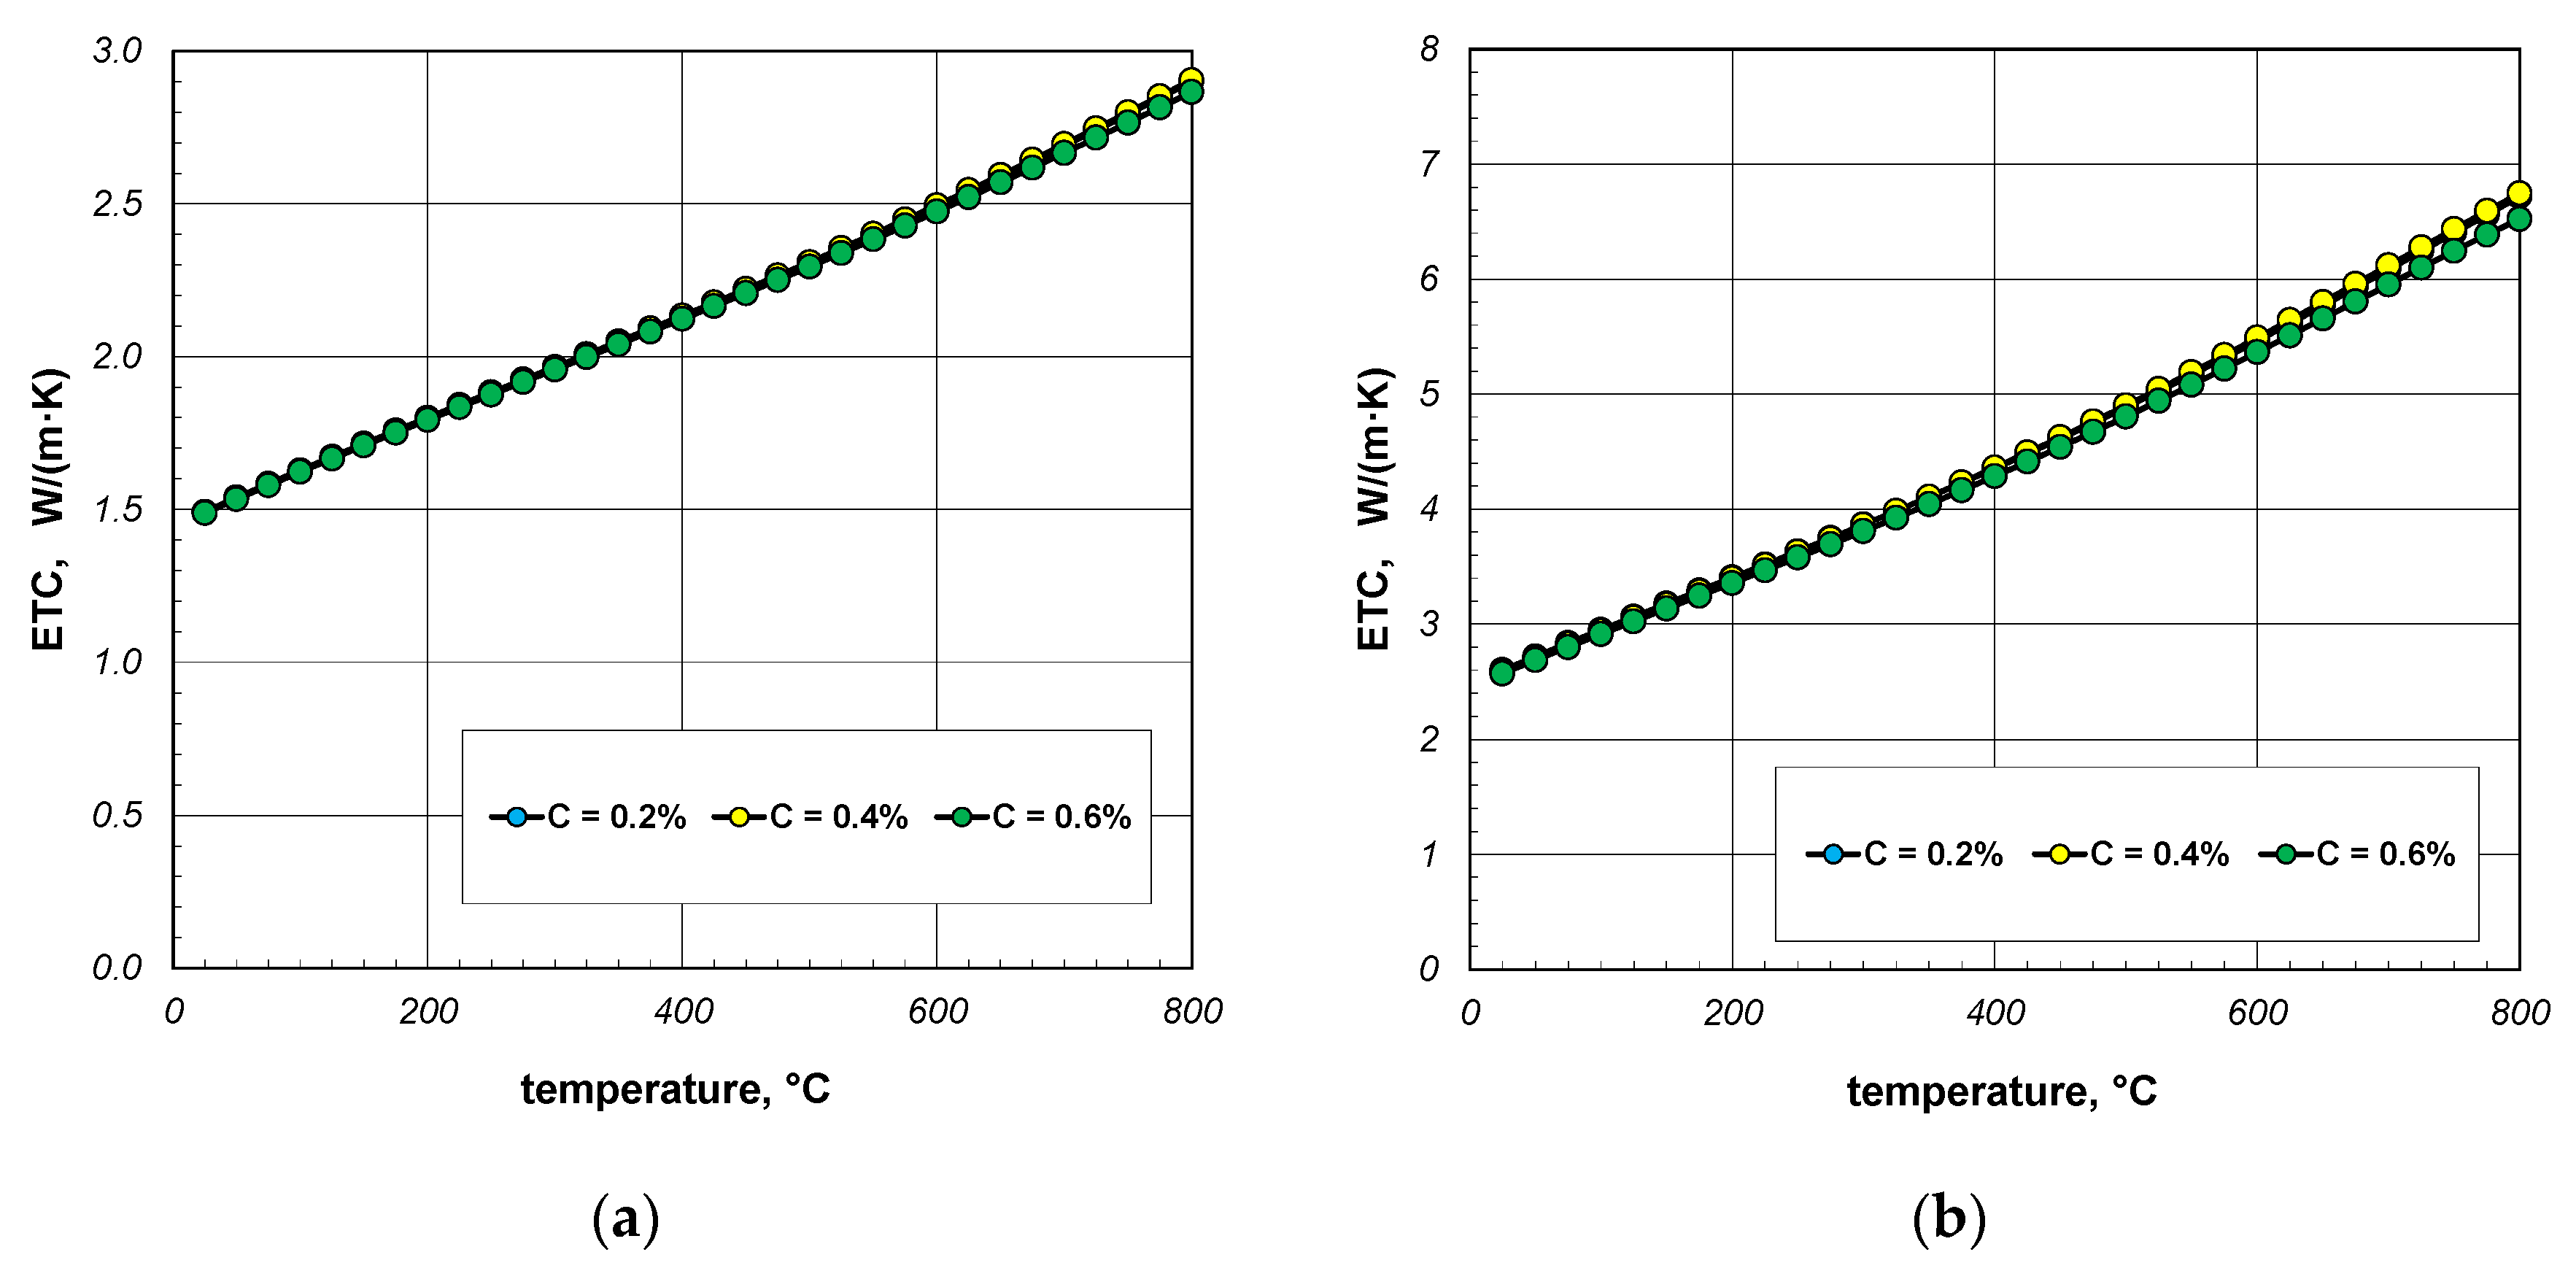
The next stage of the analysis was to investigate the impact of the thermal conductivity of steel on the ETC of the bundle. Calculations were made for three steels with a carbon content of 0.2%, 0.4%, and 0.6%. The thermal conductivity of these steels was calculated using Equation (31). The values of the ks parameter calculated for selected temperatures are listed in Table 4. The results of ETC calculations for a bundle of 10 mm bars and a porosity of 0.09 and 0.21 are presented in Figure 8. As can be seen, the thermal conductivity of the bars has a negligible impact on the ETC value. Similar results were observed for the 40 mm bar bundle, which is shown in Figure 9.
Table 4.
The values of ks of steel depending on temperature and carbon content.

Figure 8.
ETC of the 10 mm bar bundle depending on temperature and bar thermal conductivity: (a) bundle porosity 0.09 (xg = 0) and (b) bundle porosity 0.21 (xg = 0.4).
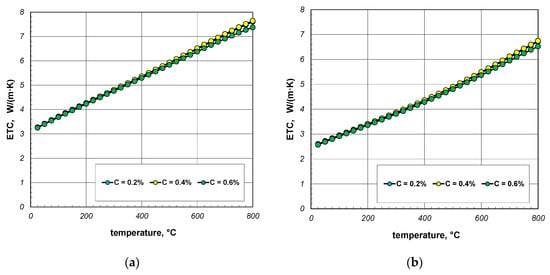
Figure 9.
ETC of the 40 mm bar bundle depending on temperature and bar thermal conductivity: (a) bundle porosity 0.1 (xg = 0) and (b) bundle porosity 0.214 (xg = 0.4).
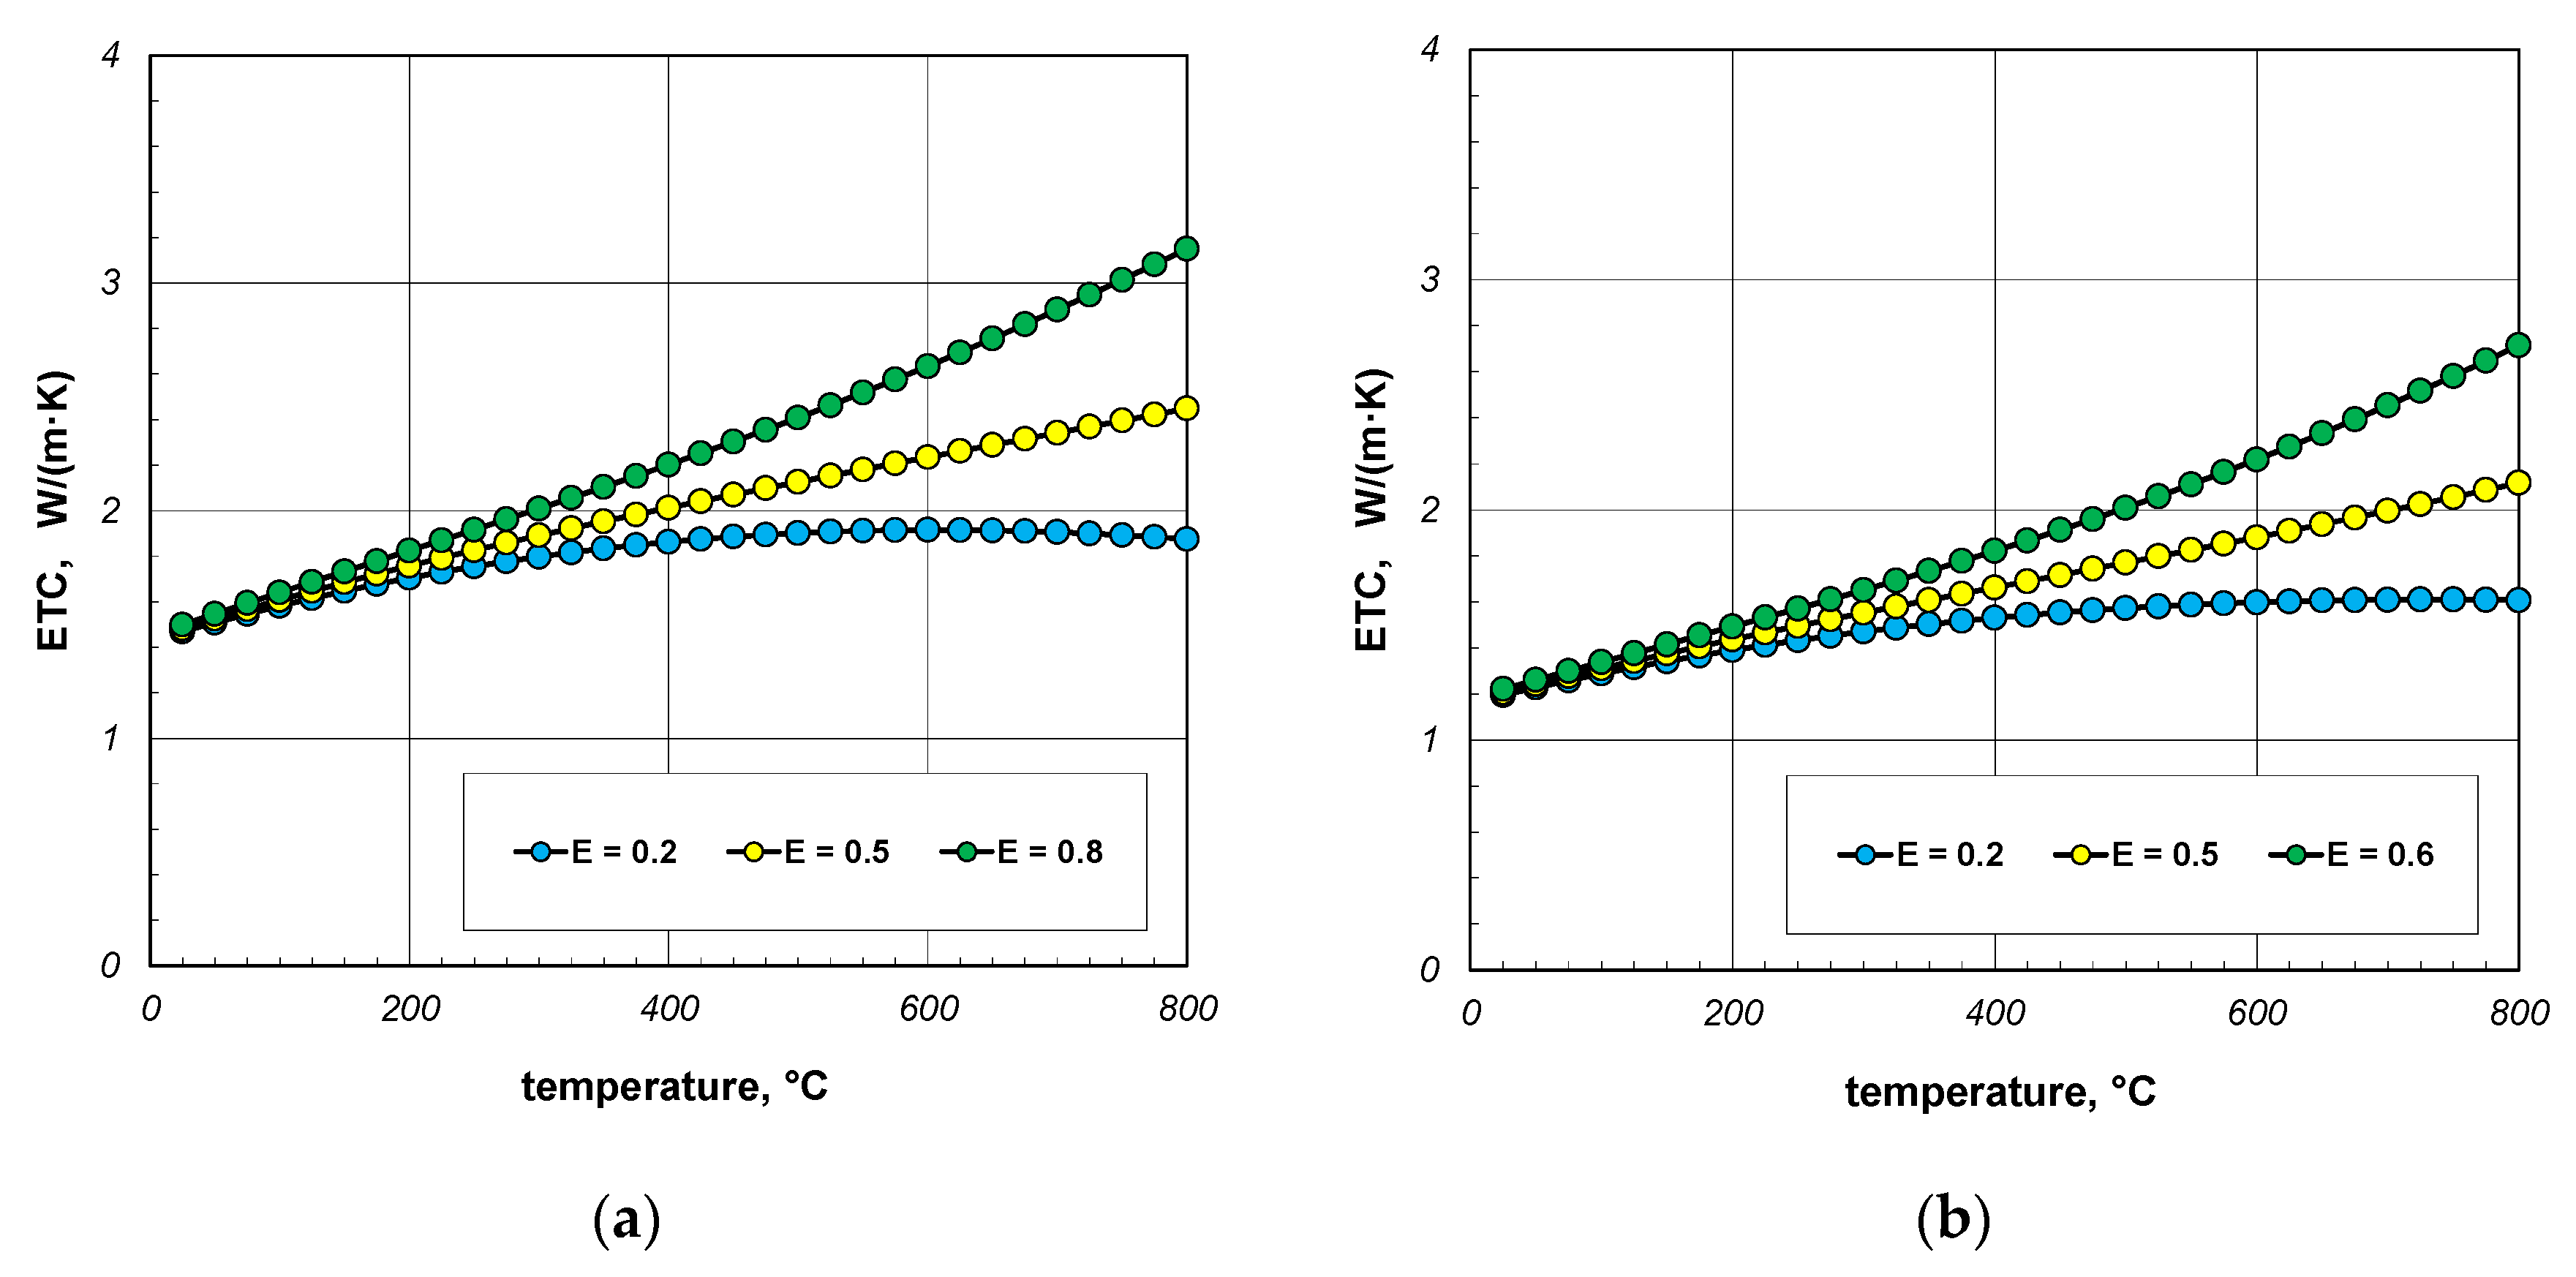
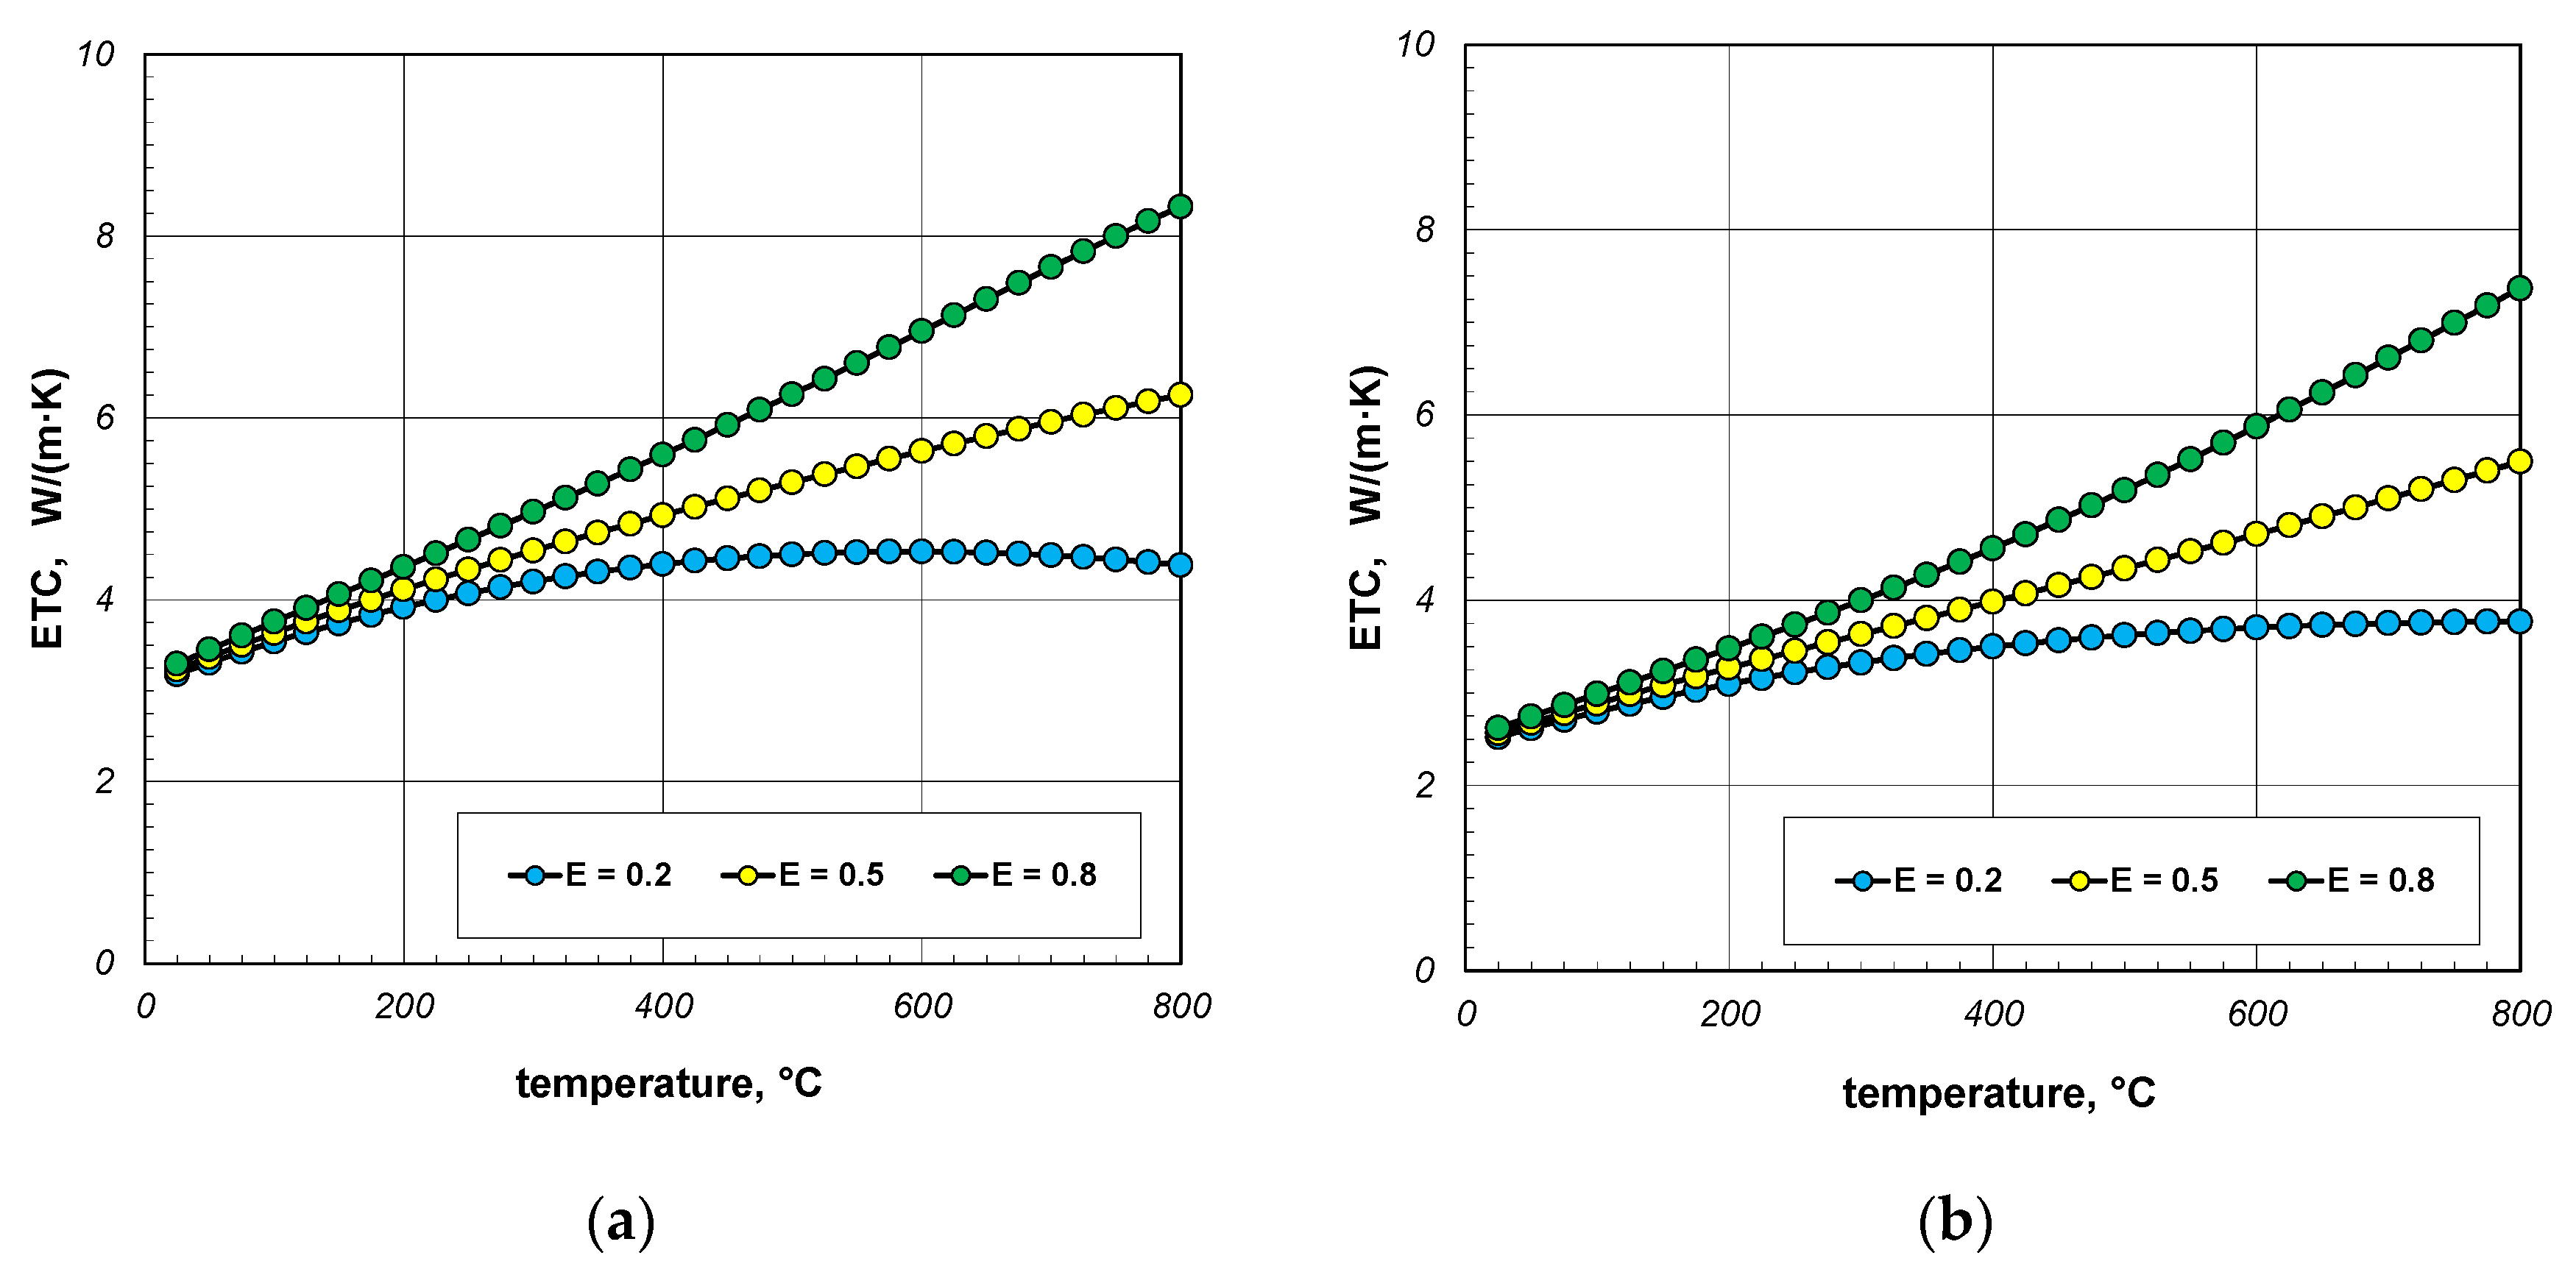
As indicated earlier, the phenomenon of thermal radiation is largely responsible for the increase in ETC as a function of temperature. The intensity of this heat transfer mechanism depends on the state of the bar surface, which is defined in the computational model by emissivity. Depending on the surface quality, the emissivity of steel varies within wide limits [60,61]. Heat-treated bars may also have different surface conditions. Therefore, in the next stage of the research, it was decided to check how the emissivity of the bars affects the ETC of the bundle. Calculations were performed for three values of εb: 0.2, 0.5, and 0.8. The calculation results obtained for 10 mm and 40 mm bars are shown in Figure 10 and Figure 11. For each of the four bundle geometries considered, it can be seen that after exceeding the temperature of 200 °C, the ETC value strongly depends on the bars’ emissivity. These results indicate that in order to correctly calculate the ETC parameter, it is necessary to accurately identify the bars’ emissivity. An incorrect determination of the εb value will result in significant distortion of the calculation results.
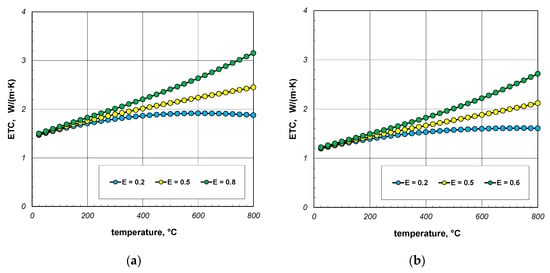
Figure 10.
ETC of the 10 mm bar bundle depending on temperature and bar emissivity: (a) bundle porosity 0.09 (xg = 0) and (b) bundle porosity 0.21 (xg = 0.4).

Figure 11.
ETC of the 40 mm bar bundle depending on temperature and bar emissivity: (a) bundle porosity 0.09 (xg = 0) and (b) bundle porosity 0.21 (xg = 0.4).
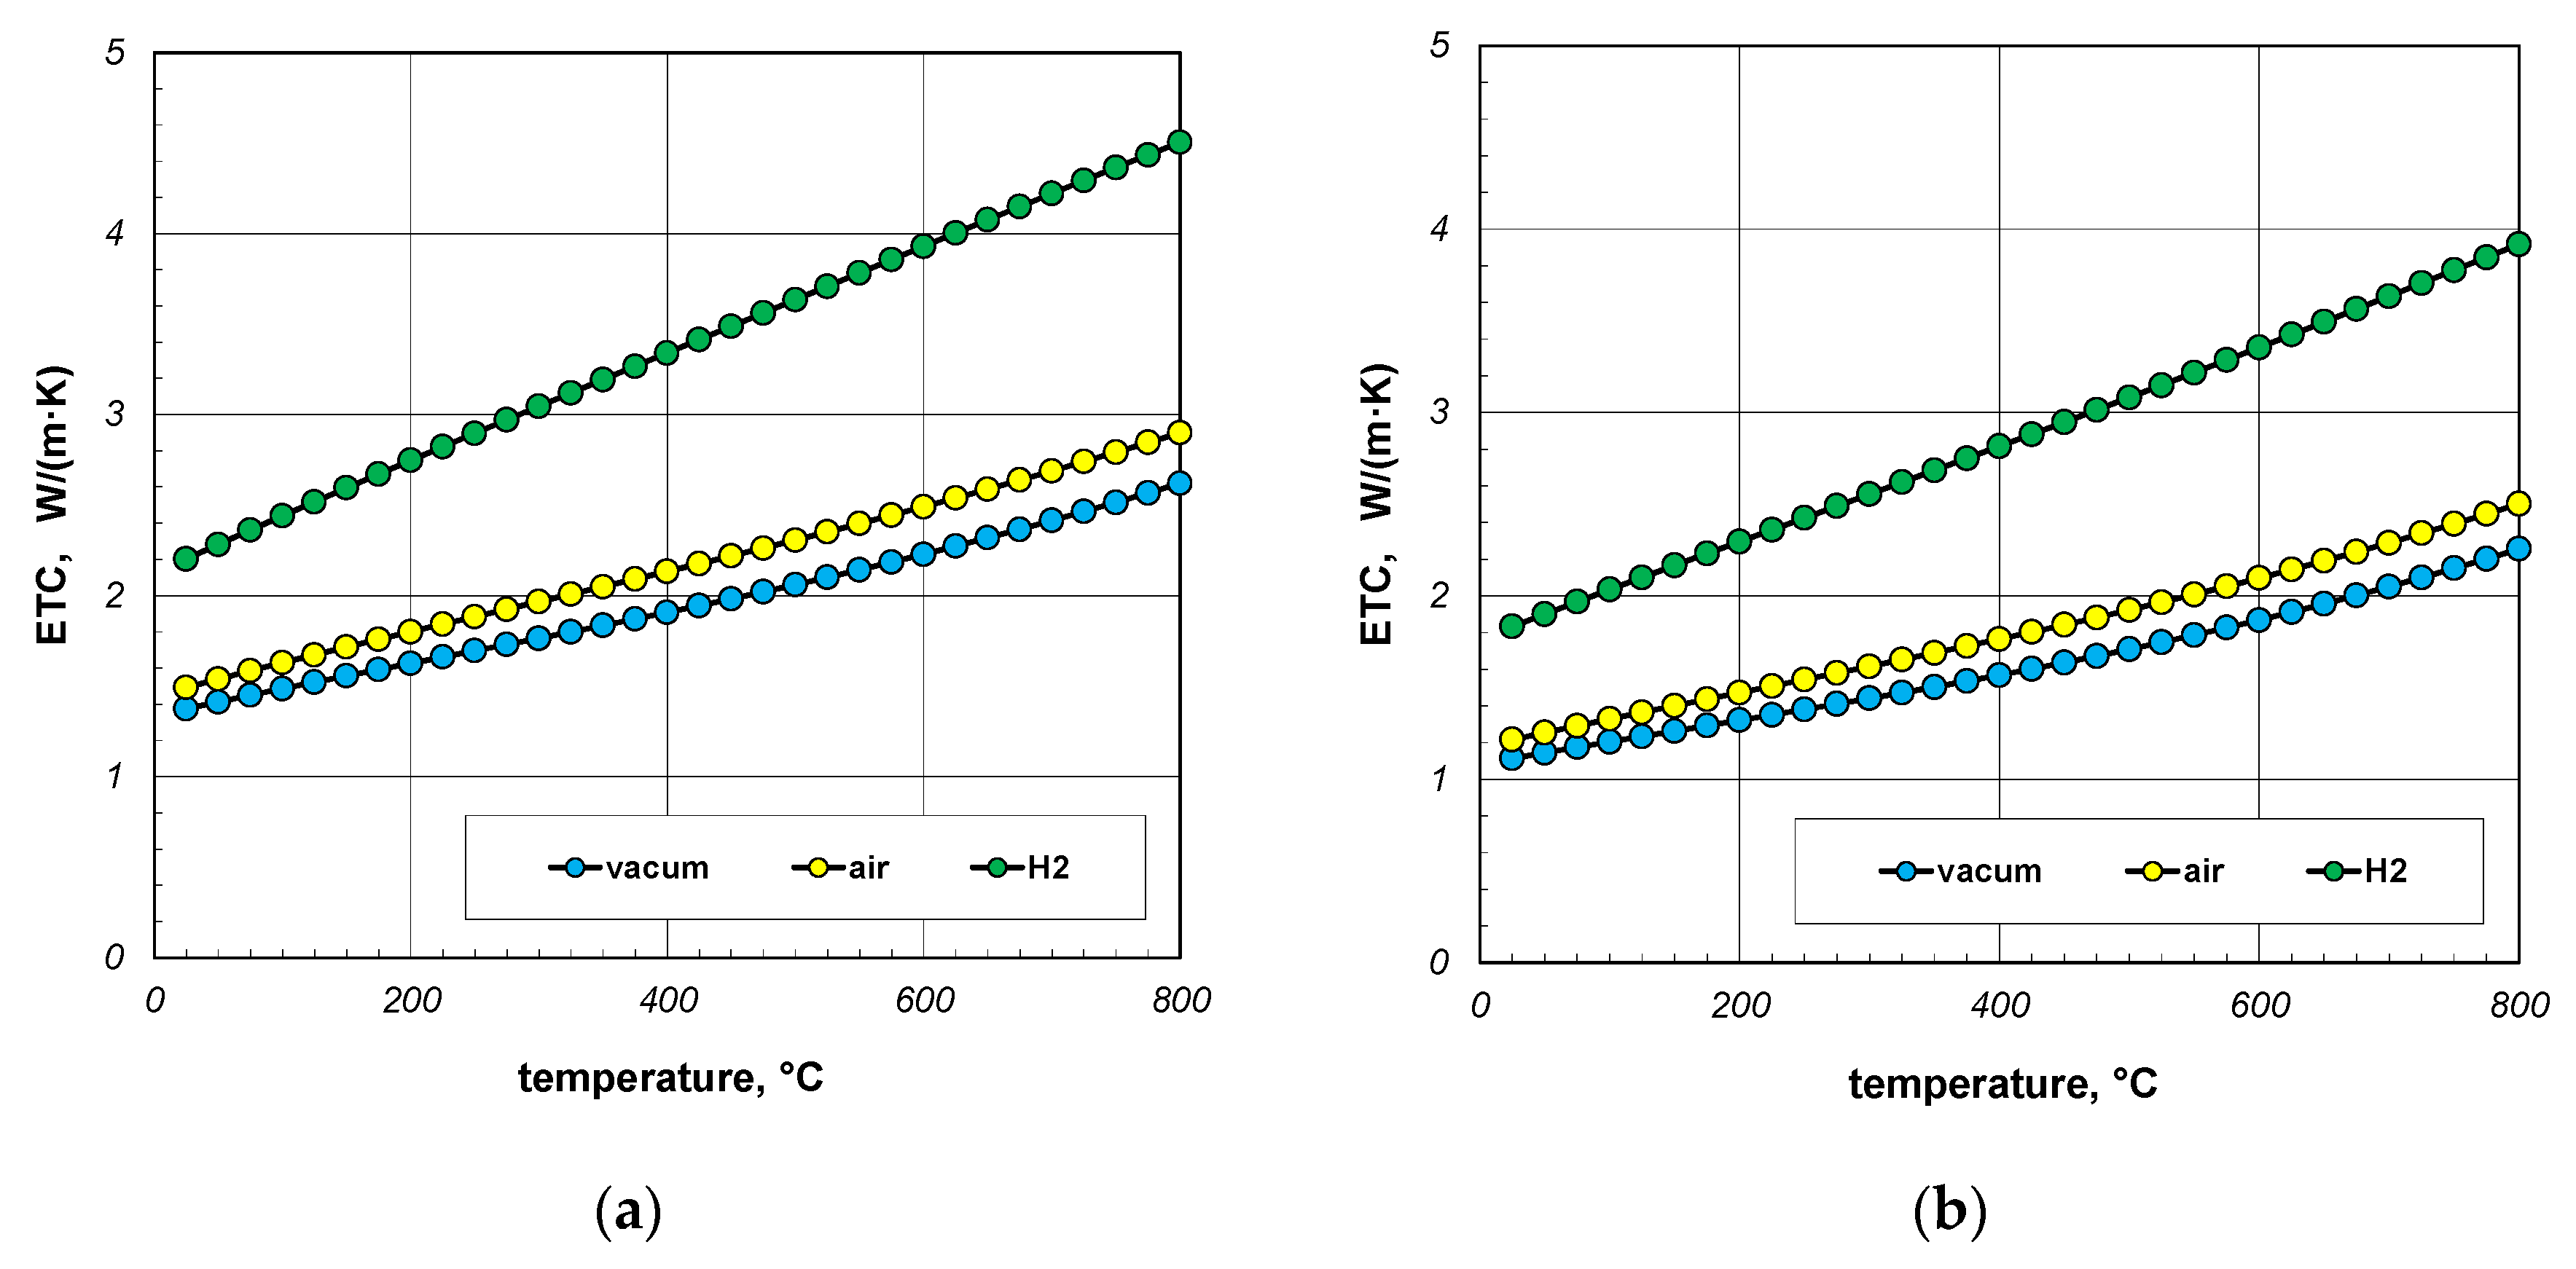
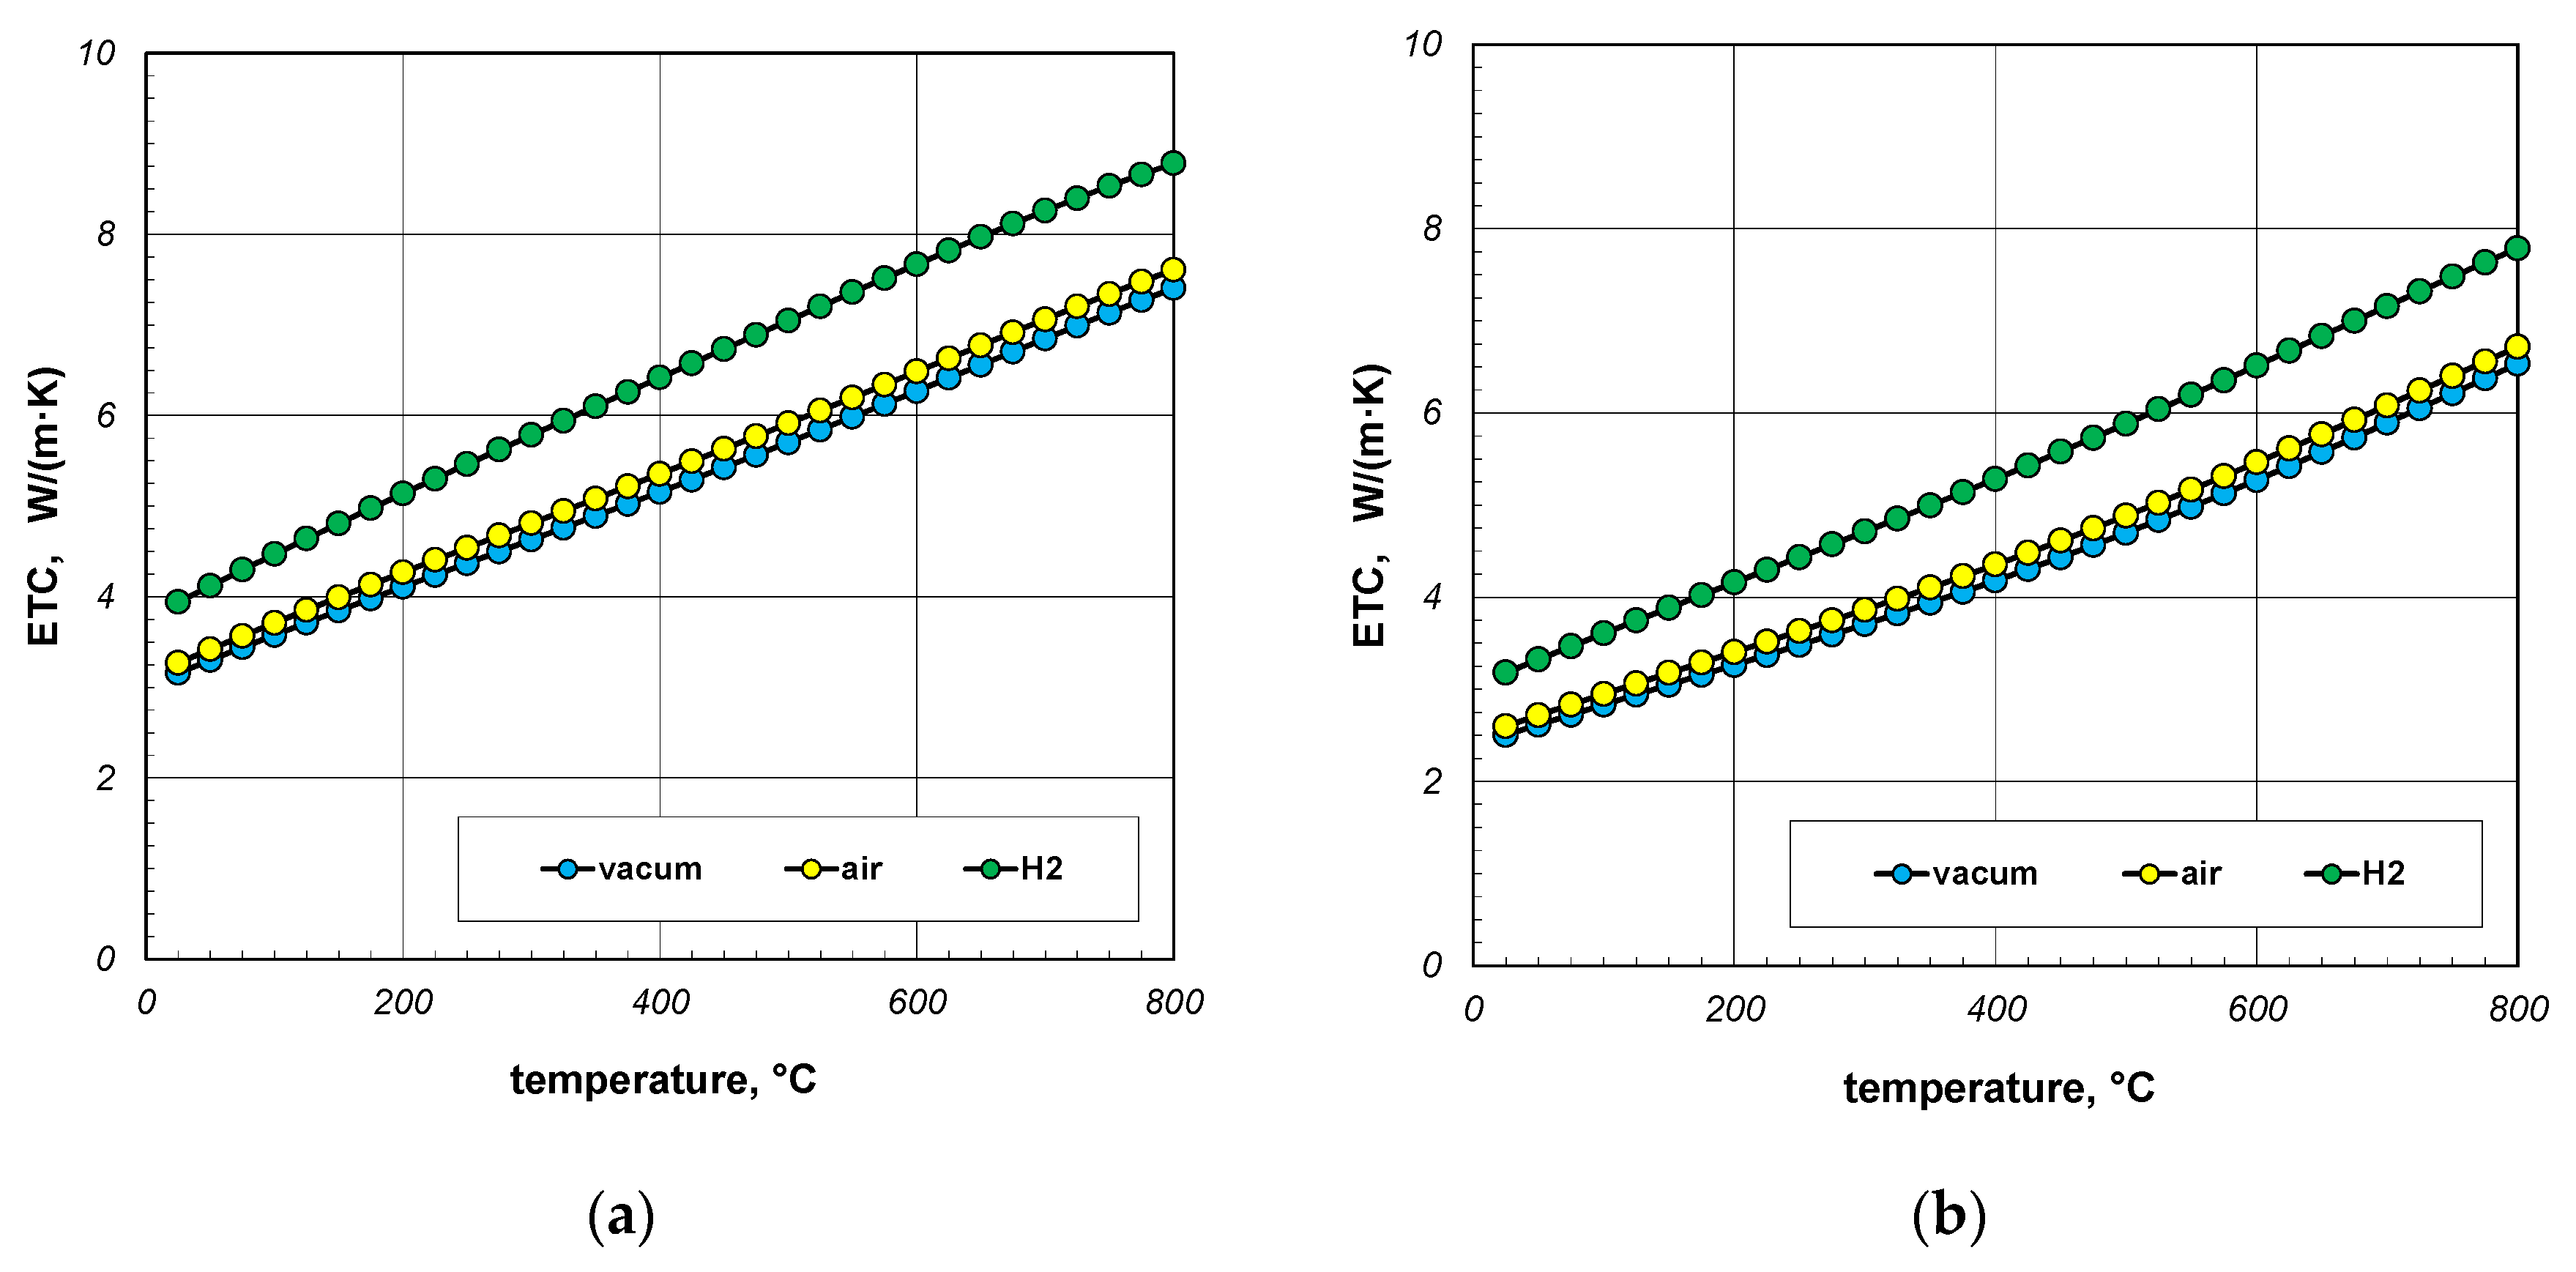
The next point of the analysis was to check how the type of gas used during heating affects the ETC value. Most often, heat treatment of steel products is carried out without the use of a protective atmosphere, i.e., in atmospheric air. However, in many cases, technological requirements force the use of protective atmospheres. As mentioned earlier, hydrogen is often used as a protective gas in the heat treatment of steel products. In special cases, heat treatment is carried out in vacuum furnaces [62,63]. The use of a vacuum has a number of advantages, including eliminating surface oxidation of the heated elements [64]. Calculations in this stage were performed for three cases: vacuum, air, and hydrogen. In the first situation, conduction in the gas phase was omitted in the calculations. However, in the third case, the thermal conductivity of the gas was calculated using Equation (33). The calculation results, taking into account the type of gas obtained for 10 mm and 40 mm bar bundles, are presented in Figure 12 and Figure 13.
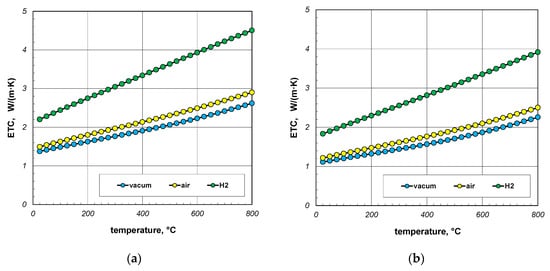
Figure 12.
ETC of the 10 mm bar bundle depending on temperature and type of atmosphere: (a) bundle porosity 0.09 (xg = 0) and (b) bundle porosity 0.21 (xg = 0.4).
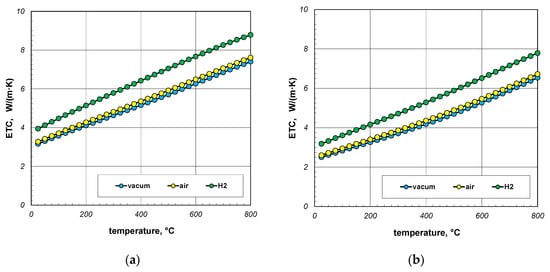
Figure 13.
ETC of the 40 mm bar bundle depending on temperature and type of atmosphere: (a) bundle porosity 0.09 (xg = 0) and (b) bundle porosity 0.21 (xg = 0.4).
The calculations performed show that there is no major difference between vacuum and air. Whereas the use of hydrogen results in a significant increase in the ETC value. For a 10 mm bar bundle, replacing air with hydrogen increases the ETC value by approximately 55% (Figure 12). In the case of a 40 mm bar bundle, this increase is close to 20% (Figure 13). Therefore, when heating a bundle, replacing air with hydrogen causes a significant increase in the intensity of this process. This intensification is stronger the smaller the diameter of the bars.
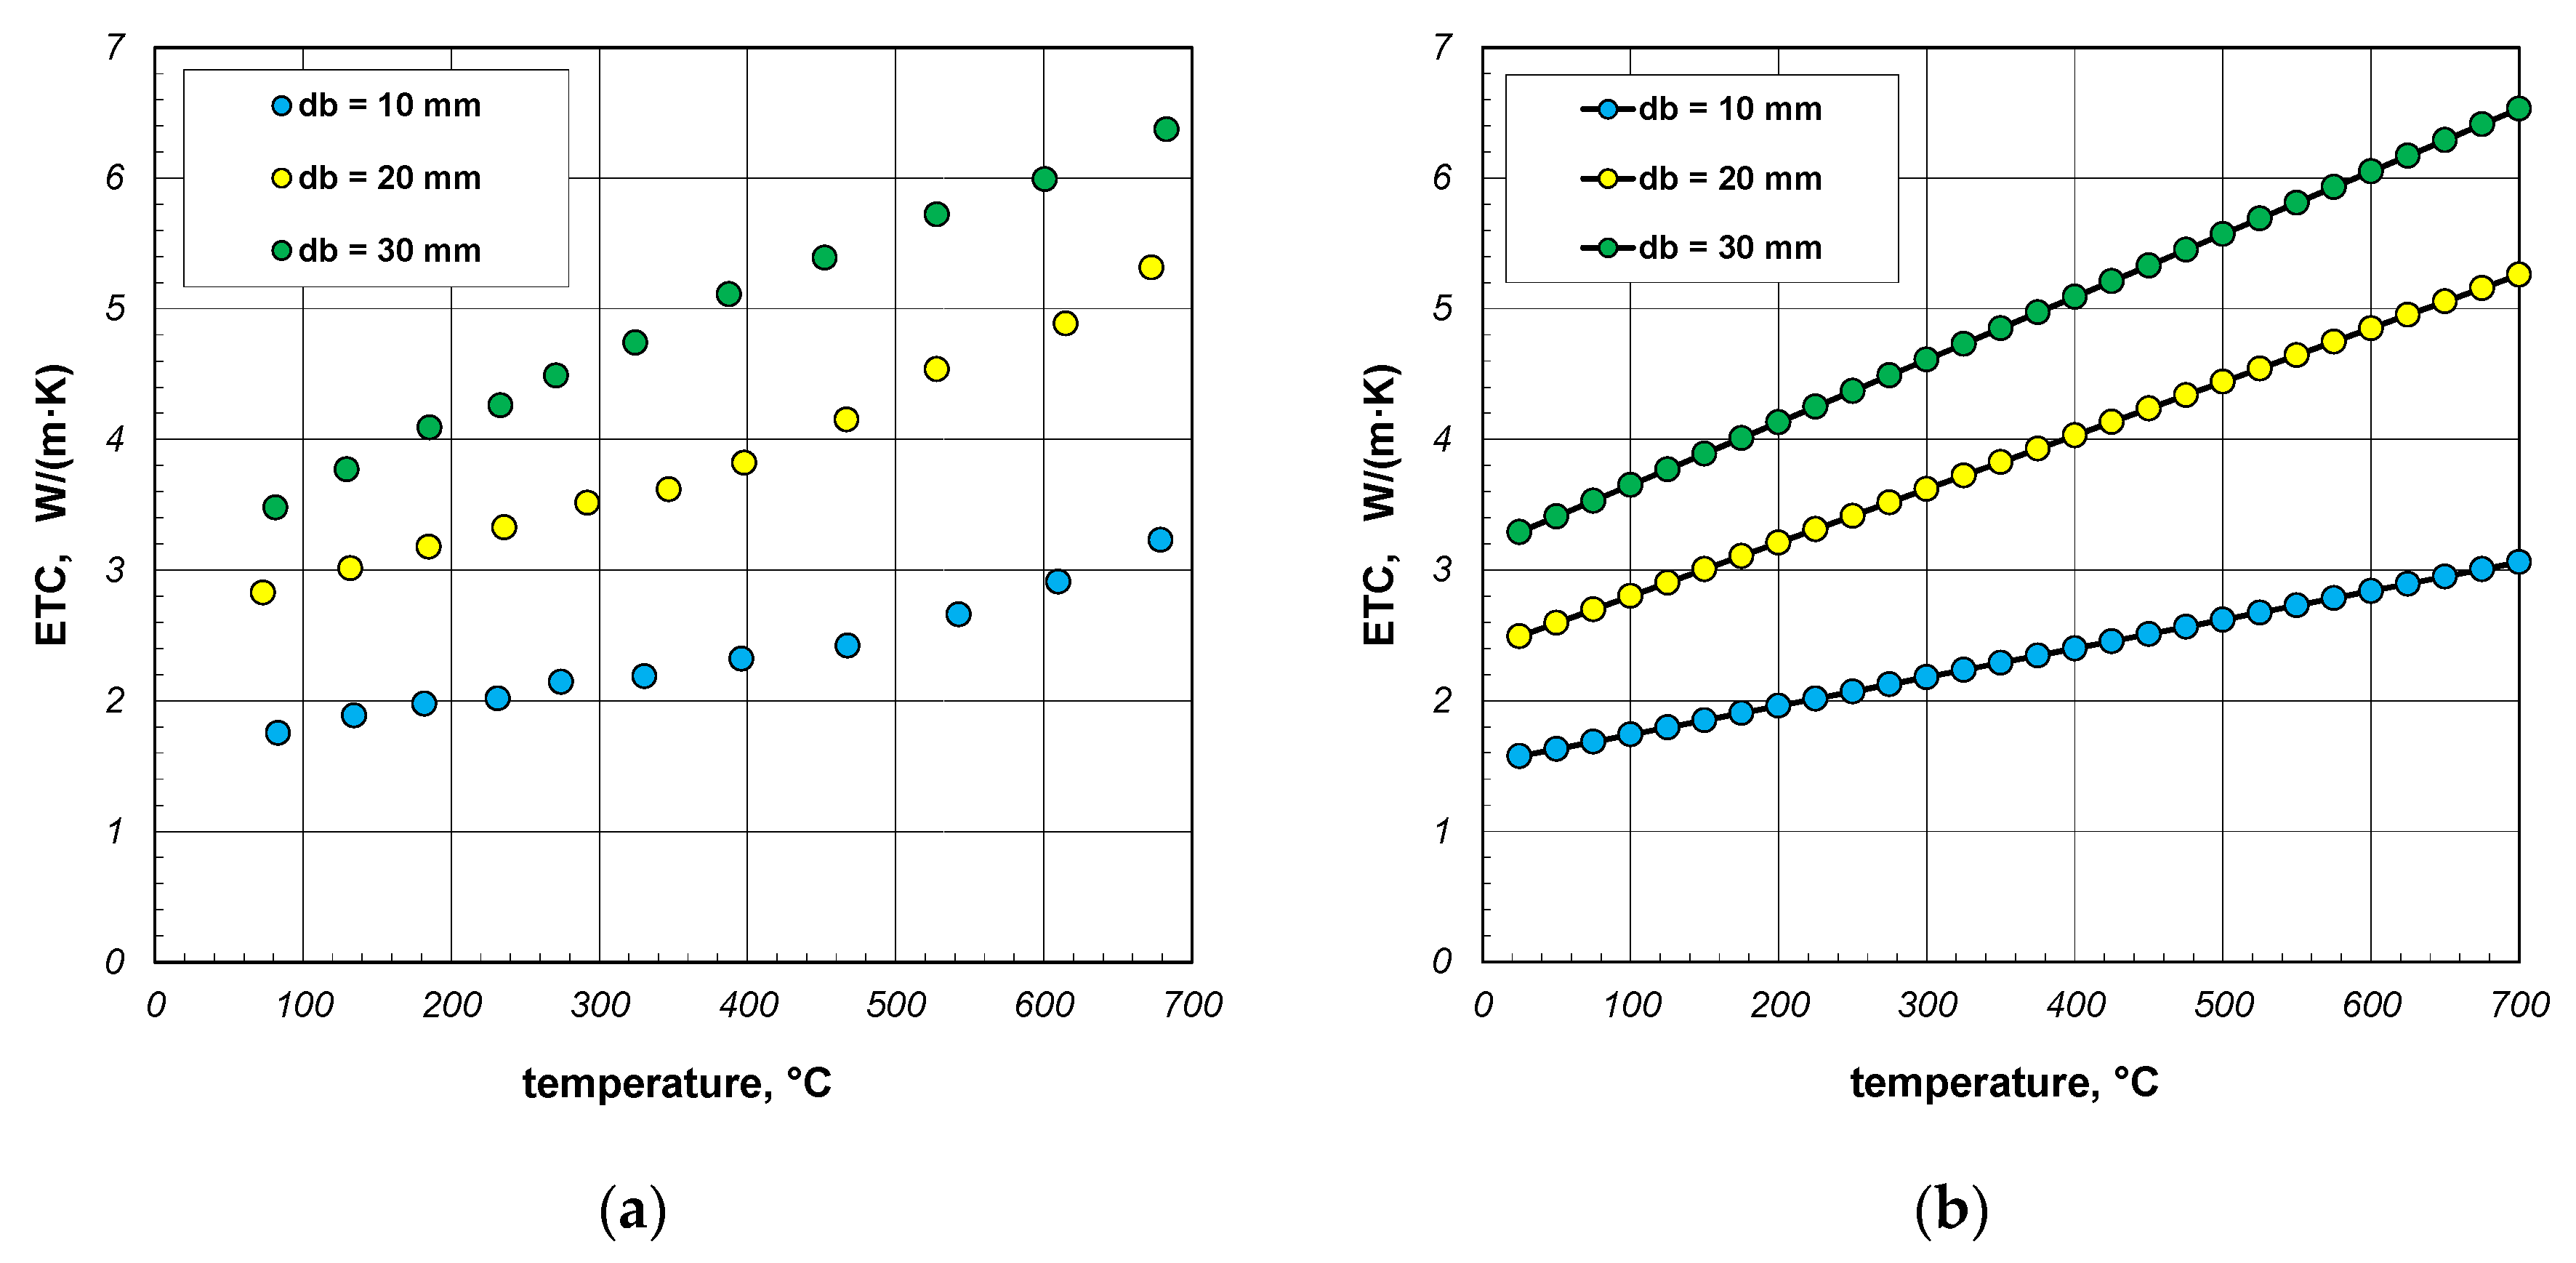
The last part of the analysis presented in this article is to evaluate the accuracy of the results generated by the proposed model. For this purpose, the results of experimental tests on the ETC of bundles of round steel bars, which were described in [41], were used. Measurement results obtained for bar bundles 10, 20, and 30 mm are shown in Figure 14a. For the purposes of further analysis, these values were approximated with linear regression functions. For individual samples, these functions take the following forms:

Figure 14.
Results of experimental tests on the ETC of the round steel bar bundles [34]: (a) measurement data and (b) values smoothed using linear regression equations.
The values of the coefficient of determination R2 for these functions are within the range of 0.962–0.997. Values close to unity indicate that the selected equations are well aligned with the measurement results. The ETC values smoothed using Equations (36)–(38) are shown in Figure 14b.
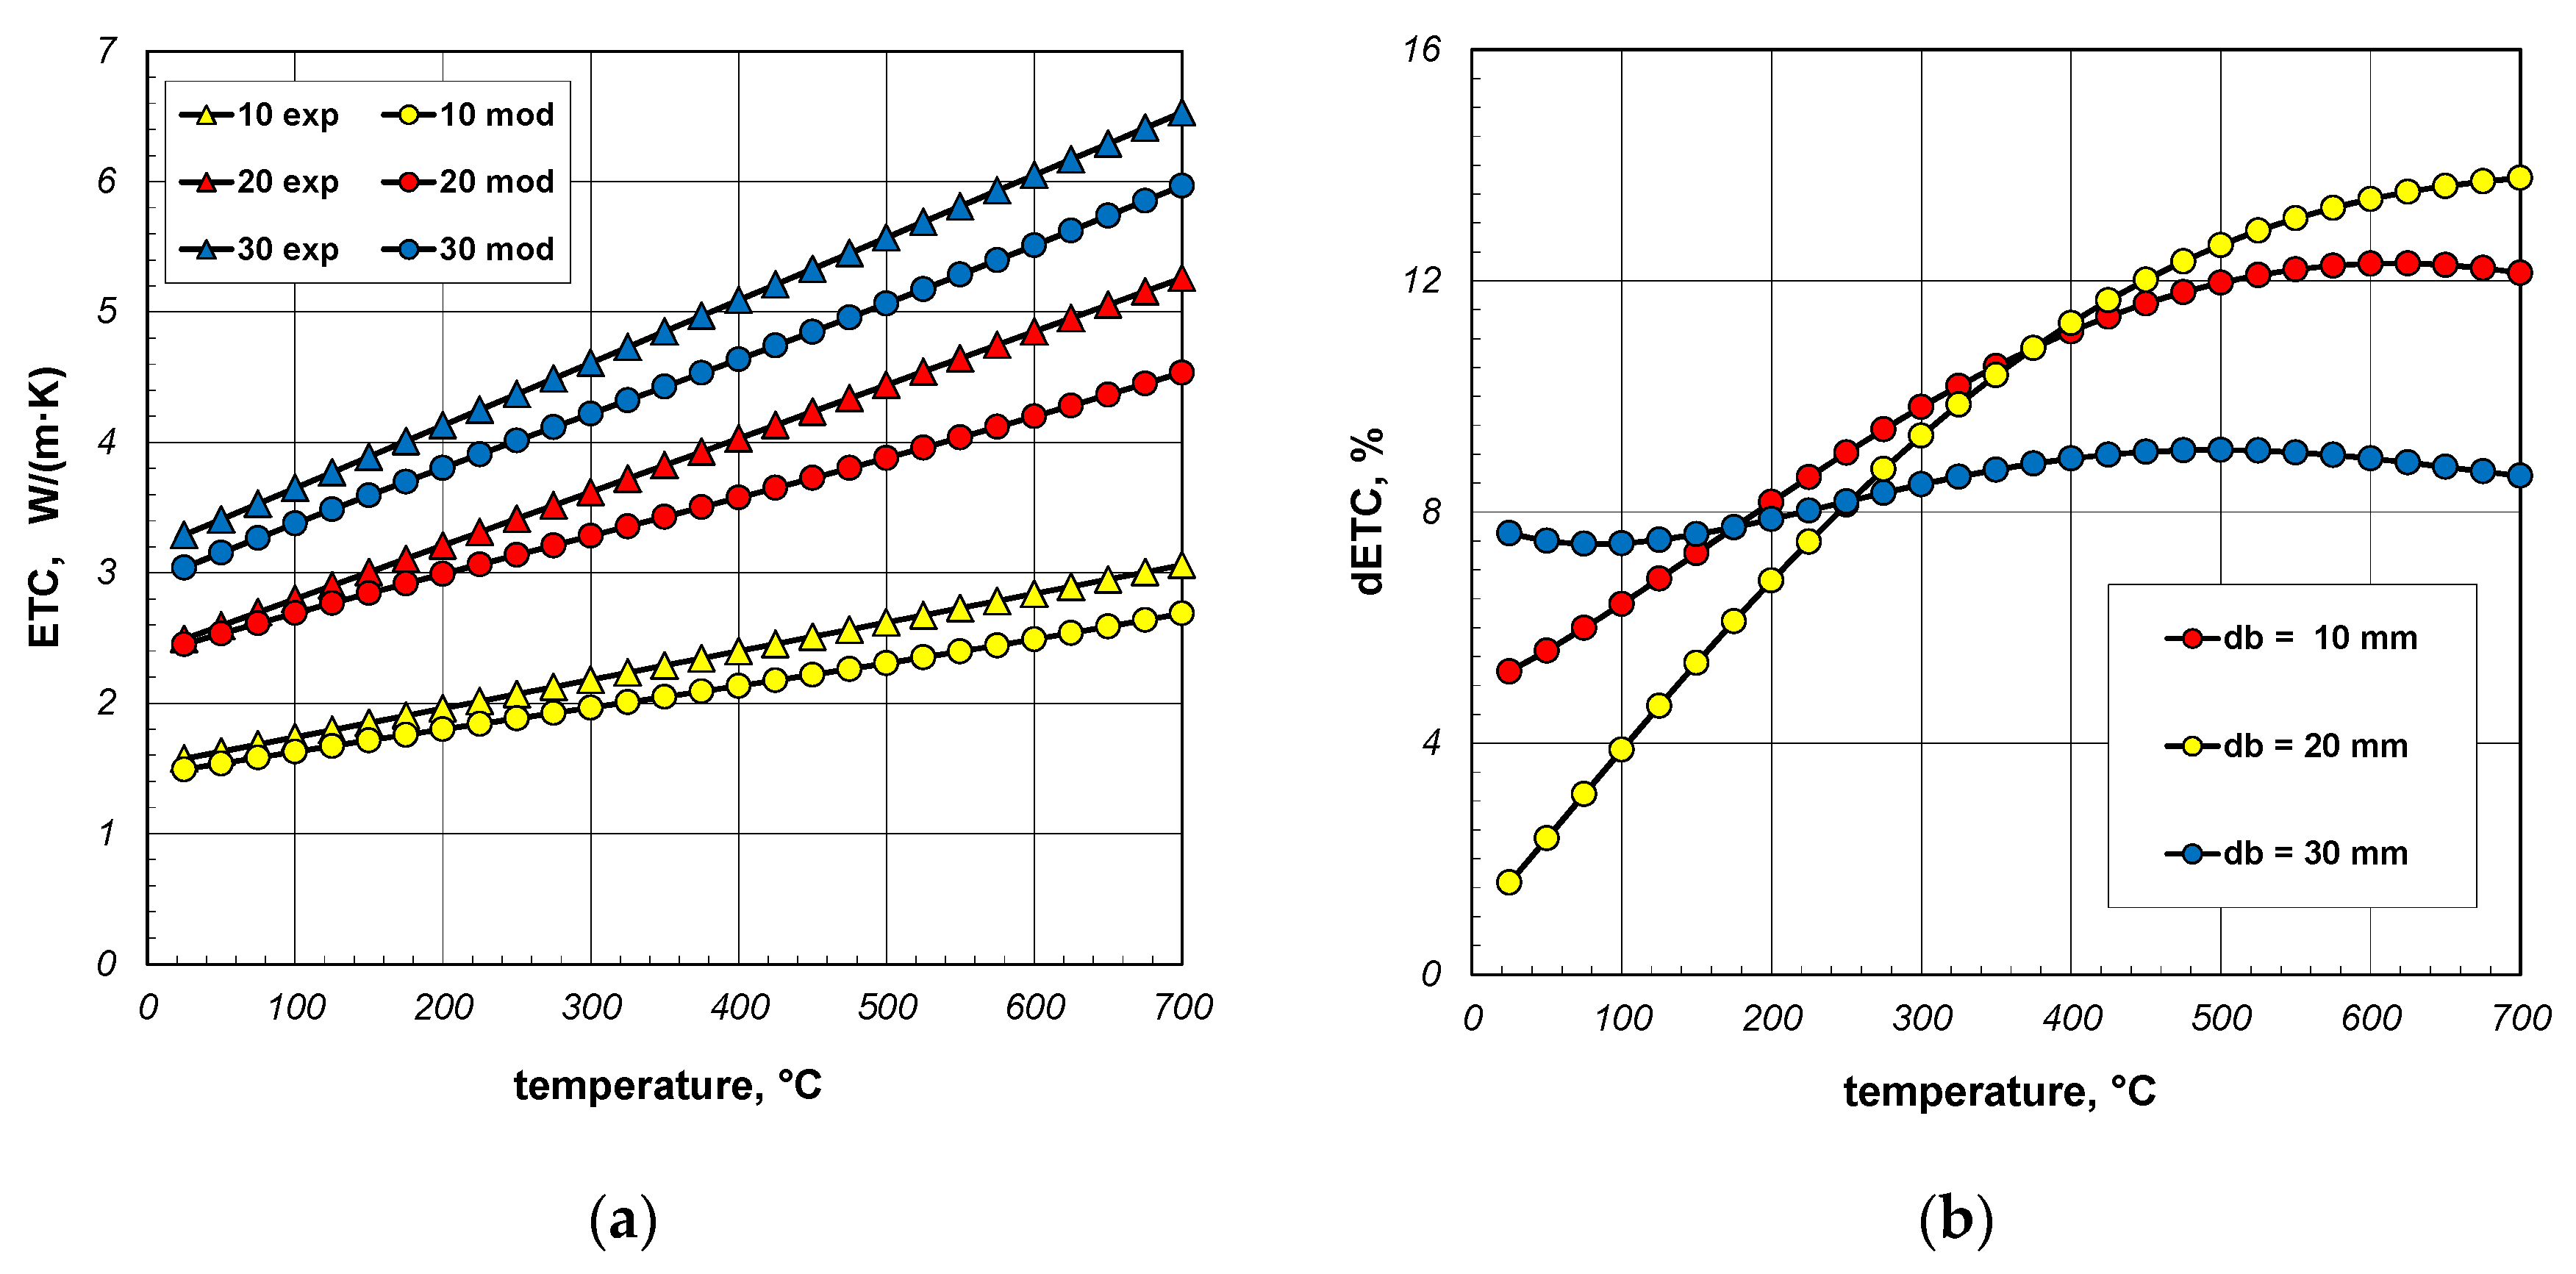
The results of model calculations and smoothed measurement data are compared in Figure 15a. The samples used during experiments were made from S235JRH steel-grade bars. The maximum carbon content in this steel grade is 0.2% [65]. For this reason, this carbon content was assumed in the model calculations when determining the ks value (Equation (31)). It was also assumed that the bar’s emissivity is 0.7. As can be seen, for all bundles the measured values are higher than the model values, and this discrepancy increases with temperature. In order to quantify this difference, the dETC parameter was used, defined by the equation:
where ETCme—measured values, ETCmo—modeled values.
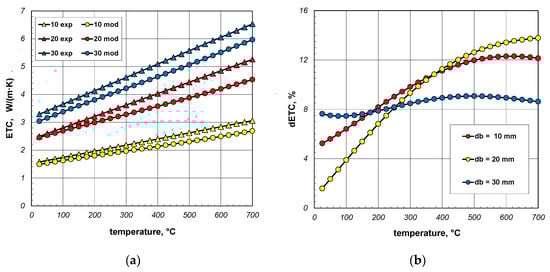
Figure 15.
Comparison of measured and model values of ETC (a) and changes in the dETC parameter (b); results obtained for constant emissivity (εb = 0.7).
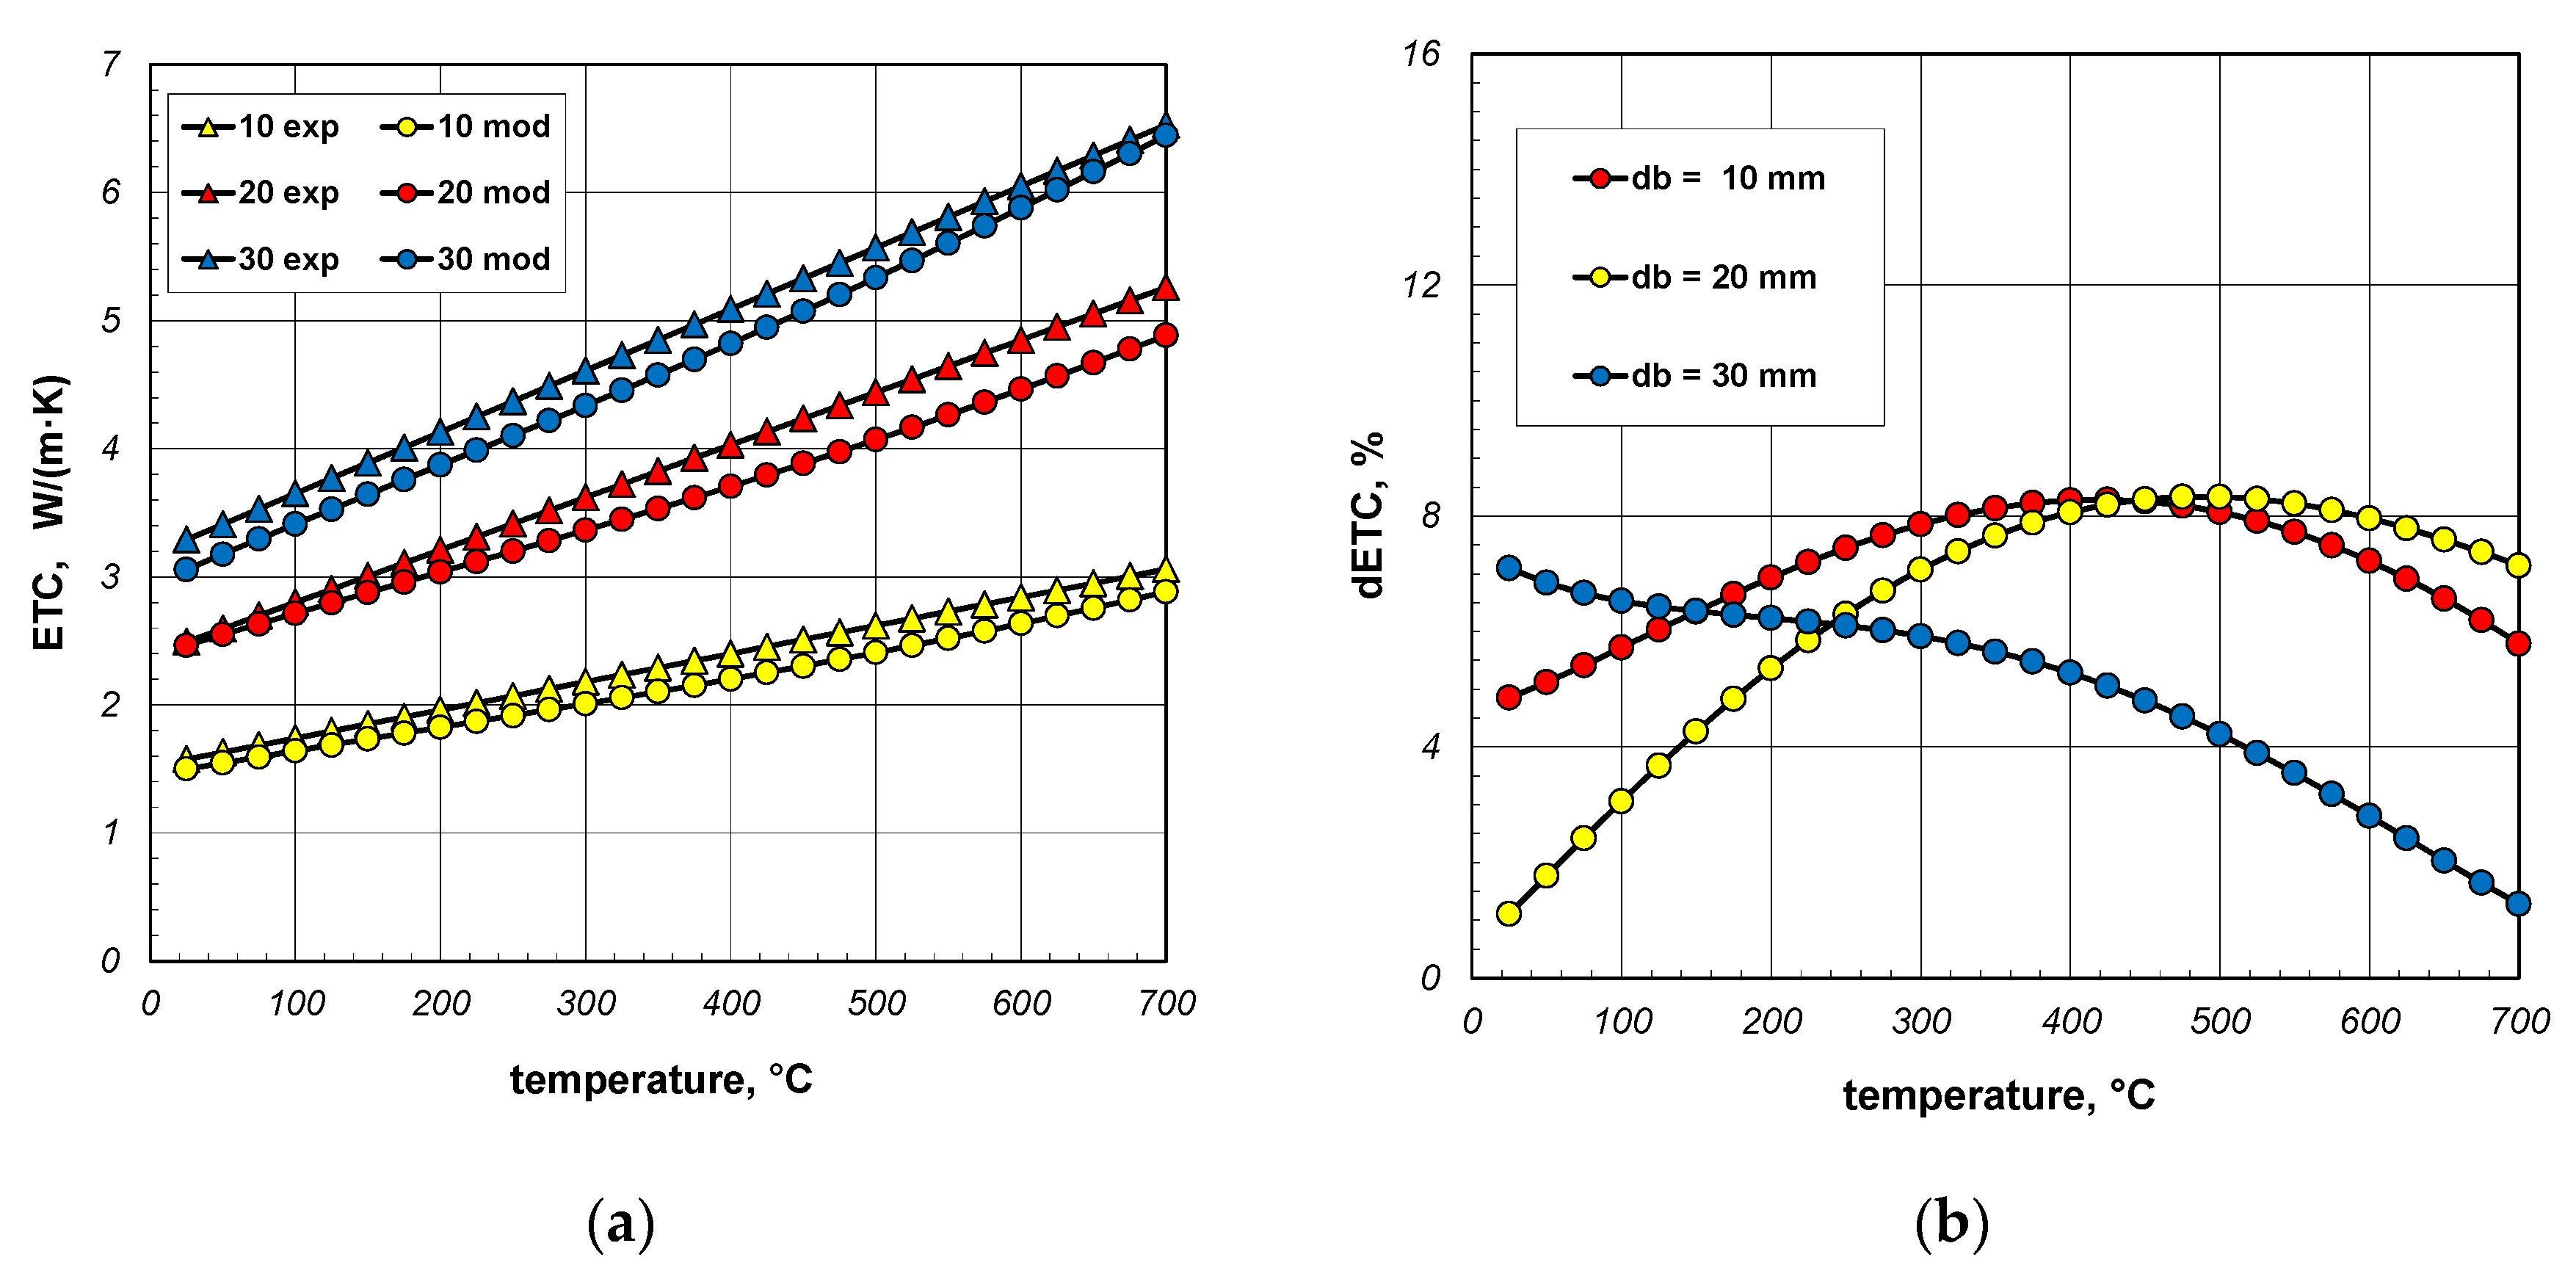
The dETC values are shown in Figure 15b. In the case of 30 mm bars, this parameter changes only slightly and is approximately 8%. In the case of 10 mm and 20 mm bars, dETC increases strongly as a function of temperature, exceeding 12%. It should be mentioned that the maximum uncertainty of ETC measurements was 4.6% [66]. This means that at higher temperatures (above 400 °C) the modeled values deviate too much from the experimental results. It should be mentioned that in the analyzed case the model values were obtained for a constant bar emissivity of 0.7. As experimental tests have shown, the emissivity of steel bars increases during heating. The variation in emissivity of such bars as a function of temperature can be described by the following equation [53]:
Figure 16a again compares the measured and model values of ETC. In this situation, the changes in the bar emissivity as a function of temperature, described by Equation (40), were taken into account in the model calculations. In this situation, the dETC (Figure 16b) values do not exceed 9% and the average value for all bar diameters is approximately 6%. This value is close to the measurement uncertainty of the experimental results. It can, therefore, be concluded that thanks to the change in emissivity, a very good match between the model values and the experimental data was achieved. This confirms the previous conclusion that the key problem for modeling heat transfer in a bar bundle is the selection of the bar’s emissivity.
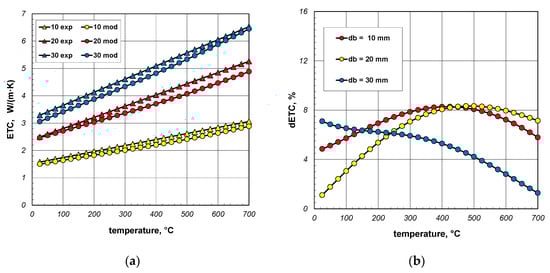
Figure 16.
Comparison of measured and model values of ETC (a) and changes in the dETC parameter (b); results obtained for emissivity described by Equation (40).
4. Conclusions
The article presents the original model of the effective thermal conductivity of a bundle of round steel bars. This model is based on the analysis of thermal resistances associated with the individual heat transfer mechanisms that occur during the heating of the bar bundle. The heat transfer mechanisms included in the model are: conduction in bars, conduction within the gas, thermal radiation between the bar’s surfaces, and contact conduction across the joints between the adjacent bars. The greatest scientific value of the presented research is the demonstration that thanks to the developed mathematical model, it is possible to analyze a very complex heat transfer phenomenon using relatively simple mathematical relationships. Based on the calculations made, the following conclusions can be drawn:
- ETC of round steel bar bundle changes over the range of 2.2–8.5 W/(m·K);
- ETC rises linearly with temperature;
- ETC increases as a function of the bar diameter—this increase is not linear;
- The bar thermal conductivity does not have much influence on the ETC value;
- The values of ETC range from 0.02 to 0.27 of bar thermal conductivity;
- The key problem for modeling heat transfer in a bar bundle is the selection of the bar’s emissivity;
- Replacing the air with a vacuum does not have a major impact on the bundle heating;
- Replacing air with hydrogen increases the bundle heating intensity from 20% to 55%. The degree of intensification of this process is the greater the smaller the diameter of the bars;
- Changing the bundle porosity in the range of 0.1–0.2 slightly reduces the ETC value.
To sum up the conducted research, it should be emphasized that the influence of contact conduction on the ETC of the bundle was not analyzed. This is a very important problem for the correct modeling of heat transfer in a bar bundle. However, due to the complexity of this issue, its analysis will be the subject of a separate publication.
Author Contributions
Conceptualization, R.W.; methodology, R.W. and M.G.; formal analysis, R.W. and M.G; writing—original draft preparation, R.W.; visualization, M.G.; supervision, R.W. and M.G. All authors have read and agreed to the published version of the manuscript.
Funding
This research received no external funding.
Institutional Review Board Statement
Not applicable.
Informed Consent Statement
Not applicable.
Data Availability Statement
The original contributions presented in the study are included in the article, further inquiries can be directed to the corresponding author.
Conflicts of Interest
The authors declare no conflicts of interest.
References
- Kwon, W.H.; Choi, S.W.; Lee, E.B. Development of Cycloid-Shaped Roll Charging Chute for Sintering Process for Energy Decarbonization and Productivity Improvement in Steel Plants. Energies 2024, 17, 1536. [Google Scholar] [CrossRef]
- Bataille, C.; Melton, N. Energy efficiency and economic growth: A retrospective CGE analysis for Canada from 2002 to 2012. Energy Econ. 2017, 64, 118–130. [Google Scholar] [CrossRef]
- Baig, A.A.; Fung, A.S.; Kumar, R. Auditing and Analysis of Natural Gas Consumptions in Small- and Medium-Sized Industrial Facilities in the Greater Toronto Area for Energy Conservation Opportunities. Energies 2024, 17, 1744. [Google Scholar] [CrossRef]
- Tahmasebi, M.M.; Banihashemi, S.; Hassanabadi, M.S. Assessment of the Variation Impacts on Windows on Energy Consumption and Carbon Footprint. Procedia Eng. 2011, 21, 820–828. [Google Scholar] [CrossRef]
- Górecki, J.; Berdychowski, M.; Gawrońska, E.; Wałęsa, K. Influence of PPD and Mass Scaling Parameter on the Goodness of Fit of Dry Ice Compaction Curve Obtained in Numerical Simulations Utilizing Smoothed Particle Method (SPH) for Improving the Energy Efficiency of Dry Ice Compaction Process. Energies 2023, 16, 7194. [Google Scholar] [CrossRef]
- Lohri, C.; Rajabu, H.; Sweeney, D.; Zurbrügg, C. Char fuel production in developing countries—A review of urban biowaste carbonization. Renew. Sustain. Energy Rev. 2016, 59, 1514–1530. [Google Scholar]
- Sahay, S.S.; Krishnan, K.; Kuthle, M.; Chodha, A.; Bhattacharya, A.; Das, A.K. Model-Based Optimization of a Highly Automated Industrial Batch Annealing Operation. Ironmak. Steelmak. 2006, 33, 306–314. [Google Scholar] [CrossRef]
- Saboonchi, A.; Hassanpour, S. Simulation of Cold Rolled Steel Coil Heating during Batch Annealing Process. Heat Trans. Eng. 2008, 29, 893–901. [Google Scholar] [CrossRef]
- Sahay, S.S.; Kumar, A.M.; Chatterjee, A. Development of integrated model for batch annealing of cold rolled steels. Ironmak. Steelmak. 2004, 31, 144–152. [Google Scholar] [CrossRef]
- Mathotra, C.P.; Pedenekar, N.R.; Sahay, S.S. Cost model for the steel reheating operation. Ind. Heat. 2002, 69, 67–71. [Google Scholar]
- Sahay, S.S.; Mitra, K. Cost model-based optimization of carburizing operation. Surf. Eng. 2004, 20, 379–384. [Google Scholar] [CrossRef]
- Kotrbacek, P.; Chabicovsky, M.; Resl, O.; Kominek, J.; Luks, T. The Efficient Way to Design Cooling Sections for Heat Treatment of Long Steel Products. Materials 2023, 16, 3983. [Google Scholar] [CrossRef] [PubMed]
- Zhang, Z.; Roberts, S.; Wildgoose, J.; Philpott, W.; Jepson, M.A. Effects of post-weld heat treatment on the microstructure and properties of the matching SMAW filler metal for weld joints in MarBN steel. Weld World 2024, 68, 1549–1561. [Google Scholar] [CrossRef]
- Kulkarni, A.R.; Raju, P.V.; Sarma, P.P.; Dewangan, S.; Selvaraj, S.K. Microstructure and Mechanical Properties of 0.18%-C Steel Samples Processed Through Five Different Heat Treatment Techniques. J. Inst. Eng. India Ser. D 2024, 105, 1945–1960. [Google Scholar] [CrossRef]
- Shi, F.; Zheng, J.; Zhang, J.; Zhao, Y.; Chen, L. Heat Treatment Process, Microstructure, and Mechanical Properties of Spring Steel with Ultra-High Strength and Toughness. Metals 2024, 14, 180. [Google Scholar] [CrossRef]
- Meshkabadi, R.; Pouyafar, V.; Soltanikia, R. Investigation on Microstructure, Hardness and Fracture Energy of AISI H13 Hot Work Tool Steel by Cyclic Heat Treatment. J. Mater. Eng. Perform. 2024, 33, 6620–6629. [Google Scholar] [CrossRef]
- Talebi, F.; Jamaati, R.; Hosseinipour, S.J. Strong strain-hardening capability in plain carbon steel through cold rolling and heat treatment of lamellar structure. Arch. Civ. Mech. Eng. 2024, 24, 44. [Google Scholar] [CrossRef]
- Musiał, D. Numerical analysis of the process of heating of a bed of steel bars. Arch. Met. Mat. 2013, 58, 63–66. [Google Scholar]
- Kolmasiak, C.; Wyleciał, T. Heat treatment of steel products as an example of transport phenomenon in porous media. Metalurgija 2018, 57, 363–366. [Google Scholar]
- Qiu, J.; Xu, X.; Chen, X.; Liu, Y.; Wu, Y. Fabrication of Particle-Stacking Microporous Metal Using Laser Powder Bed Fusion. Coatings 2024, 14, 348. [Google Scholar] [CrossRef]
- Qin, J.; Chen, Q.; Yang, C. Research process on property and application of metal porous materials. J. Alloys Compd. 2016, 654, 39–44. [Google Scholar] [CrossRef]
- Nakajima, H. Fabrication, properties and application of porous metals with directional pores. Prog. Mater. Sci. 2007, 52, 1091–1173. [Google Scholar] [CrossRef]
- Sahay, S.S.; Krishnan, K. Model based optimization of continuous annealing operation for bundle of packed rods. Ironmak. Steelmak. 2007, 34, 89–94. [Google Scholar] [CrossRef]
- Zhao, C.Y.; Lu, T.J.; Hudson, H.P.; Jackson, J.D. The temperature dependence of effective thermal conductivity of open-celled steel alloy foams. Mat. Scen. Eng. 2004, 367, 123–131. [Google Scholar] [CrossRef]
- Van Antwerpen, W.; du Toit, C.G.; Rousseau, P.G.A. Review of Correlations to Model the Packing Structure and Effective Thermal Conductivity in Packed Beds of Mono-Sized Spherical Particles. Nucl. Engin. Des. 2010, 240, 1803–1818. [Google Scholar] [CrossRef]
- Carson, J.K. Review of Effective Thermal Conductivity Models for Foods. Int. J. Refrig. 2006, 29, 958–967. [Google Scholar] [CrossRef]
- Murlidhar, G.; Yang, J.; Roy, C. Modelling the Effective Thermal Conductivity in Polydispersed Bed System: A Unified Approach using the Linear Packing Theory and Unit Cell Approach. Can. J. Chem. Eng. 2002, 80, 830–839. [Google Scholar]
- Kolmasiak, C.; Bagdasaryan, V.; Wyleciał, T.; Gała, M. Analysing the Contact Conduction Influence on the Heat Transfer Intensity in the Rectangular Steel Bars Bundle. Materials 2021, 14, 5655. [Google Scholar] [CrossRef] [PubMed]
- Zhang, X.; Yu, F.; Wu, W.; Zuo, Y. Application of radial effective thermal conductivity for heat transfer model of steel coils in HPH furnace. Int. J. Ther. 2003, 24, 1395–1405. [Google Scholar] [CrossRef]
- ASTM C1044-12; Standard Practice for Using a Guarded-Hot-Plate Apparatus or Thin-Heater Apparatus in the Single-Sided Mode. ASTM International: West Conshohocken, PA, USA, 2012.
- ASTM C177-13; Standard Test Method for Steady-State Heat Flux Measurements and Thermal Transmission Properties by Means of the Guarded-Hot-Plate Apparatus. ASTM International: West Conshohocken, PA, USA, 2013.
- Zhao, S.-Y.; Zhang, B.-M.; He, X.-D. Temperature and pressure dependent effective thermal conductivity of fibrous insulations. Int. J. Therm. Sci. 2009, 8, 440–448. [Google Scholar] [CrossRef]
- Yang, X.H.; Lu, T.J.; Kim, T. Temperature effects on the effective thermal conductivity of phase change materials with two distinctive phases. Int. Commun. Heat Mass Transf. 2011, 38, 1344–1348. [Google Scholar] [CrossRef]
- Öchsner, A.; Murcg, G.E.; de Lemos, M.J.S. (Eds.) Cellular and Porous Materials: Thermal Properties Simulation and Prediction; WILEY-VCH Verlag GmbH & Co., KGaA: Darmstadt, Germany, 2008. [Google Scholar]
- Carson, J.K. Thermal conductivity bounds for isotropic porous materials. Int. J. Heat Mass Transf. 2005, 48, 2150–2158. [Google Scholar] [CrossRef]
- Palaniswamy, S.K.A.; Venugopal, P.R.; Palaniswamy, K. Effective thermal conductivity modeling with primary and secondary parameters for two-phase materials. Therm. Sci. 2010, 14, 393–407. [Google Scholar] [CrossRef]
- Kunii, D.; Smith, J.M. Heat transfer characteristics of porous rocks. AIChE J. 1960, 6, 71–78. [Google Scholar] [CrossRef]
- Zehner, P.; Schlunder, E.U. Thermal conductivity of granular materials at moderate temperatures. Chemie Ingr Tech. 1970, 42, 933–941. (In German) [Google Scholar] [CrossRef]
- Wyczółkowski, R.; Bagdasaryan, V.; Tomczyk, B. Modelling of effective thermal conductivity of a packed bed of steel bars with the use of chosen literature models. Compos. Struct. 2022, 282, 115025. [Google Scholar] [CrossRef]
- Wyczółkowski, R.; Musiał, D. Analysis of the Occurrence of Natural Convection in a Bed of Bars in Vertical Temperature Gradient Conditions. Arch. Thermodyn. 2013, 34, 71–83. [Google Scholar] [CrossRef]
- Wyczółkowski, R.; Bagdasaryan, V.; Strycharska, D. Experimental and Theoretical Studies of the Thermal Contact Conductance for Bundles of Round Steel Bars. Materials 2023, 16, 6925. [Google Scholar] [CrossRef]
- Cengel, Y.A. Heat and Mass Transfer—A Practical Approach, 3rd ed.; Mc Graw Hill: New York, NY, USA, 2007. [Google Scholar]
- Tian, W.X.; Zhang, K.; Hou, Y.D.; Zhang, Y.P.; Qiu, S.Z.; Su, G.H. Hydrodynamics of two-phase flow in a rod bundle under cross-flow condition. Ann. Nucl. Energy 2016, 91, 206–214. [Google Scholar] [CrossRef]
- Faraji, H.; Teggar, M.; Arshad, A.; Arıcı, M.; Mehdi Berra, E.; Choukairy, K. Lattice Boltzmann simulation of natural convection heat transfer phenomenon for thermal management of multiple electronic components. Ther. Sci. Eng. Prog. 2023, 45, 102126. [Google Scholar] [CrossRef]
- Afaynou, I.; Faraji, H.; Choukairy, K.; Arıcı, M.; Khallaki, K. Heat transfer improvement of phase change materials by metal foams and nanoparticles for efficient electronic thermal management: A comprehensive study. Int. J. Heat Mass Transf. 2024, 227, 125534. [Google Scholar] [CrossRef]
- Sohag, F.A.; Mohanta, L.; Cheung, F.B. CFD analyses of mixed and forced convection in a heated vertical rod bundle. App. Therm. Eng. 2017, 117, 85–93. [Google Scholar] [CrossRef]
- Bahrami, M.; Yovanovich, M.M.; Culham, J.R. Effective thermal conductivity of rough spherical packed beds. Int. J. Heat Mass Transf. 2006, 49, 3691–3701. [Google Scholar] [CrossRef]
- Nellis, G.; Klein, S. Heat Transfer; Cambridge University Press: New York, NY, USA, 2012. [Google Scholar]
- Wyczółkowski, R.; Gała, M.; Boryca, J. Computational Model of Heat Conduction in the Steel Round Bar Bundle. Act. Phys. Pol. A 2019, 136, 1001–1007. [Google Scholar] [CrossRef]
- Yovanovich, M.M.; Marotta, E.E. Chapter 4—Thermal spreading and contact resistances. In Heat Transfer Handbook; Bejan, A., Kraus, A.D., Eds.; John Wiley & Sons, Inc.: New York, NY, USA, 2003. [Google Scholar]
- Yovanovich, M.M. Four decades of research on thermal contact, gap, and joint resistances in microelectronics. IEEE Trans. Comp. Pack. Tech. 2005, 20, 182–206. [Google Scholar] [CrossRef]
- Furmański, P.; Wiśniewski, T.S.; Banaszek, J. Thermal Contact Resistances and Other Thermal Phenomena at Solid-Solid Interface; Institute of Heat Engineering—Warsaw University of Technology: Warsaw, Poland, 2008. [Google Scholar]
- Wyczólkowski, R.; Urbaniak, D. Modeling of Radiation in Bar Bundles Using the Thermal Resistance Concept. J. Ther. Heat Transf. 2016, 30, 721–729. [Google Scholar] [CrossRef]
- Modest, M.F. Chapter 5—Radiative Exchange Between Gray, Diffuse Surfaces. In Radiative Heat Transfer, 3rd ed.; Academic Press: New York, NY, USA; San Francisco, CA, USA; London, UK, 2013; pp. 160–198. [Google Scholar]
- Liščić, B. Steel Heat Treatment—Metallurgy and Technologies; CRC Taylor & Francis Group: Boca Raton, CA, USA; London, UK; New York, NY, USA, 2006. [Google Scholar]
- Wyczółkowski, R.; Strycharska, D.; Bagdasaryan, V. Correlations for the thermal conductivity of selected steel grades as a function of temperature in the range of 0–800 °C. Arch. Thermod. 2022, 43, 29–45. [Google Scholar]
- Saboonchi, A.; Hassanpour, S.; Abbasi, S. New heating schedule in hydrogen annealing furnace based on process simulation for less energy consumption. Energ. Cons. Manag. 2009, 49, 3211–3216. [Google Scholar] [CrossRef]
- Zuo, Y.; Wu, W.; Zhang, X.; Lin, L.; Xiang, S.; Liu, T.; Niu, L.; Huang, X. A study of heat transfer in high-performance hydrogen bell-type annealing furnace. Heat Trans. Asian Res. 2001, 30, 615–623. [Google Scholar] [CrossRef]
- Raźnjević, K. Thermal Table with Diagrams; WNT: Warsaw, Poland, 1966. (In Polish) [Google Scholar]
- Available online: https://www.flukeprocessinstruments.com/en-us/service-and-support/knowledge-center/infrared-technology/emissivity-metals (accessed on 15 October 2024).
- Available online: https://www.transmetra.ch/images/transmetra_pdf/publikationen_literatur/pyrometrie-thermografie/emissivity_table.pdf (accessed on 15 October 2024).
- Available online: https://knifemaker.com/wp-content/uploads/2020/11/TDMAW_SOS_Spring_Page_Kinetic_Vacuum_Heat_Treat_Article.pdf (accessed on 15 October 2024).
- Available online: https://polmet.zagan.pl/en/blog/31-heat-treatment-vacuum-what-is-it (accessed on 15 October 2024).
- Available online: https://www.miheuprecision.com/blog/vacuum-heat-treatment (accessed on 15 October 2024).
- European Steel and Alloy Grades/Numbers Steel Number. Available online: http://www.steelnumber.com/en/steel_composition_eu.php?name_id=645 (accessed on 15 October 2024).
- Wyczółkowski, R. Experimental Investigations of Effective Thermal Conductivity of the Selected Examples of Steel Porous Charge. Solids 2021, 2, 420–436. [Google Scholar] [CrossRef]

Disclaimer/Publisher’s Note: The statements, opinions and data contained in all publications are solely those of the individual author(s) and contributor(s) and not of MDPI and/or the editor(s). MDPI and/or the editor(s) disclaim responsibility for any injury to people or property resulting from any ideas, methods, instructions or products referred to in the content. |
© 2025 by the authors. Licensee MDPI, Basel, Switzerland. This article is an open access article distributed under the terms and conditions of the Creative Commons Attribution (CC BY) license (https://creativecommons.org/licenses/by/4.0/).