Electrochemical Hydrogen-Charging Effect on the Microstructural Evolution and Mechanical Behavior of Deformed Ti Alloy

 ,
, 
 ,
,  and
and
Abstract
:1. Introduction
2. Materials and Experimental Methods
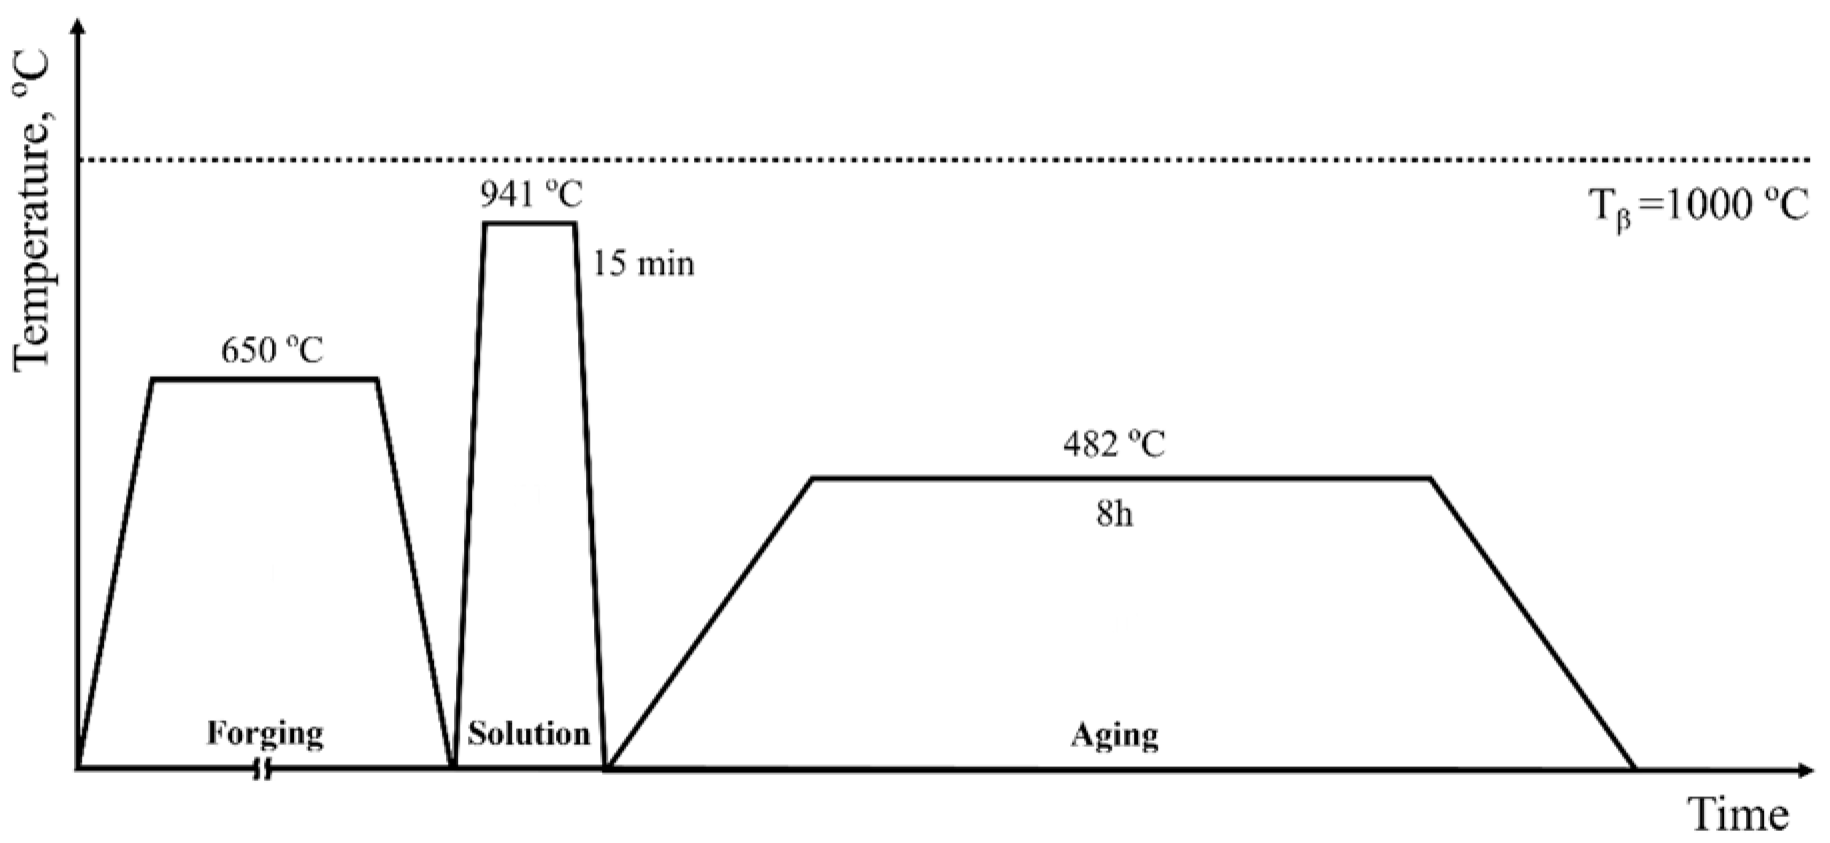
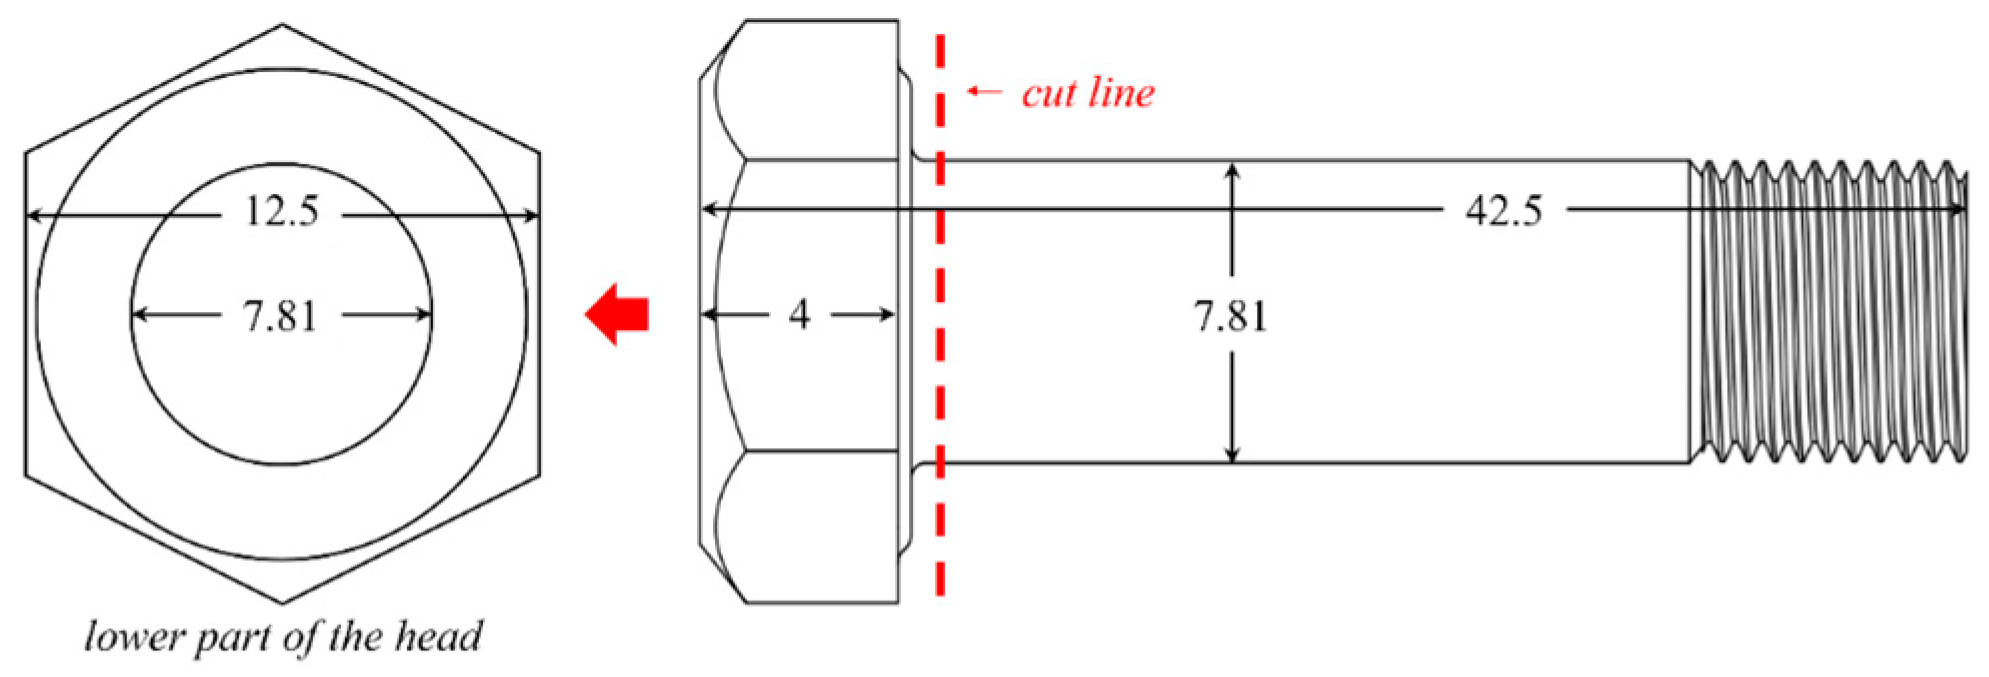
2.1. Manufacturing Process and Specimen Preparation
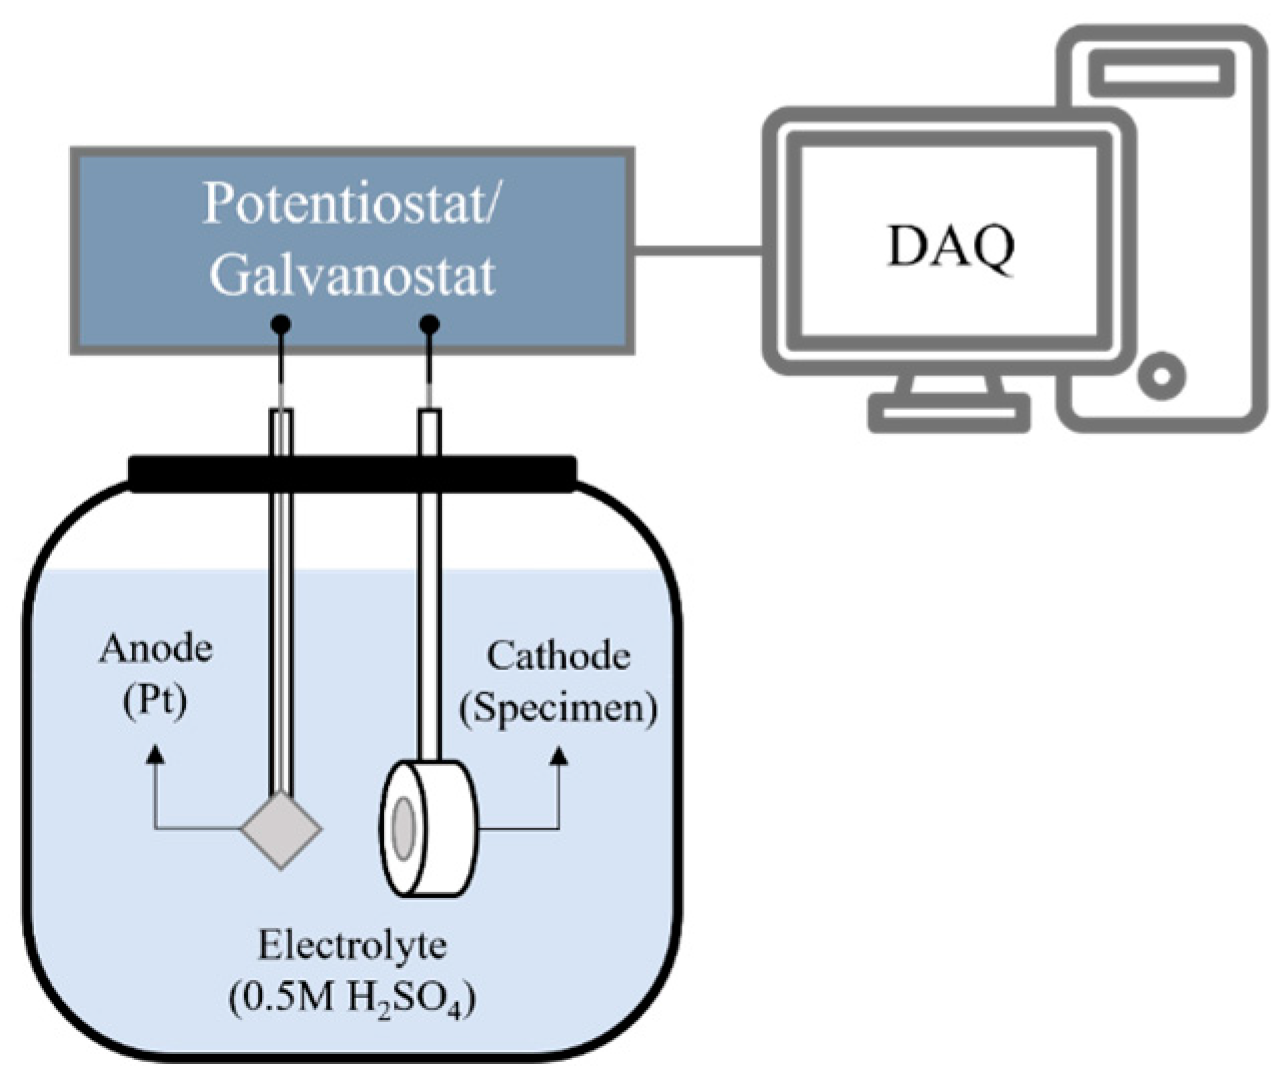
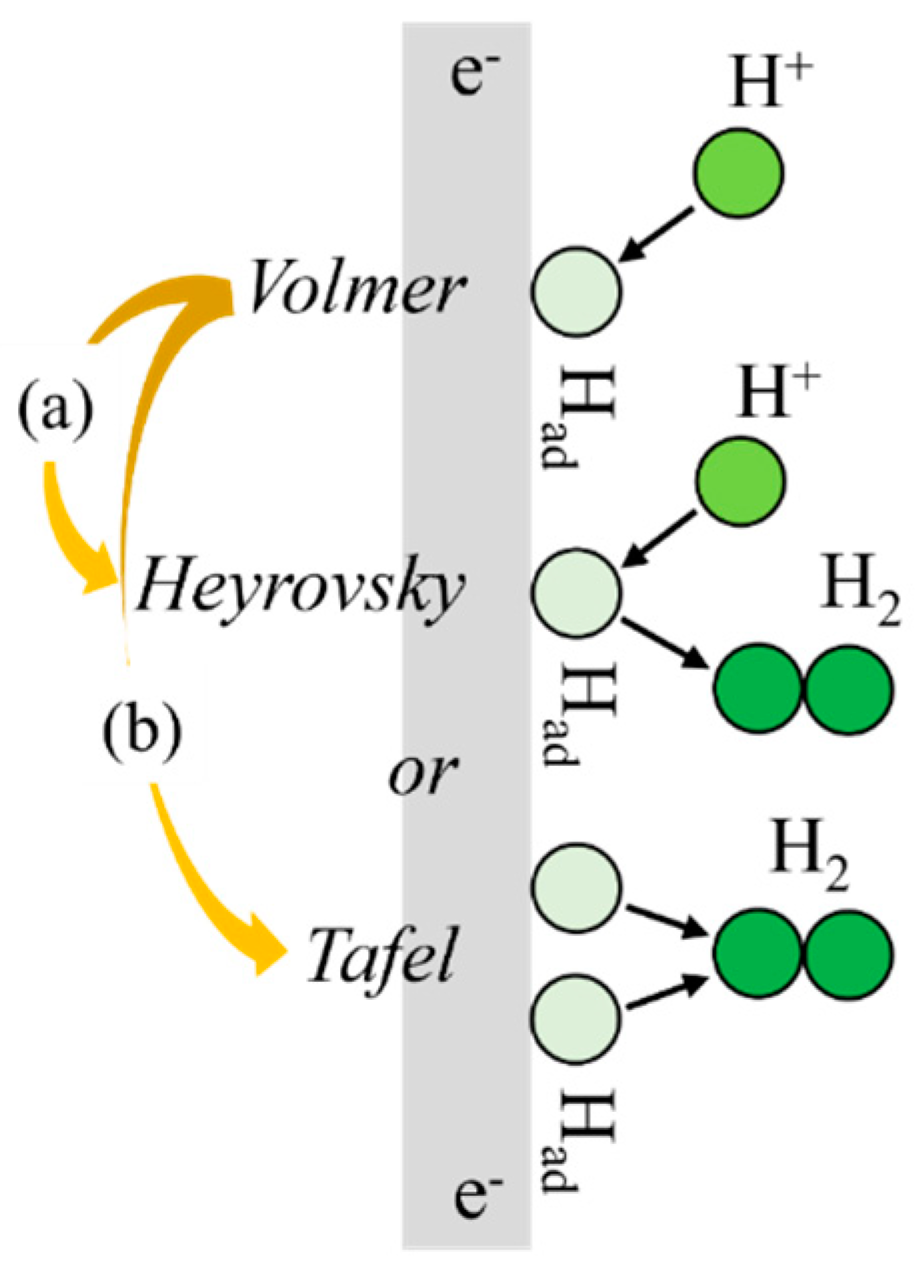
2.2. Electrochemical Hydrogen Charging
2.3. Microstructural Assessment
2.4. Mechanical Tests
3. Finite Element (FE) Modeling
3.1. Governing Equation
3.2. Model Development
3.3. Initial and Boundary Conditions
4. Results and Discussion
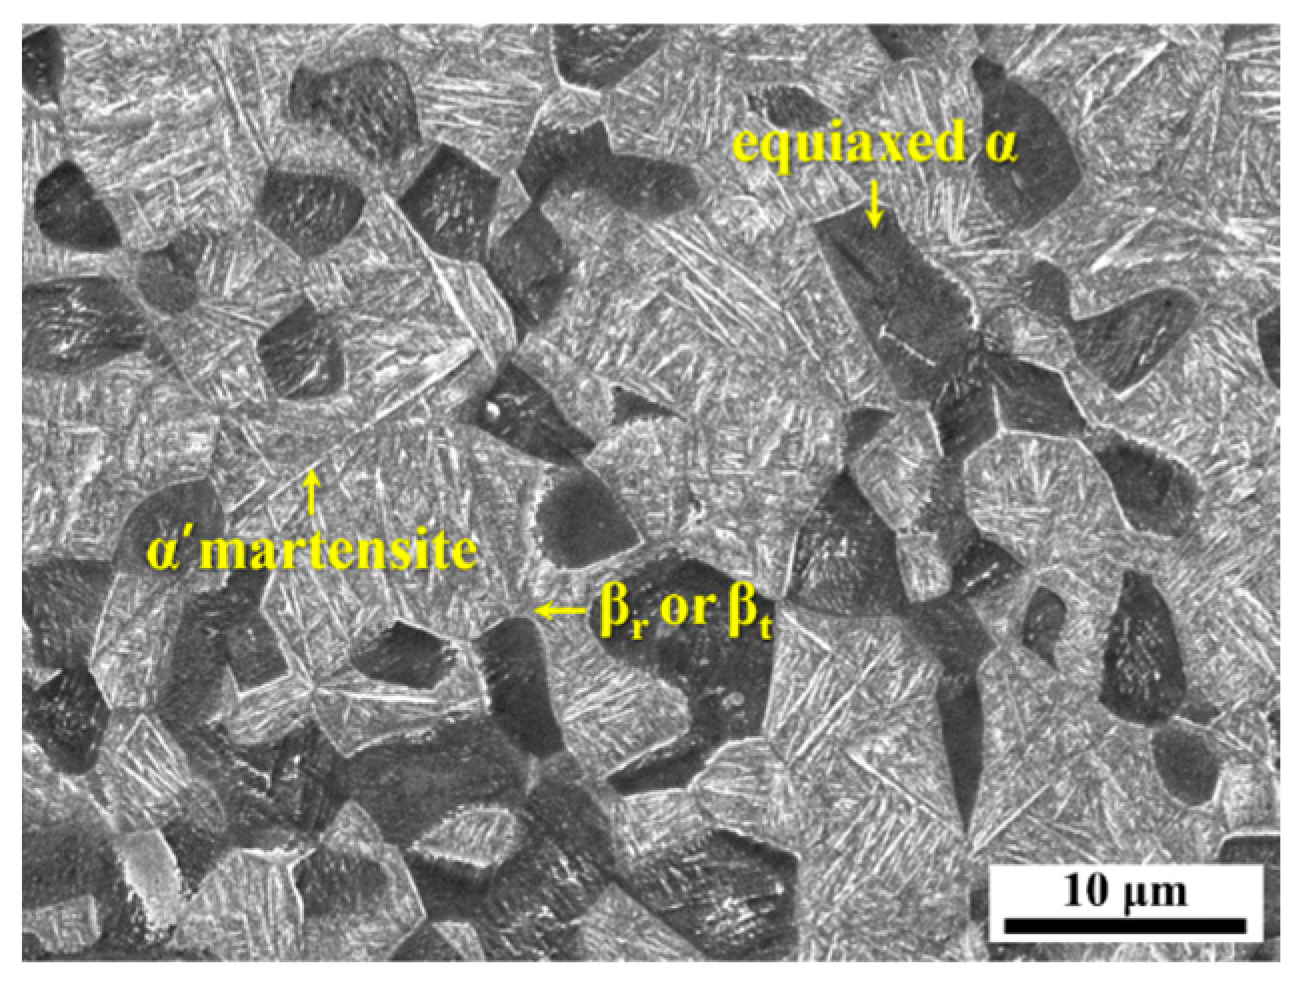
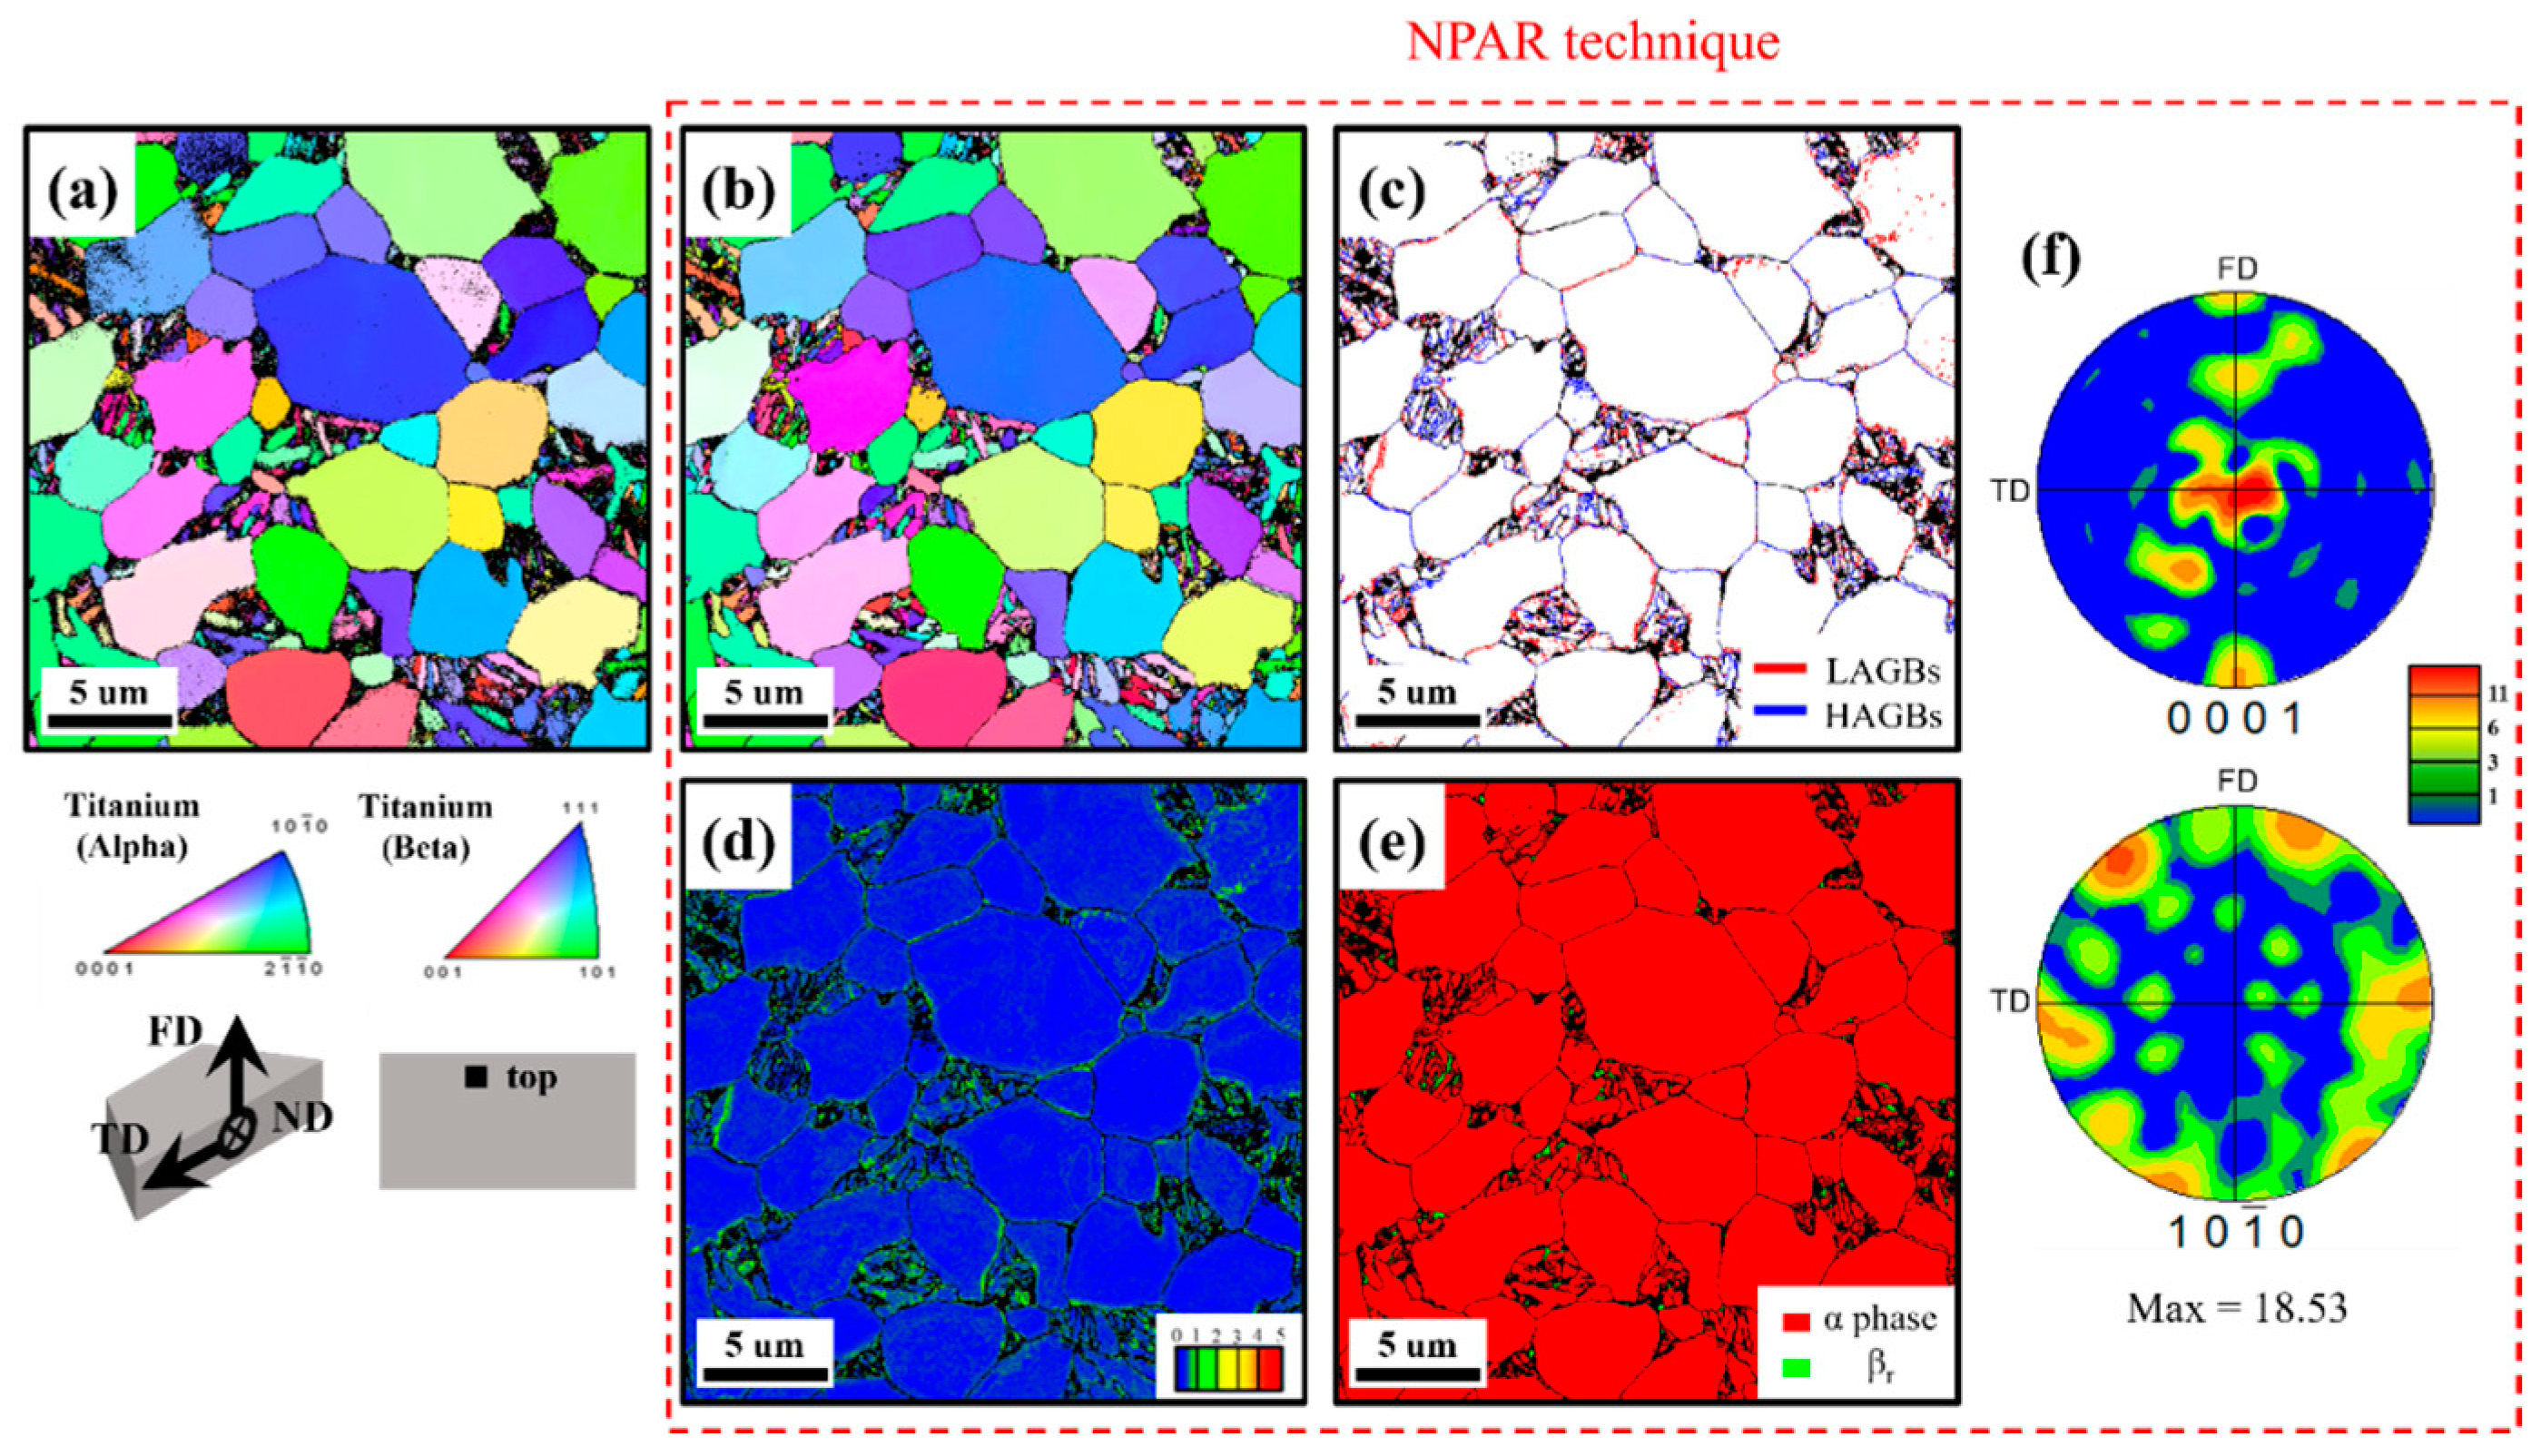
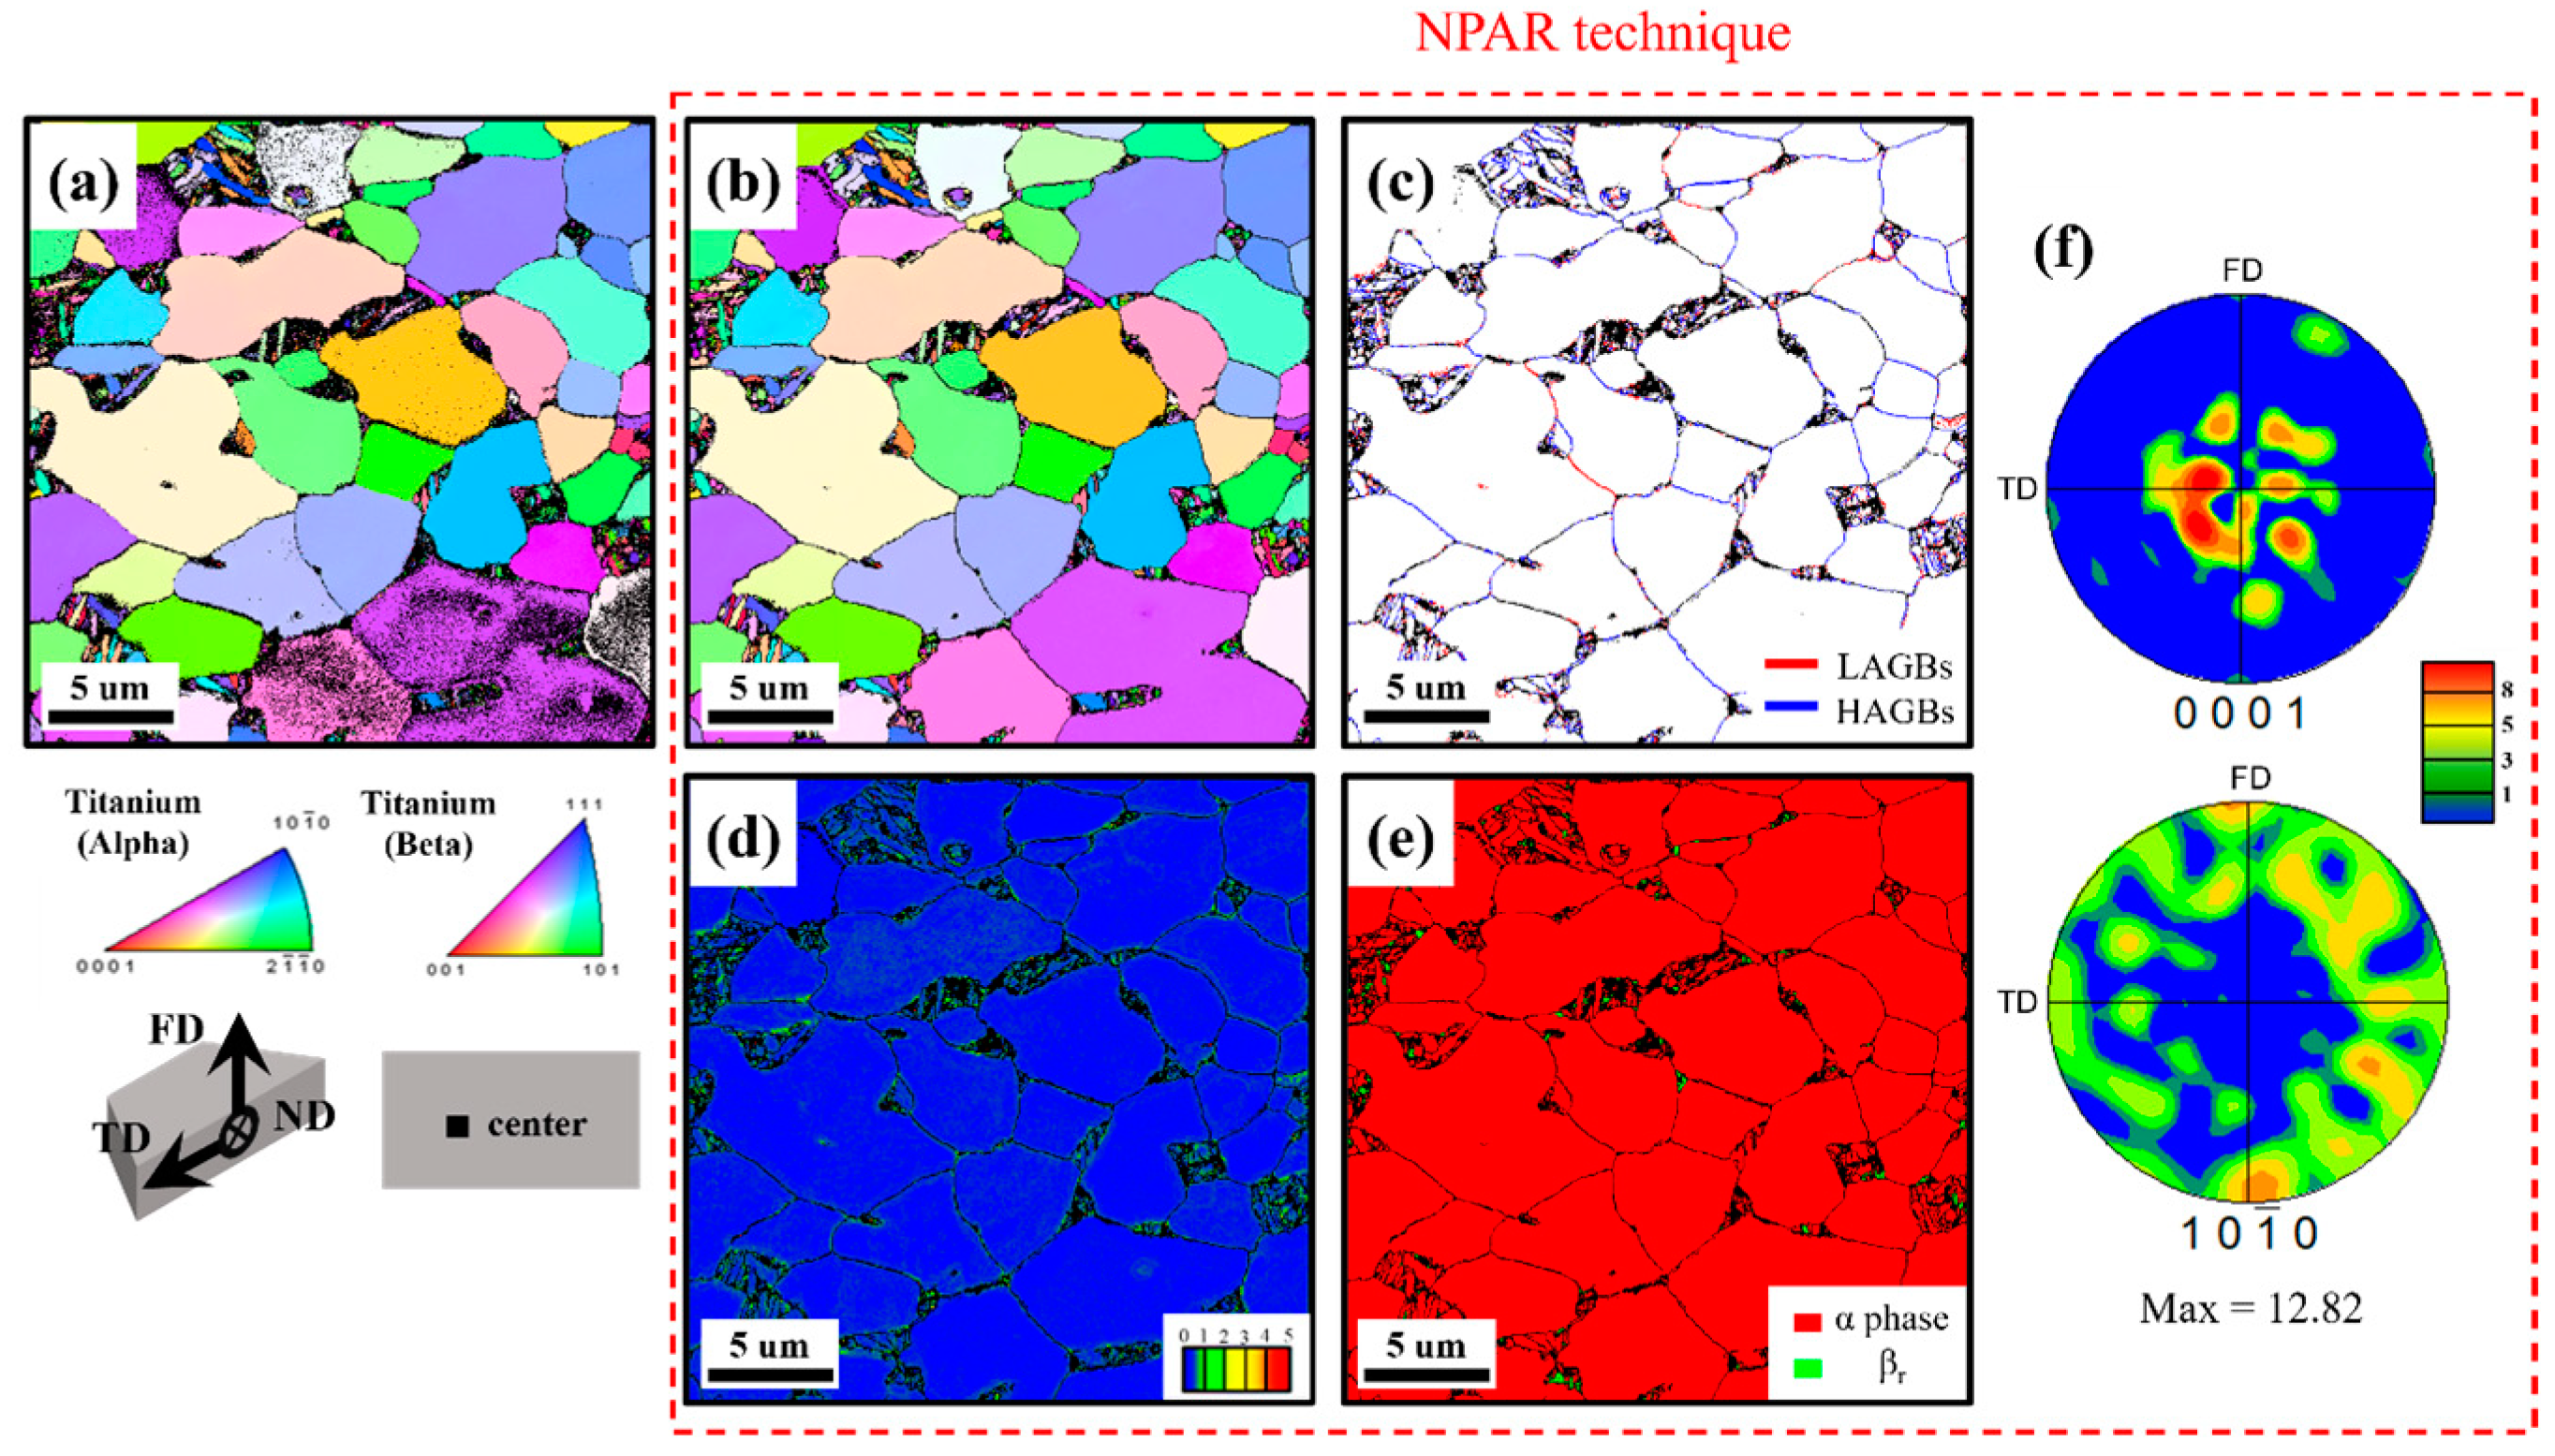
4.1. Microstructural Characteristics of the Uncharged Base Material
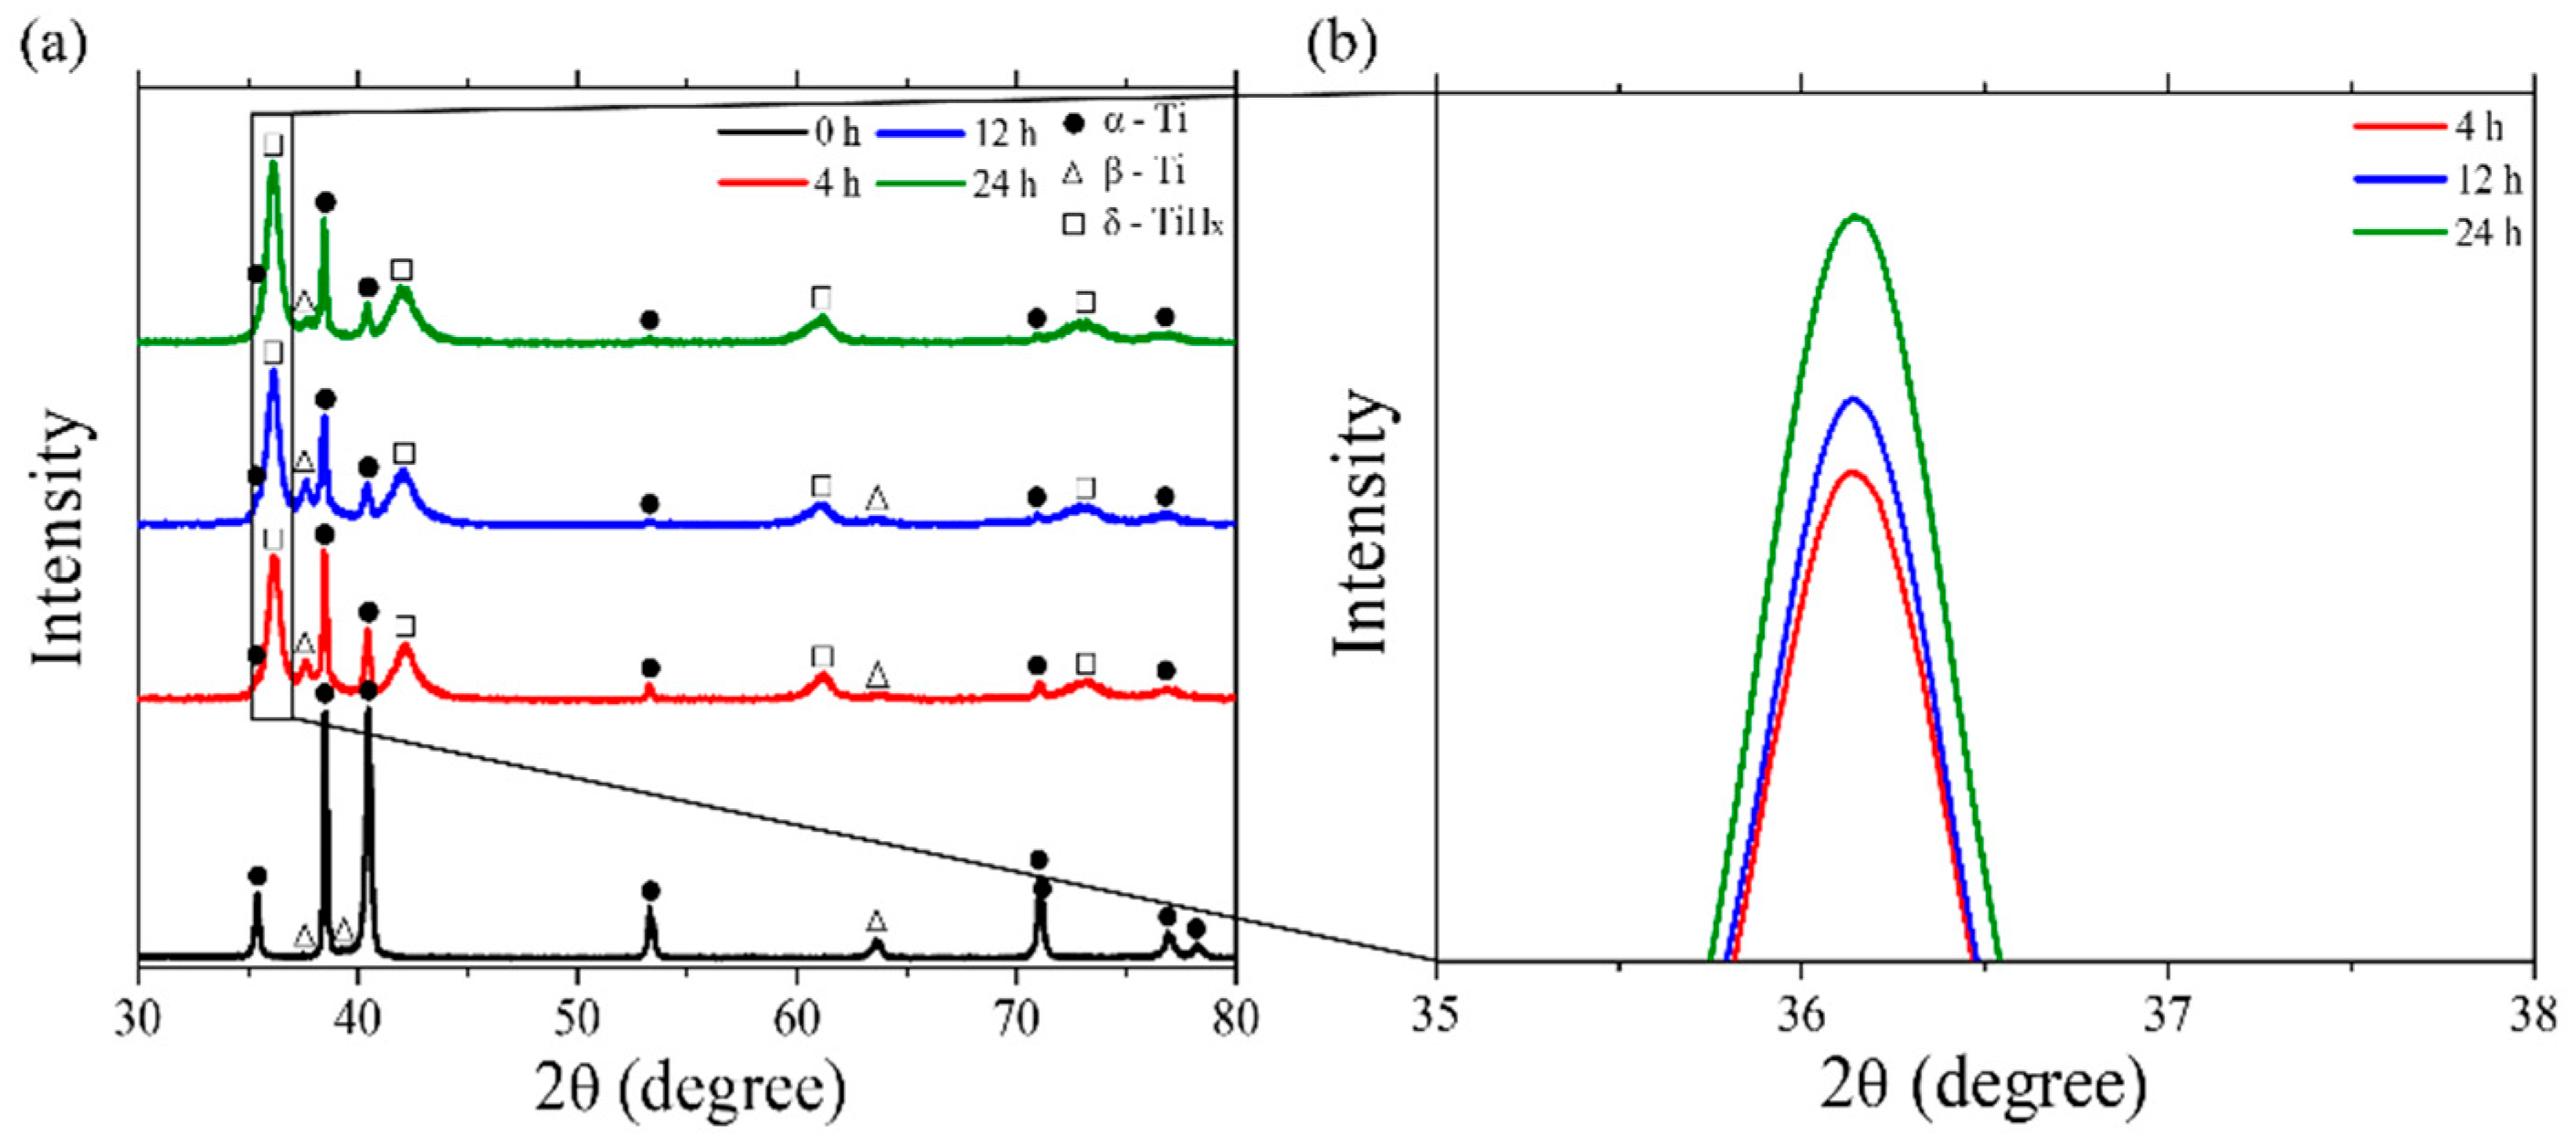
4.2. Microstructural Features of the Hydrogen-Charged Specimens
4.3. Mechanical Properties
4.3.1. Microhardness Assessment of Uncharged and Charged Specimens
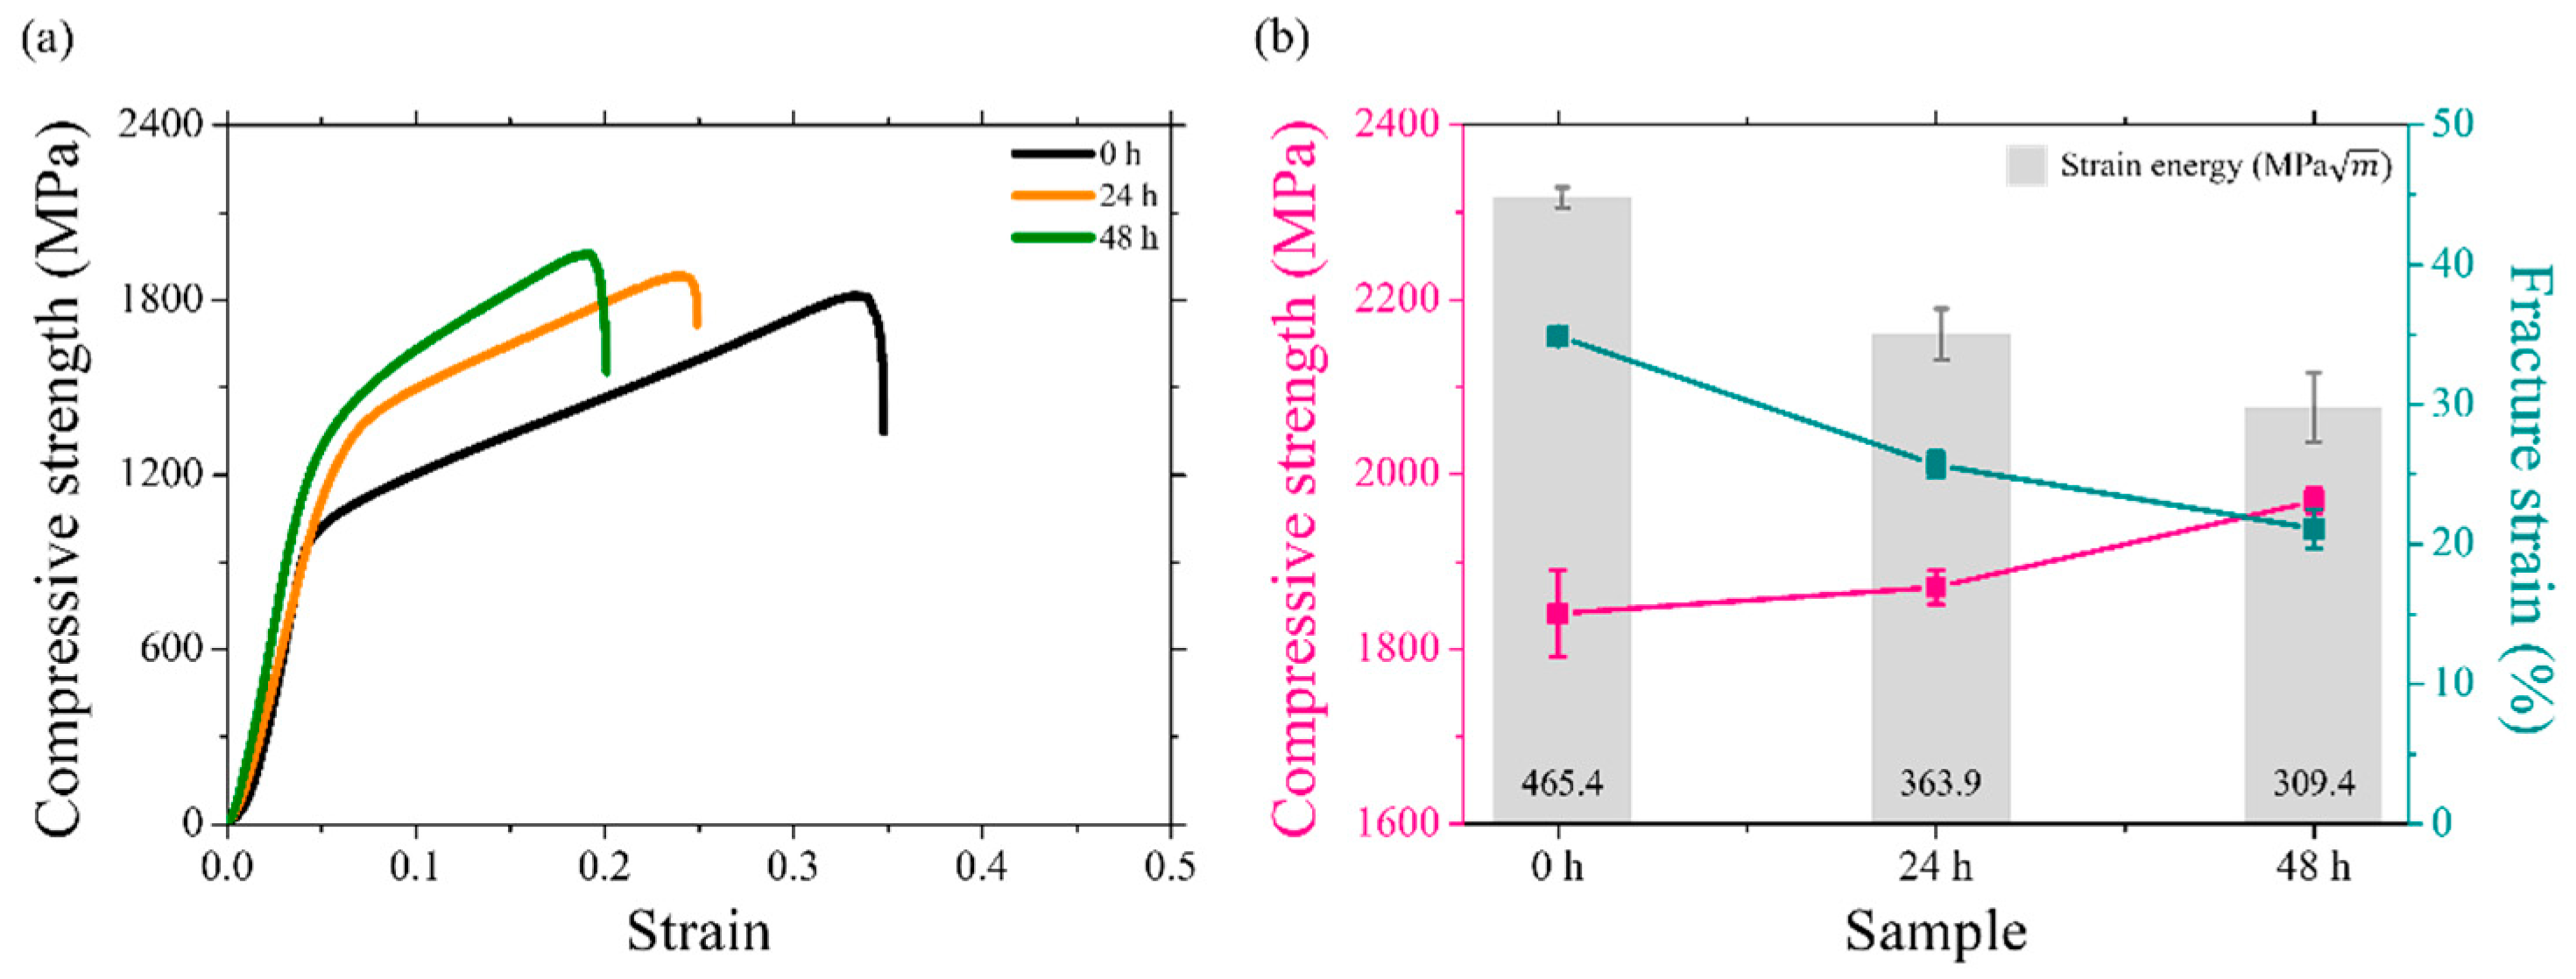
4.3.2. Uniaxial Compression Behaviors of the Uncharged and Charged Specimens
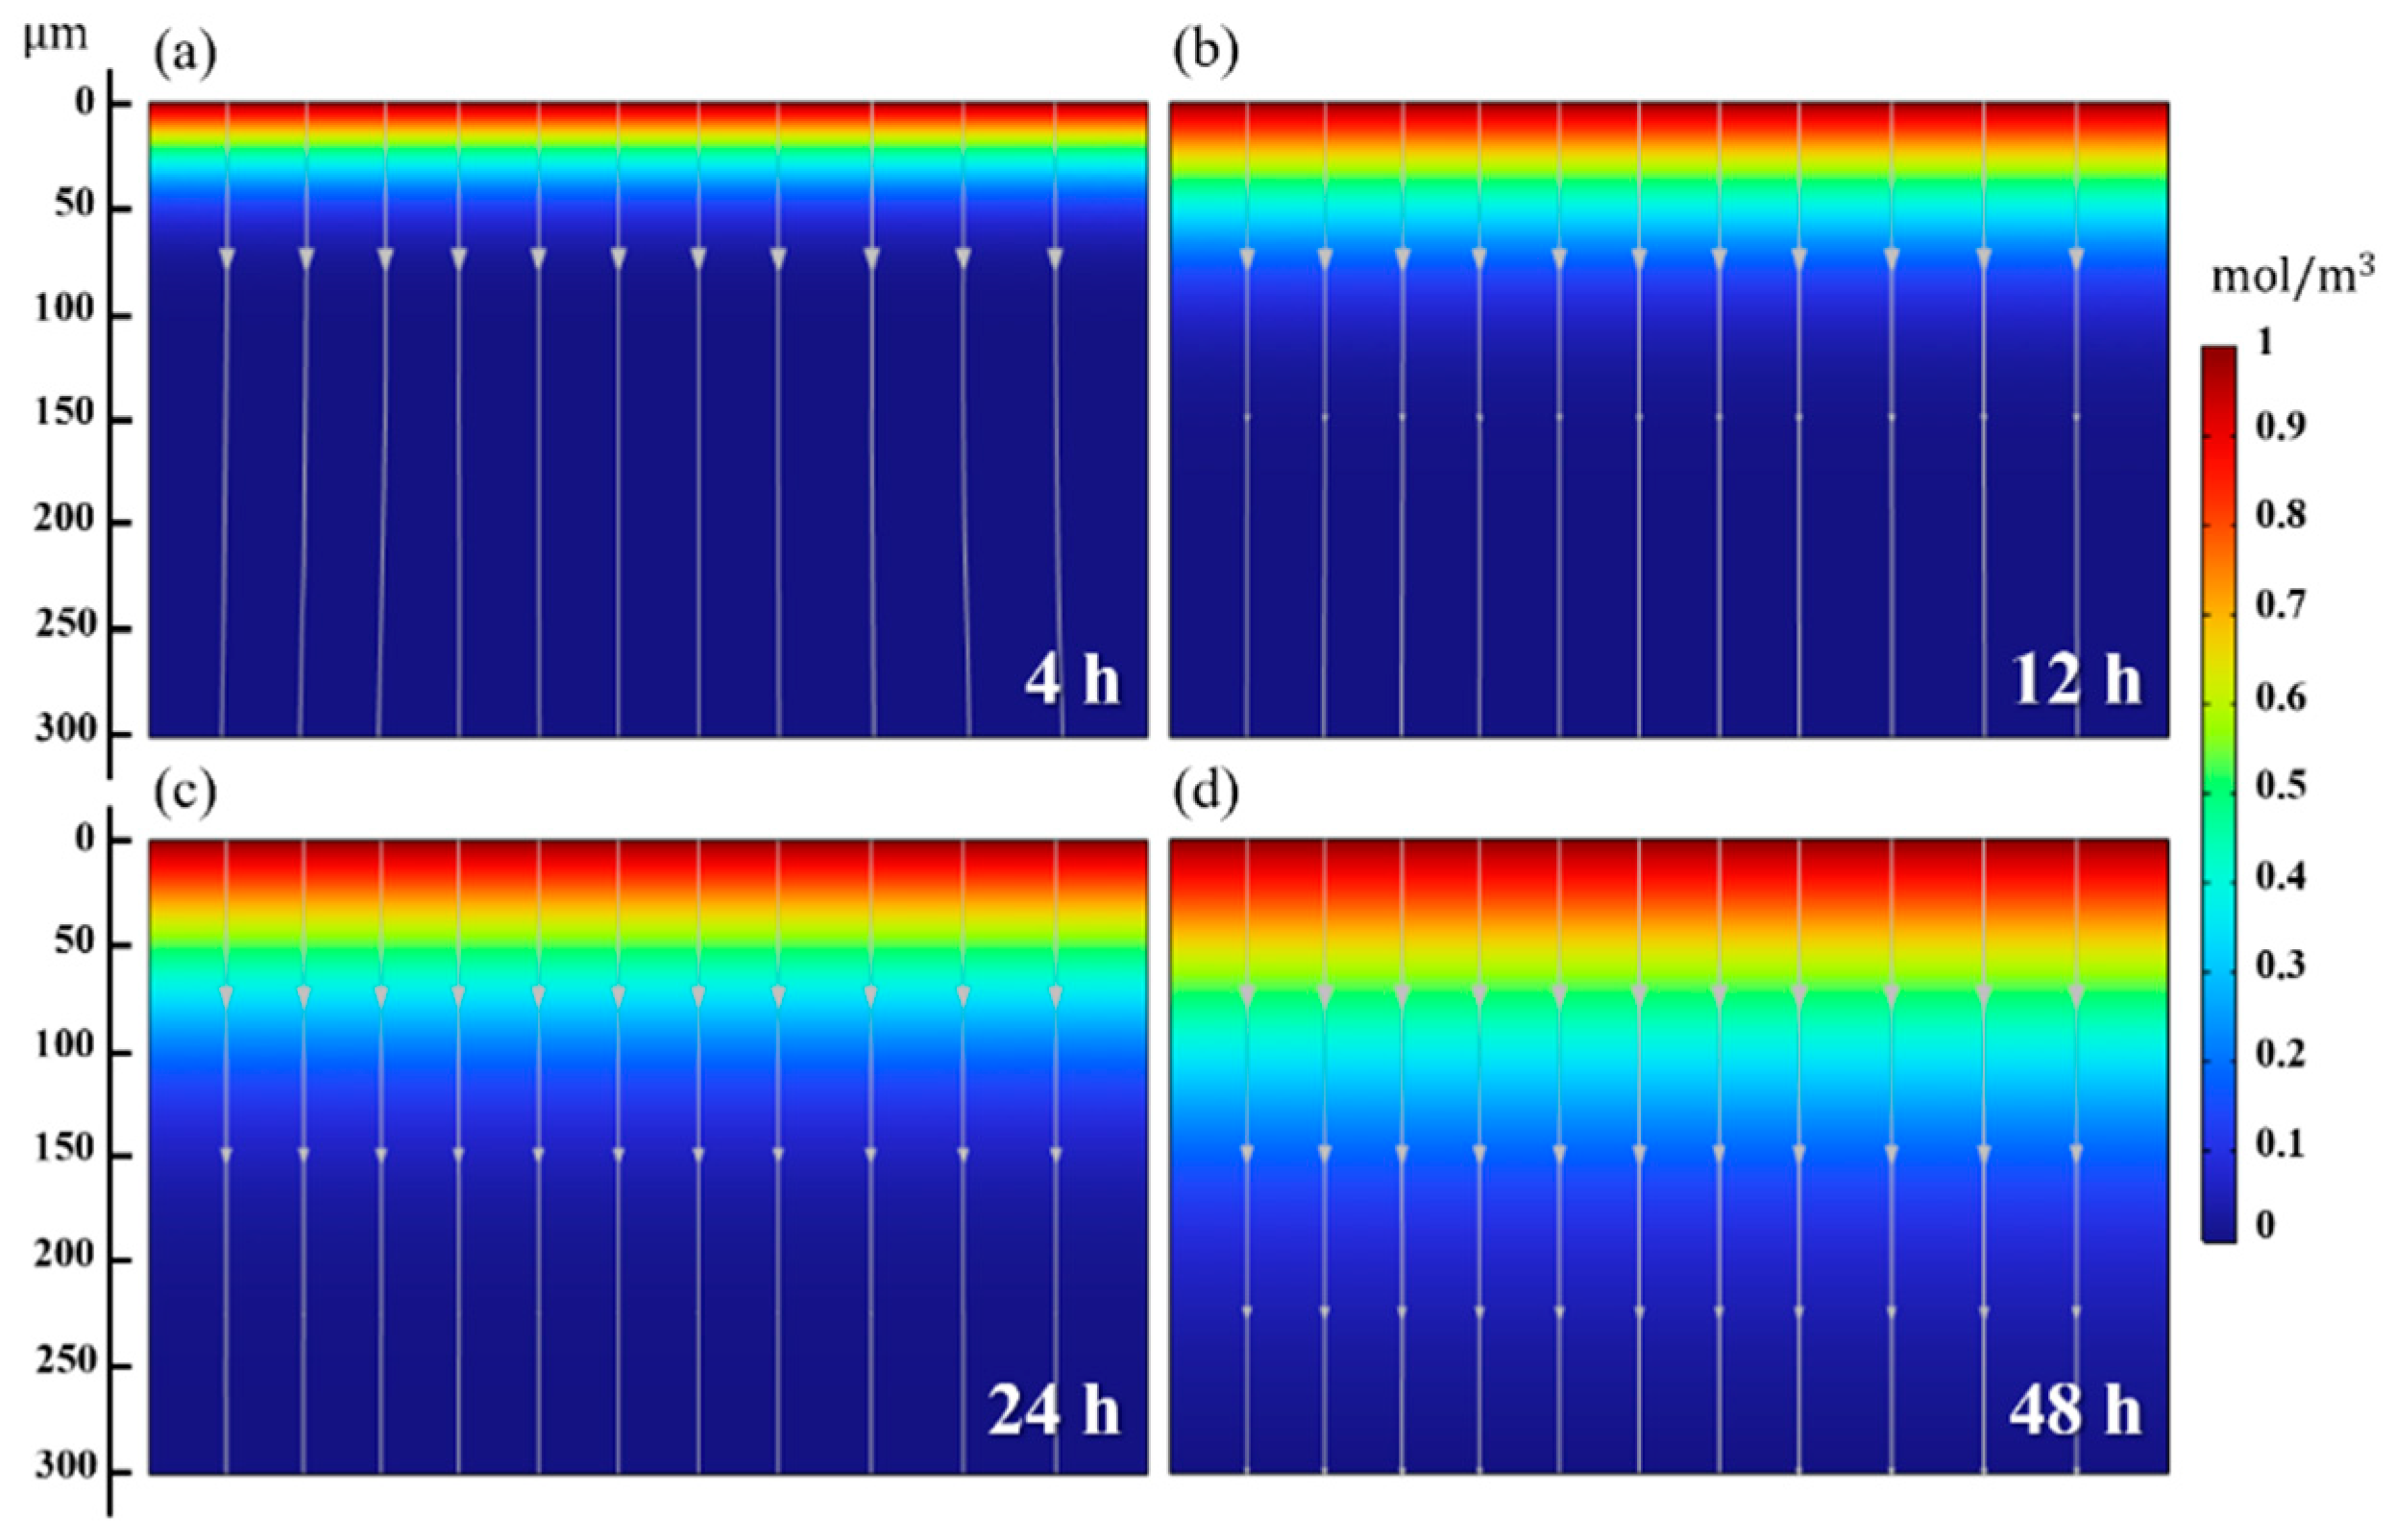
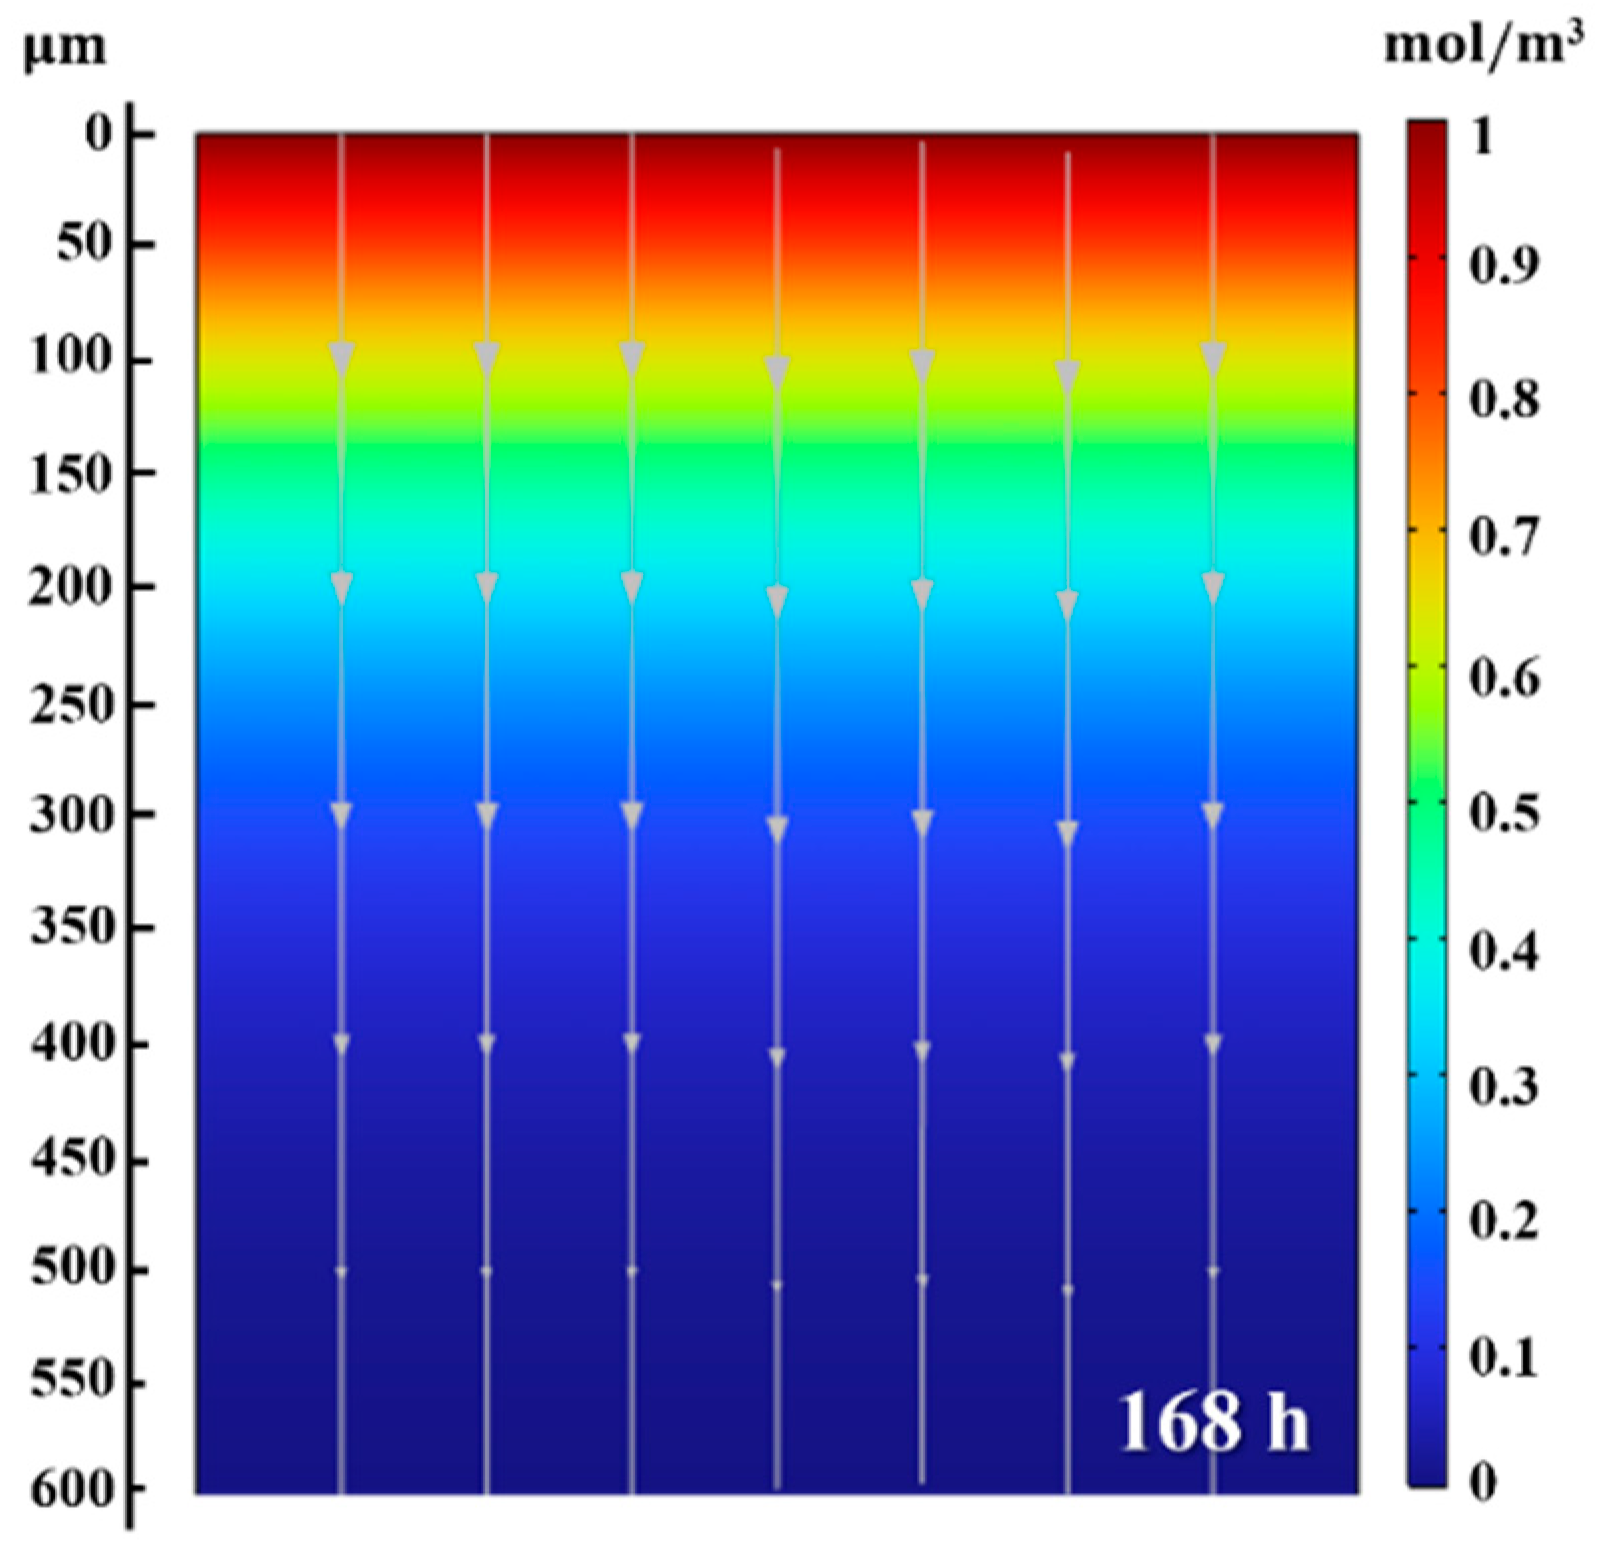
4.4. Predicted Hydrogen Diffusion Behavior by the FE Model
5. Conclusions
Author Contributions
Funding
Institutional Review Board Statement
Data Availability Statement
Conflicts of Interest
References
- Liu, Y.G.; Li, M.Q. Structure response characteristics and surface nanocrystallization mechanism of alpha phase in Ti-6Al-4V subjected to high energy shot peening. J. Alloy Compd. 2019, 773, 860–871. [Google Scholar] [CrossRef]
- Huang, S.; Zhang, J.; Ma, Y.; Zhang, S.; Youssef, S.S.; Qi, M.; Wang, H.; Qiu, J.; Xu, D.; Lei, J.; et al. Influence of thermal treatment on element partitioning in α+β titanium alloy. J. Alloy Compd. 2019, 791, 575–585. [Google Scholar] [CrossRef]
- Qi, P.; Li, B.; Wei, W.; Chen, J.; Wang, T.; Huang, H.; Gao, K.; Wen, S.; Wu, X.; Rong, L.; et al. Microstructural evolution and mechanical properties of a novel biomedical Ti-6Zr-4Fe alloy during solution and aging treatment. J. Mater. Res. Technol. 2022, 21, 429–437. [Google Scholar] [CrossRef]
- Liu, X.; Wang, J.; Gao, L.; Li, R.; Luo, X.; Zhang, W.; Zhang, X.; Zha, X. Surface concentration and microscale distribution of hydrogen and the associated embrittlement in a near α titanium alloy. J. Alloy Compd. 2021, 862, 158669. [Google Scholar] [CrossRef]
- Senkov, O.n.; Froes, F.H. Thermohydrogen processing of titanium alloys. Int. J. Hydrogen Energy 1999, 24, 565–576. [Google Scholar] [CrossRef]
- Batteries, L.I.; Silvestri, L.; Paolone, A.; Termtanun, M.; Stephens, R.D.; Gross, A.F. Hydrogen-related catalytic effects of Ti and other light transition metals on NaAlH4 surfaces. J. Phys. Condens. Matter 2007, 19, 176007. [Google Scholar]
- Koultoukis, E.D.; Makridis, S.S.; Pavlidou, E.; De Rango, P.; Stubos, A.K. Investigation of ZrFe2-type materials for metal hydride hydrogen compressor systems by substituting Fe with Cr or V. Int. J. Hydrogen Energy 2014, 39, 21380–21385. [Google Scholar] [CrossRef]
- López-Suárez, A.; García-Zúñiga, N. Study of hydrogen storage capacity of Ti induced by ion irradiation. Int. J. Hydrogen Energy 2017, 42, 14199–14204. [Google Scholar] [CrossRef]
- Liang, C.P.; Gong, H.R. Structural stability, mechanical property and phase transition of the Ti-H system. Int. J. Hydrogen Energy 2010, 35, 11378–11386. [Google Scholar] [CrossRef]
- Chong, Y.; Bhattacharjee, T.; Tian, Y.; Shibata, A.; Tsuji, N. Deformation mechanism of bimodal microstructure in Ti-6Al-4V alloy: The effects of intercritical annealing temperature and constituent hardness. J. Mater. Sci. Technol. 2021, 71, 138–151. [Google Scholar] [CrossRef]
- Kohn, D.H.; Ducheyne, P. Microstructural refinement of β-sintered and Ti-6Al-4V porous-coated by temporary alloying with hydrogen. J. Mater. Sci. 1991, 26, 534–544. [Google Scholar] [CrossRef]
- Lulu-Bitton, N.; Sabatani, E.; Rosen, B.A.; Kostirya, N.; Agronov, G.; Tiferet, E.; Eliaz, N.; Navi, N.U. Mechanical behavior of electrochemically hydrogenated electron beam melting (EBM) and wrought Ti–6Al–4V using small punch test. Int. J. Hydrogen Energy 2022, 47, 6388–6403. [Google Scholar] [CrossRef]
- Paramore, J.D.; Fang, Z.Z.; Dunstan, M.; Sun, P.; Butler, B.G. Hydrogen-enabled microstructure and fatigue strength engineering of titanium alloys. Sci. Rep. 2017, 7, 41444. [Google Scholar] [CrossRef]
- Liu, H.J.; Zhou, L.; Liu, P.; Liu, Q.W. Microstructural evolution and hydride precipitation mechanism in hydrogenated Ti-6Al-4V alloy. Int. J. Hydrogen Energy 2009, 34, 9596–9602. [Google Scholar] [CrossRef]
- Kim, J.; Kang, J.; Tasan, C.C. Hydride formation in Ti6Al4V: An in situ synchrotron X-ray diffraction study. Scr. Mater. 2021, 193, 12–16. [Google Scholar] [CrossRef]
- Tal-Gutelmacher, E.; Eliezer, D. Hydrogen cracking in titanium-based alloys. J. Alloy Compd. 2005, 404–406, 621–625. [Google Scholar] [CrossRef]
- Liu, Y.; Ren, Z.H.; Liu, J.; Schaller, R.F.; Asselin, E. Electrochemical Investigation and Identification of Titanium Hydrides Formed in Mixed Chloride Sulfuric Acid Solution. J. Electrochem. Soc. 2019, 166, C3096–C3105. [Google Scholar] [CrossRef]
- Qiao, Y.; Xu, D.; Wang, S.; Ma, Y.; Chen, J.; Wang, Y.; Zhou, H. Effect of hydrogen charging on microstructural evolution and corrosion behavior of Ti-4Al-2V-1Mo-1Fe alloy. J. Mater. Sci. Technol. 2021, 60, 168–176. [Google Scholar] [CrossRef]
- Pan, Z.; Wei, Y.; Fu, Y.; Luo, H.; Li, X. Effect of electrochemical hydrogen charging on the mechanical property and corrosion behavior of Ti-3Mo alloy. Corros. Sci. 2022, 200, 110219. [Google Scholar] [CrossRef]
- Zhao, Y.Q.; Xin, S.W.; Zeng, W.D. Effect of major alloying elements on microstructure and mechanical properties of a highly β stabilized titanium alloy. J. Alloy Compd. 2009, 481, 190–194. [Google Scholar] [CrossRef]
- Metalnikov, P.; Eliezer, D.; Ben-Hamu, G. Hydrogen trapping in additive manufactured Ti–6Al–4V alloy. Mater. Sci. Eng. A 2021, 811, 141050. [Google Scholar] [CrossRef]
- Wang, Q.; Liu, X.; Zhu, T.; Ye, F.; Wan, M.; Zhang, P.; Song, Y.; Huang, C.; Ma, R.; Ren, X.; et al. Mechanism of hydrogen-induced defects and cracking in Ti and Ti–Mo alloy. Int. J. Hydrogen Energy 2023, 48, 5801–5809. [Google Scholar] [CrossRef]
- Ogawa, Y.; Hosoi, H.; Tsuzaki, K.; Redarce, T.; Takakuwa, O.; Matsunaga, H. Hydrogen, as an alloying element, enables a greater strength-ductility balance in an Fe-Cr-Ni-based, stable austenitic stainless steel. Acta Mater. 2020, 199, 181–192. [Google Scholar] [CrossRef]
- Kim, J.; Yao, X.; Kong, D.; Li, J.; Yildiz, B.; Tasan, C.C. Electrochemical pumping: An alternative solution for hydrogen embrittlement. Appl. Mater. Today. 2022, 29, 101627. [Google Scholar] [CrossRef]
- Shishvan, S.S.; Csányi, G.; Deshpande, V.S. Hydrogen induced fast-fracture. J. Mech. Phys. Solids 2020, 134, 103740. [Google Scholar] [CrossRef]
- Ren, X.; Zhou, Q.; Chu, W.; Li, J.; Su, Y.; Qiao, L. The mechanism of nucleation of hydrogen blister in metals. Sci. Bull. 2007, 52, 2000–2005. [Google Scholar] [CrossRef]
- Escobar, D.P.; Miñambres, C.; Duprez, L.; Verbeken, K.; Verhaege, M. Internal and surface damage of multiphase steels and pure iron after electrochemical hydrogen charging. Corros. Sci. 2011, 53, 3166–3176. [Google Scholar] [CrossRef]
- Bechtle, S.; Kumar, M.; Somerday, B.P.; Launey, M.E.; Ritchie, R.O. Grain-boundary engineering markedly reduces susceptibility to intergranular hydrogen embrittlement in metallic materials. Acta Mater. 2009, 57, 4148–4157. [Google Scholar] [CrossRef]
- Deconinck, L.; Depover, T.; Verbeken, K. The mechanism of hydride formation during electrochemical hydrogen charging of Ti–6Al–4V. Mater. Today Sustain. 2023, 22, 100387. [Google Scholar] [CrossRef]
- Qin, D.D.; Tang, Y.; Ma, G.; Qin, L.; Tao, C.L.; Zhang, X.; Zhang, X.; Tang, Z. Molecular metal nanoclusters for ORR, HER and OER: Achievements, opportunities and challenges. Int. J. Hydrogen Energy 2021, 46, 25771–25781. [Google Scholar] [CrossRef]
- Kucernak, A.R.; Zalitis, C. General Models for the Electrochemical hydrogen oxidation and hydrogen evolution reactions: Theoretical derivation and experimental results under near mass-transport free conditions. J. Phys. Chem. C 2016, 120, 10721–10745. [Google Scholar] [CrossRef]
- Cheng, Y.F.; Niu, L. Mechanism for hydrogen evolution reaction on pipeline steel in near-neutral pH solution. Electrochem. Commun. 2007, 9, 558–562. [Google Scholar] [CrossRef]
- Capelle, J.; Dmytrakh, I.; Pluvinage, G. Comparative assessment of electrochemical hydrogen absorption by pipeline steels with different strength. Corros. Sci. 2010, 52, 1554–1559. [Google Scholar] [CrossRef]
- Pierozynski, B.; Mikolajczyk, T. Hydrogen evolution reaction at ru-modified carbon fibre in 0.5 M H2SO4. Int. J. Electrochem. Sci. 2012, 7, 9697–9706. [Google Scholar] [CrossRef]
- Nagumo, M. Hydrogen entry into metals from liquid phase I—Basic electrochemical reactions. Corros. Eng. 2006, 55, 380–389. [Google Scholar] [CrossRef]
- Hiroyuki, F.; Taishi, F.; Takuya, H. Effect of ammonium thiocyanate on hydrogen entry behavior of low alloy steel under galvanostatic cathode charging. ISIJ Int. 2021, 61, 1151–1158. [Google Scholar]
- Wright, S.I.; Nowell, M.M.; Lindeman, S.P.; Camus, P.P.; De Graef, M.; Jackson, M.A. Introduction and comparison of new EBSD post-processing methodologies. Ultramicroscopy 2015, 159, 81–94. [Google Scholar] [CrossRef] [PubMed]
- Brewick, P.T.; Wright, S.I.; Rowenhorst, D.J. NLPAR: Non-local smoothing for enhanced EBSD pattern indexing. Ultramicroscopy 2019, 200, 50–61. [Google Scholar] [CrossRef] [PubMed]
- Sundaram, P.A.; Wessel, E.; Clemens, H.; Kestler, H.; Ennis, P.J.; Quadakkers, W.J.; Quadakkers, W.J.; Singheiser, L. Determination of the diffusion coefficient of hydrogen in gamma titanium aluminides during electrolytic. Acta Mater. 2000, 48, 1005–1019. [Google Scholar] [CrossRef]
- Vecchi, L.; Simillion, H.; Montoya, R.; Van Laethem, D.; Van den Eeckhout, E.; Verbeken, K.; Terryn, H.; Deconinck, J.; Van Ingelgem, Y. Modelling of hydrogen permeation experiments in iron alloys: Characterization of the accessible parameters—Part I—The entry side. Electrochim. Acta 2018, 262, 57–65. [Google Scholar] [CrossRef]
- Yang, F.Q.; Zhan, W.J.; Yan, T.; Zhang, H.B.; Fang, X.R. Numerical analysis of the coupling between hydrogen diffusion and mechanical behavior near the crack tip of titanium. Math. Probl. Eng. 2020, 2020, 3618589. [Google Scholar] [CrossRef]
- Díaz, A.; Alegre, J.M.; Cuesta, I.I. A review on diffusion modelling in hydrogen related failures of metals. Eng. Fail. Anal. 2016, 66, 577–595. [Google Scholar] [CrossRef]
- Celis, M.A.C.; Wanderley, J.B.V.; Neves, M.A.S. Numerical simulation of dam breaking and the influence of sloshing on the transfer of water between compartments. Ocean Eng. 2017, 146, 125–139. [Google Scholar] [CrossRef]
- Chalcravarti, N.; Sebastian, K.L. Theory of barrierless electronic relaxation in solution. Delta function sink models. Chem. Phys. Lett. 1993, 204, 496–504. [Google Scholar] [CrossRef]
- Matsumoto, H.; Yoneda, H.; Sato, K.; Kurosu, S.; Maire, E.; Fabregue, D.; Konno, T.J.; Chiba, A. Room-temperature ductility of Ti-6Al-4V alloy with α’ martensite microstructure. Mater. Sci. Eng. A 2011, 528, 1512–1520. [Google Scholar] [CrossRef]
- Liu, S.; Shin, Y.C. Additive manufacturing of Ti6Al4V alloy: A review. Mater. Des. 2019, 164, 107552. [Google Scholar] [CrossRef]
- Zhang, Q.; Lian, Q.; Zhang, C.; Peng, F.; Han, J.; Feng, H.; Li, H.; Qi, J.; Yang, J.; Kong, F.; et al. Superplastic deformation behavior of 5 vol% (TiBw+TiCp)/Ti matrix composite sheets with lamellar microstructure. J. Mater. Res. Technol. 2024, 30, 440–450. [Google Scholar] [CrossRef]
- Xu, X.; Zhang, B.; Xue, J.; Li, F.; Su, S.; Chang, H. Microstructural characteristics and recrystallization mechanism of Ti-6.5Al–2Zr–1Mo–1V alloy during two-stage hot deformation. J. Mater. Res. Technol. 2024, 30, 769–781. [Google Scholar] [CrossRef]
- Kenel, C.; Grolimund, D.; Li, X.; Panepucci, E.; Samson, V.A.; Sanchez, D.F. In situ investigation of phase transformations in Ti-6Al-4V under additive manufacturing conditions combining laser melting and high-speed micro-X-ray diffraction. Sci. Rep. 2017, 7, 16358. [Google Scholar] [CrossRef] [PubMed]
- Lee, S.; Park, C.; Hong, J.; Yeom, J. The role of nano-domains in {1-011} twinned martensite in metastable titanium alloys. Sci. Rep. 2018, 8, 11914. [Google Scholar] [CrossRef]
- Zhao, J.; Lv, L.; Wang, K.; Liu, G. Effects of strain state and slip mode on the texture evolution of a near-α TA15 titanium alloy during hot deformation based on crystal plasticity method. J. Mater. Sci. Technol. 2020, 38, 125–134. [Google Scholar] [CrossRef]
- Choi, S.; Hong, J.; Park, C.H.; Lee, S.; Kang, N.; Choi, Y.S.; Park, J.T.; Ahn, S.T.; Yeom, J.-T. Manufacturing process of titanium alloys flux-metal cored wire for gas tungsten arc welding. JWJ 2019, 37, 268–274. [Google Scholar] [CrossRef]
- Marashi, J.; Yakushina, E.; Xirouchakis, P.; Zante, R.; Foster, J. An evaluation of H13 tool steel deformation in hot forging conditions. J. Mater. Process. Technol. 2017, 246, 276–284. [Google Scholar] [CrossRef]
- Zheng, X.; Xu, C.; Cai, Y.; Zhang, B. Effect of plastic deformation and acidic solution on the corrosion behavior of Ti-6Al-4V ELI titanium alloy. Metals 2023, 13, 1740. [Google Scholar] [CrossRef]
- Duan, Y.; Wu, Y.; Peng, M.; Qi, H. The interstitial diffusion behaviors and mechanisms of boron in α-Ti and β-Ti: A first-principles calculation. Comput. Mater. Sci. 2020, 184, 109866. [Google Scholar] [CrossRef]
- Xu, Y.; Zhang, B. Effects of hydrogen as a solid solution element on the deformation behavior of a near-alpha titanium alloy. Mater. Sci. Eng. A 2021, 815, 141269. [Google Scholar] [CrossRef]
- Agyenim-Boateng, E.; Huang, S.; Sheng, J.; Yuan, G.; Wang, Z.; Zhou, J.; Feng, A. Influence of laser peening on the hydrogen embrittlement resistance of 316L stainless steel. Surf. Coat. Technol. 2017, 328, 44–53. [Google Scholar] [CrossRef]
- Anaman, S.Y.; Zhang, S.; Lee, J.S.; Cho, H.H.; Hong, S.T. A comprehensive assessment of the galvanic corrosion behavior of an electrically assisted pressure joint of dissimilar stainless steel alloys under uniaxial tensile stress. J. Mater. Res. Technol. 2022, 19, 3110–3129. [Google Scholar] [CrossRef]
- Anaman, S.Y.; Ansah, S.; Cho, H.H.; Jo, M.G.; Suh, J.Y.; Kang, M.; Lee, J.S.; Hong, S.T.; Han, H.N. An investigation of the microstructural effects on the mechanical and electrochemical properties of a friction stir processed equiatomic CrMnFeCoNi high entropy alloy. J. Mater. Sci. Technol. 2021, 87, 60–73. [Google Scholar] [CrossRef]
- Wen, D.; Shan, D.; Wang, S.; Zong, Y. Investigation of hydrogen influencing γ-phase true and pseudo twinning in a TiAl based alloy during high-temperature plane strain compression. Mater. Sci. Eng. A 2018, 710, 374–384. [Google Scholar] [CrossRef]
- Balluffi, R.W.; Medalist, R.F.M. Grain Boundary Diffusion Mechanisms in Metals. Metall. Mater. Trans. B 1982, 13, 527–553. [Google Scholar] [CrossRef]
- Jost, W. Diffusion and electrolytic conduction in crystals (ionic semiconductors). J. Chem. Phys. 1933, 1, 466–475. [Google Scholar] [CrossRef]
- Levine, H.S.; MacCallum, C.J. Grain boundary and lattice diffusion in polycrystalline bodies. J. Appl. Phys. 1960, 31, 595–599. [Google Scholar] [CrossRef]
- Zhu, Y.; Heo, T.W.; Rodriguez, J.N.; Weber, P.K.; Shi, R.; Baer, B.J.; Morgado, F.F.; Antonov, S.; Kweon, K.E.; Watkins, E.B.; et al. Hydriding of titanium: Recent trends and perspectives in advanced characterization and multiscale modeling. Curr. Opin. Solid State Mater. Sci. 2022, 26, 101020. [Google Scholar] [CrossRef]
- Huang, Z.; Xiao, H.; Yu, J.; Zhang, H.; Huang, H.; Yu, K.; Zhou, R. Effects of different annealing cooling methods on the microstructure and properties of TA10 titanium alloys. J. Mater. Res. Technol. 2022, 18, 4859–4870. [Google Scholar] [CrossRef]
- Liu, X.; Han, E.H.; Song, Y.; Dong, K. Hydrogen damage process of dual-phase Ti-6Al-4V alloy: From surface passive film to the interior substrate. Electrochim. Acta 2023, 464, 142916. [Google Scholar] [CrossRef]
- Mao, W.; Wilde, M.; Ogura, S.; Chen, J.; Fukutani, K.; Matsuzaki, H.; Terai, T. Hydrogen-Accelerated Phase Transition and Diffusion in TiO2 Thin Films. J. Phys. Chem. C 2018, 122, 23026–23033. [Google Scholar] [CrossRef]
- Edalati, K.; Shao, H.; Emami, H.; Iwaoka, H.; Akiba, E.; Horita, Z. Activation of titanium-vanadium alloy for hydrogen storage by introduction of nanograins and edge dislocations using high-pressure torsion. Int. J. Hydrogen Energy 2016, 41, 8917–8924. [Google Scholar] [CrossRef]
- Zakroczymski, T. Adaptation of the electrochemical permeation technique for studying entry, transport and trapping of hydrogen in metals. Electrochim. Acta 2006, 51, 2261–2266. [Google Scholar] [CrossRef]
- Iwaoka, H.; Arita, M.; Horita, Z. Hydrogen diffusion in ultrafine-grained palladium: Roles of dislocations and grain boundaries. Acta Mater. 2016, 107, 168–177. [Google Scholar] [CrossRef]


| N | C | H | Fe | O | Al | V | Y | Ti | |
|---|---|---|---|---|---|---|---|---|---|
| Ti64 | 0.002 | 0.010 | 0.004 | 0.210 | 0.190 | 6.4 | 3.95 | 0.001 | Bal. |
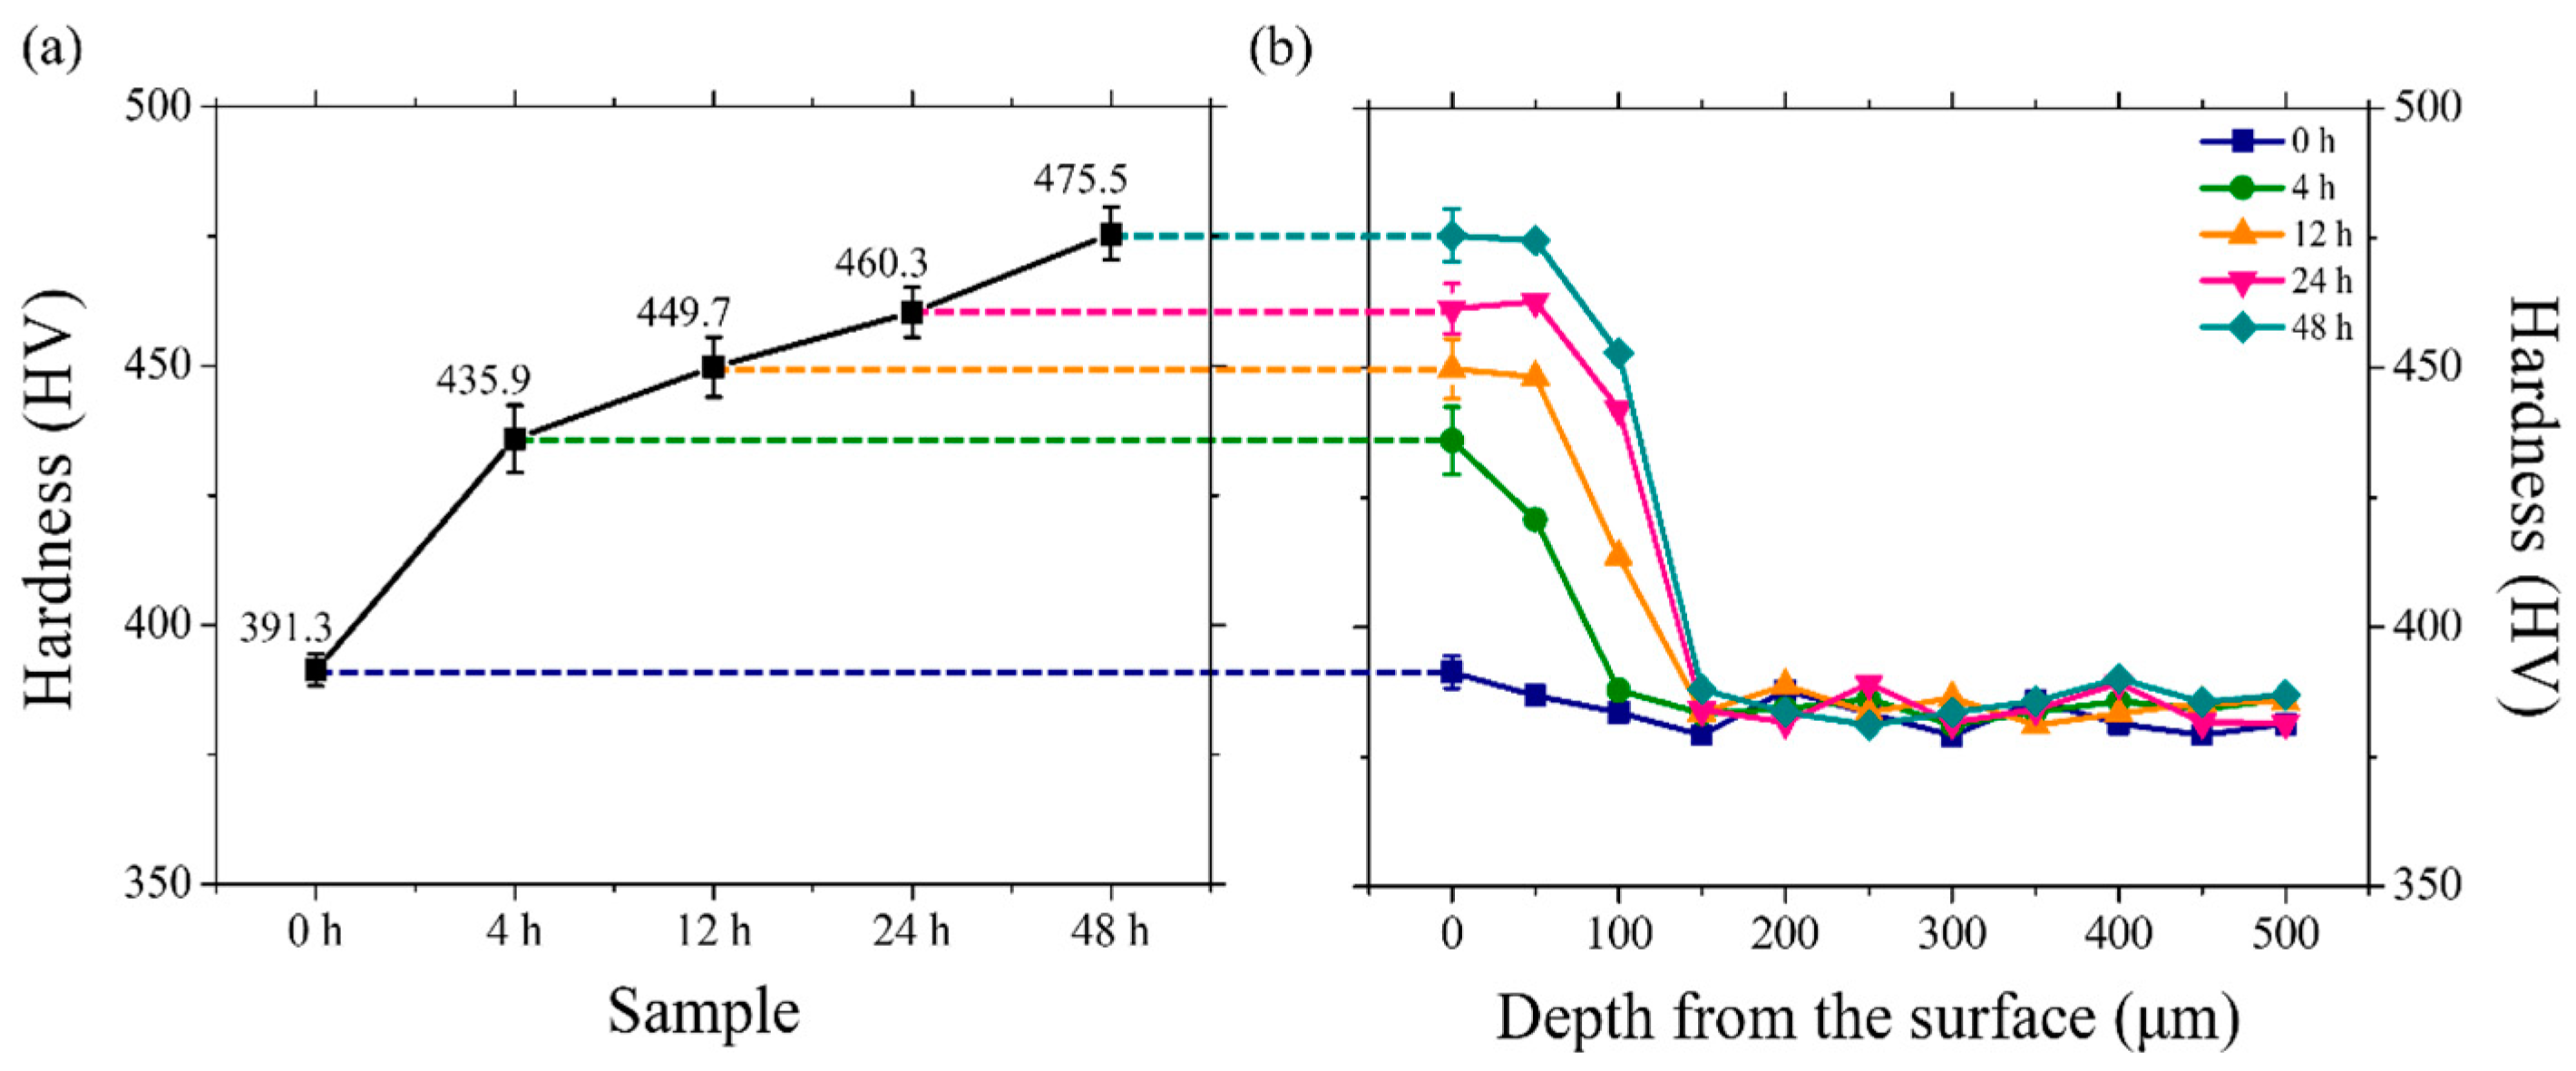
| Specimen | Microhardness (HV) |
|---|---|
| 0 h | 391.3 ± 3.1 |
| 4 h | 435.9 ± 6.5 |
| 12 h | 449.7 ± 5.8 |
| 24 h | 460.3 ± 4.8 |
| 48 h | 475.5 ± 5.1 |
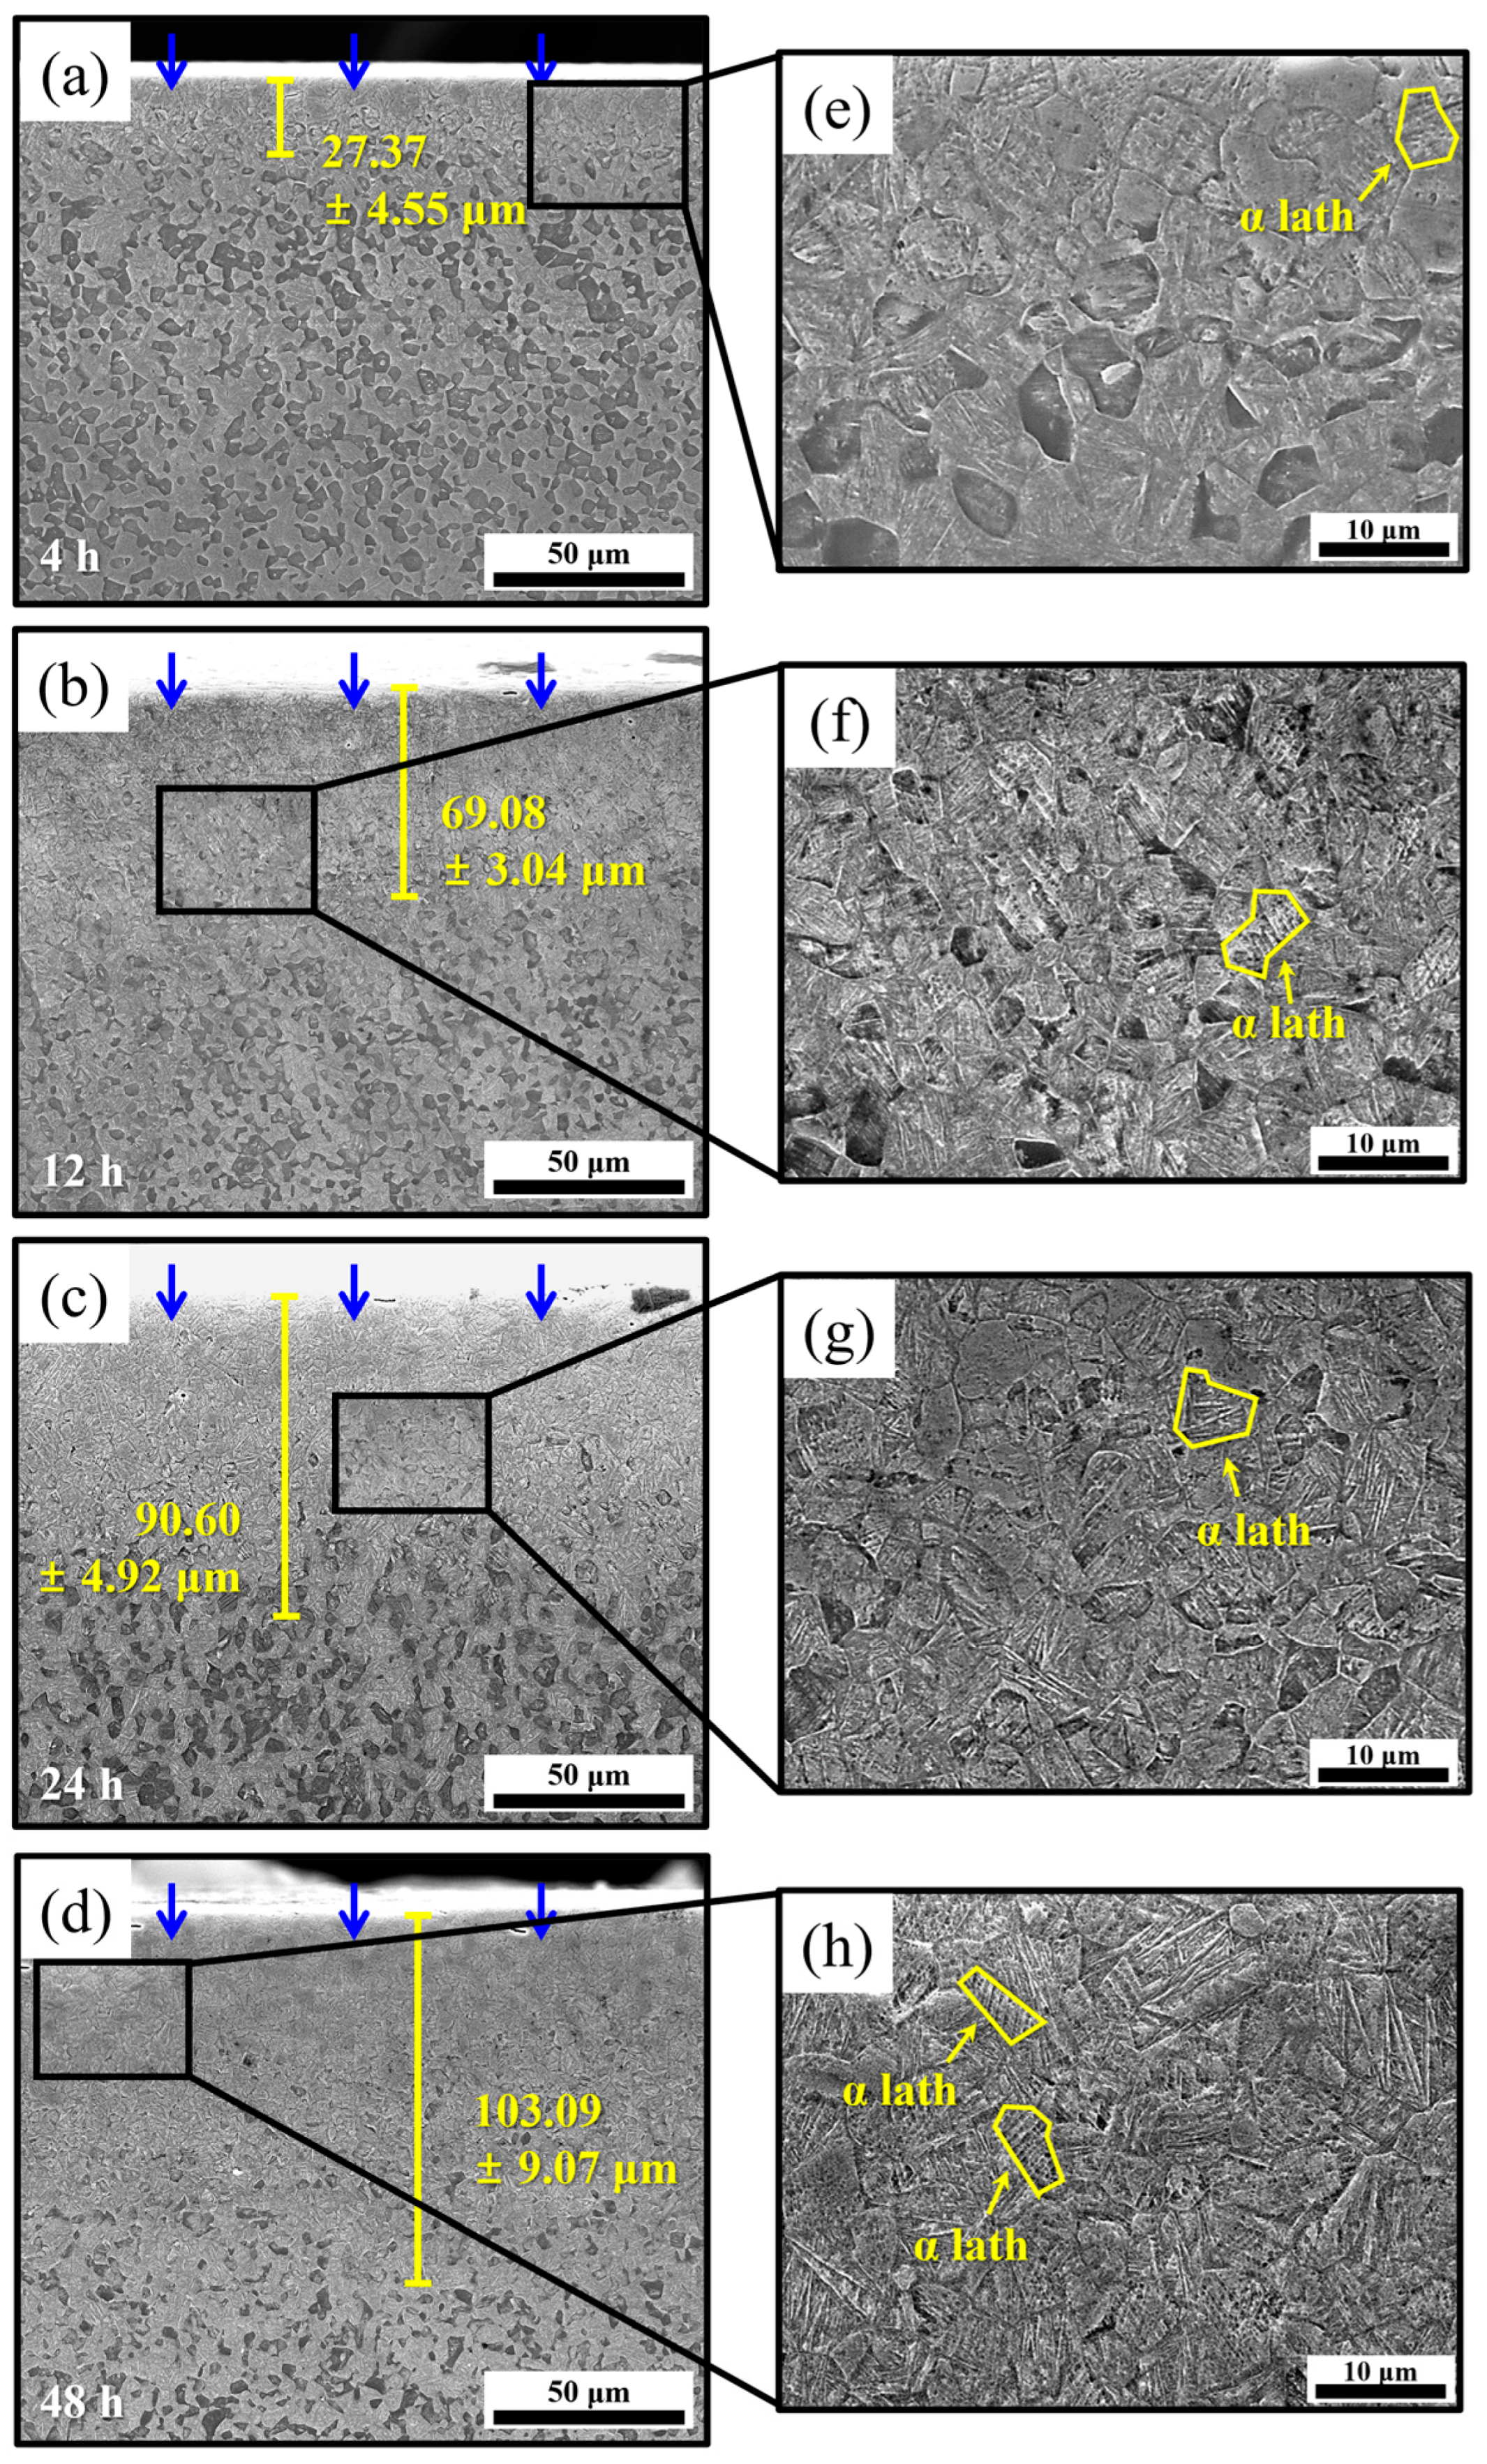
| Specimen | Hydrogen Penetration Depth (Figure 10a–d) (μm) | (m2/s) |
|---|---|---|
| 4 h | 27.37 ± 4.55 | 2.61 × 10⁻¹⁴ |
| 12 h | 69.08 ± 3.04 | 5.53 × 10⁻¹⁴ |
| 24 h | 90.60 ± 4.92 | 5.33 × 10⁻¹⁴ |
| 48 h | 103.09 ± 9.07 | 3.08 × 10⁻¹⁴ |
Disclaimer/Publisher’s Note: The statements, opinions and data contained in all publications are solely those of the individual author(s) and contributor(s) and not of MDPI and/or the editor(s). MDPI and/or the editor(s) disclaim responsibility for any injury to people or property resulting from any ideas, methods, instructions or products referred to in the content. |
© 2025 by the authors. Licensee MDPI, Basel, Switzerland. This article is an open access article distributed under the terms and conditions of the Creative Commons Attribution (CC BY) license (https://creativecommons.org/licenses/by/4.0/).
Share and Cite
Lee, H.; Anaman, S.Y.; Choi, J.-M.; Park, L.; Lee, K.; Kim, J.-K.; Lee, J.-S.; Song, J.Y.; Park, J.-S.; Cho, H.-H. Electrochemical Hydrogen-Charging Effect on the Microstructural Evolution and Mechanical Behavior of Deformed Ti Alloy. Materials 2025, 18, 518. https://doi.org/10.3390/ma18030518
Lee H, Anaman SY, Choi J-M, Park L, Lee K, Kim J-K, Lee J-S, Song JY, Park J-S, Cho H-H. Electrochemical Hydrogen-Charging Effect on the Microstructural Evolution and Mechanical Behavior of Deformed Ti Alloy. Materials. 2025; 18(3):518. https://doi.org/10.3390/ma18030518
Chicago/Turabian StyleLee, Hyojoo, Sam Yaw Anaman, Jeong-Mook Choi, Leeju Park, Keunho Lee, Jae-Kook Kim, Jong-Sook Lee, Jae Yong Song, Joon-Sik Park, and Hoon-Hwe Cho. 2025. "Electrochemical Hydrogen-Charging Effect on the Microstructural Evolution and Mechanical Behavior of Deformed Ti Alloy" Materials 18, no. 3: 518. https://doi.org/10.3390/ma18030518
APA StyleLee, H., Anaman, S. Y., Choi, J.-M., Park, L., Lee, K., Kim, J.-K., Lee, J.-S., Song, J. Y., Park, J.-S., & Cho, H.-H. (2025). Electrochemical Hydrogen-Charging Effect on the Microstructural Evolution and Mechanical Behavior of Deformed Ti Alloy. Materials, 18(3), 518. https://doi.org/10.3390/ma18030518