

Microstructure Evolution of Rapid Solidified Invar Alloy


Abstract
:1. Introduction
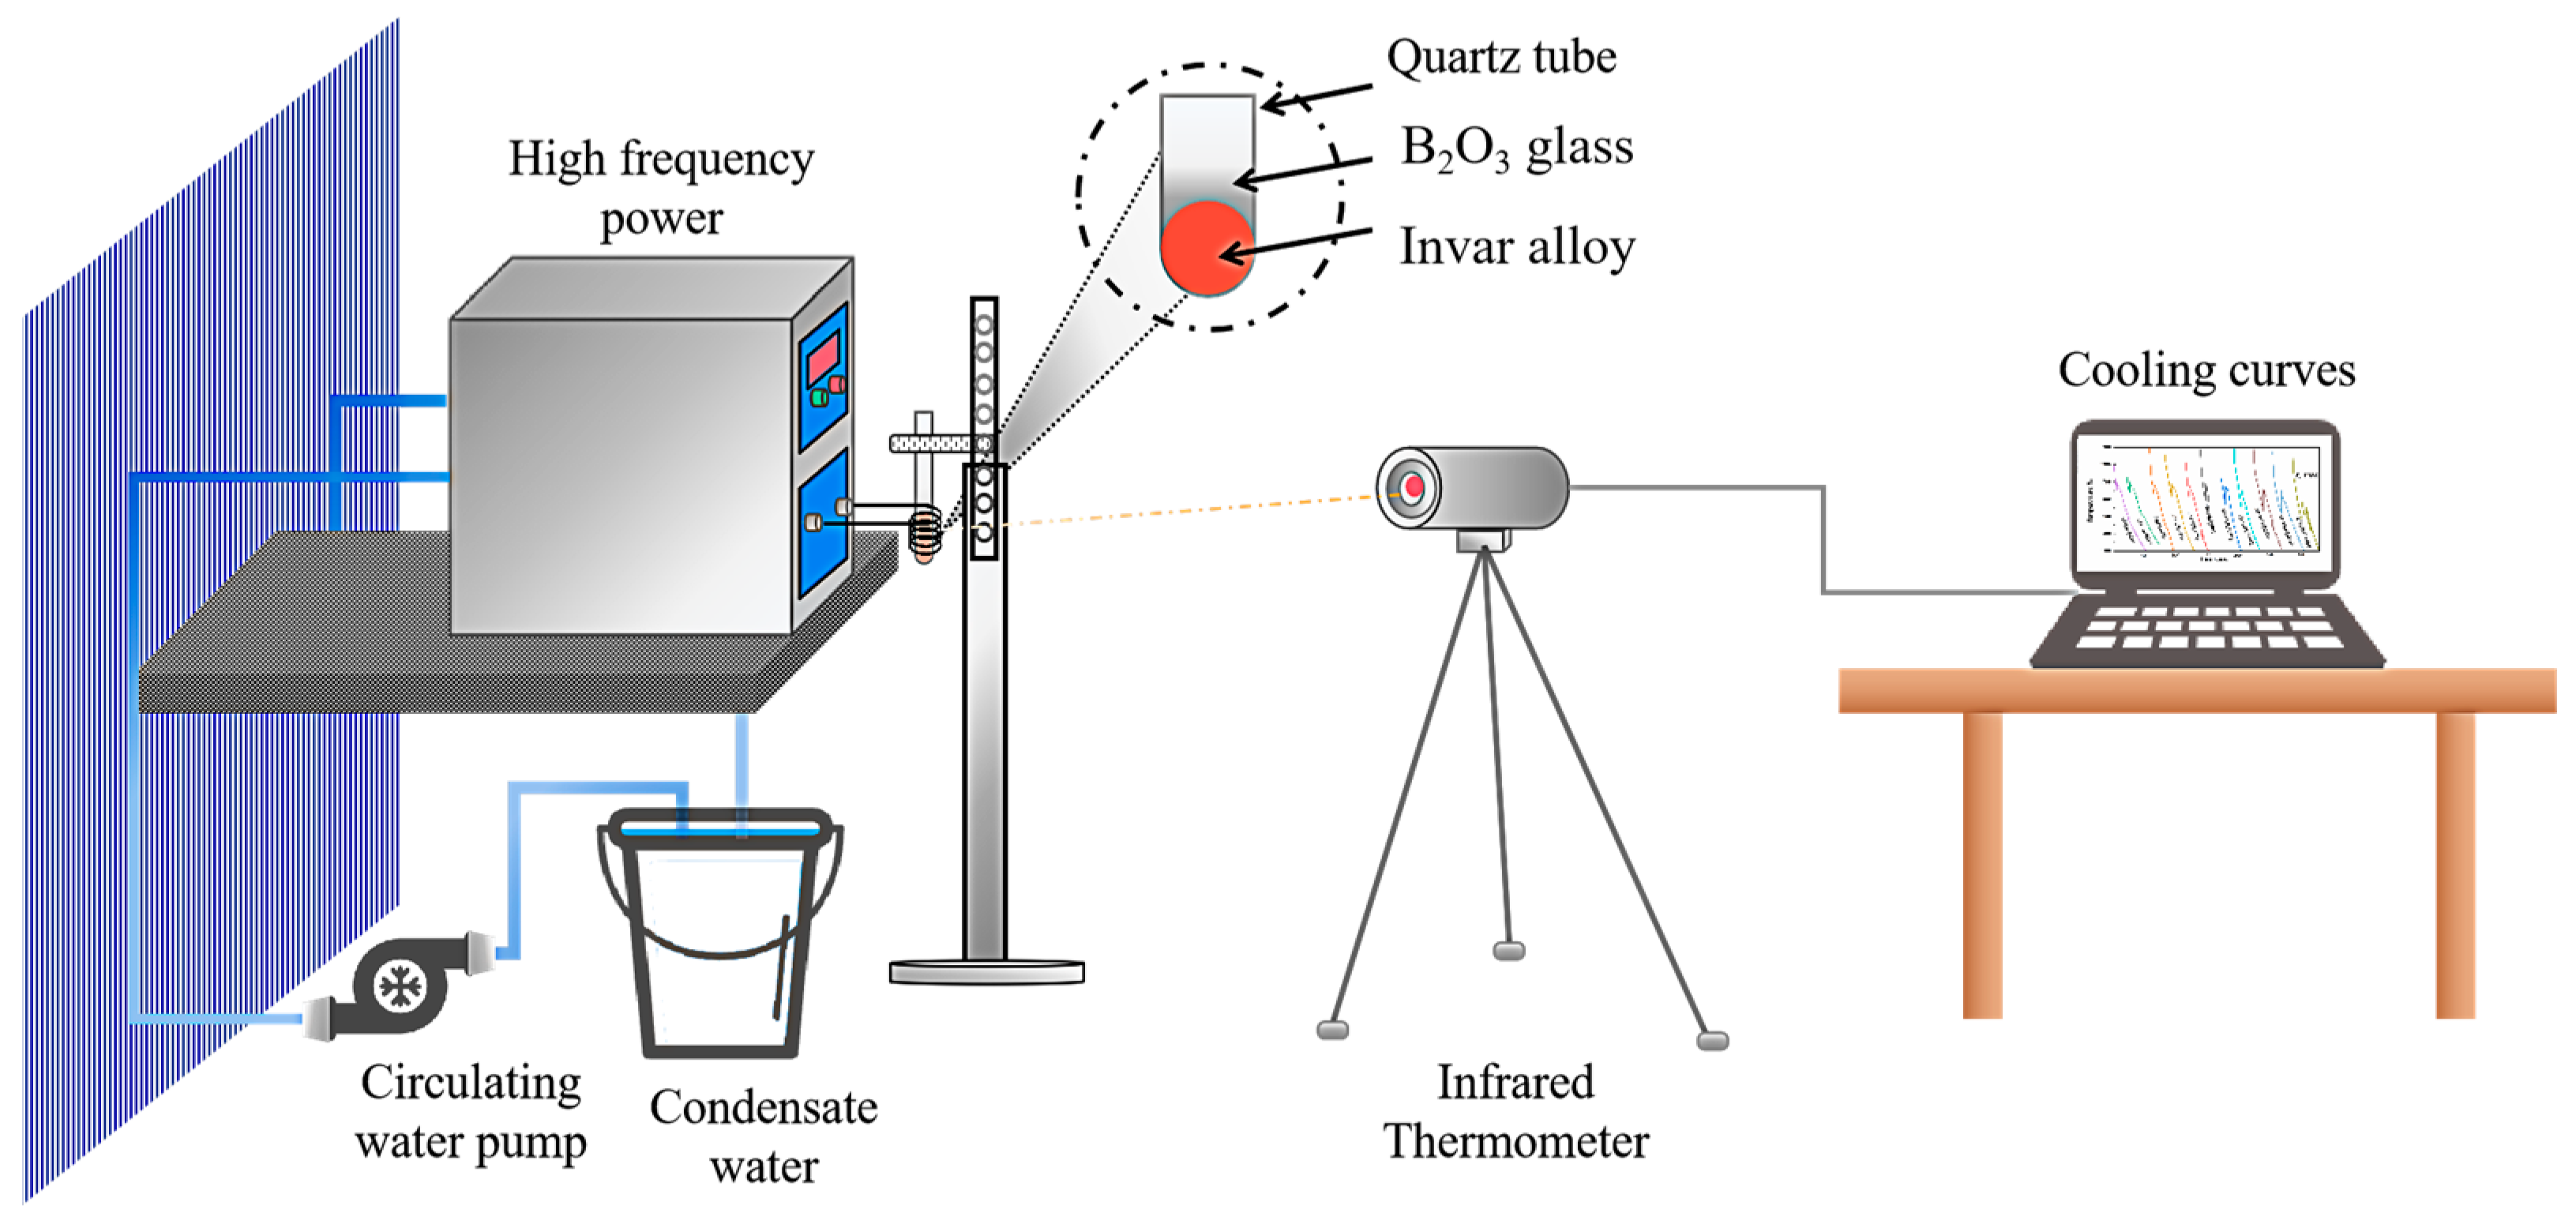
2. Experimental
3. Results
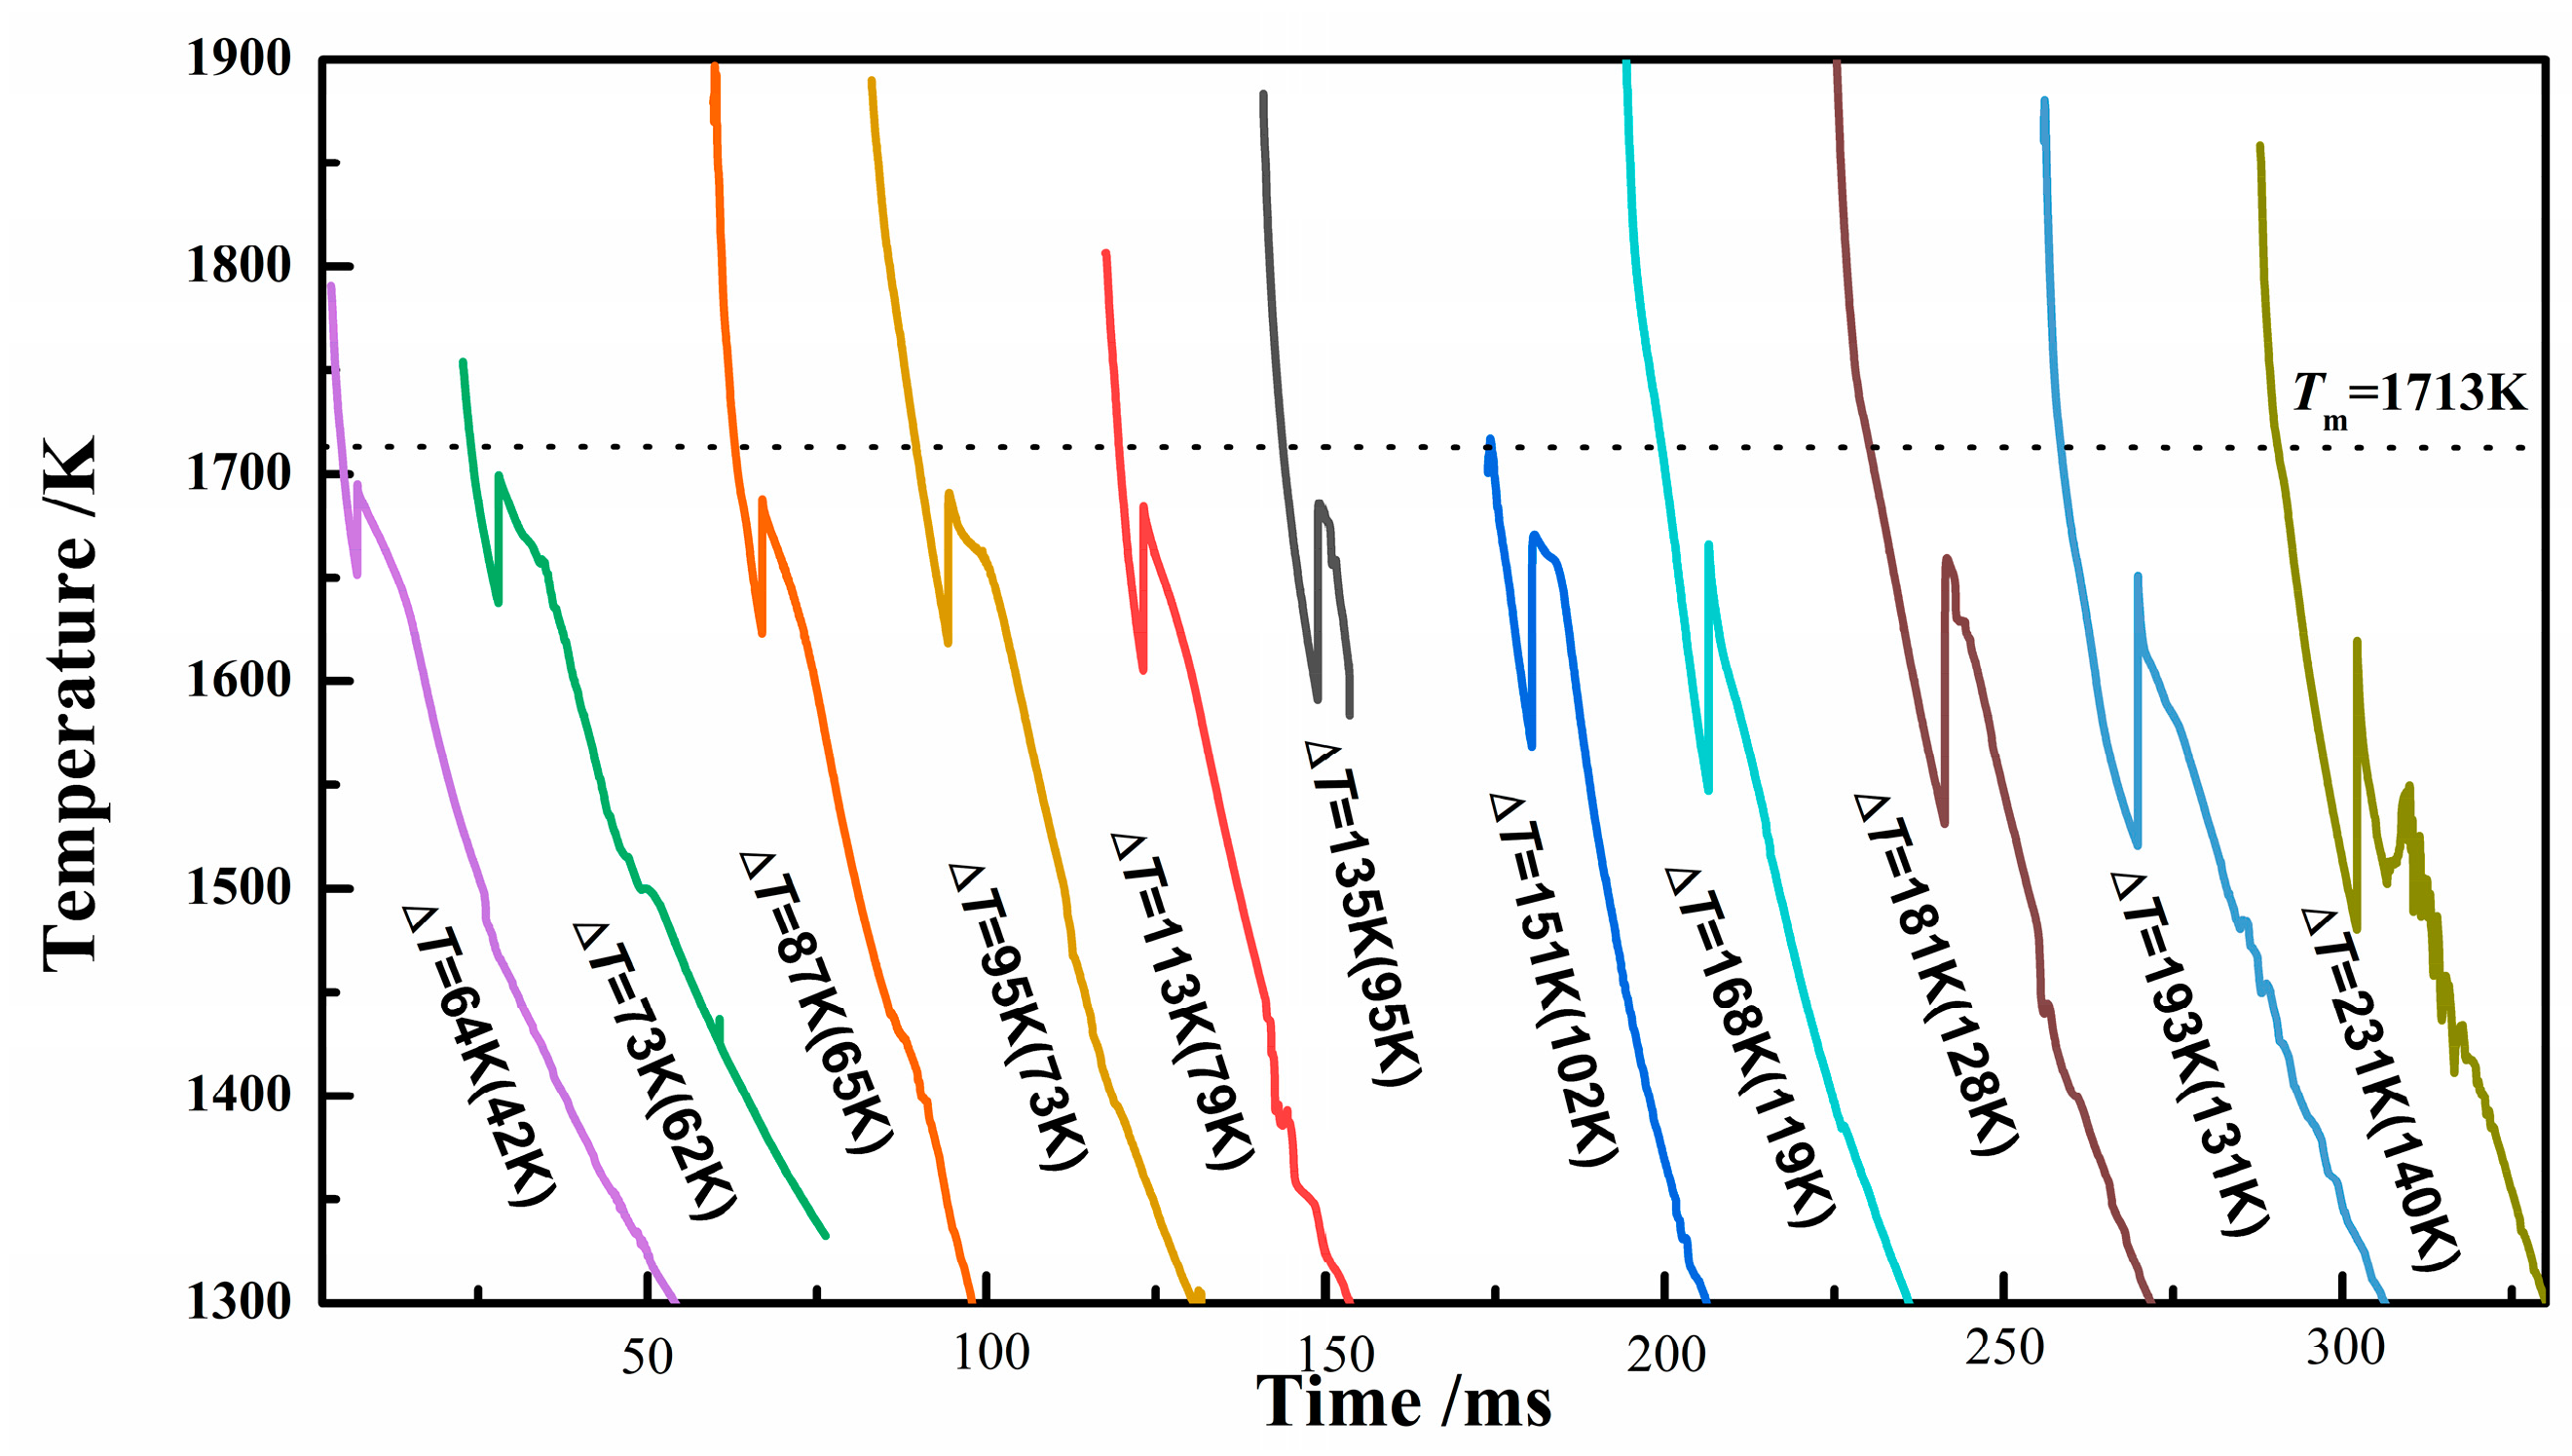
3.1. Cooling Curves
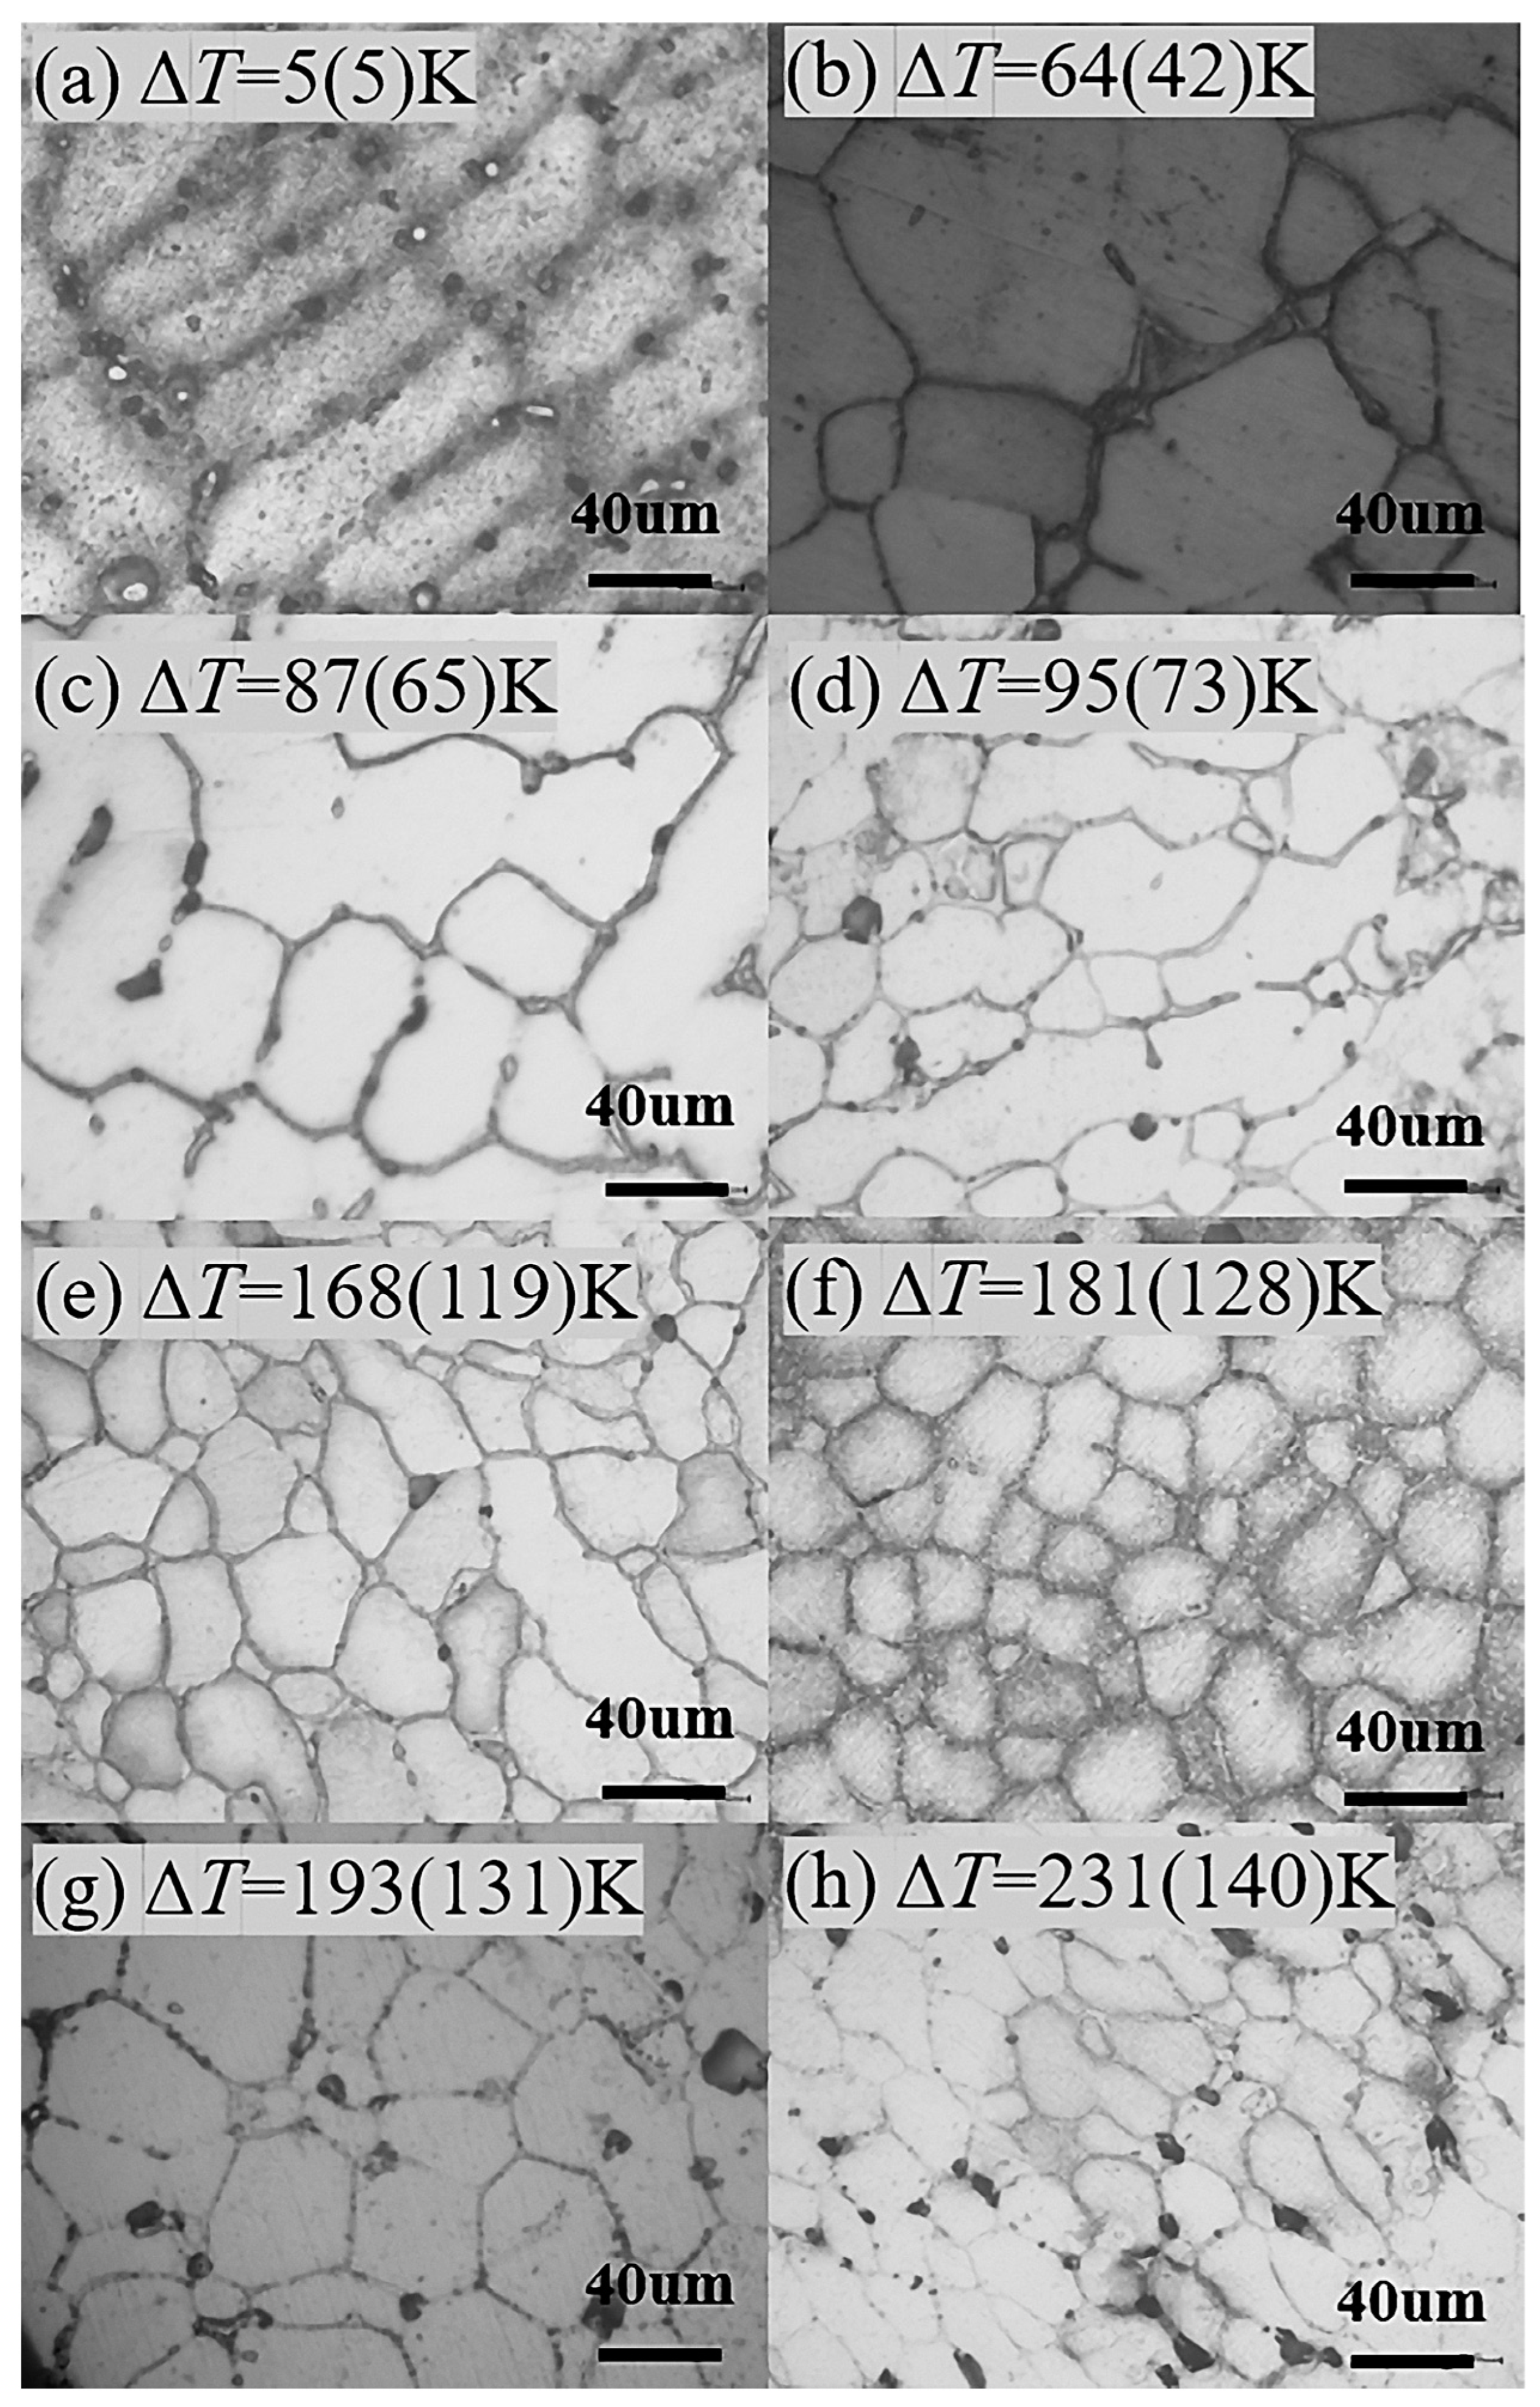
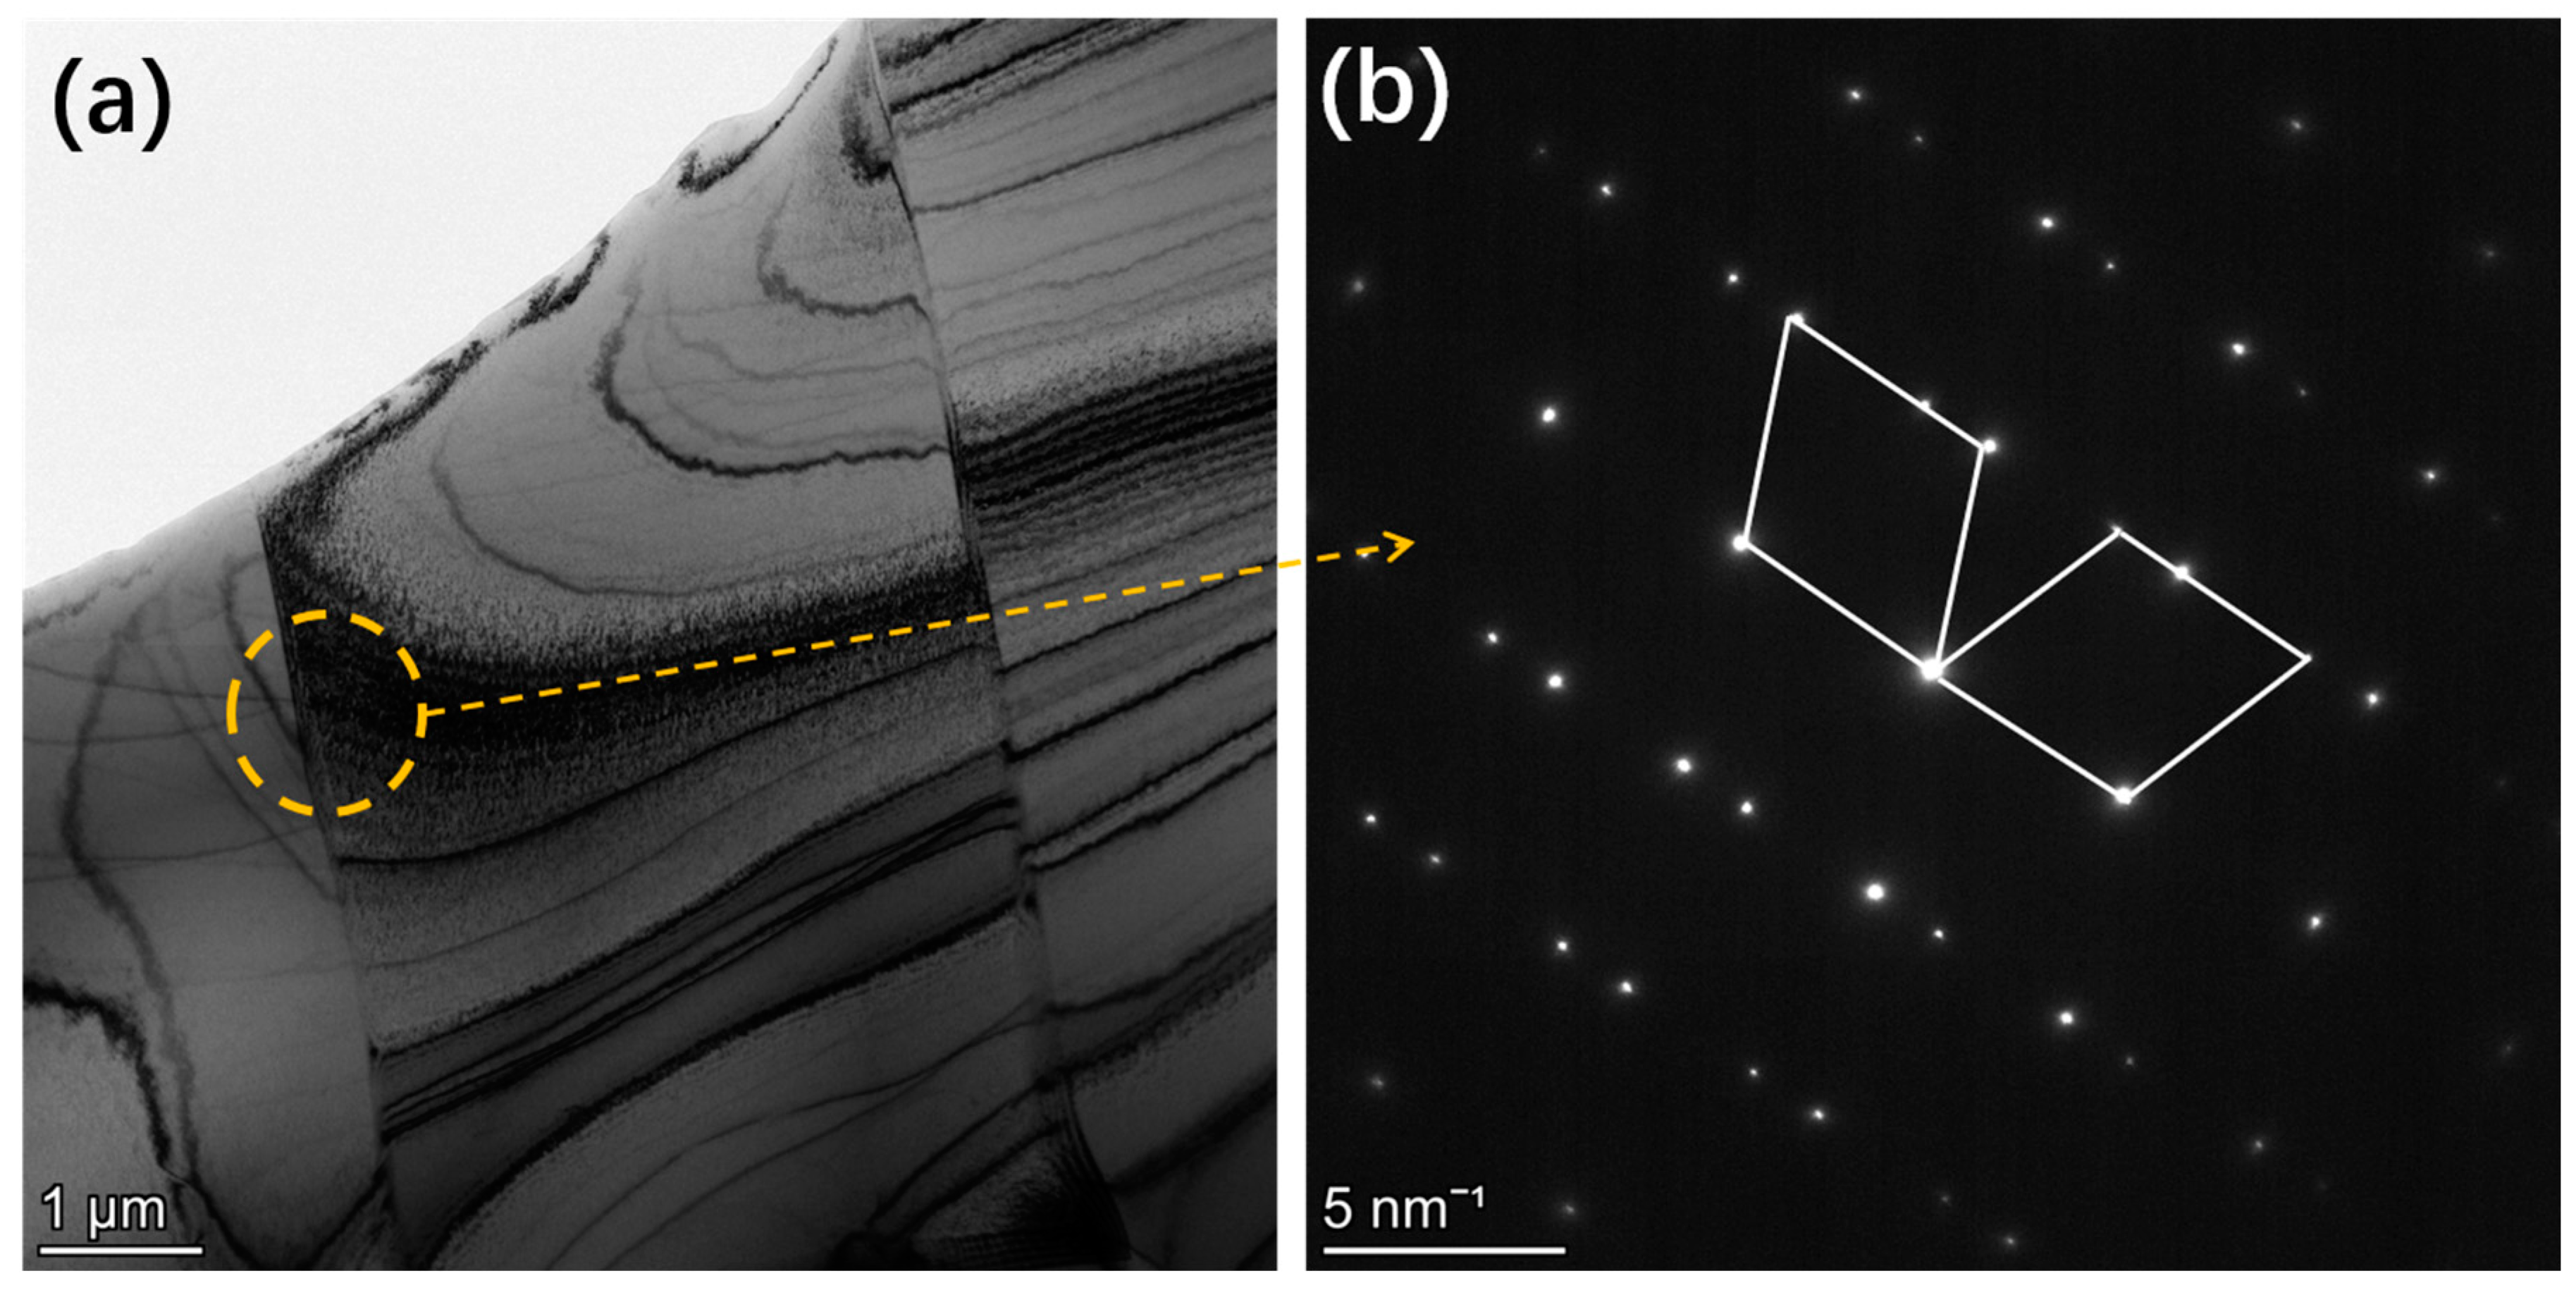
3.2. Microstructures
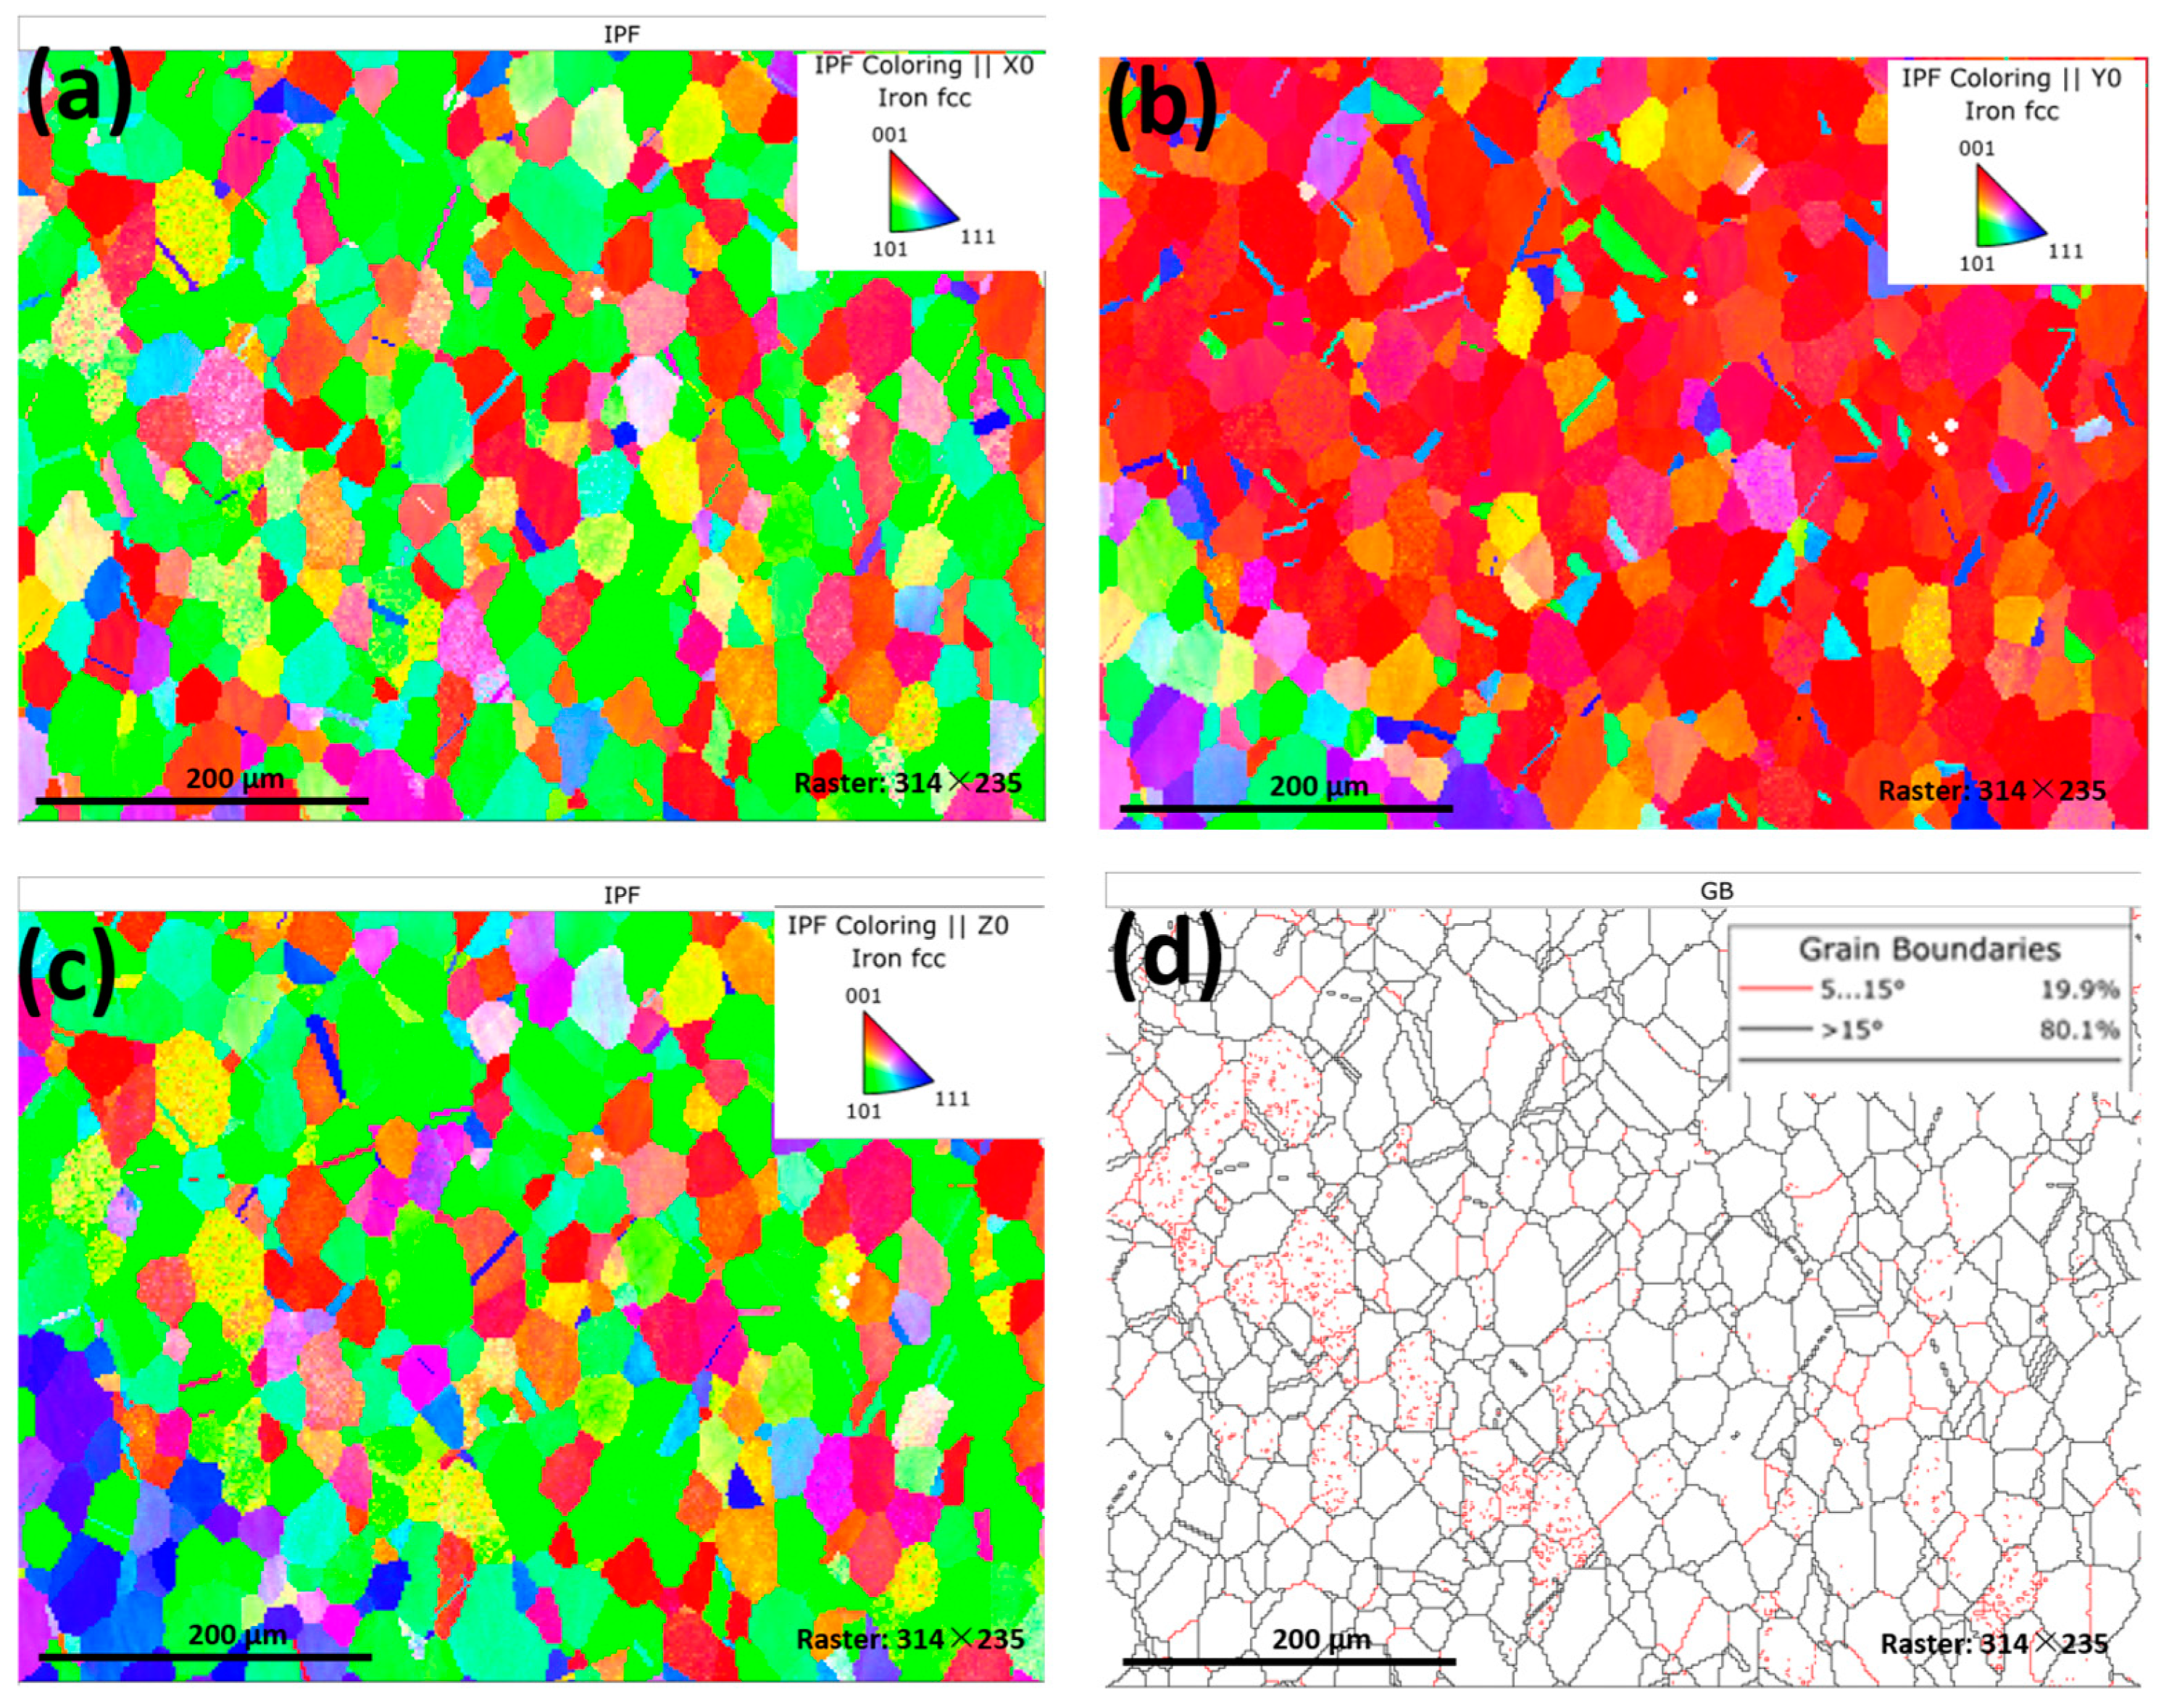
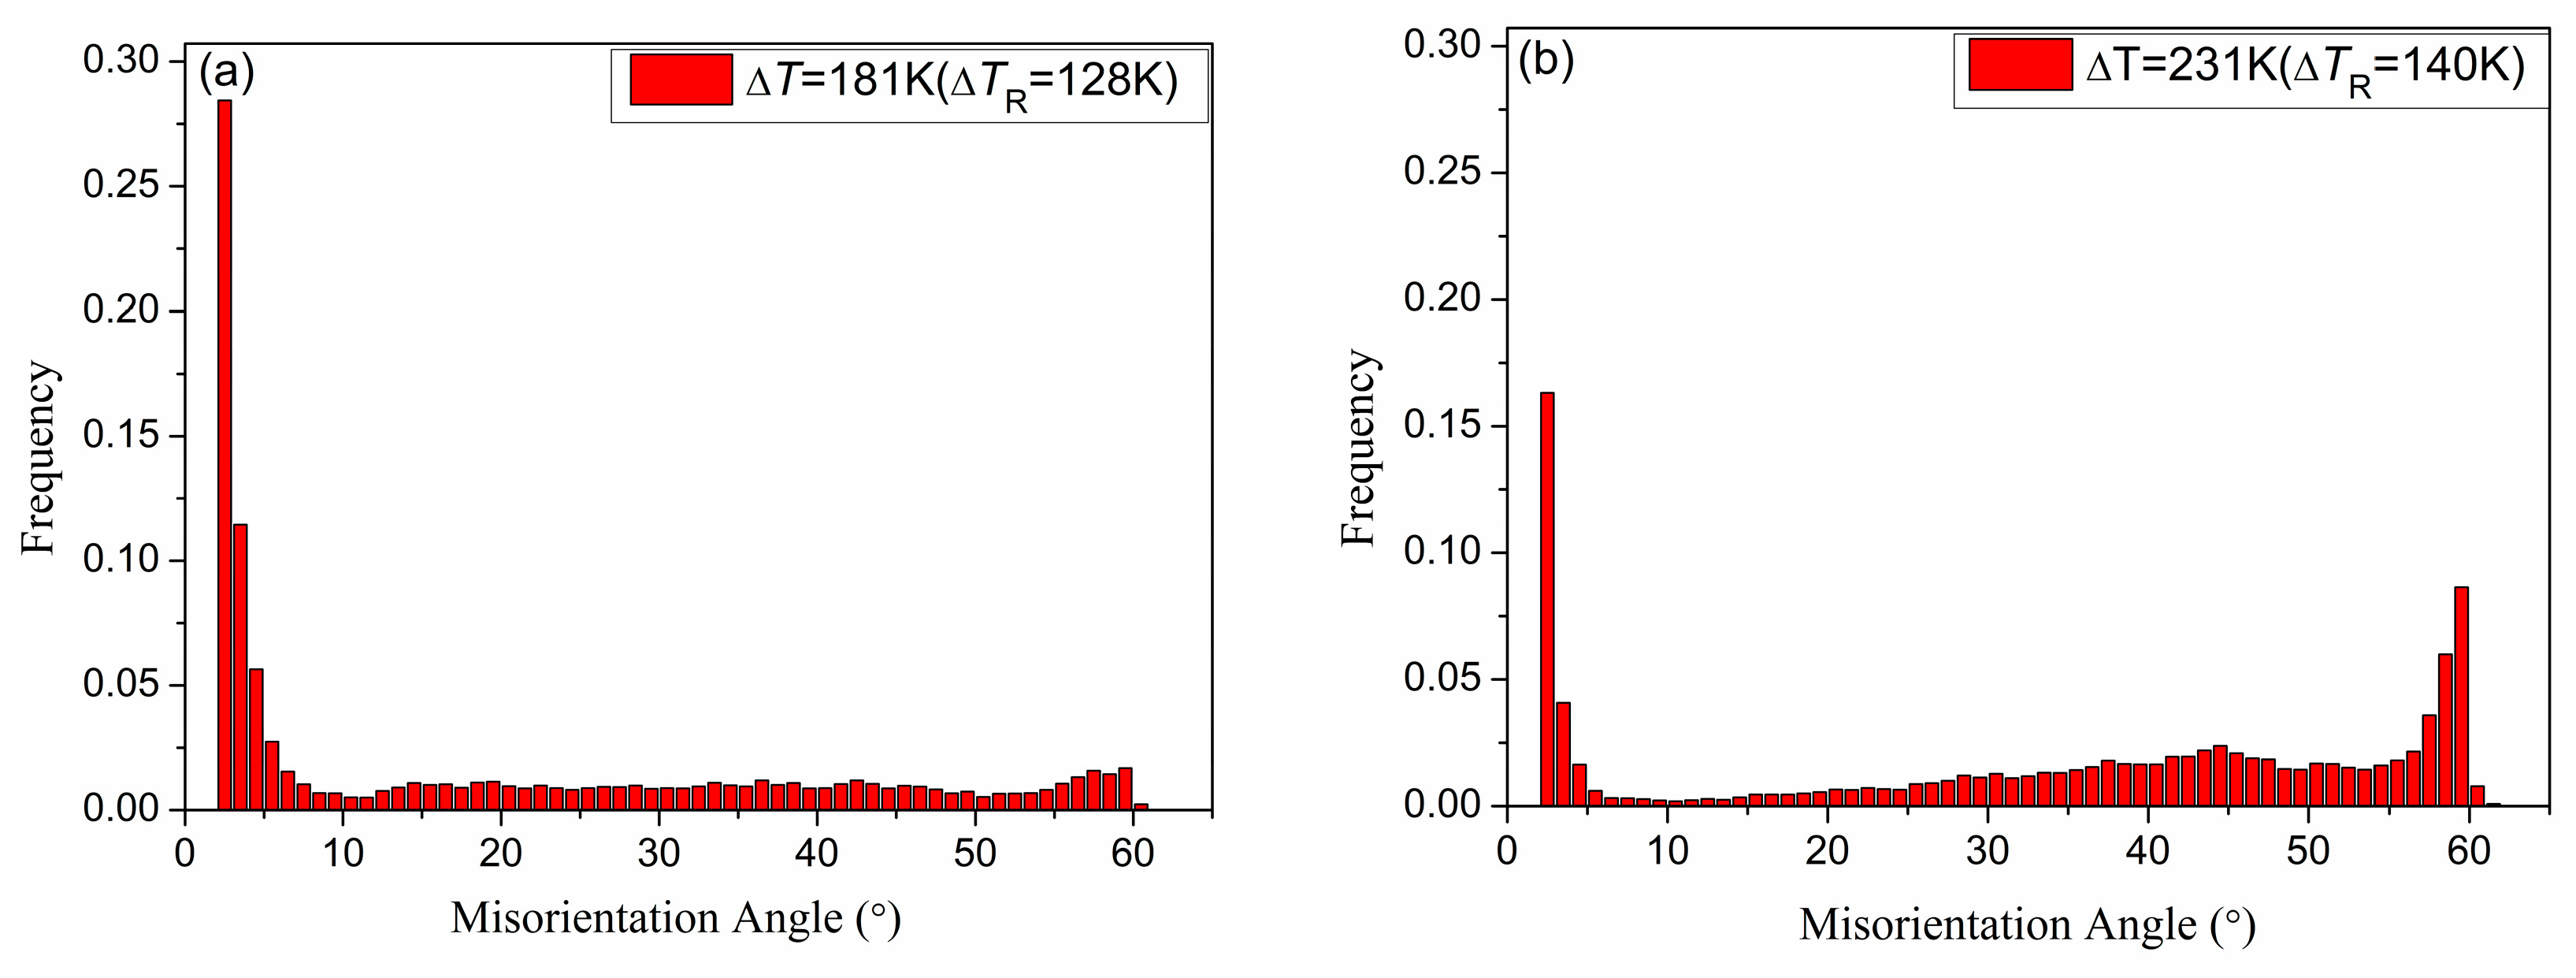
3.3. EBSD Analysis
4. Discussion
5. Conclusions
Author Contributions
Funding
Institutional Review Board Statement
Informed Consent Statement
Data Availability Statement
Acknowledgments
Conflicts of Interest
References
- Sahoo, A.; Medicherla, V.R.R. Fe-Ni Invar alloys: A review. Mater. Today Proc. 2021, 43, 2242–2244. [Google Scholar] [CrossRef]
- Silman, G.I. Compilative Fe–Ni phase diagram with author’s correction. Met. Sci. Heat Treat. 2012, 54, 105–112. [Google Scholar] [CrossRef]
- Acharya, S.S.; Medicherla VR, R.; Bapna, K.; Ali, K.; Biswas, D.; Rawat, R.; Maiti, K. Mixed ground state in Fe-Ni Invar alloys. J. Alloys Compd. 2021, 863, 158605. [Google Scholar] [CrossRef]
- Sagaradze, V.V.; Kataeva, N.V.; Zavalishin, V.A.; Shabashov, V.A.; Kozlov, K.A.; Klyukina, M.F. Conditions for the violation of concentrational homogeneity of Fe–Ni Invar alloys. Phys. Met. Metallogr. 2021, 122, 969–975. [Google Scholar] [CrossRef]
- Sui, Q.; He, J.; Zhang, X.; Sun, Z.; Zhang, Y.; Wu, Y.; Peng, H. Strengthening of the Fe-Ni Invar alloy through chromium. Materials 2019, 12, 1297. [Google Scholar] [CrossRef]
- Si, P.Z.; Choi, C.J. High hardness nanocrystalline Invar alloys prepared from Fe-Ni nanoparticles. Metals 2018, 8, 28. [Google Scholar] [CrossRef]
- Dong, H.; Zhou, H.; Li, Y.; Li, X.; Zhao, S.; Liu, X.; Wang, Y. Temperature-dependent electroplasticity in the Invar alloy. Journal of Materials Research and Technology. Temperature-dependent electroplasticity in the Invar 36 alloy. J. Mater. Res. Technol. 2024, 29, 3842–3848. [Google Scholar] [CrossRef]
- Zhu, S.; Niu, B.; Chang, Z.; Long, B.; Yin, F.; Ouyang, L.; Jiang, Z. Analysis of the thermal expansion and mechanical properties of laser cladding of Invar alloy. Int. J. Adv. Manuf. Technol. 2024, 132, 245–264. [Google Scholar] [CrossRef]
- Huang, G.; He, G.; Gong, X.; He, Y.; Liu, Y.; Huang, K. Additive manufacturing of Invar 36 alloy. J. Mater. Res. Technol. 2024, 30, 1241–1268. [Google Scholar] [CrossRef]
- Singh, R.S.; Guruswamy, S. Elastic constants of equiatomic Fe–Ni Invar alloy single crystal. AIP Adv. 2023, 13, 115112. [Google Scholar] [CrossRef]
- Schönfeld, B.; Sax, C.R. Static atomic displacements in the near-surface region of the Invar alloy Fe-28 at.% Pt. Acta Mater. 2018, 151, 470–477. [Google Scholar] [CrossRef]
- Park, S.J.; Jo, S.H.; Oh, S.; Oh, Y.S.; Kim, S.J.; Lee, H.W.; Kang, S.H.; Moon, Y.H.; Jung, J. Microstructure-dependent etching behavior of a partially recrystallized Invar alloy. Mater. Des. 2022, 217, 110631. [Google Scholar] [CrossRef]
- Xu, N.; Song, Q.; Bao, Y. Microstructure and mechanical properties’ modification of friction stir welded Invar 36 alloy joint. Sci. Technol. Weld. Join. 2019, 24, 79–82. [Google Scholar] [CrossRef]
- Li, H.; Chen, B.; Tan, C.; Song, X.; Feng, J. Microstructure evolution and mechanical properties of laser metal deposition of Invar 36 alloy. Opt. Laser Technol. 2020, 125, 106037. [Google Scholar] [CrossRef]
- Hao, Y.; Xu, X.; Wu, Q.; Zhao, Y.; Hou, H. Study on the microstructure evolution mechanism of copper single phase alloys under deep undercooling conditions. J. Mater. Res. Technol. 2023, 25, 1069–1085. [Google Scholar] [CrossRef]
- Hao, Y.; Xu, X.; Wu, Q.; Wu, L.; Zhao, Y.; Hou, H. Investigation on nonequilibrium crystallization of highly undercooled Cu–Ni–Co alloys. J. Mater. Res. Technol. 2023, 26, 654–665. [Google Scholar] [CrossRef]
- Wang, H.F.; Tang, C.; An, O.G.; Lu, K.; Zhao, Y.H. Microstructure refinement mechanism of undercooled Cu (55) Ni (45) alloys. Mater. Sci. Pol. 2021, 39, 319–330. [Google Scholar] [CrossRef]
- Dai, F.P.; Wang, W.L.; Ruan, Y.; Wei, B. Liquid phase separation and rapid dendritic growth of undercooled ternary Fe60Co20Cu20 alloy. Appl. Phys. A 2018, 124, 20. [Google Scholar] [CrossRef]
- Lü, P.; Wang, H.P.; Wei, B. Competitive nucleation and growth between the primary and peritectic phases of rapidly solidifying Ni–Zr hypoperitectic alloy. Metall. Mater. Trans. A 2019, 50, 789–803. [Google Scholar] [CrossRef]
- Wang, Y.; Gao, J.; He, L. Facile formation of a superalloy-like microstructure in Ni77Ga23 alloys by rapid solidification processing. Scr. Mater. 2024, 239, 115822. [Google Scholar] [CrossRef]
- Sahoo, D.; Paliwal, M.; Srivastava, A.; Mishra, S. A comparative study on the microstructure development in Fe50Cu50 alloy prepared using aerodynamic levitation process and W-wire held process. J. Alloys Compd. 2022, 925, 166693. [Google Scholar] [CrossRef]
- Shkatov, V.; Mazur, I. Modeling the dynamic recrystallization and flow curves using the kinetics of static recrystallization. Materials 2019, 12, 3024. [Google Scholar] [CrossRef] [PubMed]
- Wang, Y.H.; Kang, J.M.; Peng, Y.; Wang, T.S.; Hansen, N.; Huang, X. Hall-Petch strengthening in Fe-34.5 Mn-0.04 C steel cold-rolled, partially recrystallized and fully recrystallized. Scr. Mater. 2018, 155, 41–45. [Google Scholar] [CrossRef]
- Xu, X.; Tang, C.; Wang, H.; An, Y.; Zhao, Y. Microstructure evolution and grain refinement mechanism of rapidly solidified single-phase copper based alloys. J. Mater. Sci. Technol. 2022, 128, 160–179. [Google Scholar] [CrossRef]
- He, H.; Yao, Z.; Li, X.; Xu, J. Rapid Solidification of Invar Alloy. Materials 2024, 17, 231. [Google Scholar] [CrossRef]
- Schwarz, M.; Karma, A.; Eckler, K.; Herlach, D.M. Physical mechanism of grain refinement in solidification of undercooled melts. Phys. Rev. Lett. 1994, 73, 1380. [Google Scholar] [CrossRef]
- Xu, X.L.; Zhao, Y.H.; Hou, H. Growth velocity-undercooling relationship and structure refinement mechanism of undercooled Ni-Cu alloys. J. Alloys Compd. 2019, 773, 1131–1140. [Google Scholar] [CrossRef]
- Xu, X.; Hao, Y.; Dong, R.; Hou, H.; Zhao, Y. Effect of undercooling on microstructure evolution of Cu based alloys. J. Alloys Compd. 2023, 935, 167998. [Google Scholar] [CrossRef]


Disclaimer/Publisher’s Note: The statements, opinions and data contained in all publications are solely those of the individual author(s) and contributor(s) and not of MDPI and/or the editor(s). MDPI and/or the editor(s) disclaim responsibility for any injury to people or property resulting from any ideas, methods, instructions or products referred to in the content. |
© 2025 by the authors. Licensee MDPI, Basel, Switzerland. This article is an open access article distributed under the terms and conditions of the Creative Commons Attribution (CC BY) license (https://creativecommons.org/licenses/by/4.0/).
Share and Cite
He, H.; Yao, Z.; Xu, J.; Shi, X.; Li, X. Microstructure Evolution of Rapid Solidified Invar Alloy. Materials 2025, 18, 691. https://doi.org/10.3390/ma18030691
He H, Yao Z, Xu J, Shi X, Li X. Microstructure Evolution of Rapid Solidified Invar Alloy. Materials. 2025; 18(3):691. https://doi.org/10.3390/ma18030691
Chicago/Turabian StyleHe, Hanxin, Zhirui Yao, Junfeng Xu, Xianzhe Shi, and Xuyang Li. 2025. "Microstructure Evolution of Rapid Solidified Invar Alloy" Materials 18, no. 3: 691. https://doi.org/10.3390/ma18030691
APA StyleHe, H., Yao, Z., Xu, J., Shi, X., & Li, X. (2025). Microstructure Evolution of Rapid Solidified Invar Alloy. Materials, 18(3), 691. https://doi.org/10.3390/ma18030691