
Impact of Recycled Fine Aggregate on Physical and Mechanical Properties of Green Mortar


Abstract
:1. Introduction
2. Materials and Methods
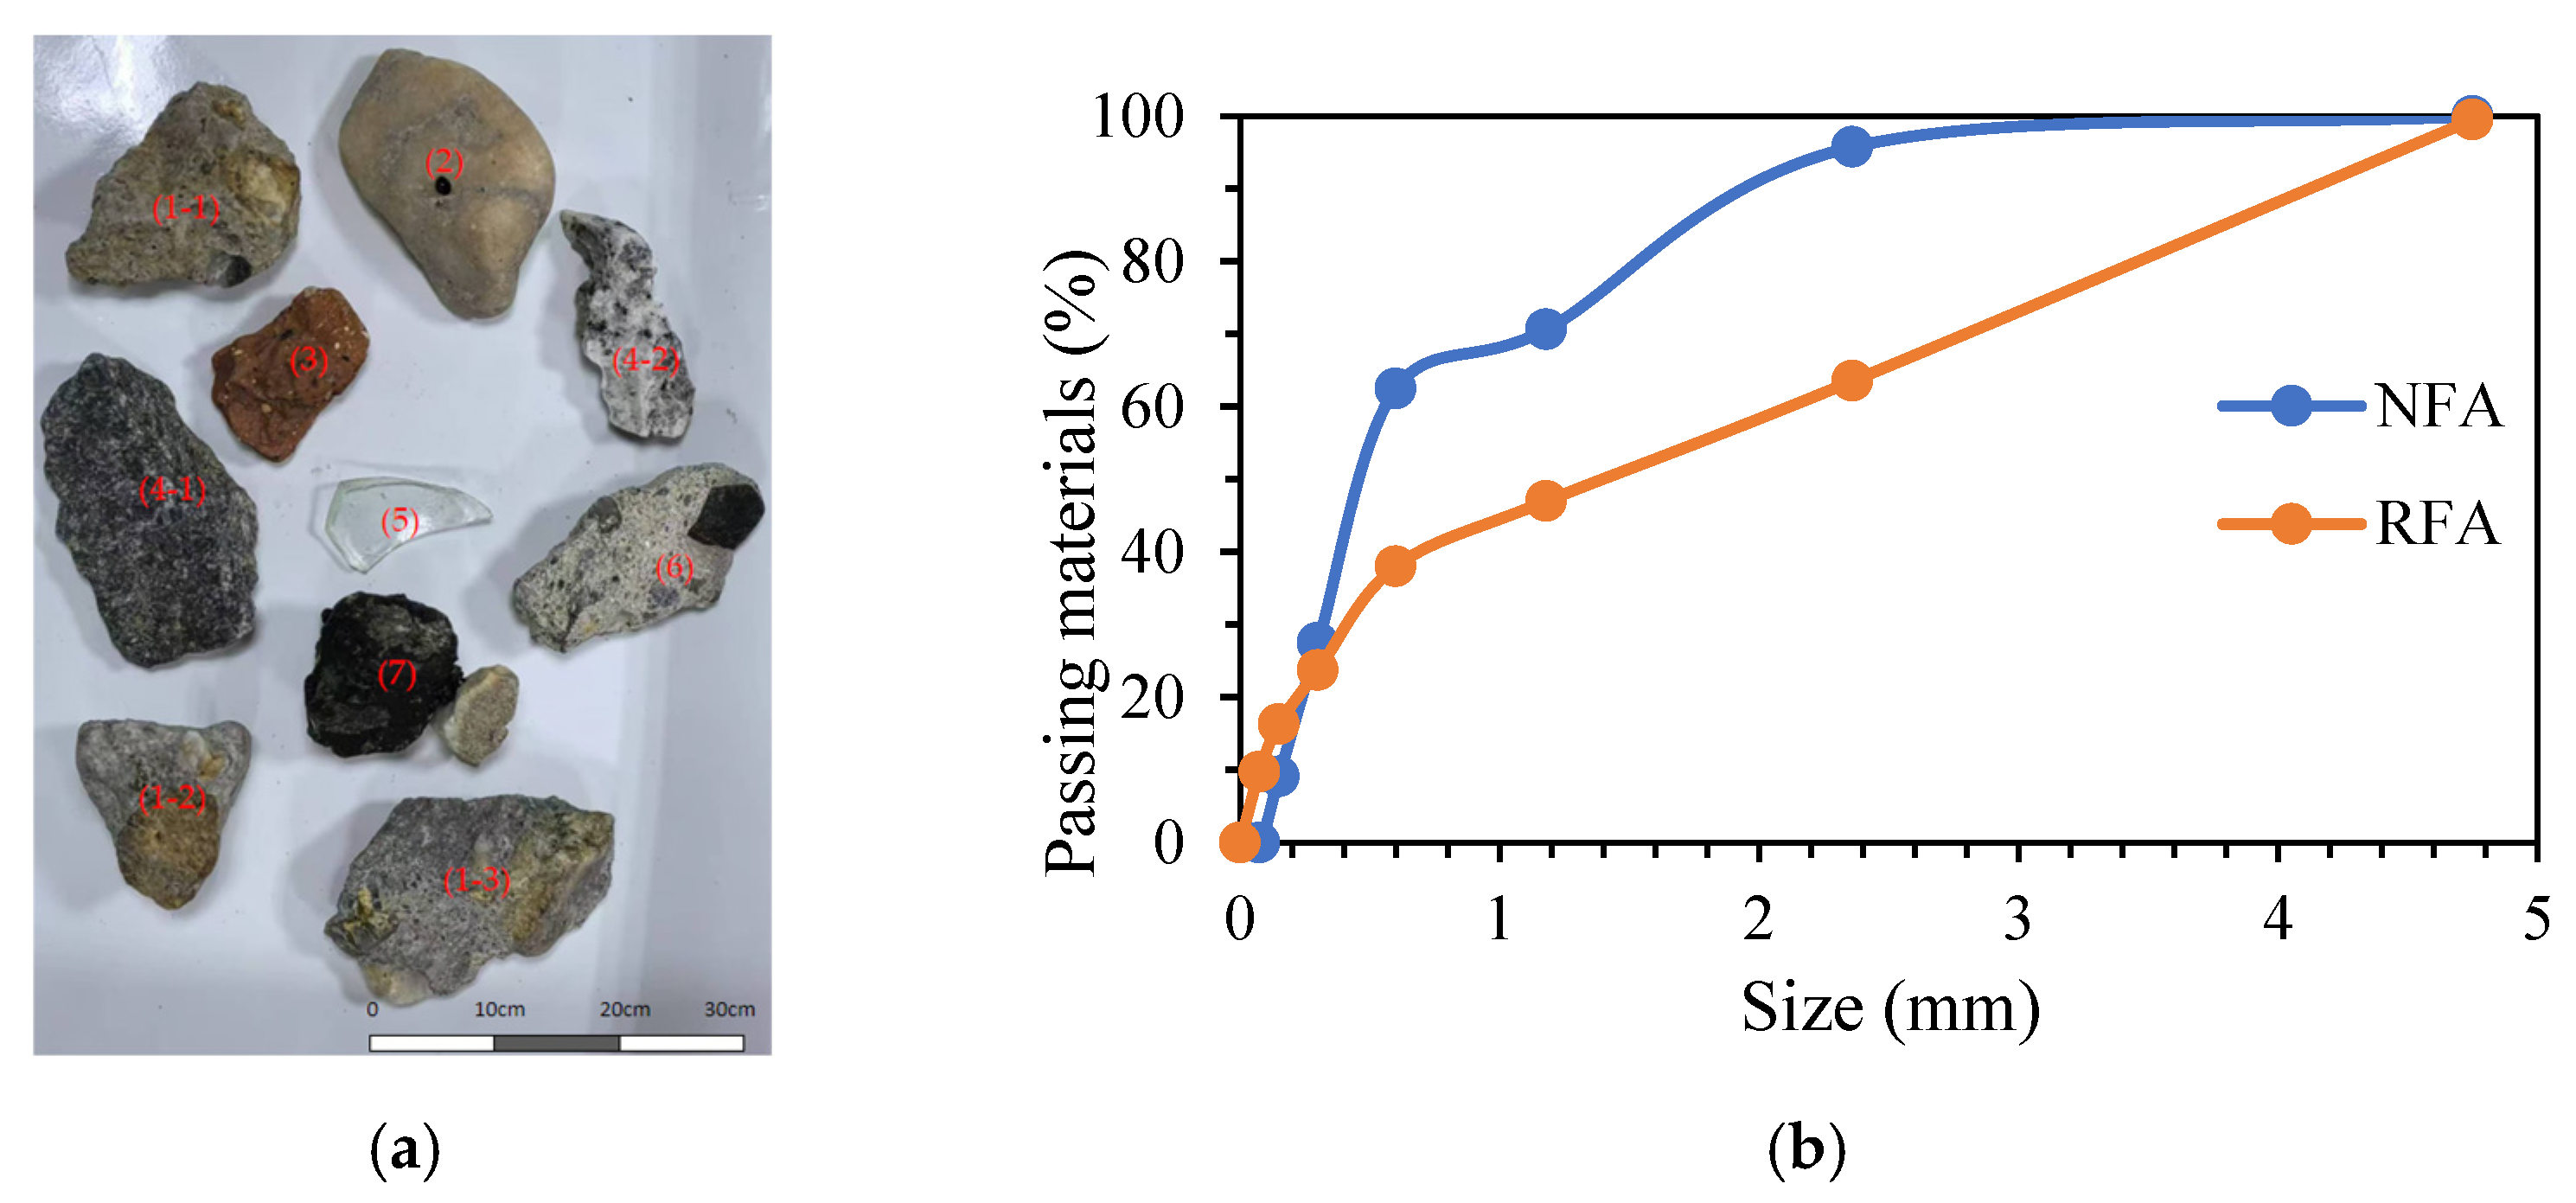
2.1. Materials
2.2. Formulation Mortar Mix Ratio
2.3. Methods
2.3.1. Consistency of Fresh Mortar
2.3.2. Setting Time of Fresh Mortar
2.3.3. Microstructure
2.3.4. Density and Water Absorption of Mortar
2.3.5. Capillary Water Absorption of Mortar
2.3.6. Compressive Strength of Mortar
2.3.7. Flexural Strength of Mortar
3. Results and Discussion
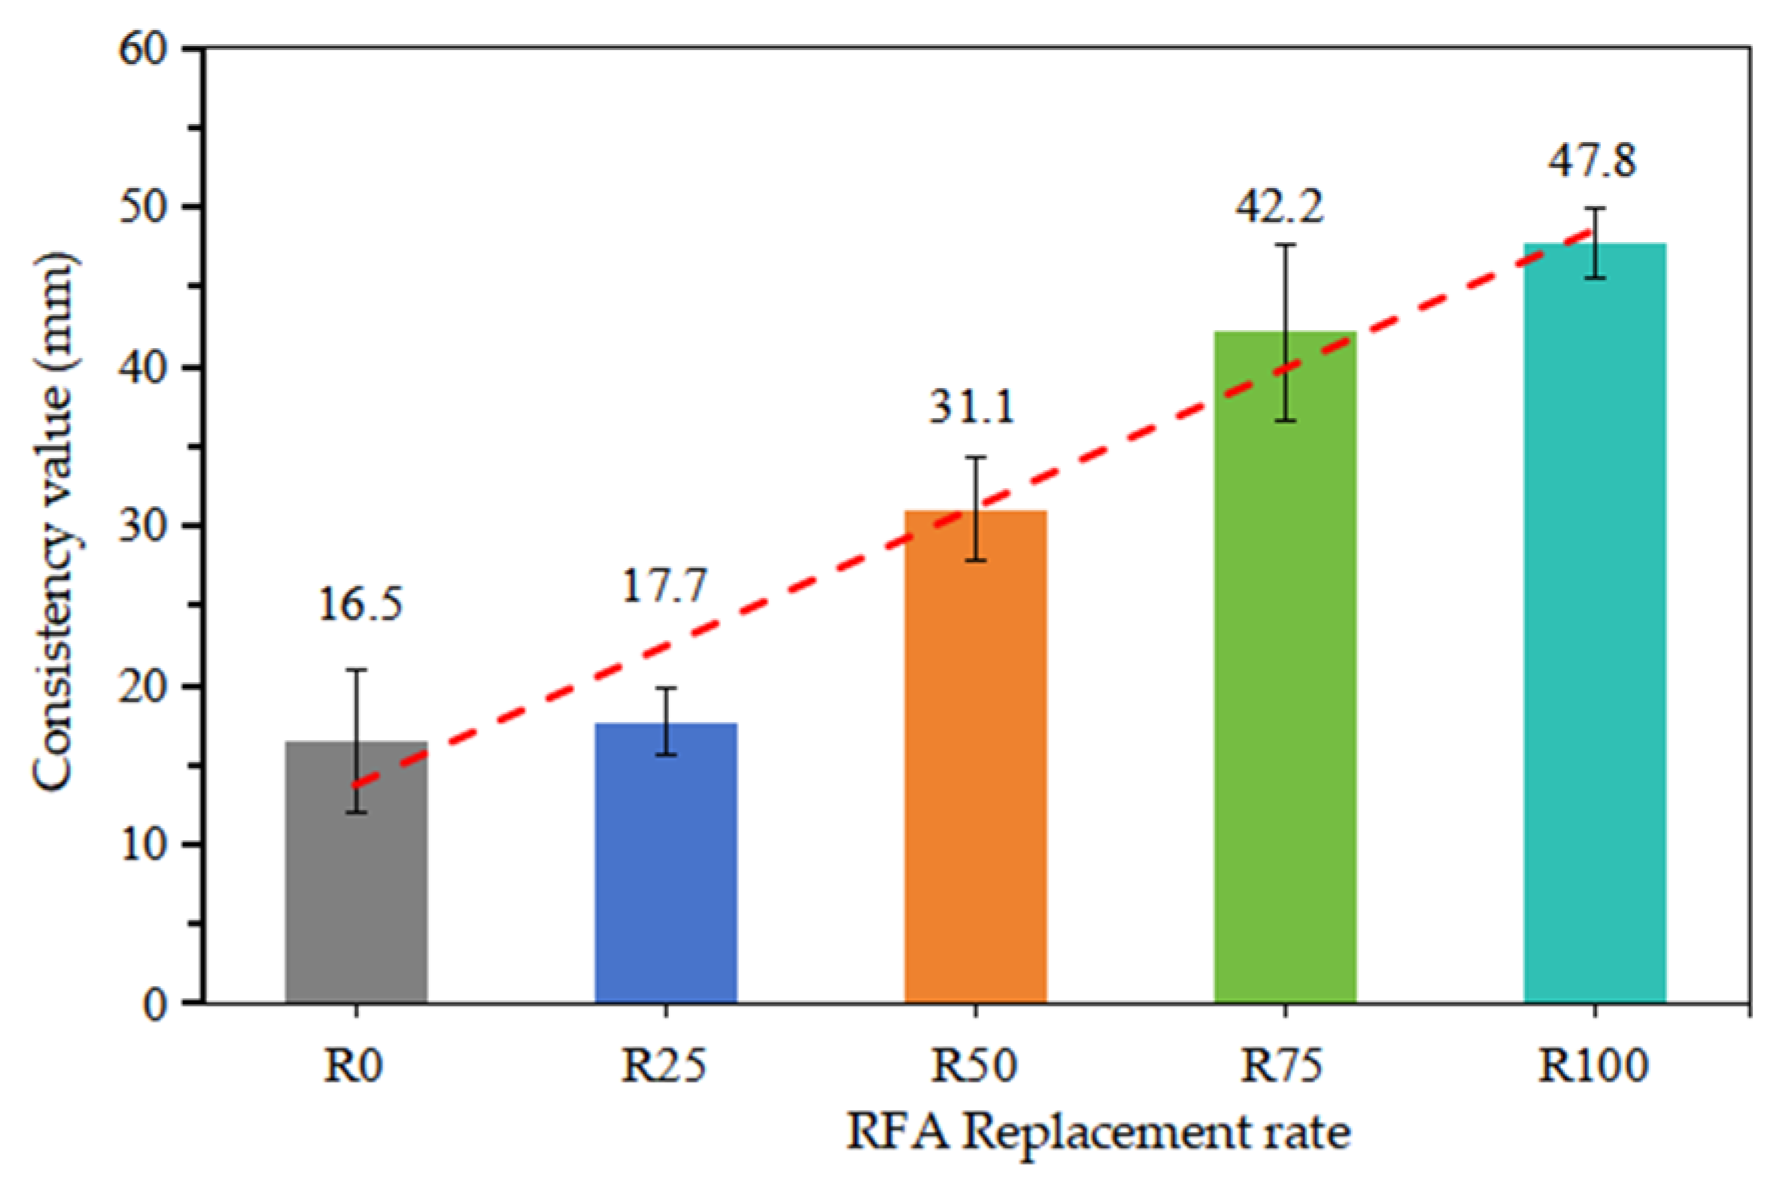
3.1. Fresh Mortar Consistency
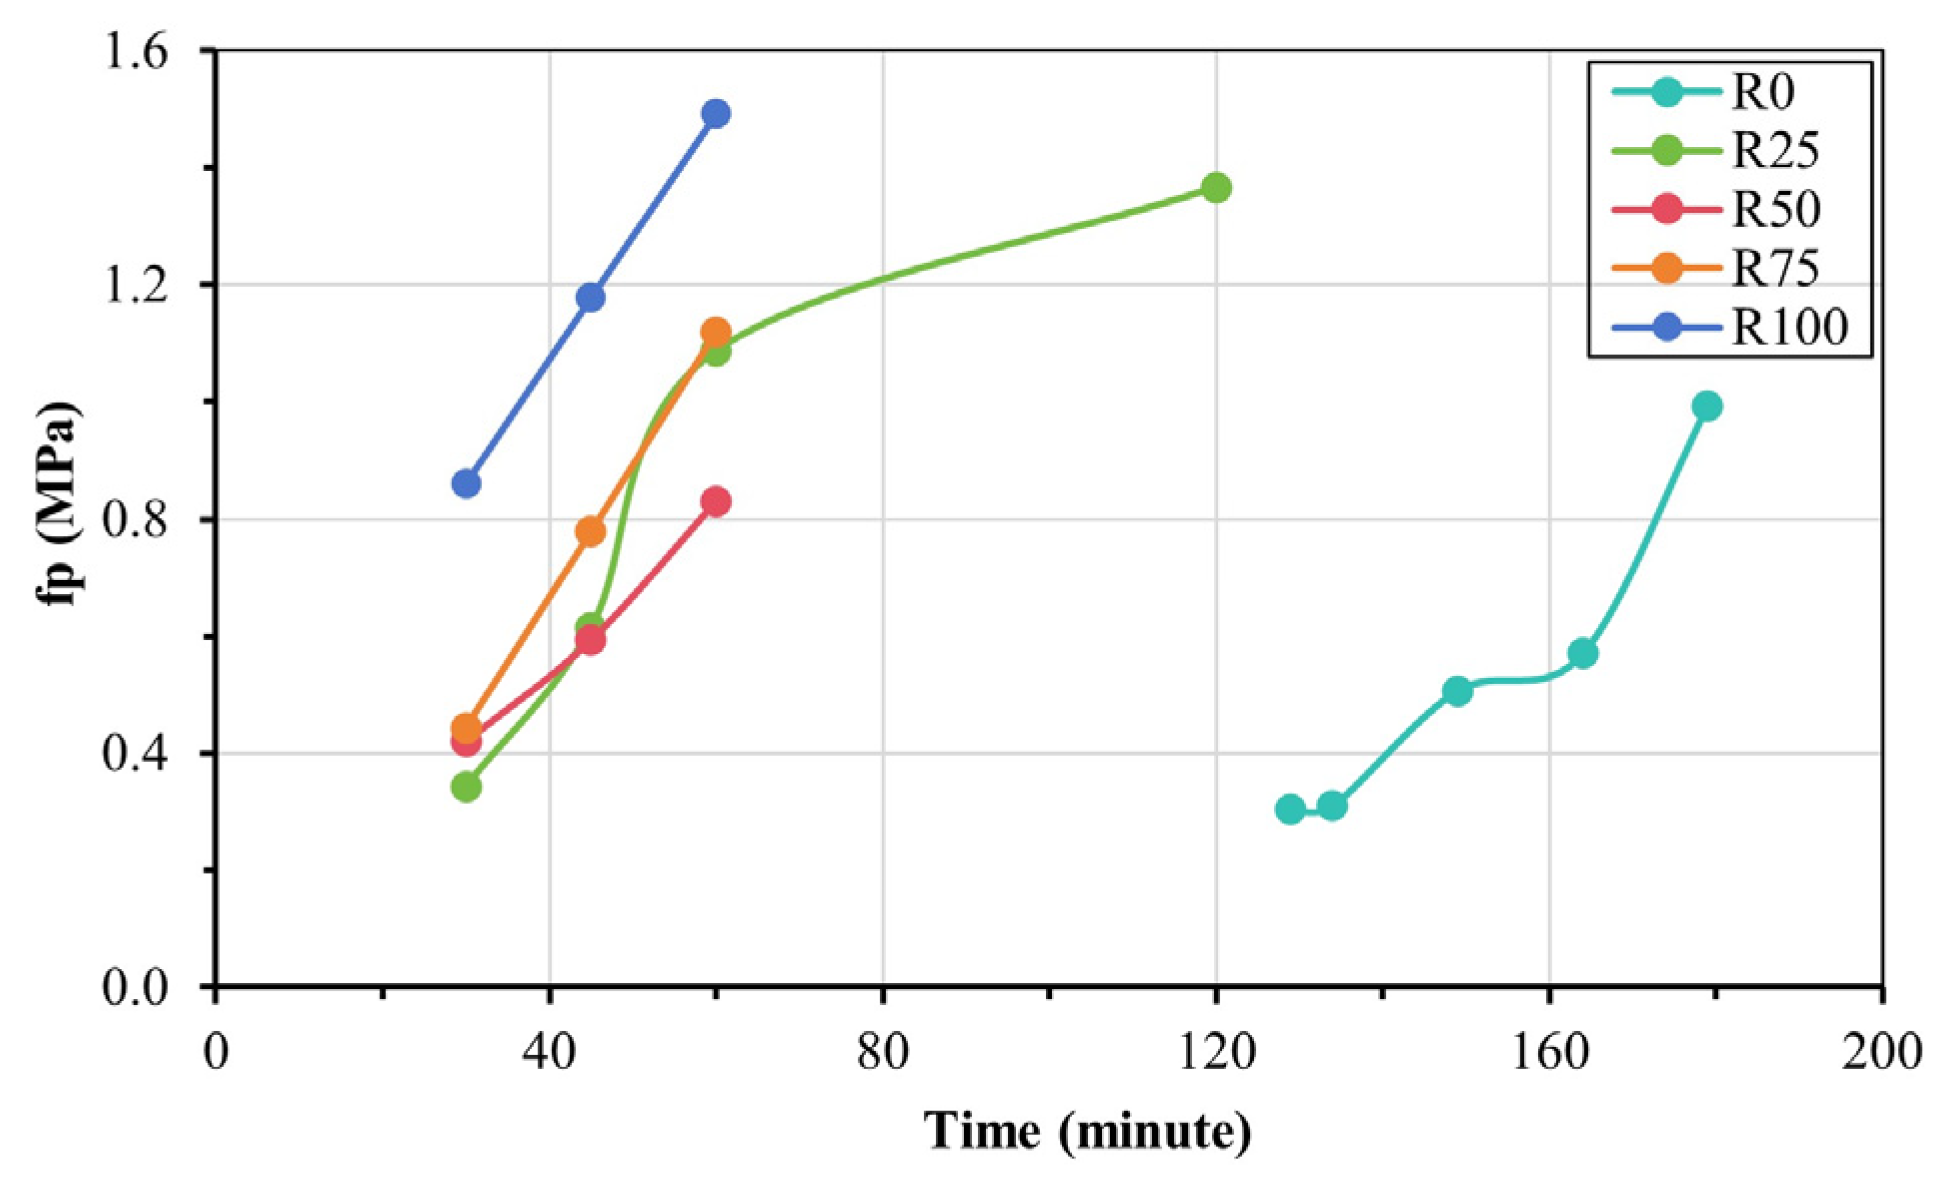
3.2. Setting Time of Fresh Mortar
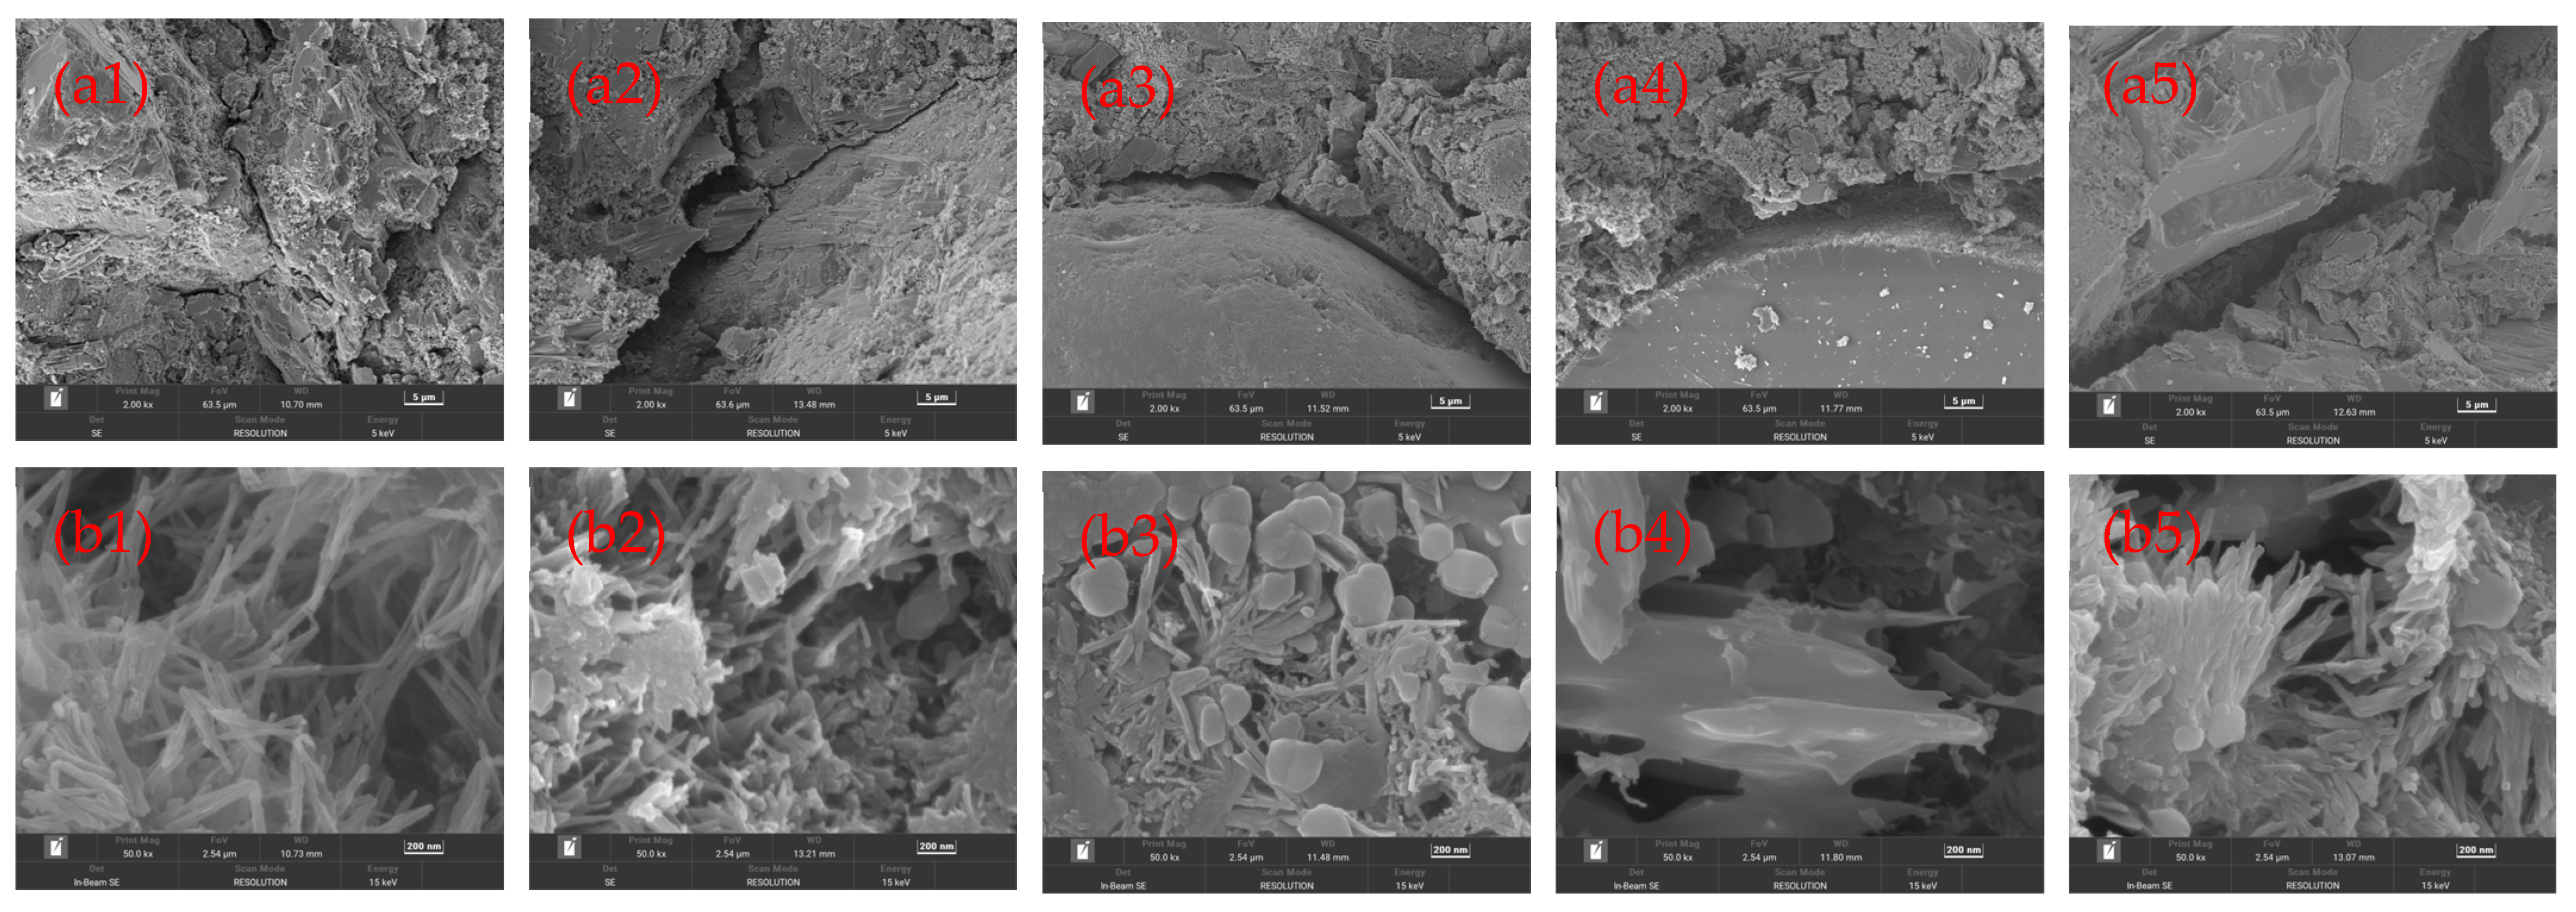
3.3. Microstructure Analysis of Mortar Samples
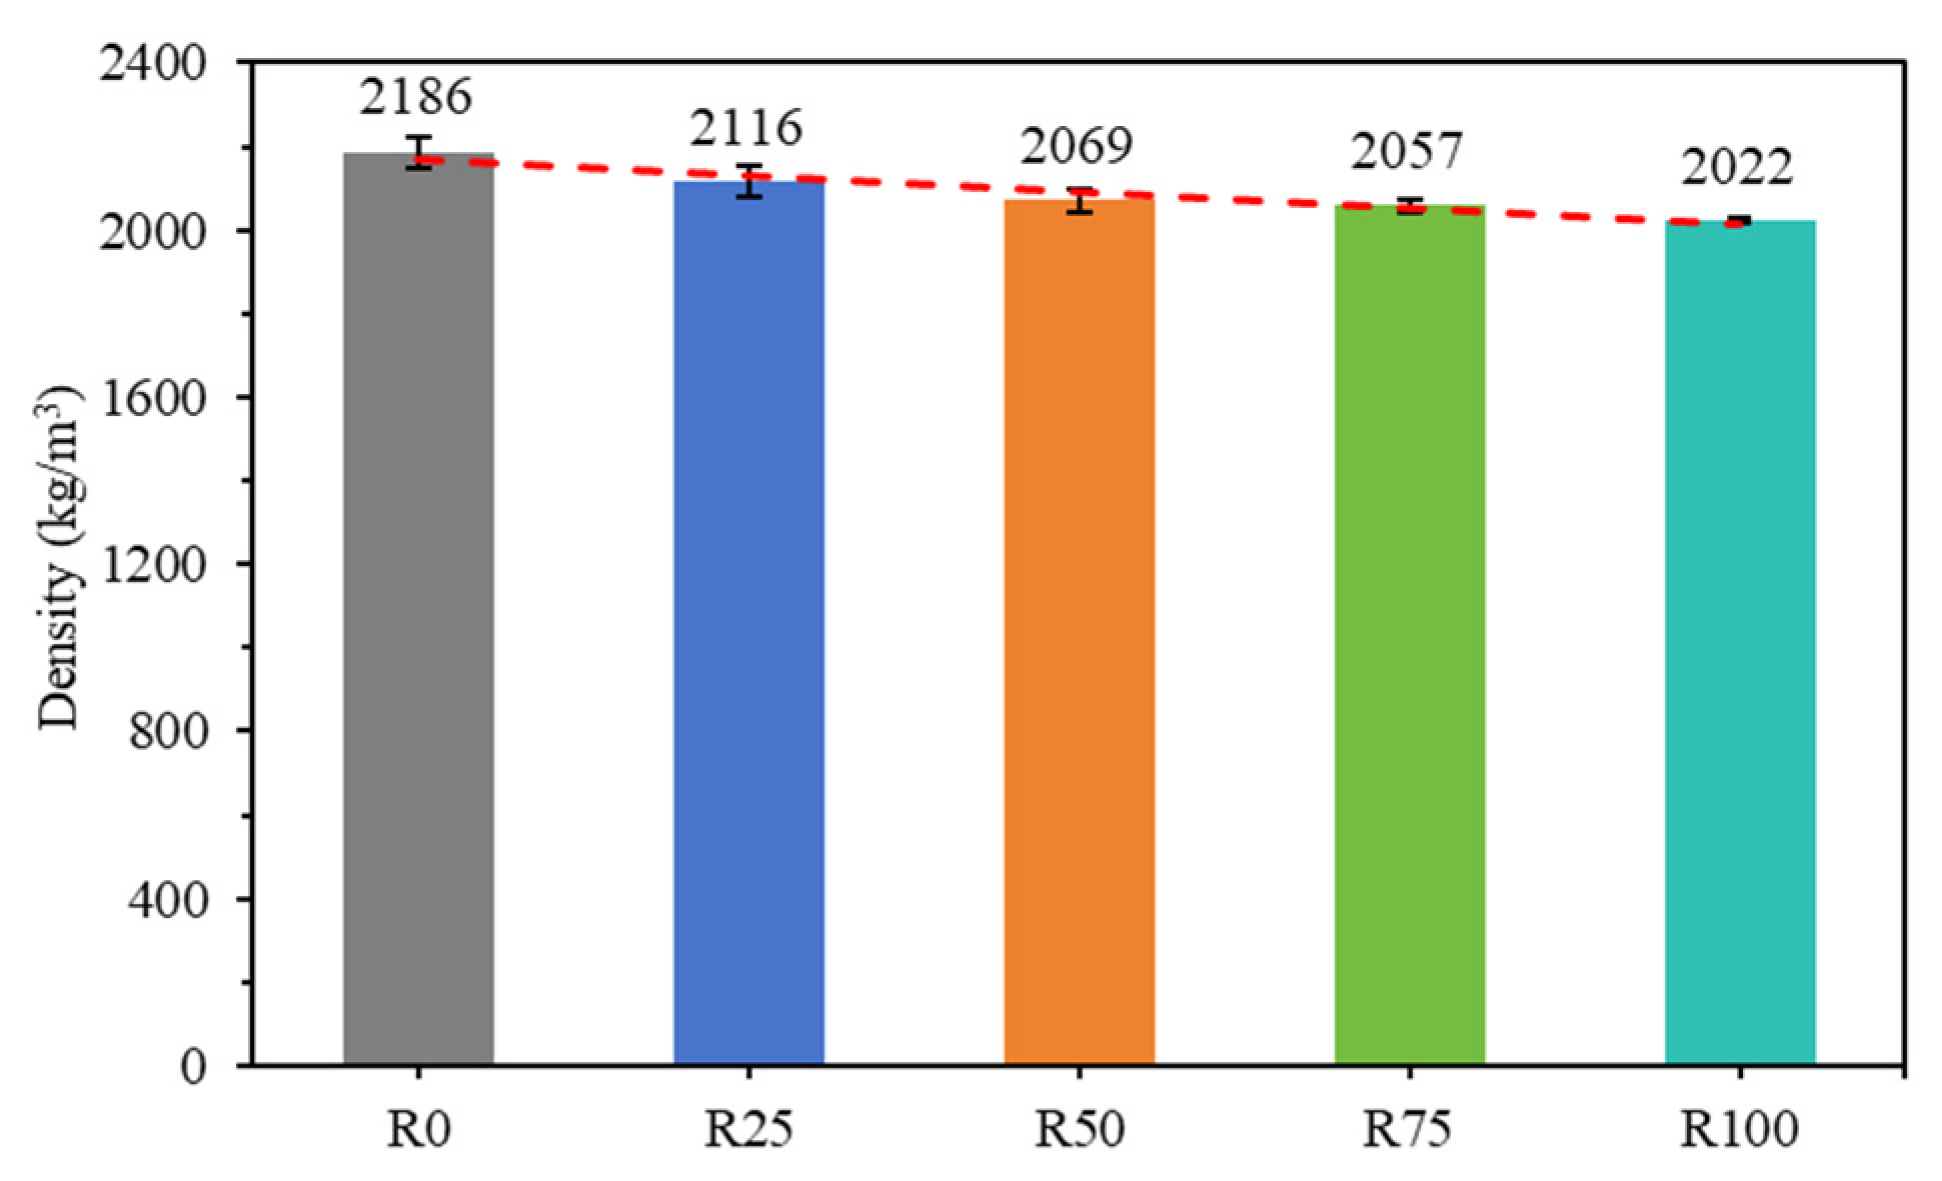
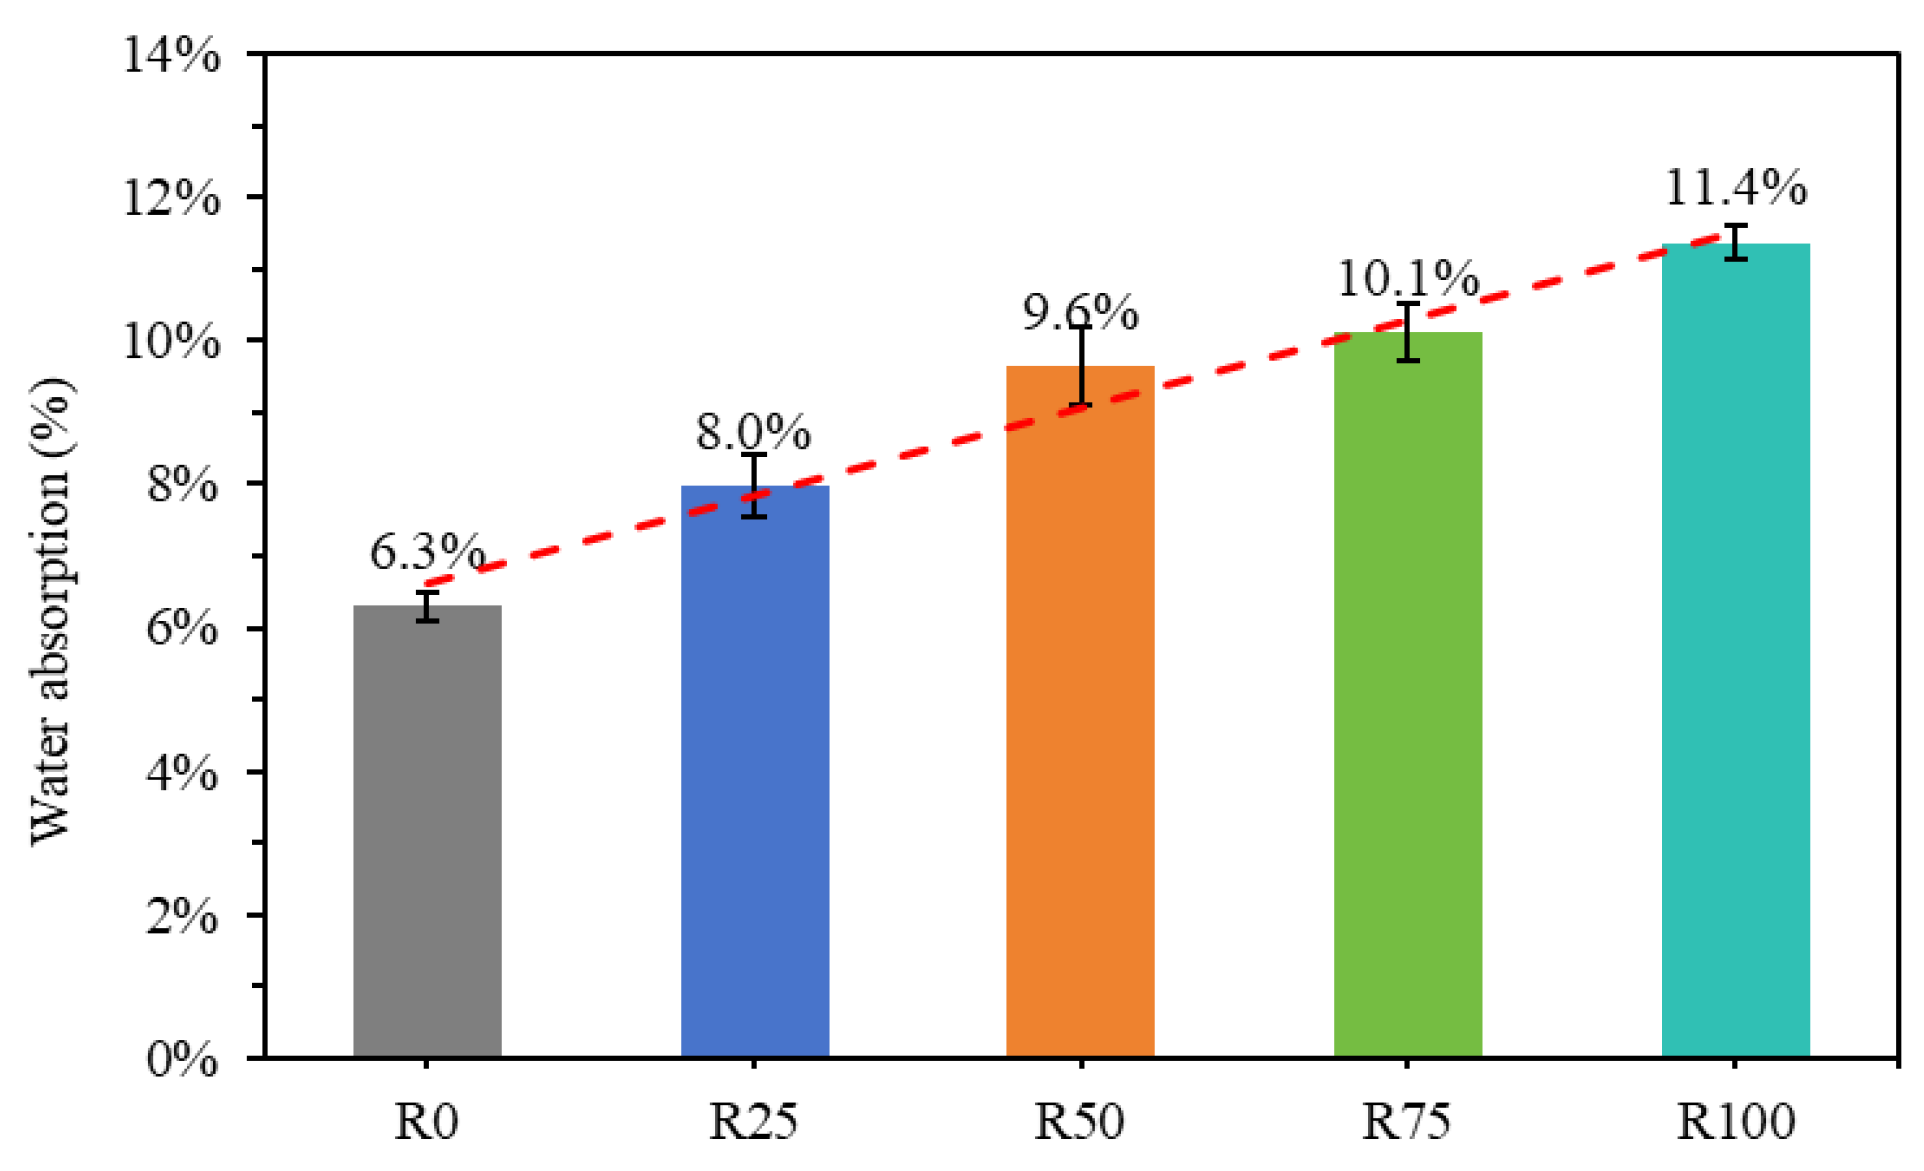
3.4. Density and Water Absorption of Mortar
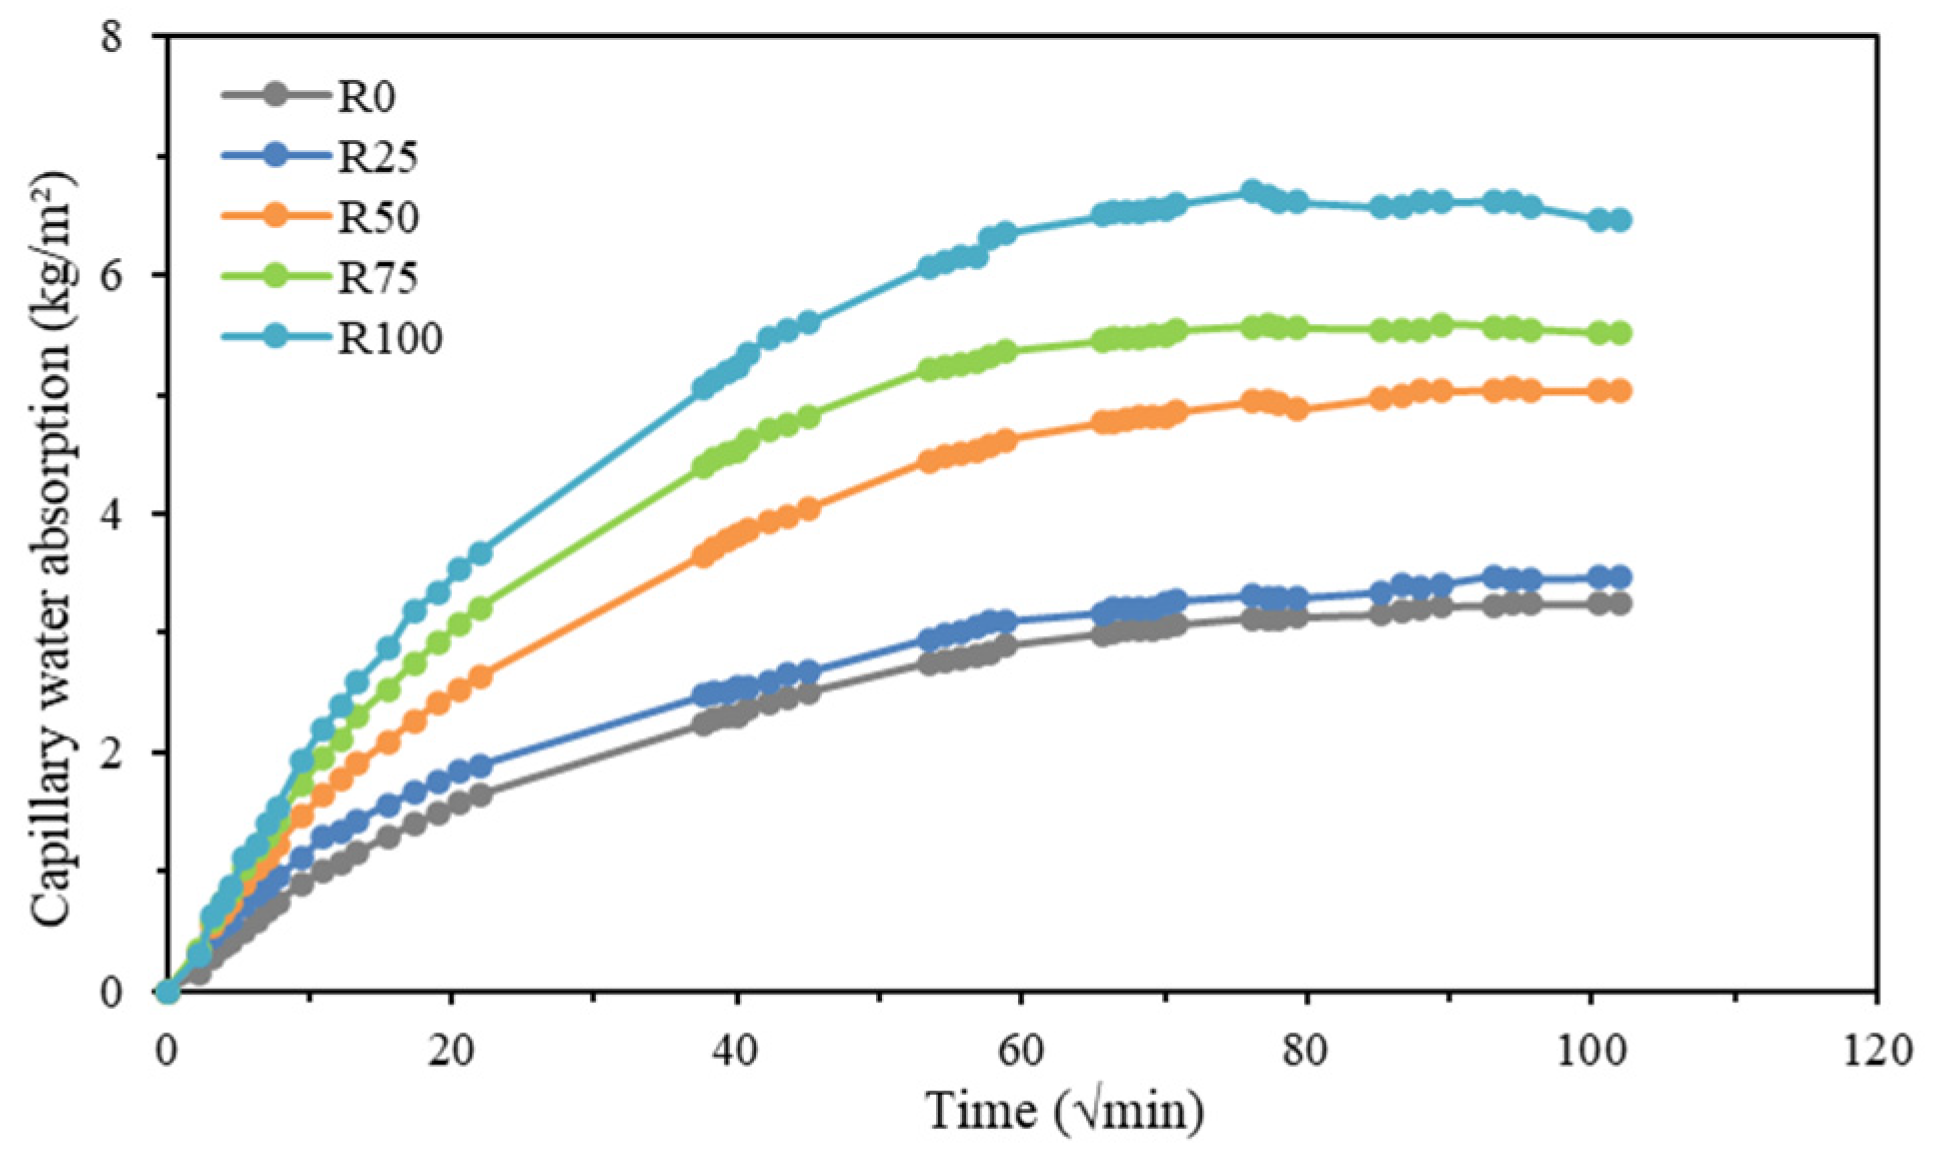
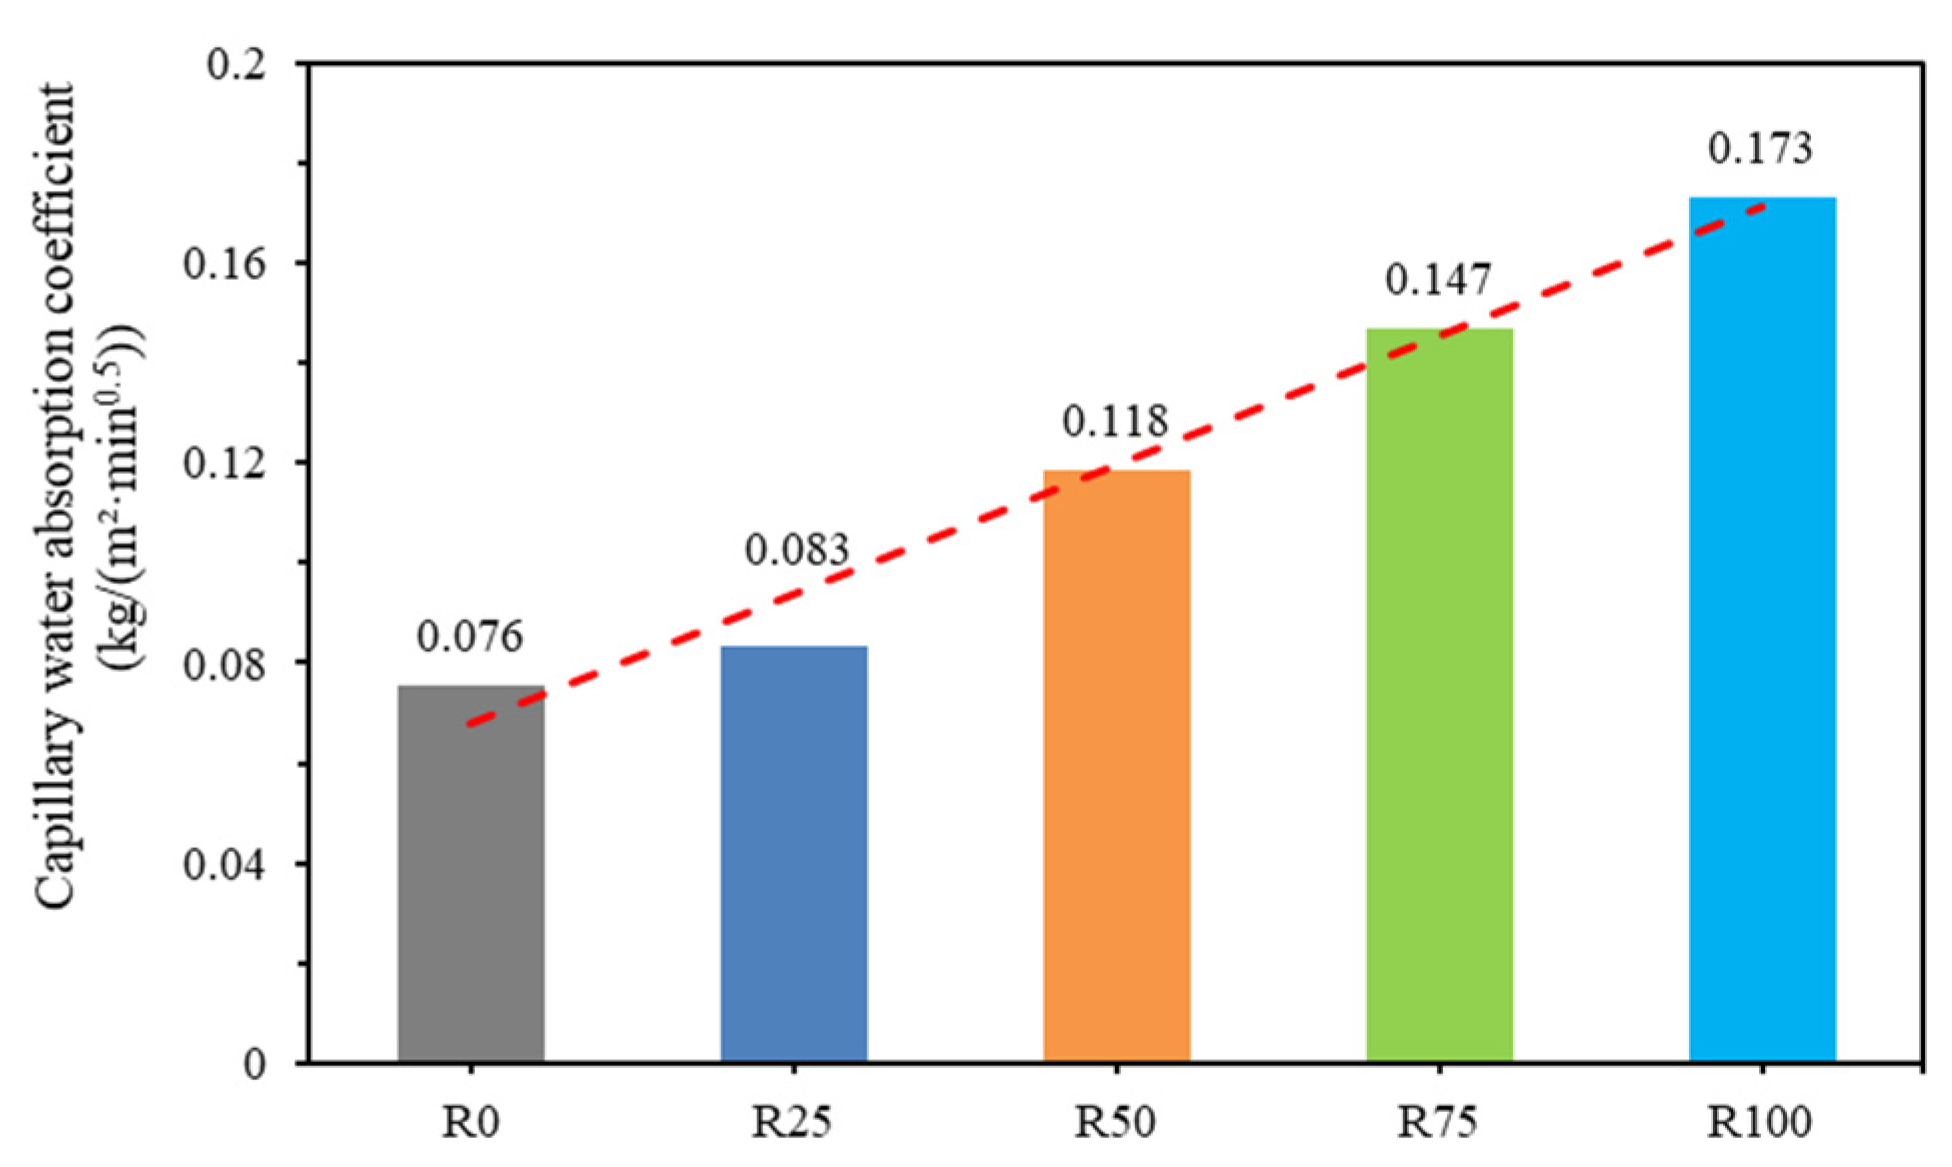
3.5. Capillary Water Absorption of Mortar
3.6. Compressive Strength of Mortar
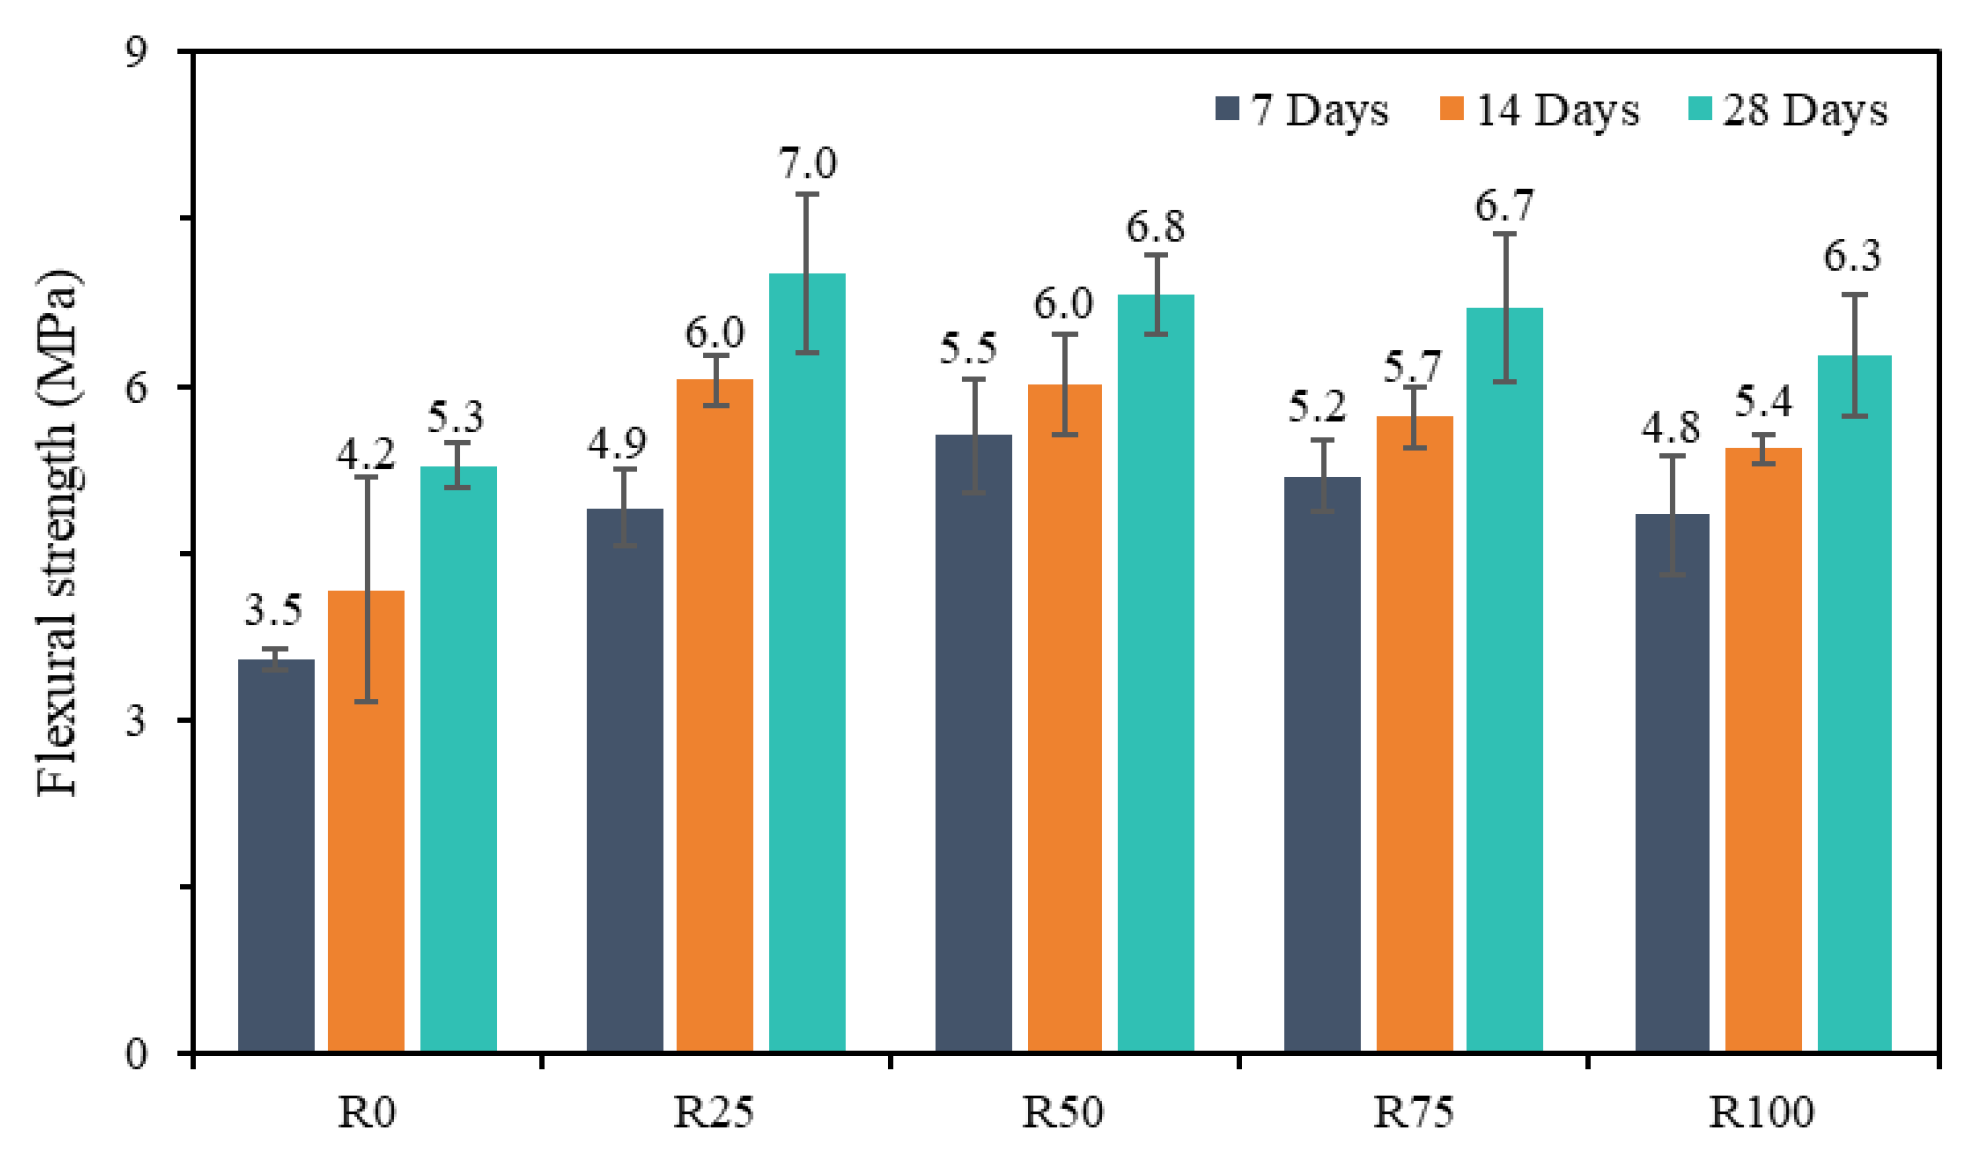
3.7. Flexural Strength of Mortar
4. Conclusions
Author Contributions
Funding
Institutional Review Board Statement
Informed Consent Statement
Data Availability Statement
Conflicts of Interest
References
- Rentier, E.S.; Cammeraat, L.H. The environmental impacts of river sand mining. Sci. Total Environ. 2022, 838, 155877. [Google Scholar] [CrossRef] [PubMed]
- Wang, H.; Wang, P.; Zhang, X.; Chen, W.Q.; Tzachor , A.; Fishman , T.; Schandl, H. Substantial increase in China’s manufactured sand supply since 2010. Nat. Geosci. 2024, 17, 833–836. [Google Scholar] [CrossRef]
- Bendixen, M.; Best, J.; Hackney, C.; Iversen, L.L. Time is running out for sand. Nature 2019, 571, 29–31. [Google Scholar] [CrossRef] [PubMed]
- Torres, A.; Brandt, J.; Lear, K.; Liu, J. A looming tragedy of the sand commons. Science 2017, 357, 970–971. [Google Scholar] [CrossRef] [PubMed]
- Zhong, X.; Sebastiaan, D.; Arnold, T.; Paul, B. Increasing material efficiencies of buildings to address the global sand crisis. Nat. Sustain. 2022, 5, 389–392. [Google Scholar] [CrossRef]
- Huang, B.; Wang, X.; Kua, H.; Geng, Y.; Bleischwitz, R.; Ren, J. Construction and demolition waste management in China through the 3R principle. Resour. Conserv. Recycl. 2018, 129, 36–44. [Google Scholar] [CrossRef]
- Seror, N.; Portnov, B.A. Identifying areas under potential risk of illegal construction and demolition waste dumping using GIS tools. Waste Manag. 2018, 75, 22–29. [Google Scholar] [CrossRef]
- Jia, Z.; Aguiar, J.; Sandra, C.; de Carlos, J. Green Thermal Aggregates: Influence of the Physical Properties of Recycled Aggregates with Phase Change Materials. Materials 2023, 16, 6267. [Google Scholar] [CrossRef]
- Jia, Z.; Sandra, C.; Aguiar, J.; Guo, P. The Effect of Phase Change Materials on the Physical and Mechanical Properties of Concrete Made with Recycled Aggregate. Buildings 2023, 13, 2601. [Google Scholar] [CrossRef]
- Martínez, P.S.; Cortina, M.G.; Martínez, F.F.; Sanchez, A.R. Comparative study of three types of fine recycled aggregates from construction and demolition waste (CDW), and their use in masonry mortar fabrication. J. Clean. Prod. 2016, 118, 162–169. [Google Scholar] [CrossRef]
- Ji, T.; Chen, C.Y.; Zhuang, Y.Z.; Chen, J.F. A mix proportion design method of manufactured sand concrete based on minimum paste theory. Constr. Build. Mater. 2013, 44, 422–426. [Google Scholar] [CrossRef]
- Nehal, E.; Abobakr, A.; Eslam, M.A.G.A. Construction and Demolition Waste Management Research: A Science Mapping Analysis. Int. J. Environ. Res. Public Health 2022, 19, e4496. [Google Scholar] [CrossRef]
- Hua, L.; José, A.; Xiaoqi, W.; Yinggu, W.; Sandra, C.; Jia, Z. Application of Aggregates from Construction and Demolition Wastes in Concrete: Review. Sustainability 2024, 16, e4277. [Google Scholar] [CrossRef]
- Aslam, M.S.; Huang, B.; Cui, L. Review of construction and demolition waste management in China and USA. J. Environ. Manag. 2020, 264, e110445. [Google Scholar] [CrossRef]
- Fernanda, A.S.; Flavio’, A.S. Recycled aggregates from construction and demolition waste towards an application on structural concrete: A review. J. Build. Eng. 2022, 52, e104452. [Google Scholar] [CrossRef]
- Estanqueiro, B.; Silvestre, J.D.; Brito, J.; Pinheiro, M.D. Environmental life cycle assessment of coarse natural and recycled aggregates for concrete. Eur. J. Environ. Civ. Eng. 2016, 22, 429–449. [Google Scholar] [CrossRef]
- Bogas, J.A. Freeze-thaw resistance of concrete produced with fine recycled concrete aggregates. J. Clean. Profuction 2016, 115, 294–306. [Google Scholar] [CrossRef]
- Shah, M.M.; Khalid, U.; Mujtaba, H.; Naqvi, S.A.Z.; Masood, S. Environmental impacts and performance assessment of recycled fne aggregate concrete. Environ. Sci. Pollut. Res. 2024, 31, 36938–36957. [Google Scholar] [CrossRef]
- Erhan, G. Rheological and fresh properties of self-compacting concretes containing coarse and fine recycled concrete aggregates. Constr. Build. Mater. 2016, 113, 622–630. [Google Scholar] [CrossRef]
- Cartuxo, F.; Britoa, J.; Evangelistab, L.; Jiménez, J.R.; Ledesma, E.F. Rheological behaviour of concrete made with fine recycled concreteaggregates-Influence of the superplasticizer. Constr. Build. Mater. 2015, 89, 36–47. [Google Scholar] [CrossRef]
- Ho, H.L.; Huang, R.; Lin, W.T.; Cheng, A. Pore-structures and durability of concrete containing pre-coated fine recycled mixed aggregates using pozzolan and polyvinyl alcohol Materials. Constr. Build. Mater. 2018, 160, 278–292. [Google Scholar] [CrossRef]
- Singh, A.; Xinzhao, M.; Xin, Z.; Qi, D.; Jiannan, L.; Shuai, Z.; Zhenhua, D. Use of recycled fine aggregates and recycled powders in sustainable recycled concrete. J. Build. Eng. 2023, 77, e107370. [Google Scholar] [CrossRef]
- Sindhurashmi, B.M.; Nayak, G.; Adesh, N.D.; Dubey, S.P.; Rao, V. Mock-up pragmatic study on the impact performance of selfcompacting concrete incorporating sea sand. Sci. Rep. 2024, 14, e24744. [Google Scholar] [CrossRef]
- Ahmed, Z.B. Plastic shrinkage and cracking risk of recycled aggregates concrete. Constr. Build. Mater. 2016, 121, 733–745. [Google Scholar] [CrossRef]
- Marija, N.; Jeanette, V.; Branko, S.; Siska, V.; Erik, S. Use of fine recycled concrete aggregates in concrete: A critical review. J. Build. Eng. 2021, 38, e102196. [Google Scholar] [CrossRef]
- Ahmed, A.; Ahmad, S.; Musa, A.E.S.; Mohammed, A.A. Properties of concrete incorporating recycled coarse aggregates and recycled plastic fne aggregates. Innov. Infrastruct. Solut. 2024, 9, e165. [Google Scholar] [CrossRef]
- Cai, Y.; Liu, M.; Li, M.; Mao, J.; Wu, Z.; Cheng, Z.; Shi, R.; Du, S.; Ren, J. Study on the properties and eco-sustainability of early-age carbonation cured cement paste with recycled concrete slurry waste substitution. Case Stud. Constr.-Uction. Mater. 2024, 21, e03862. [Google Scholar] [CrossRef]
- Vaishnav, S.K.; Trivedi, M.K. Performance assessment of sustainable mortar mixes using recycled fne aggregate obtained from diferent processing Techniques. Environ. Dev. Sustain. 2024, 26, 14449–14476. [Google Scholar] [CrossRef]
- Paswan, R.; Das, S. Meso-structural degradation and mechanical property evolution in cementitious mortars containing microencapsulated phase change materials under extended freeze-thaw cycles. Constr. Build. Mater. 2024, 457, 139405. [Google Scholar] [CrossRef]
- Aboutaleb, D.; Safi, B.; Chahour, K.; Belaid, A. Use of refractory bricks as sand replacement in self-compacting mortar. Cogent Eng. 2017, 4, e1360235. [Google Scholar] [CrossRef]
- Minjae, S.; Gyuyong, K.; Sangkyu, L.; Hongseop, K.; Hamin, E.; Yaechan, L.; Sasui, S.; Jeongsoo, N. Investigation of Conditions for Using Mass-Produced Waste Glass as Sustainable Fine Aggregate for Mortar. Int. J. Concr. Struct. Mater. 2024, 18, 55. [Google Scholar] [CrossRef]
- Vanderschelden, B.; Ruben, V.B.; Nathan, V.D.B.; Veerle, C.; Tim, D.K. The impact of lime as a replacement of cementbased mortar, on the water absorption and rain penetration of masonry. MATEC Web Conf. 2024, 403, 05012. [Google Scholar] [CrossRef]
- Zhu, Y.; Yanmin, J.; Jinyu, S.; Xiaobo, Z.; Yaojie, H.; Xuhua, H. Study on the Properties of High Fly Ash Content Alkali-Activated Fly Ash Slag Pastes and Fiber-Reinforced Mortar Under Normal Temperature Curing. Materials 2024, 17, e5668. [Google Scholar] [CrossRef]
- Jia, J.Y.; Sheh, C.K.; Kong, F.T.; Gimbun, J.; Siew, C.C. Spent cofee grounds enhanced compressive strength of cement mortar: An optimization study. Discov. Appl. Sci. 2024, 6, 379. [Google Scholar] [CrossRef]
- Rosa, L.P.; Santos, D.H.; Zaccaron, A.; Ribeiro, J.M.; Klegues, O.R.; Montedo; Arcaro, S.; Raupp-Pereira, F. Rheological behavior of nepheline syenite beneficiation waste-based mortars. J. Build. Eng. 2024, 98, e111403. [Google Scholar] [CrossRef]
- GB/T 25176-2010; Recycled Fine Aggregate for Concrete and Mortar. Ministry of Housing and Urban-Rural Development: Beijing, China, 2010.
- GB/T 14684-2022; Sand for Construction. State Administration for Market Regulation and Standardization Administration of China: Beijing, China, 2022.
- GB/T 17671-2021; Test Method of Cement Mortar Strength, Cement-Test Methods-Determination of Strength. State Administration for Market Regulation and Standardization Administration of China: Beijing, China, 2009.
- JGJ/T 70-2009; Standard for Test Method of Basic Properties of Construction Mortar. Ministry of Housing and Urban-Rural Development, People’s Republic of China: Beijing, China, 2009.
- Paul, S.C.; Basit, M.A.; Hasan, N.M.S.; Islam, M.S. Sustainable cement mortar production using rice husk and eggshell powder: A study of strength, electrical resistivity, and microstructure. Smart Constr. Sustain. Cities 2024, 2, 13. [Google Scholar] [CrossRef]
- EN 1015-18:2002; Methods of Test Formortar for Masonry—Part 18: Determination of Waterabsorption Coefficient Due to Capillary Action of Hardened Mortar. European Committee for Standardization: London, UK, 2002.
- JC/T 724-2005; Electrically Driven Flexure Testing Device for Strength of Cement Mortar. National Development and Reform Commission: Beijing, China, 2005.
- Majhi, R.K.; Nayak, A.N.; Mukharjee, B.B. Development of sustainable concrete using recycled coarse aggregate and ground granulated blast furnace slag. Constr. Build. Mater. 2018, 159, 417–430. [Google Scholar] [CrossRef]
- Behera, M.; Bhattacharyya, S.K.; Minocha, A.K.; Deoliya, R.; Maiti, S. Recycled aggregate from C&D waste & its use in concrete-A breakthrough towards sustainability in construction sector: A review. Constr. Build. Mater. 2014, 68, 501–516. [Google Scholar] [CrossRef]
- Haider, M.M.; Guoqing, J.; Hui, L.; Miller, Q.R.S.; Wolcott, M.; Fernandez, C.; Nassiri, S. Impact of chitin nanofibers and nanocrystals from waste shrimp shells on mechanical properties, setting time, and late-age hydration of mortar. Sci. Rep. 2022, 12, e20539. [Google Scholar] [CrossRef]
- Romero, L.M.B.; Bahrami, A.; Awoyera, P.O.; Fadire, O.; Velarde, A.Y.V.; Mydin, M.A.O.; Krishna, P.A. Exploring efects of supplementary cementitious materials on setting time, strength, and microscale properties of mortar. Discov. Appl. Sci. 2024, 6, e629. [Google Scholar] [CrossRef]
- Yicheng, W. Experimental study on mechanical properties and durability of recycled fine aggregate concrete. NingXia Univ. 2023, 1–76. [Google Scholar] [CrossRef]
- Bhardwaj, B.; Kumar, P. Waste foundry sand in concrete: A review. Constr. Build. Mater. 2017, 156, 661–674. [Google Scholar] [CrossRef]
- Zhong, L.; Yadong, B.; Jihui, Z.; Yiren, W.; Xuan, Q.; Qiang, L. Sustainable building materials-recycled aggregate and concrete: A systematic review of properties, modifcation techniques, and environmental impacts. Environ. Sci. Pollut. Res. 2024, 31, 20814–20852. [Google Scholar] [CrossRef]
- Allujami, H.M.; Abdulkareem, M.; Jassam, T.M.; Ramez, A.A.; Ibrahim, A.; Jing, L.N.; Hok, C.Y. Mechanical properties of concrete containing recycle concrete aggregates and multi-walled carbon nanotubes under static and dynamic stresses. Case Stud. Constr. Mater. 2022, 17, e01651. [Google Scholar] [CrossRef]
- Antunes, A.; Costa, H.; Carmo, R.; Júlio, E. Mortars produced with recycled aggregates from construction and demolition waste–Analysis and construction site application. Constr. Build. Mater. 2024, 457, e139395. [Google Scholar] [CrossRef]
- Hatefi, M.H.; Arabani, M.; Payan, M.; Ranjbar, P.Z.; Keawsawasvong, S.; Jamsawang, P. The role of particle shape in the mechanical behavior of granular soils: A state-of-the-art review. Results Eng. 2024, 24, e103572. [Google Scholar] [CrossRef]
- Singh, R.; Nayak, D.; Pandey, A.; Kumar, R.; Kumar, V. Effects of recycled fine aggregates on properties of concrete containing natural or recycled coarse aggregates: A comparative study. J. Build. Eng. 2022, 45, e103442. [Google Scholar] [CrossRef]
- Jiang, L.; Ke, W.; Ming-Liang, Q. Experimental determination on the capillary water absorption coefficient of porous building materials: A comparison between the intermittent and continuous absorption tests. J. Build. Eng. 2020, 28, e101091. [Google Scholar] [CrossRef]
- Yue, W.; Liangshun, L.; Mingzhe, A.; Yifan, S.; Ziruo, Y.; Hanfeng, H. Factors Influencing the Capillary Water Absorption Characteristics of Concrete and Their Relationship to Pore Structure. Appl. Sci. 2022, 12, e2211. [Google Scholar] [CrossRef]
- Yuanyu, Z.; Ru, W. Application of the supplementary cementitious material and aggregates made from waste clay bricks in the preparation of plastering mortar. Constr. Build. Mater. 2024, 450, e138705. [Google Scholar] [CrossRef]
- Onuaguluchi, O.; Shen, W.; Ricky, R.; Nemkumar, B. Bond strength and fexural performance of repair composites incorporating nanofbrillated cellulose (NFC) modifed mortar. Mater. Struct. 2025, 58, 15. [Google Scholar] [CrossRef]
- Liew, Y.X.; Saad, S.A.; Anand, N.; Tee, K.F.; Chin, S.C. Evaluating the impact of reducing POFA’s particle fneness on its pozzolanic reactivity and mortar strength. J. Mater. Sci. Mater. Eng. 2024, 19, 23. [Google Scholar] [CrossRef]
- Jianzhuang, X.; Qi, D.; Zhenhua, D.; Shaodan, H.; Jielin, T. Reclaimed Fine Aggregate Carbonation Modification and Its Effect on Mortar Rheology. J. Basic Sci. Eng. 2024, 32, 1486–1495. [Google Scholar] [CrossRef]


| Aggregate | ρA (kg/m3) | ρs (kg/m3) | WA (%) | FM |
|---|---|---|---|---|
| NFA | 2614.7 | 2622.4 | 0.3 | 2.3 |
| RFA | 2300.5 | 2435.2 | 5.9 | 3.1 |
| Type | Cement (kg/m3) | Water (kg/m3) | NFA0-4.75 mm (kg/m3) | RFA0-4.75 (kg/m3) | Saturated Water (kg/m3) |
|---|---|---|---|---|---|
| R0 | 450 | 180 | 1350 | 0.00 | 3.92 |
| R25 | 450 | 180 | 1012.5 | 296.94 | 20.34 |
| R50 | 450 | 180 | 675 | 593.87 | 36.76 |
| R75 | 450 | 180 | 337.5 | 890.81 | 53.18 |
| R100 | 450 | 180 | 0 | 1187.75 | 69.60 |
Disclaimer/Publisher’s Note: The statements, opinions and data contained in all publications are solely those of the individual author(s) and contributor(s) and not of MDPI and/or the editor(s). MDPI and/or the editor(s) disclaim responsibility for any injury to people or property resulting from any ideas, methods, instructions or products referred to in the content. |
© 2025 by the authors. Licensee MDPI, Basel, Switzerland. This article is an open access article distributed under the terms and conditions of the Creative Commons Attribution (CC BY) license (https://creativecommons.org/licenses/by/4.0/).
Share and Cite
Wan, X.; Jia, Z.; Li, N.; Luo, H. Impact of Recycled Fine Aggregate on Physical and Mechanical Properties of Green Mortar. Materials 2025, 18, 696. https://doi.org/10.3390/ma18030696
Wan X, Jia Z, Li N, Luo H. Impact of Recycled Fine Aggregate on Physical and Mechanical Properties of Green Mortar. Materials. 2025; 18(3):696. https://doi.org/10.3390/ma18030696
Chicago/Turabian StyleWan, Xiaoqi, Zhiyou Jia, Nannan Li, and Hua Luo. 2025. "Impact of Recycled Fine Aggregate on Physical and Mechanical Properties of Green Mortar" Materials 18, no. 3: 696. https://doi.org/10.3390/ma18030696
APA StyleWan, X., Jia, Z., Li, N., & Luo, H. (2025). Impact of Recycled Fine Aggregate on Physical and Mechanical Properties of Green Mortar. Materials, 18(3), 696. https://doi.org/10.3390/ma18030696