Article

Boosting Electrooxidation of Ethanol by Nickel Addition to Metallic Glass Ribbon Precursors

1
School of Materials and Chemical Engineering, Bengbu University, Bengbu 233030, China
2
Songshan Lake Materials Laboratory, Dongguan 523808, China
3
Anhui Haoou Electronic Technology Co., Ltd., Bengbu 233010, China
4
School of Materials Science and Engineering, Hefei University of Technology, Hefei 230009, China
*
Author to whom correspondence should be addressed.
Materials 2025, 18(3), 701; https://doi.org/10.3390/ma18030701
Submission received: 2 December 2024 / Revised: 25 January 2025 / Accepted: 30 January 2025 / Published: 5 February 2025

Abstract

:
A CuNiCe-O nanocomposite was fabricated on the Cu40Ni20Al10Ce26Pt3Ru1 metallic glass (MG) ribbon surface by dealloying. The influences of Ni and dealloying time on the morphology and EOR performance were analyzed. The results suggest that the catalytic activity and stability of the dealloyed MG ribbon could be significantly enhanced owing to the alloying of Ni to the Cu60Al10Ce26Pt3Ru1 MG ribbon precursor. The activated D-Cu40Ni20Al10Ce26Pt3Ru1 ribbon obtained at an etching time of 3 h had a better electrochemical ethanol oxidation reaction (EOR) performance than other dealloyed samples due to the formation of abundant active sites and the presence of defects within the CuNiCe-O composite.

1. Introduction

A direct alcohol fuel cell (DAFC) is a low-temperature proton exchange membrane fuel cell that can directly use alcohol aqueous solution as a fuel [1]. Various organic small molecules can be selected as fuels, such as methanol, formic acid, formaldehyde, and ethanol. Among them, ethanol is the simplest chain alcohol, possessing low toxicity. It has a high theoretical energy density (8.1 kWh/kg), low permeability, and a wide range of sources, and can be mass-produced through simple crop fermentation, consistent with the requirements of green chemistry. Therefore, direct ethanol fuel cells (DEFCs) have broad application prospects and great potential to solve energy crises and environmental problems [2].
The research and development of catalysts with high efficiency, low cost, and long service life is very important for the practical application of DEFCs [3]. Electrochemical ethanol oxidation (EOR) plays a key role in electrochemical hydrogen production and DEFCs, both of which are crucial to utilizing renewable energy [2,4]. In general, noble metals such as Pt and Pd have outstanding EOR performances; however, their high cost, scarcity, and easy poisoning by intermediates (such as CO and CH3CHO) have always been the main factors restricting the wide application of noble metal-group catalysts [5,6]. Therefore, the design and development of non-noble metal substitutes with high performance and economy have been the focus of researchers [6]. Non-noble-metal-based catalysts, including metal oxides [7], carbides [8], sulfides [9], and nitrides [10], with diverse structures and abundant active sites, improve catalytic activities. Especially, Ni-based electrocatalysts display higher EOR performances [6,7,8]. In particular, Ni oxide [11], Ni hydroxide [12], Ni sulfide [13], Ni nitride [14], and Ni phosphide [15] were developed for the electrooxidation of ethanol. In recent years, the focus of research has been on understanding the reaction chemistry and mechanism, the determination of active sites, and the design of catalysts [16,17,18]. Various strategies, such as promotion with non-noble transition metals [19,20], promotion with noble metals [21,22,23], amorphization [24], and promotion with carbon materials [25], have been utilized to develop and improve the activities of Ni-based catalysts for efficient EOR. These strategies have enhanced the specific surface area, the number of active sites, synergetic effects, conductivity, and mass transfer, remarkably enhancing EOR performance [26].
Amorphous alloys also known as metallic glass (MG) have a uniform microstructure with long-range disorder up to the sub-nanometer scale. A great number of reports have shown that nanoporous materials obtained by dealloying metallic glass precursors have a more uniform structure and composition [27,28]. Furthermore, metal oxides fabricated by dealloying have better morphology and catalytic properties than those dealloyed from the corresponding crystalline alloys [29,30]. Ni can activate water and provide more OHads (H2O → OHads + H+ + e) for catalysis, which helps to completely oxidize intermediates and improve the catalysts’ resistance to poisoning [31]. At the same time, the existence of Cu is beneficial to the formation of β-NiOOH with a higher level of activity [32]. In this work, Ni was introduced into a Cu60Al10Ce26Pt3Ru1 MG ribbon, and a CuNiCe-O nanocomposite was constructed on the surface of the Cu40Ni20Al10Ce26Pt3Ru1 MG ribbon. The effects of Ni addition to the MG ribbon precursor and dealloying time on the morphology and EOR performance were studied. The results suggest that the dealloyedCu40Ni20Al10Ce26Pt3Ru1 ribbon had a better EOR performance than the dealloyed Cu60Al10Ce26Pt3Ru1 ribbon due to the synergy of Cu and Ni oxides and the formation of abundant active sites and defects within the dealloyed layer composites of the AD-Cu40Ni20Al10Ce26Pt3Ru1 ribbon.

2. Materials and Methods

2.1. Chemicals

Potassium hydroxide (KOH) and nitric acid (HNO3) were purchased from Sinopharm Chemical Reagent Co., Ltd., Shanghai, China. Deionized water was used for solution preparation. All chemical reagents were analytically pure and were used without further purification.

2.2. Preparation of MG Ribbons and Dealloyed Electrocatalysts

The preparation of Cu60Al10Ce26Pt3Ru1 and Cu40Ni20Al10Ce26Pt3Ru1 MG ribbons is outlined. First, it was necessary to calculate the mass of the required high-purity Ce, Al, and Cu metals (purity over 99.95, wt%) according to the atomic ratio of MG ribbons. Next, we weighed the metal to the nearest ± 0.0005 g. Subsequently, under the protection of argon, the Ti ingot was melted several times to remove residual air, and then the metals were melted 3–5 times into alloy ingots with uniform components. After that, we placed the alloy ingot into a high-purity quartz tube, heating it by electromagnetic induction. The molten alloy was then sprayed onto a copper roller, rotating at a high speed, and thrown out [33]. An MG ribbon was obtained with a width of about 1.5 mm and a thickness of about 20 μm.
The preparation of dealloyed samples proceeded as follows. Dealloying was performed at normal temperatures and pressures by putting the amorphous alloy ribbons in 0.05 M HNO3. Then, the dealloyed MG ribbon obtained was washed with water and alcohol more than 3 times and dried naturally (marked as D-MG ribbon), as shown in Figure 1. After that, the activation of the as-dealloyed products was carried out by the cyclic voltammetry (CV) scanning method through 100 scan cycles at 50 mV/s in the potential range from −0.8 to 1.0 V vs. Hg/HgO in a 1 M KOH aqueous solution. Then, the electrode material (AD-MG ribbon) was prepared.

2.3. Structure Characterization

XRD (Rigaku XR, Cu-Kα, Tokyo, Japan) was used to identify the phase structure. The voltage and current were 40 kV and 30 mA, respectively. Morphology and microstructure characterization were performed using field emission scanning electron microscopy (FE-SEM, Zeiss Auriga, Gemini 500, Oberkochen, Germany) and transmission electron microscopy (TEM, Japan-JEM-2100F, Tokyo, Japan). The valence states and binding energies of element catalysts were analyzed by an X-ray photon energy spectrometer (XPS, Thermo ESCALAB250Xi, Waltham, MA, USA) equipped with Al-Kα (hν = 1486.6 eV) radiation and calibrated internally by a carbon deposit C 1s binding energy of284.8 eV.

2.4. Electrochemical Test

Electrochemical measurements were performed using the Shanghai Chenhua Electrochemical Workstation (CHI 760E, Shang Hai, Shanghai, China). A classical three-electrode system was used, wherein the dealloyed MG ribbons were utilized as working electrodes, saturated Hg/HgO (1 M KOH) was used as the reference electrode, a Pt sheet (0.5 cm × 1.0 cm) was used as the counter electrode, and the electrolyte solution was 1.0 M KOH or 1.0 M KOH + 1.0 M ethanol (1.0 M KOH containing 1.0 M ethanol). The working electrode area was kept at (0.15 × 2) cm2, and the rest was sealed with acrylate adhesive. N2 was bubbled through the electrolyte for 20 min before electrochemical testing.
Before electrochemical testing, the dealloyed ribbons (D-MG ribbons) were activated in a 1.0 M KOH electrolyte. Then, the activated dealloyed MG ribbons (AD-MG ribbons) were then used directly in the electrocatalytic ethanol oxidation. CVs were conducted at scan rate of 30 mV/s. Chronoamperometric tests (CAs) were performed at 1.57 V (vs. RHE) for 10 h. The potentials were converted into that potential relative to the standard hydrogen electrode by using Formula (1):
E R H E = E H g H g O + 0.921
The current density was normalized using Equation (2).
j m A   c m 2 = i / S
where i is the current (mA) and S is the effective area of the working electrode immersed in the electrolyte.

3. Results

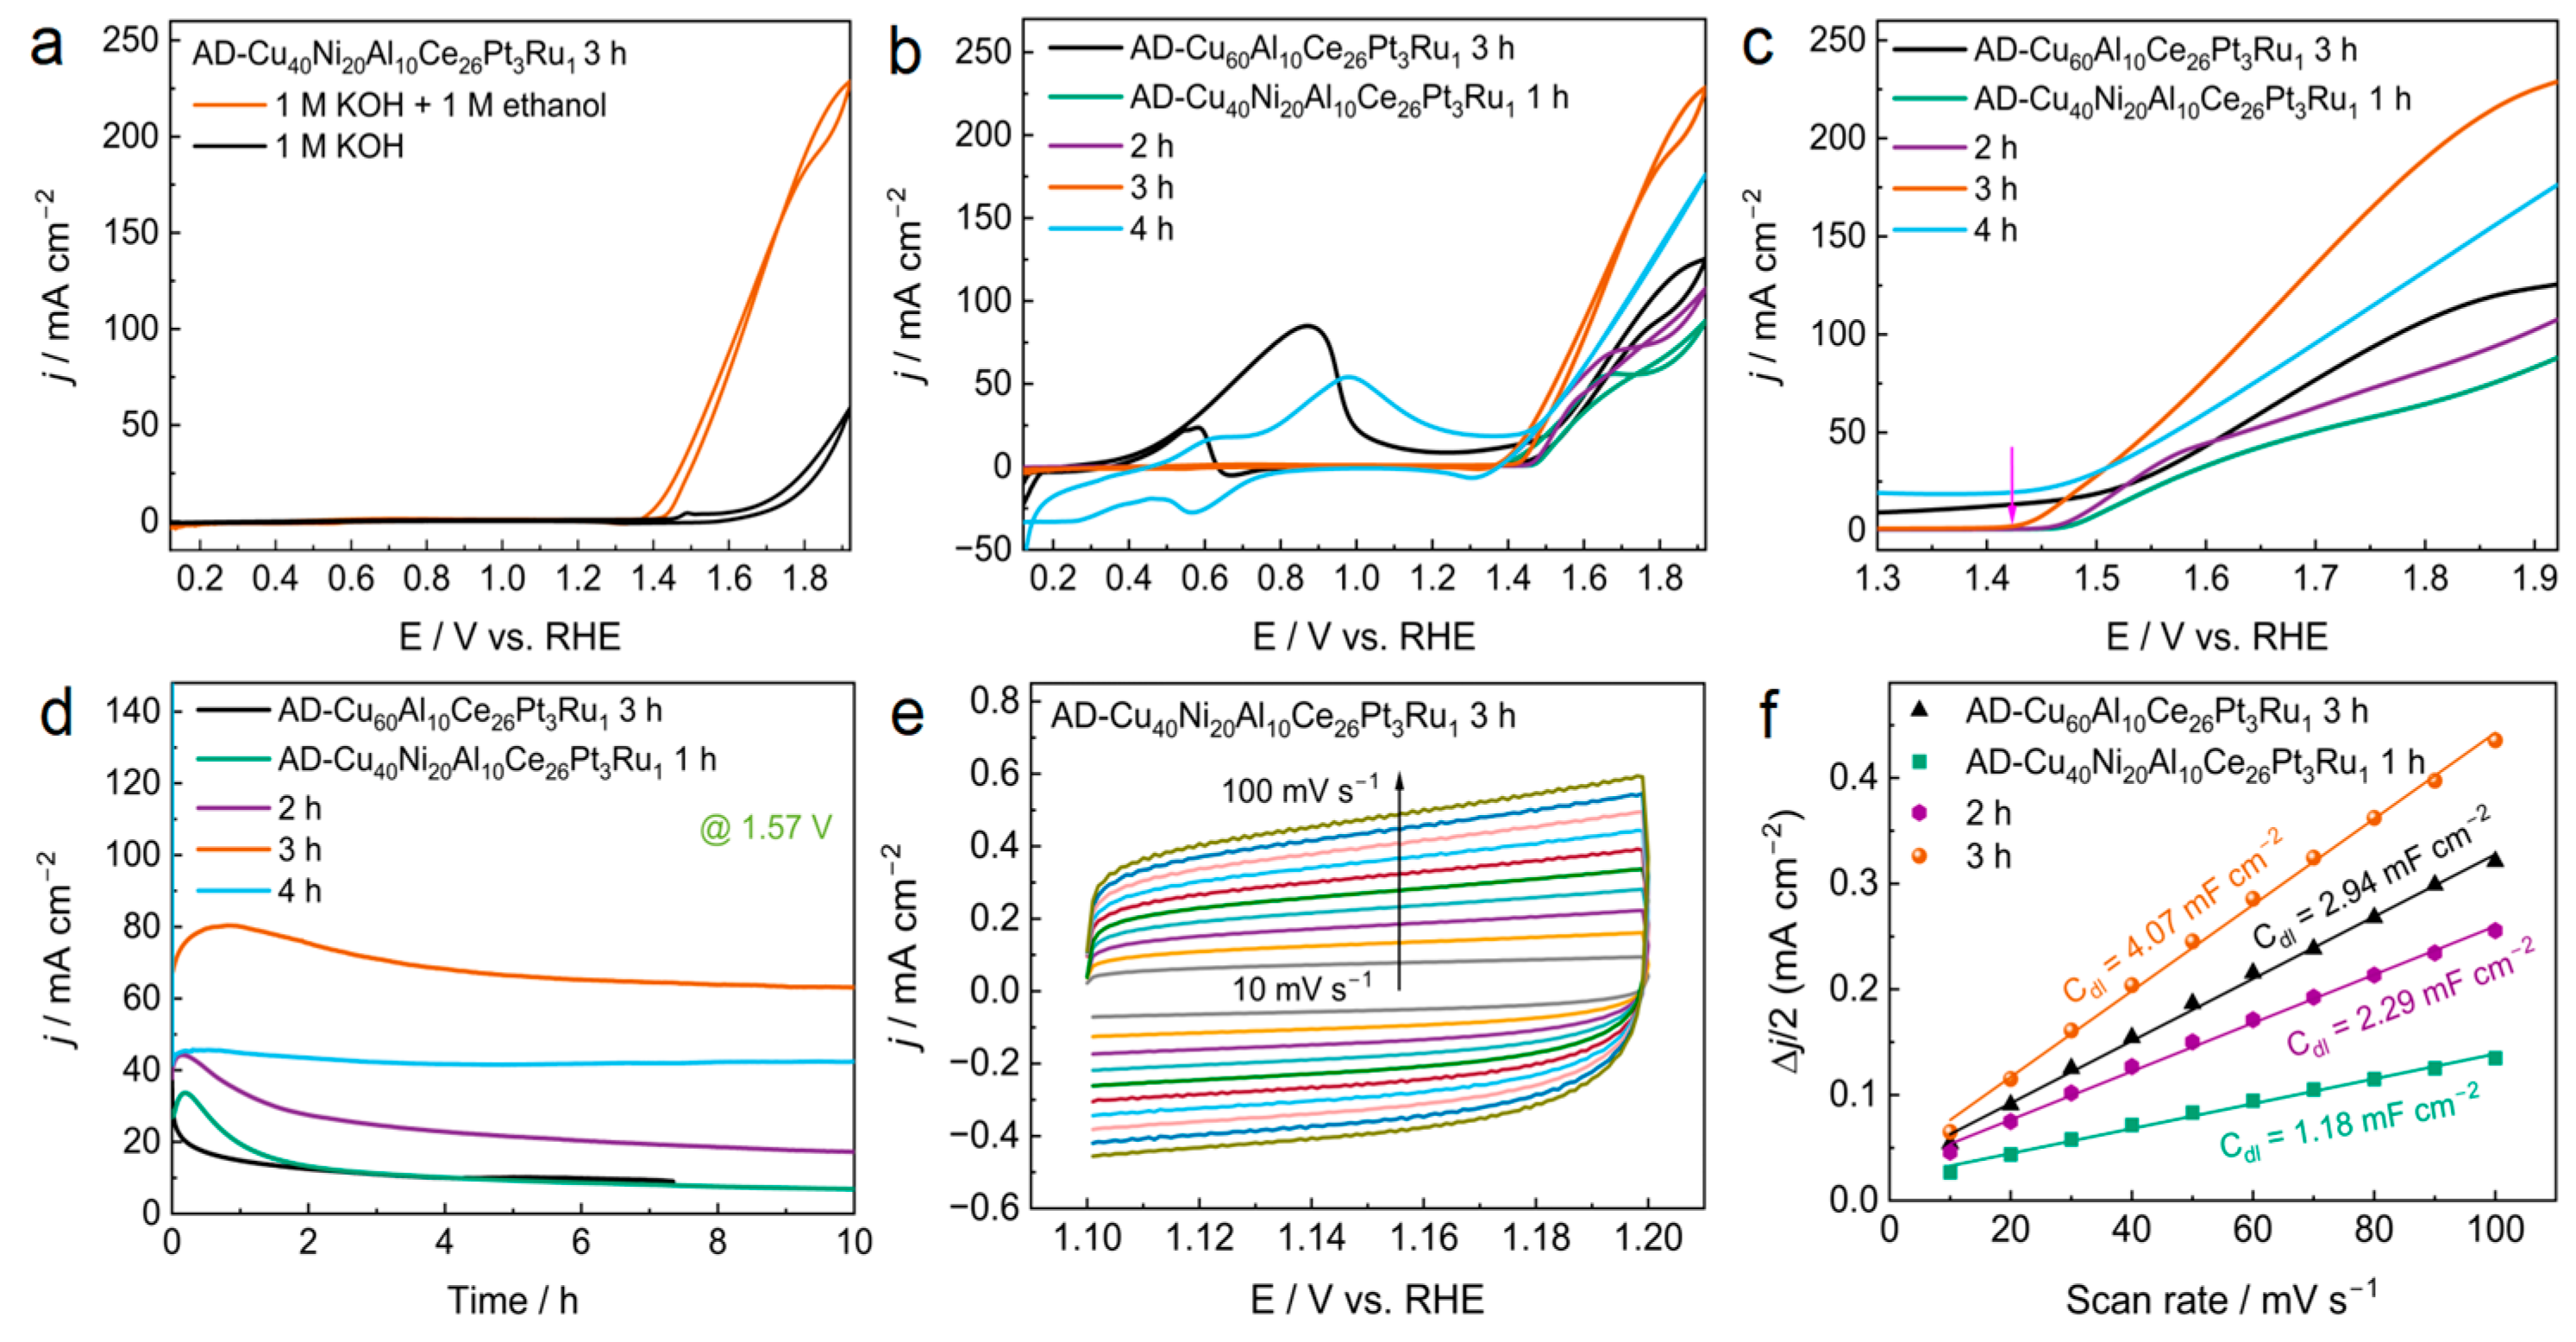
3.1. EOR Performance

EOR was conducted in an alkaline solution to assess the electrocatalytic performance of the catalysts. The EOR performance of the as-spun alloy ribbons was also investigated and the results obtained revealed that they exhibited negligible electrocatalytic activity toward EOR (Figure S1). Figure 2 shows the EOR performance of the dealloyed samples. As can be seen from Figure 2a, when ethanol was not added, there was a pair of redox peaks in the CV spectrum between 1.4 and 1.6 V, which was Ni2+↔Ni3+ redox. When ethanol was added, a strong oxidation peak appeared after 1.3 V, indicating that ethanol was oxidized [34]. Furthermore, as shown in Figure 2b, oxidation peaks appeared in the positive and negative scans in the range of 0.3~1.3 V in the CV spectrum of the AD-Cu60Al10Ce26Pt3Ru1-3 h MG ribbon. These are typical oxidation peaks of Pt-catalyzed ethanol oxidation. Strong oxidation peaks at 1.3~1.921 V are attributed to the ethanol oxidation by the surface products of the dealloyed MG ribbons. When the CV spectrum of the AD-Cu40Ni20Al10Ce26Pt3Ru1 MG ribbon was observed, only the oxidation peak of Pt to ethanol appeared in the CV spectrum of the AD-Cu40Ni20Al10Ce26Pt3Ru1-4 h ribbon, whereas the other three samples only showed oxidation peaks in the range of 1.3~1.921 V, indicating that Pt active sites were not formed on the surface of the AD-Cu40Ni20Al10Ce26Pt3Ru1-1 h, -2 h, or -3 h MG ribbons. Figure 2d shows that the AD-Cu60Al10Ce26Pt3Ru1-3 h ribbon without Ni is the most unstable for catalytic ethanol oxidation amongst those tested. Moreover, the Cdl of the AD-Cu40Ni20Al10Ce26Pt3Ru1-3 h ribbon was 4.07 mF cm−2, which was higher than that of the AD-Cu60Al10Ce26Pt3Ru1-3 h ribbon (Cdl = 2.94 mF cm−2), demonstrating the larger electrochemical active surface area of the CuNiCe-O nanoparticle constructed on the AD-Cu40Ni20Al10Ce26Pt3Ru1-3 h ribbon surface (Figure 2e,f). Therefore, this suggests that the catalytic activity and stability of the activated dealloyed MG ribbons can be enhanced when Ni is introduced into the MG ribbon precursors. The stability of the AD-Cu40Ni20Al10Ce26Pt3Ru1 ribbon was the highest, and the current density decreased by only 5% after the CA test for 10 h. Nevertheless, the current density increased at the beginning of the CA curve, probably because the activated sample was used in 1 M KOH, although CV activation tended to stabilize; however, in the CA test, due to the test being performed at the high potential of 1.57 V (vs. RHE), the surface of the sample continued to react, and the current density reached the maximum valid and then began to decrease. Figure 2c and Table 1 show that the AD-Cu40Ni20Al10Ce26Pt3Ru1-3 h ribbon has the lowest onset potential (1.437 V), indicating that its catalytic efficiency is the highest [35].

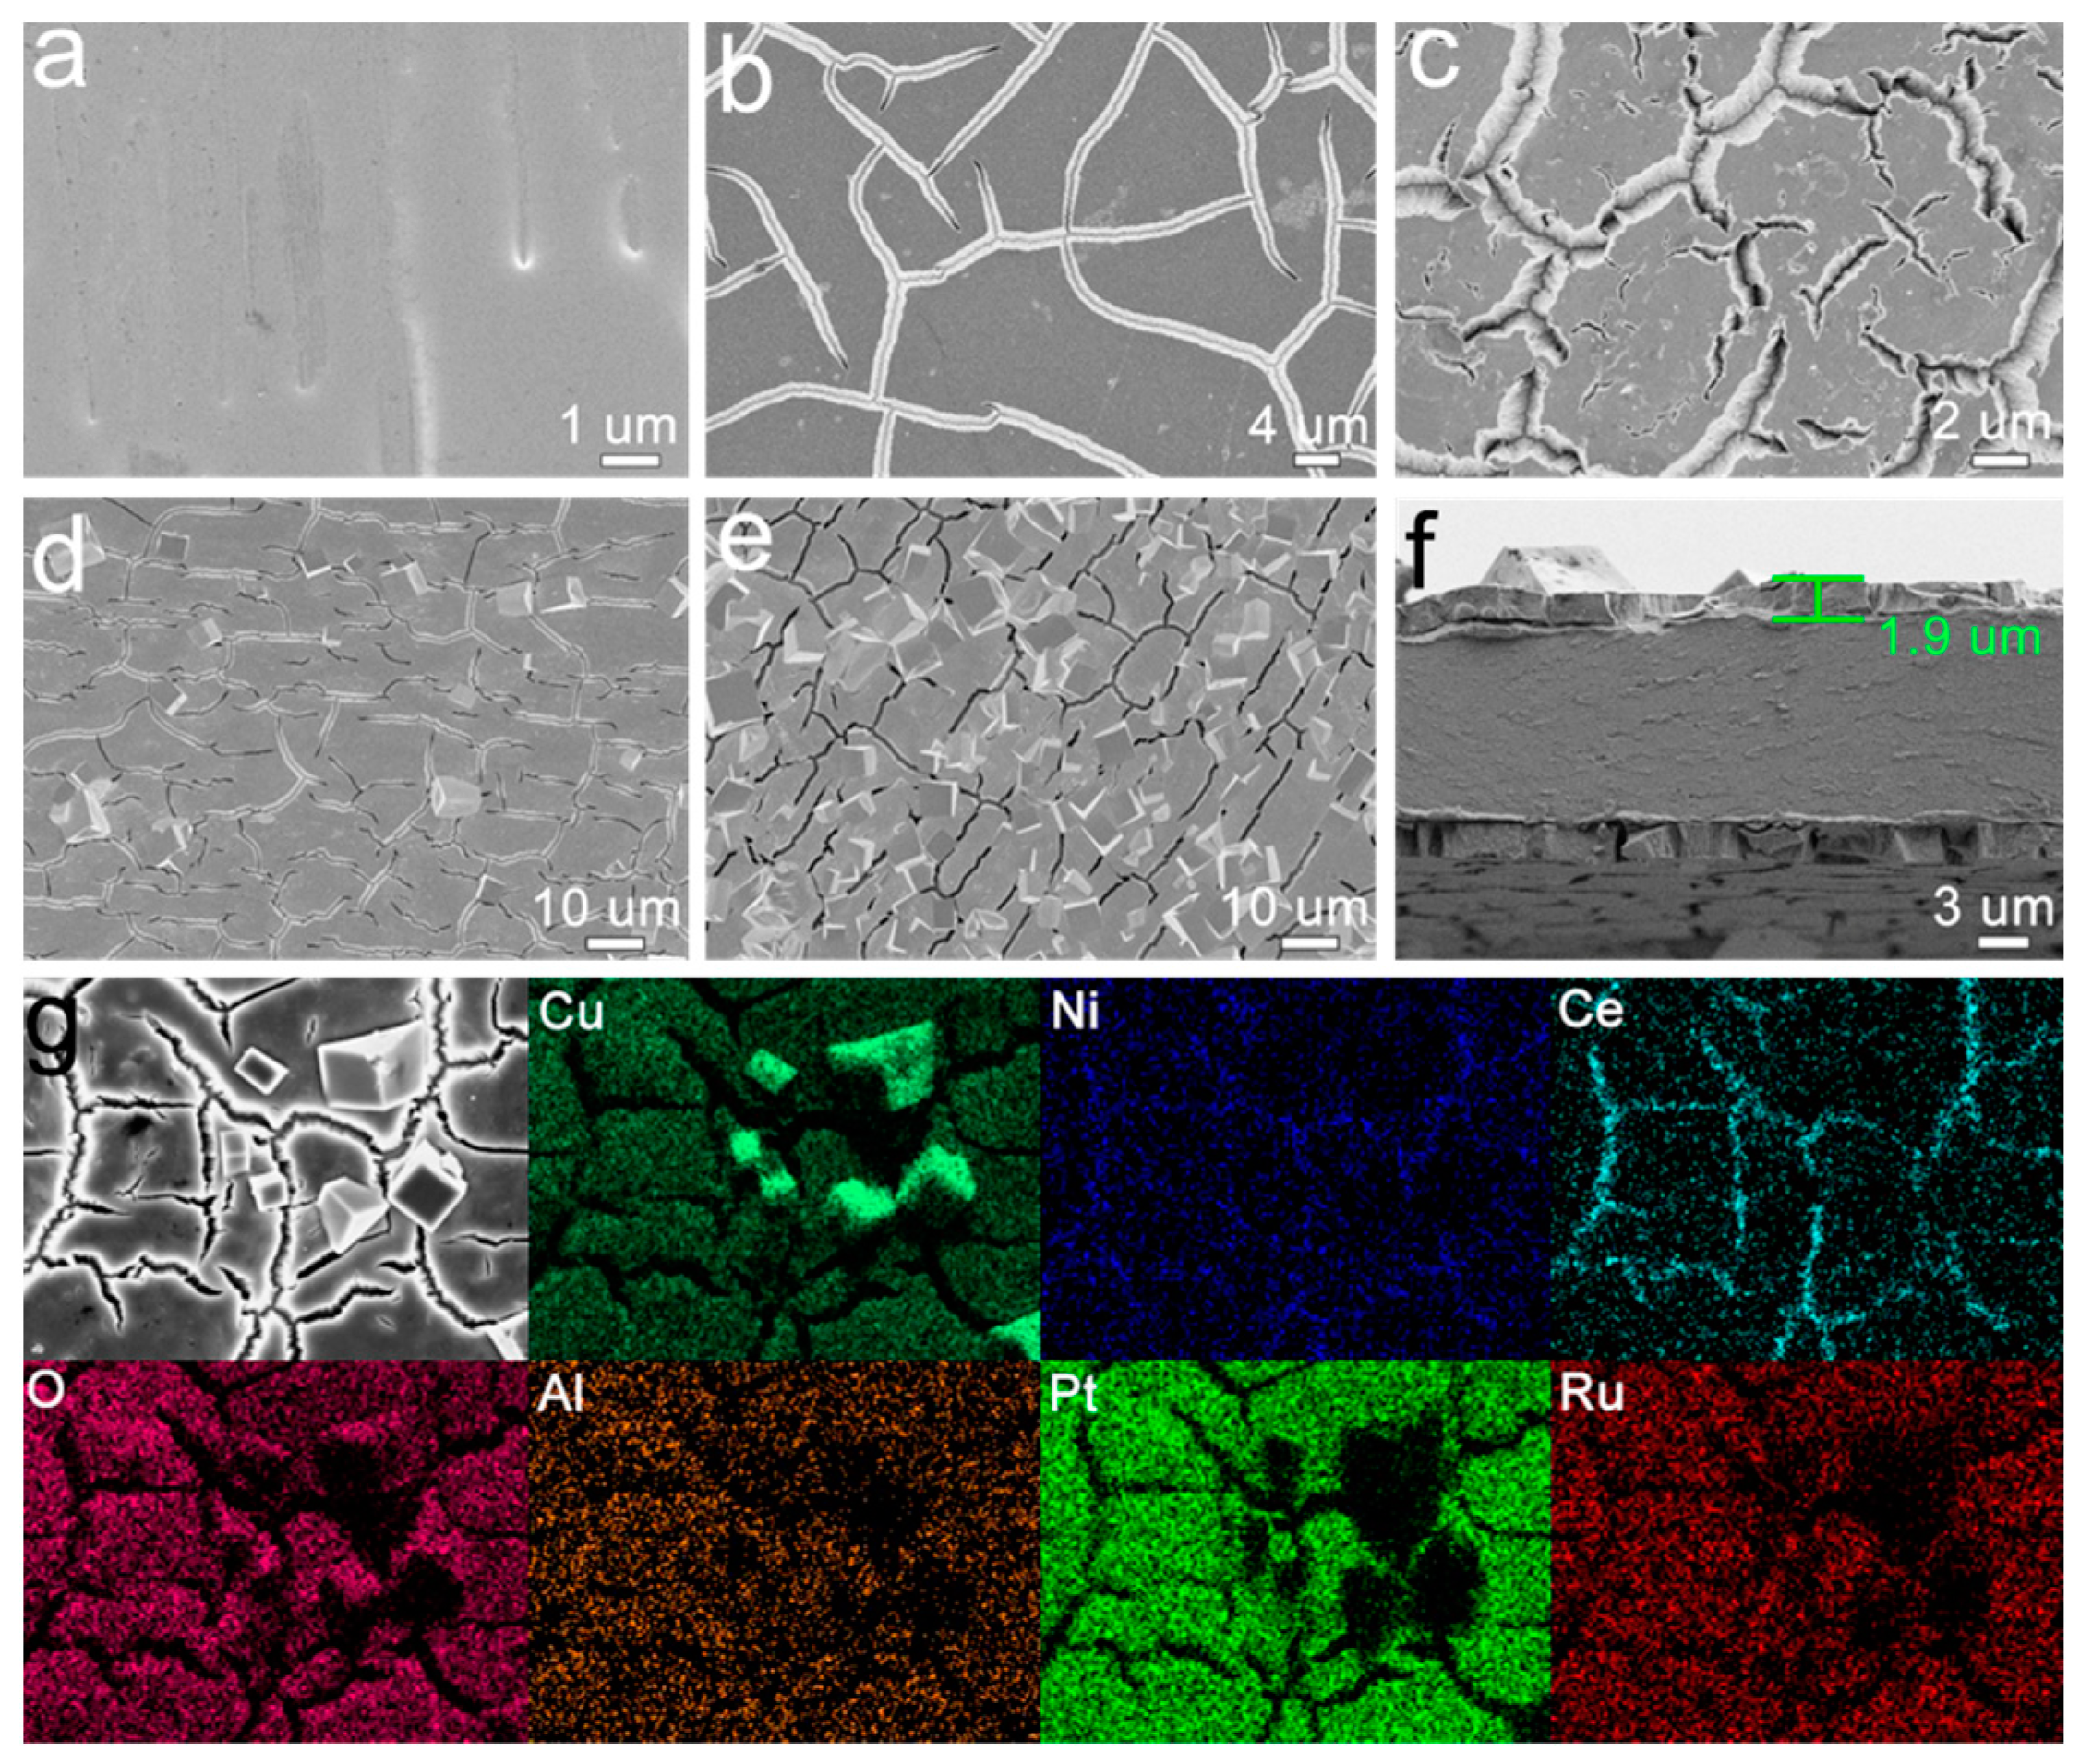
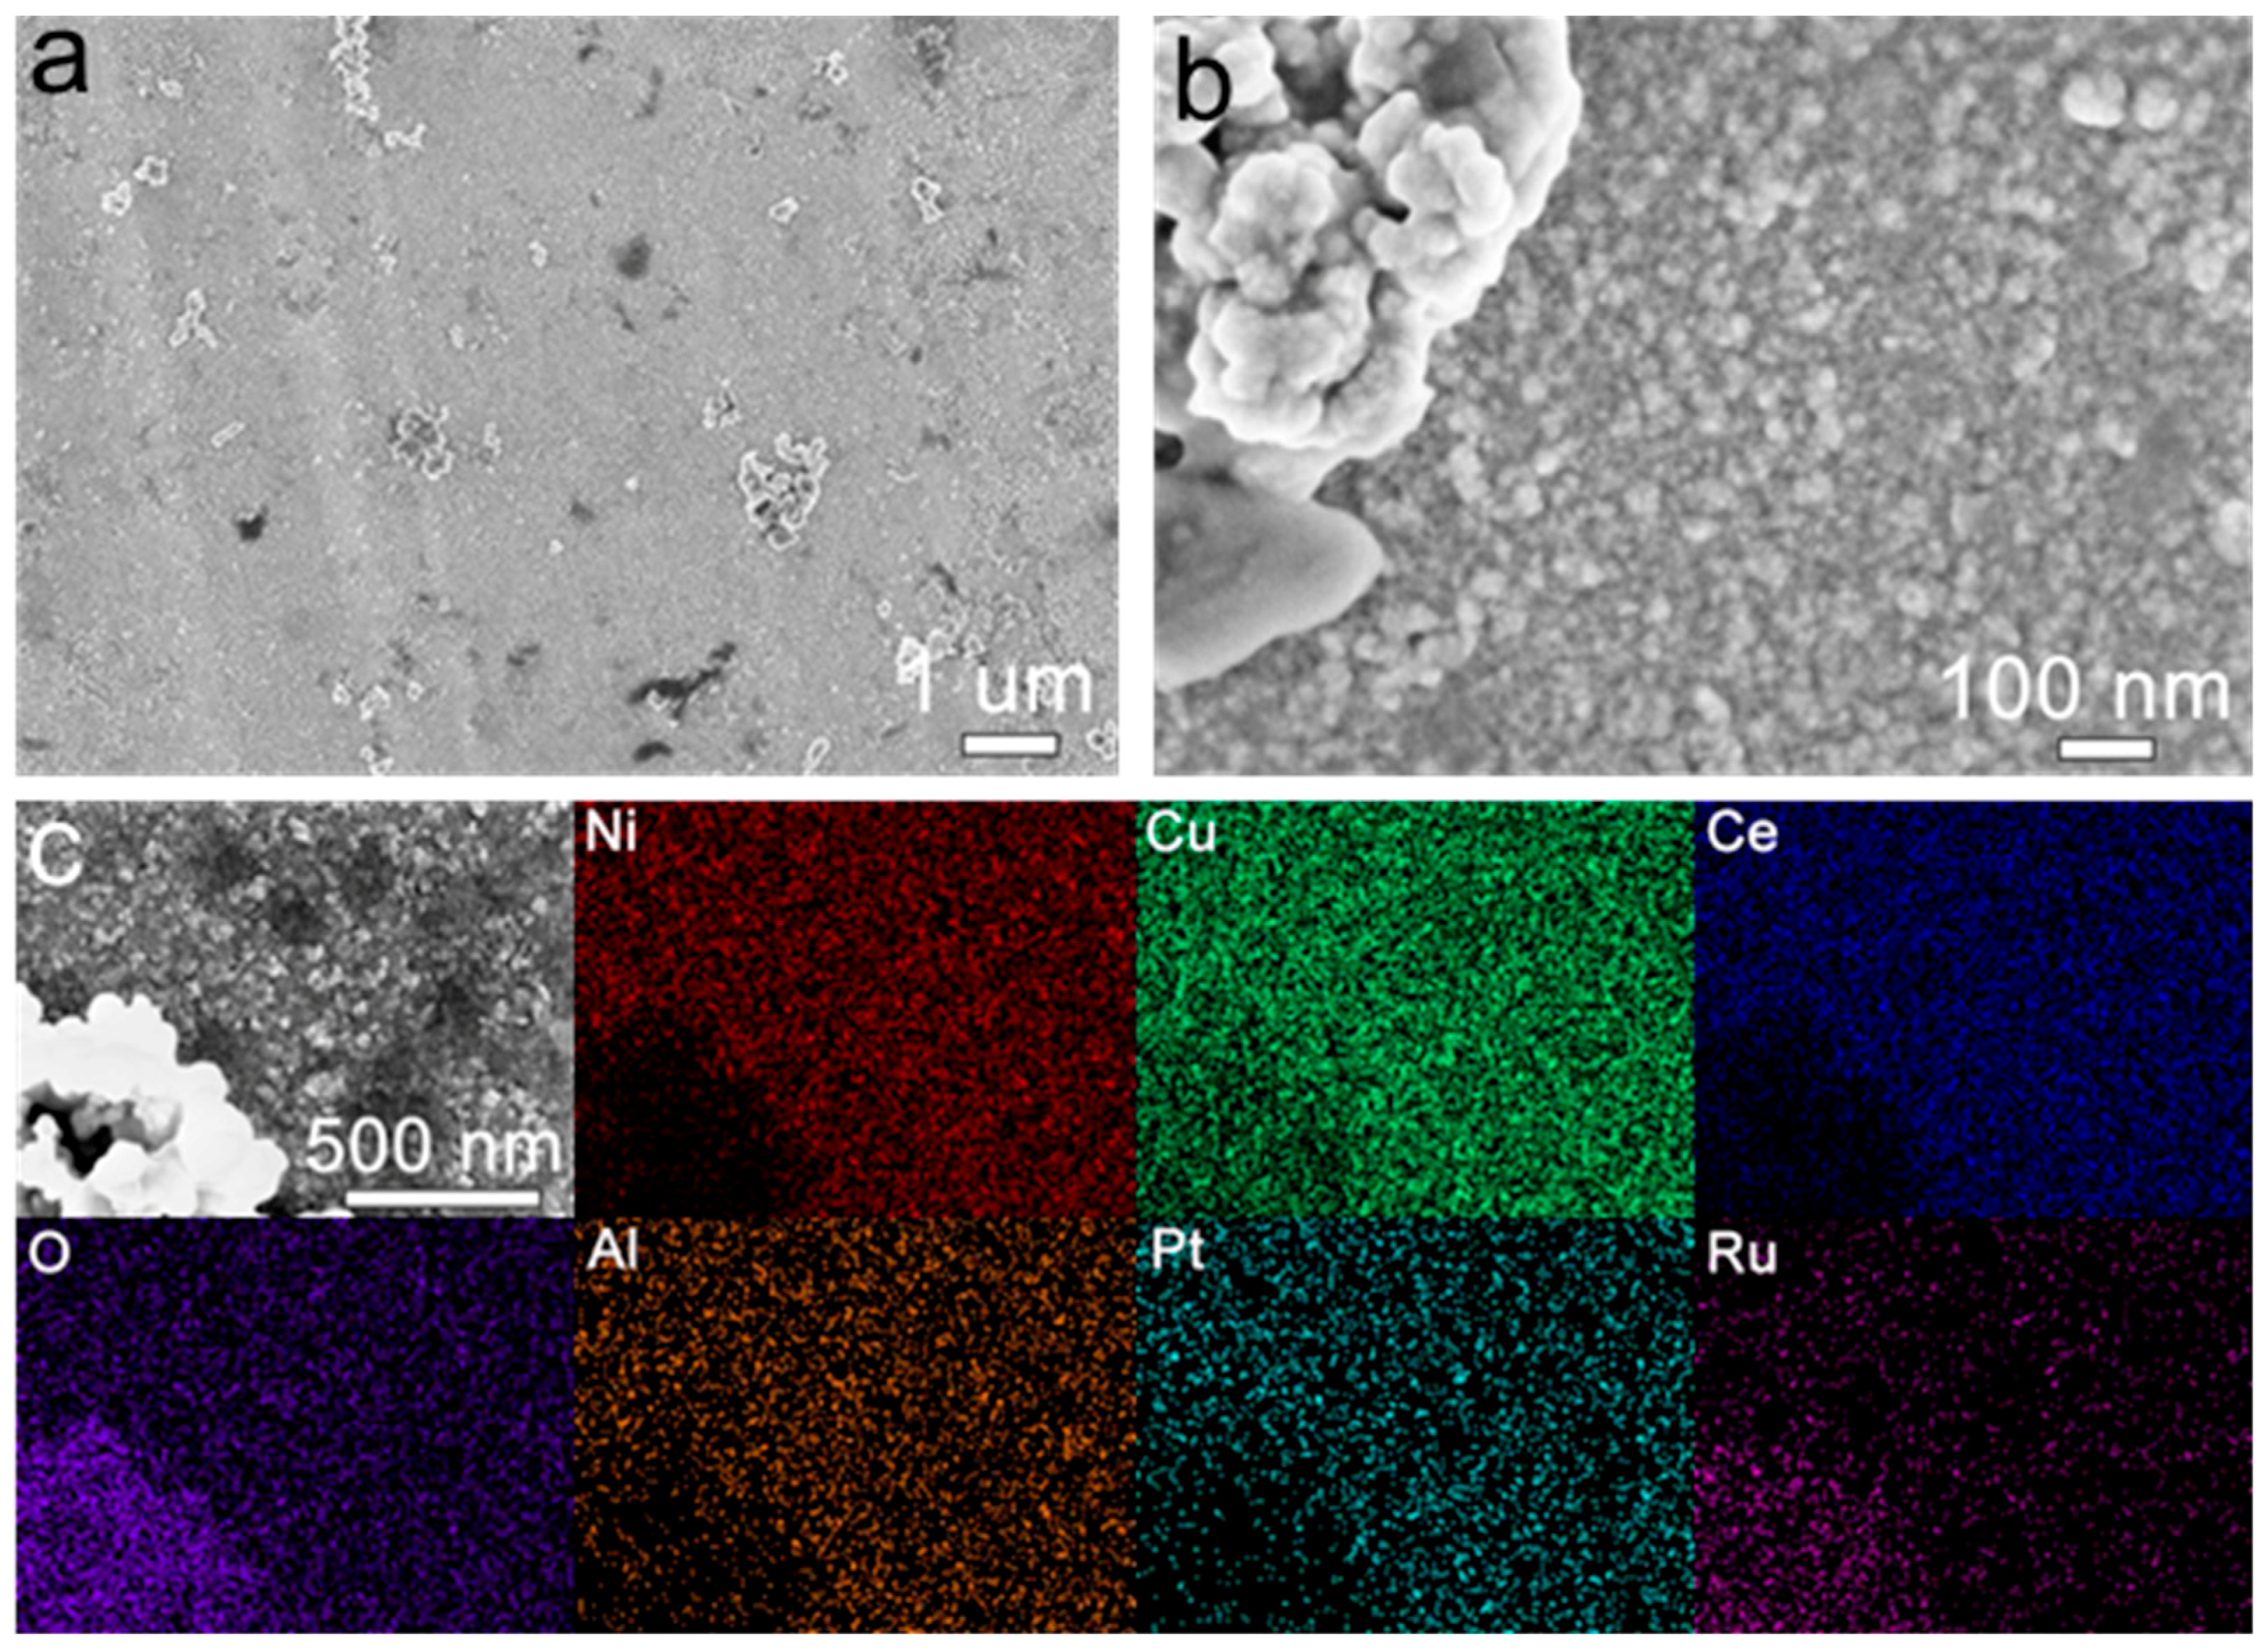
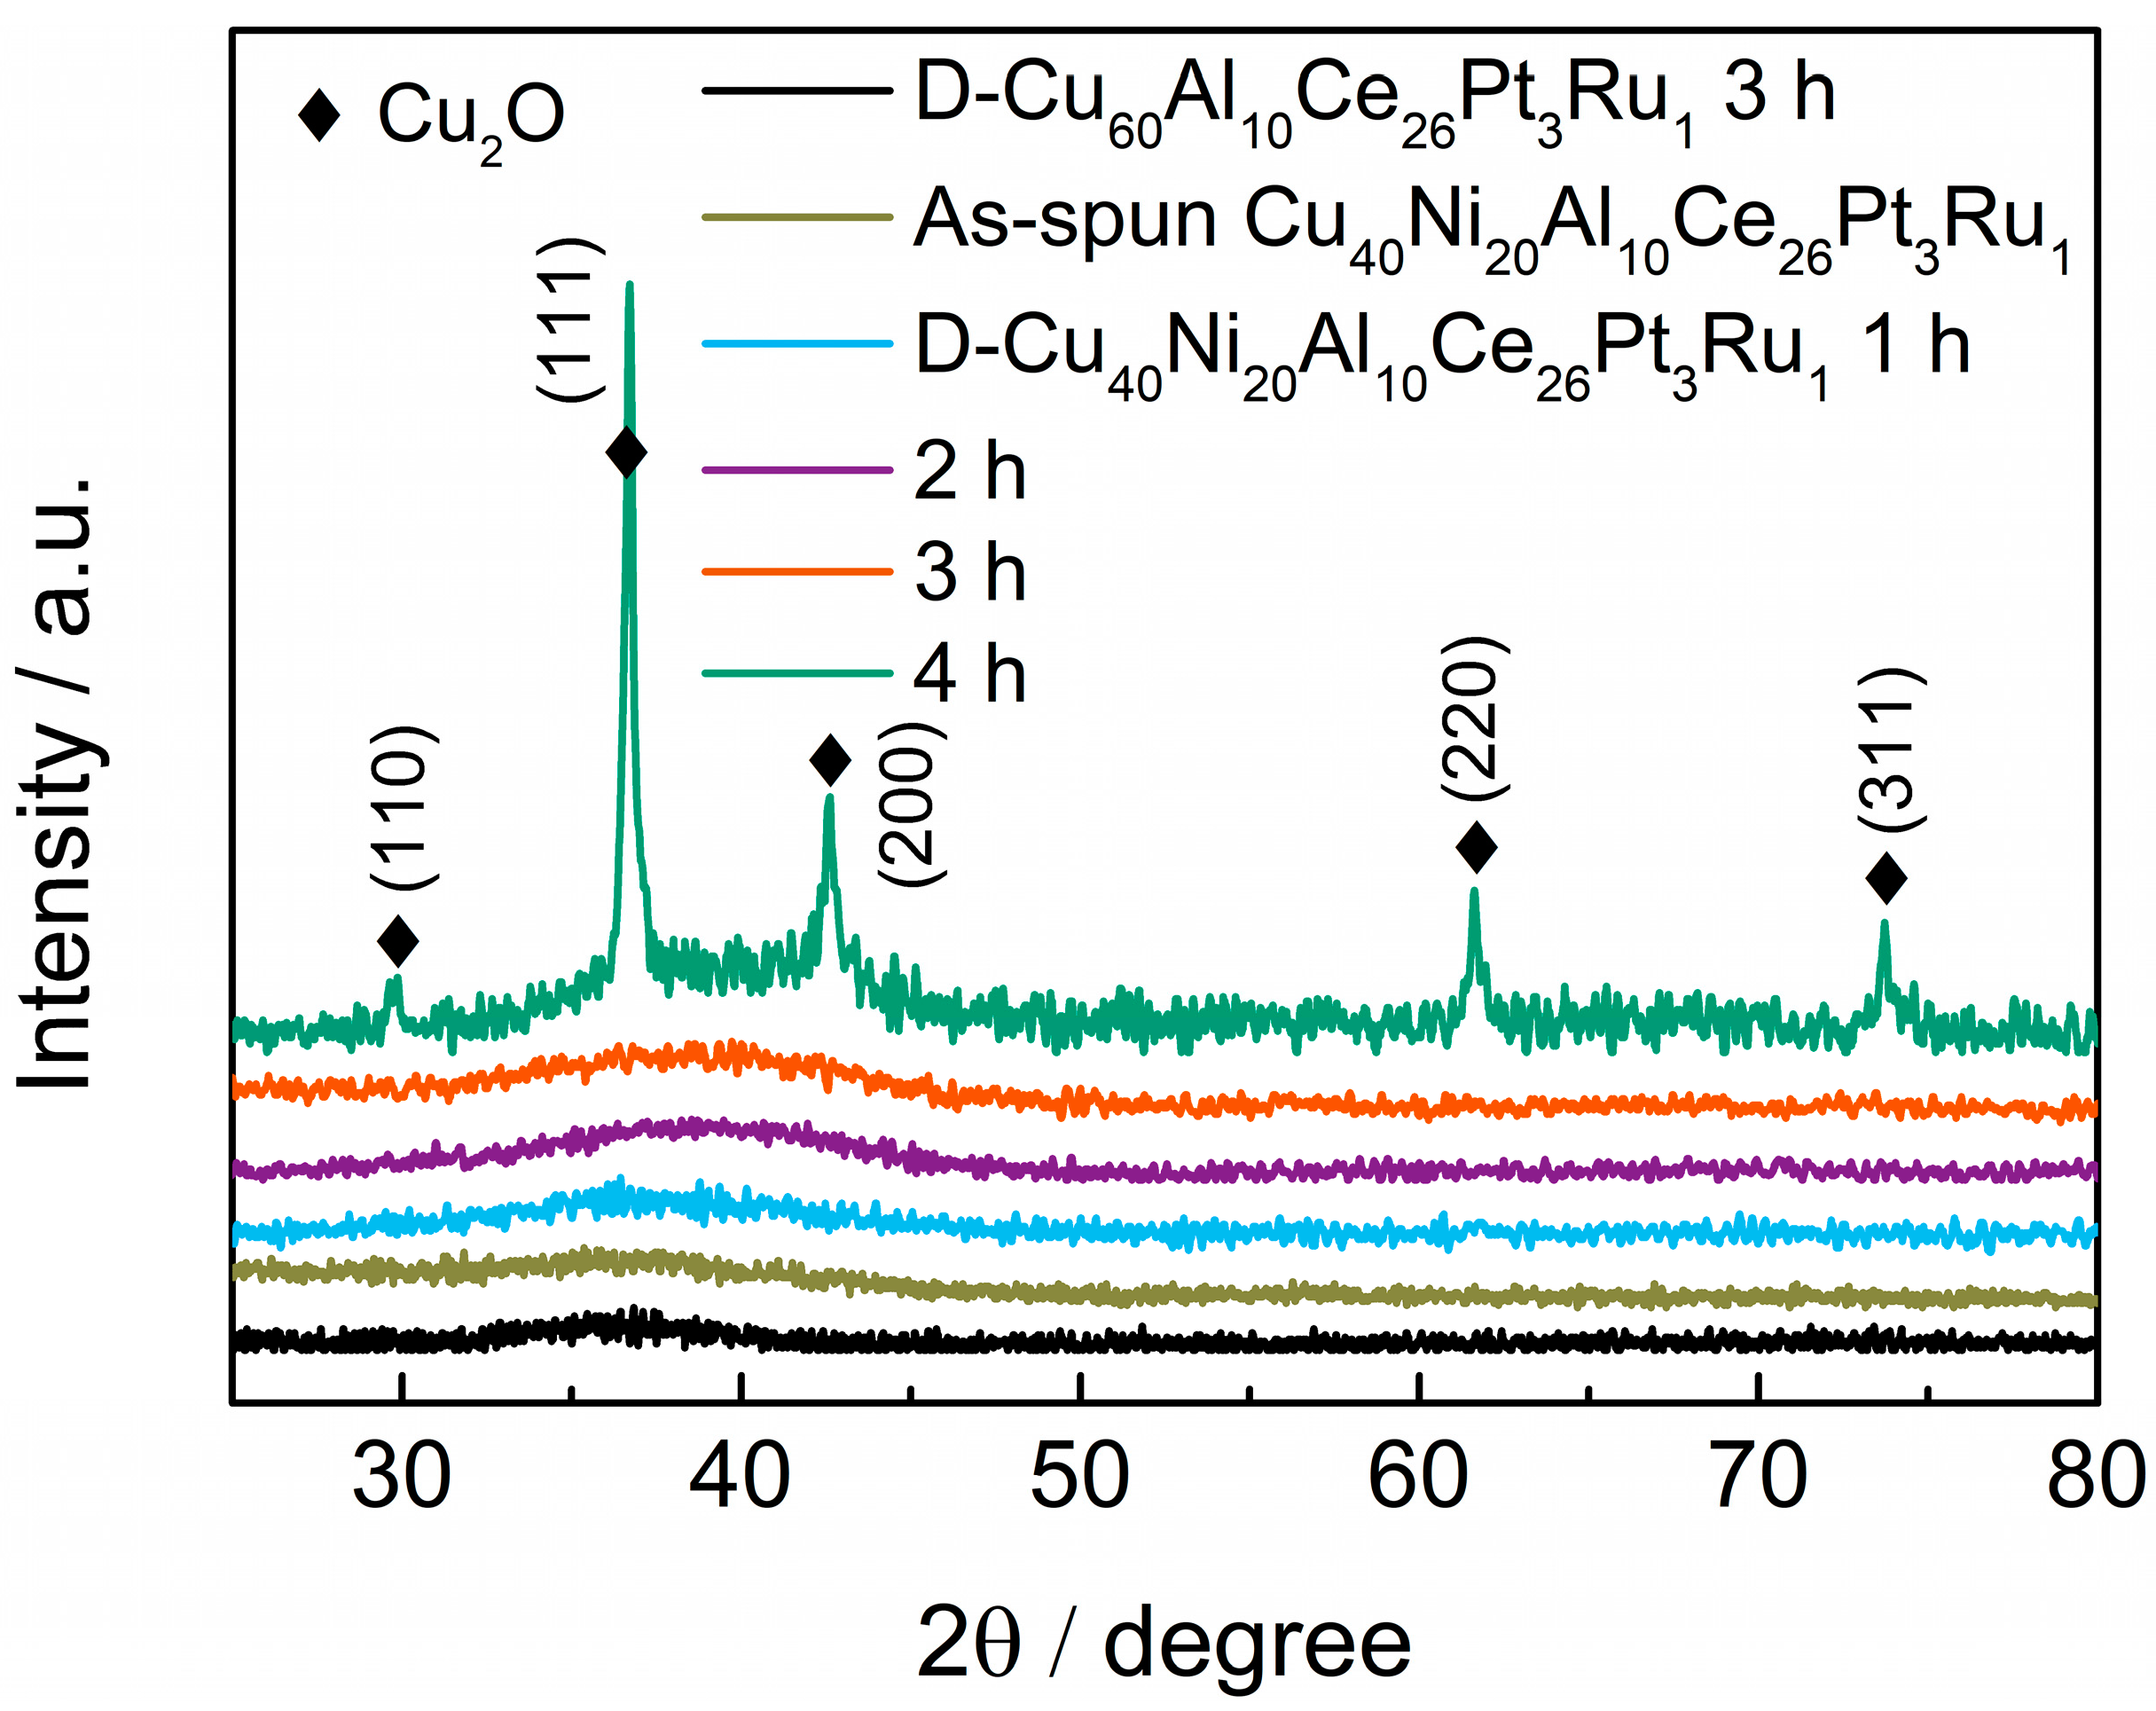
3.2. Morphological and Structural Characterization

The approximate content of elements contained in the as-spun (as-prepared) Cu60Al10Ce26Pt3Ru1 and Cu40Ni20Al10Ce26Pt3Ru1MGribbonsis shown in Figure S2, and it is consistent with the theoretical content. As can be seen from Figure 3, the surface of the Cu40Ni20Al10Ce26Pt3Ru1 MG ribbon is relatively smooth (Figure 3a). When the dealloying time was 1 h and 2 h, a flat and cracked oxide layer appeared on the surface of the MG ribbon (Figure 3b,c). When the dealloying time was extended to 3 h, a small number of cubic grains were formed on the surface of the dealloyed layer (Figure 3d). When the dealloying time was 4 h, the cubic grains increased obviously in amount (Figure 3e). As can be seen from Figure 3f, the thickness of the dealloyed layer of the D-Cu40Ni20Al10Ce26Pt3Ru1-3 h MG ribbon was about 1.9 μm. Figure 3g shows that the components of the dealloyed layer and cubic crystal grains were mainly Cu and O. The EDS result (Figure S3) shows that the atomic ratio of Cu and O in the cracked dealloyed layer was less than 1:1, indicating that it was mainly composed of CuO. The atomic ratio of Cu and O in the cubic particles was close to 2:1, demonstrating that the composition of cubic particles was Cu2O [36].
The EOR performance showed that only the activated dealloyed MG ribbon had catalytic activity; compared to the other samples, the AD-Cu40Ni20Al10Ce26Pt3Ru1-3 h ribbon exhibited an outstanding performance. The surface SEM images of the AD-Cu40Ni20Al10Ce26Pt3Ru1-3 h ribbon are shown in Figure 4. Figure 4a,b show that the surface of the activated sample is mainly covered by nanoparticles, except for a small number of irregular bulk structures. As can be seen from Figure 4c, the two structures above are mainly composed of Cu, Ce, Ni, and O, which are evenly distributed, indicating that the CuNiCe-O composite is formed on the surface of the AD-Cu40Ni20Al10Ce26Pt3Ru1-3 h MG ribbon. It can be seen that the Ce (27.4%), Cu (26.0%), Ni (17.5%), and O (17.3%) atomic ratio of nanoparticles is relatively high (Figure S4). The irregular bulk structures have lower Ni (9.2%) and higher Ru (8.4%) and O (40.9%) contents.
The surface SEM image of the AD-Cu40Ni20Al10Ce26Pt3Ru1-3 h ribbon after the CA test for 10 h is shown in Figure S5. It can be seen that a small number of island-like and aggregated nanosheet structures appear on the ribbon surface (Figure S5a). As can be seen from the enlarged view, nanosheets are distributed on the island and substrate surfaces (Figure S5b,c). The EDS spectra show that the islands are mainly composed of Pt-CuO, while the nanosheets are mainly composed of Cu, O, Ce, and Ni. The structural transformation after activation may be related to the increase in current density at the beginning of the CA test, resulting in the nanoparticle structures being transformed into nanosheets and promoting the enrichment of Pt to form the Pt-rich island structure.
The XRD pattern of the samples is shown in Figure 5. It can be seen from the figure that the D-Cu60Al10Ce26Pt3Ru1, Cu40Ni20Al10Ce26Pt3Ru1, D-Cu40Ni20Al10Ce26Pt3Ru1 (dealloying time t = 1–3 h), and AD-Cu40Ni20Al10Ce26Pt3Ru1-3 h ribbons only have one broad peak in the XRD diffraction spectrum, located between 30 and 45°, indicating that their phase structure is amorphous. From the SEM analysis results (Figure 3), it is observed that although a layer of metal oxide was formed on the surface of the dealloyed samples, the thickness of the surface product was no more than 2 μm (Figure 3f), while the thickness of the sample measured by XRD diffraction was generally no less than 5 μm [37]. Therefore, for the dealloyed and activated samples, the XRD tests were performed on the amorphous alloy inside, and so they still showed amorphous structures. Although a small number of cubic particles with large sizes were generated on the surface of the D-Cu40Ni20Al10Ce26Pt3Ru1-3 h ribbon (Figure 3d), the XRD diffraction spectrum did not detect the corresponding crystal peaks due to their small number and as such still presented an amorphous phase. However, when the dealloying time was 4 h, the cubic particles increased obviously and almost covered the oxide layer (Figure 3e). Therefore, both amorphous structure diffraction peaks and strong Cu2O crystal peaks appeared in the XRD diffraction spectrum (Figure 5). The diffraction peaks at 29.83°, 36.71°, 42.57°, 61.60°, and 73.70° were indexed to the (110), (111), (200), (220), and (311) planes of Cu2O (PDF No. 05-0667).
To identify the valence state of the surface product of the AD-Cu40Ni20Al10Ce26Pt3Ru1-3 h ribbon, an XPS test was performed and the results are shown in Figure 6. Figure 6a shows that two clusters of spin–orbit peaks appear in the high-resolution Ni 2p spectrum, accompanied by a cluster of resonant satellite peaks, corresponding to Ni 2p3/2 and Ni 2p1/2, respectively. Specifically, two peaks at ~855.8 and 872.8 eV correspond to Ni2+, and two peaks at ~857.0 and 873.8 eV are attributed to Ni3+ [38]. In addition, the spectra of Ni 2p3/2 and Ni 2p1/2 show that the strong satellite peaks with high binding energy located at 860–870 eV and 877–890 eV are split, indicating that they have multi-electron excitation characteristics [39]. In Figure 6b, two sets of spin–orbit multiplet peaks labeled (u0–u3) and (v0–v3) correspond to Ce 3d3/2 and Ce 3d5/2 in the Ce 3d spectrum, respectively. Peaks labeled v0, v2, v3, u0, u2, and u3 indicate the presence of Ce4+ species (CeO2), while peaks labeled v1 and u1 indicate the presence of Ce3+-containing components (Ce2O3) [40,41,42]. Calculation shows that the peak area of the Ce3+ component accounts for about 28%, indicating that there are many unsaturated Ce3+components in the surface product. The existence of Ce3+ means that the catalyst contains a large number of O vacancies, which can greatly enhance the catalytic activity and stability of the catalyst [43]. In Figure 6c, from Cu 2p spectra, it is obvious that the two main peaks at 934.7 eV and 954.5 eV, together with satellite peaks at 941.7 eV and 944.1 eV, are attributed to Cu2+ (CuO).The two peaks at 933.4 eV and 952.8 eV correspond to Cu+, and the other peak at 932.6 eV can be attributed to CuO [44,45]. As shown in Figure 6d, two band peaks at ~529.9 eV and 530.9 eV are attributed to lattice oxygen (OLattice) of metal oxides. The peak at 531.6 eV corresponds to an O vacancy, and the peak at 532.2 eV corresponds to adsorbed O, such as the adsorption of H2O from the atmosphere [46,47,48]. The XPS results are consistent with SEM.
The Raman spectra of the AD-Cu40Ni20Al10Ce26Pt3Ru1-3 h and AD-Cu60Al10Ce26Pt3Ru1-3 h ribbons are shown in Figure 7. The peaks at 268 and 474 cm−1 correspond to the bending vibrations of the Ce-O and Ni-O bonds, respectively [49,50]. The band spanning from 500 to 760 cm−1 can be attributed to the nondegenerate LO mode of ceria related to the oxygen vacancies in the ceria lattice [51]. Generally, the wider this band (F2g), the greater the number of oxygen vacancies [52,53]. The band located at 2500–3500 cm−1 is attributed to O-H vibrations, demonstrating that the surface product of the AD-Cu40Ni20Al10Ce26Pt3Ru1-3 h ribbon contains abundant hydroxyl groups. Thus, the obtained XPS and Raman data confirm the presence of more defects/oxygen vacancies in the dealloyed layers of the AD-Cu40Ni20Al10Ce26Pt3Ru1-3 h ribbon than in those of the AD-Cu60Al10Ce26Pt3Ru1-3 h ribbon, which promotes the adsorption of OH groups, oxygen ions, and other oxygen-containing species, boosting EOR performance [39].

3.3. Dealloying Reaction and EOR Mechanism

It can be seen from Table 2 that the Ce content in the acid solution after dealloying is the highest, followed by Cu, Ni, and Al. According to the above analysis of the composition and morphology, it can be inferred that the possible reactions in the dealloying process are as follows:
2 C e + C u + 6 H + + H 2 O 2 C e 3 + + C u O + 4 H 2
C u O + 2 H + C u 2 + + H 2 O
N i + 2 H + N i 2 + + H 2
2 A l + 6 H + 2 A l 3 + + 3 H 2
From the above analysis, it can be observed that the CuO layer is mainly formed on the MG ribbon surface after dealloying, and that Pt atoms migrate to the surface at the same time. From the EDS test results shown in Figure 3g, it can be seen that the Pt content in the dealloyed oxide layer is about 9.7%, which is larger than the amount in the MG ribbon precursor. The CuNiCe-O oxide layer is formed by the recombination of elements during CV activation. Pt atoms may be covered, resulting in lower Pt in the surface products (Figure S4). The mechanism of the ethanol oxidation reaction on the CuNiCe-O composite surface in an alkaline environment can be speculated to be as follows:
C u 2 + C u 3 + + e
C u 3 + + C H 3 C H 2 O H a d s + I n t e r m e d i a t e + C u 2 +
C u 3 + + I n t e r m e d i a t e P r o d u c t + C u 2 +
It has been reported that doping Cu into Ni-based catalysts can increase the percentage of high-valence Ni (Ni3+). In addition, the introduction of Cu increases the specific surface area and produces more defect sites, enhancing EOR performance [54].
N i I I N i I I I + e
N i I I I + e t h a n o l I n t e r m e d i a t e + N i I I
I n t e r m e d i a t e + N i I I I P r o d u c t + N i I I
The electrocatalytic oxidation mechanisms of Ni and Cu are similar for ethanol. However, it can be seen from Figure 2b,c that after Ni is introduced into the precursor, the activity and stability of the activated dealloyed MG ribbon are significantly improved, indicating that Ni plays a crucial role in enhancing catalysis. The Cu and Ni composite can fill the d band vacancy of Ni and inhibit the formation of γ-NiOOH. The formation of a high-valence-state γ-NiOOH competes with β-NiOOH, and the latter shows higher catalytic activity under alkaline conditions [32,55,56]. The surface catalytic activity and excellent electrical conductivity of nickel are very important for improving EOR performance. The state of Ni, especially the +3 state NiOOH, has high electrical activity, which improves reaction efficiency [57]. Ni and Ce ions which are not saturated can also provide a large number of oxygen vacancies, which make ethanol molecules and hydroxyl components easy to adsorb onto the catalyst surface, thereby reducing the oxidation potential of ethanol and oxidizing the intermediates in time so that the active sites can be quickly released. Hence, the activity and stability are enhanced. As can be seen from Figure 6a,c, after the catalyst is used, the energy bands of Ni2+and Ni3+ move to a lower binding energy, and the percentage of Cu2+ decreases. From Table S1, it can be observed that the percentage content of adsorbed oxygen (532.2 eV) is obviously reduced after the reaction. These results indicate that Ni, Cu, and -OHads play a key role in the catalytic reaction [58,59].

4. Conclusions

In this work, Ni was introduced into Cu60Al10Ce26Pt3Ru1 MG, and the relationship between the morphology of D/AD-Cu40Ni20Al10Ce26Pt3Ru1 MG ribbons and EOR performance was investigated. The results show that introducing Ni into the MG ribbon precursor may change the migration paths of elements during dealloying, resulting in the formation of CuCeNi-O composite nanoparticles on the surface of the activated dealloyed MG ribbons. Compared with the AD-Cu60Al10Ce26Pt3Ru1 ribbon, the AD-Cu40Ni20Al10Ce26Pt3Ru1 ribbon had higher EOR activity and stability. A possible reason for this is that Cu can promote the formation of β-NiOOH with high catalytic activity and the unsaturated Ni and Ce ions provide sufficient oxygen vacancies, improving catalytic efficiency and anti-poisoning ability.

Supplementary Materials

The following supporting information can be downloaded at: https://www.mdpi.com/article/10.3390/ma18030701/s1, Figure S1: SEM-EDS spectra and element content of the As-spun Cu60Al10Ce26Pt3Ru1and Cu40Ni20Al10Ce26Pt3Ru1 MG ribbon; Figure S2: Selection EDS spectra of D-Cu40Ni20Al10Ce26Pt3Ru1-3 h ribbon; Figure S3: Selection EDS spectra of AD-Cu40Ni20Al10Ce26Pt3Ru1-3 h ribbon; Figure S4: Morphology of AD-Cu40Ni20Al10Ce26Pt3Ru1-3 h ribbon after EOR: (a–c) Surface SEM after 10 h CA test; (d) Selection EDS spectrum.; Table S1: The peak area percentages of O 1s calculated from the XPS spectrum.

Author Contributions

J.S.: conceptualization, data curation, investigation, formal analysis, methodology, visualization, writing—original draft and editing, funding acquisition; B.Z.: conceptualization, supervision, project administration, resources; Y.C.: methodology, resources, project administration; Q.H.: conceptualization, formal analysis, resources, funding acquisition; F.Z.: conceptualization, supervision, project administration, resources, funding acquisition; L.Z.: formal analysis, investigation. All authors have read and agreed to the published version of the manuscript.

Funding

This research was funded by the Natural Science Foundation for Universities of Anhui Province (No. 2024AH051169), the National Natural Science Foundation of China (No. 51801050, 52201210).

Institutional Review Board Statement

Not applicable.

Informed Consent Statement

Informed consent was obtained from all subjects involved in the study.

Data Availability Statement

The original contributions presented in this study are included in the article and Supplementary Material. Further inquiries can be directed to the corresponding author.

Conflicts of Interest

Author Yu Chen is employed by the Anhui Haoou Electronic Technology. The remaining authors declare that the research was conducted in the absence of any commercial or financial relationships that could be construed as a potential conflict of interest.

References

  1. Shaari, N.; Kamarudin, S.K.; Bahru, R.; Osman, S.H.; Ishak, N.A.I.M. Progress and challenges: Review for direct liquid fuelcell. Int. J. Energy Res. 2021, 45, 6644–6688. [Google Scholar] [CrossRef]
  2. Tan, X.; Chen, S.; Yan, D.; Du, R.; Zhong, Q.; Liao, L.; Tang, Z.; Zeng, F. Recent advances in Ni-based catalysts for the electrochemical oxidation of ethanol. J. Energy Chem. 2024, 98, 588–614. [Google Scholar] [CrossRef]
  3. Kang, Z.; Zhao, M.; Wu, Y.; Xia, T.; Cao, J.P.; Cai, W.; Chen, L. Facial fabrication of yolk-shell Pd-Ni-P alloy with mesoporous structure as an advanced catalyst for methanol electro-oxidation. Appl. Surf. Sci. 2019, 484, 441–445. [Google Scholar] [CrossRef]
  4. Cheng, T.; Tian, J.; Du, J.; Wang, Z.; Ye, J.; Liu, A.; Chen, Q.; Zhu, Y. Self-Interface in Rh Nanosheets-Supported Tetrahedral Rh Nanocrystals for Promoting Electrocatalytic Oxidation of Ethanol. Small 2024, 20, 2306221. [Google Scholar] [CrossRef] [PubMed]
  5. Li, J.; Wang, C.; Shang, H.; Wang, Y.; You, H.; Xu, H.; Du, Y. Metal-modified PtTe2 nanorods: Surface reconstruction for efficient methanol oxidation electrocatalysis. Chem. Eng. J. 2021, 424, 130319. [Google Scholar] [CrossRef]
  6. Ren, X.; Lv, Q.; Liu, L.; Liu, B.; Wang, Y.; Liu, A.; Wu, G. Current progress of Pt and Pt-based electrocatalysts used for fuel cells. Sustain. Energy Fuels 2020, 4, 15–30. [Google Scholar] [CrossRef]
  7. Wang, H.; Lee, H.W.; Deng, Y.; Lu, Z.; Hsu, P.C.; Liu, Y.; Lin, D.; Cui, Y. Bifunctional non-noble metal oxide nanoparticle electrocatalysts through lithium-induced conversion for overall water splitting. Nat. Commun. 2015, 6, 7261. [Google Scholar] [CrossRef] [PubMed]
  8. Roy, S.; Bagchi, D.; Dheer, L.; Sarma, S.; Rajaji, V.; Narayana, C.; Waghmare, U.; Peter, S. Mechanistic insights into the promotional effect of Ni substitution in non-noble metal carbides for highly enhanced water splitting. Appl. Catal. B Environ. 2021, 298, 120560. [Google Scholar] [CrossRef]
  9. She, H.; Sun, Y.; Li, S.; Huang, J.; Wang, L.; Zhu, G.; Wang, Q. Synthesis of non-noble metal nickel doped sulfide solid solution for improved photocatalytic performance. Appl. Catal. B Environ. 2019, 245, 439–447. [Google Scholar] [CrossRef]
  10. Yu, L.; Zhu, Q.; Song, S.; McElhenny, B.; Wang, D.; Wu, C.; Qin, Z.; Bao, J.; Yu, Y.; Chen, S.; et al. Non-noble metal-nitride based electrocatalysts for high-performance alkaline seawater electrolysis. Nat. Commun. 2019, 10, 5106. [Google Scholar] [CrossRef]
  11. Shekhawat, A.; Samanta, R.; Panigrahy, S.; Barman, S. Electrocatalytic oxidation of urea and ethanol on two-dimensional amorphous nickel oxide encapsulated on N-doped carbon nanosheets. ACS Appl. Energy Mater. 2023, 6, 3135–3146. [Google Scholar] [CrossRef]
  12. Zhou, X.C.; Yang, X.Y.; Fu, Z.B.; Yang, Q.; Yang, X.; Tang, Y.J.; Wang, C.Y.; Yi, Y. Single-crystalline ultrathin nanofilms of Ni aerogel with Ni(OH)2 hybrid nanoparticles towards enhanced catalytic performance for ethanol electro-oxidation. Appl. Surf. Sci. 2019, 492, 756–764. [Google Scholar] [CrossRef]
  13. Zhang, Y.; Zhu, W.; Fang, J.; Xu, Z.; Xue, Y.; Liu, D.; Sui, R.; Lv, Q.; Liu, X.; Wang, Y.; et al. Defective Ni3S2 nanowires as highly active electrocatalysts for ethanol oxidative upgrading. Nano Res. 2022, 15, 2987–2993. [Google Scholar] [CrossRef]
  14. Shi, W.; Wang, Q.; Qin, F.; Yu, J.; Jia, M.; Gao, H.; Zhang, Y.; Zhao, Y.; Li, G. N-doped carbon encapsulated nickel nanoparticles: Rational fabrication and ultra-high performance for ethanol oxidation. Electrochim. Acta 2017, 232, 332–338. [Google Scholar] [CrossRef]
  15. Sharma, P.; Radhakrishnan, S.; Khil, M.S.; Kim, H.Y.; Kim, B.S. Simple room temperature synthesis of porous nickel phosphate foams for electrocatalytic ethanol oxidation. J. Electroanal. Chem. 2018, 808, 236–244. [Google Scholar] [CrossRef]
  16. Zhang, K.; Han, Y.; Qiu, J.; Ding, X.; Deng, Y.; Wu, Y.; Zhang, G.; Yan, L. Interface engineering of Ni/NiO heterostructures with abundant catalytic active sites for enhanced methanol oxidation electrocatalysis. J. Colloid Interface Sci. 2023, 630, 570–579. [Google Scholar] [CrossRef] [PubMed]
  17. Tian, H.; Pei, C.; Wu, Y.; Chen, S.; Zhao, Z.J.; Gong, J. Tunable metal-oxide interaction with balanced Ni0/Ni2+ sites of NixMg1−xO for ethanol steam reforming. Appl. Catal. B Environ. 2021, 293, 120178. [Google Scholar] [CrossRef]
  18. Chen, W.; Shi, J.; Wu, Y.; Jiang, Y.; Huang, Y.C.; Zhou, W.; Liu, J.; Dong, C.; Zou, Y.; Wang, S. Vacancy-induced catalytic mechanism for alcohol electrooxidation on nickel-based electrocatalyst. Angew. Chem. Int. Ed. 2024, 63, e202316449. [Google Scholar] [CrossRef] [PubMed]
  19. Sheng, S.; Ye, K.; Sha, L.; Zhu, K.; Gao, Y.; Yan, J.; Wang, G.; Cao, D. Rational design of Co-SP nanosheet arrays as bifunctional electrocatalysts for both ethanol oxidation reaction and hydrogen evolution reaction. Inorg. Chem. Front. 2020, 7, 4498–4506. [Google Scholar] [CrossRef]
  20. Ghalkhani, M.; Mirzaie, R.A.; Banimostafa, A.; Sohouli, E.; Hashemi, E. Electrosynthesis of ternary nonprecious Ni, Cu, Fe oxide nanostructure as efficient electrocatalyst for ethanol electro-oxidation: Design strategy and electrochemical performance. Int. J. Hydrogen Energy 2023, 48, 21214–21223. [Google Scholar] [CrossRef]
  21. Baruah, S.; Kumar, A.; Peela, N.R. Role of ZSM-5/AC hybrid support on the catalytic activity of Pd-Ag electrocatalysts towards ethanol oxidation: An experimental and kinetic study. Electrochim. Acta 2023, 453, 142357. [Google Scholar] [CrossRef]
  22. Tang, X.D.; Wang, Y.; Wang, C.Y.; Yuan, L.; Yi, Y. Pt-Bi on carbon aerogels as efficient electrocatalysts for ethanol oxidation reaction in alkaline medium. J. Alloys Compd. 2023, 938, 168398. [Google Scholar] [CrossRef]
  23. Liu, D.; Zhu, Z.; Li, J.; Chen, L.W.; Huang, H.Z.; Jing, X.T.; Yin, A.X. Rh–Cu alloy nano-dendrites with enhanced electrocatalytic ethanol oxidation activity. J. Energy Chem. 2023, 82, 343–349. [Google Scholar] [CrossRef]
  24. Yang, H.; Zhang, A.; Bai, Y.; Chu, M.; Li, H.; Liu, Y.; Zhu, P.; Chen, X.; Deng, C.; Yuan, X. One stone two birds: Unlocking the synergy between amorphous Ni(OH)2 and Pd nanocrystals toward ethanol and formic acid oxidation. Inorg. Chem. 2022, 61, 14419–14427. [Google Scholar] [CrossRef]
  25. Baruah, S.; Kumar, A.; Peela, N.R. Activated Carbon Supported Ni-Co Layered Double Hydroxides Nanowires: An Effective and Low-Cost Electrocatalyst for Ethanol Electro-Oxidation in Alkaline Media. J. Electrochem. Soc. 2023, 170, 034509. [Google Scholar] [CrossRef]
  26. Zhao, Y.; Björk, E.M.; Yan, Y.; Schaaf, P.; Wang, D. Recent progress in transition metal based catalysts and mechanism analysis for alcohol electrooxidation reactions. Green Chem. 2024, 22, 100913. [Google Scholar] [CrossRef]
  27. Vassileva, E.; Mihaylov, L.; Lyubenova, L.; Spassov, T.; Scaglione, F.; Rizzi, P. Porous metallic structures by dealloying amorphous alloys. J. Alloys Compd. 2023, 969, 172417. [Google Scholar] [CrossRef]
  28. Yu, J.; Ding, Y.; Xu, C.; Inoue, A.; Sakurai, T.; Chen, M. Nanoporous metals by dealloying multicomponent metallic glasses. Chem. Mater. 2008, 20, 4548–4550. [Google Scholar] [CrossRef]
  29. Nozaki, A.; Deguchi, R.; Ichiwara, H.; Kameo, R.; Morishita, M. Pd-Dispersed CeO2 Catalyst Prepared from Dealloying the Pd–Ce–Al Ternary Amorphous Alloy Used for Oxidation Reaction. Mater. Trans. 2020, 61, 1848–1852. [Google Scholar] [CrossRef]
  30. Nozaki, A.; Fujiwara, R.; Ueda, C.; Yamashita, A.; Yamamoto, H.; Morishita, M. Preparation of nanoporous CeO2 Catalyst supports by chemical treatment of amorphous alloys and investigation of Ni/CeO2 catalytic activity. Mater. Trans. 2019, 60, 1964–1967. [Google Scholar] [CrossRef]
  31. Li, M.; Liu, J.; Wang, C.; Liu, Y.; Sun, Y.; Qin, C.; Wang, Z.; Li, Y.; Liu, L.; Liu, S. Controllable nanoporous copper synthesized by dealloying metallic glasses: New insights into the tuning pore structure and applications. Chem. Eng. J. 2022, 427, 130861. [Google Scholar] [CrossRef]
  32. Li, S.; Guan, A.; Wang, H.; Yan, Y.; Huang, H.; Jing, C.; Zhang, L.; Zheng, G. Hybrid palladium nanoparticles and nickel single atom catalysts for efficient electrocatalytic ethanol oxidation. J. Mater. Chem. A 2022, 10, 6129–6133. [Google Scholar] [CrossRef]
  33. Song, J.; Zhang, F.; Hu, Q.; Lu, D.; Lu, Z.; Zhang, B. Synthesis of Pt-CuO/RuO2 composites by dealloying from metallic glass and their ethanol electrooxidation performance. Appl. Surf. Sci. 2022, 590, 153123. [Google Scholar] [CrossRef]
  34. He, D.; Cao, L.; Huang, J.; Zhang, X.; Wang, C.; Zhao, K.; Kajiyoshi, K.; Feng, L. Nanosheets-assembled hollow N-doped carbon nanospheres encapsulated with ultrasmall NiSe nanoparticles for electrocatalytic hydrogen evolution. Int. J. Hydrogen Energy 2024, 64, 733–743. [Google Scholar] [CrossRef]
  35. Zhao, X.; Liu, Q.; Li, Q.; Chen, L.; Mao, L.; Wang, H.; Chen, S. Two-dimensional electrocatalysts for alcohol oxidation: Acritical review. Chem. Eng. J. 2020, 400, 125744. [Google Scholar] [CrossRef]
  36. Liu, B.; Yao, X.; Zhang, Z.; Li, C.; Zhang, J.; Wang, P.; Zhao, J.; Guo, Y.; Sun, J.; Zhao, C. Synthesis of Cu2O nanostructures with tunable crystal facets for electrochemical CO2 reduction to alcohols. ACS Appl. Mater. Interfaces 2021, 13, 39165–39177. [Google Scholar] [CrossRef] [PubMed]
  37. Li, R.; Liu, X.; Wu, R.; Wang, J.; Li, Z.; Chan, K.C.; Wang, H.; Wu, Y.; Lu, Z. Flexible honeycombed nanoporous/glassy hybrid for efficient electrocatalytic hydrogen generation. Adv. Mater. 2019, 31, 1904989. [Google Scholar] [CrossRef]
  38. Sun, H.; Li, L.; Chen, Y.; Kim, H.; Xu, X.; Guan, D.; Hu, Z.; Zhang, L.; Shao, Z.; Jung, W. Boosting ethanol oxidation by NiOOH-CuO nano-heterostructure for energy-saving hydrogen production and biomass upgrading. Appl. Catal. B Environ. 2023, 325, 122388. [Google Scholar] [CrossRef]
  39. Song, J.; Zhang, F.; Hu, Q.; Lu, Z.; Zhang, B. Dealloying fabrication of nickel Oxyhydroxide/Oxide-based composites boosting ethanol electrooxidation. Appl. Surf. Sci. 2023, 637, 157915. [Google Scholar] [CrossRef]
  40. Wang, N.; Pan, Y.; Lu, T.; Li, X.; Wu, S.; Wu, J. A new ribbon-ignition method for fabricating p-CuO/n-CeO2 heterojunction with enhanced photocatalytic activity. Appl. Surf. Sci. 2017, 403, 699–706. [Google Scholar] [CrossRef]
  41. Putanenko, P.K.; Dorofeeva, N.V.; Kharlamova, T.S.; Grabchenko, M.V.; Kulinich, S.A.; Vodyankina, O.V. La2O3-CeO2-Supported Bimetallic Cu-Ni DRM Catalysts. Materials 2023, 16, 7701. [Google Scholar] [CrossRef] [PubMed]
  42. Zhang, Z.; Fan, L.; Liao, W.; Zhao, F.; Tang, C.; Zhang, J.; Feng, M.; Lu, J.Q. Structure sensitivity of CuO in CO oxidation over CeO2-CuO/Cu2O catalysts. J. Catal. 2022, 405, 333–345. [Google Scholar] [CrossRef]
  43. Chang, F.; Zhang, Z.; Zhang, Y.; Liu, Y.; Yang, L.; Wang, X.; Bai, Z.; Zhang, Q. Synergistic modulation of valence state and oxygen vacancy induced by surface reconstruction of the CeO2/CuO catalyst toward enhanced electrochemical CO2 reduction. Carbon Energy 2024, 6, e588. [Google Scholar] [CrossRef]
  44. Mohana, P.; Yuvakkumar, R.; Ravi, G.; Arunmetha, S. Enhanced electrochemical performance of CuO/NiO/rGO for oxygen evolution reaction. Electrochim. Acta 2024, 473, 143464. [Google Scholar] [CrossRef]
  45. Gu, F.; Chen, K.; Du, Y.; Song, Y.; Wang, L. CeO2-NiO/N,O-rich porous carbon derived from covalent-organic framework for enhanced Li-storage. Chem. Eng. J. 2022, 442, 136298. [Google Scholar] [CrossRef]
  46. Li, W.; Song, Z.; Deng, X.; Fu, X.; Luo, J. Decoration of NiO hollow spheres composed of stacked nanosheets with CeO2 nanoparticles: Enhancement effect of CeO2 for electrocatalytic methanol oxidation. Electrochim. Acta 2020, 337, 135684. [Google Scholar] [CrossRef]
  47. Sekar, K.; Chuaicham, C.; Vellaichamy, B.; Li, W.; Zhuang, W.; Lu, X.; Ohtani, B.; Sasaki, K. Cubic Cu2O nanoparticles decorated on TiO2 nanofiber heterostructure as an excellent synergistic photocatalyst for H2 production and sulfamethoxazole degradation. Appl. Catal. B Environ. 2021, 294, 120221. [Google Scholar] [CrossRef]
  48. Park, S.; Khan, Z.; Shin, T.J.; Kim, Y.; Ko, H. Rechargeable Na/Ni batteries based on the Ni(OH)2/NiOOH redox couple with high energy density and good cycling performance. J. Mater. Chem. A 2019, 7, 1564–1573. [Google Scholar] [CrossRef]
  49. Wang, S.; Wang, W.; Zuo, J.; Qian, Y. Study of the Raman spectrum of CeO2 nanometer thin films. Mater. Chem. Phys. 2001, 68, 246–248. [Google Scholar] [CrossRef]
  50. Ma, X.C.; Yu, Z.; Zhang, Y.; Jin, J.; Li, J.; Fan, X.; Wan, Q.; Zheng, J.; Zhou, X.; Wang, Y. In situ Raman Monitoring of Surface Structures and Oxygen Species on Ni(OH)2/Au/Nickel Foam During Oxygen Evolution Reaction. J. Phys. Chem. C 2024, 128, 19736–19742. [Google Scholar] [CrossRef]
  51. Tang, C.; Sun, B.; Sun, J.; Hong, X.; Deng, Y.; Gao, F.; Dong, L. Solid state preparation of NiO-CeO2 catalyst for NO reduction. Catal. Today 2017, 281, 575–582. [Google Scholar] [CrossRef]
  52. AbdRahman, N.; Wong, K.T.; Choong, C.E.; Nah, I.; Park, C.; Kim, J.; Oh, S.; Yoon, Y.; Choi, E.; Jang, M. Revealing the roles of oxygen vacancies in NiO-CeO2 redox catalysts for electrocatalytic ozonation: Mechanistic study via in situ Raman spectroscopy. Appl. Surf. Sci. 2025, 679, 161174. [Google Scholar] [CrossRef]
  53. Ascencio, F.; Rangel-Gamboa, L.; Maqueda-Cabrera, B.; Zorrilla, C.; Herrera, R.; Cruz, R. Structural and vibrational study of porous CeO2 nanoparticles. Mater. Chem. Phys. 2024, 311, 128492. [Google Scholar] [CrossRef]
  54. Wang, H.; Guan, A.; Zhang, J.; Mi, Y.; Li, S.; Yuan, T.; Jing, C.; Zhang, L.; Zheng, G. Copper-doped nickel oxyhydroxide for efficient electrocatalytic ethanol oxidation. Chin. J. Catal. 2022, 43, 1478–1484. [Google Scholar] [CrossRef]
  55. Miao, Z.; Xu, C.; Zhan, J.; Xu, Z. Morphology-control and template-free fabrication of bimetallic Cu–Ni alloy rods for ethanol electro-oxidation in alkaline media. J. Alloys Compd. 2021, 855, 157438. [Google Scholar] [CrossRef]
  56. An, Y.; Ijaz, H.; Huang, M.; Qu, J.; Hu, S. The one-pot synthesis of CuNi nanoparticles with a Ni-rich surface for the electrocatalytic methanol oxidation reaction. Dalton Trans. 2020, 49, 1646–1651. [Google Scholar] [CrossRef]
  57. Ismail, K.M.; Hassan, S.S.; Medany, S.S.; Hefnawy, M. A novel Ni-complex nanocatalyst for efficient electrochemical oxidation of alcohol in alkaline medium: Mechanism and DFT study. Electrochim. Acta 2024, 504, 144954. [Google Scholar] [CrossRef]
  58. Raveendran, A.; Chandran, M.; Wabaidur, S.M.; Islam, M.; Dhanusuraman, R.; Ponnusamy, V. Facile electrochemical fabrication of Nickel-Coated Polydiphenylamine (Ni/PDPA) nanocomposite material as efficient anode catalyst for direct alcohol fuel cell application. Fuel 2022, 324, 124424. [Google Scholar] [CrossRef]
  59. Sieben, J.M.; Alvarez, A.E.; Sanchez, M.D. Glycerol electrooxidation on carbon-supported Pt-CuO and PtCu-CuO catalysts. Electrochim. Acta 2023, 439, 141672. [Google Scholar] [CrossRef]
Figure 1. A schematic diagram of the D-Cu40Ni20Al10Ce26Pt3Ru1 MG ribbon produced by dealloying.
Materials 18 00701 g001
Figure 2. The EOR performance of all samples. (a) CV curves of AD-Cu40Ni20Al10Ce26Pt3Ru1-3 h ribbon utilized in 1.0 M KOH and 1.0 M KOH + 1.0 M ethanol aqueous solution. (b) CV curves of all samples recorded in 1.0 M KOH + 1.0 M ethanol solution. (c) The enlarged view of the forward scan in (b) (The purple arrow represents the onset potential of AD-Cu40Ni20Al10Ce26Pt3Ru1-3 h ribbon). (d) CA curves. (e) CVs of AD-Cu40Ni20Al10Ce26Pt3Ru1-3 h ribbon performed in 1.0 M KOH at different scan rates in a potential window where no Faradaic processes occur (CVs potential range of AD-Cu40Ni20Al10Ce26Pt3Ru1 ribbon was 1.10–1.20 V and that of AD-Cu60Al10Ce26Pt3Ru1 was 1.2–1.3 V, different color lines represent different scanning rates from 10 to 100 mV/s.). (f) Charging current density differences (Δj/2 = (ja − jc)/2) plotted against scan rates: the linear slope equivalent to the double-layer capacitance, Cdl, was used to represent the ECSA. CV scan rate was 30 mV/s, and the CA test was conducted at 1.57 V.
Materials 18 00701 g002
Figure 3. Surface morphology of D-Cu40Ni20Al10Ce26Pt3Ru1 ribbon: (ae) surface SEM of D-Cu40Ni20Al10Ce26Pt3Ru1 with etching times of 0, 1, 2, 3, and 4 h; (f) SEM cross-sectional image of D-Cu40Ni20Al10Ce26Pt3Ru1-3 h ribbon; (g) SEM-mapping image of D-Cu40Ni20Al10Ce26Pt3Ru1-3 h ribbon.
Materials 18 00701 g003
Figure 4. The surface morphology of the AD-Cu40Ni20Al10Ce26Pt3Ru1-3 h ribbon: (a) an SEM image; (b) an internal SEM image of (a); (c) SEM-mapping image.
Materials 18 00701 g004
Figure 5. The XRD patterns of all samples.
Materials 18 00701 g005
Figure 6. XPS spectra of the AD-Cu40Ni20Al10Ce26Pt3Ru1-3 h ribbon before and after EOR: (a) Ni 2p, (b) Ce 3d, (c) Cu 2p, and (d) O 1s.
Materials 18 00701 g006
Figure 7. Raman spectra of the AD-Cu40Ni20Al10Ce26Pt3Ru1-3 h and AD-Cu60Al10Ce26Pt3Ru1-3 h ribbons.
Materials 18 00701 g007
Table 1. The initial potential of all electrocatalysts.
Dealloyed MG Ribbons After Activated (AD-MG Ribbons)Initial Potentials (V)
AD-Cu60Al10Ce26Pt3Ru11.511
AD-Cu40Ni20Al10Ce26Pt3Ru1-1 h1.475
AD-Cu40Ni20Al10Ce26Pt3Ru1-2 h1.469
AD-Cu40Ni20Al10Ce26Pt3Ru1-3 h1.437
AD-Cu40Ni20Al10Ce26Pt3Ru1-4 h1.473
Table 2. ICP-MS results of the 0.05 M HNO3 acid aqueous solution after dealloying.
Ion conc. */ppbNiCeCuAlPtRu
Cu40Ni20Al10Ce26Pt3Ru1
0.05 M HNO3, 3 h
42,101.2123,89684,455.710,75079.278263.962
* Ion conc.—ionic concentration. For dealloying, 0.02 g of metal ribbons were etched in 35 mL acid solutions.
Disclaimer/Publisher’s Note: The statements, opinions and data contained in all publications are solely those of the individual author(s) and contributor(s) and not of MDPI and/or the editor(s). MDPI and/or the editor(s) disclaim responsibility for any injury to people or property resulting from any ideas, methods, instructions or products referred to in the content.

