
Study on the Grain Growth Behavior of Ultra-High Strength Stainless Steel

 ,
, 
Abstract
:1. Introduction
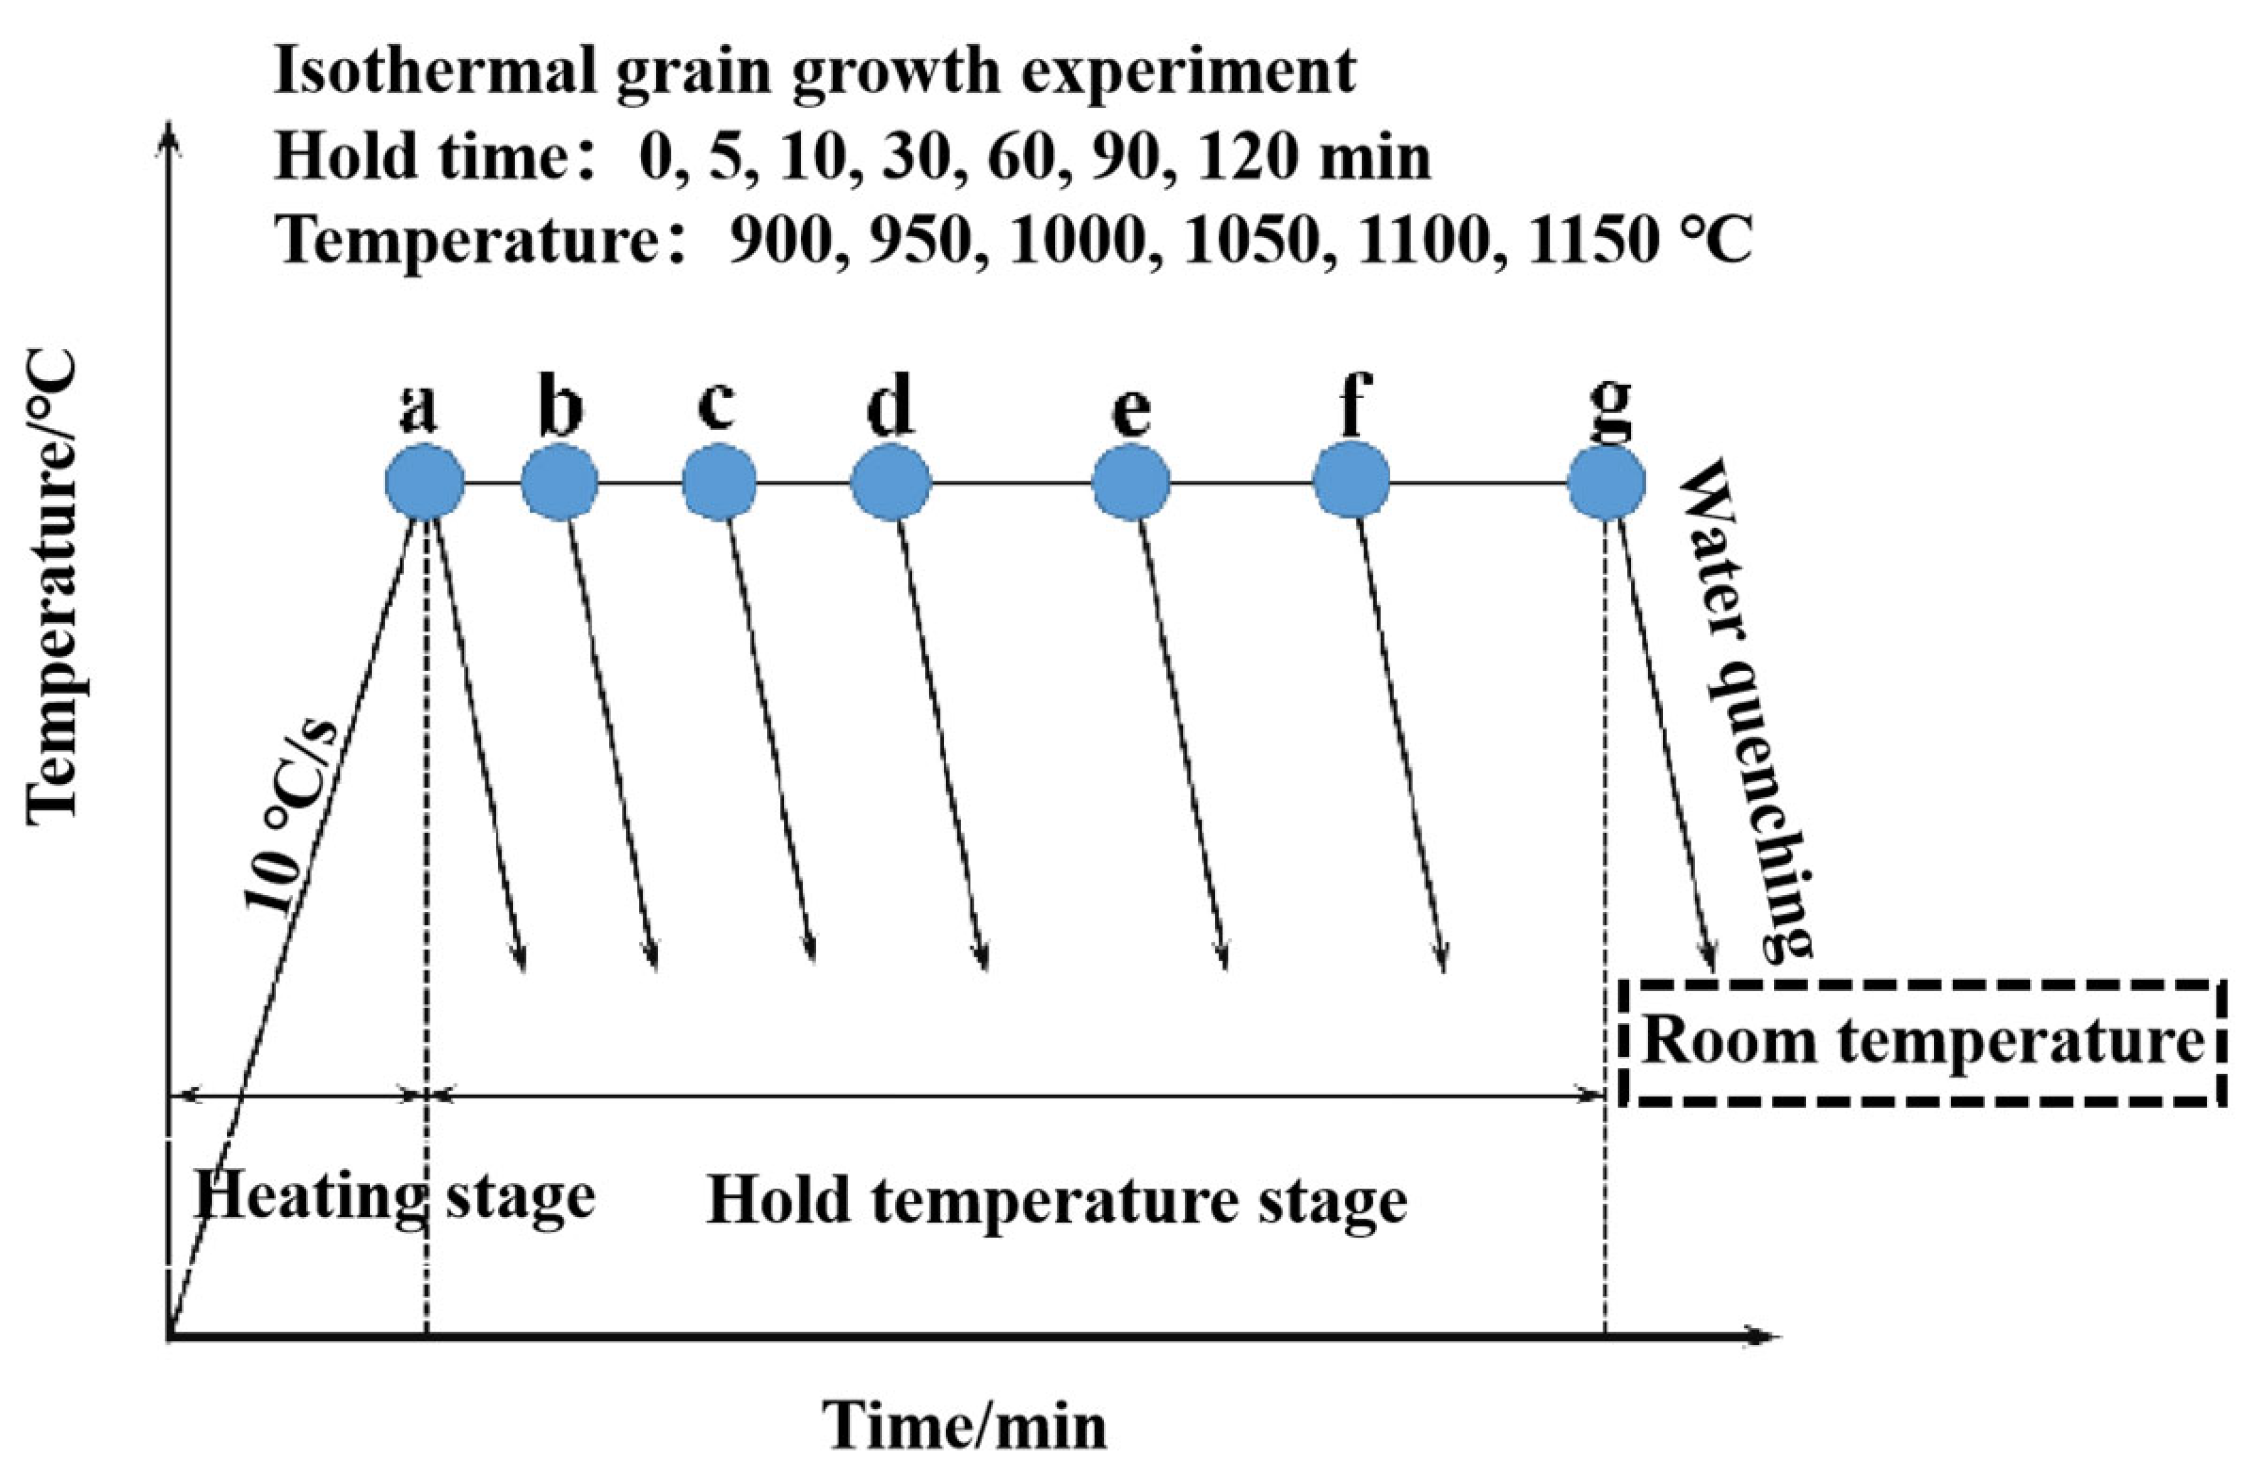
2. Experiments
3. Results and Analysis
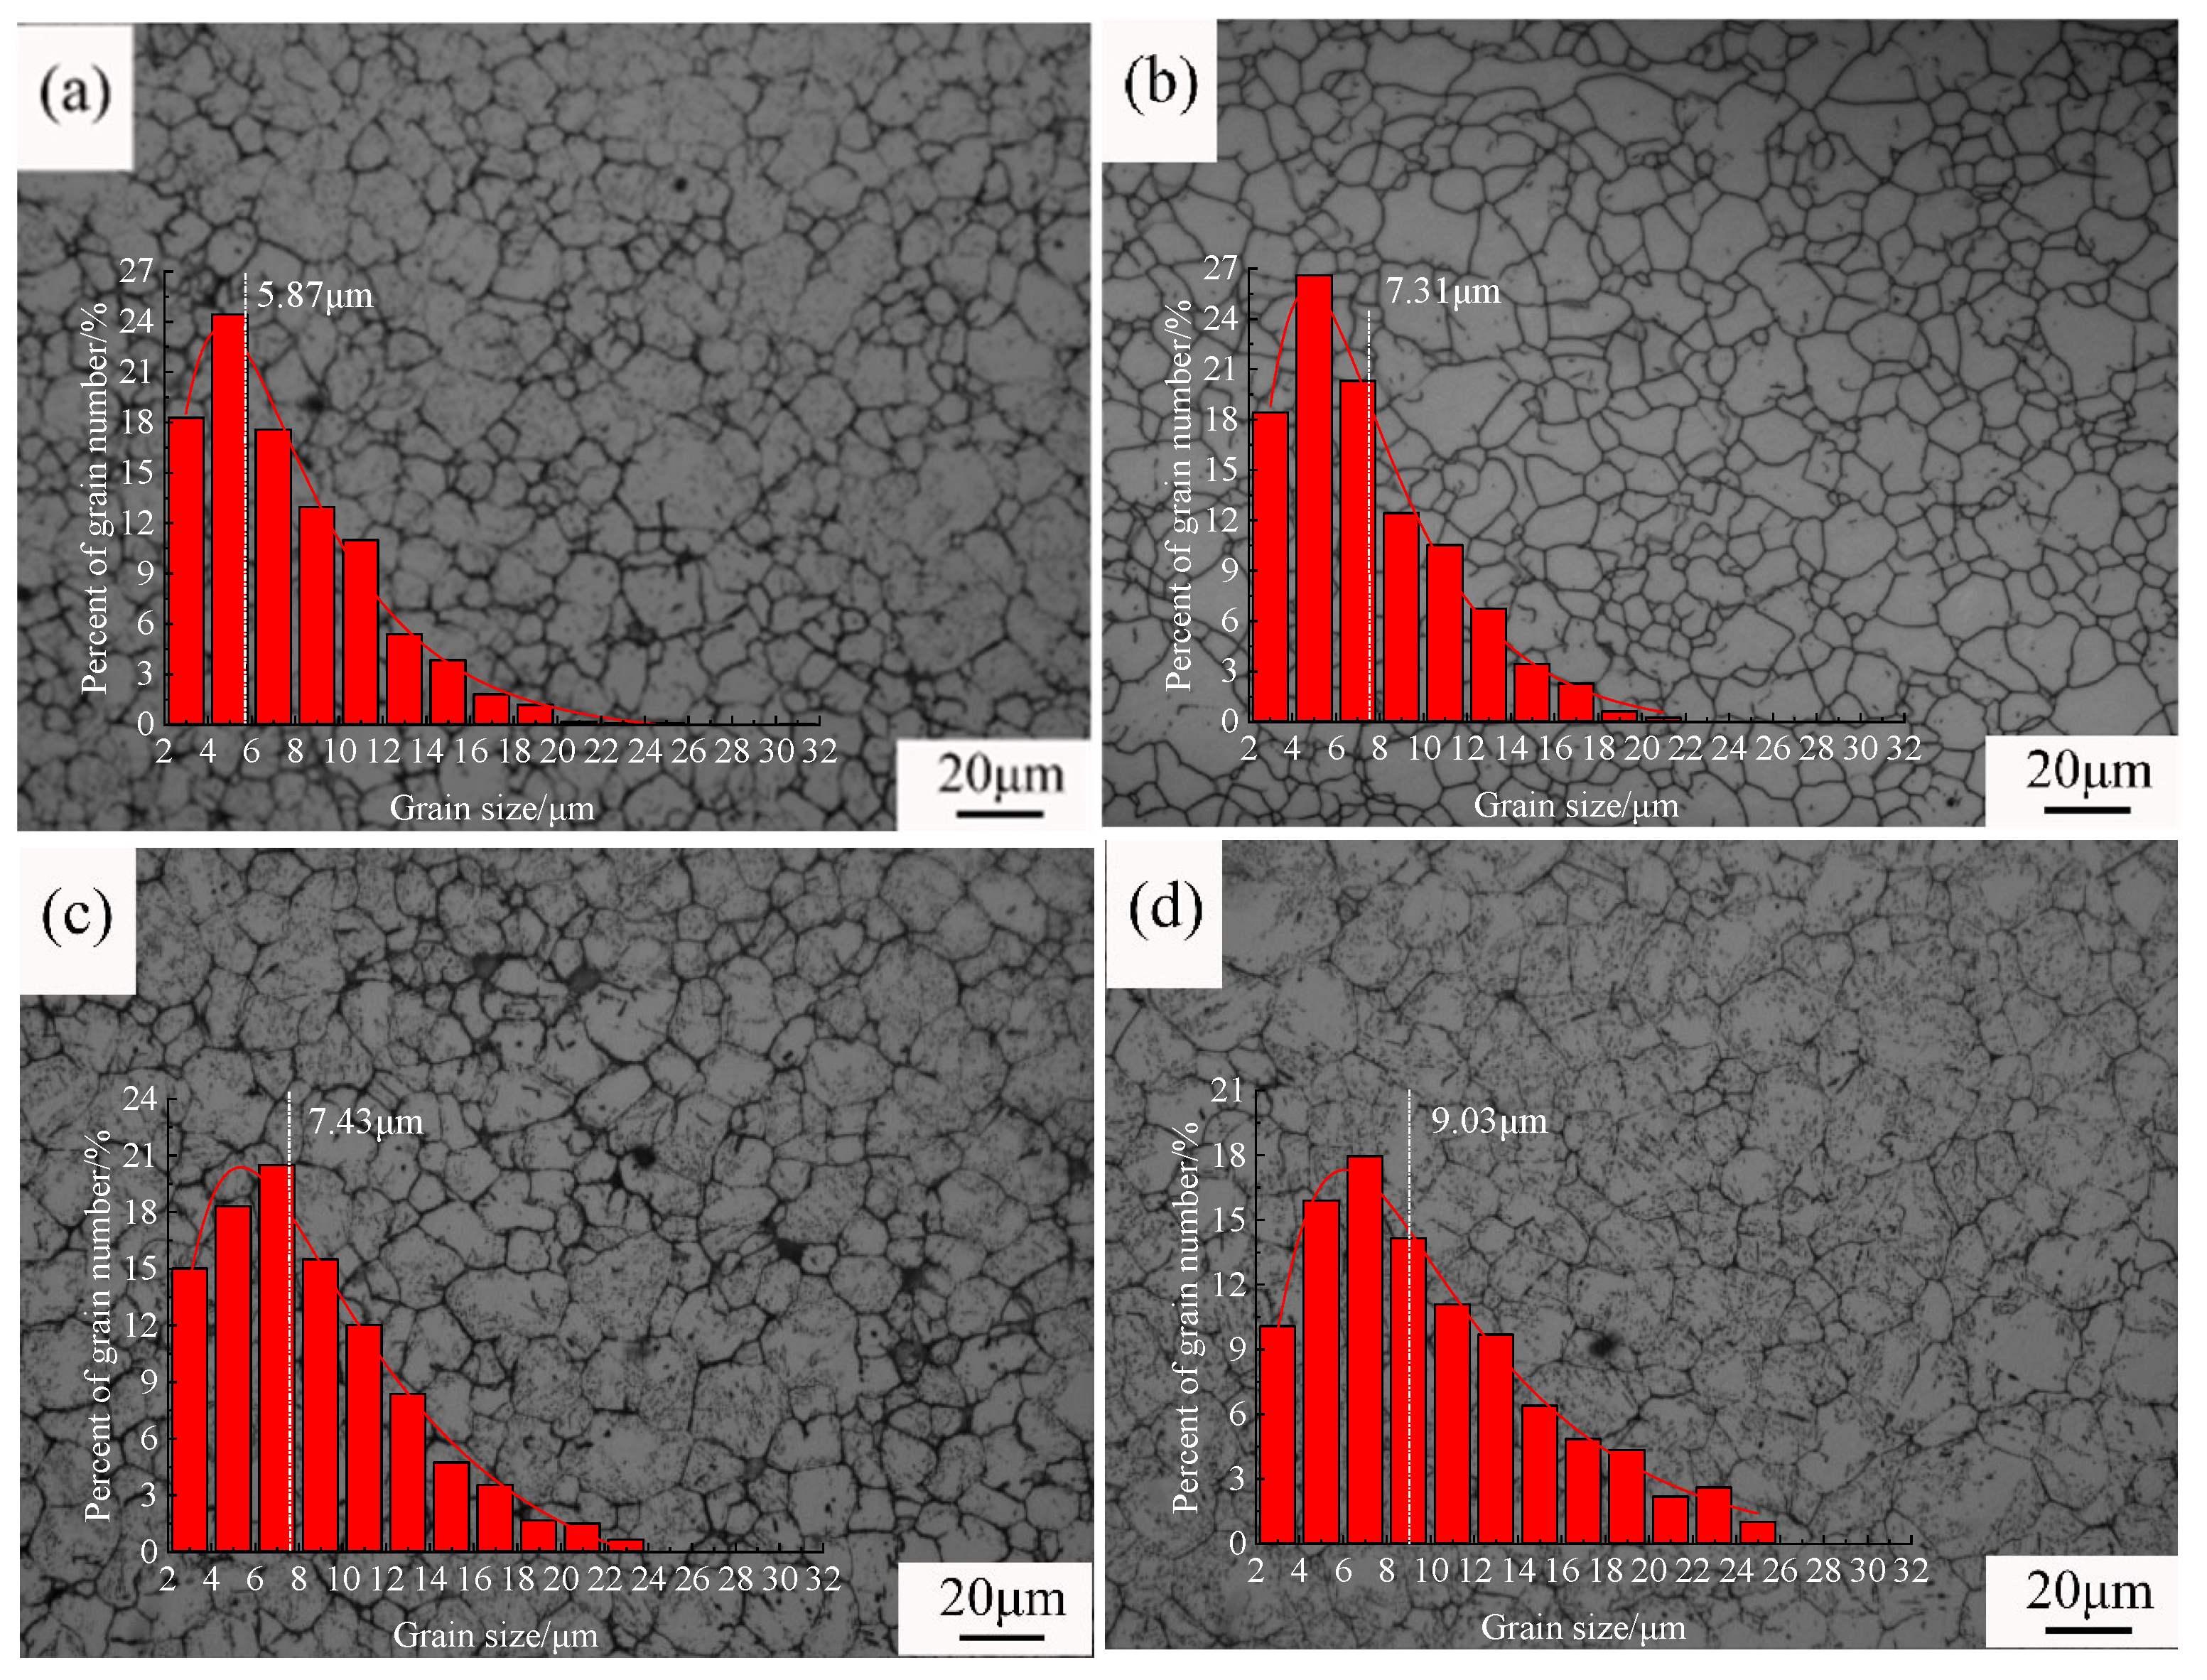
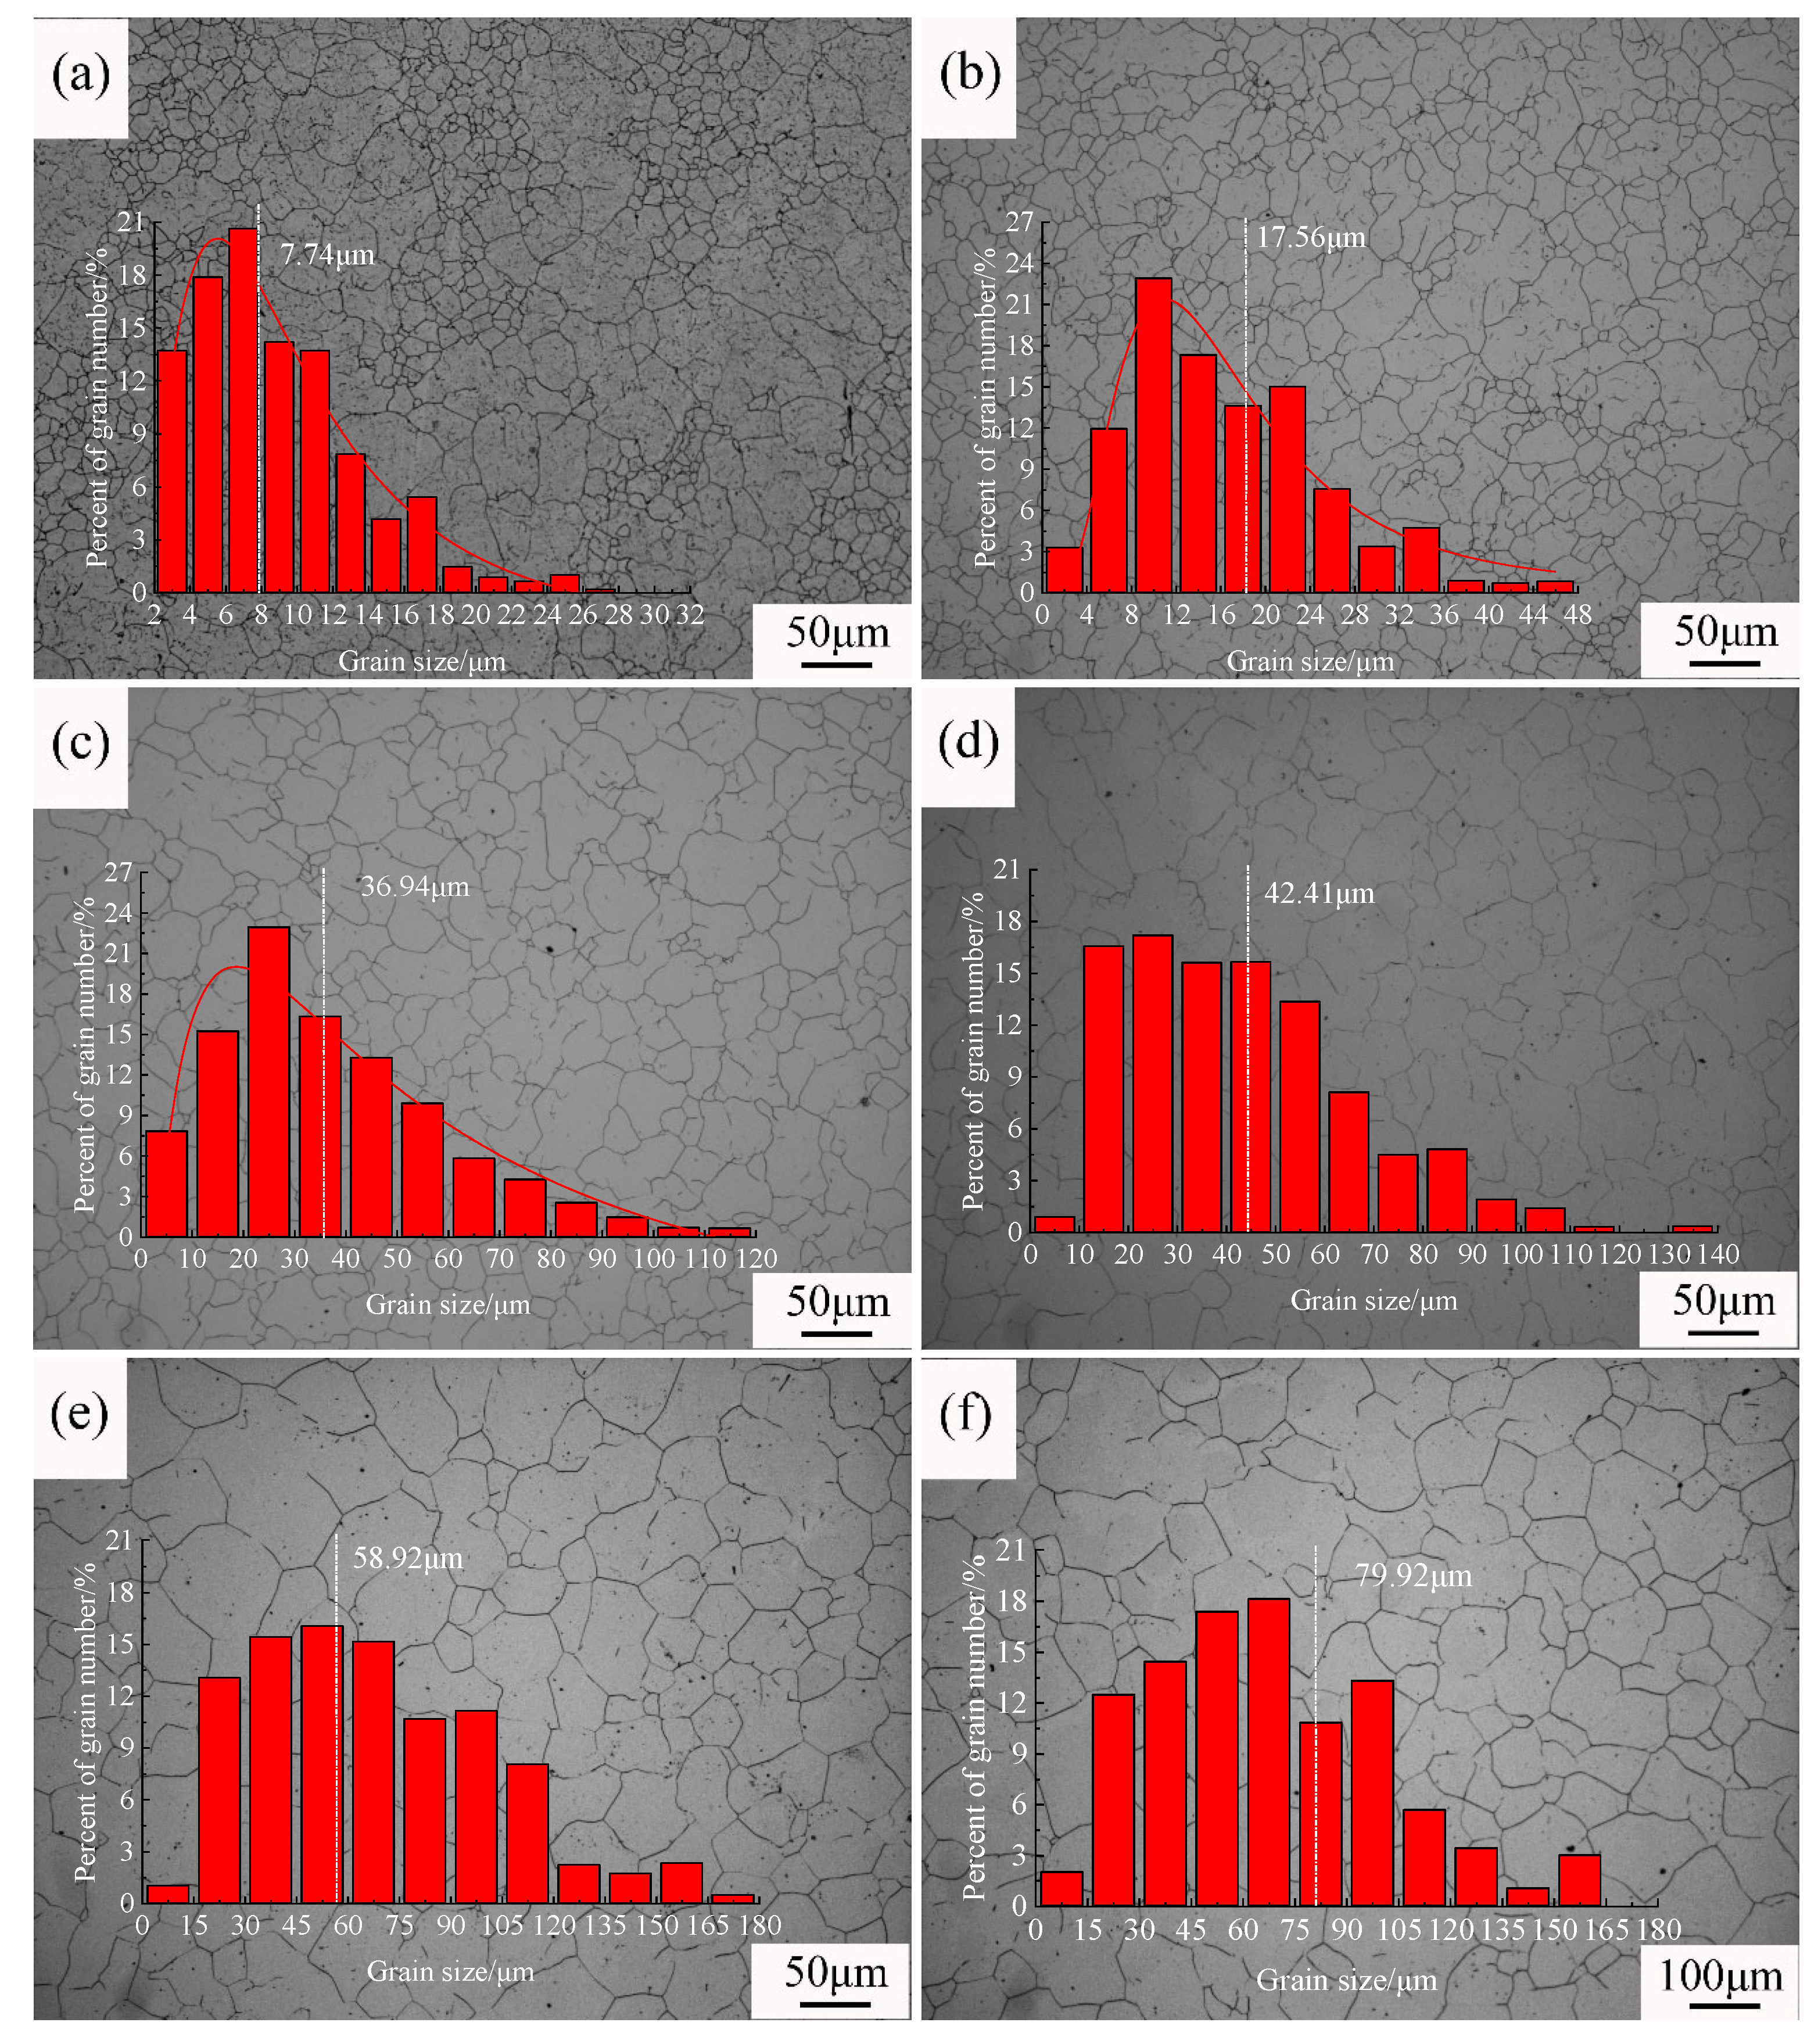
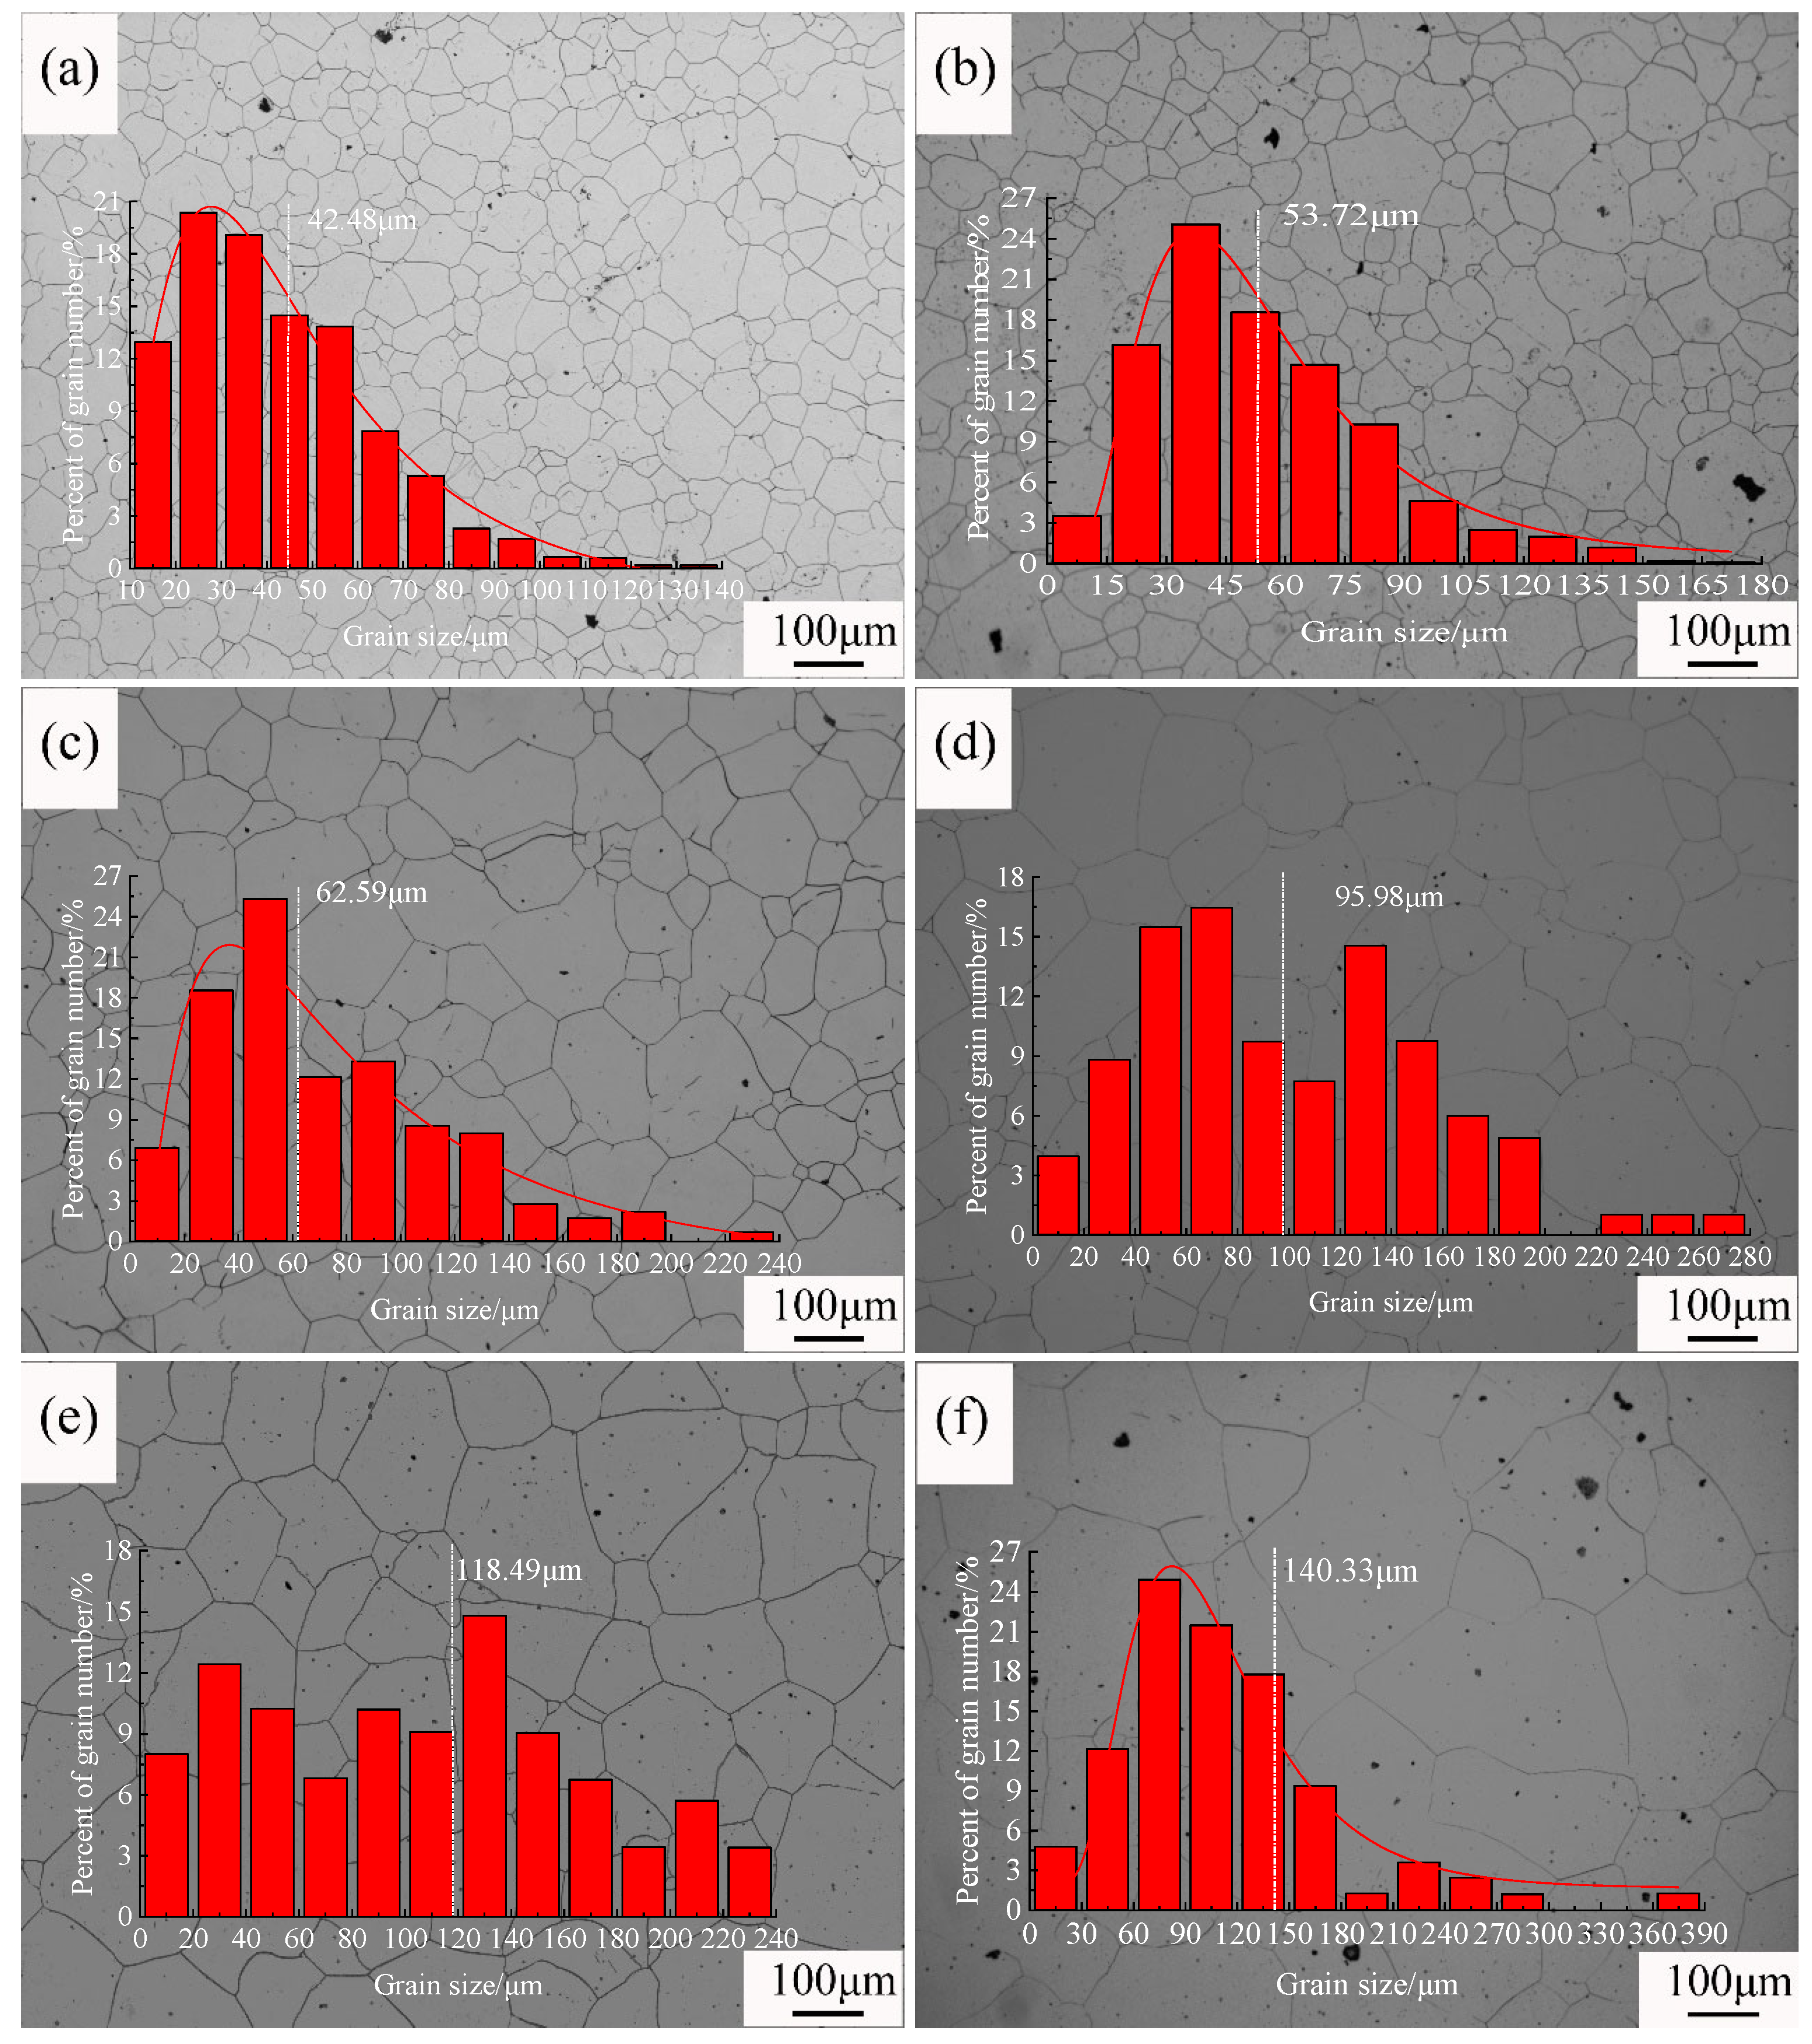
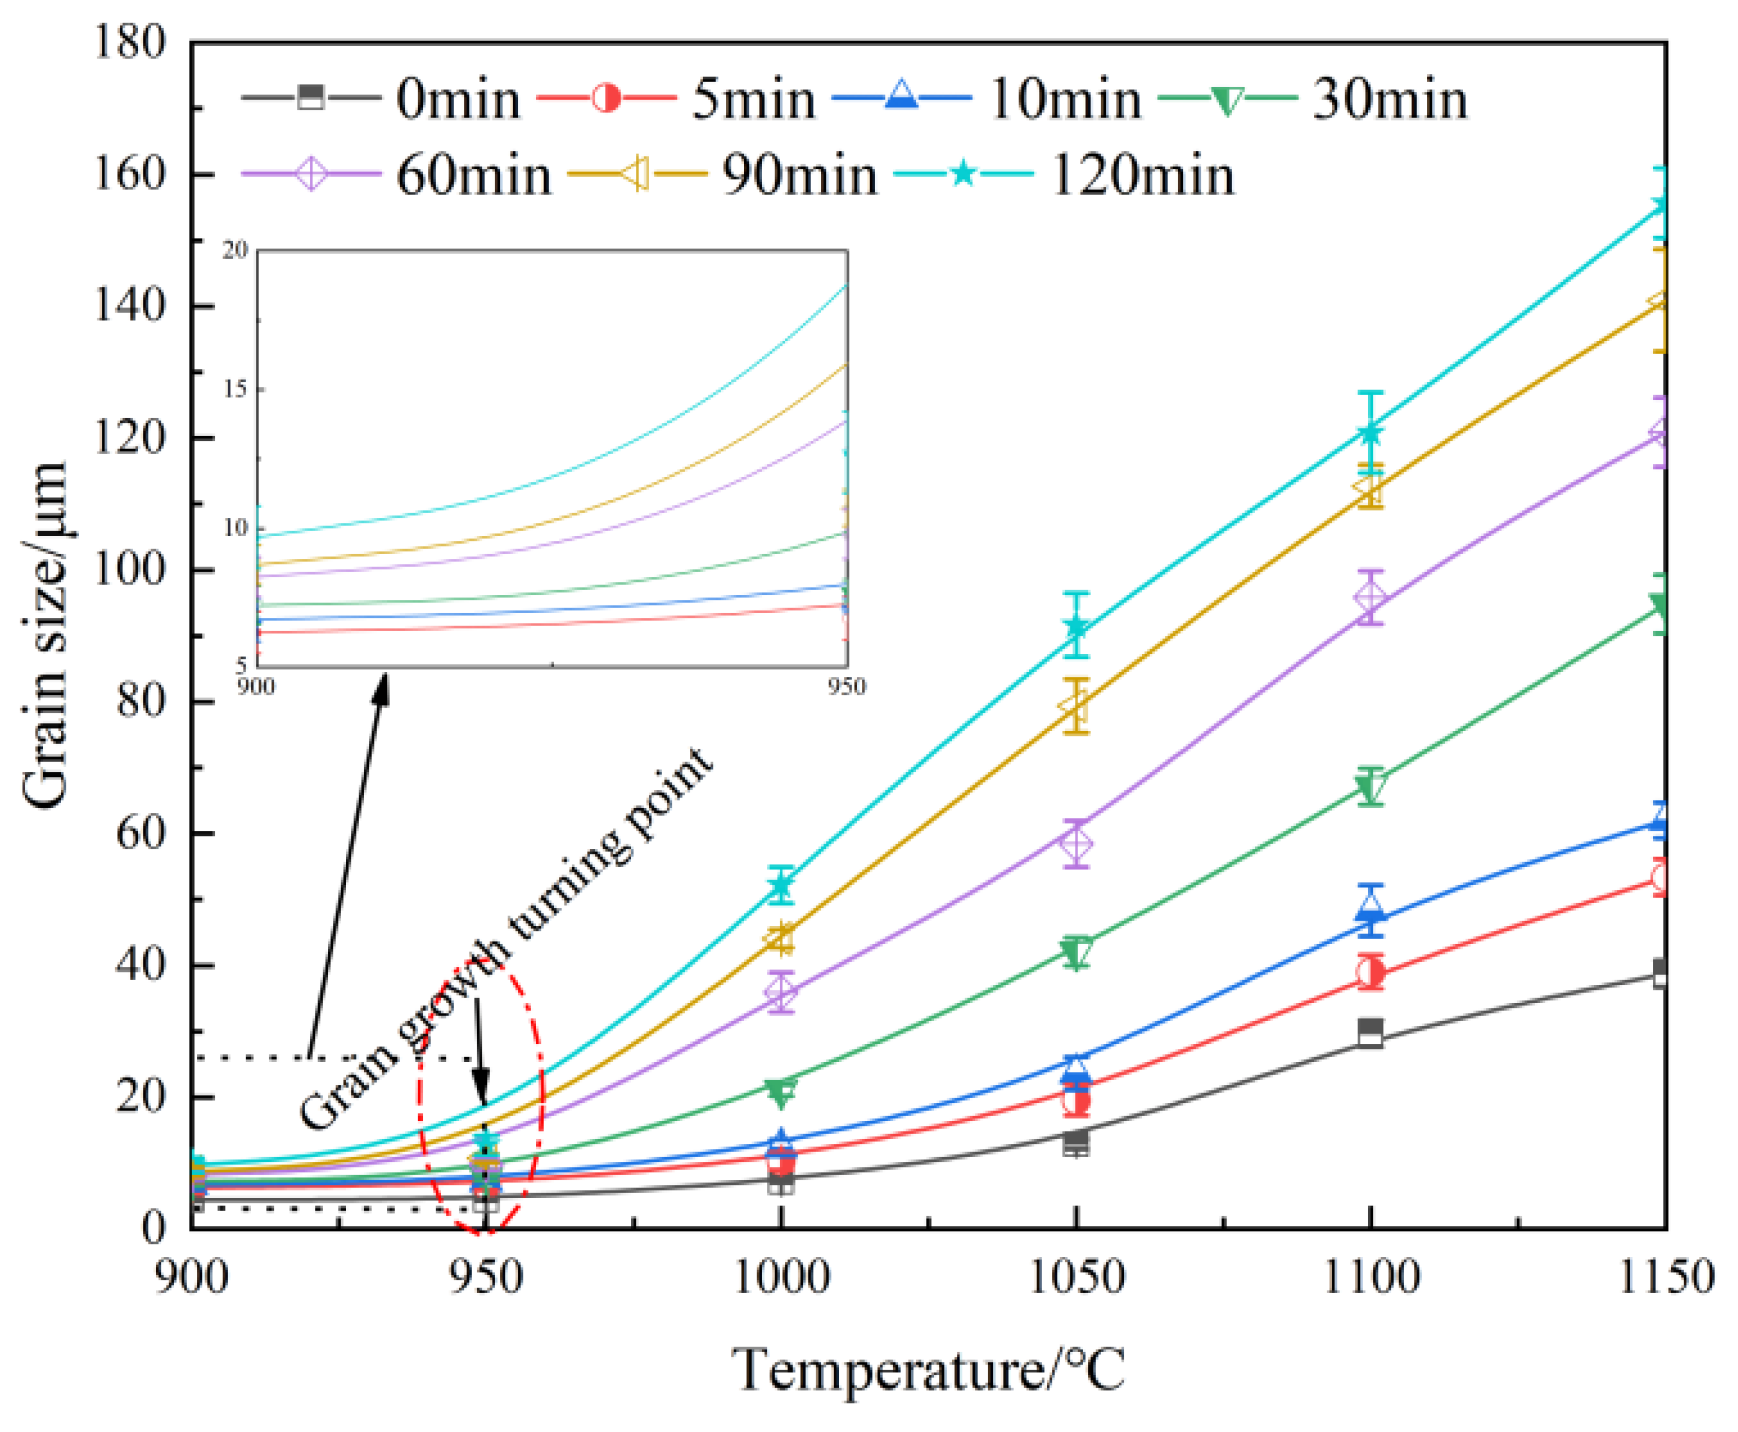
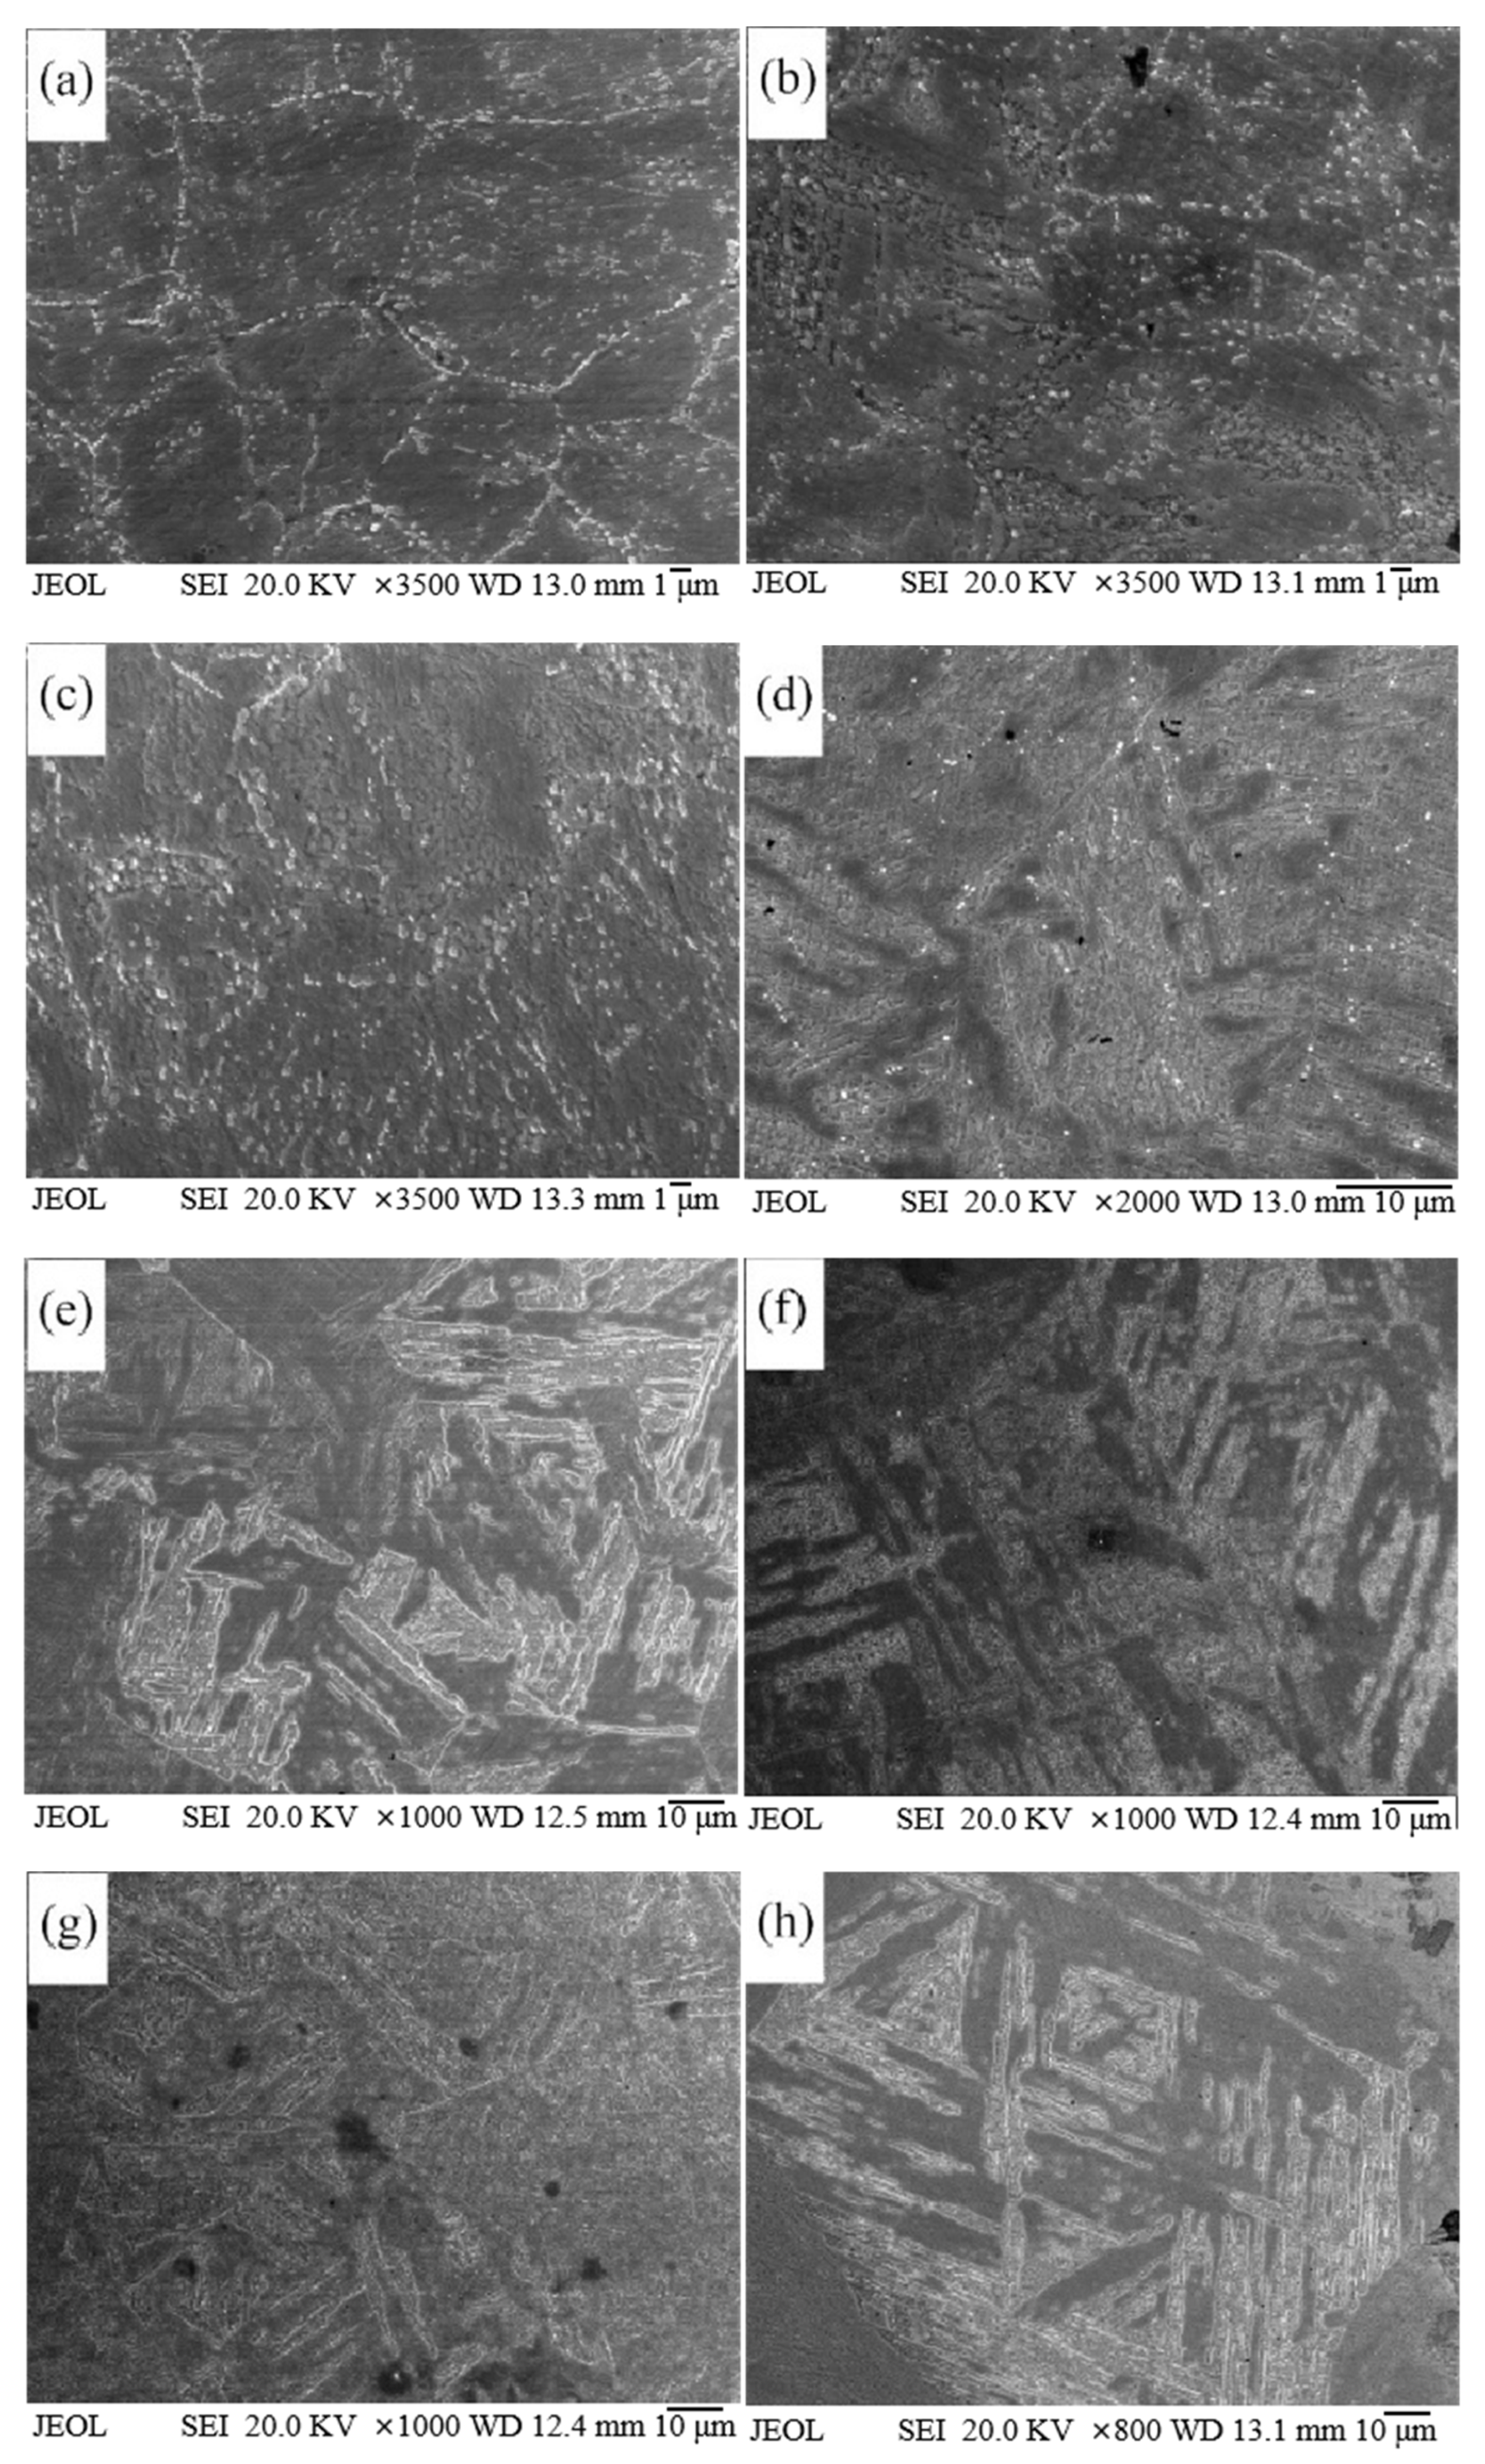
3.1. The Influence of Holding Temperature and Time on the Original Austenite Grains
3.2. The Influence of Holding Temperature and Time on the Second Phase
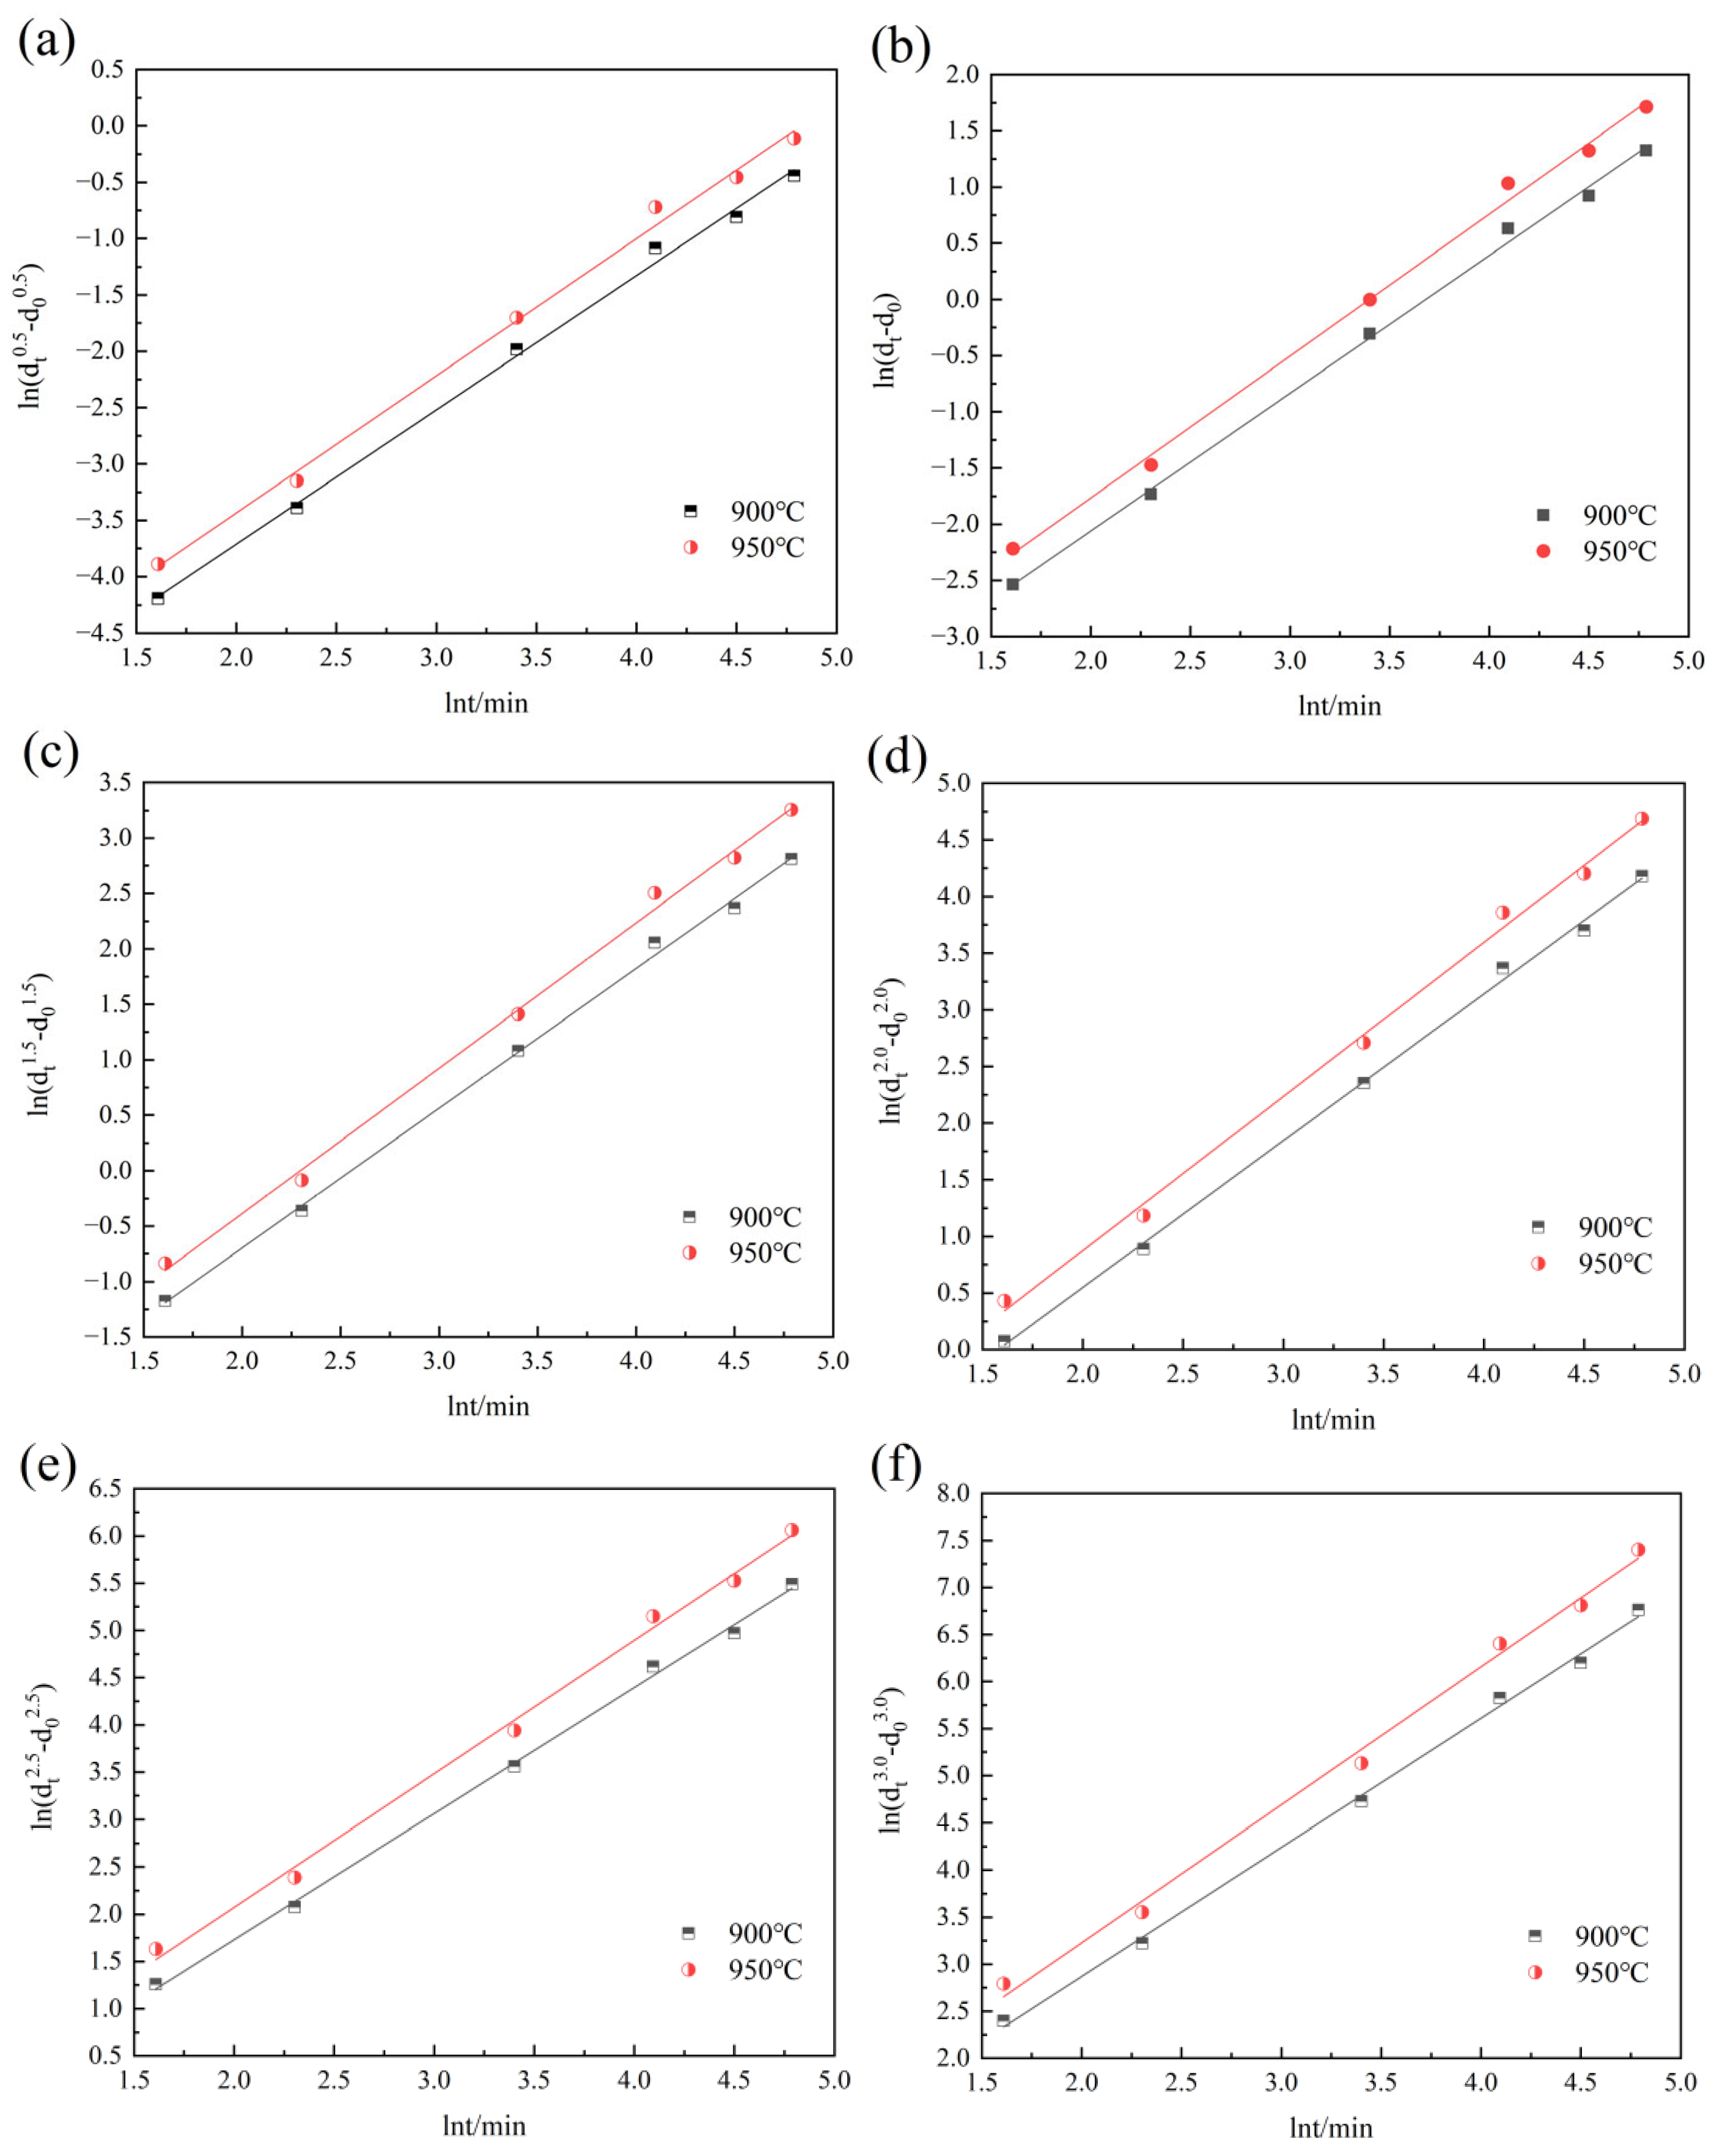
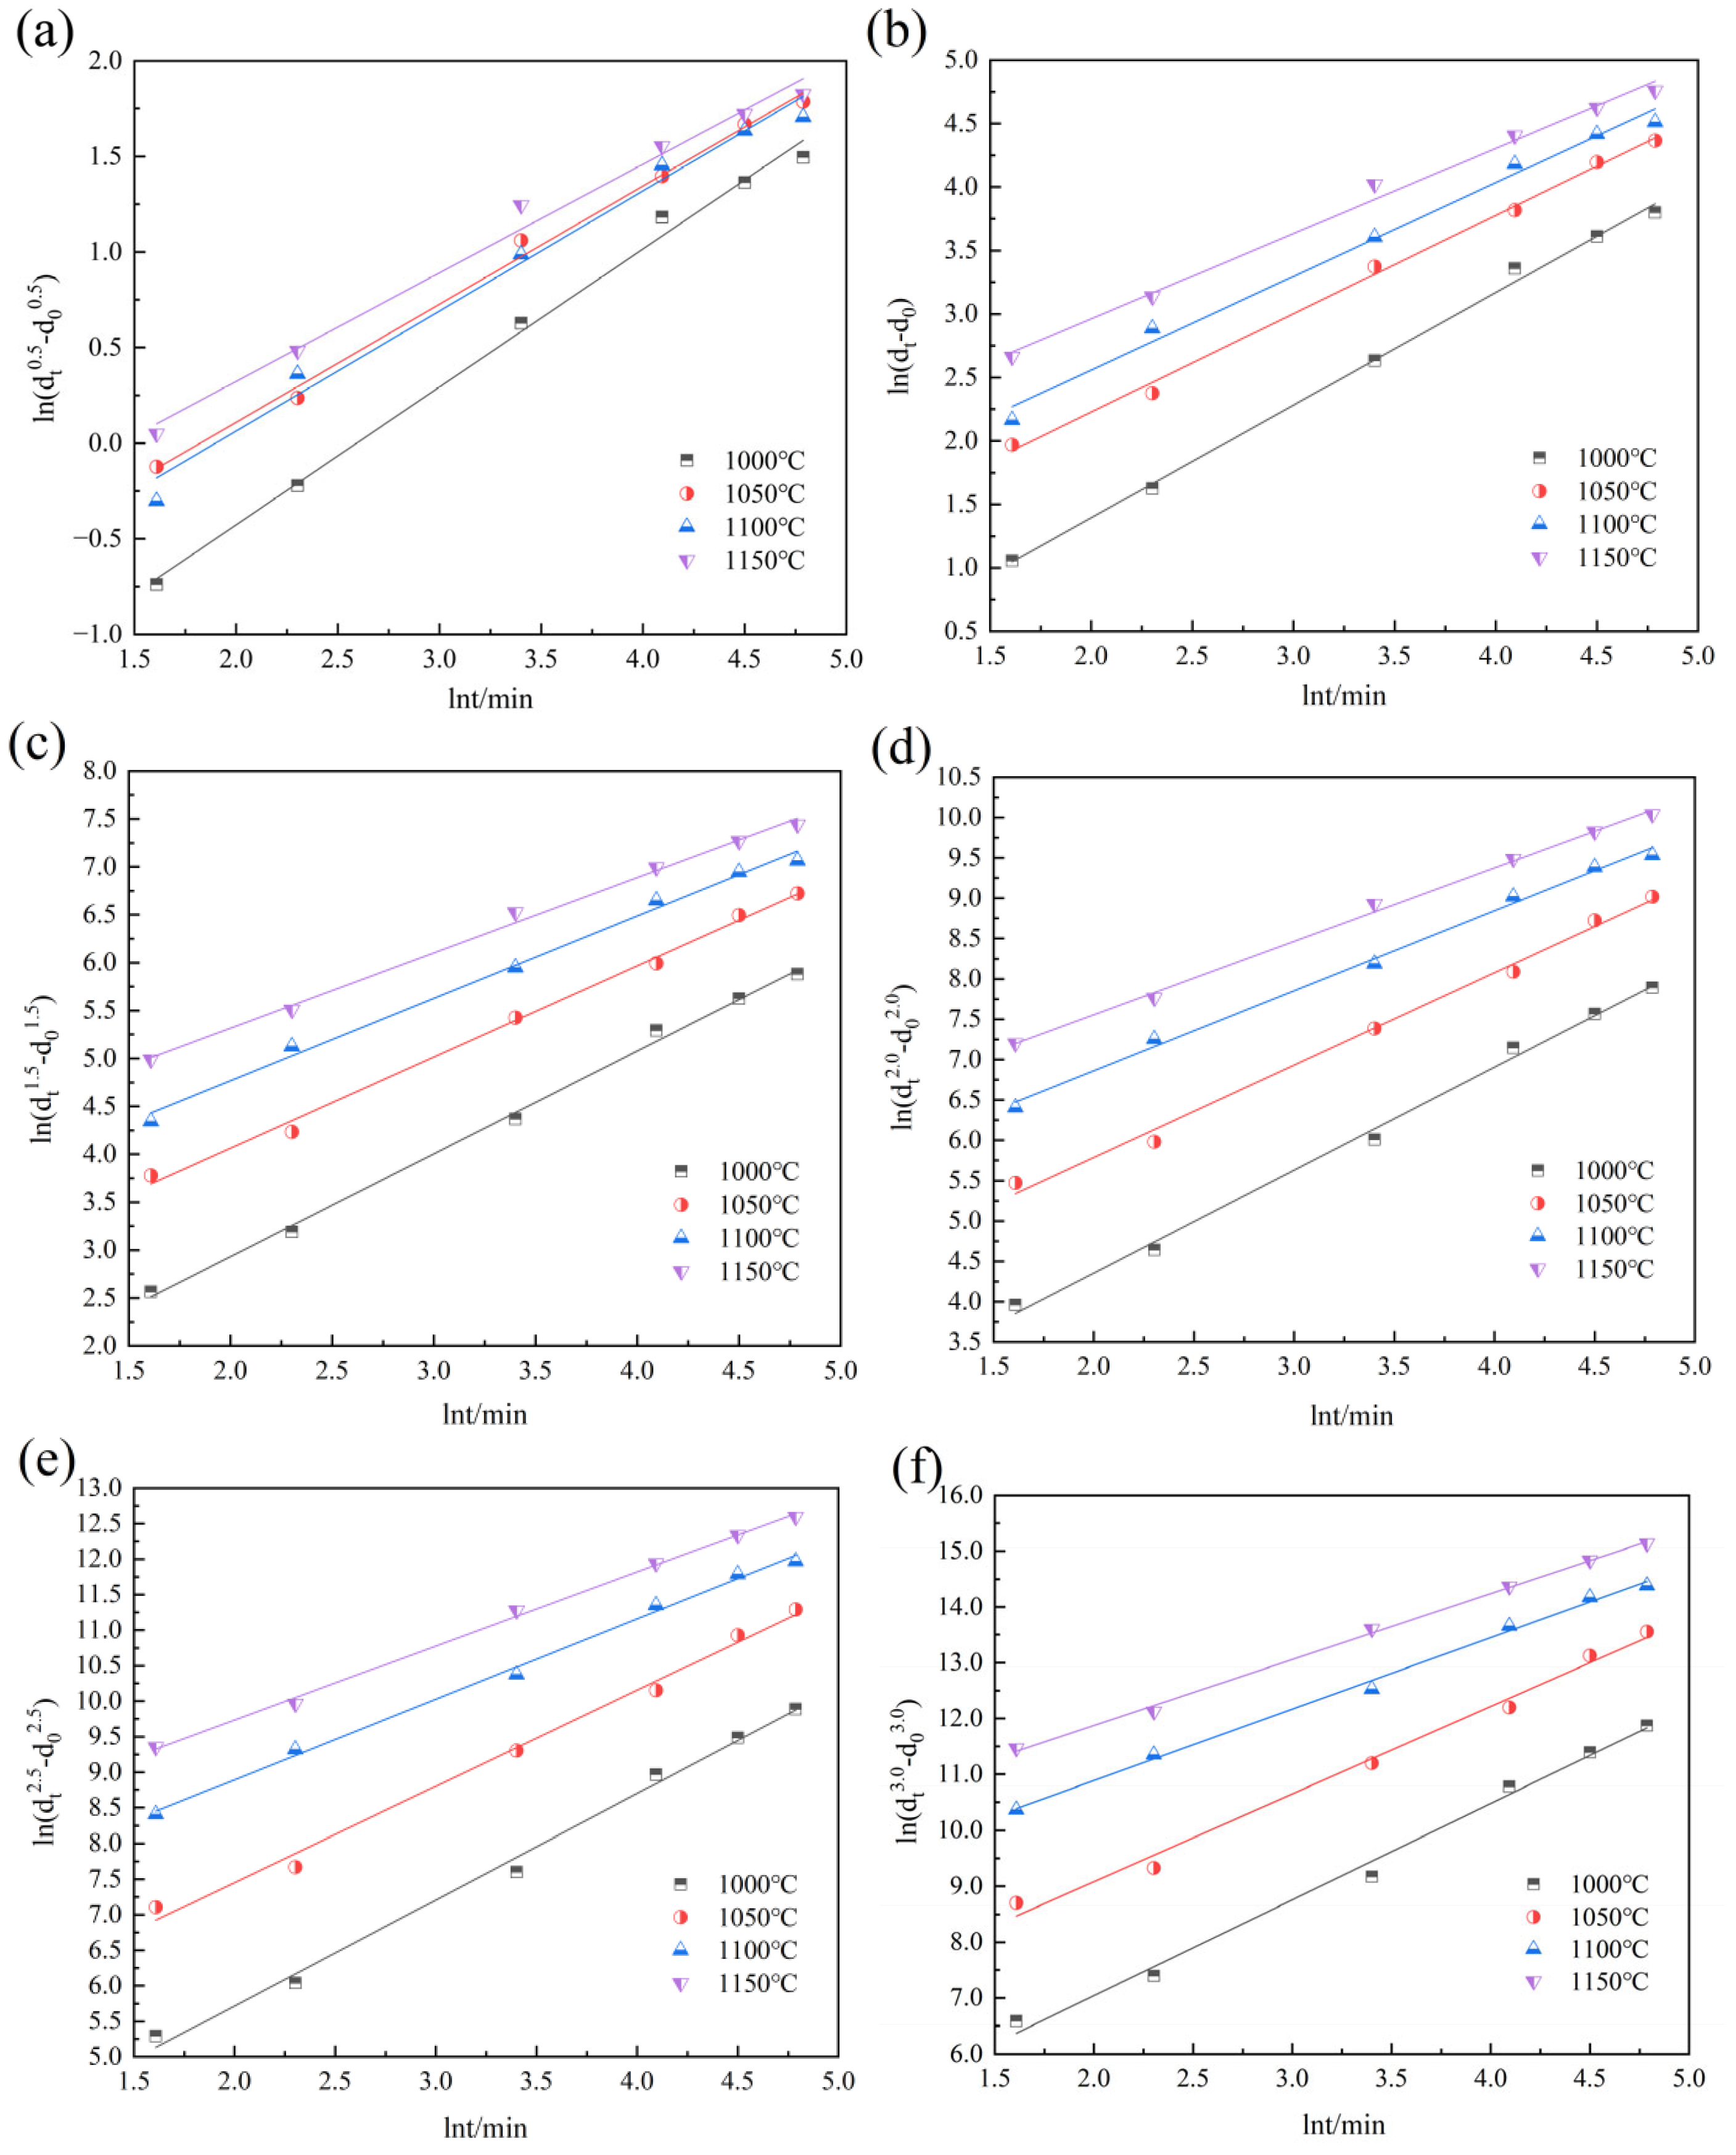
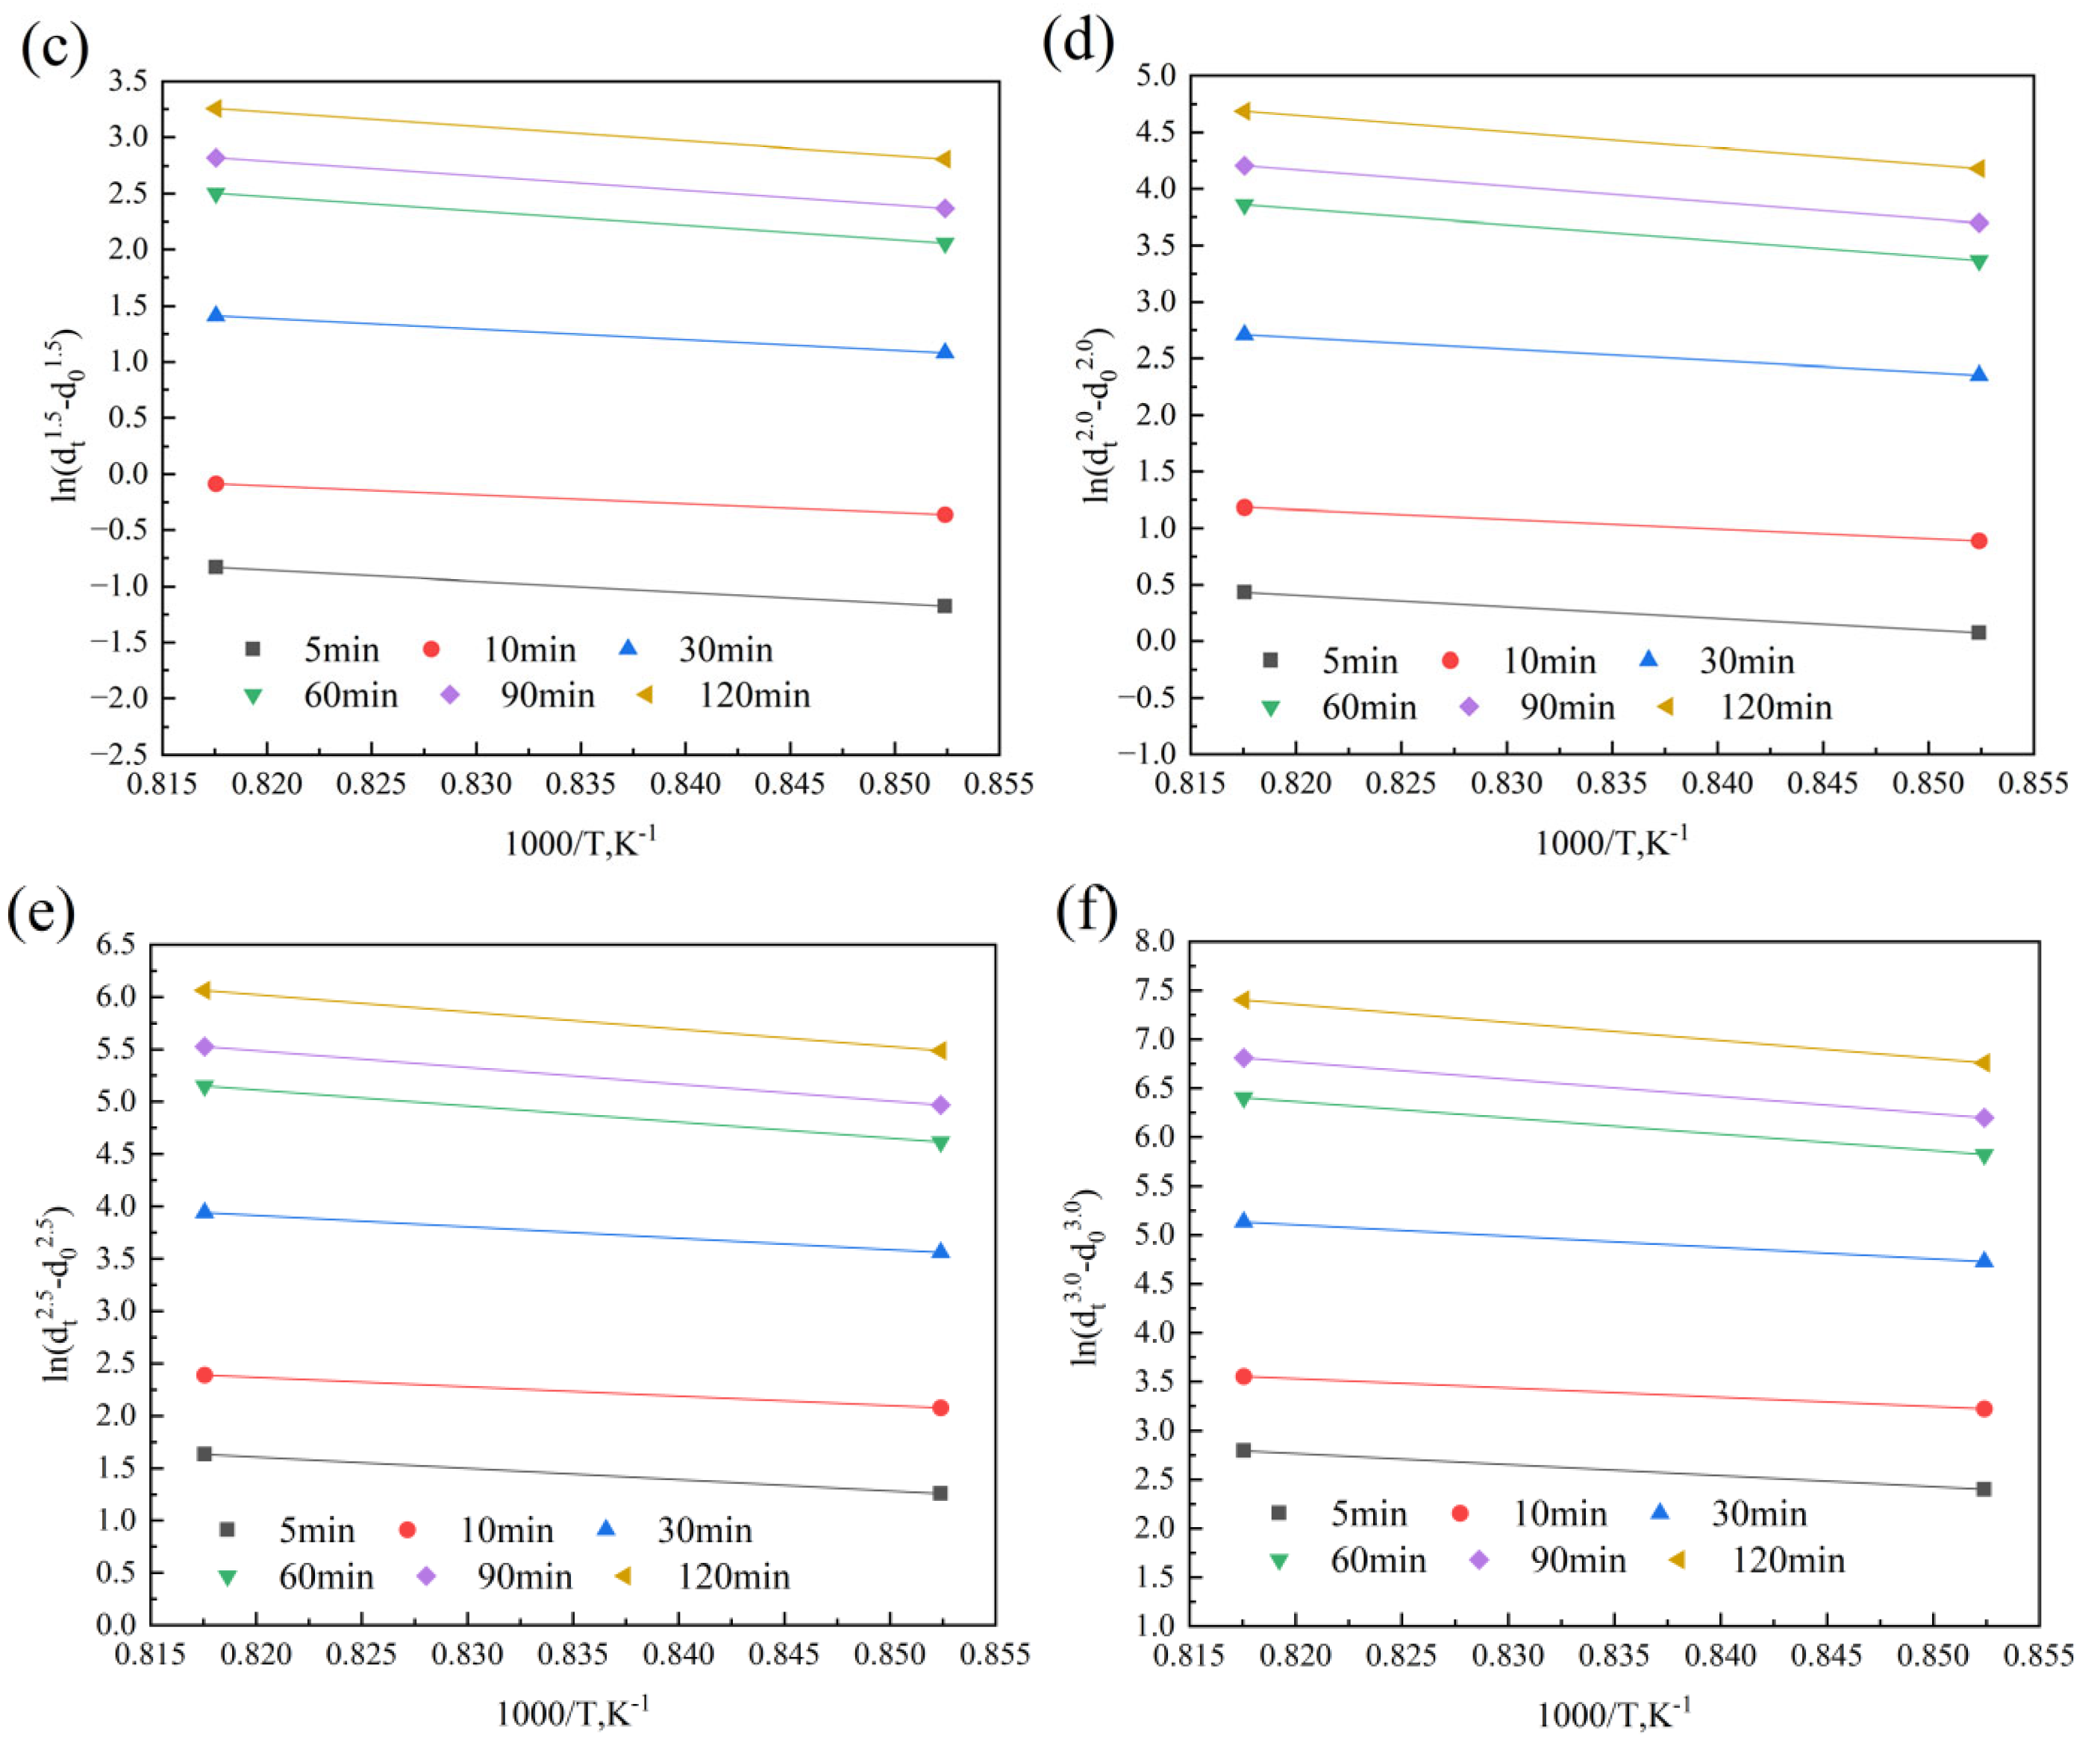
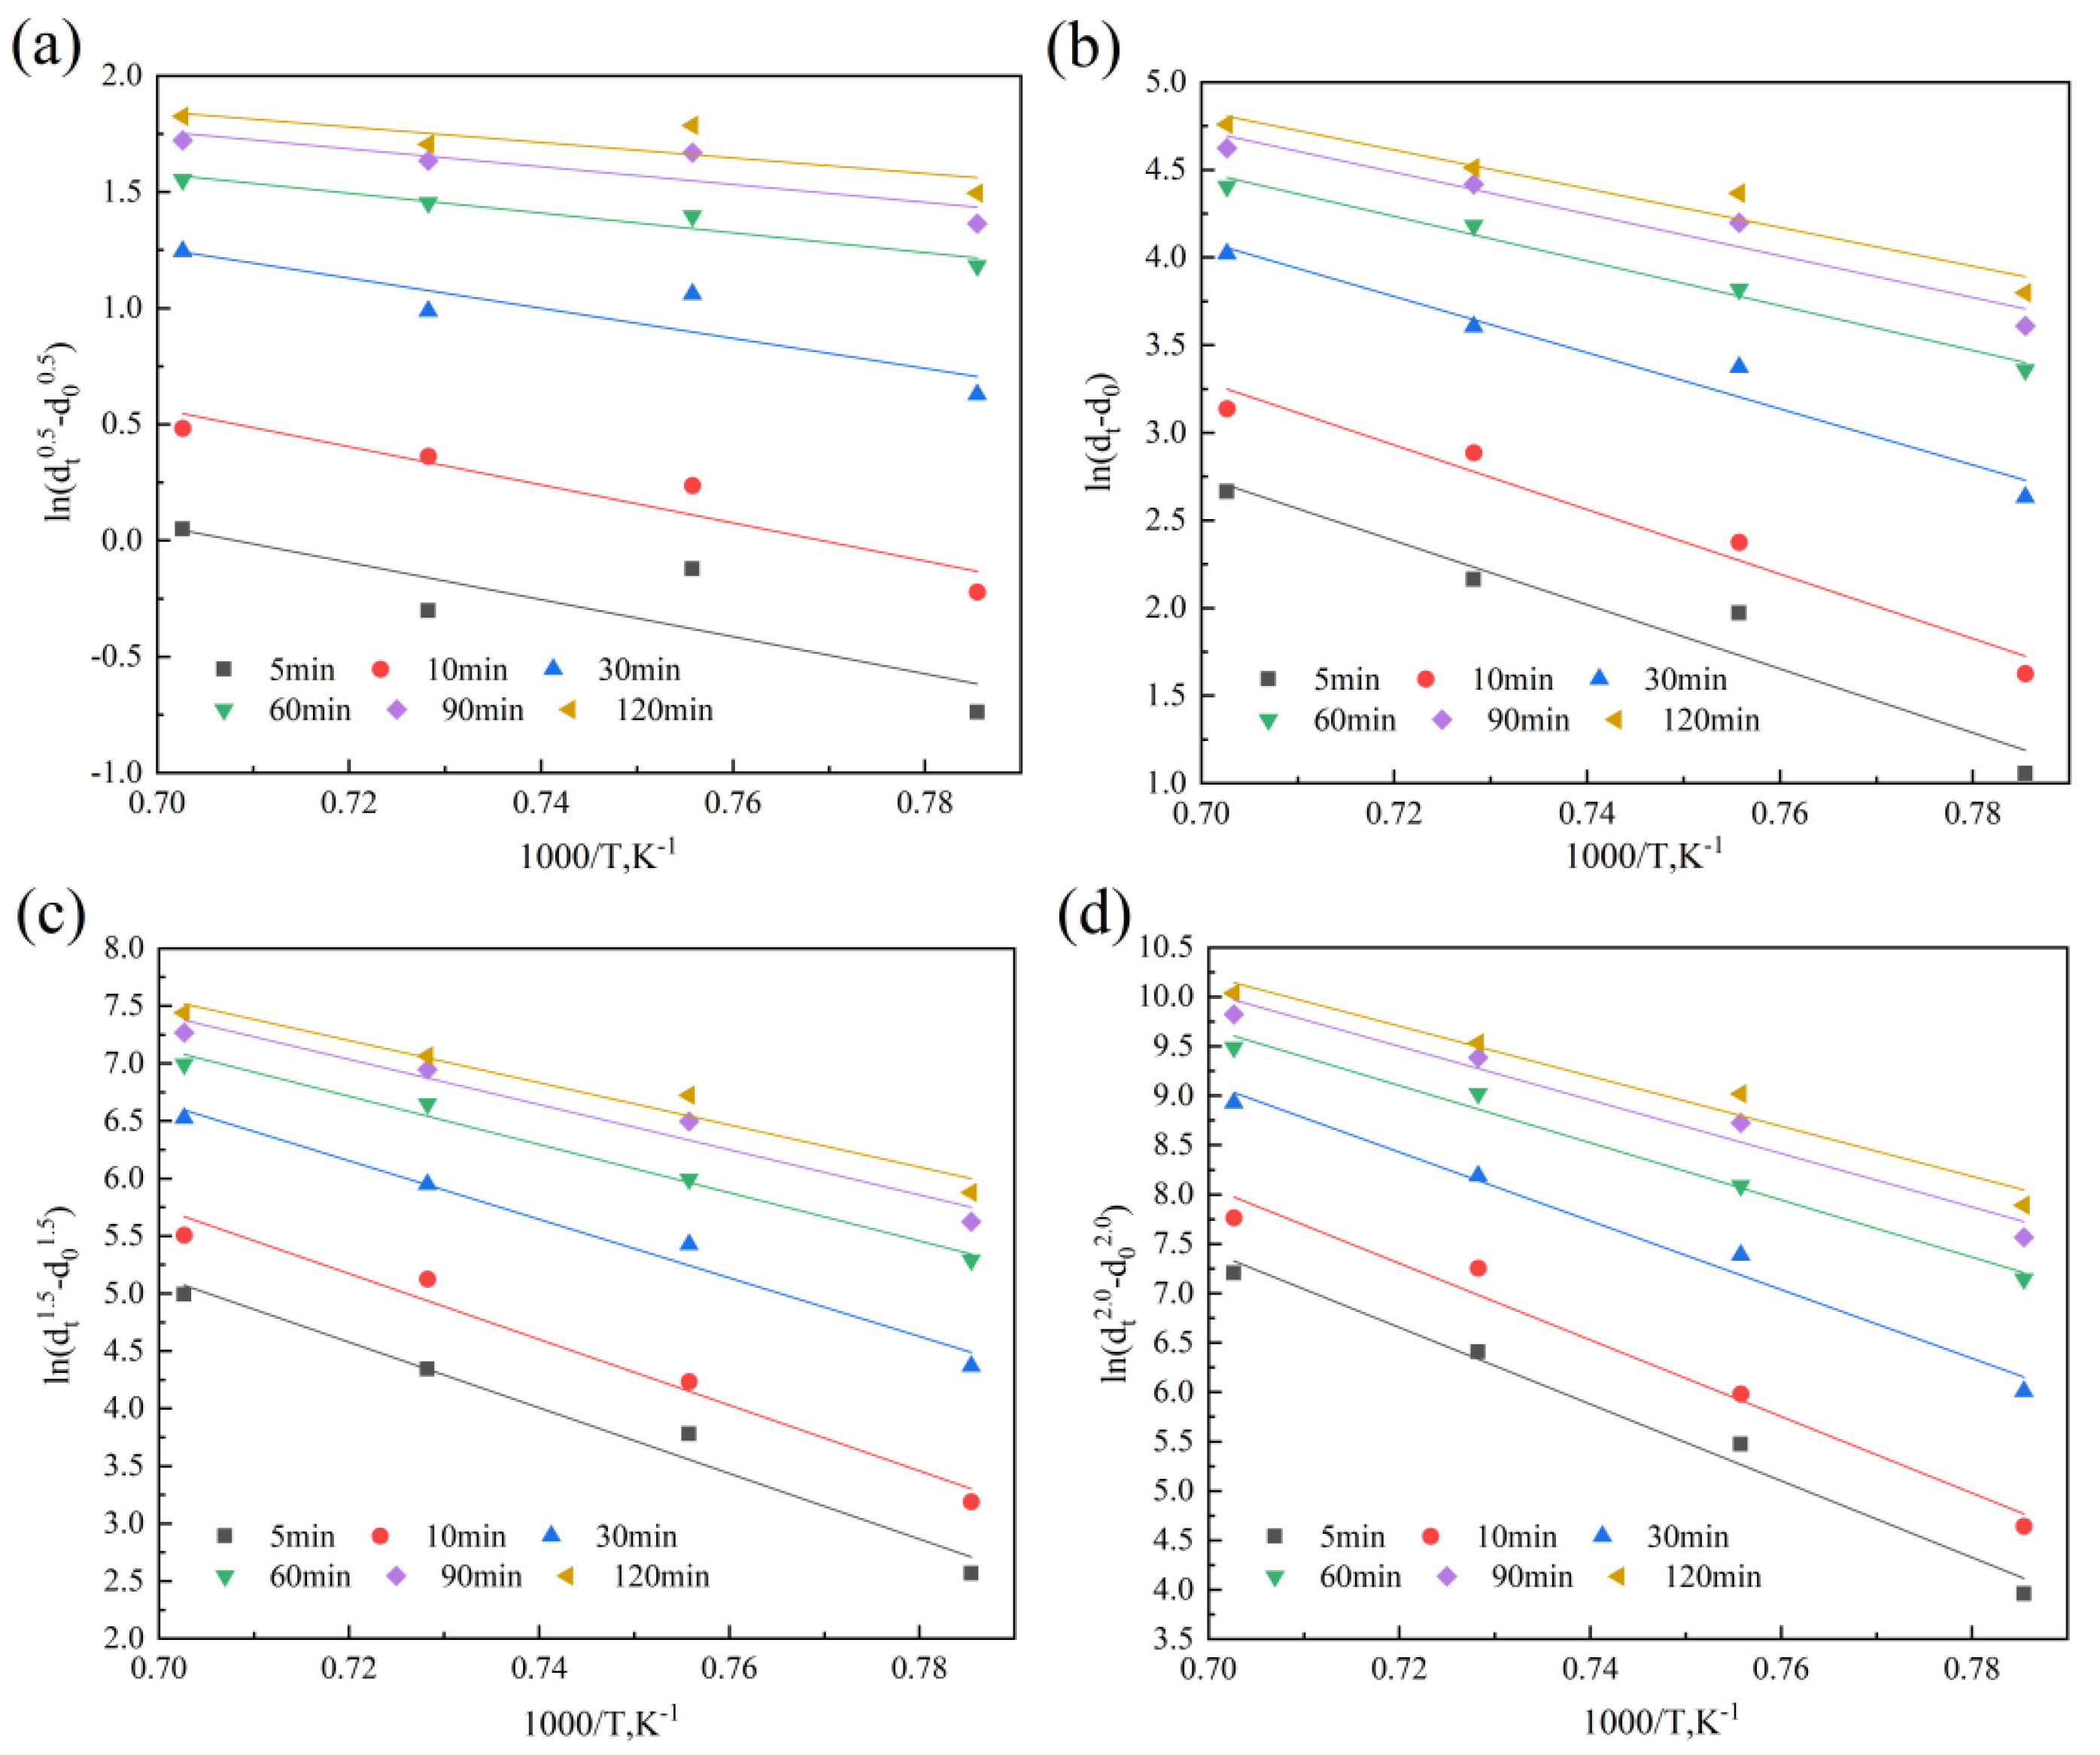
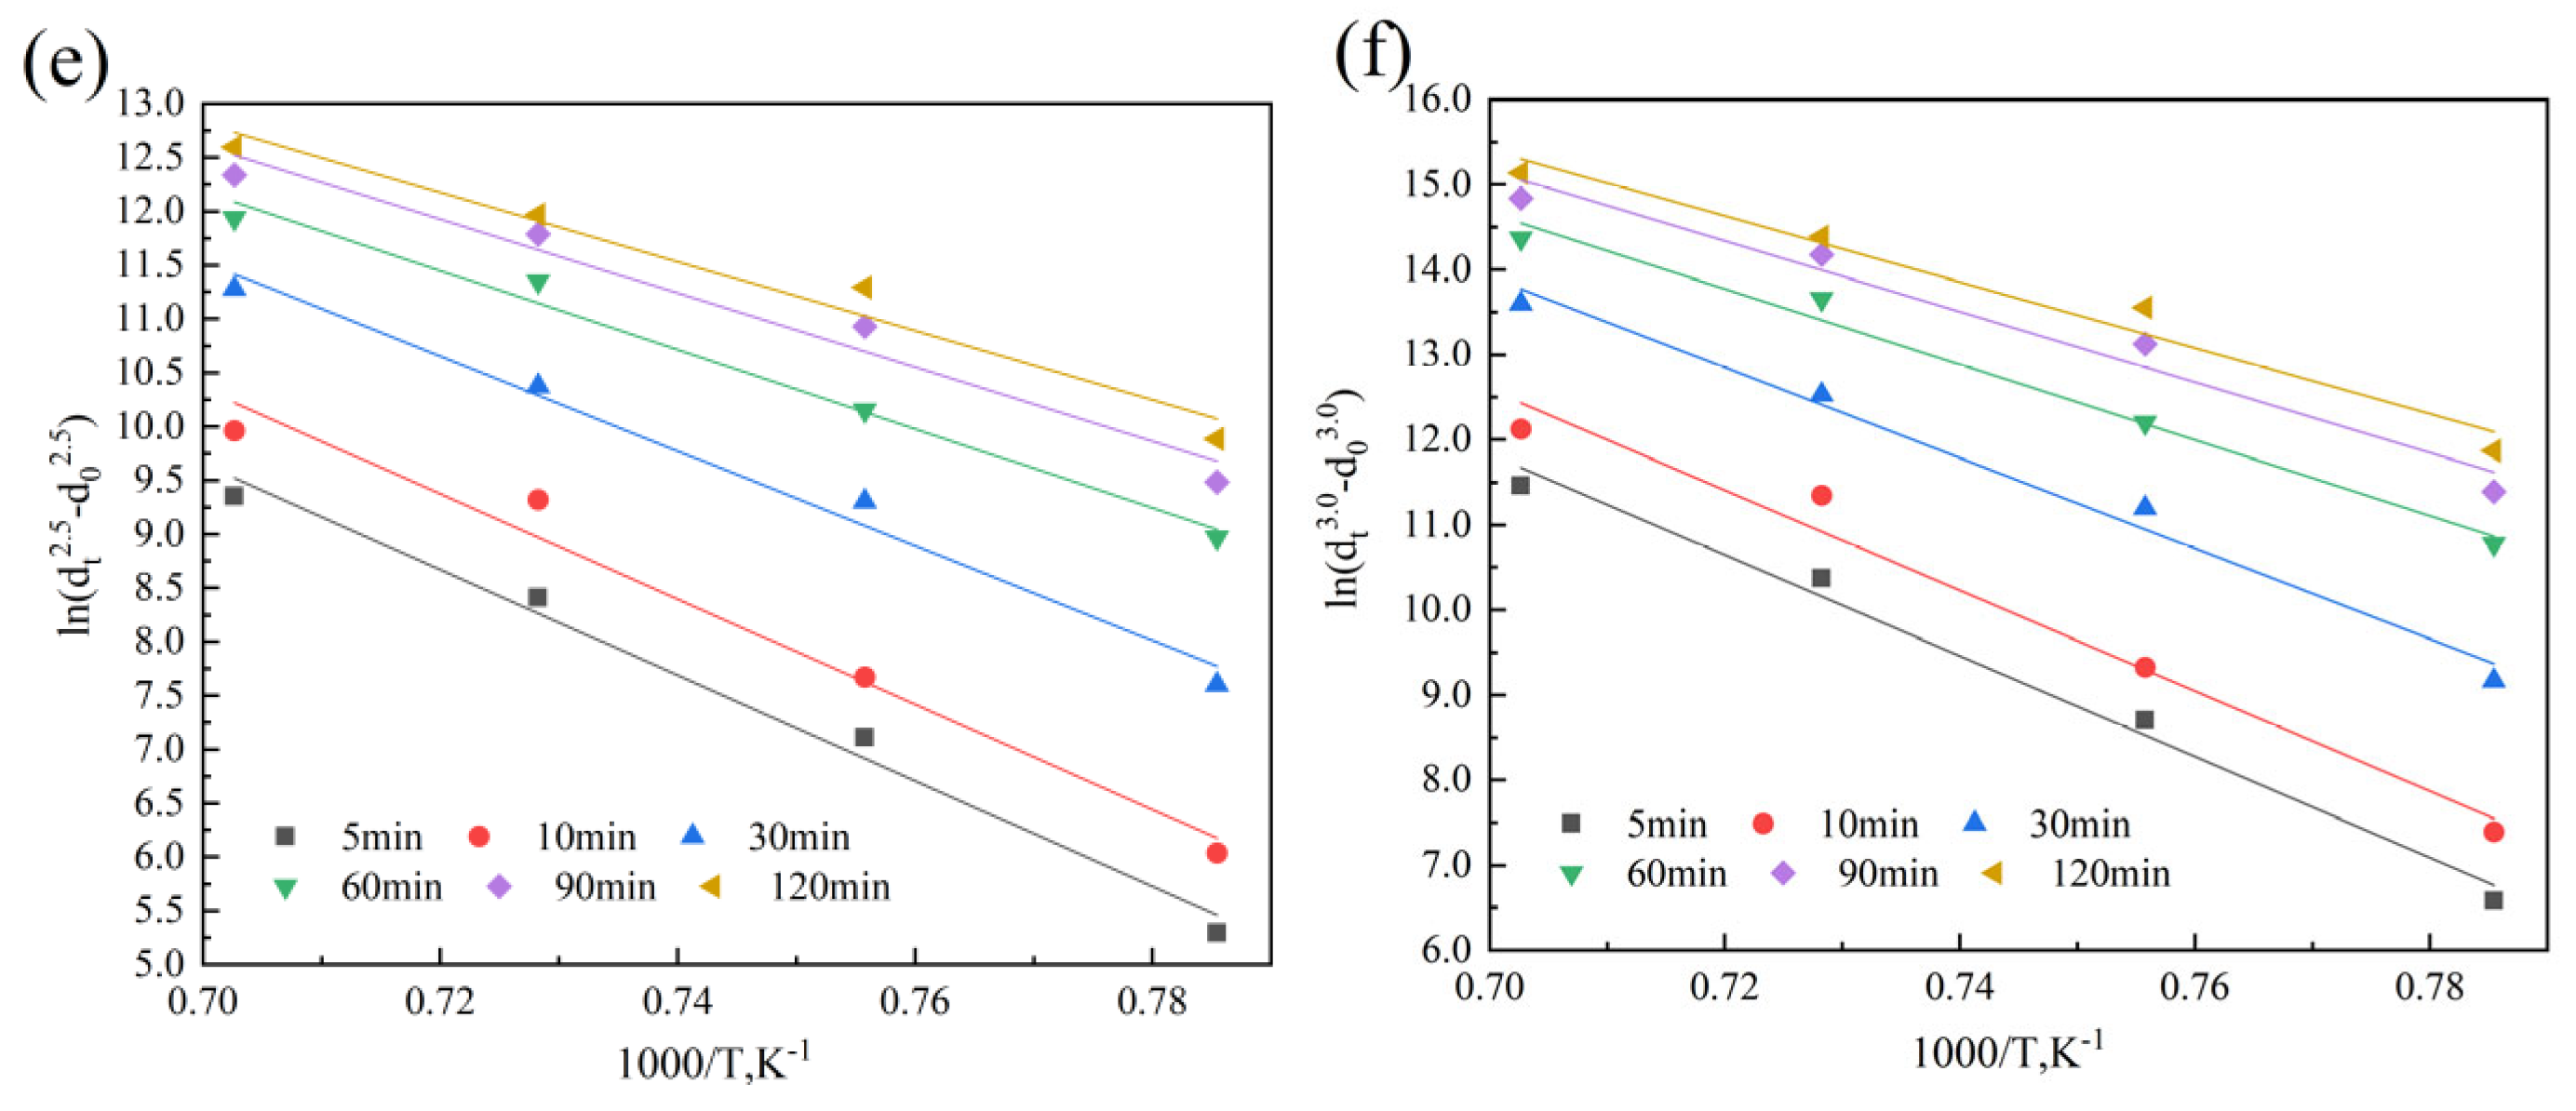
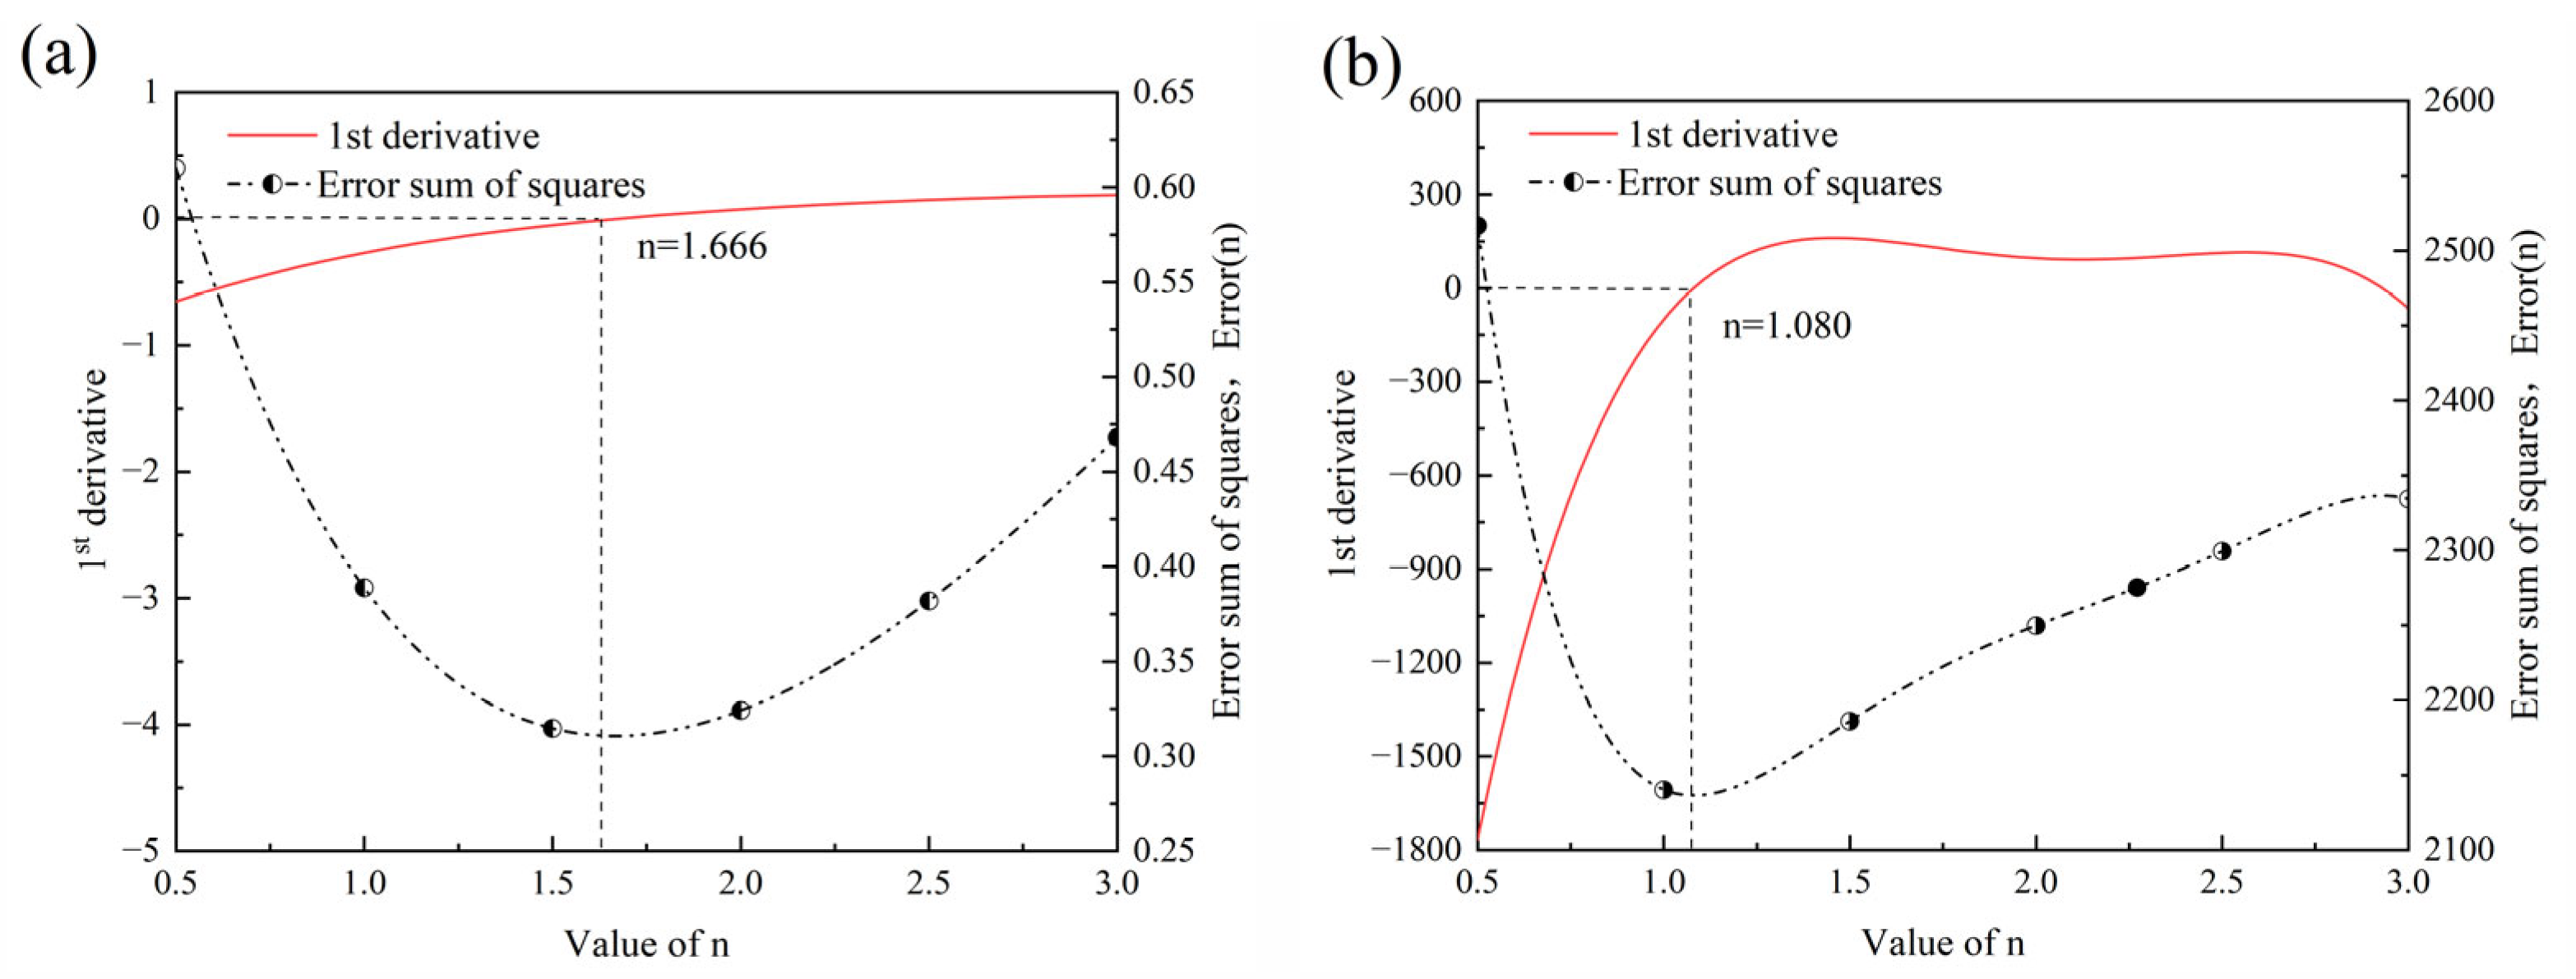
4. Model Establishment and Discussion
5. Conclusions
Author Contributions
Funding
Institutional Review Board Statement
Informed Consent Statement
Data Availability Statement
Conflicts of Interest
References
- Ye, G.N.; Chen, Y.L. Challenges and Countermeasure Investigation of Corrosion and Fatigue on Aircraft Structures. Adv. Aeronaut. Sci. Eng. 2011, 2, 66–69+88. [Google Scholar]
- Jiang, Y.; Yin, Z.D.; Zhu, J.C.; Li, M.W. Development Status of Maraging Stainless Steel. Spec. Steel 2003, 3, 1–5. [Google Scholar]
- Liu, Z.B.; Liang, J.X.; Su, J.; Wang, X.H.; Sun, Y.Q.; Wang, C.J.; Yang, Z.Y. Research and application progress in ultra-high strength stainless steel. Acta Metall. Sin. 2020, 56, 549–557. [Google Scholar]
- Wang, J.; Zou, H.; Li, C.; Qiu, S.Y.; Shen, B.L. The effect of microstructural evolution on hardening behavior of type 17-4PH stainless steel in long-term aging at 350 °C. Mater. Charact. 2006, 57, 274–280. [Google Scholar] [CrossRef]
- Bhargava, A.K.; Tiwari, A.N. Rapid solidification of 17-7PH stainless steel: Heat treatment response. Int. J. Rapid Solidif. 1996, 9, 121–136. [Google Scholar]
- Couturier, L.; Descoins, M. Evolution of the microstructure of a 15-5PH martensitic stainless steel during precipitation hardening heat treatment. Mater. Des. 2016, 107, 416–425. [Google Scholar] [CrossRef]
- AnilKumar, V.; Karthikeyan, M.K.; Gupta, R.K.; Gino Prakash, F.; Ram Kumar, P. Aging behavior in 15-5PH precipitation hardening martensitic stainless steel. Mater. Sci. Forum. 2012, 710, 483–488. [Google Scholar] [CrossRef]
- Leitner, H.; Schnitzer, R.; Schober, M.; Zinner, S. Precipitate modification in PH13-8Mo type maraging steel. Acta Mater. 2011, 59, 5012–5022. [Google Scholar] [CrossRef]
- Ravitej, S.V.; Murthy, M.; Krishnappa, M.B. Review paper on optimization of process parameters in turning Custom 465® precipitation hardened stainless steel. Mater. Today Proc. 2018, 5, 2787–2794. [Google Scholar] [CrossRef]
- Tian, J.L.; Wang, W.; Shahzad, M.B.; Yan, W.; Shan, Y.Y.; Jiang, Z.H.; Yang, K. A new maraging stainless steel with excellent strength-toughness-corrosion synergy. Materials 2017, 10, 1293. [Google Scholar] [CrossRef]
- Wang, Z.H.; Wang, Y.; Wang, C.M. Grain size effect on the hot ductility of high-nitrogen austenitic stainless steel in the presence of precipitates. Materials 2018, 11, 1026. [Google Scholar] [CrossRef]
- Liu, W.L.; Wang, X.L.; Guo, F.J.; Shang, C.J. Carbides Dissolution in 5Cr15MoV Martensitic Stainless Steel and New Insights into Its Effect on Microstructure and Hardness. Materials 2022, 15, 8742. [Google Scholar] [CrossRef] [PubMed]
- Sha, Q.; Sun, Z. Grain growth behavior of coarse-grained austenite in a Nb-V-Ti microalloyed steel. Mater. Sci. Eng. A 2009, 523, 77–84. [Google Scholar] [CrossRef]
- Yu, Q.; Sun, Y. Abnormal growth of austenite grain of low-carbon steel. Mater. Sci. Eng. A 2006, 420, 34–38. [Google Scholar] [CrossRef]
- Illescas, S.; Fernández, J.; Guilemany, J.M. Kinetic analysis of the austenitic grain growth in HSLA steel with a low carbon content. Mater. Lett. 2008, 62, 3478–3480. [Google Scholar] [CrossRef]
- Bao, S.; Yang, G.W.; Xu, Y.W.; Han, R.Y.; Zhu, X.X.; Zhao, G. Austenite grain growth behavior of medium manganese martensitic NM500 steel. Iron Steel 2022, 57, 152–159. [Google Scholar]
- Guo, F.H.; Li, J.R.; Zhang, P.F.; Wang, H.L.; Yang, G. Austenite grain growth behavior of 60Mn3Al3Ni2CrVNb quenched and tempered low density steel. Trans. Mater. Heat Treat. 2021, 42, 76–83. [Google Scholar]
- Yan, Z.K.; Chen, H.T.; Lang, Y.P.; Qu, H.P.; Feng, H.Q.; Liu, R.P. Effect of Nb on microstructure and intergranular corrosion sensitivity of 00Cr21Ni6Mn9N stainless steel. Heat Treat. Met. 2022, 47, 240–244. [Google Scholar]
- Zheng, S.J.; Hao, X.D.; Hong, Y.C.; Bai, L.; Yue, C.F.; Bai, Y.N. Austenitic grain growth behavior during austenitization of high nitrogen stainless steel. Trans. Mater. Heat Treat. 2017, 38, 180–186. [Google Scholar]
- Bai, R.X.; Liu, Z.B.; Cao, J.C.; Wang, X.H. Effect of high temperature tempering on microstructure of USS122G ultra-high strength stainless steel. Iron Steel 2020, 55, 81–86+98. [Google Scholar]
- Wang, X.H.; Liu, Z.B.; Luo, H.W. Complicated Interaction of Dynamic Recrystallization and Precipitation During Hot Deformation of Ultrahigh-Strength Stainless Steel. Metall. Mater. Trans. A 2016, 47, 6248–6258. [Google Scholar] [CrossRef]
- Wang, X.H.; Liu, Z.B.; Luo, H.W. Hot deformation characterization of ultrahigh strength stainless steel through processing maps generated using different instability criteria. Mater. Charact. 2017, 131, 480–491. [Google Scholar] [CrossRef]
- Raghunathan, N.; Sheppard, T. Microstructural development during annealing of hot rolled Al-Mg alloys. Mater. Sci. Technol. 1989, 5, 542–547. [Google Scholar] [CrossRef]
- Zhou, H.; Tao, L.J.; Li, Z.L.; Zhang, X.F.; Liu, Y.C. A study of grain growth behavior of cryogenic austenite in 0.22C-0.45Mn steel. J. Anhui Univ. Technol. 2023, 40, 52–58. [Google Scholar]
- Han, R.Y.; Yang, G.W.; Sun, X.J.; Zhao, G.; Liang, X.K.; Zhu, X.X. Austenite grain growth behavior of vanadium microalloying medium manganese martensitic wear-resistant steel. Acta Metall. Sin. 2022, 58, 1589–1599. [Google Scholar]
- Liu, Z.B.; Xin, T.; Wang, X.H.; Liang, J.X.; Yang, Z.Y.; Wang, C.J. Carbide dissolution and austenite grain growth behavior of a new ultrahigh-strength stainless steel. J. Iron Steel Res. 2020, 27, 732–741. [Google Scholar] [CrossRef]
- Neter, J. Applied Linear Regression Models; McGraw-Hill/Irwin: Boston, MA, USA, 2004. [Google Scholar]
- Tayman, J.; Swanson, D.A. On the validity of MAPE as a measure of population forecast accuracy. Popul. Res. Policy Rev. 1999, 18, 299–322. [Google Scholar] [CrossRef]
- Hagquist, C.; Stenbeck, M. Goodness of fit in regression analysis-R2 and G2 reconsidered. Qual. Quant. 1998, 32, 229–245. [Google Scholar] [CrossRef]


Disclaimer/Publisher’s Note: The statements, opinions and data contained in all publications are solely those of the individual author(s) and contributor(s) and not of MDPI and/or the editor(s). MDPI and/or the editor(s) disclaim responsibility for any injury to people or property resulting from any ideas, methods, instructions or products referred to in the content. |
© 2025 by the authors. Licensee MDPI, Basel, Switzerland. This article is an open access article distributed under the terms and conditions of the Creative Commons Attribution (CC BY) license (https://creativecommons.org/licenses/by/4.0/).
Share and Cite
Wang, X.; Liu, Z.; Chen, J.; Liang, J.; Yang, Z.; Zhao, W.; Tian, S. Study on the Grain Growth Behavior of Ultra-High Strength Stainless Steel. Materials 2025, 18, 1064. https://doi.org/10.3390/ma18051064
Wang X, Liu Z, Chen J, Liang J, Yang Z, Zhao W, Tian S. Study on the Grain Growth Behavior of Ultra-High Strength Stainless Steel. Materials. 2025; 18(5):1064. https://doi.org/10.3390/ma18051064
Chicago/Turabian StyleWang, Xiaohui, Zhenbao Liu, Jiahao Chen, Jianxiong Liang, Zhiyong Yang, Wenyu Zhao, and Shuai Tian. 2025. "Study on the Grain Growth Behavior of Ultra-High Strength Stainless Steel" Materials 18, no. 5: 1064. https://doi.org/10.3390/ma18051064
APA StyleWang, X., Liu, Z., Chen, J., Liang, J., Yang, Z., Zhao, W., & Tian, S. (2025). Study on the Grain Growth Behavior of Ultra-High Strength Stainless Steel. Materials, 18(5), 1064. https://doi.org/10.3390/ma18051064