Abstract
Under undrained monotonic static loading, saturated loose granular materials may undergo static liquefaction. Tailings, a kind of granular material, pose particularly serious hazards after static liquefaction. To understand the effects of the initial state and fines content on the static liquefaction of tailings, consolidated undrained triaxial compression tests and one-dimensional compression tests were carried out on tailings with different initial states and fines content. The critical state strength, undrained shear strength, instability line, brittleness index, and compressibility of tailings were investigated, and the tests results were analyzed and discussed using the critical state framework. The results show that tailings with different initial states have the same critical state line, and changes in fines content will cause the position of the critical state line to shift. An increase in the initial void ratio and initial confining pressure will increase the degree of static liquefaction, while the influence of fines content has a threshold value (30%), at which the degree of static liquefaction is the highest. Our analysis shows that compressibility has limitations for evaluating static liquefaction, while the state parameter is an effective indicator for evaluating the static liquefaction of tailings with different initial states and fines contents. The results provide valuable theoretical and practical insights regarding the static liquefaction of tailings and are of great significance for evaluating the stability and preventing the static instability of tailing dams.
1. Introduction
Tailings are the waste material that remains after valuable metals have been extracted from processed rock. As the world’s demand for metallic minerals continues to increase, the quantities of tailings are also constantly increasing. For example, China’s annual tailings emissions are 1.03 billion t. Aside from the 280 million t comprehensively utilized, the rest are all stored in tailings deposits, and there are more than 13,000 existing tailings deposits in China. A tailings dam is a dangerous high-potential-energy source, which not only threatens the safety of downstream residents and facilities but also causes many disasters and environmental problems. Liquefaction is an important cause of tailings dam instability [1,2,3]. Liquefaction of saturated loose granular materials can be initiated by dynamic or static loading under undrained conditions. The behavior of materials under dynamic loading has attracted a lot of interest from researchers and is well understood [4,5,6,7]. However, static liquefaction has been studied to a lesser degree. Static liquefaction [8,9,10,11] refers to the phenomenon in which the shear strength of saturated loose granular materials under undrained static loading decreases rapidly before reaching the damage envelope and is coupled with a rapid increase in pore water pressure. Figure 1 shows typical curves of the static liquefaction of saturated loose tailings in a consolidated undrained triaxial compression (CUTC) test, where u is pore water pressure, ε1 is major principal strain, p′ is the mean effective stress, and q is the effective shear stress, and these curves can be expressed using Equations (1) and (2).
in which σ1′ and σ3′ are the major and minor principal effective stresses, respectively.
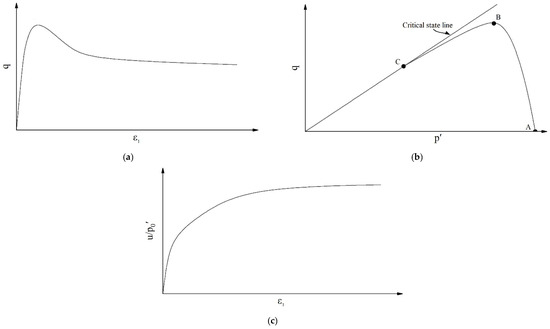
Figure 1.
Typical curves in CUTC tests: (a) stress–strain curve; (b) effective stress path; (c) pore water pressure variation curve.
Static liquefaction can cause sudden reductions in strength and accelerated deformation in tailings dams, resulting in catastrophic consequences for personal and property safety [12,13,14,15,16].
In Figure 1b, point A is the starting point of the effective stress path and the start of the test. The stress state at this point can be expressed as (p0′, q0), where the subscript “0” represents the initial state. Point B is the peak of the effective stress path, at which the shear stress represents the undrained shear strength of the specimen. At point B, the specimen starts to become unstable and soften, and static liquefaction occurs. Therefore, this point is called the instability point. The stress state at this point can be expressed as (pp′, qp), where the subscript “p” represents the peak state. Point C represents the final state of the shear test, when the specimen is in the ultimate shear failure state with constant effective stress and constant volume, that is, the critical state [17,18]. At this time, the stress state can be expressed as (pcs′, qcs), where the subscript “cs” represents the critical state, and qcs represents critical state shear strength.
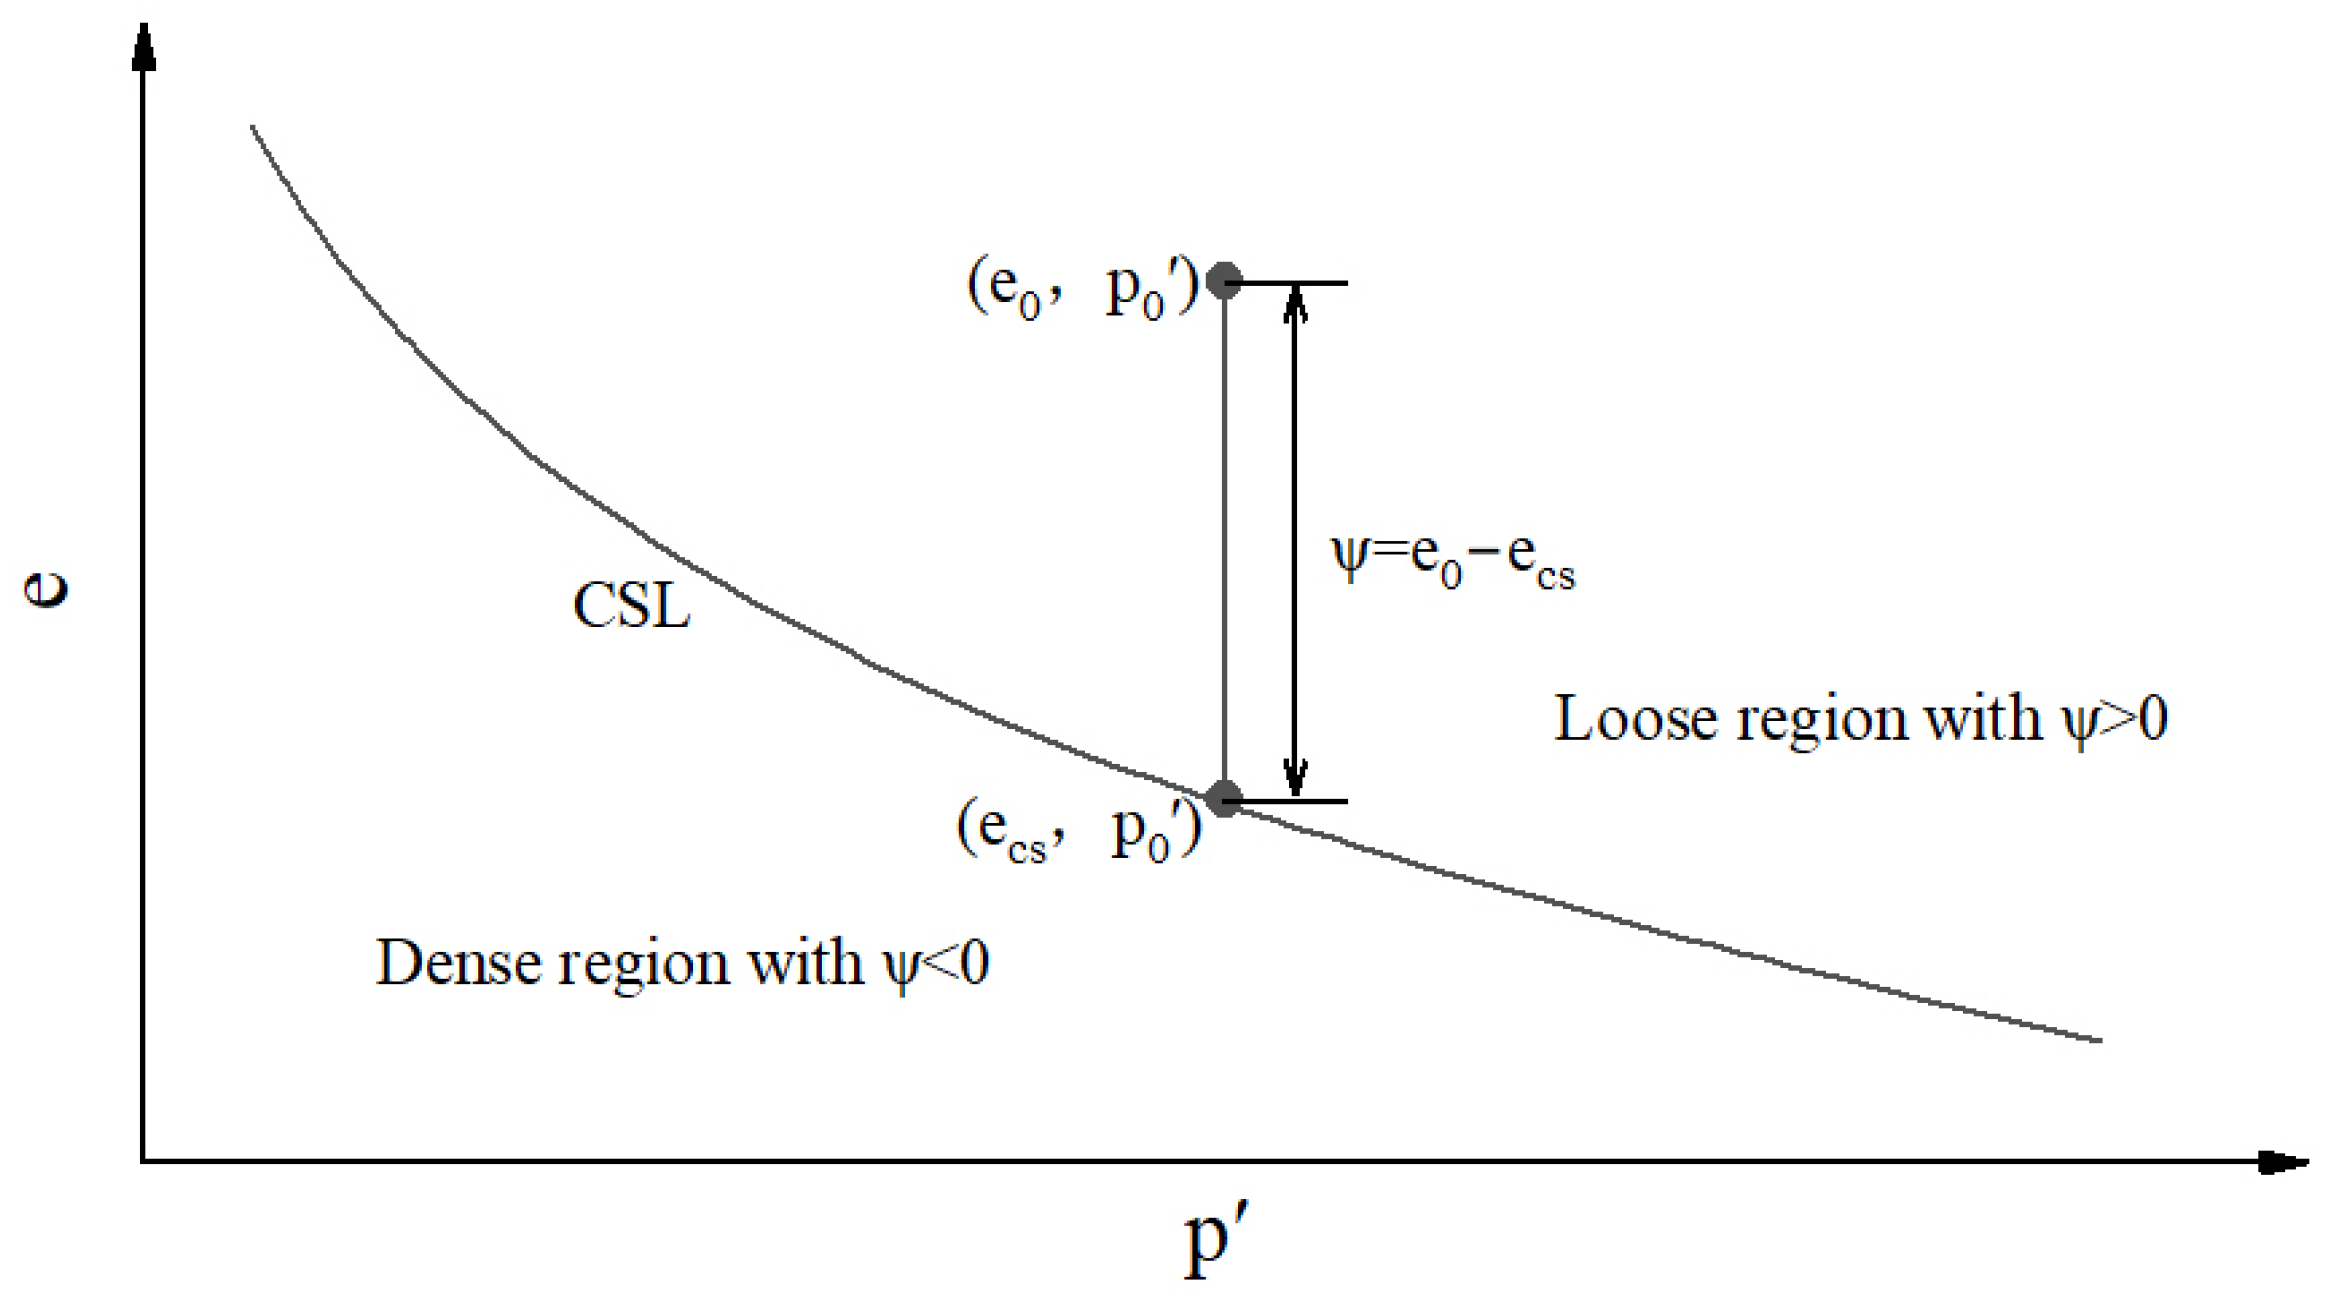
Numerous studies [19,20,21] have been performed to research static liquefaction characteristics, especially for sands subjected to undrained loading [22,23,24]. These studies have mainly focused on the effect of the initial state (the void ratio e0 and the mean principal stress p0′ after consolidation) at point A on the location of points B and C. For a given type of sand, a unique critical state line (CSL) is obtained in the plane of the void ratio versus the mean principal stress, as shown in Figure 2 [25,26]. The void ratio remains constant in the CUTC tests, and the critical state is related only to e0 and not to p0′. The critical state stress ratio M, calculated using Equation (3), is constant, independent of the initial state [27].
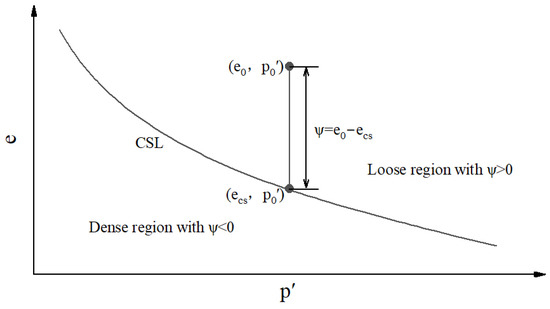
Figure 2.
The CSL and definition of ψ.
In CUTC tests, the collapse line that connects points B and C determined using specimens with the same e0 but different p0′ was proposed [28]. In the p-q plane, the position of the collapse line moves down along the CSL, but the slope remains unchanged as the e0 increases. Similar results were obtained by Ishihara [25,29]. After further investigation, Lade found that the collapse line is a straight line connecting point B to the origin and renamed it the instability line (IL) [30,31]. The slope of the IL can be calculated using Equation (4).
ηIL increases with a decreasing e0, as verified by [32,33]. Recently, the research by J. Yang showed that ηIL is not only related to e0 but also decreases with the increase in p0′ [34,35].
Tailings, as well as natural sands, often contain fines (with a particle size less than 0.075 mm), and the fines content (FC) can change the position of the CSL in e-p plane [36,37,38,39]. There has been no unified conclusion on the influence of the existence of fines on static liquefaction. Several studies have concluded that the existence of fines decreases the liquefaction potential [40,41,42], while an opposite conclusion has been made by [43,44]. Some studies have found that there exists a threshold FC [45,46,47]. When the FC is below the threshold content, the fine grains will slip into the spaces of the large-grained skeleton as shear stress is applied. This phenomenon increases the contraction of the specimen, with a consequent increase in pore water pressure and liquefaction potential. On the contrary, when the FC exceeds the threshold content, the fine grains will fill the spaces of the skeleton, halting the specimen’s contraction or even making it expand, and the liquefaction phenomenon ceases. In order to evaluate the contraction of specimens, Yamamuro and Lade proposed the concept of compressibility based on the results of one-dimensional compression (OC) tests conducted on sandy soils [48,49] and investigated the relationship between compressibility and static liquefaction. The results showed that compressibility is a direct indication of the liquefaction potential and related to the development of pore water pressure. On the other hand, J. Yang [35] studied the effects of initial shear stress and the initial state on slope stability and liquefaction in granular soils using the critical state framework and concluded that the IL is only correlated with the initial state parameter. The state parameter (ψ) [19] is illustrated in Figure 2, and it can be specifically calculated using Equation (5).
where ecs is the void ratio at the same mean effective stress as e0 on the CSL.
In summary, in the existing literature, in-depth research has been conducted on the static liquefaction problems of coarse-grained soils, but there the following issues still need to be addressed:
- (i)
- The impact of fines on the static liquefaction of coarse-grained soil is still unclear, and there is a lack of experimental data on the effect of FC;
- (ii)
- The compressibility evaluation parameters of soil are not uniform, and there is a lack of systematic research on their relationship with static liquefaction;
- (iii)
- There is still a lack of experimental research on the static liquefaction problems pertaining to tailings, a special granular material.
In response to the above issues, we selected gold tailings as experimental materials and studied the static liquefaction behavior of tailings with different fines contents and initial states through CUTC tests and OC tests under the critical state framework. The specific objectives were as follows:
- (i)
- To study the effects of the initial state and FC of tailings on the critical state, the instability line, undrained shear strength, and the brittleness index;
- (ii)
- To compare two existing compressibility parameters and analyze their advantages and disadvantages;
- (iii)
- To identify the relationship between tailings’ compressibility and static liquefaction and evaluate static liquefaction using compressibility parameters within the critical state framework.
The results of this study have guiding significance for the design and monitoring of ability to warn of risks to tailings dams, providing an experimental and theoretical basis for the stability assessment of existing tailings dams.
The structure of this paper is as follows. Section 2 introduces the experimental materials and methods. Section 3 analyzes the results of OC tests and CUTC tests. Section 4 discusses the mechanism of the static liquefaction of tailings with fines and the role of compressibility indicators in evaluating static liquefaction, and it provides suggestions for future research. Section 5 summarizes the main findings of this paper.
2. Materials and Methods
2.1. Materials
Gold tailings were used as test materials in this study. They were taken from the upstream dry beach of a gold tailings deposit in Ili, Xinjiang, China. In order to ensure the representativeness of the samples taken, five sampling points were set up along the direction perpendicular to the dam axis on the beach surface. The sampling depth was about 10 cm below the beach surface, and the tailings were loose in texture and yellowish-green in color. The basic physical property indexes are shown in Table 1.

Table 1.
Basic physical properties of the tailings.
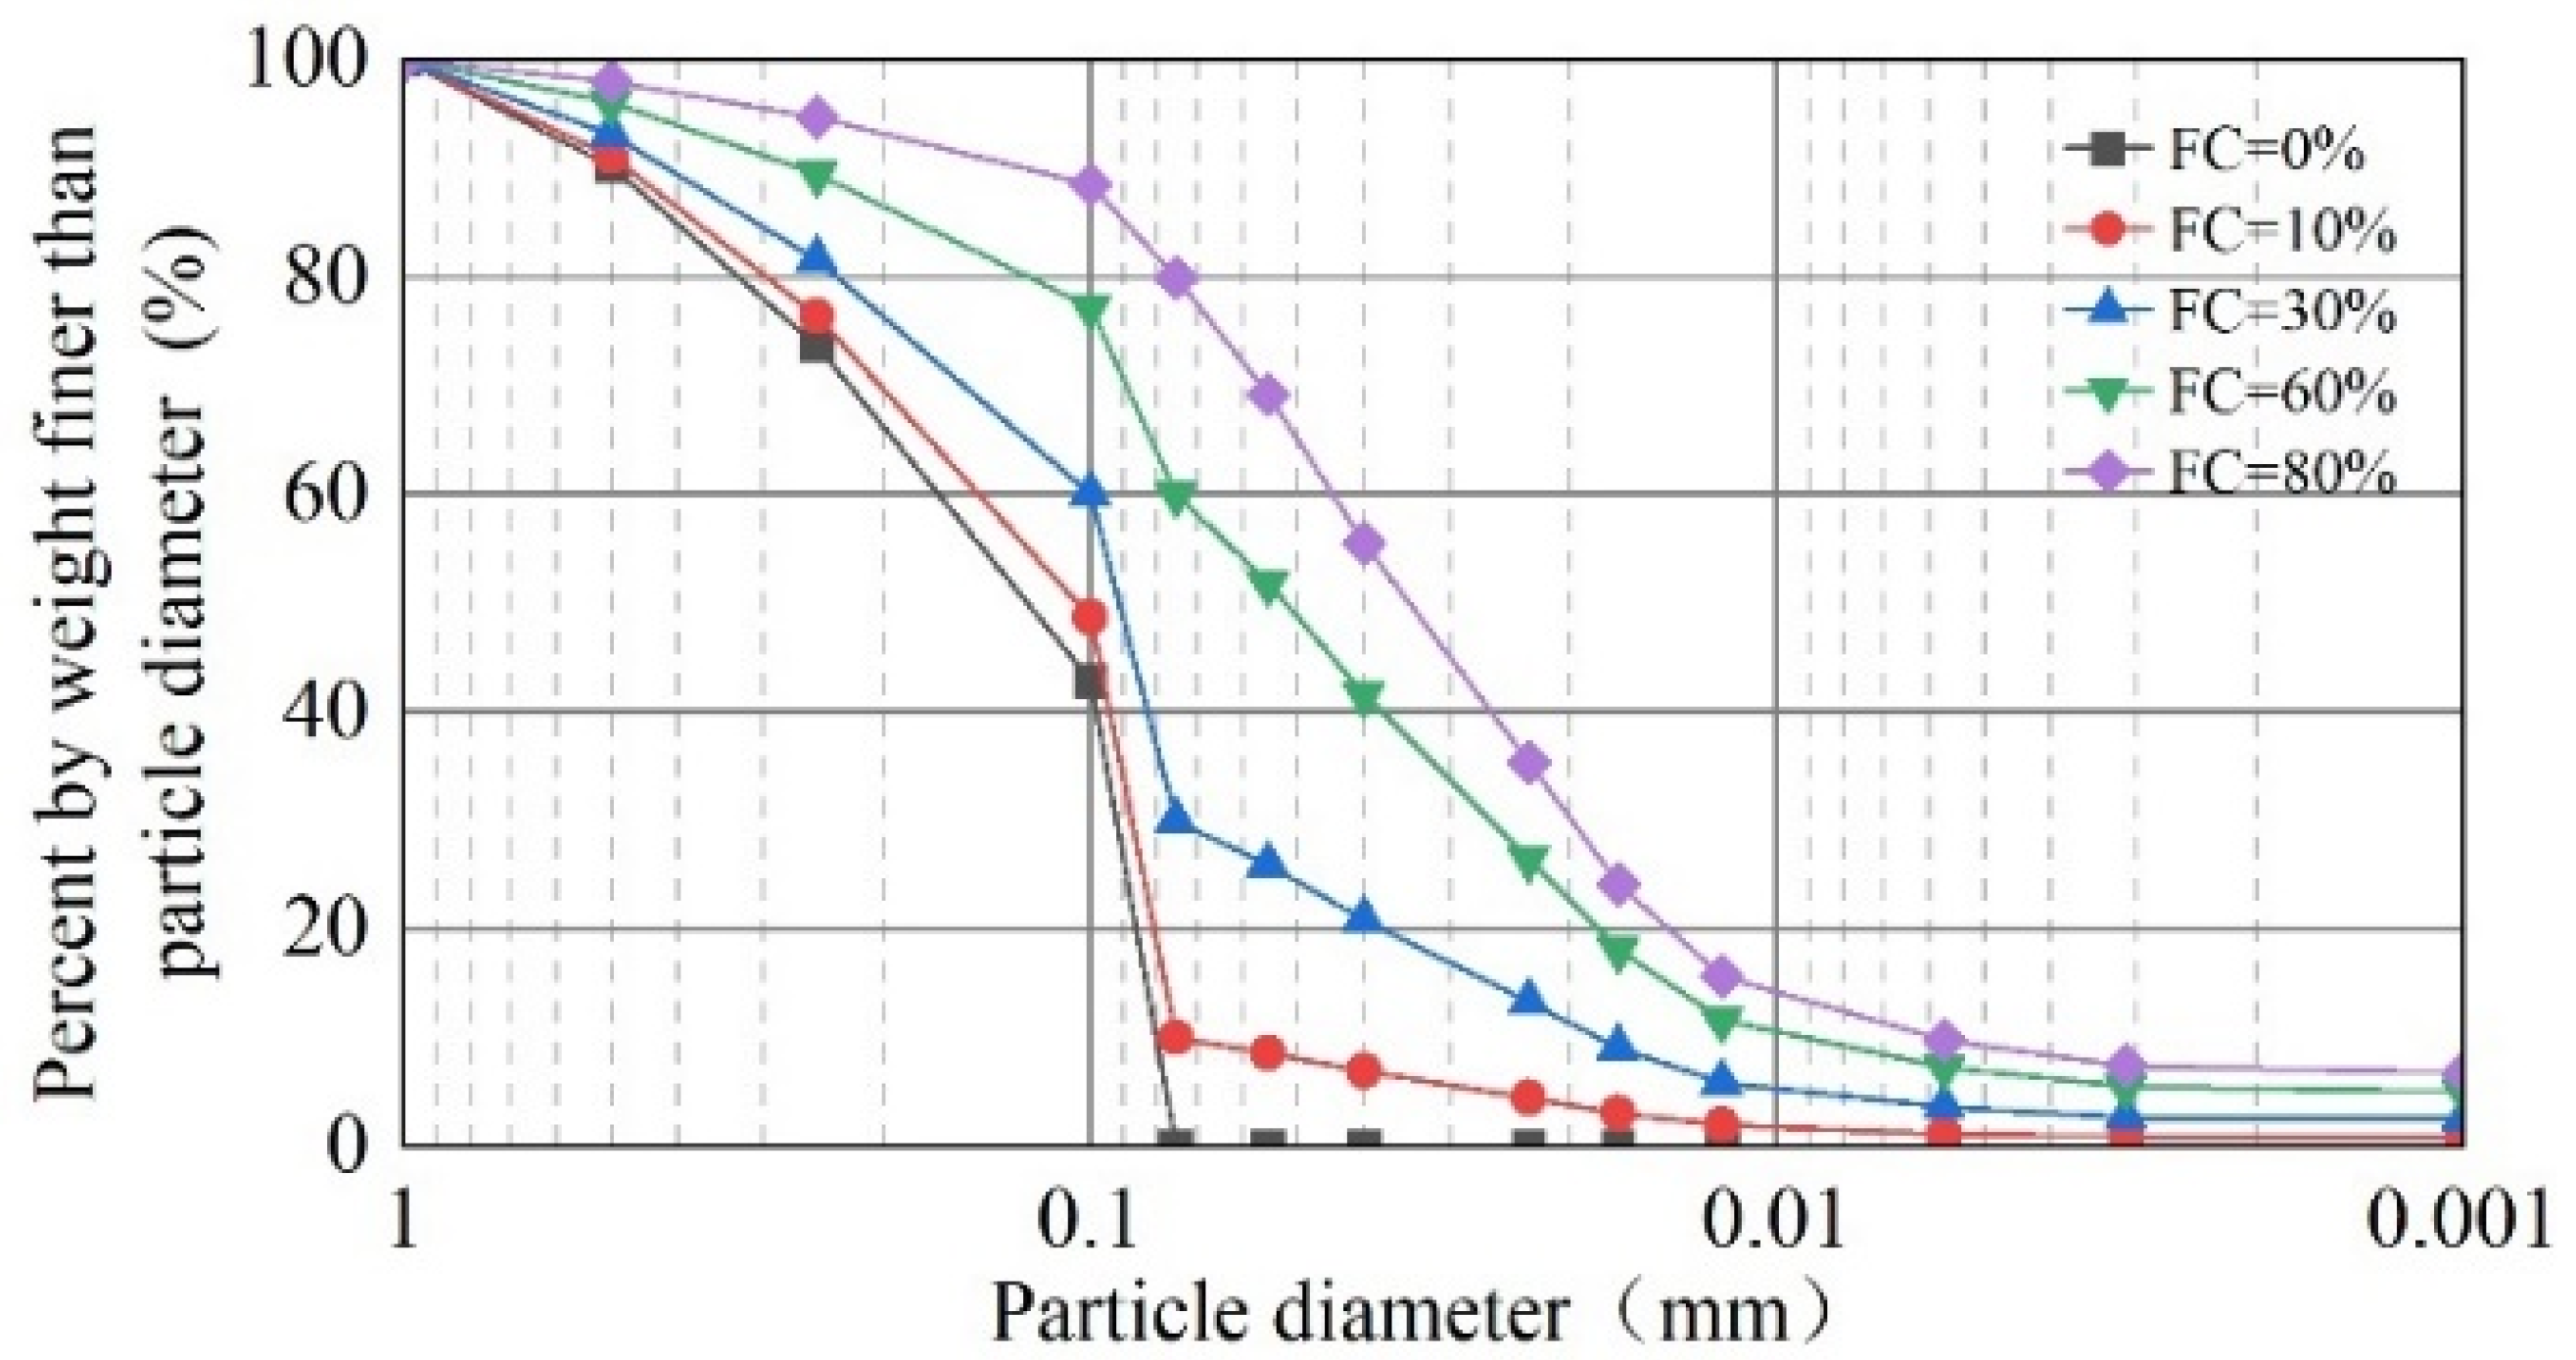
The FC of the tailings was between 72.53% and 81.05%. It is evident that FC in tailings varies with location, with a maximum of over 80%. In order to study the influence of FC on the static liquefaction characteristics of tailings, excluding the influence of the coarse particle gradings of different sampling points, the sieved-out fine particles of the P5 tailings were taken as the base tailings. The base tailings were mixed with tailings’ fines and formulated into mixed-tailings material with FC of 0%, 10%, 30%, 60%, and 80% according to the mass ratio. The particle-grading curves of tailings with different FC are plotted in Figure 3.
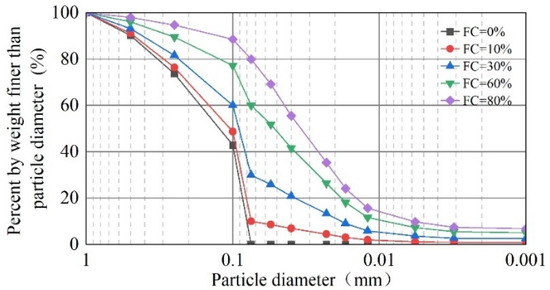
Figure 3.
Particle-size distribution of tailings with different FC.
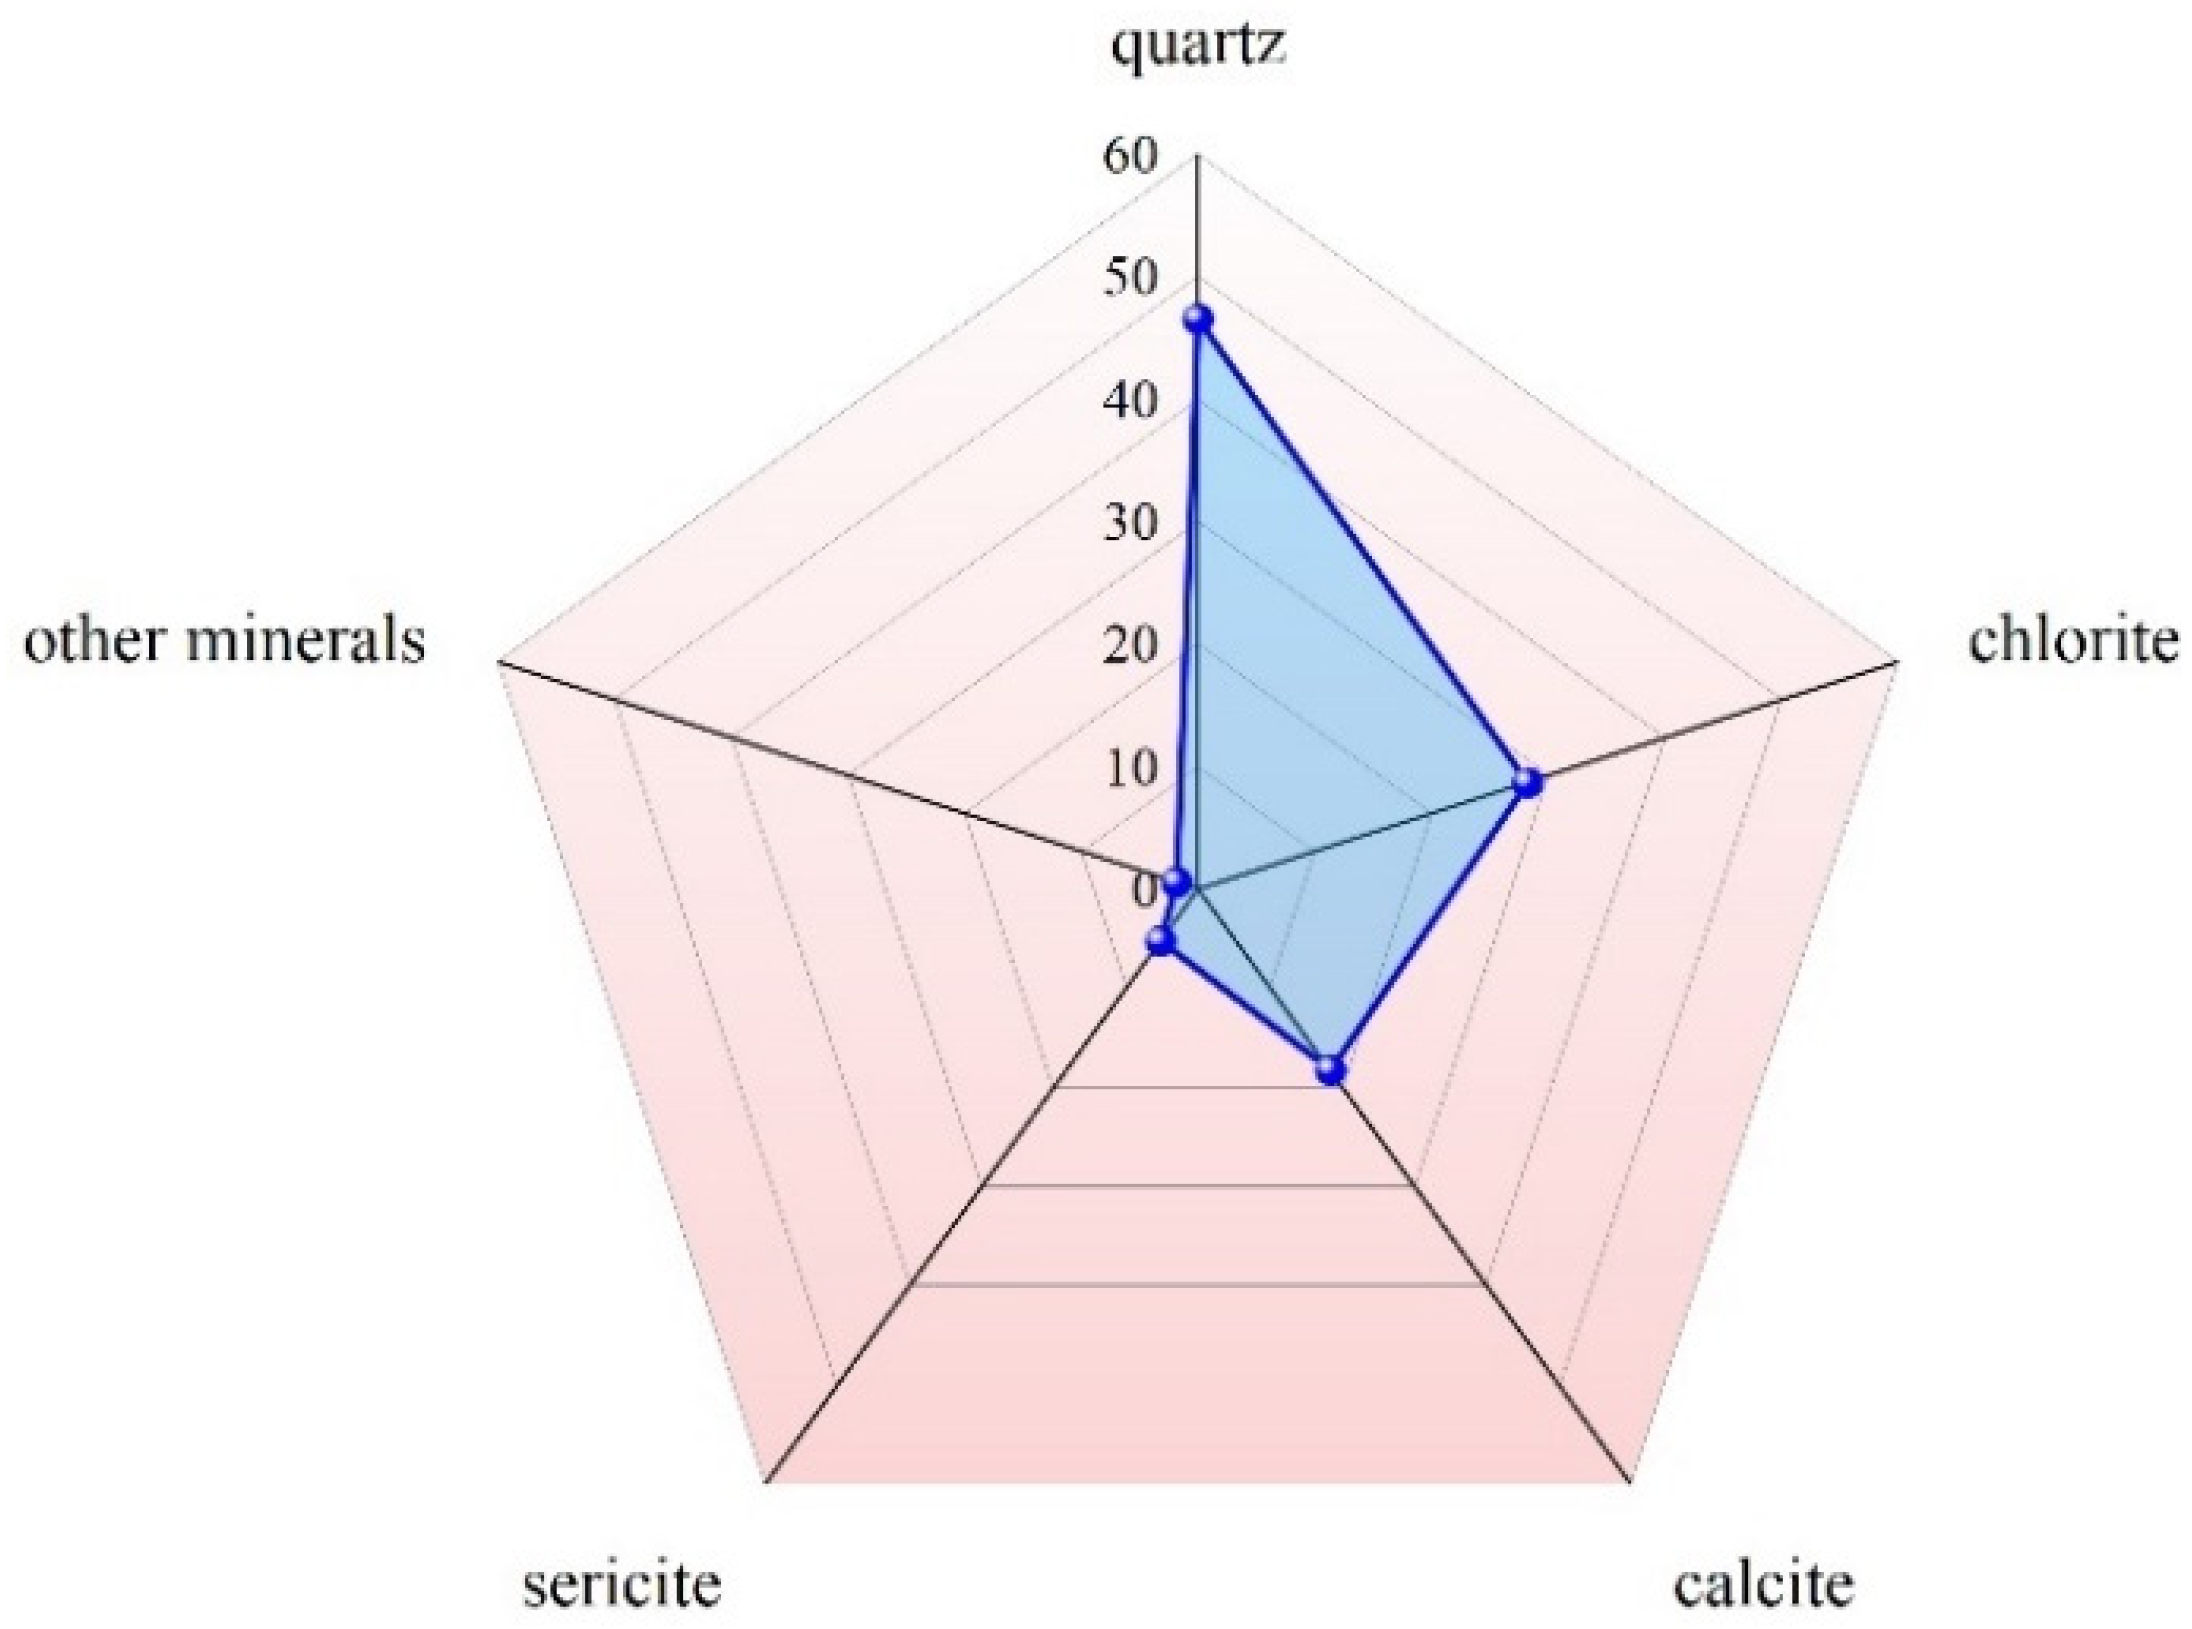
The mineral composition was measured using an electron microprobe, as shown in Figure 4. The principal mineral constituents of these metal tailings are quartz, chlorite, calcite, and sericite.

Figure 4.
Mineral composition of the tailings.
2.2. Methods
2.2.1. CUTC Tests
CUTC tests were conducted to study the static liquefaction characteristics of tailings under different initial states and FCs using a SYL-2 stress path triaxial apparatus (Nanjing soil instrument factory, Nanjing, Jiangsu, China). The CUTC tests for gold tailings and instrument calibration were performed in accordance with the “Test Methods of Soils for Highway Engineering” (JTG 3430-2020) [50]. The stress path triaxial apparatus includes a pressure supply system, a control system, and a data acquisition system. The control system consists of a strain control program and a stress control program, which can carry out conventional triaxial tests and stress path triaxial tests. The strain control program is used in this study.
The moist tamping method [25] was used for specimen preparation. The specimens were cylinders with a diameter of 39.1 mm and a height of 80 mm. The required mass of each specimen was determined based on the predetermined FC and void ratio. Five equal pre-weighed portions of tailings with water content of 5% were scattered sequentially into the sample making mold and compacted in 5 layers for one specimen. Then, the prepared specimen was sleeved inside the latex membrane and mounted on the triaxial pressure chamber base. The specimens were saturated using distilled water with a back pressure of 300 kPa. The criterion for saturation of each specimen was that the B-value had to be more than 0.98. The test FCs were 0%, 10%, 30%, 60%, and 80%, and the consolidation mean effective stress values were 50 kPa, 100 kPa, 200 kPa, and 300 kPa. The process of shearing was carried out while the specimens were still undrained, with a loading rate of 0.08 mm/min. The tests were finished when the axial strain reached 25%. Table 2 shows the specific test program.
Table 2.
Summary of CUTC tests.
2.2.2. OC Tests
To describe volumetric compressibility and its dependence on FC, void ratio, and pressure, a series of OC tests were performed on the tailings. The instrument used was an OC test apparatus (Nanjing soil instrument factory, Nanjing, Jiangsu, China). The OC tests for gold tailings and instrument calibration were performed in accordance with the “Test Methods of Soils for Highway Engineering” (JTG 3430-2020) [50]. The sample preparation method was the same as that used for the CUTC tests, and the specimen’s size was 61.8 mm in diameter and 40 mm in height. The vertical pressure (σv′) of the tests was loaded from 0 kPa to 800 kPa. The void ratio was calculated using vertical displacement. Table 3 shows the specific test program.
Table 3.
Summary of OC tests.
3. Results and Analysis
3.1. Analysis of CUTC Tests
The stress–strain curves of the specimens were obtained using CUTC tests, and the corresponding effective stress path curves and pore water pressure ratio curves were also plotted, as shown in Figure 5, Figure 6 and Figure 7.
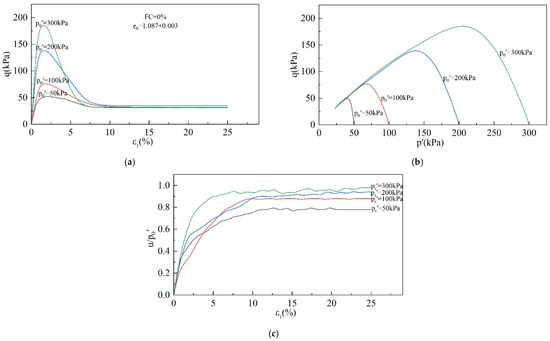
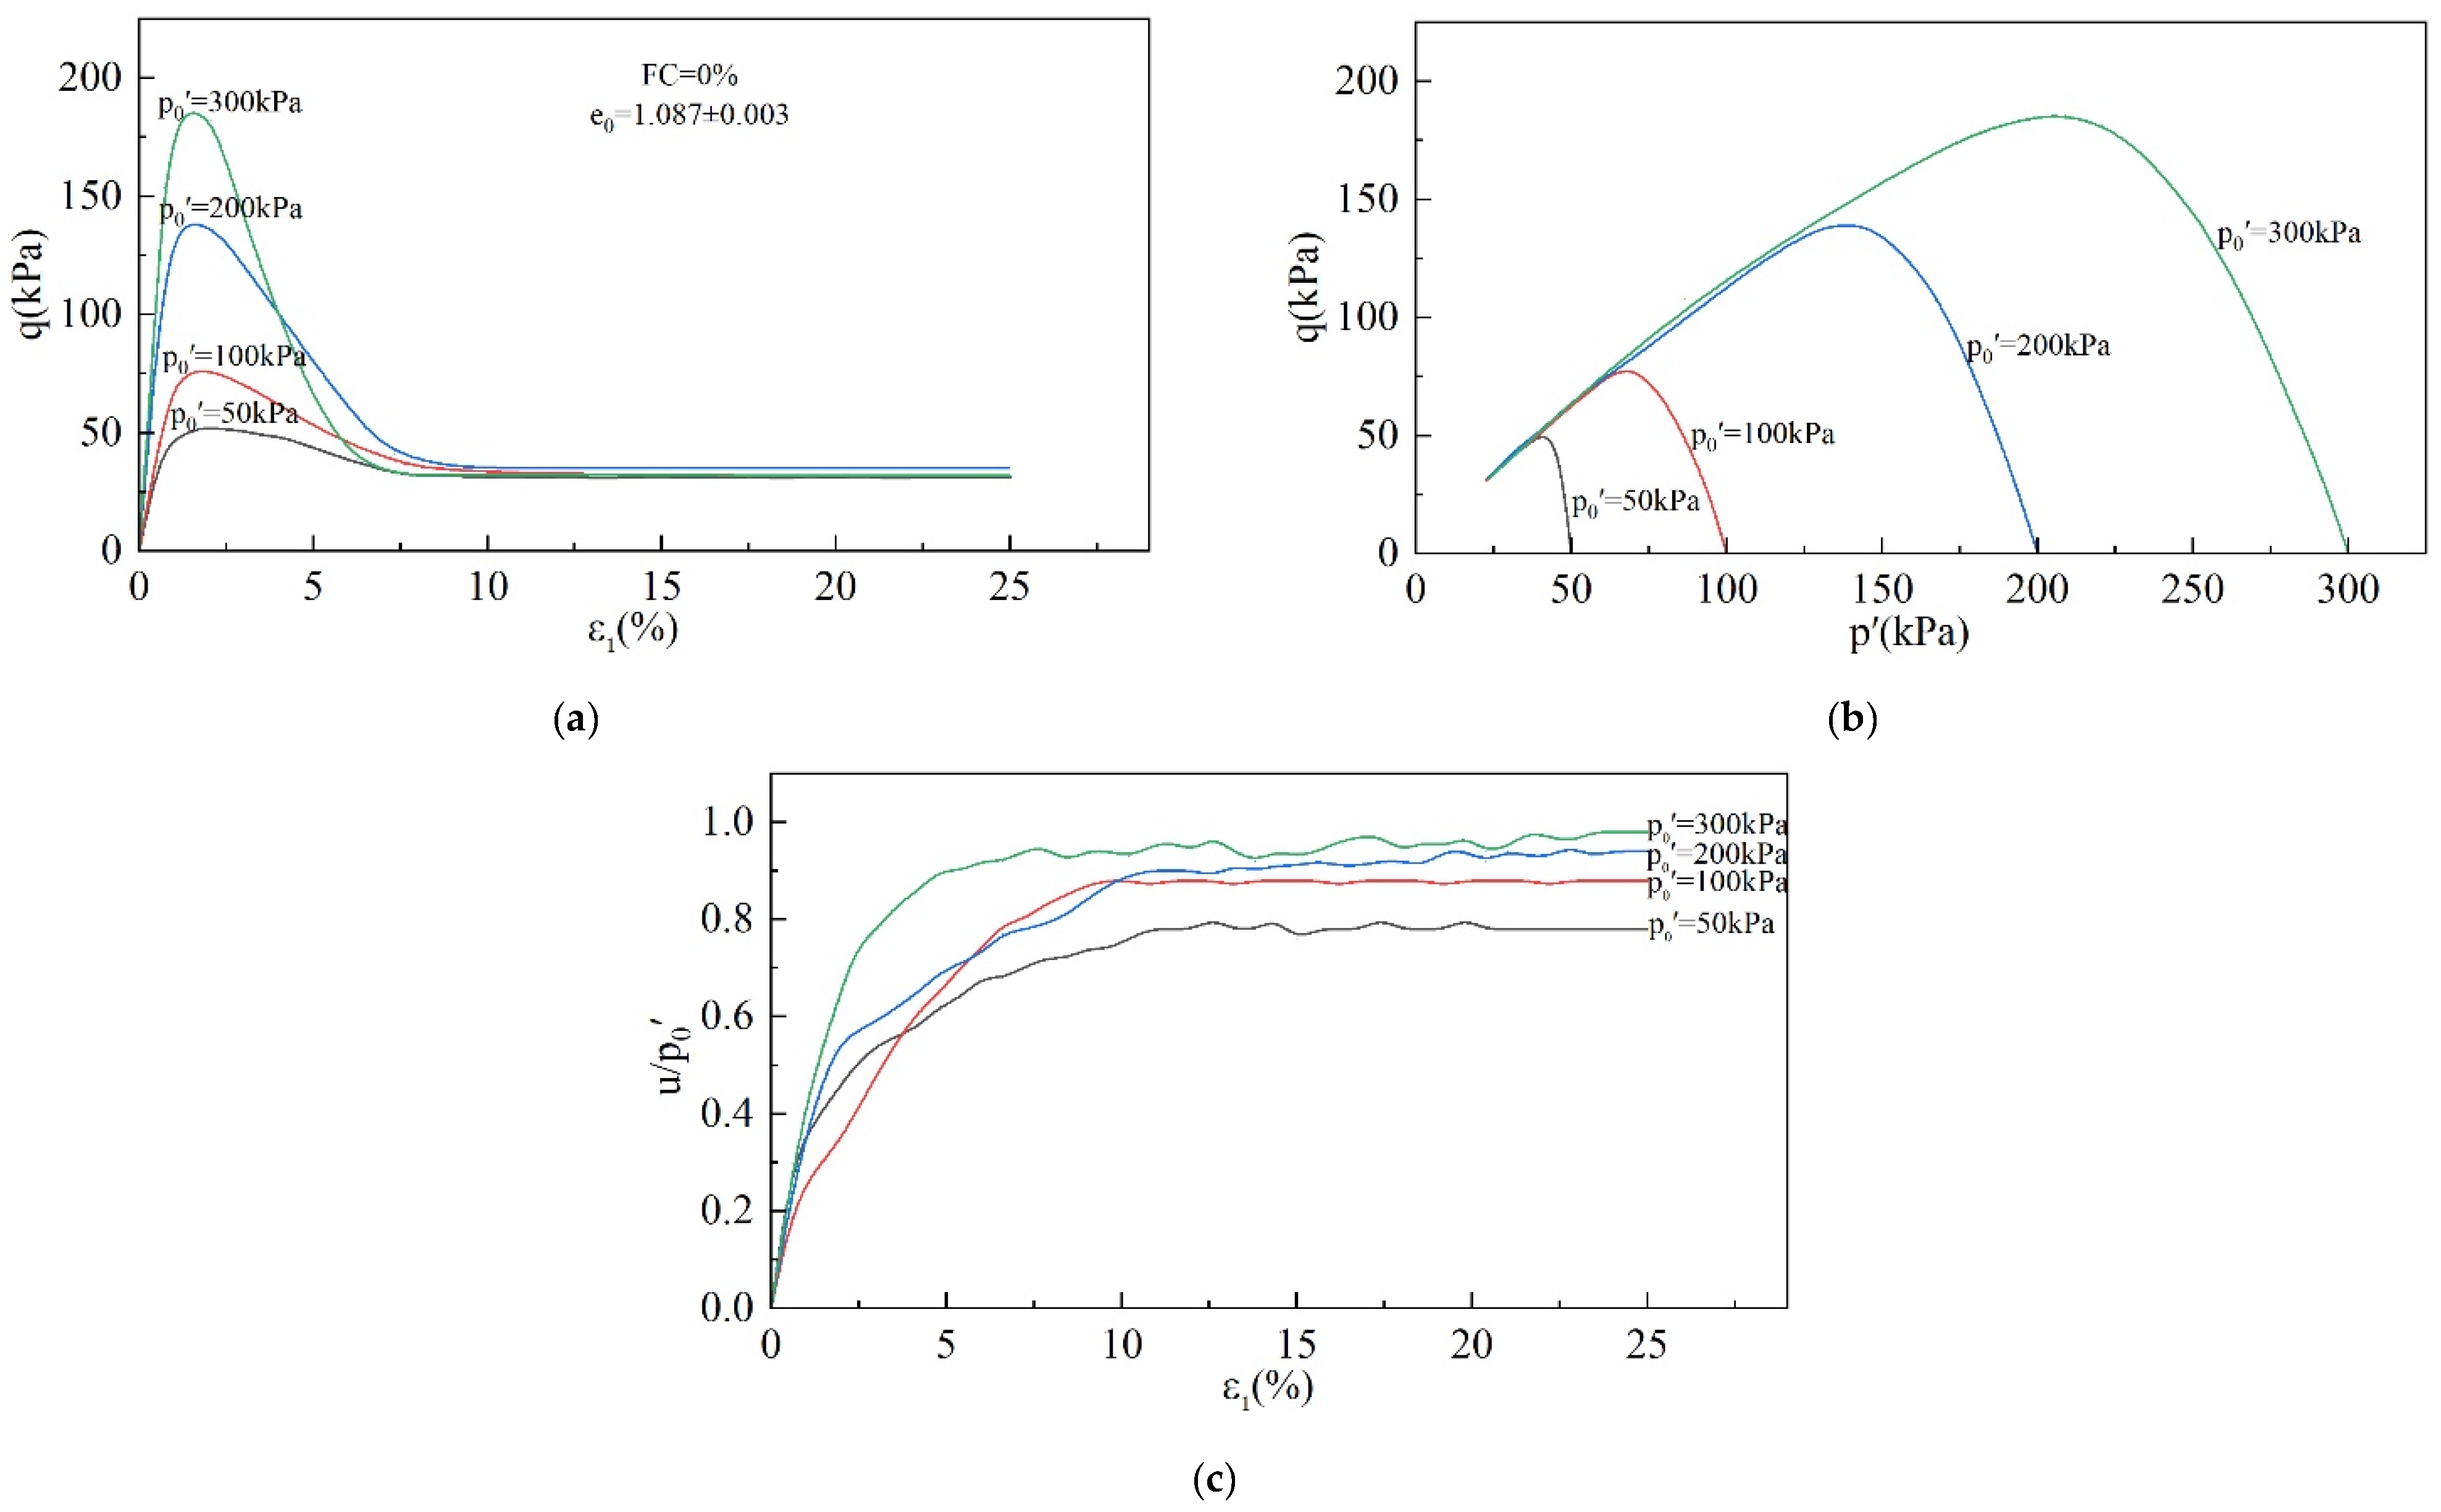
Figure 5.
Effect of p0′ on undrained behavior of tailings: (a) stress–strain diagram; (b) effective stress path diagram; (c) pore water pressure ratio diagram.
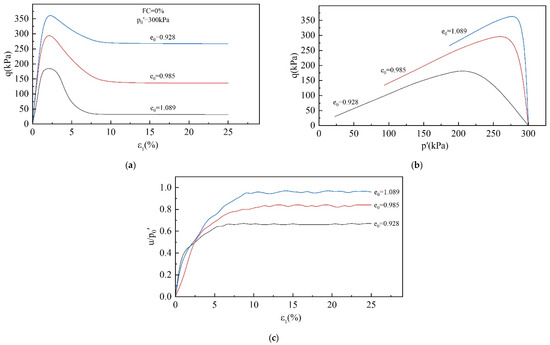
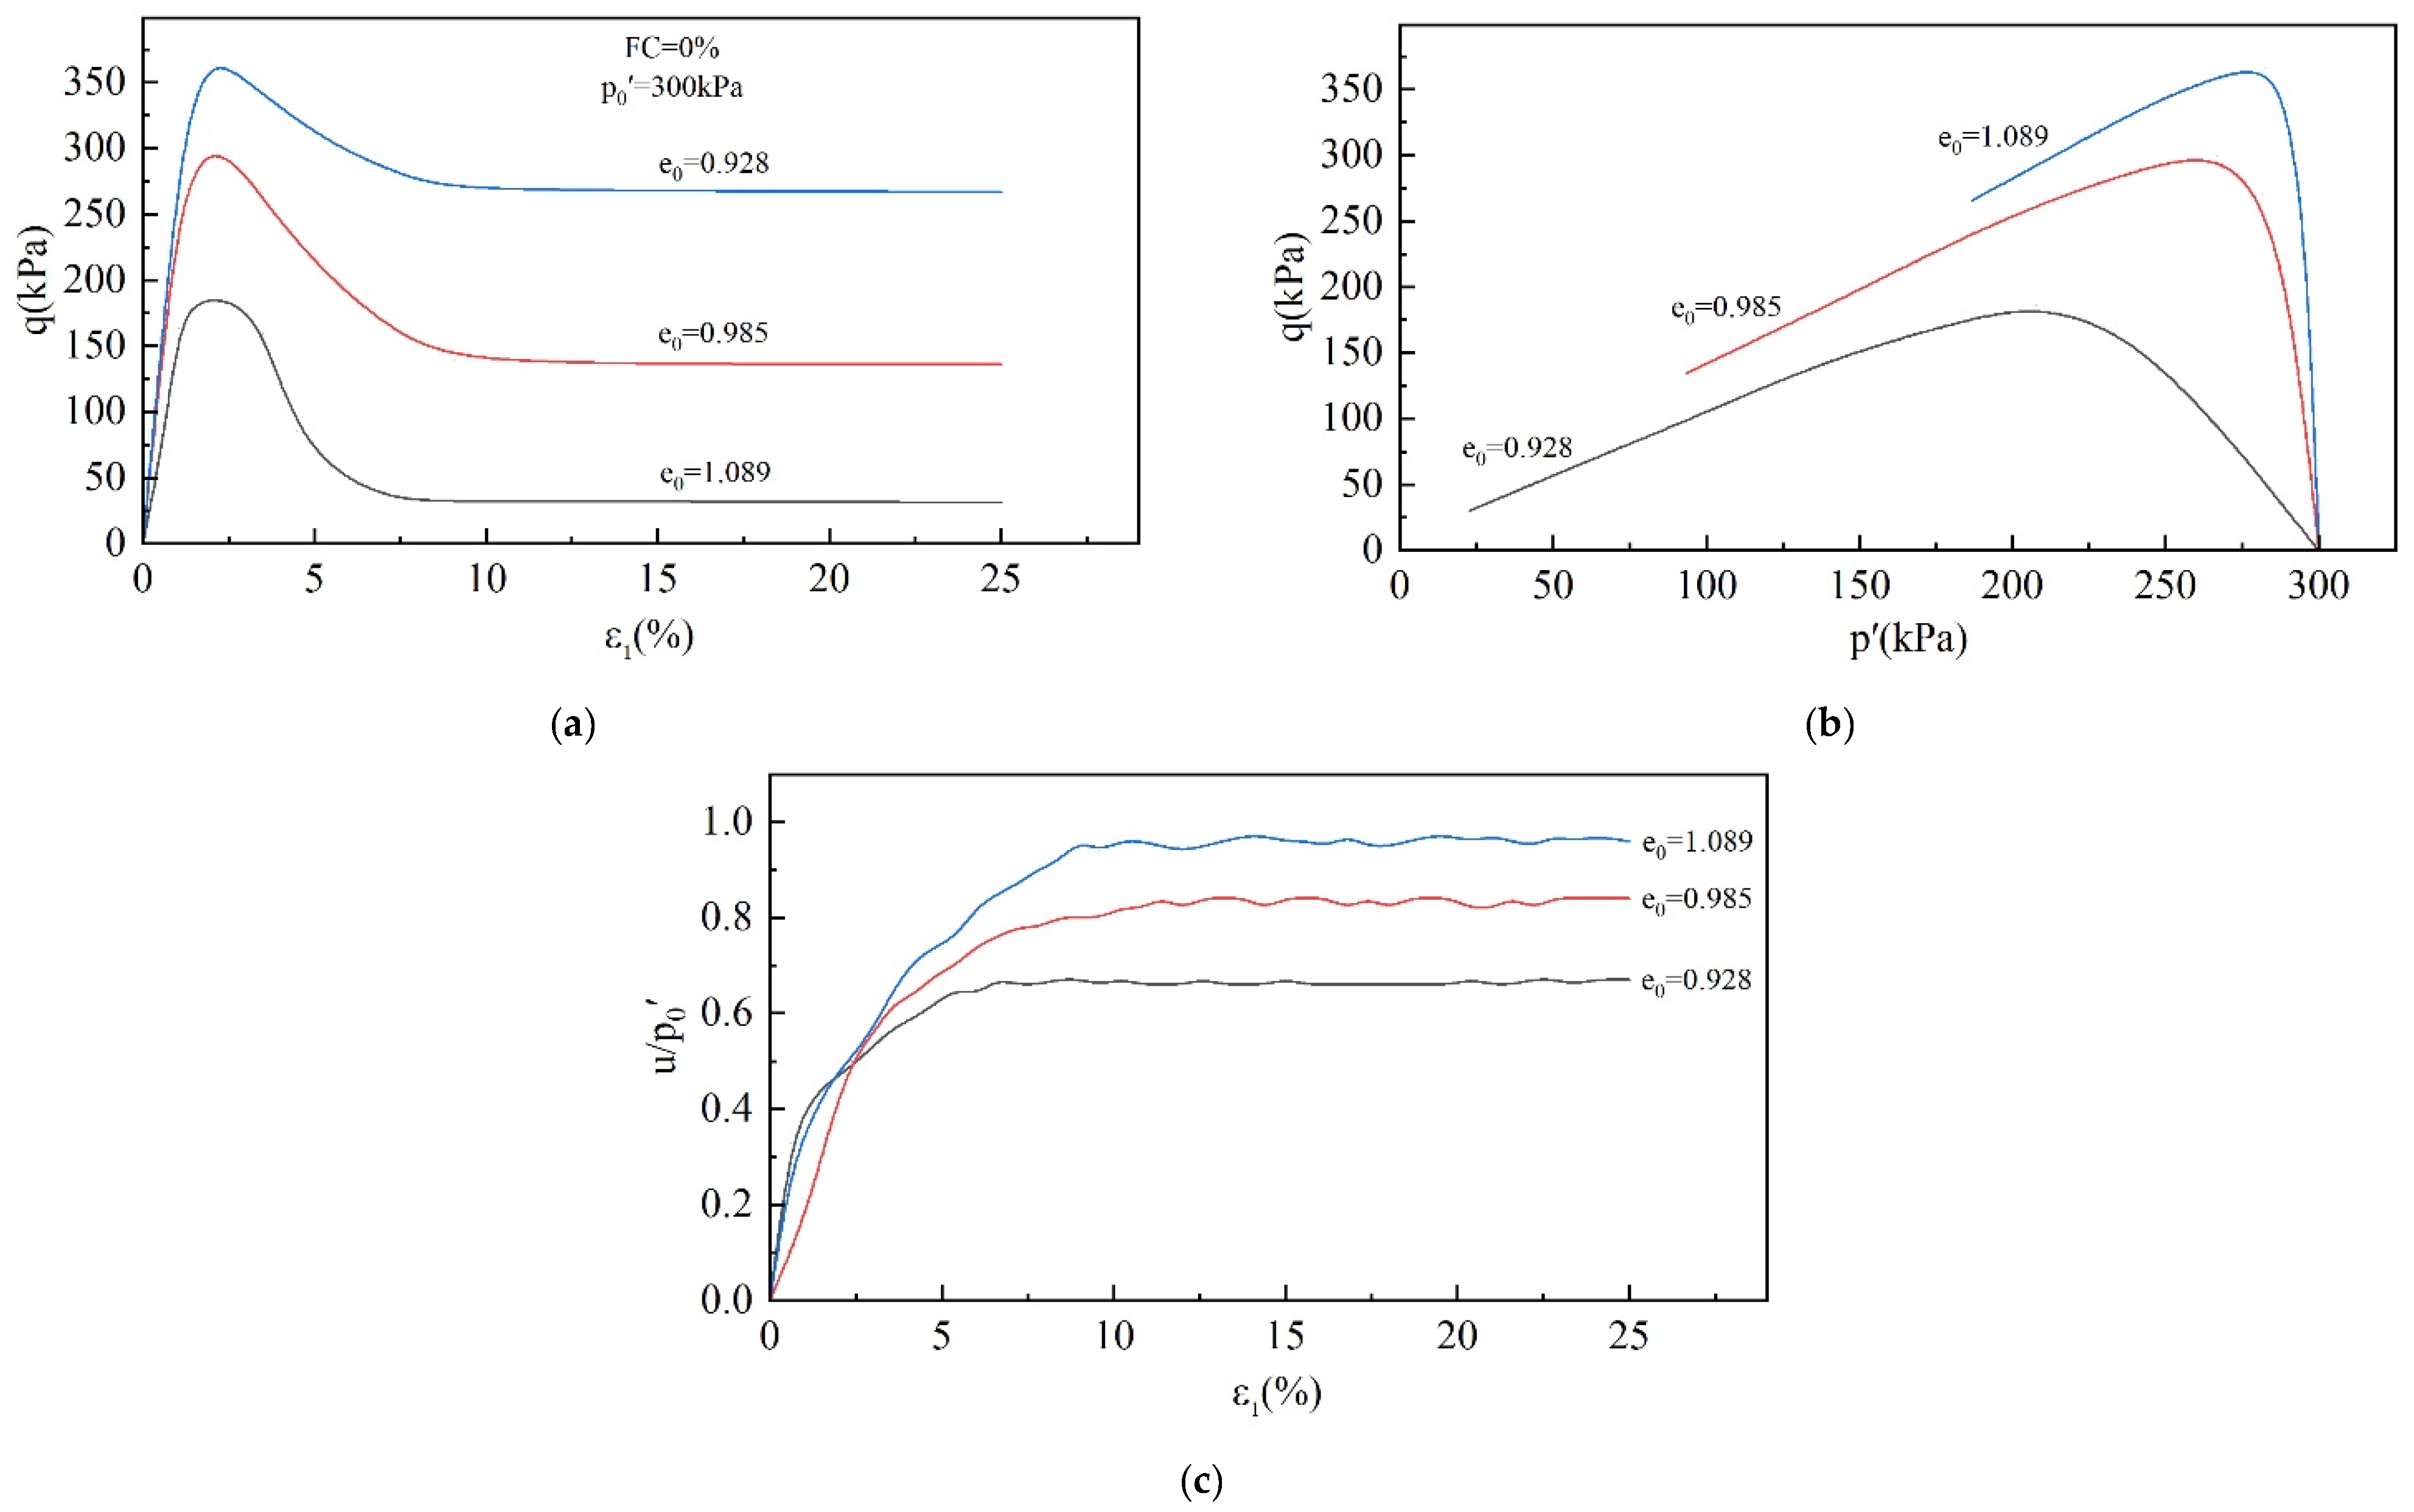
Figure 6.
Effect of e0 on undrained behavior of tailings: (a) stress–strain diagram; (b) effective stress path diagram; (c) pore water pressure ratio diagram.
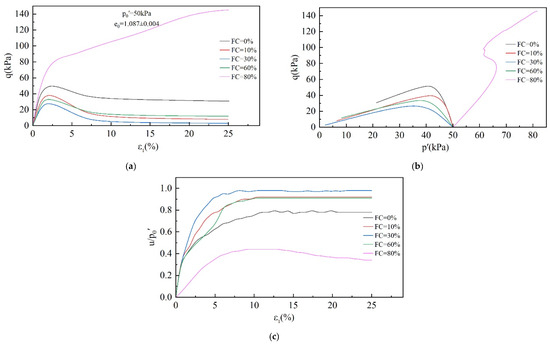
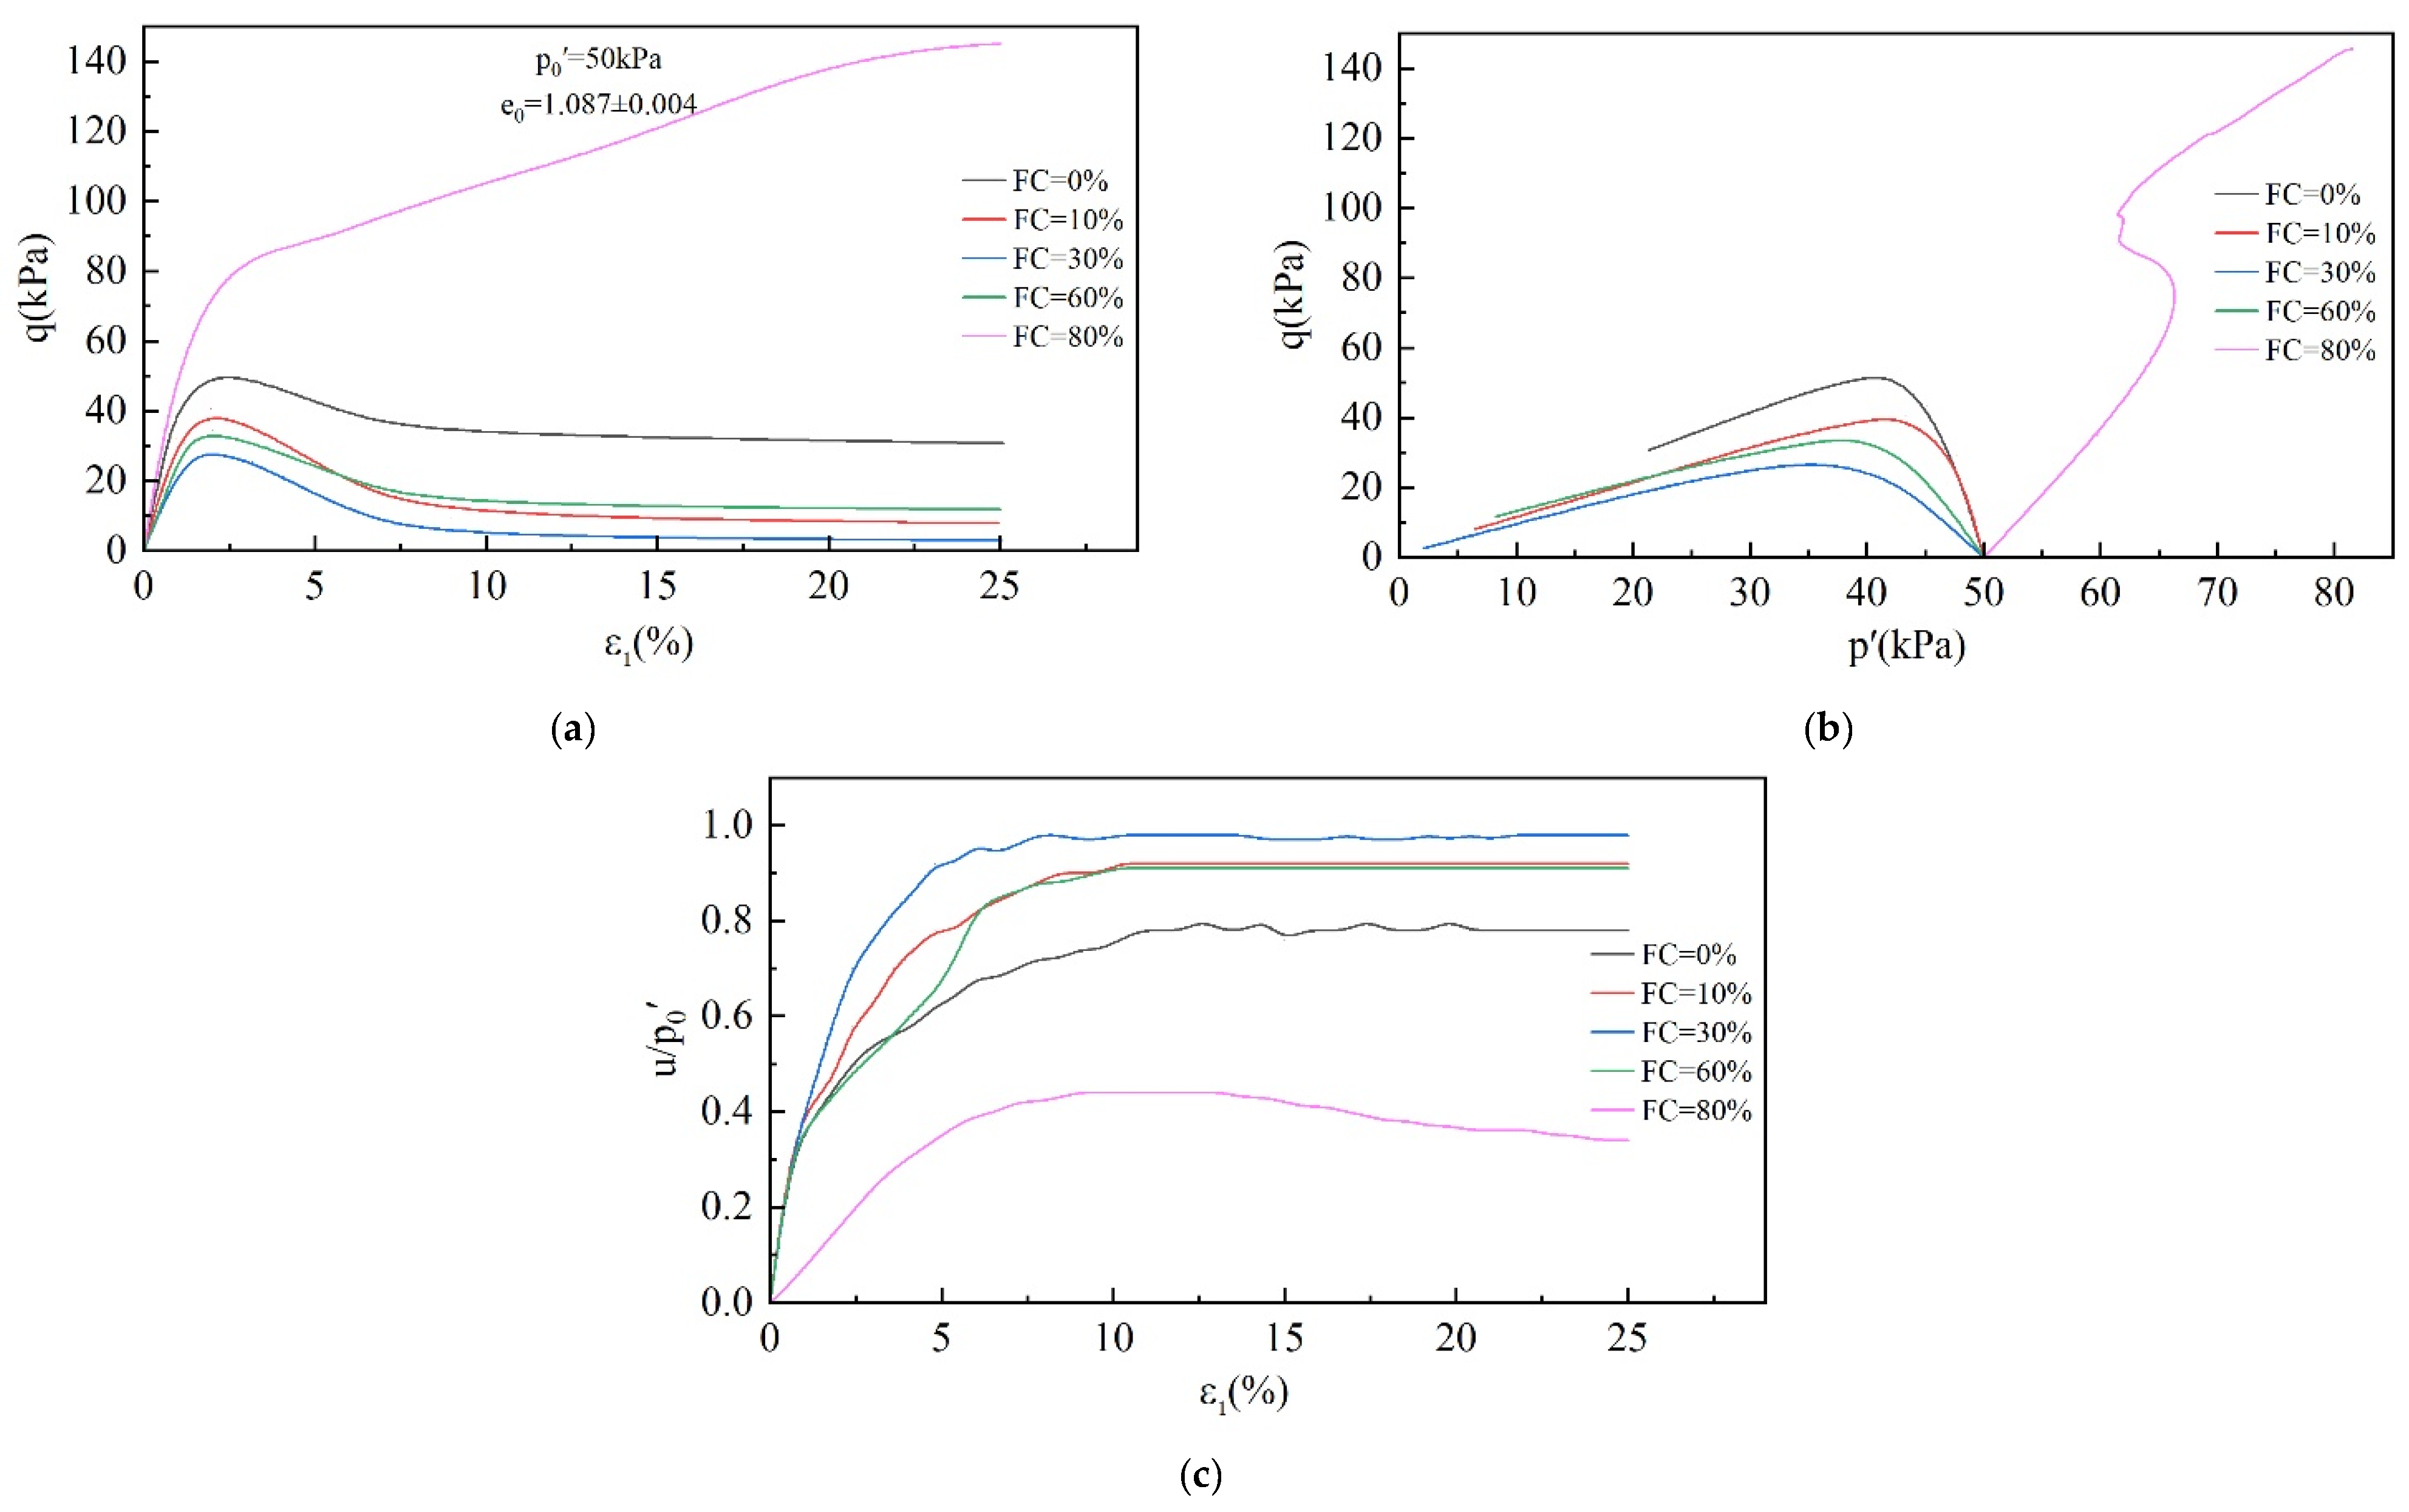
Figure 7.
Effect of FC on undrained behavior of tailings: (a) stress–strain diagram; (b) effective stress path diagram; (c) pore water pressure ratio diagram.
Figure 5 shows the effect of the p0′ on the undrained behavior of the tailings. Static liquefaction occurred in all four specimens. As shown in Figure 5a, as the strain develops, the shear stress increases and reaches a peak at about ε1 = 5% before softening. The shear stress decreases sharply and tends to a stable value after ε1 = 10%. qp increases with an increasing p0′. Figure 5b,c show that the mean effective stress decreases as shear stress is applied, which is mainly due to the increasing pore water pressure. The pore water pressure ratio indicates the degree of development of pore pressure, which increases with an increasing p0′.
Figure 6 shows the effect of the e0 on the undrained behavior of the tailings. Similar to the effect of p0′, the void ratio mainly affects the peak shear stress and pore water pressure. As e0 grows, the tailings become loose, peak shear stress decreases, and pore water pressure increases.
As can be seen in Figure 7, static liquefaction occurred in all the specimens with an FC in the range of 0–60%, and the shear stress reached its peak before the strain reached 5%, followed by softening, and tended to a stable value after the strain reached 10%. The pore water pressure, on the other hand, continued to increase and achieved stability when ε1 reached 10%. However, the final pore water pressure ratio shows a tendency of increasing and then decreasing with the increase in FC and reached a maximum value at FC = 30%. The specimen with an FC = 80% did not exhibit a static liquefaction phenomenon, and the shear stress continued to increase during the shear process. When the strain reached 25%, the shear stress had not yet reached stability. On the other hand, the pore water pressure ratio increased slowly in the early stage, achieved a brief period of stability at about 10% axial strain, and then showed a decreasing trend, proving that shear dilation occurred. From the above analysis, it can be found that the undrained behavior of tailings has a significant dependence on p0′, e0, and FC.
The behavior of specimens undergoing static liquefaction can be summarized in three stages. The first is (i) the stage of increasing shear stress. In this stage, as the shear strain increases, the pore water pressure and the shear stress increase, eventually reaching the peak strength. (ii) The next is the strength-softening stage. (iii) Subsequently, there is the strength stability stage. As the shear strain continues to develop, the shear strength remains unchanged, and the pore water pressure reaches its maximum value and remains unchanged. The division point between stages (i) and (ii) represents the undrained shear strength of the specimen and the onset of static liquefaction or instability. In the next stage (iii), the specimen reaches the critical state. Obviously, the instability point and the critical state point are critical for studying static liquefaction. These two points mark the beginning and the final state of static liquefaction and determine the severity of static liquefaction.
3.1.1. Critical State
In this study, the state at ε1 = 25% was taken as the critical state. The CSLs were fitted from critical state points and are shown in Figure 8.
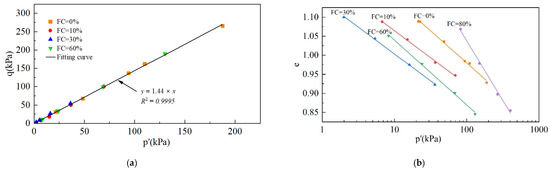
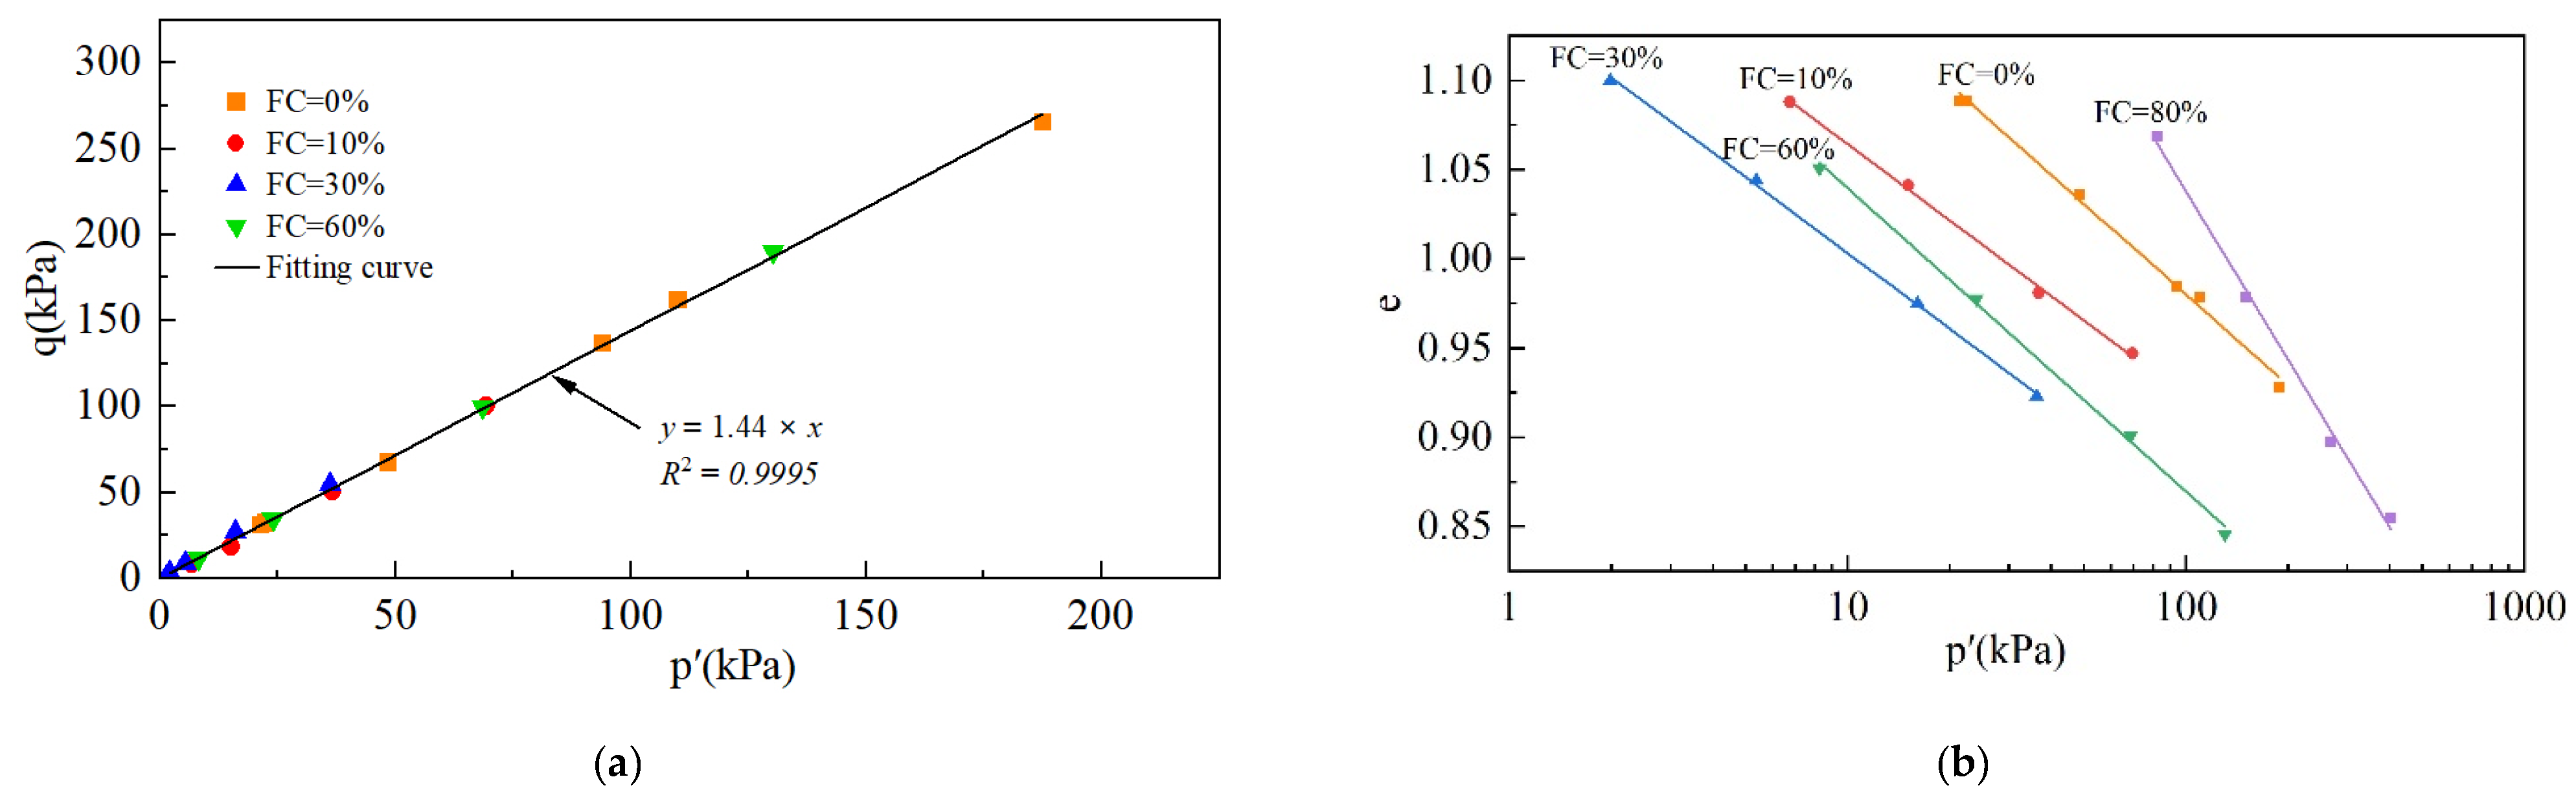
Figure 8.
The CSLs: (a) the CSL in q-p′ space; (b) the CSLs in e-p′ space.
With the change in FC, the critical stress ratio M becomes almost constant, with a mean value of M = 1.44. It can be assumed that FC has no effect on M, as described in the results reported by Bouckovalas [27]. Previous studies [38,51] have shown that the CSL can be expressed as a straight line on the e-lnp′ plane using Equation (6):
where Γ is the intercept of the vertical coordinate at p′ = 1 kPa, and λ represents the slope of the CSL in e-lnp space. Figure 8b shows that the CSLs are approximately parallel to each other as FC increases in the range of 0–60%, with λ being a constant regardless of the FC. This is because λ increases with increasing particle angularity [36,38]. The fines and base tailings used in the tests were taken from the same tailings and had the same particle angles. However, the variation in Γ was due to the change in FC with different particle size distributions [38]. The CSLs at FC = 80% are not parallel to the other CSLs, mainly because the specimens with an FC = 80% exhibit shear dilation and do not reach the critical state at ε1 = 25%. However, a trend in Γ relating to differences in FC could be determined; that is, Γ decreased and then increased as the FC increased from 0% to 80%, with a minimum value at FC = 30%.
3.1.2. IL
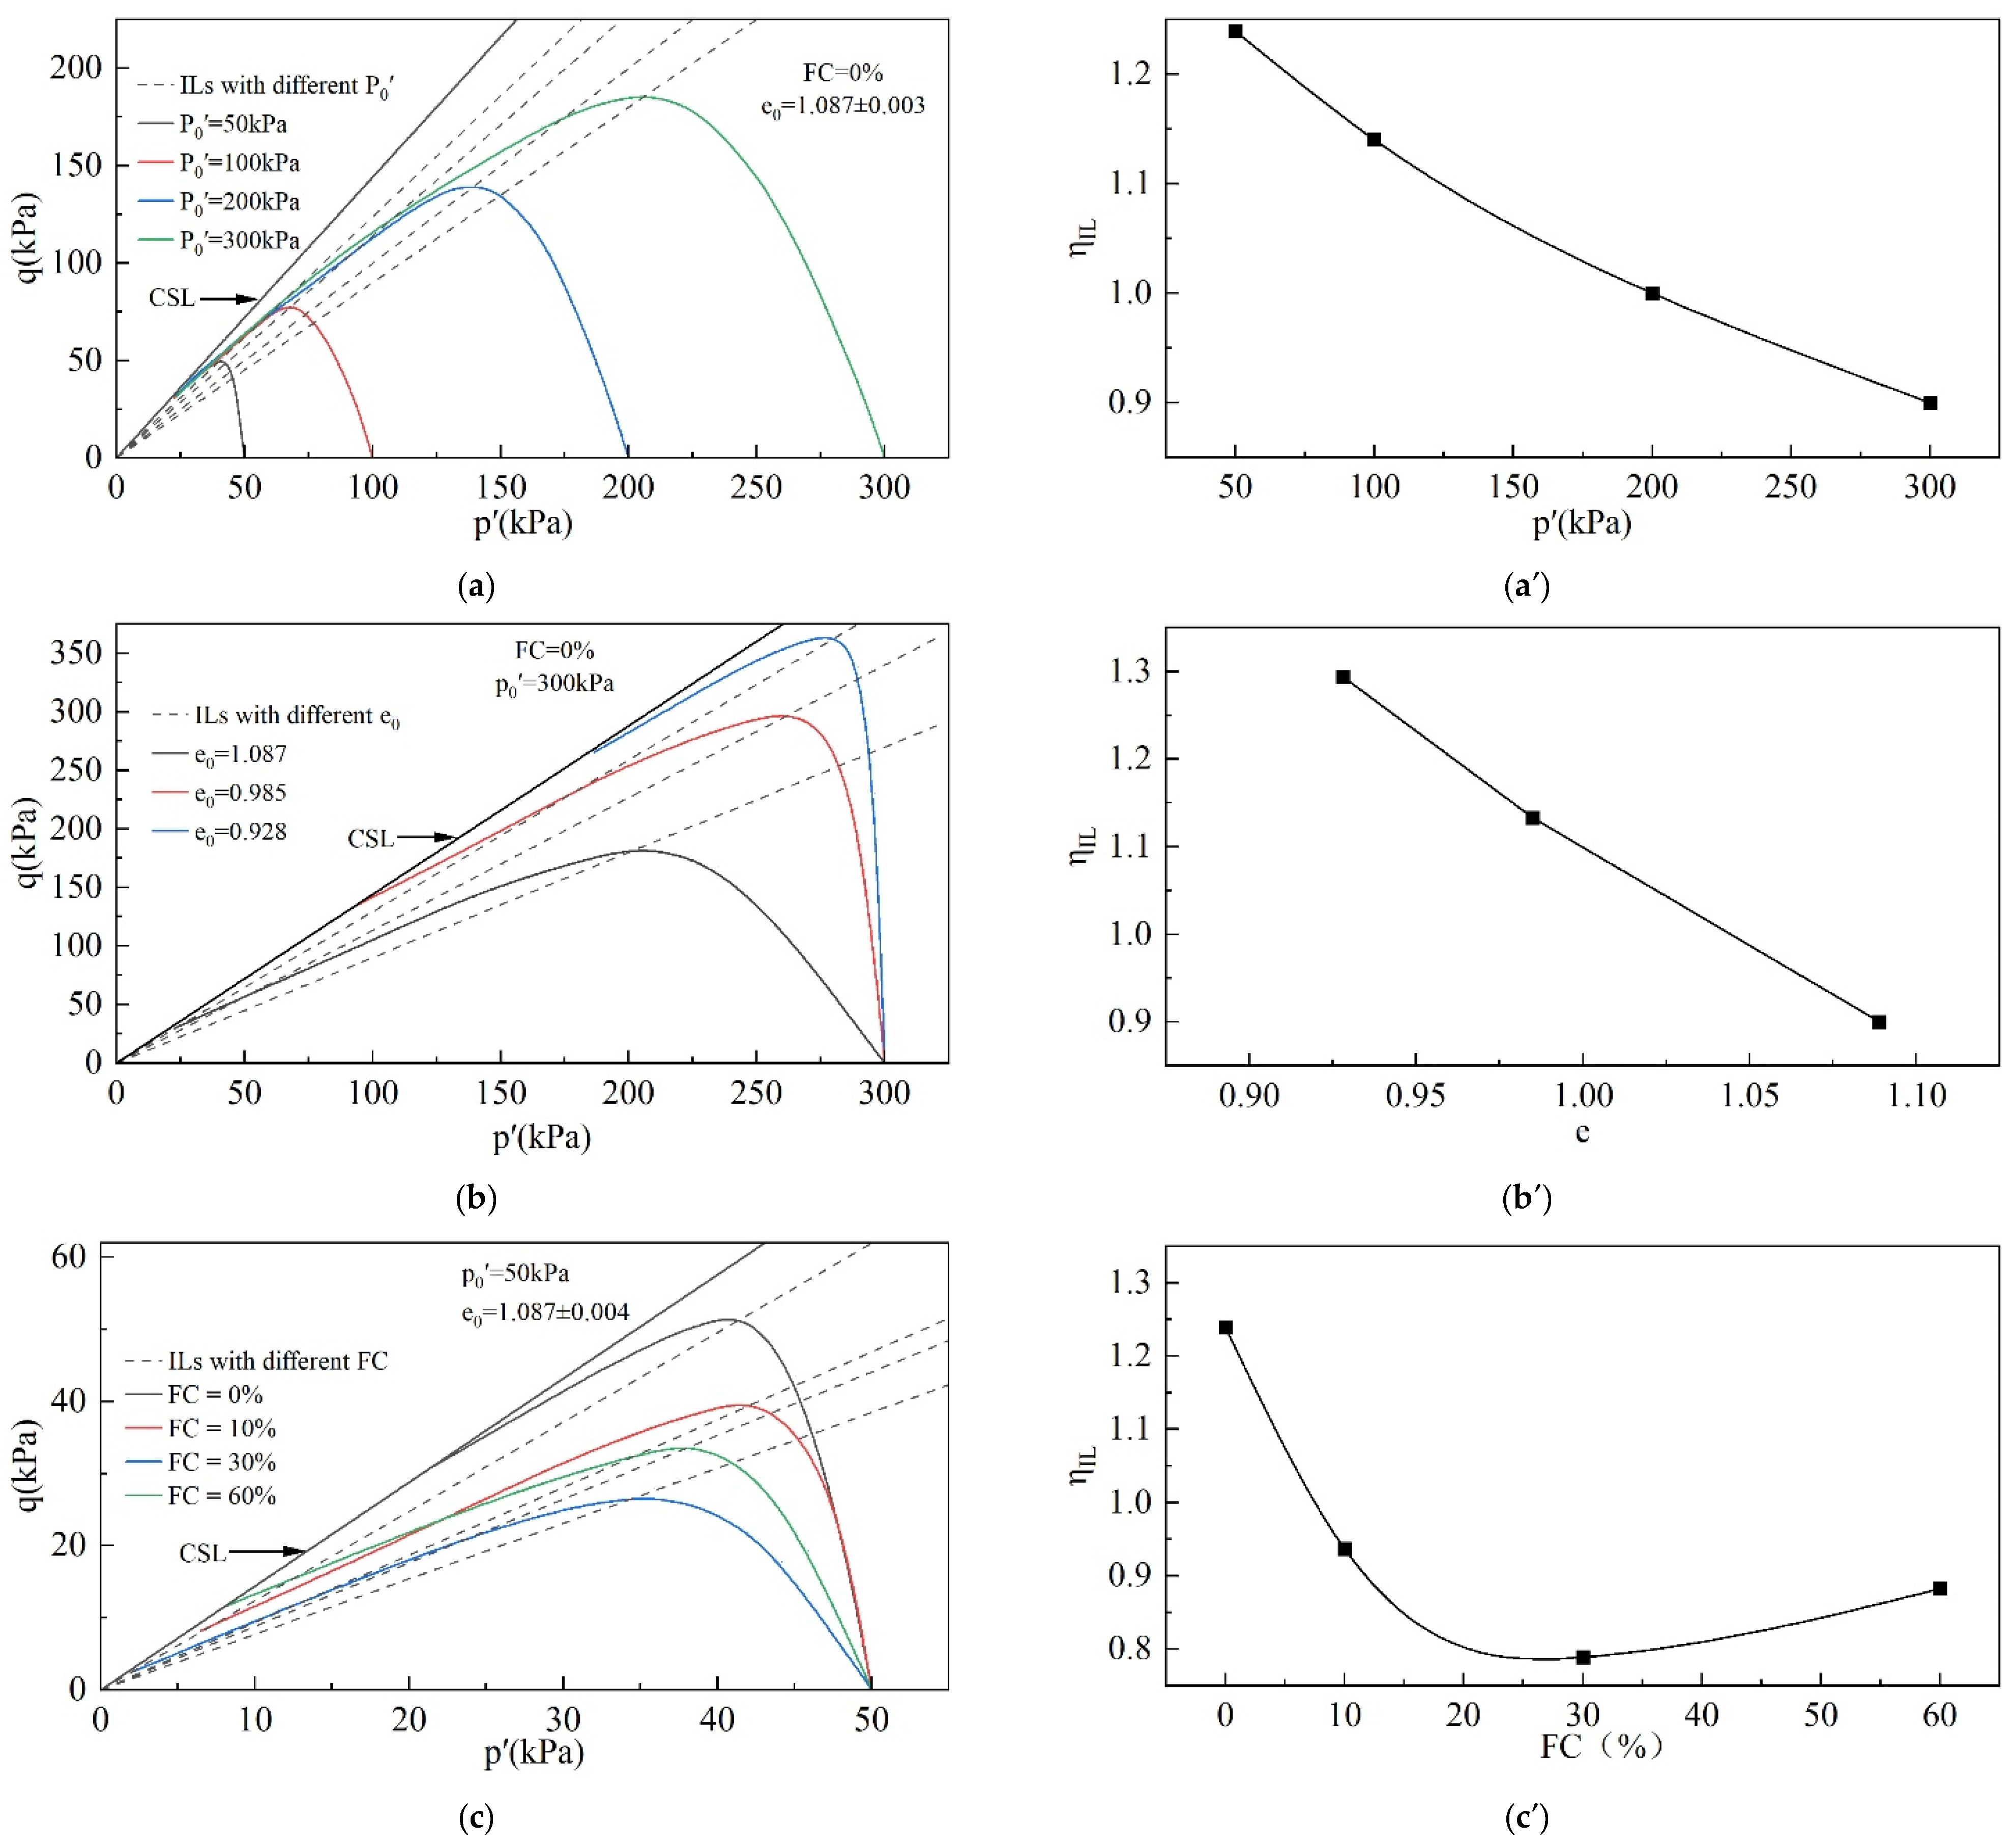
It is interesting to examine how the IL is affected by the initial state and FC of tailings. Figure 9 illustrates the ILs for different initial states and FCs.
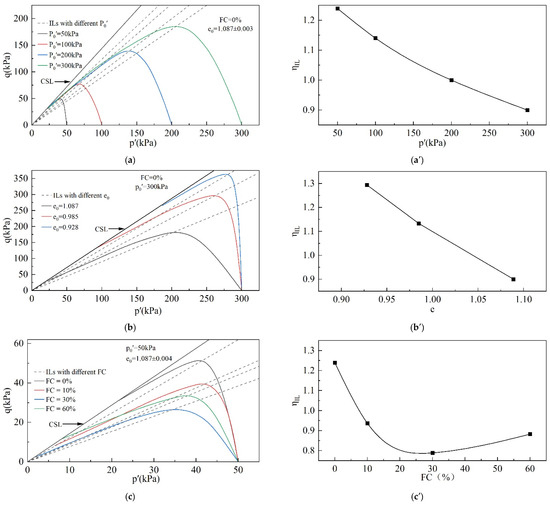
Figure 9.
Tailings’ ILs: (a,a′) effect of p0′; (b,b′) effect of e0; (c,c′) effect of FC.
In Figure 9, ηIL is closely related to p0′, e0, and FC. ηIL decreases monotonically as p0′ and e0 increase. This result indicates that static liquefaction is more likely to be triggered at larger e0 and higher p0′. When the e0 and p0′ are constant, ηIL decreases and then increases with the increase in FC. ηIL reaches its lowest value at FC = 30%. This indicates that the change in FC cannot be simply interpreted as beneficial or detrimental to the stability of tailings. For the tailings used in this study, when the FC is less than 30%, the increase in the FC is detrimental to the tailings’ stability, while when the FC is greater than 30%, the increase in FC helps to improve the tailings’ stability and reduce the possibility of static liquefaction. When the FC = 30%, it is most detrimental for the stability of tailings.
3.1.3. Undrained Shear Strength
In this study, for specimens undergoing static liquefaction, the undrained shear strength is equivalent to qp, which represents the maximum shear stress for resisting static liquefaction.
Figure 10 presents the variation in qp with p0′, e0, and FC. qp increases with an increasing p0′, rising from 52.2 kPa at p0′ = 50 kPa to 187 kPa at p0′ = 300 kPa. qp decreases with an increasing e0, falling from 366.4 kPa at e0 = 0.928 to 187 kPa at e0 = 1.089. The increase in e0 leads to a growth in pore water pressure (Figure 6c), which in turn leads to a reduction in mean effective stress and ultimately a reduction in undrained shear strength. The effect of FC on qp is not monotonic, but there is a threshold. When the FC is below the threshold, qp decreases with an increasing FC, but the trend is opposite when the FC exceeds the threshold. The FC threshold for the tailings is around 30%.
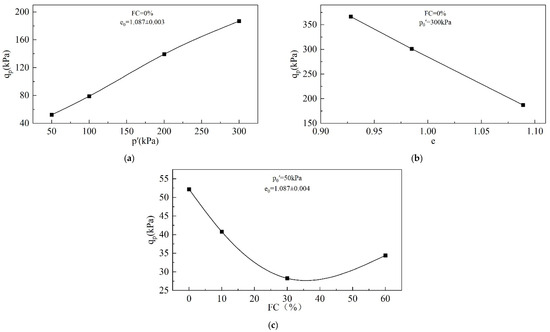
Figure 10.
Undrained shear strength of tailings: (a) effect of p0′; (b) effect of e0; (c) effect of FC.
3.1.4. Brittleness Index
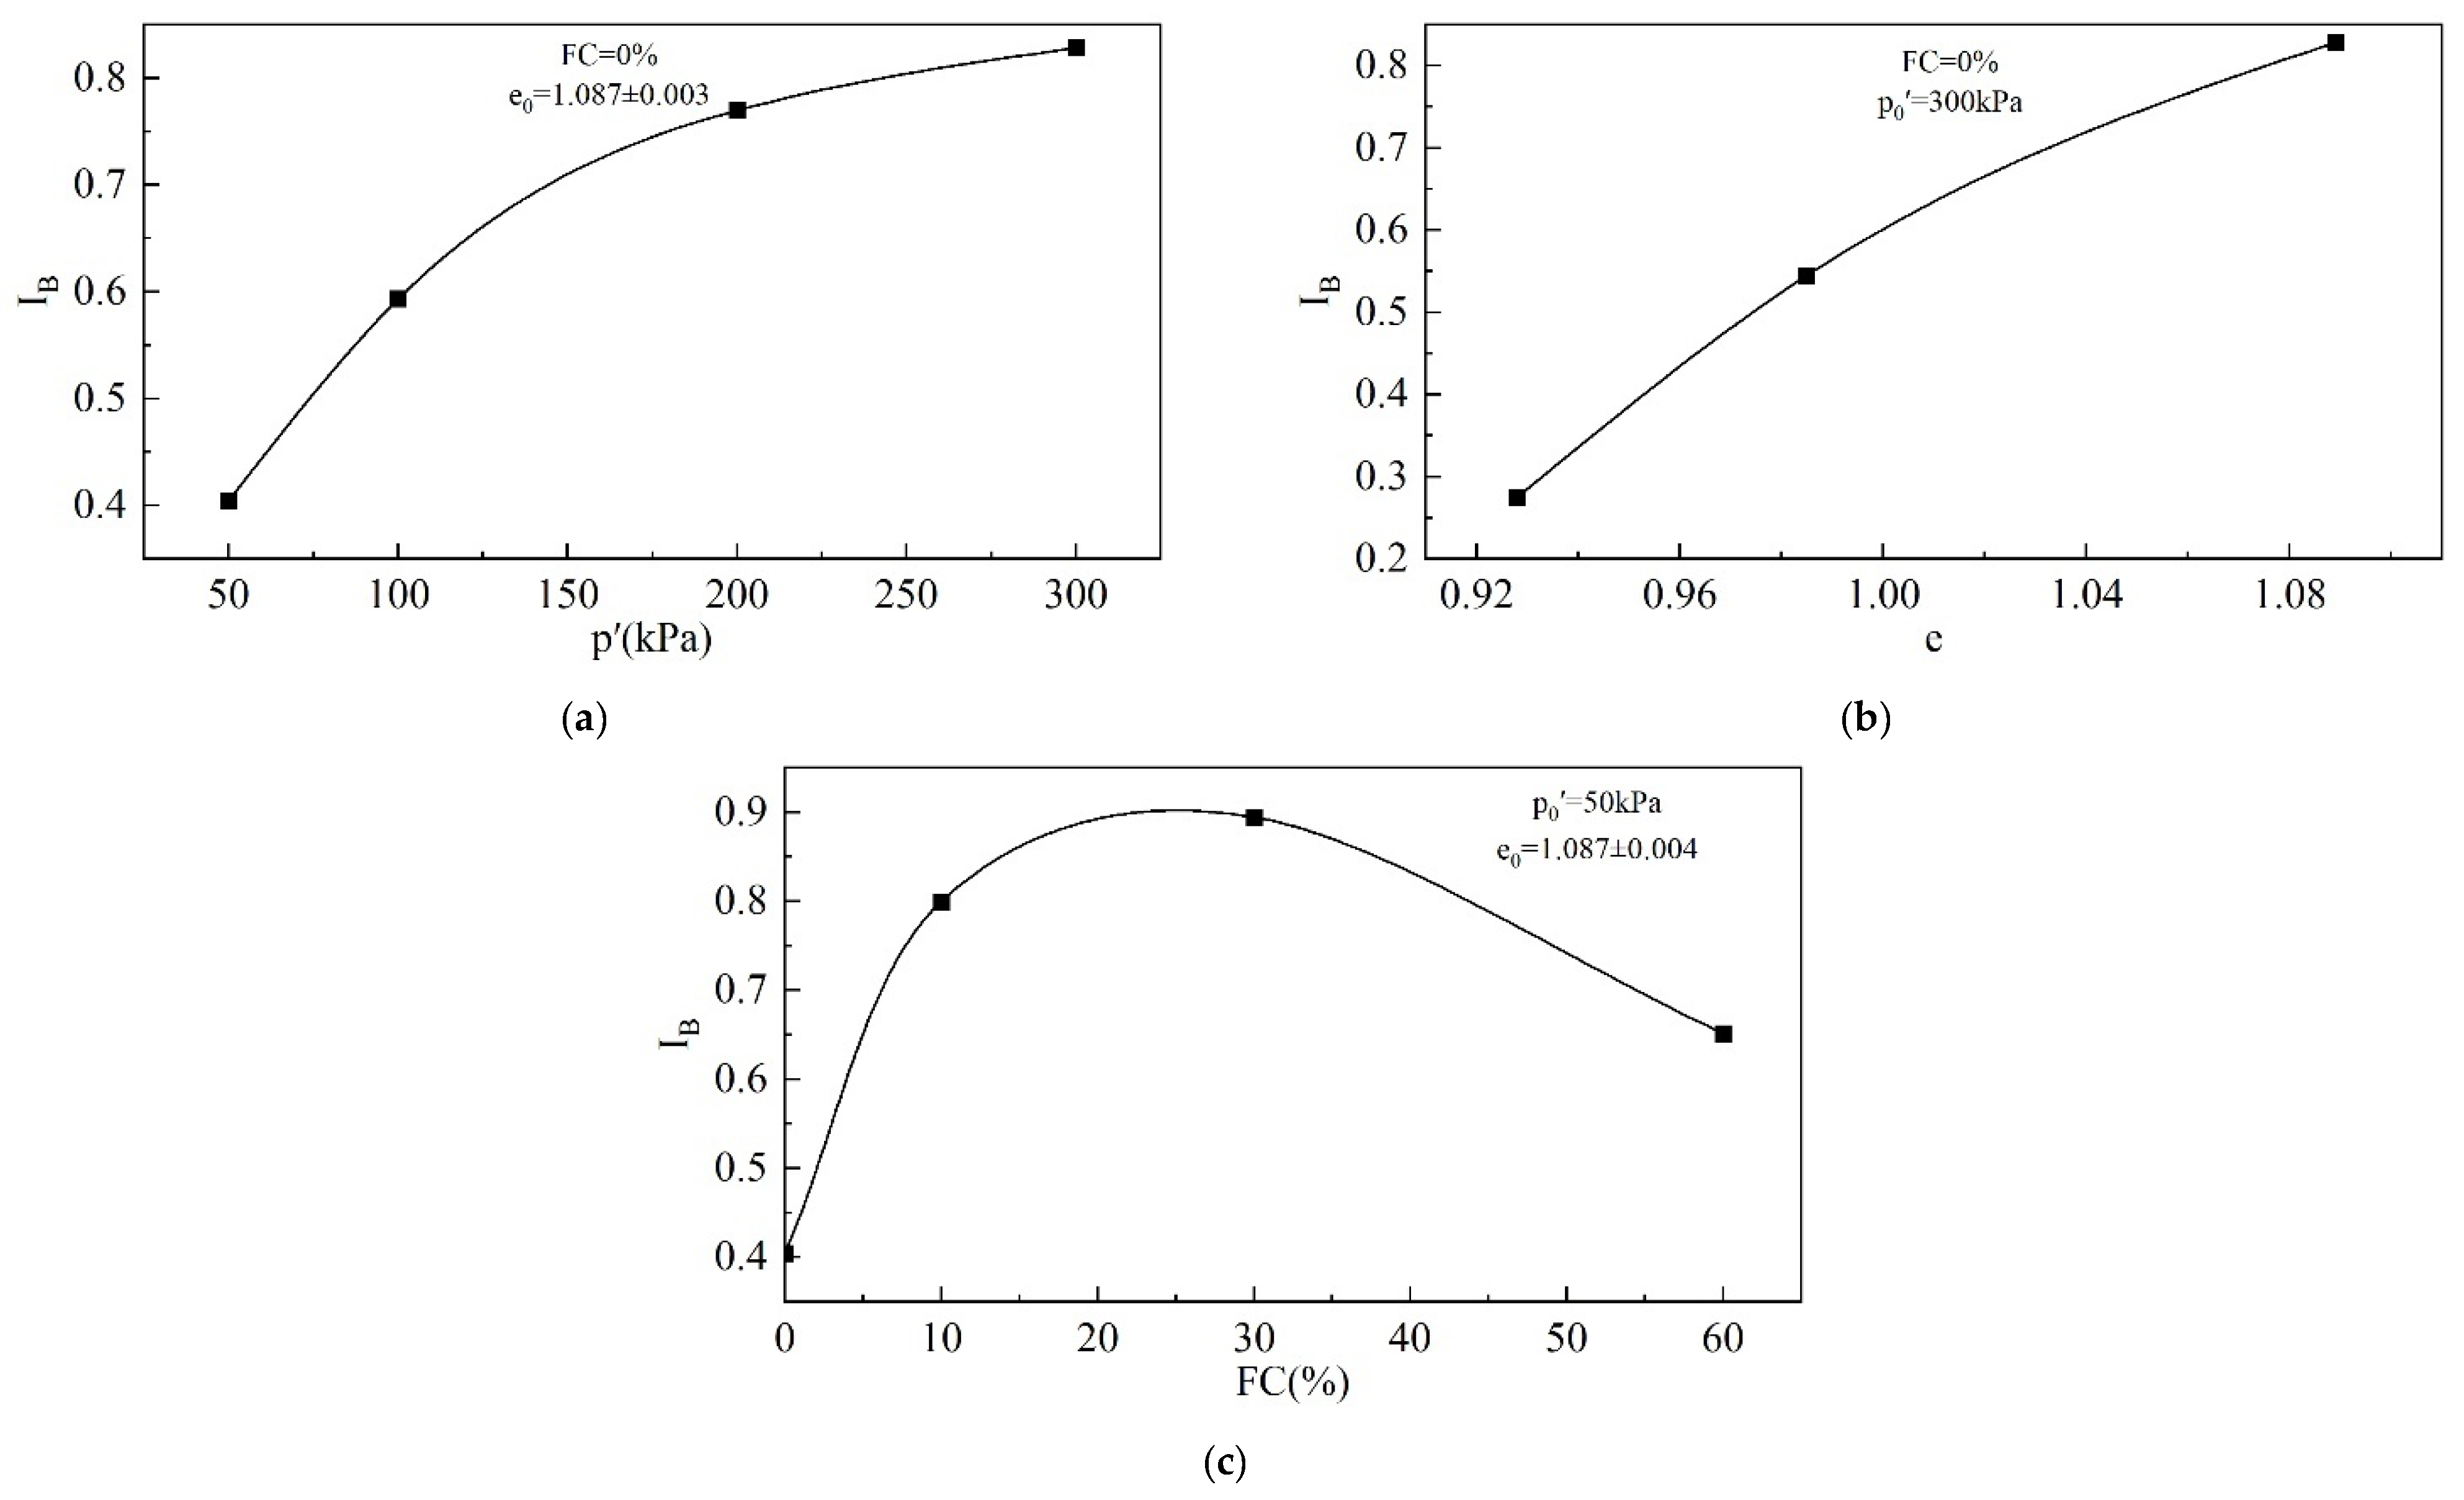
The brittleness index (IB) is commonly employed to evaluate the extent of strength softening or the severity of liquefaction.
IB ranges from 0 to 1. An undrained IB = 1 indicates that the qcs of the tailings specimen is 0 kPa, and complete static liquefaction occurs. When the undrained IB = 0, this indicates that the qcs of the tailings is the same as the qp, that is, the q-ε1 curve is strain-hardening, and the tailings do not have the potential for static liquefaction.
Figure 11 presents the variation in IB with e0, p0′, and FC. IB increases with the increase in p0′, but the trend slows down gradually. When p0′ increases from 50 kPa to 300 kPa, the IB increases from 0.404 to 0.828, a more than twofold increase. IB increases with the increase in e0, indicating a growth in the softening degree. When e0 = 1.089, IB reaches as high as 0.828, which is close to the point of complete liquefaction. Obviously, the increase in both the p0′ and e0 will increase the risk of the tailings’ static liquefaction and the severity of this risk. Figure 11c shows that there exists a threshold for the effect of FC on IB. As the FC increases, IB increases first and then decreases. The FC threshold for the tailings is around 30%.

Figure 11.
IB of tailings: (a) effect of p0′; (b) effect of e0; (c) effect of FC.
3.2. Analysis of OC Tests
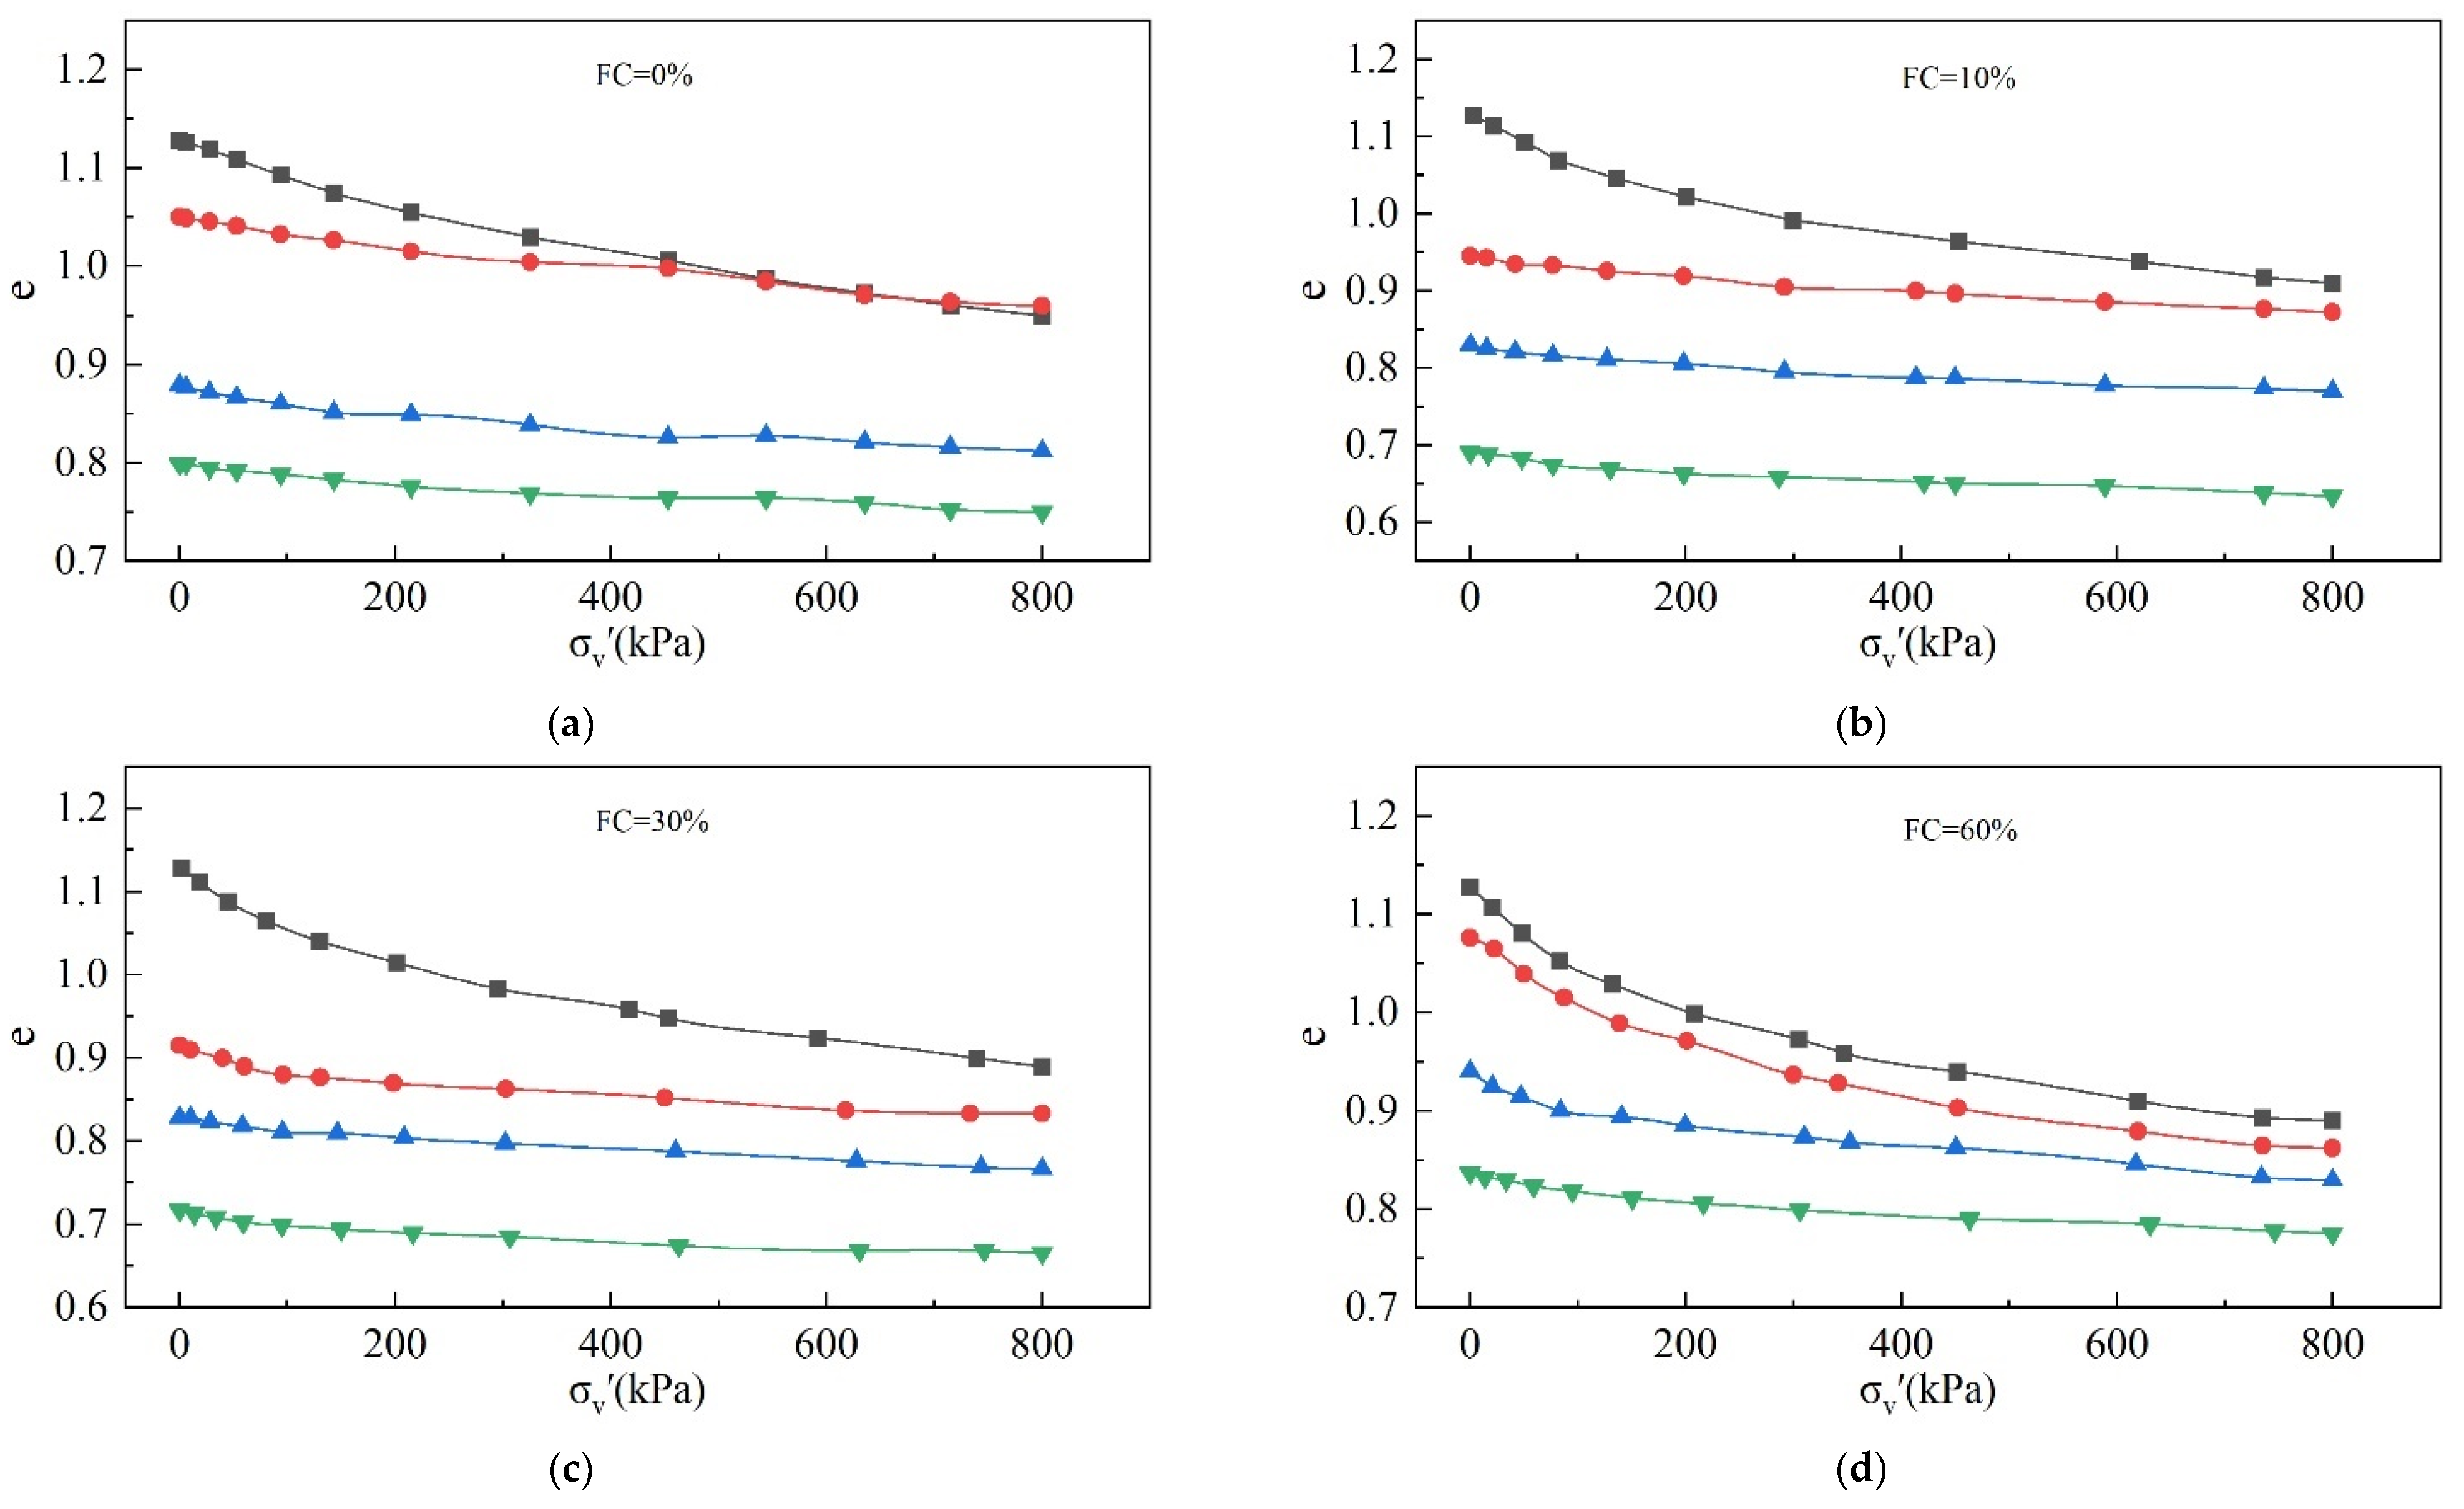
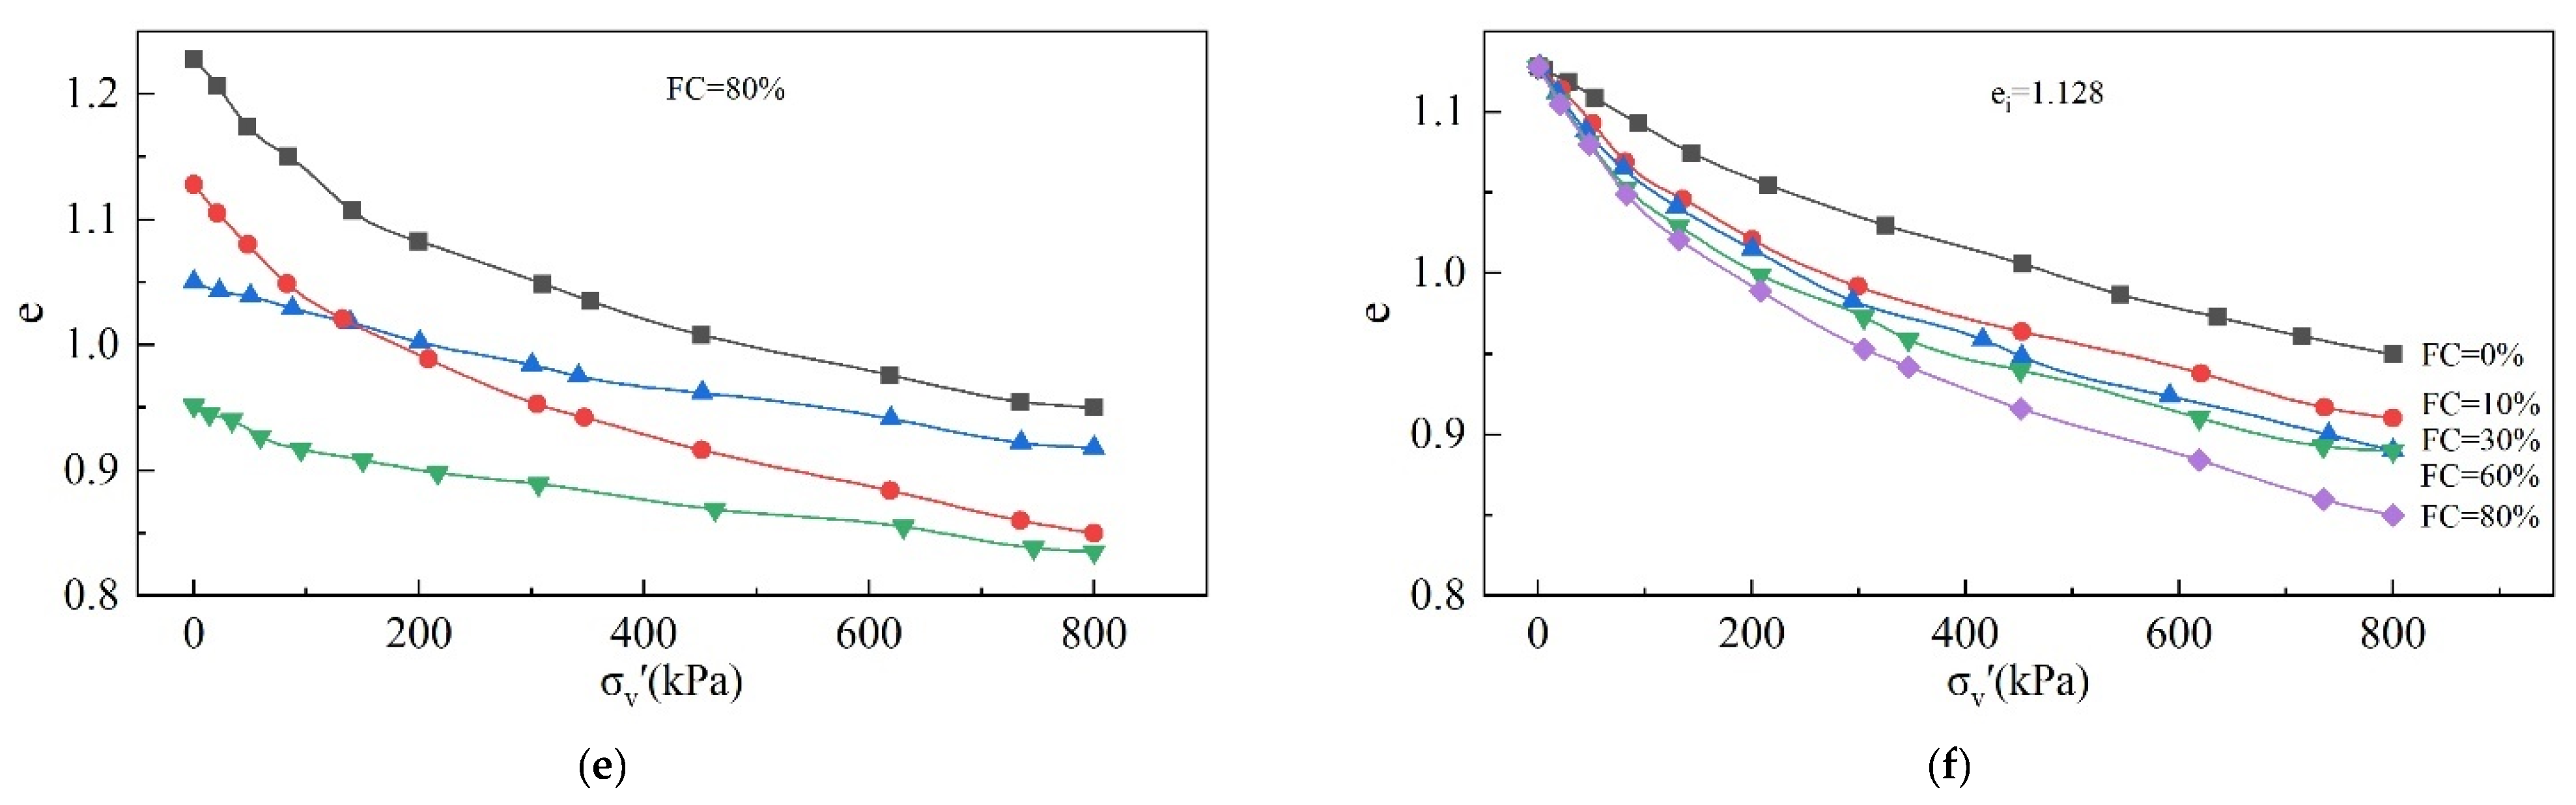
The OC tests results are shown in the Figure 12.

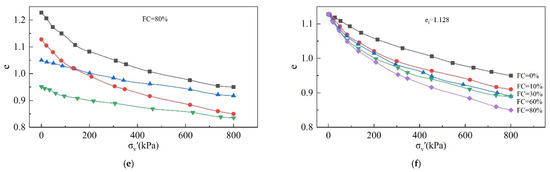
Figure 12.
Compression curves of tailings with different ei and FCs: (a) FC = 0%; (b) FC = 10%; (c) FC = 30%; (d) FC = 60%; (e) FC = 80%; (f) ei = 1.128.
As shown in Figure 12, with the increase in σv′, the void ratio and the slope of the compression curves gradually decrease. The compression curves exhibit different compressibility with different initial void ratios and FCs.
Compressibility [48,49] can be defined as the slope of the compression curve at different points:
As can be seen from the Equation (8), compressibility represents the variation in the void ratio caused by the variation in vertical pressure per unit. The greater the compressibility, the easier it is for a material to be compressed.
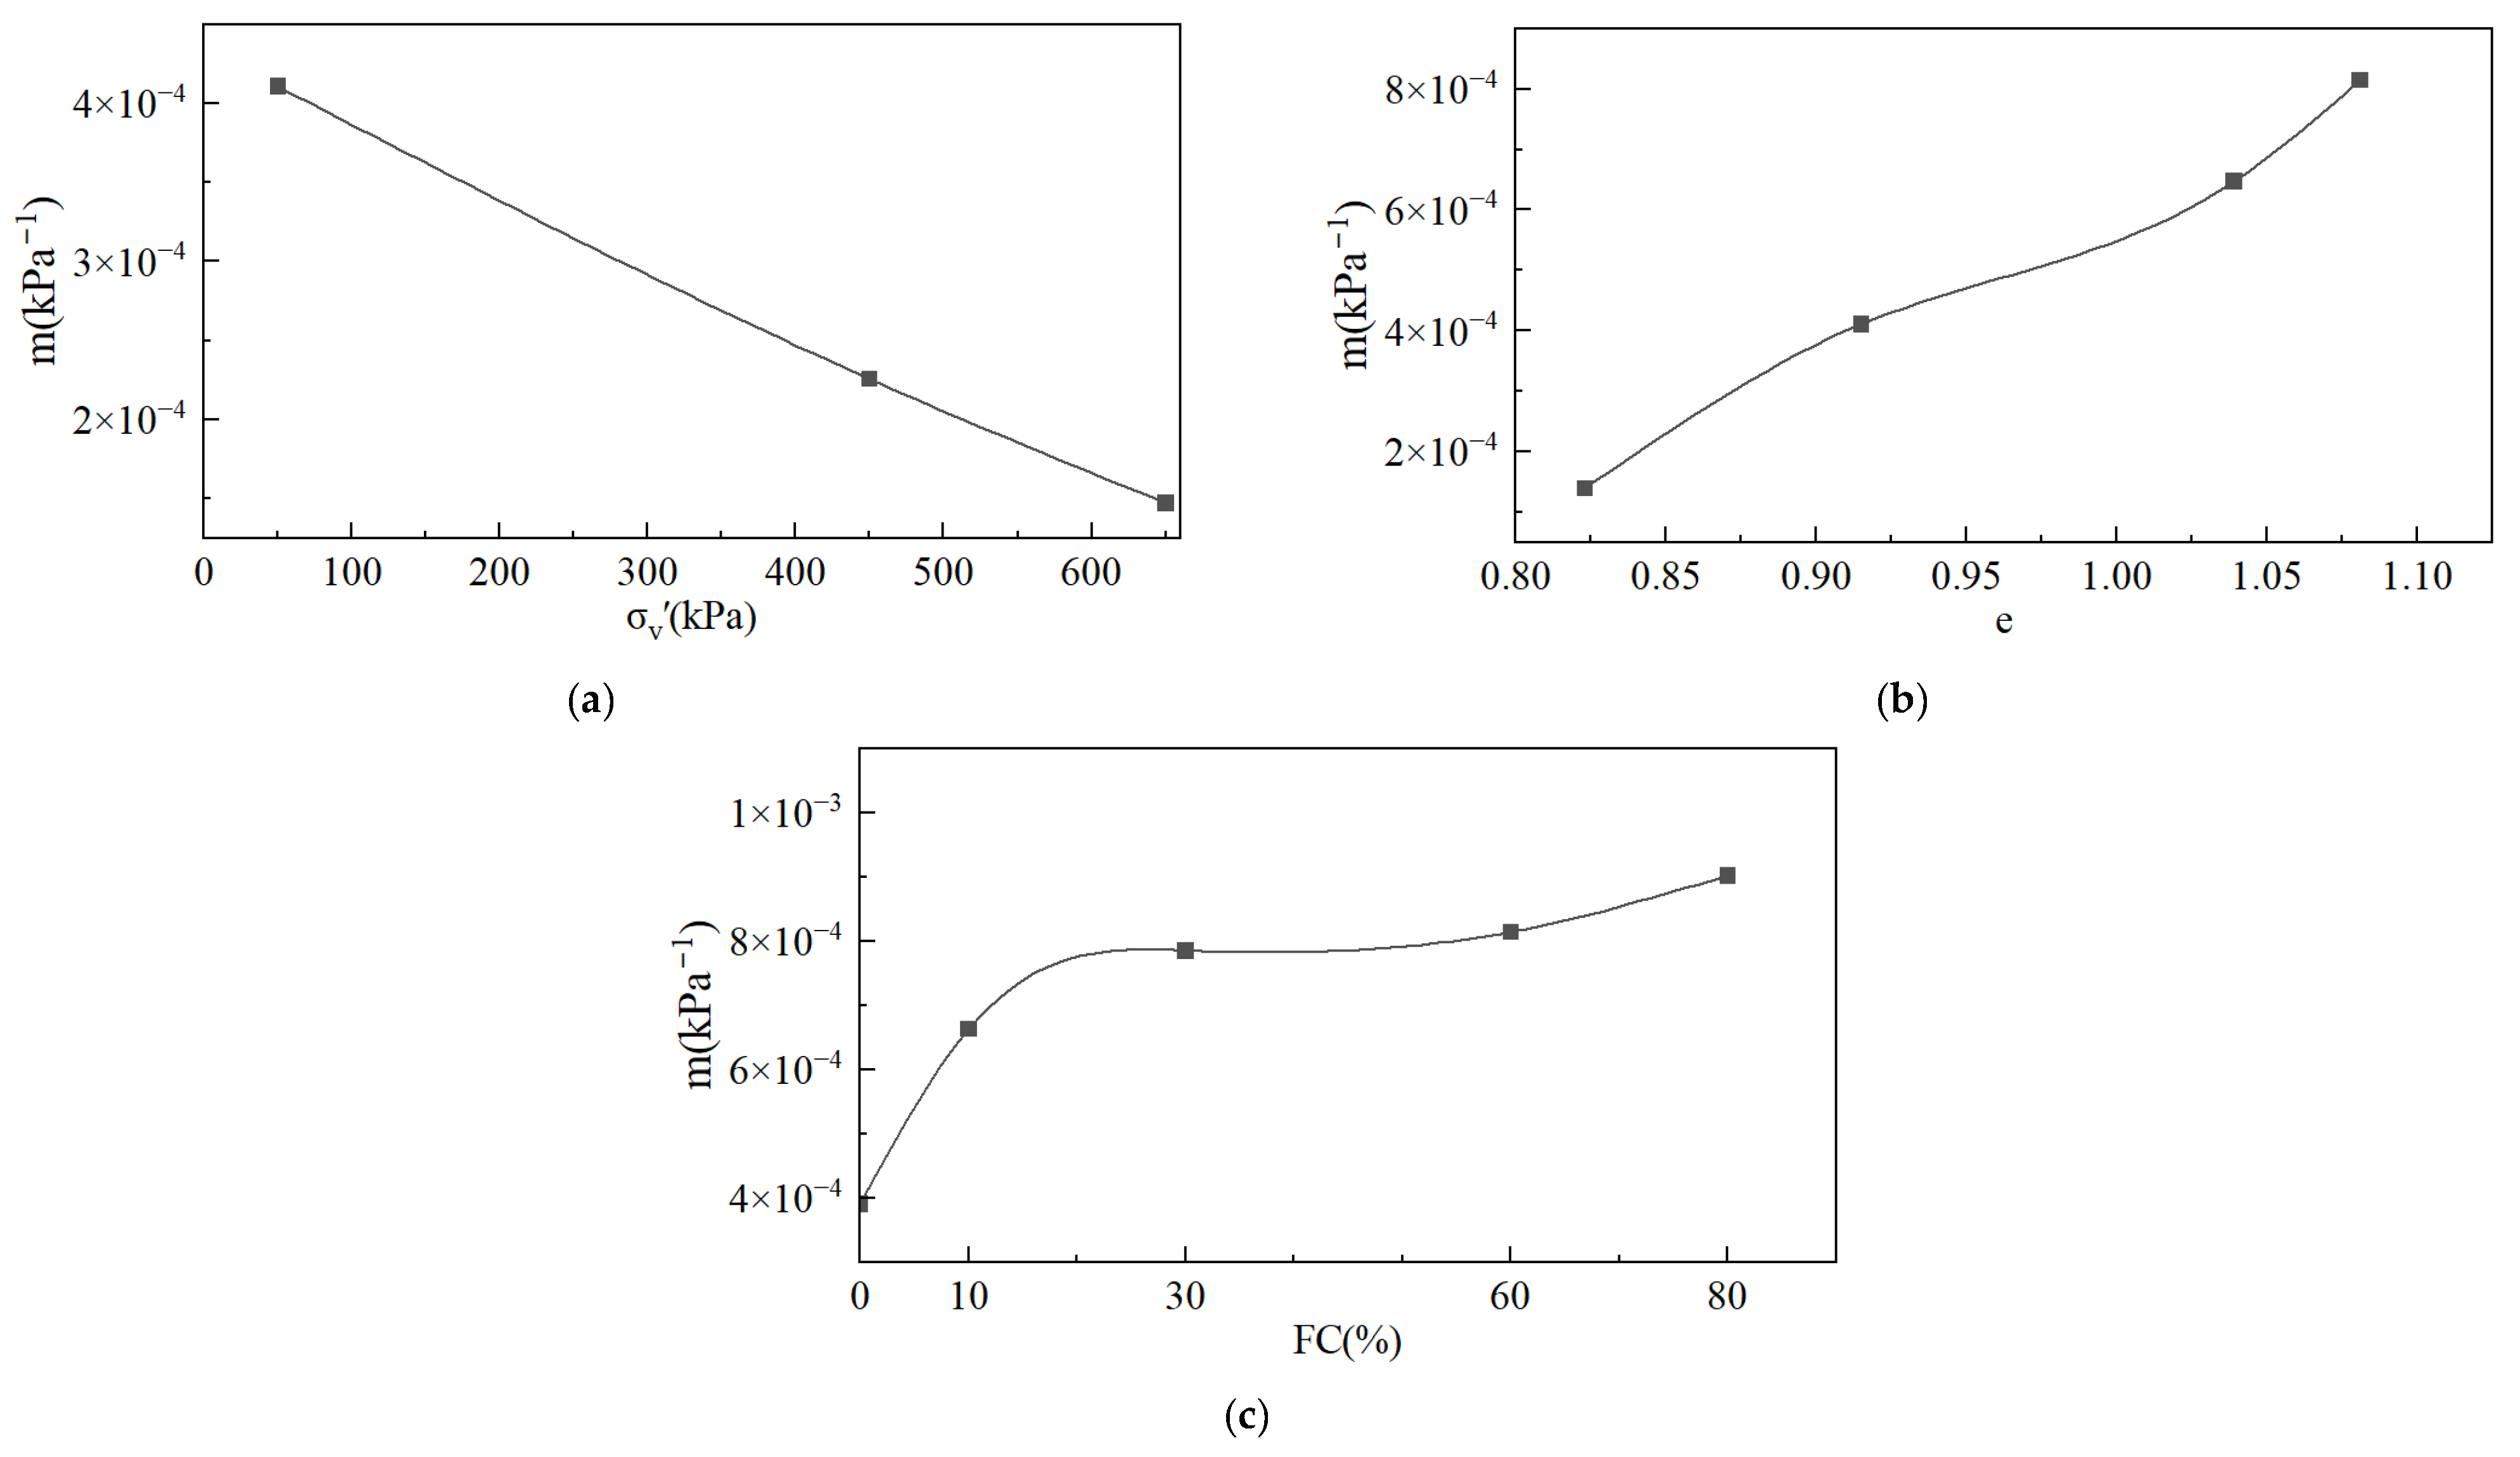
Taking an FC = 60% as an example, we analyzed the changes in compressibility for the same FC but different ei and σv′. Figure 13a shows the change rule for compressibility with respect to σv′ when ei = 0.9. With the increase in σv′, the compressibility of the tailings decreases. The change rule for compressibility with respect to the void ratio when σv′ = 50 kPa is shown in Figure 13b. Under the same σv′, the compressibility of the tailings increases with the increase in the void ratio.
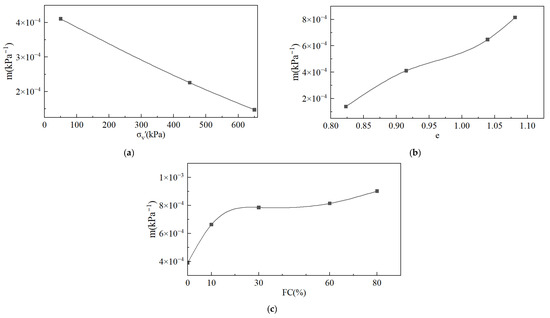
Figure 13.
Compressibility of tailings: (a) effect of σv′; (b) effect of e0; (c) effect of FC.
For simplicity, the variation in compressibility with respect to FC can be expressed by the slope of the cut line from 0 kPa to 50 kPa; that is, m = de/dσv′ ≈ Δe/Δσv′ = Δe/50 kPa. The compression curves of different FCs are shown in Figure 13c when the initial void ratio ei = 1.128. It is obvious that compressibility increases with an increasing FC.
4. Discussion
4.1. Relationship Between Compressibility and Static Liquefaction
Figure 14 shows a typical stress path diagram for static liquefaction tailings under CUTC test conditions-. In the effective stress path, during the whole shear process, the stress ratio of the tailings and the effective internal friction angle continuously increase. Therefore, the ability of the tailings to resist shear will continue to increase if the mean effective stress is unchanged. The reason why the shear strength starts to decrease and static liquefaction occurs after qp is not the decrease in the internal friction angle but rather the decrease in mean effective stress caused by the increase in pore water pressure.
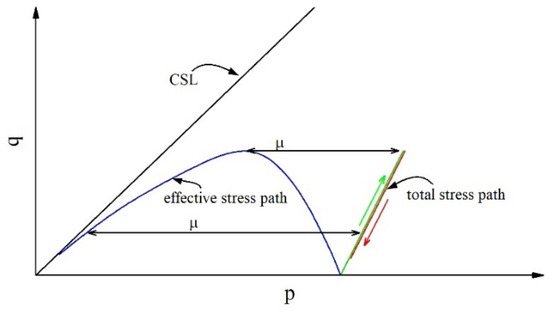
Figure 14.
Typical stress path diagram of CUTC tests.
Equation (9) is satisfied by the CUTC tests, and Equation (10) is the differential form. From Equation (10), it can be gleaned that although the stress ratio continues to increase (dη > 0), if the increment in pore water pressure exceeds that for total mean effective stress, the shear stress may decrease. The faster the growth in pore water pressure, the earlier the peak shear stress is reached, and the lower the corresponding ηIL.
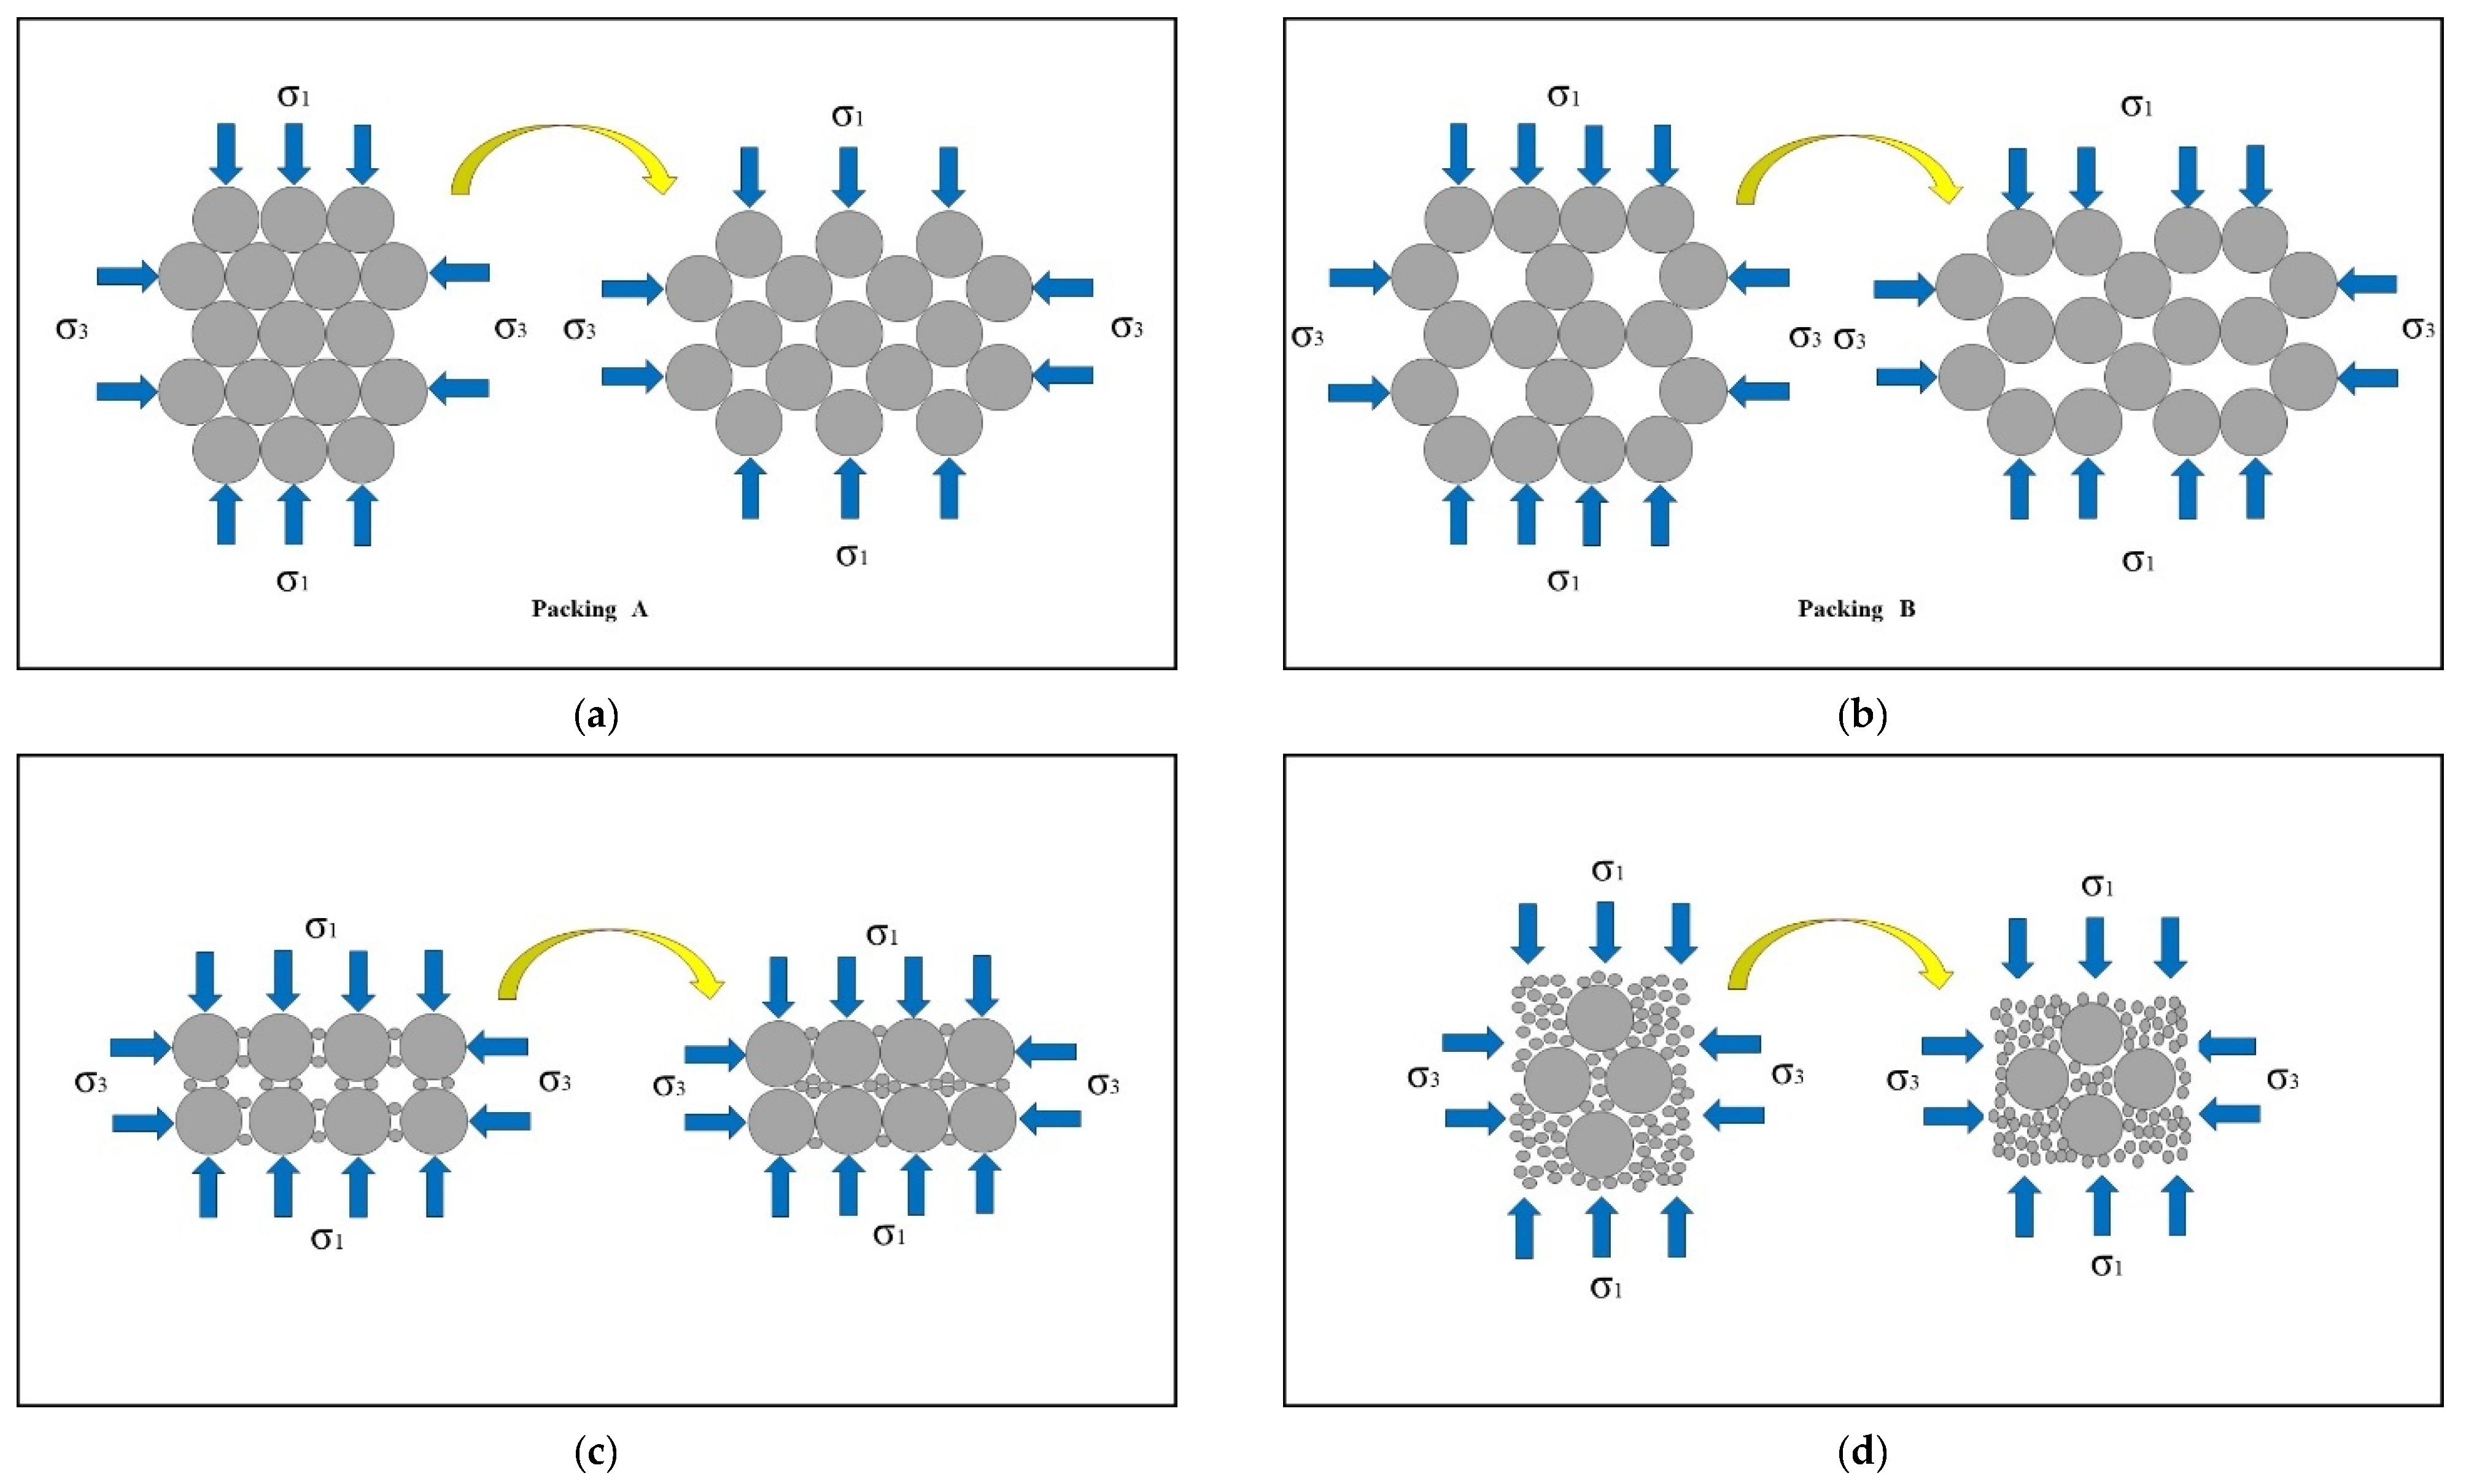
The development of pore water pressure in soil during the shearing process is related to the density and particle arrangement of the soil [52]. The particle arrangement structure shown in Figure 15 is used to demonstrate the movement of particles, changes in spatial position, and development of pores during the shearing process [53,54], and its accuracy has been confirmed by relevant research [41,55].
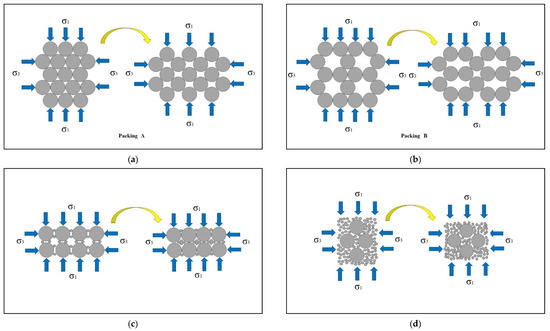
Figure 15.
Diagrams of particles’ behavior under compression: (a) Packing A; (b) Packing B; (c) tailings with a low FC; (d) the fines completely fill the void.
Consider two packing forms of uniform tailings, as shown in Figure 15a,b. Packing A represents dense tailings that dilate during the shearing process, and packing B represents loose tailings that contract during the shearing process. If the shearing process is induced under undrained conditions, packing A will have negative pore water pressure, and, at the same time, the mean effective stress will increase accordingly. Static liquefaction will not occur in packing A, while packing B will exhibit positive pore water pressure and may undergo static liquefaction upon decreasing the mean effective stress, as shown in Figure 14.
For tailings with a low FC (Figure 15c), the fines exist between the large particles. When shearing occurs, the fines will slip into the void in the skeleton formed by the large particles, which promotes the volume compression of the tailings, causing the pore water pressure to increase rapidly, and then static liquefaction occurs. If the FC is increased until the fines completely fill the void in the skeleton, tailings may experience volume expansion during the shearing process without static liquefaction (Figure 15d). In summary, compressibility plays a key role in determining whether static liquefaction of tailings can occur under undrained conditions.
Section 3.2 analyzes the dependence of compressibility on the initial state and fines content of the tailings. Figure 13b shows that compressibility increases with an increasing void ratio. This result can explain the decrease in ηIL with an increasing e0 shown in Figure 10b. However, ηIL decreases with an increasing p0′ (Figure 10a), which contradicts the increase in compressibility caused by increasing σv′ (Figure 13b). In CUTC tests, the increment in pore water pressure can be obtained from Equation (10):
In the elastoplastic theory of soils [26],
where is the plastic volumetric strain increment; G is the elastic shear modulus; ν is Poisson’s ratio; A, emin and b are all material properties; and pref = 100 kPa according to convention. If the elastic deformation is neglected, then
which is combined with Equation (8):
By analyzing Equations (11), (12), and (14), it can be concluded that the increase in pore water pressure is not only related to compressibility but also the elastic shear modulus. As the pressure grows, compressibility decreases, and the elastic shear modulus increases. Therefore, the magnitude of the increment in pore water pressure depends on the dominant factor. The tests results demonstrate that the elastic shear modulus was the dominant factor in this study.
According to Section 3.2, a threshold exists for the effect of FC on ηIL. This contradicts the observation of continuously increasing compressibility with increasing FC (Figure 13c). Lade [49] studied Ottawa sand with fines and found that the compressibility causing static liquefaction varies with the FC, which certainly adds to the complexity of such studies.
The above analysis reveals that the compressibility defined in the OC tests poses limitations for analyzing static liquefaction. Firstly, no matter how dense the tailings material is, it will exhibit positive compressibility in the OC test. Therefore, compressibility cannot be used to determine whether the tailings will undergo shear dilation or contraction, nor can it determine whether the tailings will liquefy or remain stable. In other words, it lacks a boundary reference. Secondly, compressibility cannot comprehensively reflect the volume change trend of tailings, as the effect of shear stress is not considered. The change in pore water pressure during static liquefaction is mainly due to the change in the stress ratio, which is always kept constant in OC tests. Therefore, compressibility is helpful for understanding the static liquefaction phenomenon but not for the constitutive description and prediction of static liquefaction.
4.2. Relationship Between ψ and Static Liquefaction
Critical state soil mechanics provides a good framework for studying static liquefaction. The CSL, the final state of tailings under shear stress, provides a good boundary reference. The distance between the current state and the critical state can be used as a substitute for compressibility. ψ is the most commonly used descriptor for distance in this regard.
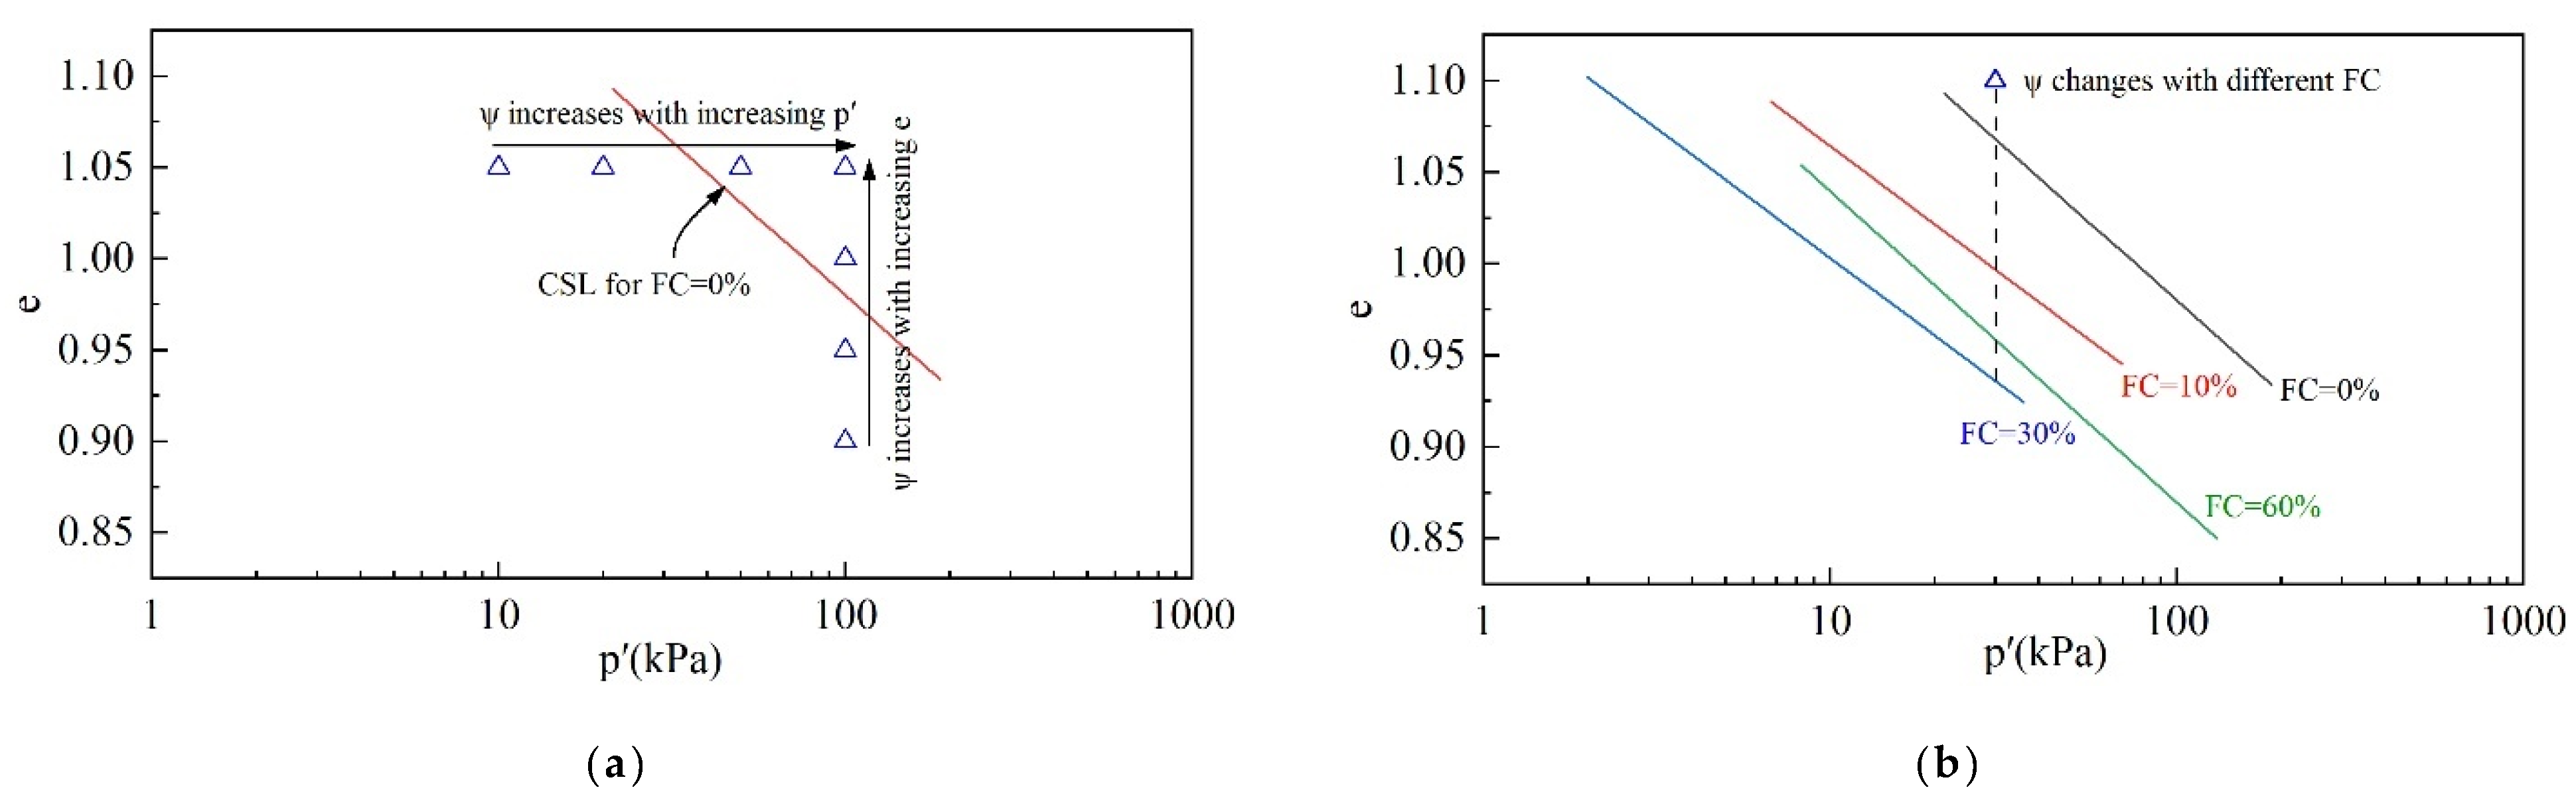
Figure 2 shows the CSL in the e-p space. The e-p space is divided into two regions by the CSL. The lower left region is the dense region with ψ < 0, and the upper right region is the loose region with ψ > 0. The larger the value of ψ, the looser the tailings. ψ = 0 indicates the critical state.
Figure 16a presents the relationship between ψ, e0, and p0′. The blue triangle represents the current state. At constant e0, as p0′ increases, the value of ψ increases. At constant p0′, ψ increases with the increasing e0.
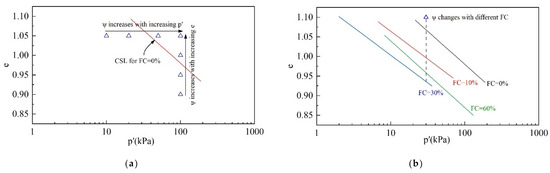
Figure 16.
The variation in ψ with respect to the initial state and FC: (a) unique FC; (b) changing FC.
Figure 16b presents the relationship between ψ and FC. In a constant initial state, the value of ψ is related to the position of CSLs affected by FC. As FC increases, ψ increases first and then decreases.
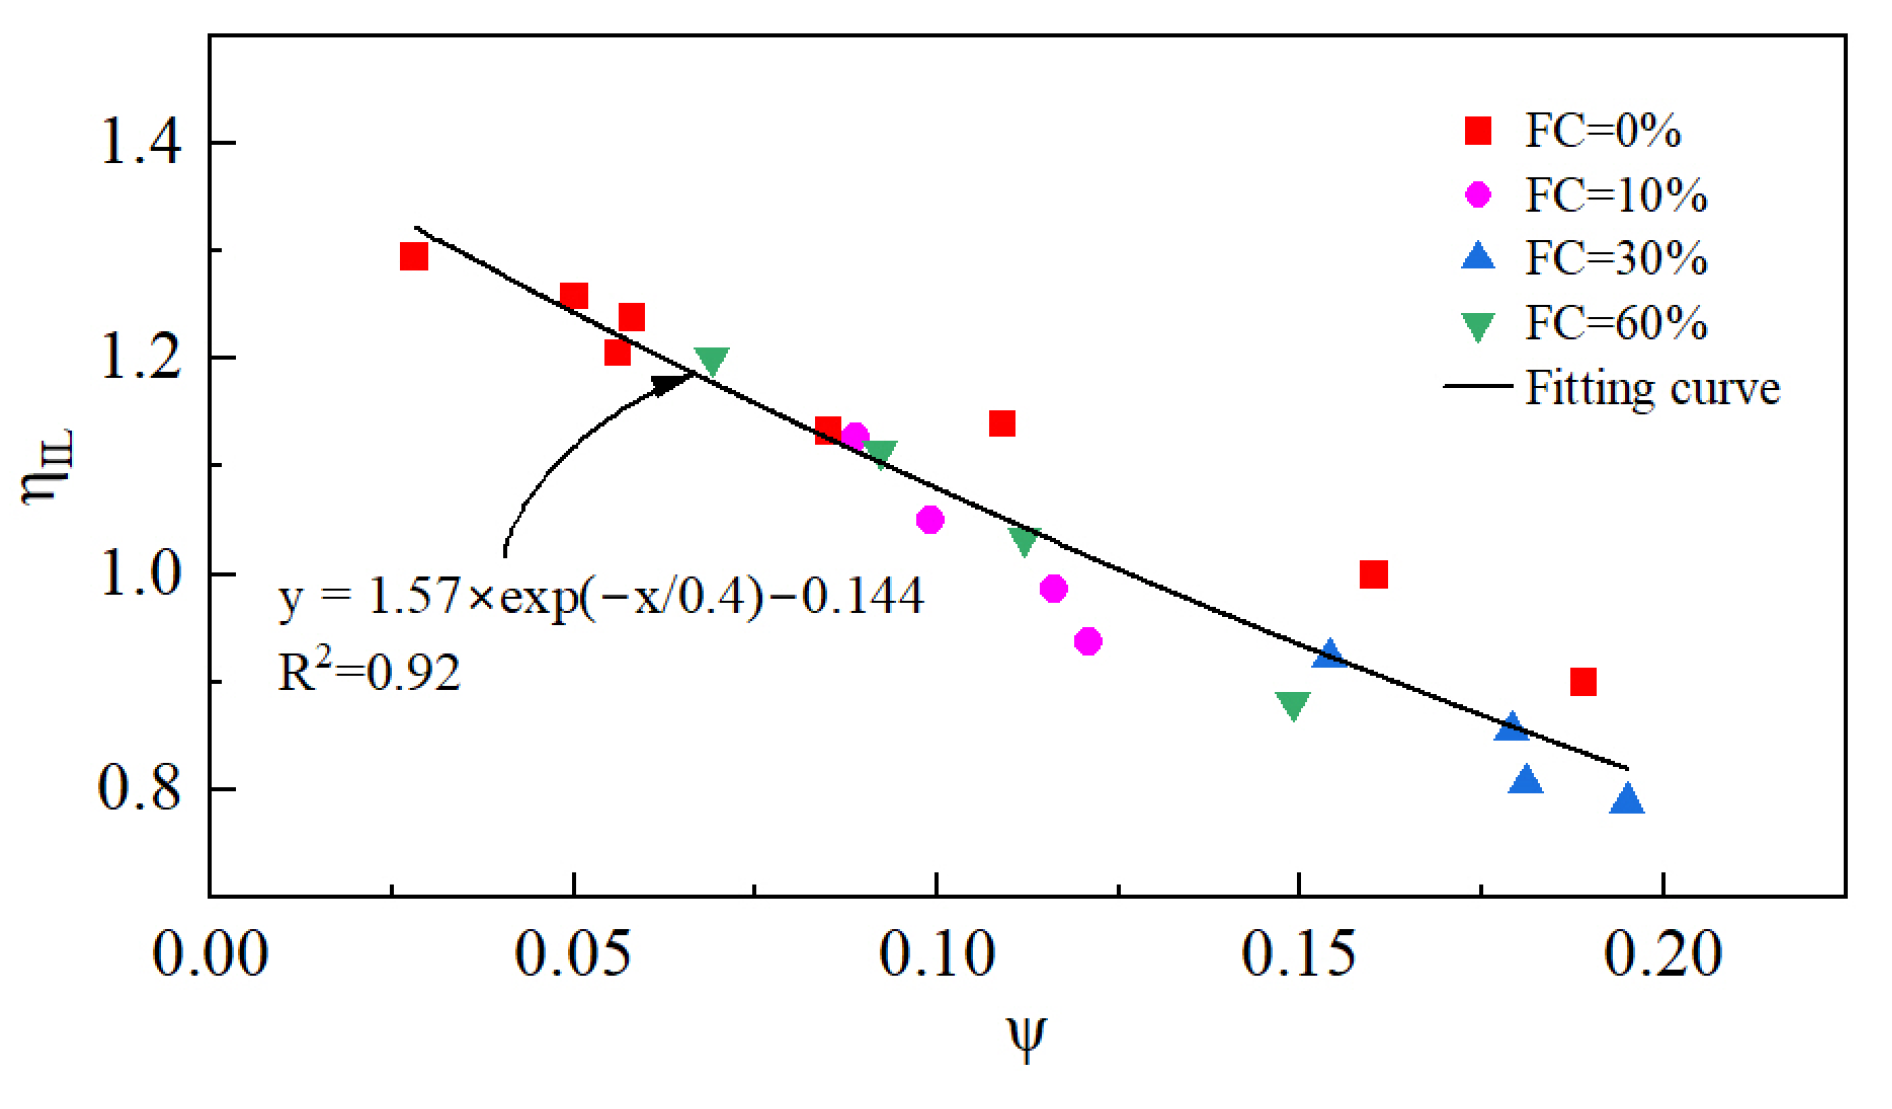
The variation in ηIL with respect to e0, p0′, and FC in Section 3.1.3 can be well explained by ψ. Figure 17 shows the relationship between ηIL and ψ under various initial states and FCs. Obviously, ηIL is related to ψ, regardless of the initial state and FC. In summary, as ψ increases, the tailings become loose and ηIL decreases.
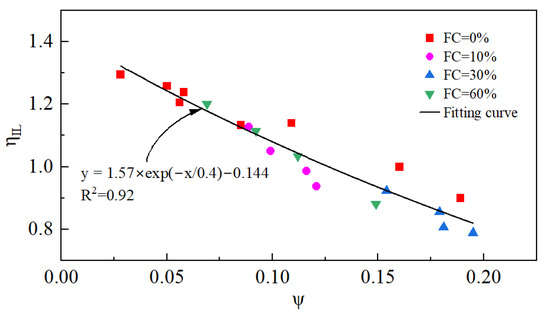
Figure 17.
The variation in ηIL with respect to ψ.
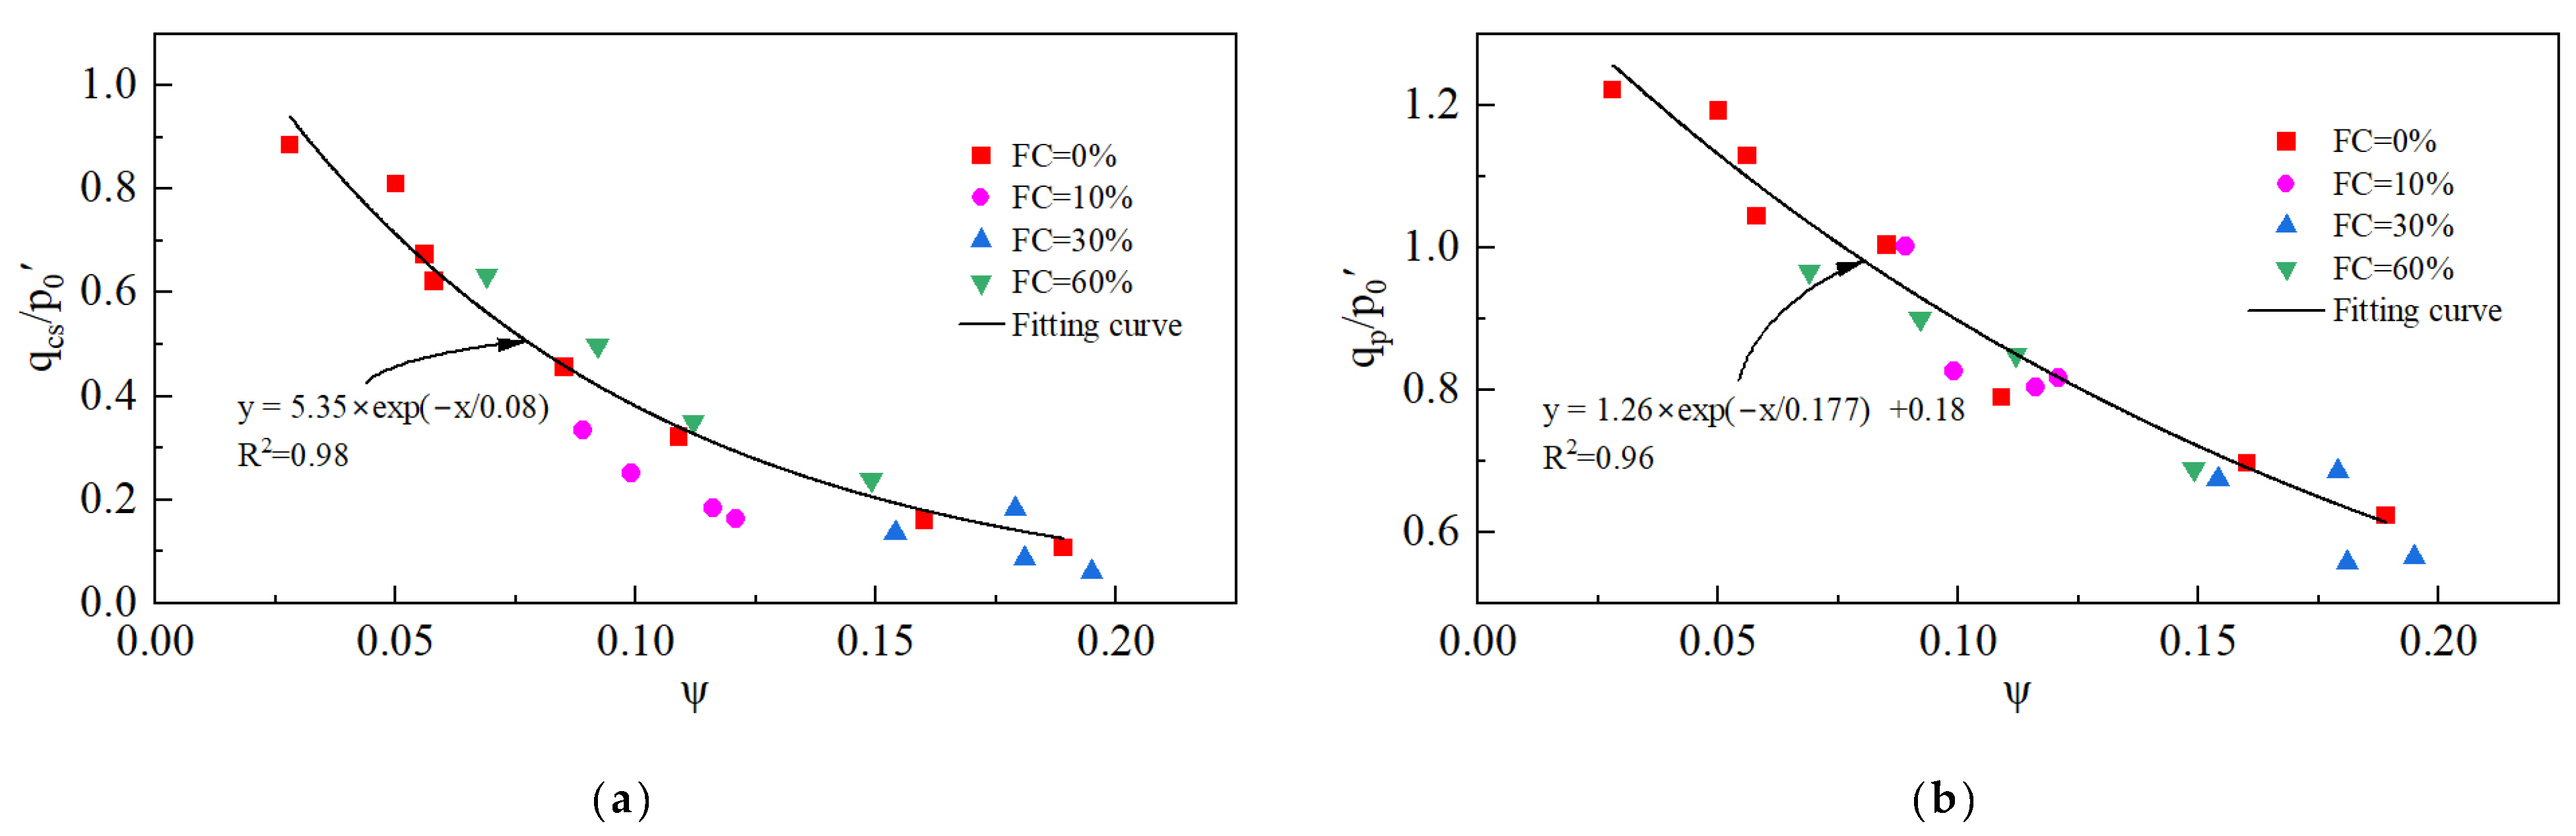
The critical-state shear strength and undrained shear strength are strongly correlated with ψ, and the relationships are shown in Figure 18. As ψ increases, the tailings become loose, and the critical-state shear strength and undrained shear strength decrease accordingly.
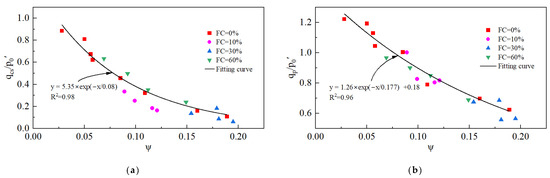
Figure 18.
The variation in shear strengthen ratio with ψ: (a) critical state shear strength ratio; (b) undrained shear strength ratio.
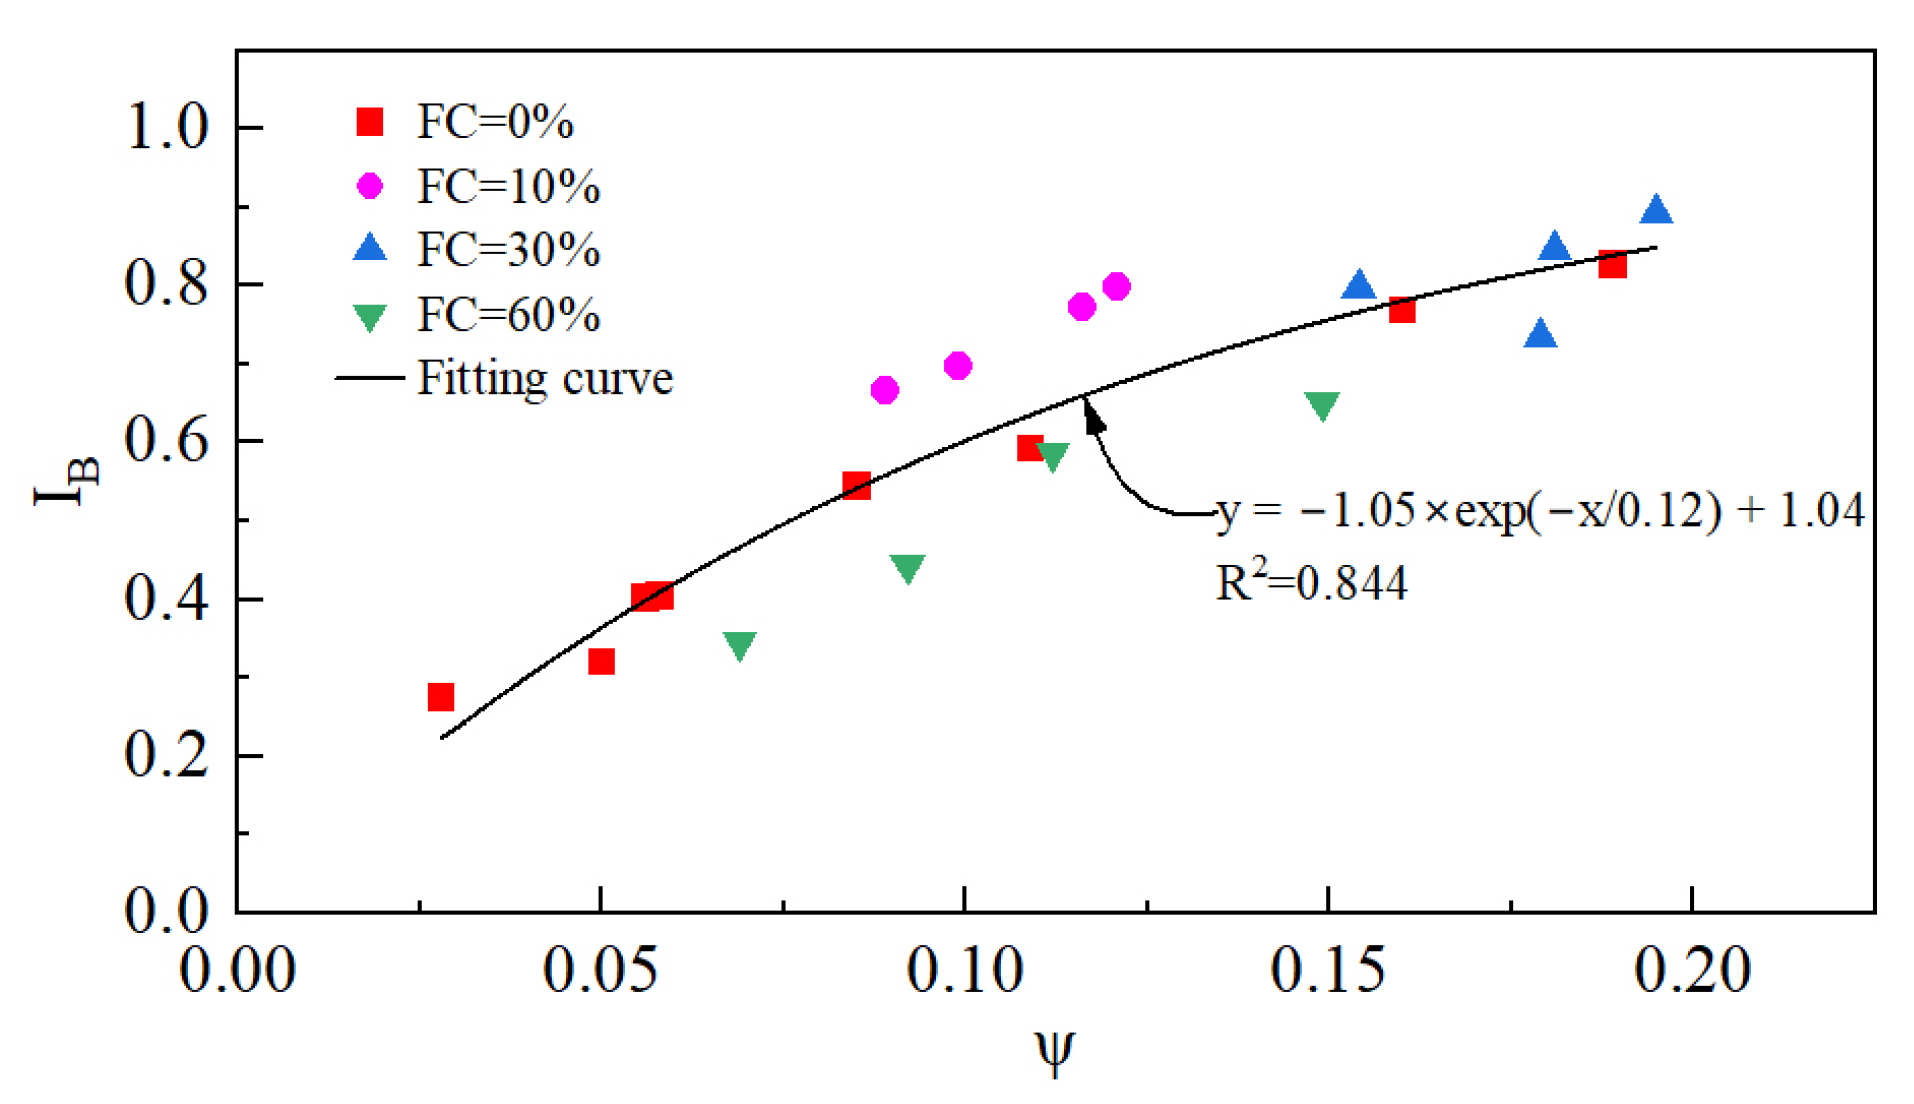
The relationship between the IB and ψ is shown in Figure 19. It is clear that IB increases with the increase in ψ, independent of the initial state and FC.
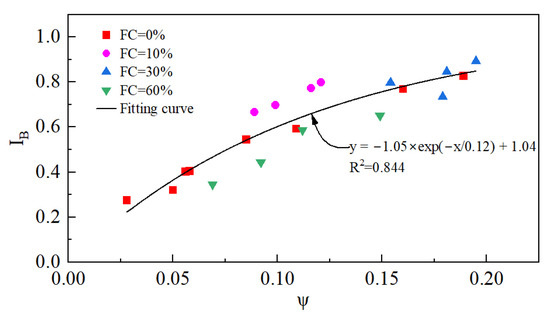
Figure 19.
The relationship between IB and ψ.
The following conclusions can be drawn from the above discussion wherein it is indicated that the combined effect of the initial state and the fines content of the tailings on static liquefaction can be normalized by the state parameter. As long as the state parameters of the tailings are known, the liquefaction behavior can be evaluated comprehensively, and this finding can be exploited to reduce the complexity of static liquefaction studies of tailings.
From the above research and discussion, it has been determined that the main reason for the static liquefaction of tailings is the increase in pore water pressure in the undrained condition. In order to effectively prevent the static liquefaction of tailings, it is necessary to strictly control the drainage conditions of tailings and detect the pore pressure of tailings to prevent an excessive rise in pore water pressure.
5. Conclusions
In this study, the effects of the initial state and fines content on the static liquefaction of tailings were investigated using CUTC tests and OC tests. The main conclusions are as follows.
- (1)
- Saturated loose tailings can undergo static liquefaction in undrained conditions. The instability line, undrained shear strength, critical state strength, and brittleness index are associated with the initial state and the fines content. A larger void ratio and higher mean effective stresses are more likely to initiate static liquefaction. There exists a fines content that is most likely to initiate static liquefaction, which is 30% in this study.
- (2)
- The instability line slope decreases with an increasing void ratio and mean effective stress. The fines content has a threshold, and the instability line slope decreases and then increases with an increasing fines content and reaches a minimum at an FC = 30%. The brittleness index has an opposite variation pattern to the instability line slope and reaches a peak at an FC = 30%.
- (3)
- The fines content has no effect on the critical state stress ratio. In the e-lnp′ space, the critical-state lines at different fines contents are approximately parallel, and the position of the critical-state line drops and then rises with an increasing fines content.
- (4)
- The compressibility of the tailings increases with an increasing void ratio and fines content and decreases with increasing pressure. Compressibility poses limitations in evaluating the static liquefaction of tailings and has little contribution to the constitutive description and prediction of static liquefaction.
- (5)
- The state parameter is an effective indicator for evaluating the static liquefaction of tailings containing fines. The comprehensive influence of the initial state and fines content on static liquefaction can be normalized by the state parameter.
These findings have guiding significance for the design and monitoring of and development of risk warnings for tailings dams, providing an experimental and theoretical basis for the stability assessment of existing tailings dams. We must acknowledge that there are certain limitations to our research in this article, which prompts us to focus on the next research direction, namely, how the particle grading and shape of coarse particles affect the static liquefaction of tailings, and to integrate discrete element simulations to identify the mechanical mechanisms involved.
Author Contributions
Conceptualization, X.W. and H.L.; methodology, X.W.; software, Y.Z.; validation, X.Y., Z.H. and M.Z.; investigation, X.W.; resources, Z.C.; data curation, Z.C.; writing—original draft preparation, X.W.; writing—review and editing, X.W.; visualization, Y.Z.; supervision, H.L.; project administration, Z.H.; funding acquisition, H.L. and M.Z. All authors have read and agreed to the published version of the manuscript.
Funding
This research was funded by the Shaanxi Province Key Laboratory of Loess Mechanics and Engineering Foundation, grant number 13JS073; the Shaanxi Province Natural Science Foundation, grant number 2017JM5059; and the Scientific Research Foundation of Weinan City, grant number ZDYF-JCYJ-301.
Institutional Review Board Statement
Not applicable.
Informed Consent Statement
Not applicable.
Data Availability Statement
The datasets presented in this article are not readily available because the data are part of an ongoing study.
Conflicts of Interest
Author Zhenpeng Chen was employed by the company Ansteel Mining Engineering Corporation. The remaining authors declare that the research was conducted in the absence of any commercial or financial relationships that could be construed as a potential conflict of interest.
References
- Ishihara, K. Post-Earthquake Failure of a Tailings Dam Due to Liquefaction of Pond Deposit. In Proceedings of the 1st Conference of the International Conference on Case Histories in Geotechnical Engineering, St. Louis, MO, USA, 30 May 1984. [Google Scholar]
- Lyu, Z.; Chai, J.; Xu, Z.; Qin, Y.; Cao, J. A comprehensive review on reasons for tailings dam failures based on case history. Adv. Civ. Eng. 2019, 2019, 4159306. [Google Scholar] [CrossRef]
- Vergaray, L.; Macedo, J.; Arnold, C. Static and Cyclic Liquefaction of Copper Mine Tailings. J. Geotech. Geoenviron. 2023, 149, 04023021. [Google Scholar] [CrossRef]
- Ishihara, K.; Troncoso, J.; Kawase, Y.; Takahashi, Y. Cyclic Strength Characteristics of Tailings Materials. Soils Found. 1980, 20, 127–142. [Google Scholar] [CrossRef] [PubMed]
- James, M.; Aubertin, M.; Wijewickreme, D.; Wilson, G.W. A laboratory investigation of the dynamic properties of tailings. Can. Geotech. J. 2011, 48, 1587–1600. [Google Scholar] [CrossRef]
- Suazo, G.; Fourie, A.; Doherty, J.; Hasan, A. Effects of confining stress, density and initial static shear stress on the cyclic shear response of fine-grained unclassified tailings. Géotechnique 2016, 66, 401–412. [Google Scholar] [CrossRef]
- Arnold, C.; Macedo, J. A novel experimental database on the cyclic response of mine tailings. Earthq. Spectra 2024, 40, 828–846. [Google Scholar] [CrossRef]
- Castro, G.; Poulos, S.J. Factors Affecting Liquefaction and Cyclic Mobility. J. Geotech. Eng. Div. 1977, 103, 501–516. [Google Scholar] [CrossRef]
- Poulos, S.J.; Robinsky, E.I.; Keller, T.O. Liquefaction Resistance of Thickened Tailings. J. Geotech. Eng. 1985, 111, 1380–1394. [Google Scholar] [CrossRef]
- Mróz, Z.; Boukpeti, N.; Drescher, A. Constitutive Model for Static Liquefaction. Int. J. Geomech. 2003, 3, 133–144. [Google Scholar] [CrossRef]
- Sabbar, A.S.; Chegenizadeh, A.; Nikraz, H. Static liquefaction of very loose sand–slag–bentonite mixtures. Soils Found. 2017, 57, 341–356. [Google Scholar] [CrossRef]
- Fourie, A.B.; Blight, G.E.; Papageorgiou, G. Static liquefaction as a possible explanation for the Merriespruit tailings dam failure. Can. Geotech. J. 2001, 38, 707–719. [Google Scholar] [CrossRef]
- Rafael, H.M.M.; Romanel, C. Static Liquefaction Analysis of the Limonar Tailings Dam in Peru. In Numerical Analysis of Nonlinear Coupled Problems; Springer: Cham, Switzerland, 2018; pp. 41–56. [Google Scholar]
- Sadrekarimi, A.; Riveros, G.A. Static Liquefaction Analysis of the Fundão Dam Failure. Geotech. Geol. Eng. 2020, 38, 6431–6446. [Google Scholar] [CrossRef]
- Riveros, G.A.; Sadrekarimi, A. Static liquefaction behaviour of gold mine tailings. Can. Geotech. J. 2021, 58, 889–901. [Google Scholar] [CrossRef]
- Verdugo, R. Static liquefaction in the context of steady state/critical state and its application in the stability of tailings dams. Soil Dyn. Earthq. Eng. 2024, 176, 108270. [Google Scholar] [CrossRef]
- Roscoe, K.H.; Schofield, A.N.; Wroth, C.P. On the Yielding of Soils. Géotechnique 1958, 8, 22–53. [Google Scholar] [CrossRef]
- Poulos, S.J. The Steady State of Deformation. J. Geotech. Eng. Div. 1981, 107, 553–562. [Google Scholar] [CrossRef]
- Been, K.; Jefferies, M.G. A state parameter for sands. Géotechnique 1985, 35, 99–112. [Google Scholar] [CrossRef]
- Kramer, S.L.; Seed, H.B. Initiation of Soil Liquefaction Under Static Loading Conditions. J. Geotech. Eng. 1988, 114, 412–430. [Google Scholar] [CrossRef]
- Leong, W.; Chu, J.; Teh, C. Liquefaction and Instability of a Granular Fill Material. Geotech. Test. J. 2000, 23, 178–192. [Google Scholar] [CrossRef]
- Fourie, A.B.; Tshabalala, L. Initiation of static liquefaction and the role of K0 consolidation. Can. Geotech. J. 2005, 42, 892–906. [Google Scholar] [CrossRef]
- Rahman, M.M.; Lo, S.R. Undrained Behavior of Sand-Fines Mixtures and Their State Parameter. J. Geotech. Geoenviron. 2014, 140, 04014036. [Google Scholar] [CrossRef]
- Monkul, M.M.; Etminan, E.; Şenol, A. Influence of coefficient of uniformity and base sand gradation on static liquefaction of loose sands with silt. Soil Dyn. Earthq. Eng. 2016, 89, 185–197. [Google Scholar] [CrossRef]
- Ishihara, K. Liquefaction and flow failure during earthquakes. Géotechnique 1993, 43, 351–451. [Google Scholar] [CrossRef]
- Jefferies, M.; Been, K. Soil liquefaction: A critical state approach, 2nd edition. Environ. Earth Sci. 2016, 75, 1014. [Google Scholar] [CrossRef]
- Bouckovalas, G.D.; Andrianopoulos, K.I.; Papadimitriou, A.G. A critical state interpretation for the cyclic liquefaction resistance of silty sands. Soil Dyn. Earthq. Eng. 2003, 23, 115–125. [Google Scholar] [CrossRef]
- Sladen, J.A.; D’Hollander, R.D.; Krahn, J. The liquefaction of sands, a collapse surface approach. Can. Geotech. J. 1985, 22, 564–578. [Google Scholar] [CrossRef]
- Ishihara, K. Characterization of cyclic behavior of sand and post-seismic stability analyses. In Proceedings of the 9th Asian Regional Conference on Soil Mechanics and Foundation Engineering, Bangkok, Thailand, 9–13 December 1991. [Google Scholar]
- Lade, P.V. Static Instability and Liquefaction of Loose Fine Sandy Slopes. J. Geotech. Eng. 1992, 118, 51–71. [Google Scholar] [CrossRef]
- Lade, P.V. Initiation of static instability in the submarine Nerlerk berm. Can. Geotech. J. 1993, 30, 895–904. [Google Scholar] [CrossRef]
- Yamamuro, J.A.; Lade, P.V. Static liquefaction of very loose sands. Can. Geotech. J. 1997, 34, 905–917. [Google Scholar] [CrossRef]
- Chu, J.; Leroueil, S.; Leong, W.K. Unstable behaviour of sand and its implication for slope instability. Can. Geotech. J. 2003, 40, 873–885. [Google Scholar] [CrossRef]
- Yang, J. Non-uniqueness of flow liquefaction line for loose sand. Géotechnique 2002, 52, 757–760. [Google Scholar] [CrossRef]
- Yang, J.; Liang, L.B.; Chen, Y. Instability and liquefaction flow slide of granular soils: The role of initial shear stress. Acta Geotech. 2022, 17, 65–79. [Google Scholar] [CrossRef]
- Poulos, S.J.; Castro, G.; France, J.W. Liquefaction Evaluation Procedure. J. Geotech. Eng. 1985, 111, 772–792. [Google Scholar] [CrossRef]
- Castro, G.; Seed, R.B.; Keller, T.O.; Seed, H.B. Steady-State Strength Analysis of Lower San Fernando Dam Slide. J. Geotech. Eng. 1992, 118, 406–427. [Google Scholar] [CrossRef]
- Sadrekarimi, A. Influence of fines content on liquefied strength of silty sands. Soil Dyn. Earthq. Eng. 2013, 55, 108–119. [Google Scholar] [CrossRef]
- Zhu, J.Q. Strength Properties and Steady-State Behavior of Sandy Soil. Ph.D. Thesis, Chinese Academy of Sciences, Beijing, China, 2007. [Google Scholar]
- Seed, H.B.; Idriss, I.M.; Arango, I. Evaluation of Liquefaction Potential Using Field Performance Data. J. Geotech. Eng. 1983, 109, 458–482. [Google Scholar] [CrossRef]
- Pitman, T.D.; Robertson, P.K.; Sego, D.C. Influence of fines on the collapse of loose sands. Can. Geotech. J. 1994, 31, 728–739. [Google Scholar] [CrossRef]
- Amini, F.; Qi, G.Z. Liquefaction Testing of Stratified Silty Sands. J. Geotech. Geoenviron. 2000, 126, 208–217. [Google Scholar] [CrossRef]
- Sladen, J.A.; D’Hollander, R.D.; Krahn, J.; Mitchell, D.E. Back analysis of the Nerlerk berm liquefaction slides. Can. Geotech. J. 1985, 22, 579–588. [Google Scholar] [CrossRef]
- Singh, S. Liquefaction characteristics of silts. Geotech. Geol. Eng. 1996, 14, 1–19. [Google Scholar] [CrossRef]
- Bouferra, R.; Shahrour, I. Influence of fines on the resistance to liquefaction of a clayey sand. Proc. Inst. Civ. Eng. Gr. 2004, 8, 1–5. [Google Scholar] [CrossRef]
- Choo, H.; Burns, S.E. Shear wave velocity of granular mixtures of silica particles as a function of finer fraction, size ratios and void ratios. Granul. Matter 2015, 17, 567–578. [Google Scholar] [CrossRef]
- Chen, Z.P. Effect of Fine Content on Mechanical Properties of Tailings. Master’s Thesis, Xi’an University of Technology, Xi’an, China, 2023. [Google Scholar]
- Yamamuro, J.A.; Lade, P.V. Steady-State Concepts and Static Liquefaction of Silty Sands. J. Geotech. Geoenviron. 1998, 124, 868–877. [Google Scholar] [CrossRef]
- Lade, P.V.; Yamamuro, J.A. Effects of fines content on void ratio, compressibility, and static liquefaction of silty sand. Geomech. Eng. 2009, 1, 1–15. [Google Scholar] [CrossRef]
- JTG 3430-2020; Test Methods of Soils for Highway Engineering. People’s Communications Publishing House: Beijing, China, 2020.
- Li, X.S.; Wang, Y. Linear Representation of Steady-State Line for Sand. J. Geotech. Geoenviron. 1998, 124, 1215–1217. [Google Scholar] [CrossRef]
- Wood, D.M. Soil Behaviour and Critical State Soil Mechanics, 1st ed.; Press Syndicate of the University of Cambridge: Cambridge, UK, 1991. [Google Scholar] [CrossRef]
- Lade, P.V.; Yamamuro, J.A. Effects of nonplastic fines on static liquefaction of sands. Can. Geotech. J. 1997, 34, 918–928. [Google Scholar] [CrossRef]
- Li, X.S.; Dafalias, Y.F. Dilatancy for Cohesionless Soils. Géotechnique 2000, 50, 449–460. [Google Scholar] [CrossRef]
- Kuerbis, R.; Negussey, D.; Vaid, Y.P. Effect of gradation and fines content on the undrained response of sand. Geotech. Spec. Publ. 1988, 21, 330–345. [Google Scholar] [CrossRef]


Disclaimer/Publisher’s Note: The statements, opinions and data contained in all publications are solely those of the individual author(s) and contributor(s) and not of MDPI and/or the editor(s). MDPI and/or the editor(s) disclaim responsibility for any injury to people or property resulting from any ideas, methods, instructions or products referred to in the content. |
© 2025 by the authors. Licensee MDPI, Basel, Switzerland. This article is an open access article distributed under the terms and conditions of the Creative Commons Attribution (CC BY) license (https://creativecommons.org/licenses/by/4.0/).