

Dynamic Compressive Damage Constitutive Correction of Concrete Under Freeze-Thaw Cycle


Abstract
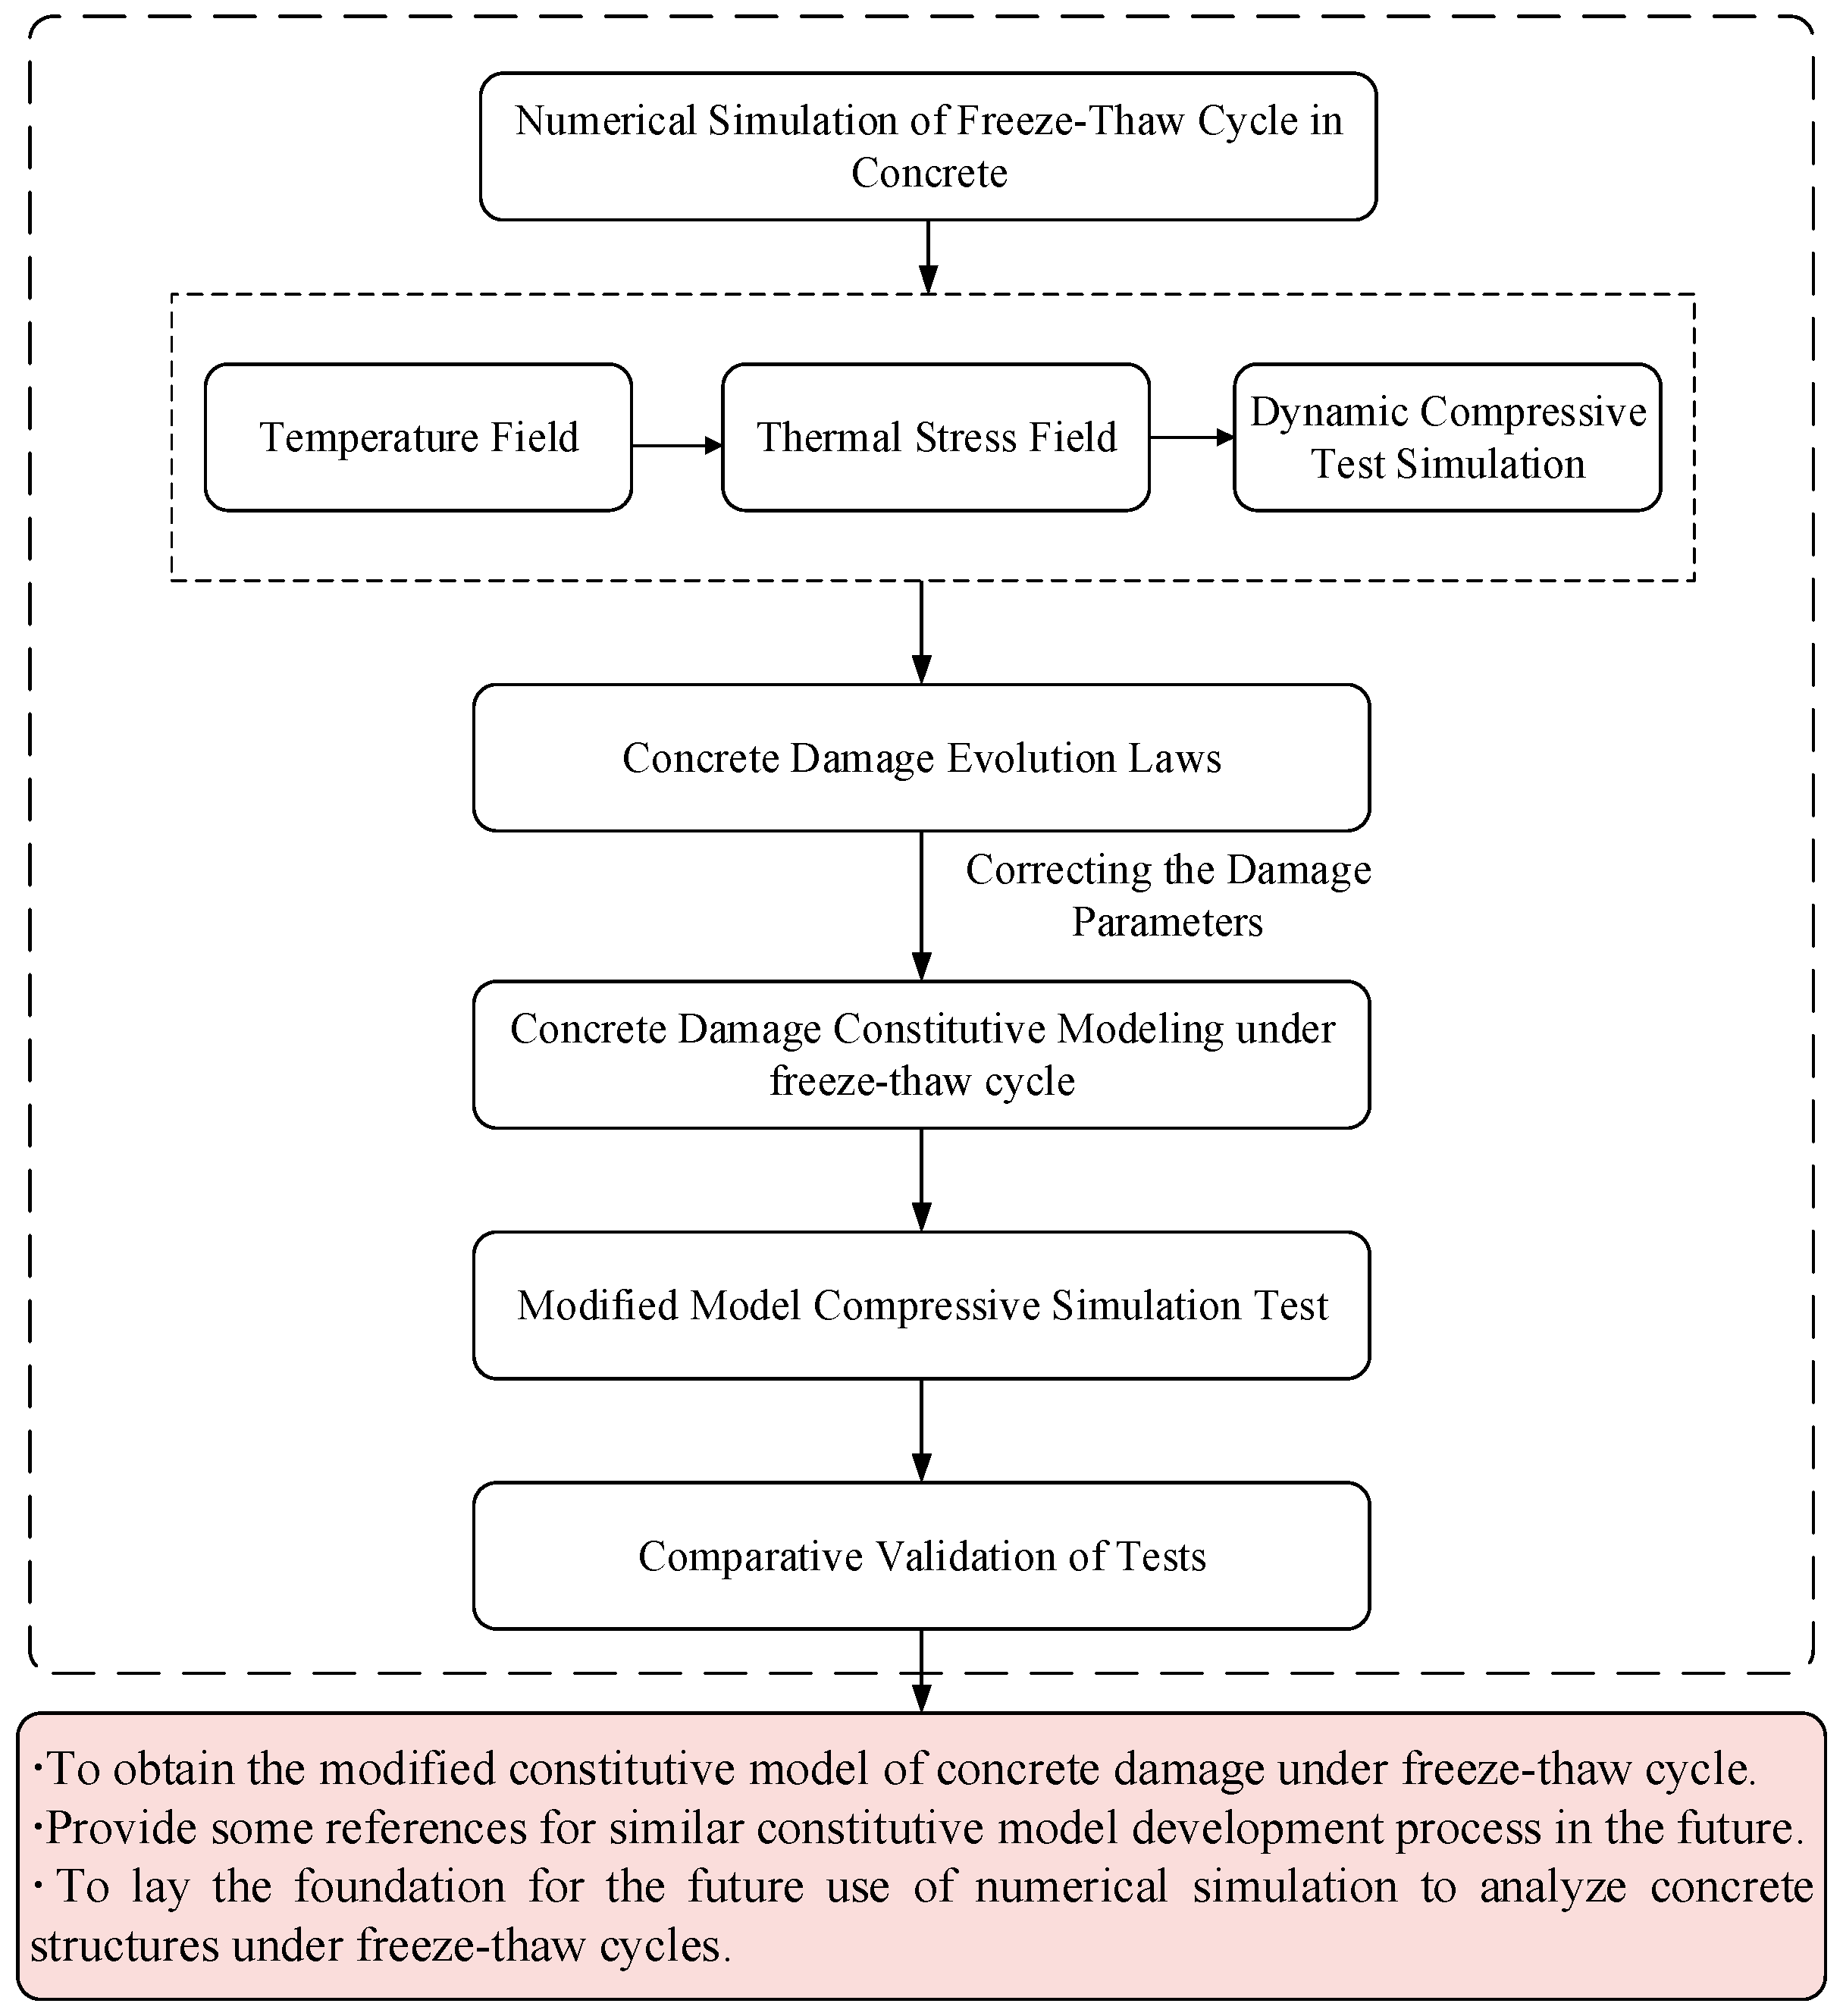
1. Introduction
2. Calculation Model and Analysis Results
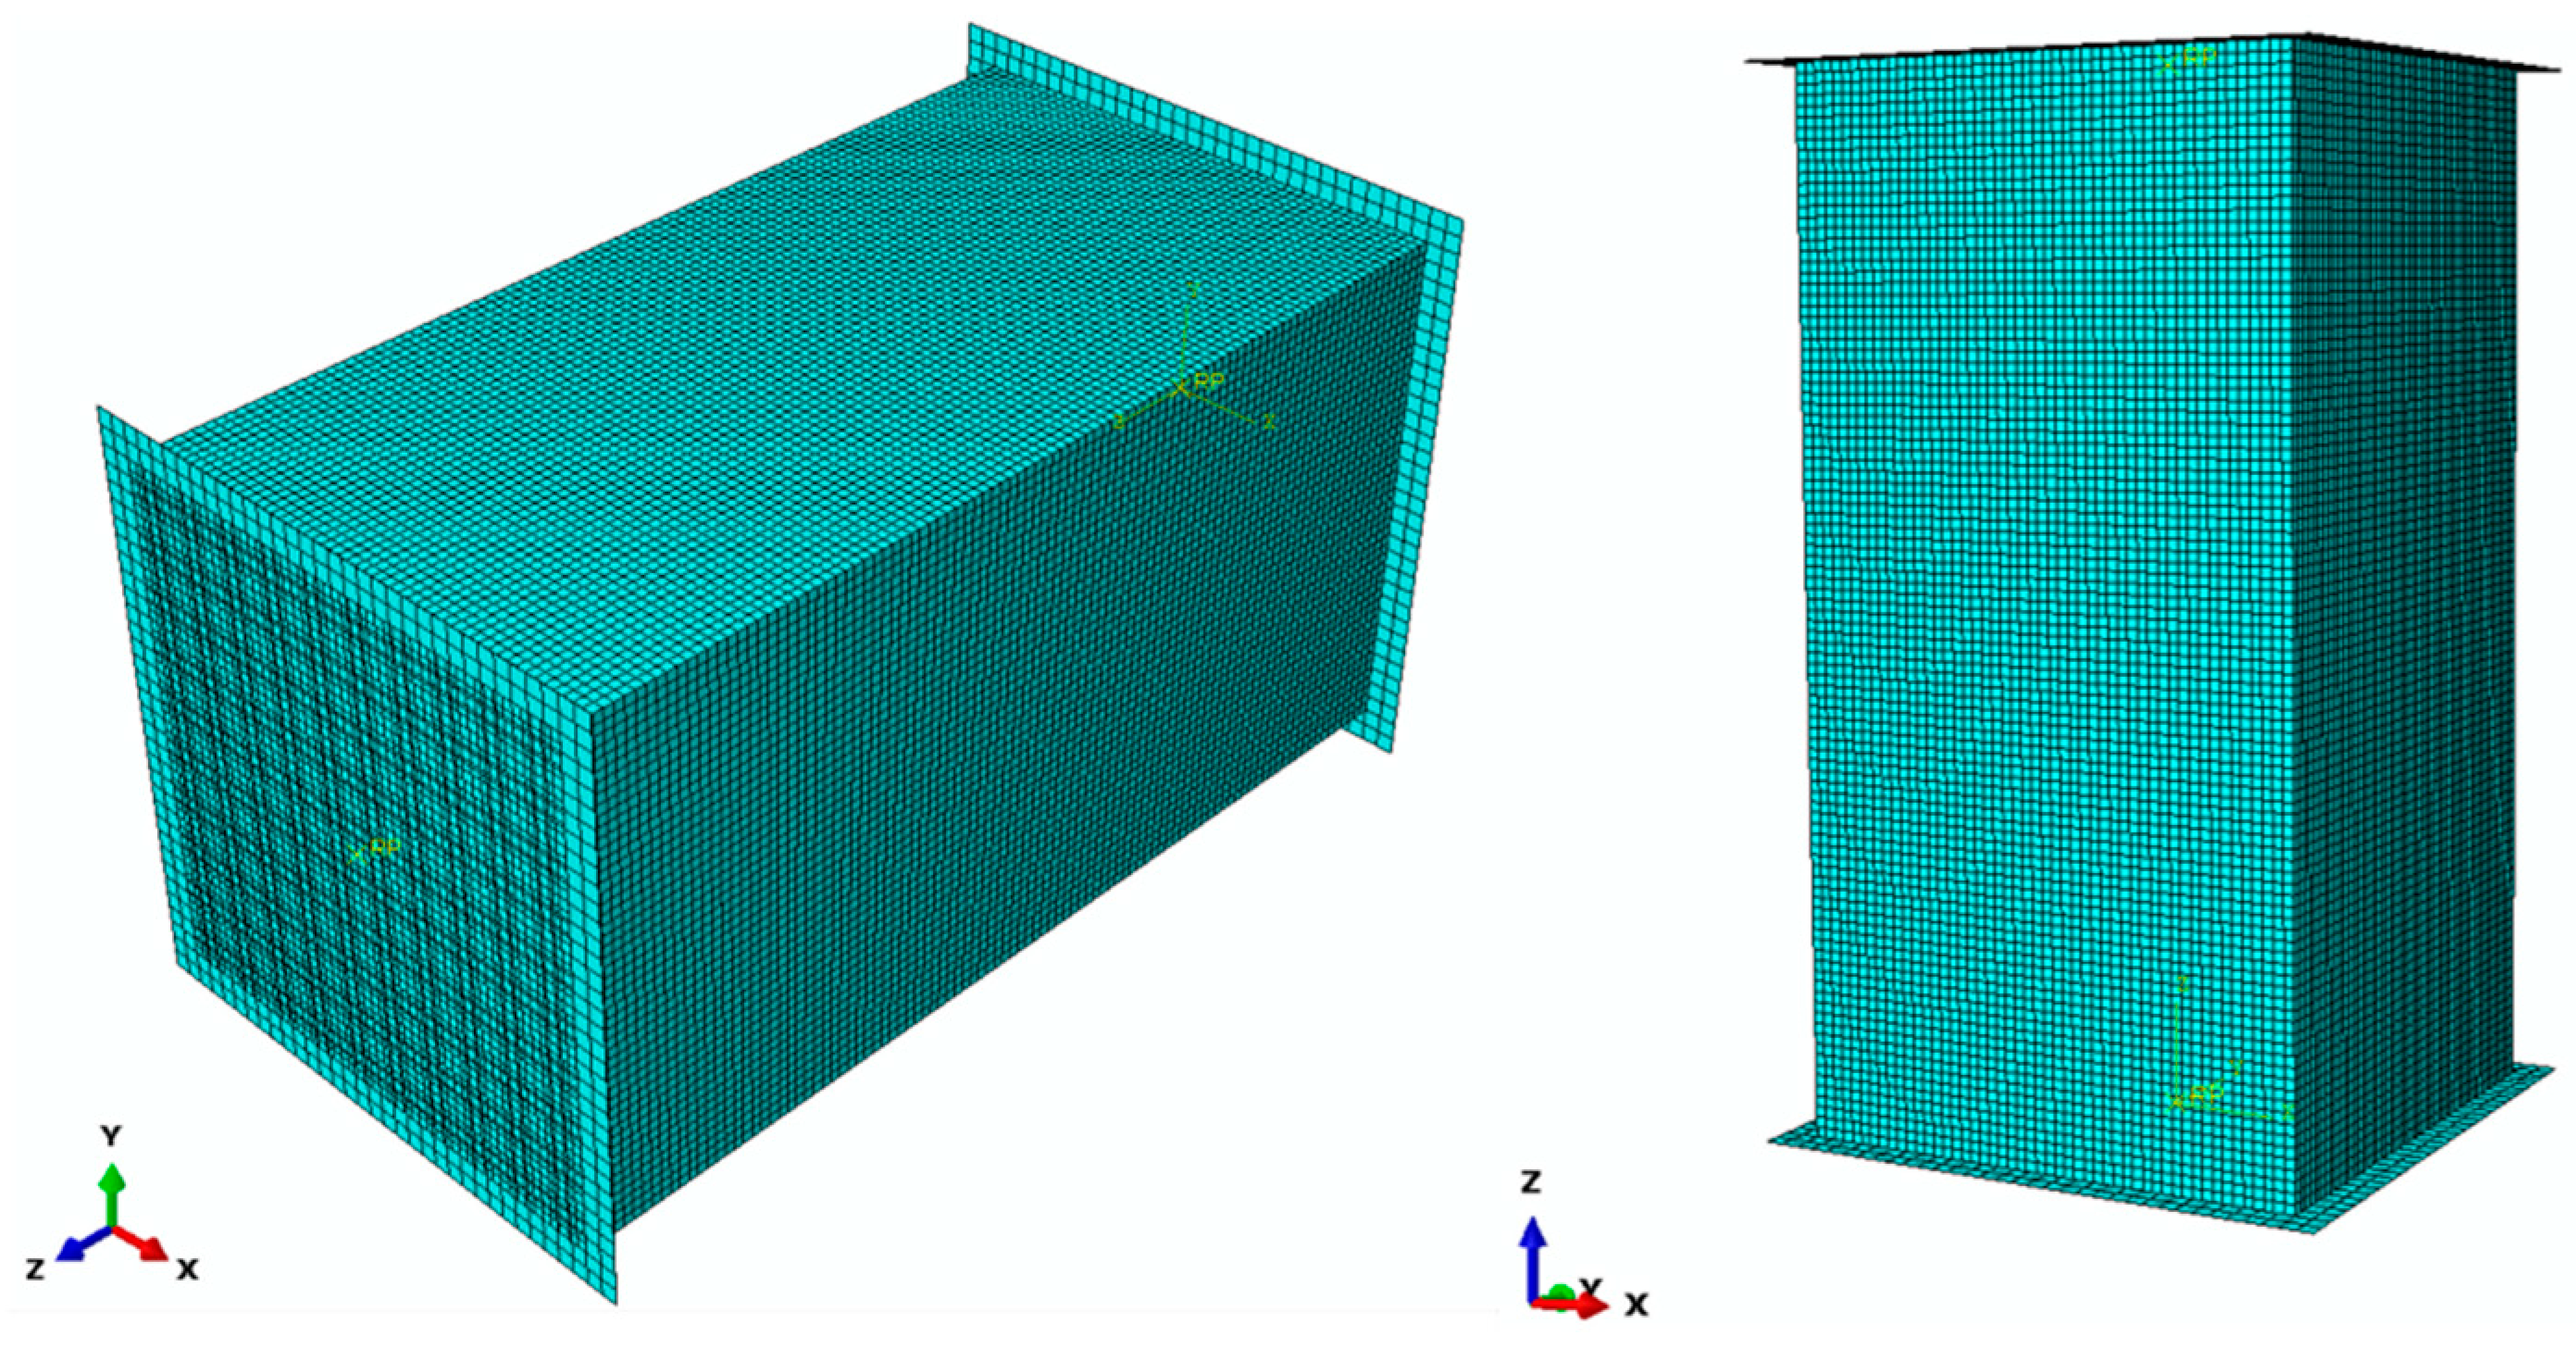
2.1. Static Step Analysis Model
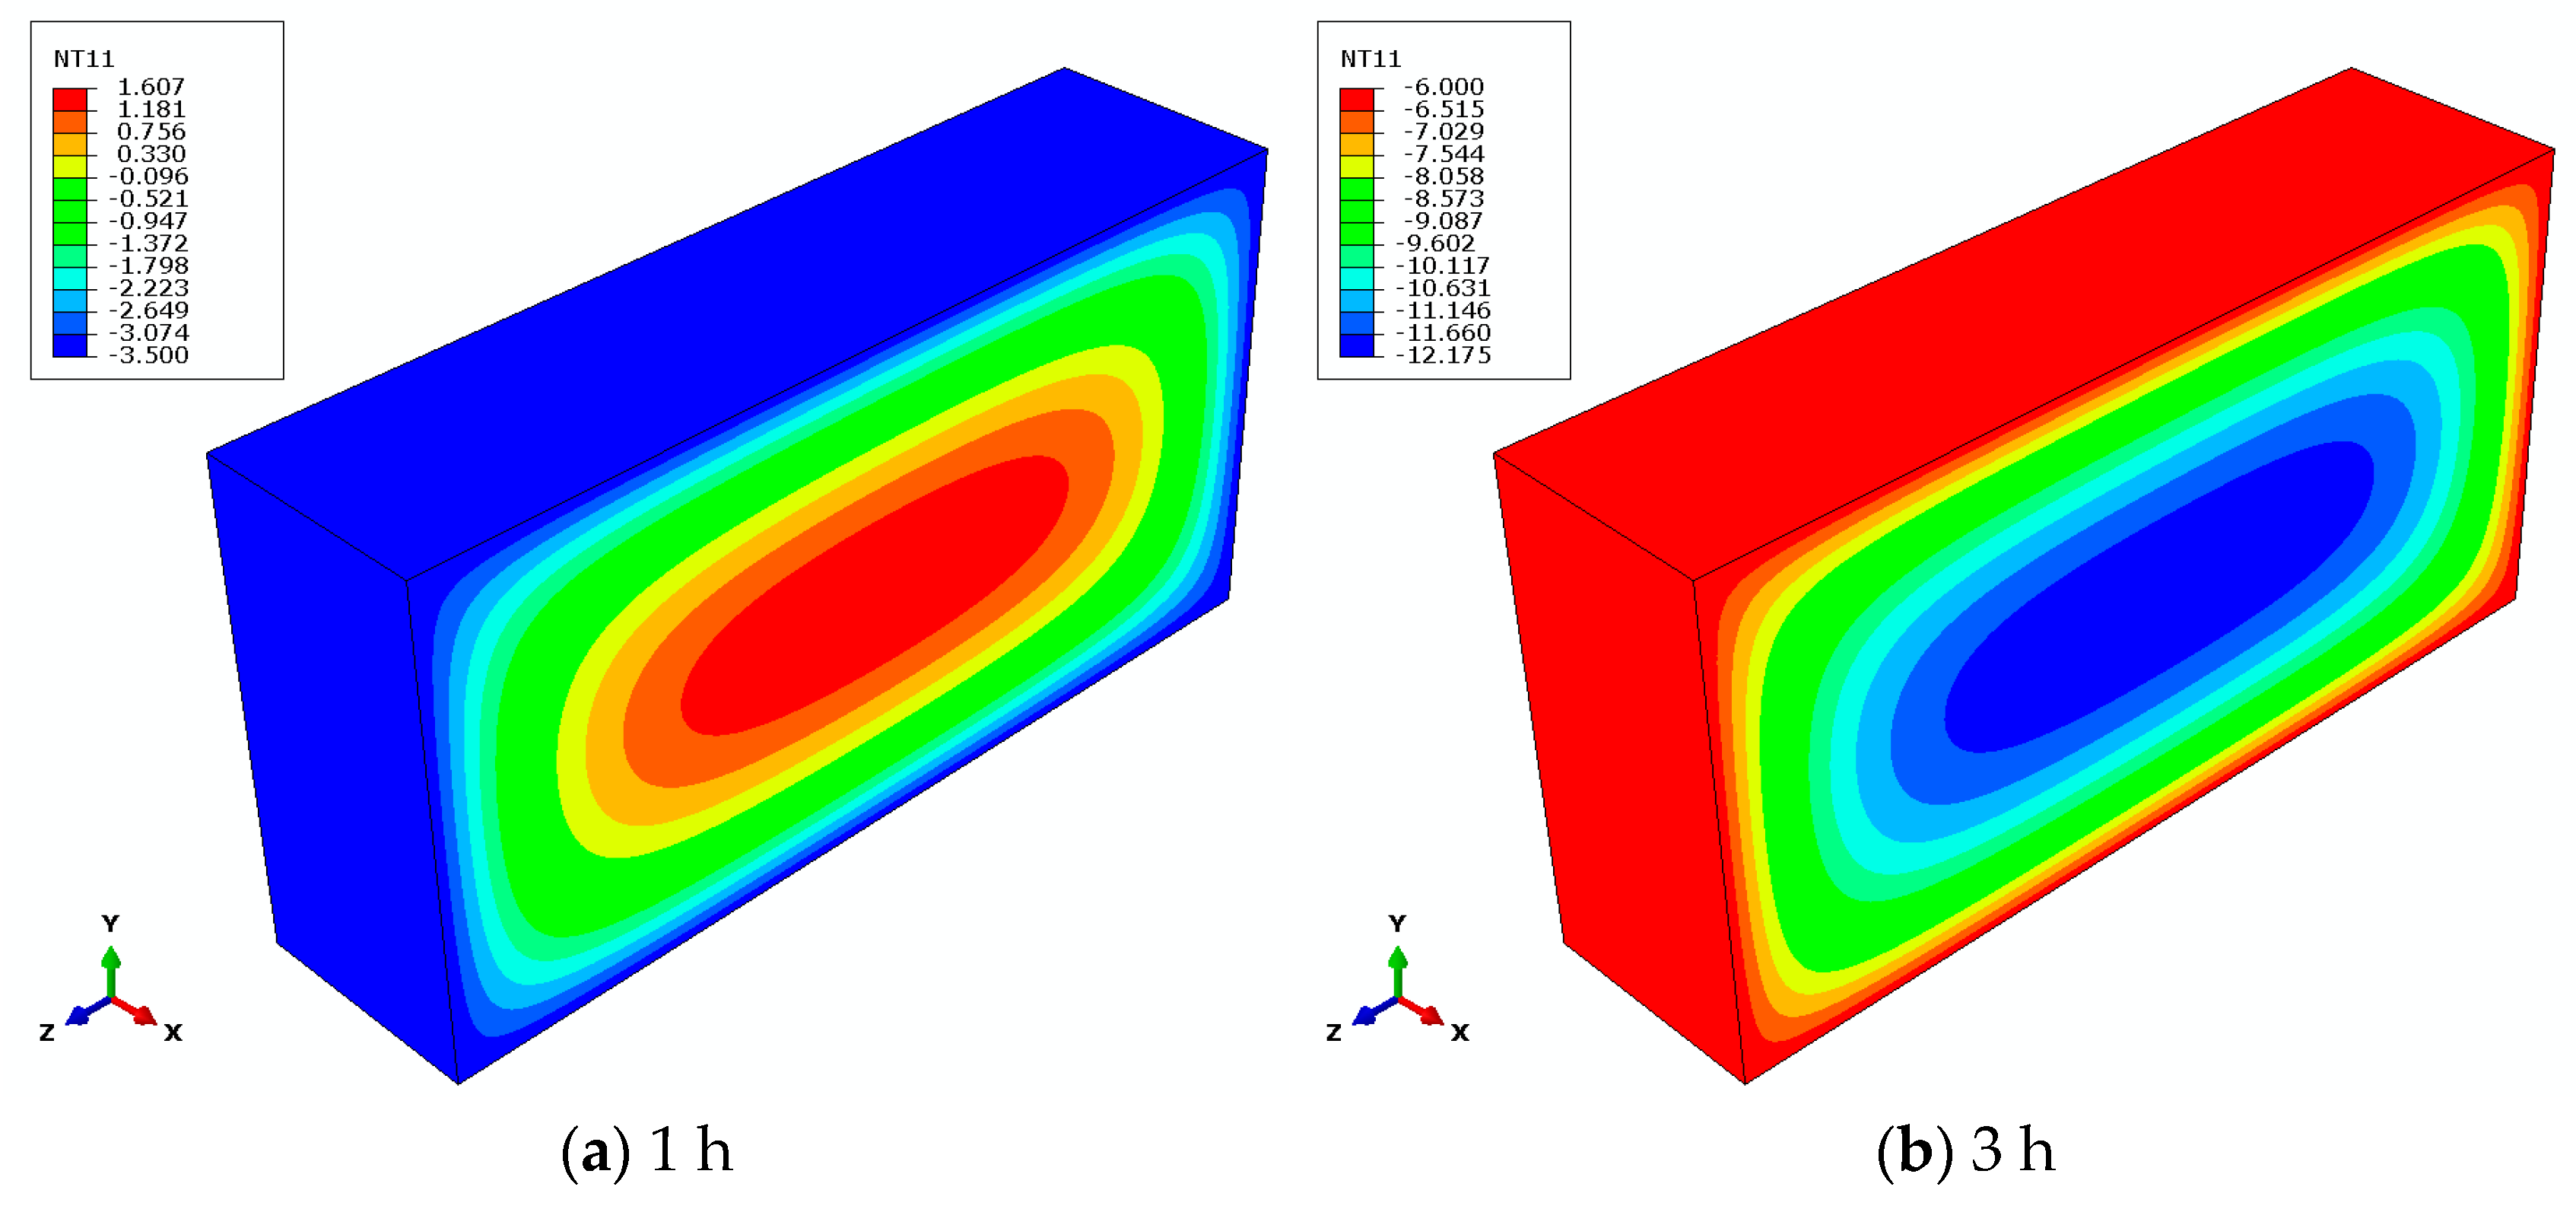
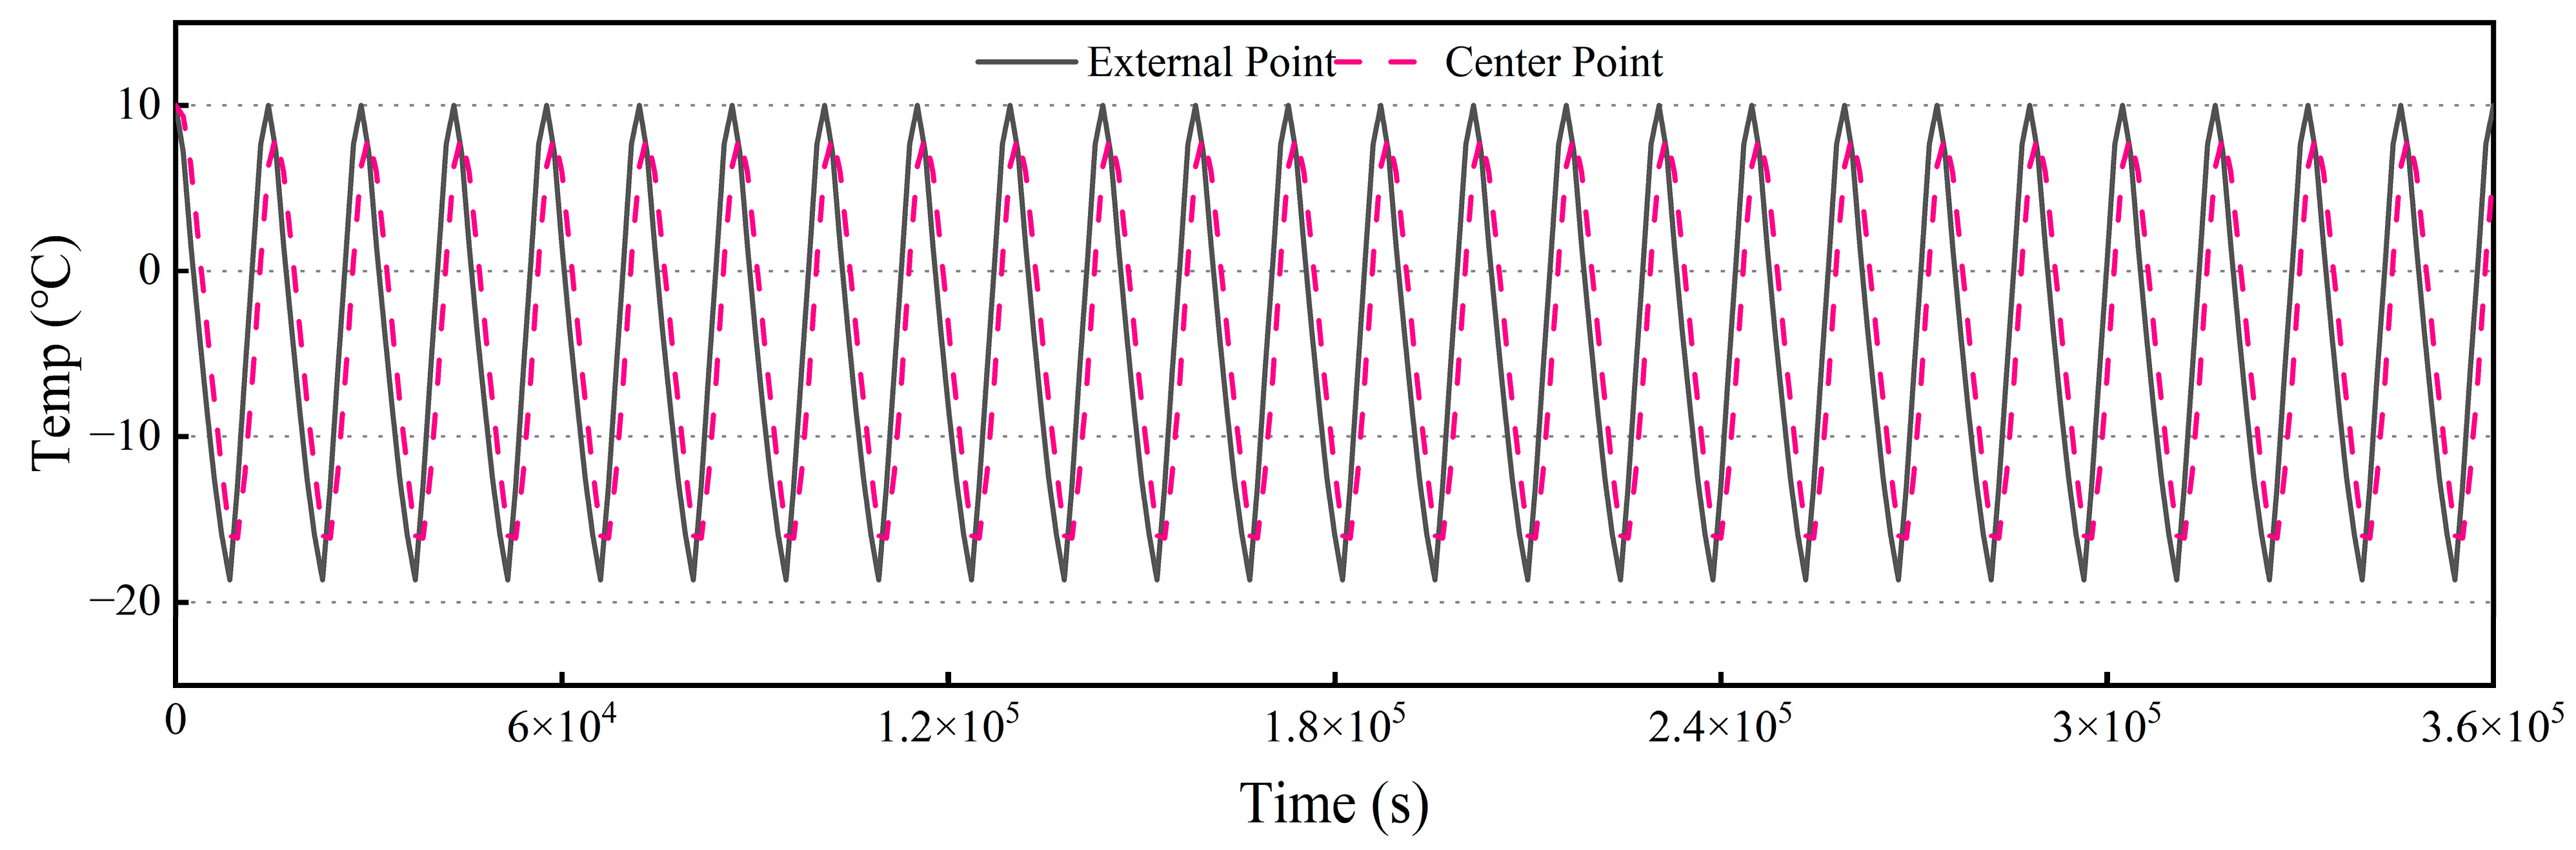
2.2. Heat Transfer Analysis Results
2.3. Dynamic Step Analysis Model
2.4. Dynamic Load Analysis Results
3. Concrete Constitutive Modeling Under Freeze-Thaw Cycles
3.1. Changing Law of the Dynamic Modulus of Elasticity of Concrete
3.2. Concrete Compressive Damage Evolution Parameters
3.3. Concrete Constitutive Modeling
3.4. Concrete Damage Plasticity Modeling
4. Discussion
4.1. Finite Element Simulation Results
4.2. Comparative Analysis of Test and Finite Element Method
5. Conclusions
- A dynamic compressive constitutive model for concrete subjected to freeze-thaw cycles was developed by modifying the parameters that govern the progression of compressive damage in accordance with the Code [21].
- The application of a modified constitutive model in conjunction with a damage plasticity model within ABAQUS software, while considering the influence of the damage factor, enabled a more precise simulation of the uniaxial compressive behavior of concrete subjected to freeze-thaw cycles. This methodology provided a dynamic and real-time representation of stress development and the corresponding damage state of concrete throughout the stress process.
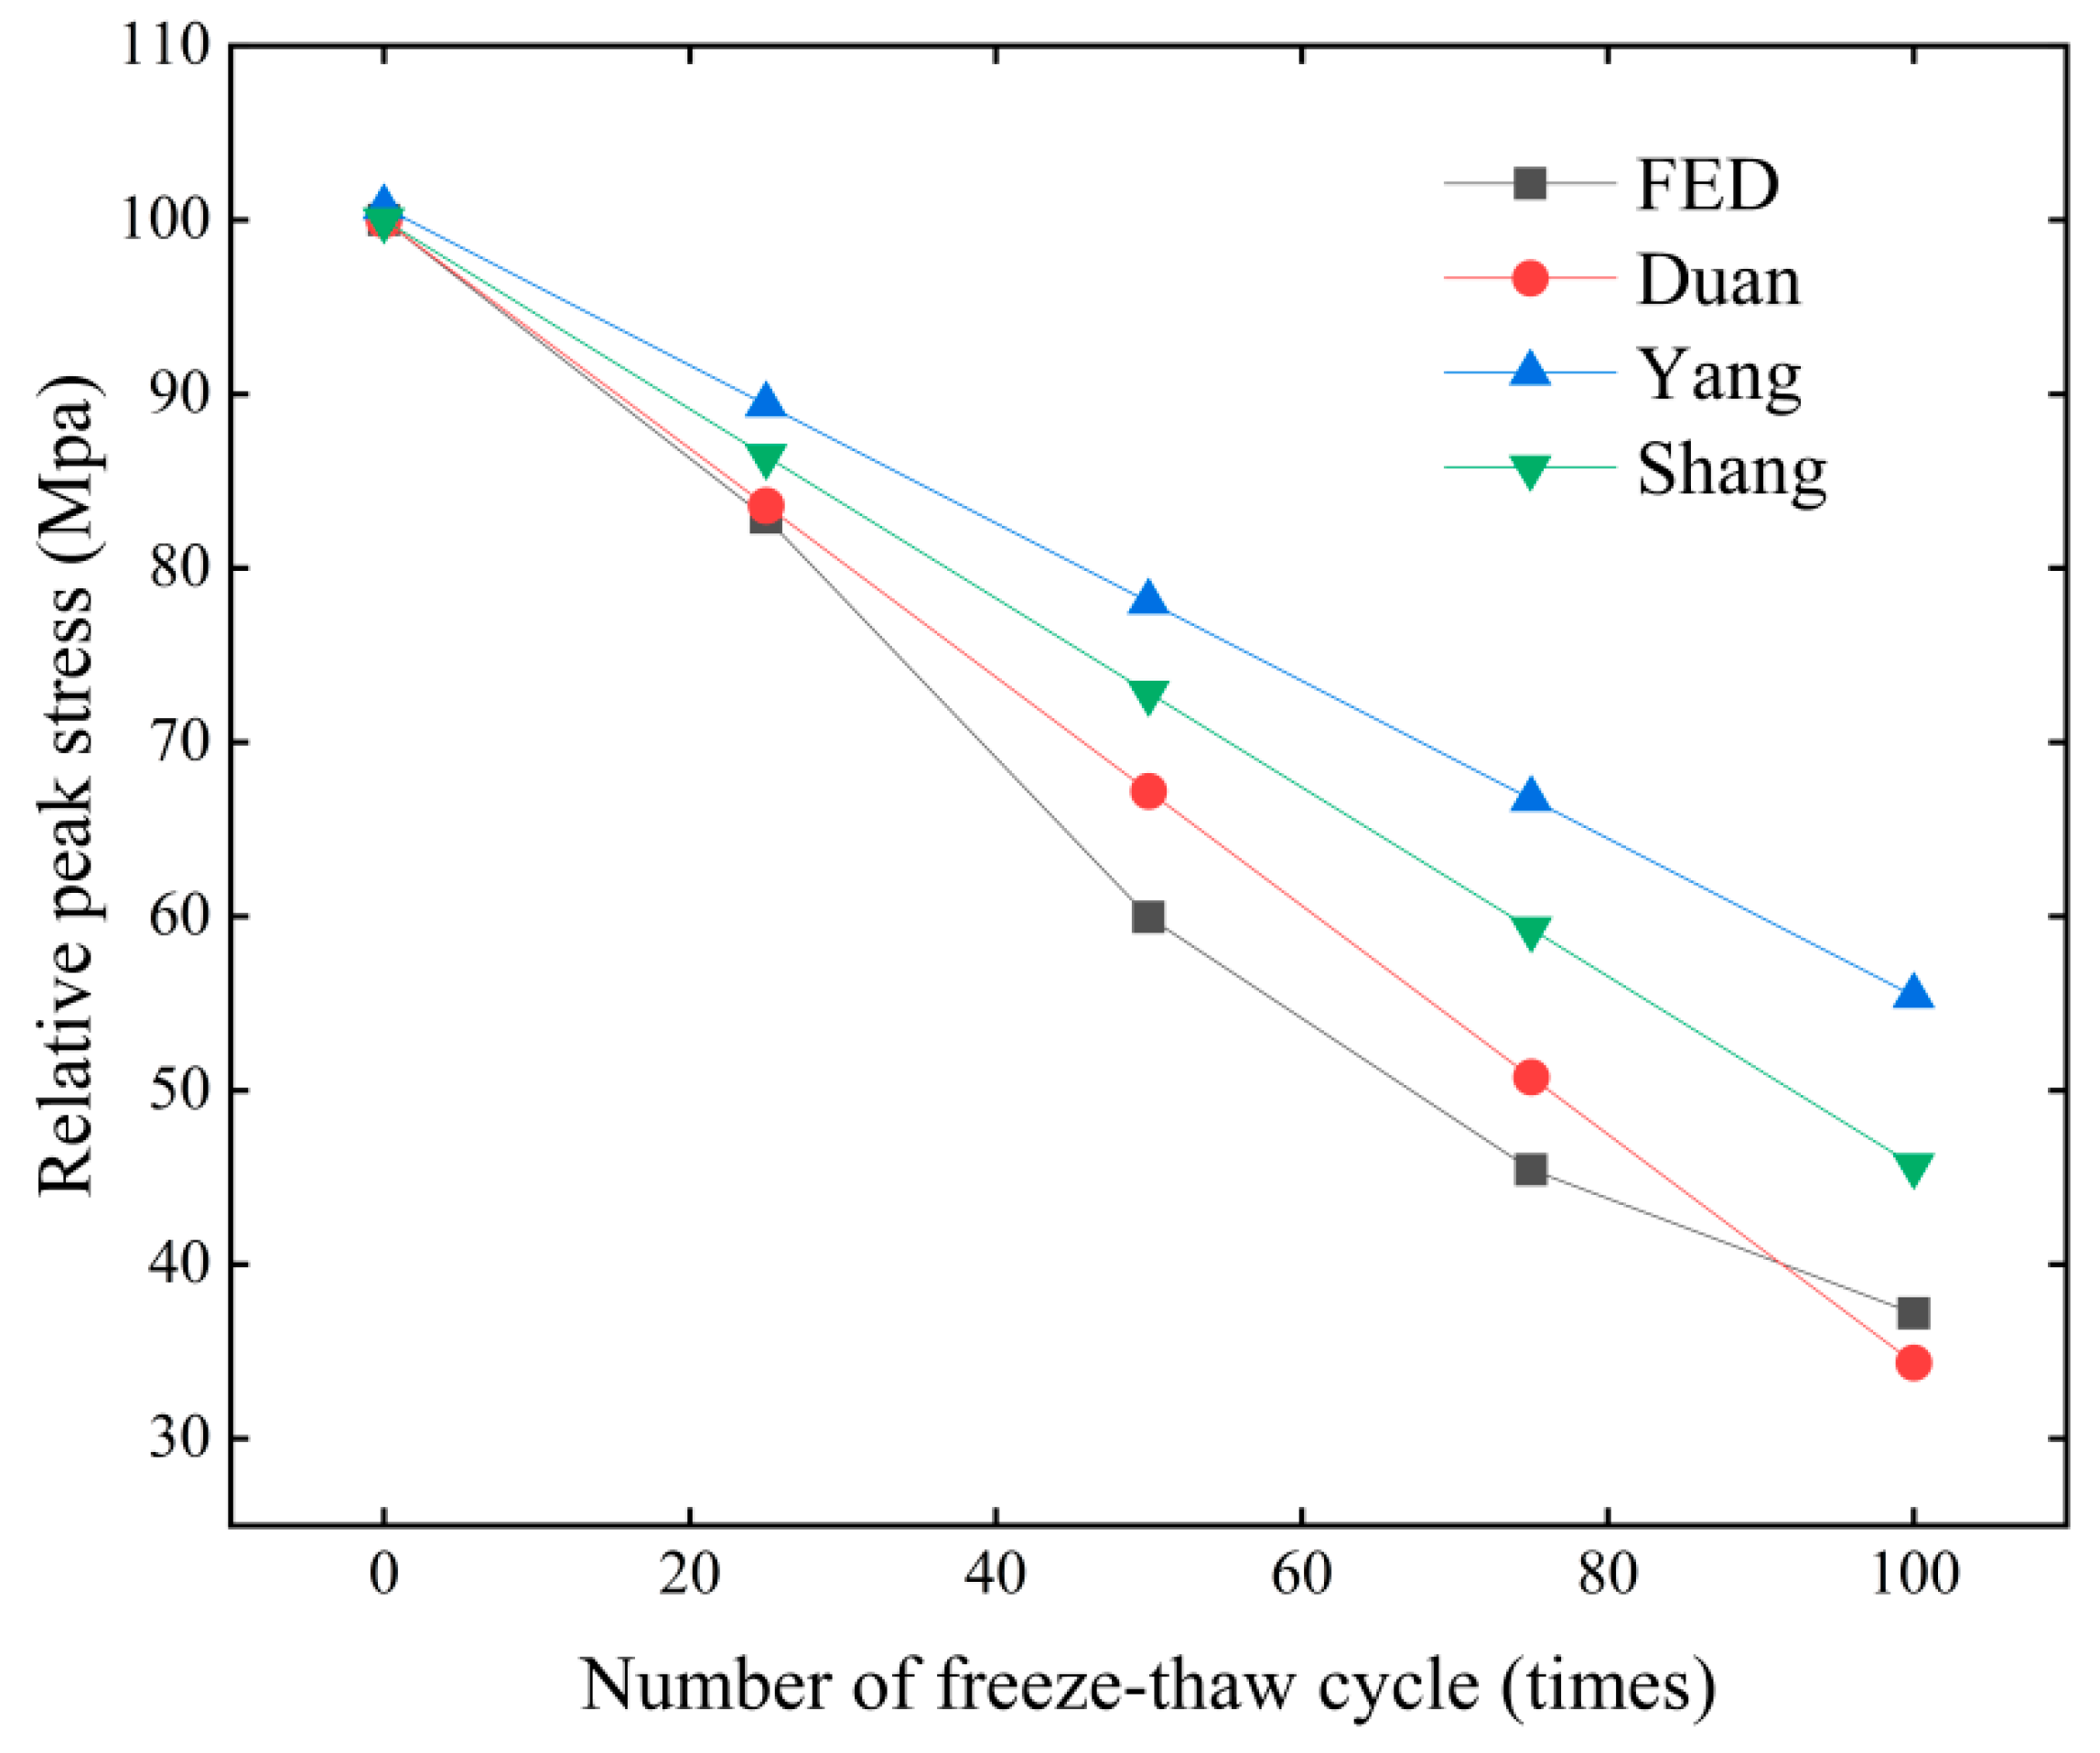
- A comprehensive correlation analysis was performed using grey theory to combine the modified constitutive model with the fitting formulas obtained from the literature. The comprehensive correlation degrees for Duan [27] and Shang [29] were 0.867 and 0.704, respectively. This indicates that our model has a high correlation with the experimental results.
- This research can be effectively utilized in ABAQUS simulations as well as in a range of concrete-related engineering applications. For instance, in dam design, it could be used to predict the stress distributions and potential failure modes under various loading conditions, aiding in the optimization of dam structure and material selection. Similarly, in bridge design, the model can simulate the dynamic response of the bridge to traffic loads and environmental factors such as wind and temperature variations, thus contributing to the assessment of bridge safety and durability. These applications underscore the practical relevance and versatility of our model in addressing complex engineering challenges.
Author Contributions
Funding
Data Availability Statement
Conflicts of Interest
References
- Ge, W.; Jiao, Y.; Li, Z.; Zhang, Z.; Guo, X. Status and development trend of research on risk consequences caused by dam breach. Adv. Water Sci. 2020, 1, 143–151. [Google Scholar] [CrossRef]
- Xing, L.; Nie, G. Durability Analysis of Concrete Structures in Hydropower Stations in China. Water Power 2003, 5, 27–31. [Google Scholar] [CrossRef]
- Xu, X.; Song, Y.; Su, J.; Du, Y.; Su, D. Study of strength experiment and failure criterion of wet-screened concrete after freeze-thaw cycles. Yangtze River 2011, 42, 43–46. [Google Scholar] [CrossRef]
- Demir, İ.; Filazi, A.; Sevim, O.; Simsek, O. Influence of freeze–thaw cycling on properties of cementitious systems doped with fly ash having optimized particle size distribution. Arch. Civ. Mech. Eng. 2022, 22, 189. [Google Scholar] [CrossRef]
- Tian, L.; Lu, J.; Zhu, K.; Liu, Y. Damage of Concrete under Freeze-thaw Cycles and Fatigue Load. J. Changjiang River Sci. Res. Inst. 2018, 35, 140–144. [Google Scholar]
- Xu, C.; Li, X.; Gao, Y.; Lian, H.; Wang, W.; Liu, Z.; Li, Z. Study on the effect of early freezing on the mechanical properties of concrete. Water Resour. Hydropower Eng. 2022, 53, 154–161. [Google Scholar] [CrossRef]
- Long, G.C.; Liu, H.; Ma, K.L.; Xie, Y.J. Uniaxial compression damage constitutive model of concrete subjected to freezing and thawing. J. Cent. South. Univ. Sci. Technol. 2018, 49, 1884–1892. [Google Scholar] [CrossRef]
- Sun, W.; Zhang, Y.M.; Yan, H.D.; Mu, R. Damage and damage resistance of high strength concrete under the action of load and freeze-thaw cycles. Cem. Concr. Res. 1999, 29, 1519–1523. [Google Scholar] [CrossRef]
- Sun, W.; Mu, R.; Luo, X.; Miao, C. Effect of chloride salt, freeze–thaw cycling and externally applied load on the performance of the concrete. Cem. Concr. Res. 2002, 32, 1859–1864. [Google Scholar] [CrossRef]
- Achintya; Prasad, M.M. Behaviour of concrete in freeze-thaw environment of sea water. J. Inst. Eng. India Civ. Eng. Div. 2003, 84, 96–101. [Google Scholar]
- Zou, C.; Zhao, J.; Liang, F.; Ba, H. Experimental study on stress-strain relationship of concrete in freeze-thaw environment. J. Harbin Inst. Technol. 2007, 3, 229–231. [Google Scholar] [CrossRef]
- Cao, D.; Fu, L.; Yang, Z.; Qin, X. Study on Constitutive Relations of Compressed Concrete Subjected to Action of Freezing-Thawing Cycles. J. Build. Mater. 2013, 16, 17–23. [Google Scholar]
- Tian, W.; Xie, Y.; Dang, F. Experimental Study on the Mechanical Property and Damage Evolution of Concrete Under Freeze-thaw Environment. J. Sichuan Univ. (Eng. Sci. Ed.) 2015, 47, 38–44. [Google Scholar] [CrossRef]
- Jiang, L.; Niu, D. Study on Constitutive Relation of Concrete Under Sulfate Attack and Freeze-thaw Environment. J. Sichuan Univ. (Eng. Sci. Ed.) 2016, 48, 71–78. [Google Scholar] [CrossRef]
- Du, P.; Yao, Y.; Wang, L.; Xu, D.; Zhou, Z.; Huang, S.; Cheng, X. Deformation of a concrete matrix subject to a cyclic freeze–thaw process. Rsc Adv. 2016, 6, 58417–58425. [Google Scholar] [CrossRef]
- Wang, B.; Wang, F.; Wang, Q. Damage constitutive models of concrete under the coupling action of freeze–thaw cycles and load based on Lemaitre assumption. Constr. Build. Mater. 2018, 173, 332–341. [Google Scholar] [CrossRef]
- Wang, B.; Pan, J.; Fang, R.; Wang, Q. Damage model of concrete subjected to coupling chemical attacks and freeze-thaw cycles in saline soil area. Constr. Build. Mater. 2020, 242, 118205. [Google Scholar] [CrossRef]
- Cheng, M.; Zhang, J.; Duan, X.; Zhu, J. Experimental Study on Mechanical Properties of Concrete Reinforced with Hybrid Fiber and Fly Ash Subjected to Freeze-thaw Cycles. Sci. Technol. Eng. 2020, 20, 11288–11294. [Google Scholar]
- Chen, X.; Yang, S.; Han, M. Uniaxial Compression Simulation of Concrete under the Coupled Actions of Sulfate, Dry-wet Cycles and Freeze-thaw Cycles. Sci. Technol. Eng. 2023, 23, 6158–6166. [Google Scholar] [CrossRef]
- Abaqus Analysis User’s Guide 6.3.3; Corp, Dassault Systèmes Simulia: Providence, RI, USA, 2016.
- GB 50010-2010; Code for Design of Concrete Structures. Ministry of Housing and Urban Rural Development of the People’s Republic of China: Beijing, China, 2010. (In Chinese)
- GB/T 50082-2009; Standard Test Methods for Long-Term Performance and Durability of Ordinary Concrete. Ministry of Housing and Urban Rural Development of the People’s Republic of China: Beijing, China, 2009. (In Chinese)
- Guo, X. Seismic Response Analysis of Gravity Dam in Freeze-thaw Environment. Master’s Thesis, Northeast Petroleum University, Daqing, China, 2021. [Google Scholar]
- Liu, W.; Xu, M.; Chen, Z. Parameters Calibration and Verification of Concrete Damage Plasticity Model of Abaqus. Ind. Constr. 2014, 44, 167–171. [Google Scholar] [CrossRef]
- Cao, M. Research on Damage Plastic Calculation Method of ABAQUS Concrete Damaged Plasticity Model. Commun. Stand. 2012, 2, 51–54. [Google Scholar] [CrossRef]
- Zhang, T. Evaluation and Application of Typical Material Models Used in FE Modelling Under Monotonic and Cyclic Loading Conditions. Master’s Thesis, Kunming University of Science and Technology, Kunming, China, 2020. [Google Scholar]
- Duan, A.; Qian, J. Experimental study on complete compressive stress-strain curve of concrete subjected to freeze-thaw cycles. Concrete 2008, 8, 13–16. [Google Scholar] [CrossRef]
- Yang, Z. Reaserch About Uniaxial Compression Performance of Concrete Under Freeze-Thaw Cycles. Master’s Thesis, Yangzhou University, Yangzhou, China, 2010. [Google Scholar]
- Shang, H.; Song, Y.; Qin, L. Experimental Study on Properties of Concrete after Freezing and Thawing Cycles. China Concr. Cem. Prod. 2005, 2, 9–11. [Google Scholar] [CrossRef]
- Zou, Y.; Zhao, J.; Liang, F.; Luo, J.; Xu, T. Degradation of mechanical properties of concrete caused by freeze-thaw action. J. Build. Struct. 2008, 1, 117–123. [Google Scholar] [CrossRef]


| Material Behavior | Value | Units |
|---|---|---|
| Density | 2400 | kg/m3 |
| Specific Heat | 960 | J/kg·°C |
| Conductivity | 2.94 | W/m·K |
| Expansion Coefficient | 1 × 10⁻⁵ | 1/°C |
| Poisson’s Ratio | 0.2 | — |
| Dilation Angle | 30 | — |
| Eccentricity | 0.1 | — |
| fb0/fc0 | 1.16 | — |
| K | 0.6667 | — |
| Viscosity Parameter | 1 × 10⁻⁵ | — |
| Time (s) | Value |
|---|---|
| 0 | 10 |
| 900 | 8.5 |
| 1800 | 4.5 |
| 2700 | 0 |
| 3600 | −3.5 |
| 4500 | −7 |
| 5400 | −10.5 |
| 6300 | −13.5 |
| 7200 | −16 |
| 8100 | −20 |
| 9000 | −16 |
| 9900 | −11.5 |
| 10,800 | −6 |
| 11,700 | −1.5 |
| 12,600 | 5 |
| 13,500 | 9 |
| 14,400 | 10 |
| Serial Number | Number of Freeze-Thaw Cycles | Peak Force (N) | Compressive Strength (MPa) | Relative Compressive Strength (%) |
|---|---|---|---|---|
| 1 | 0 | 468,800.28 | 20.84 | 100.00% |
| 2 | 25 | 389,388.34 | 17.31 | 83.06% |
| 3 | 50 | 279,772.94 | 12.43 | 59.68% |
| 4 | 75 | 214,684.53 | 9.54 | 45.79% |
| 5 | 100 | 173,318.89 | 7.70 | 36.97% |
| Serial Number | Number of Freeze-Thaw Cycles | Dynamic Modulus of Elasticity (MPa) | Relative Compressive Strength (%) |
|---|---|---|---|
| 1 | 0 | 35,721 | 100.00% |
| 2 | 25 | 32,804 | 91.83% |
| 3 | 50 | 29,909 | 83.73% |
| 4 | 75 | 24,494 | 68.57% |
| 5 | 100 | 22,494 | 62.97% |
| Number of Freeze-Thaw Cycles | Peak Compressive Stress (MPa) | Peak Compressive Strain |
|---|---|---|
| 0 | 22.23 | 0.001511 |
| 25 | 18.43 | 0.001438 |
| 50 | 13.32 | 0.001328 |
| 75 | 10.10 | 0.001247 |
| 100 | 8.27 | 0.001194 |
Disclaimer/Publisher’s Note: The statements, opinions and data contained in all publications are solely those of the individual author(s) and contributor(s) and not of MDPI and/or the editor(s). MDPI and/or the editor(s) disclaim responsibility for any injury to people or property resulting from any ideas, methods, instructions or products referred to in the content. |
© 2025 by the authors. Licensee MDPI, Basel, Switzerland. This article is an open access article distributed under the terms and conditions of the Creative Commons Attribution (CC BY) license (https://creativecommons.org/licenses/by/4.0/).
Share and Cite
Hu, A.; Chen, X.; Du, X.; Wang, F. Dynamic Compressive Damage Constitutive Correction of Concrete Under Freeze-Thaw Cycle. Materials 2025, 18, 1238. https://doi.org/10.3390/ma18061238
Hu A, Chen X, Du X, Wang F. Dynamic Compressive Damage Constitutive Correction of Concrete Under Freeze-Thaw Cycle. Materials. 2025; 18(6):1238. https://doi.org/10.3390/ma18061238
Chicago/Turabian StyleHu, Ankui, Xinglin Chen, Xinyu Du, and Fei Wang. 2025. "Dynamic Compressive Damage Constitutive Correction of Concrete Under Freeze-Thaw Cycle" Materials 18, no. 6: 1238. https://doi.org/10.3390/ma18061238
APA StyleHu, A., Chen, X., Du, X., & Wang, F. (2025). Dynamic Compressive Damage Constitutive Correction of Concrete Under Freeze-Thaw Cycle. Materials, 18(6), 1238. https://doi.org/10.3390/ma18061238