

Eco-Efficient Fiber-Reinforced Concrete: From Mix Design to Fresh and Hardened State Behavior

 , , and
Abstract
:1. Introduction
2. Background
2.1. Particle Packing Models (PPMs)
2.2. Fiber-Reinforced Concrete (FRC)
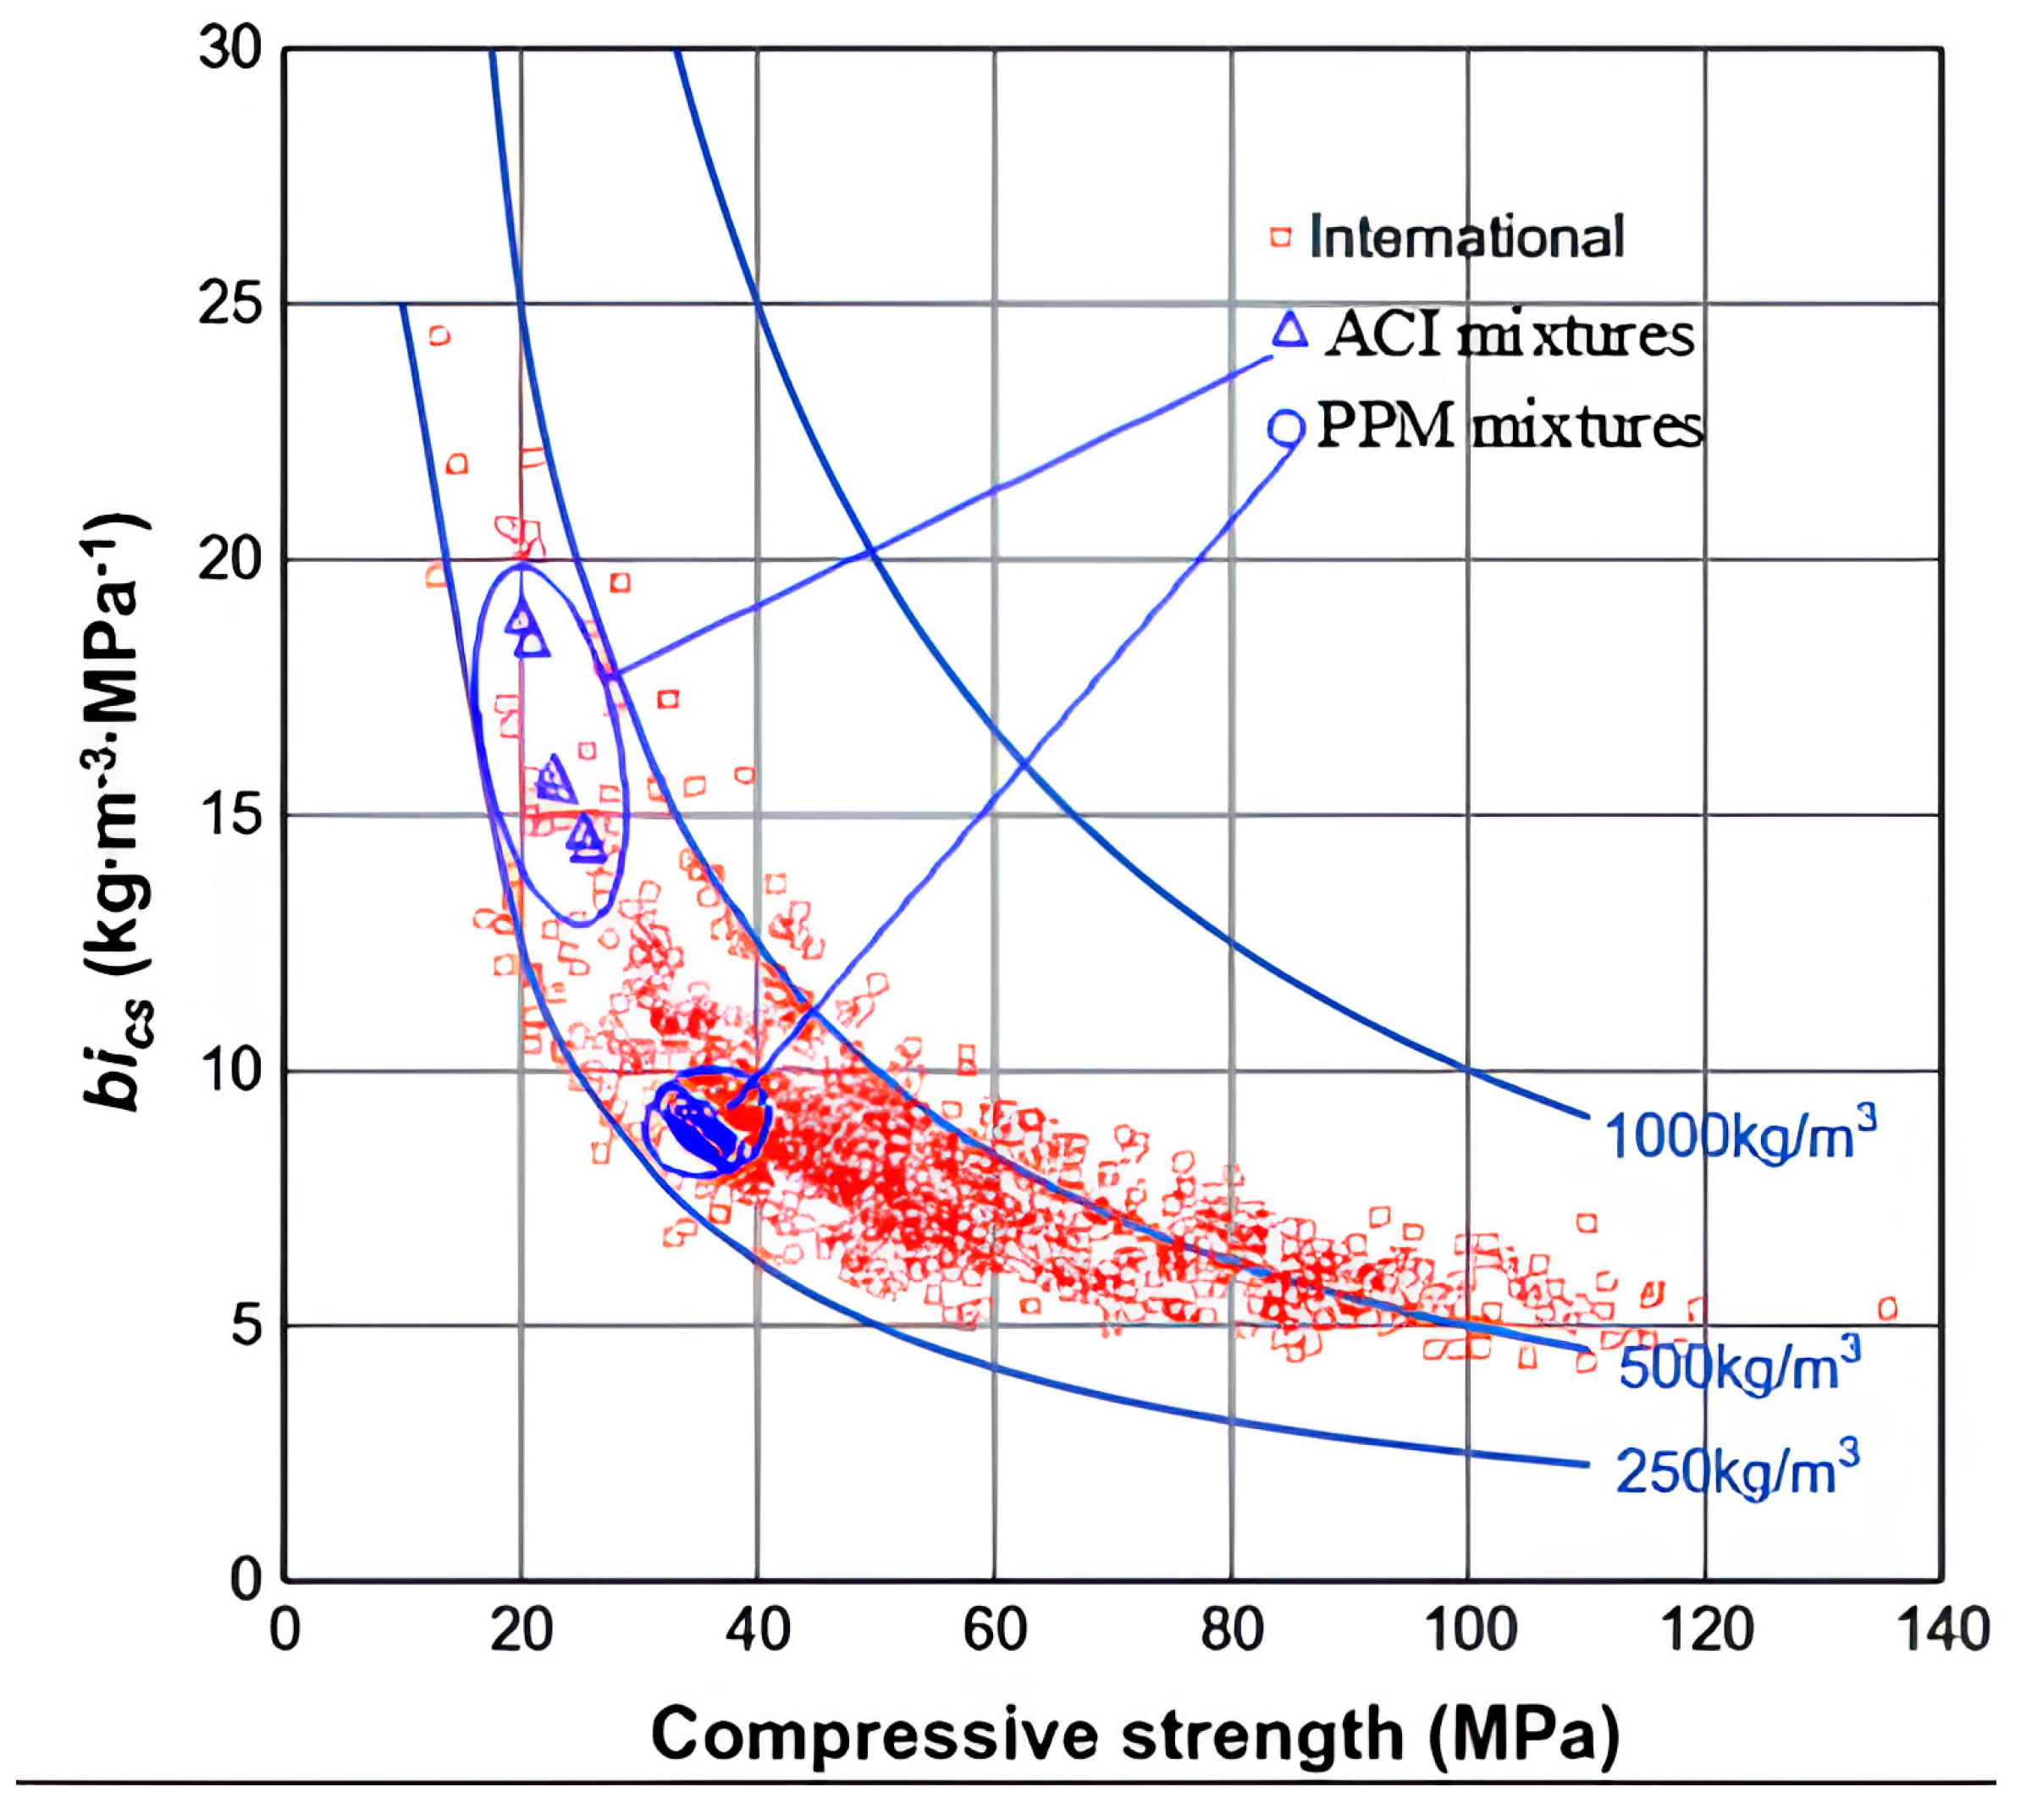
2.3. Binder Intensity Factor
3. Scope of the Work
4. Materials and Methods
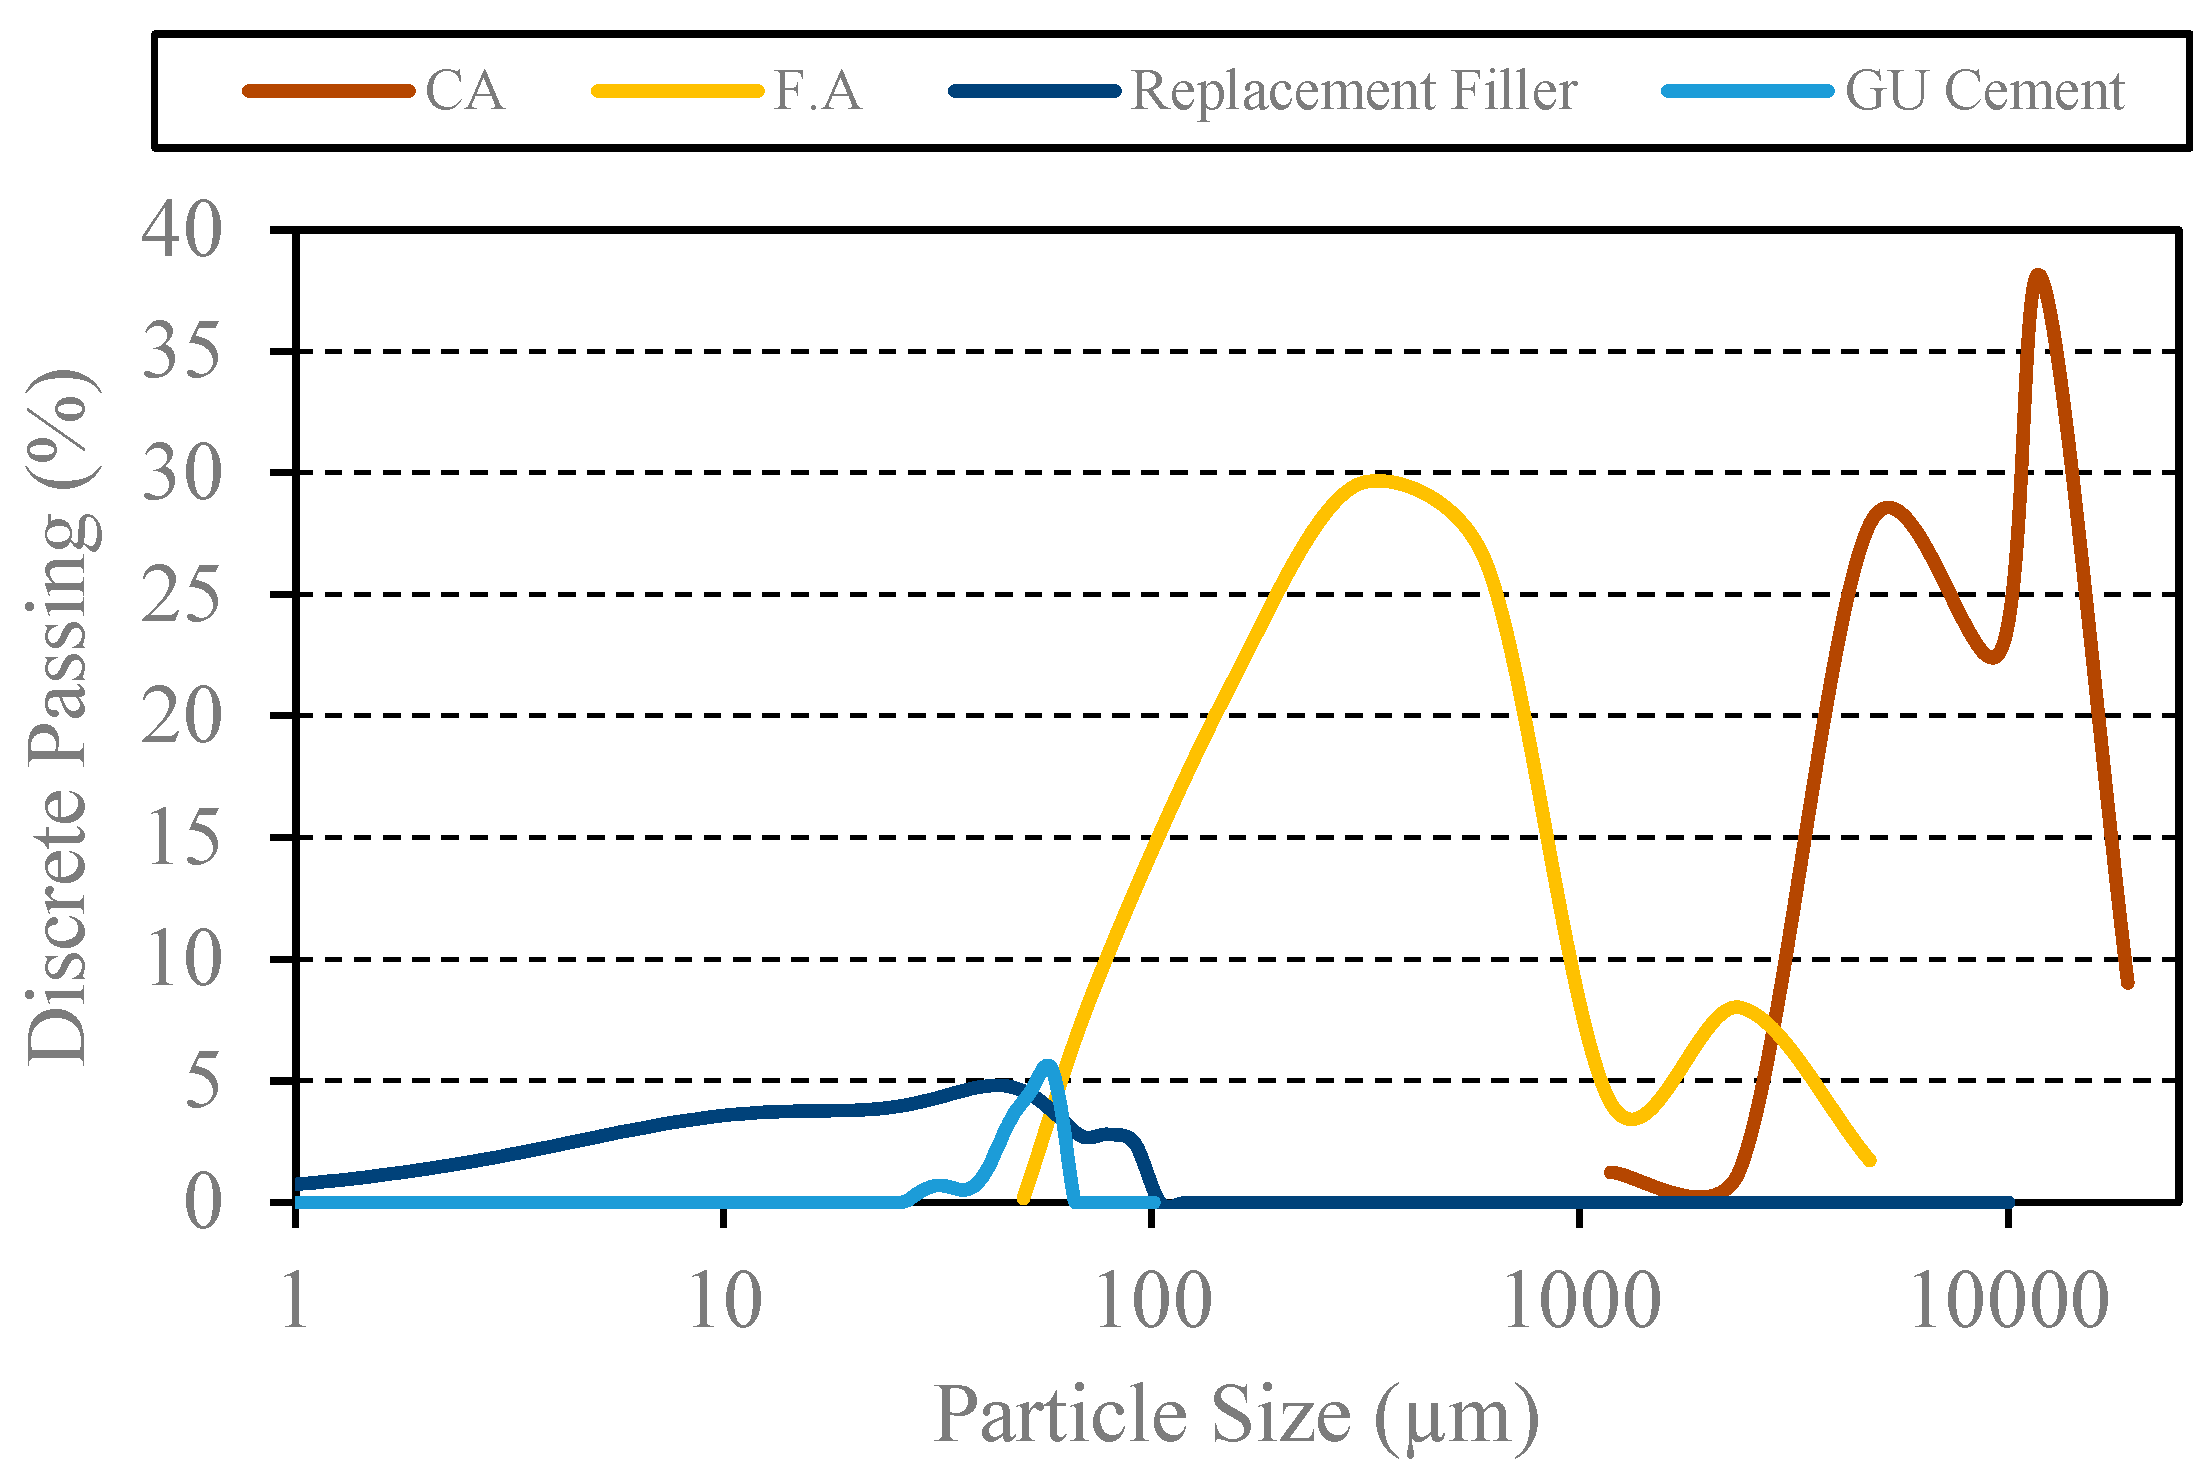
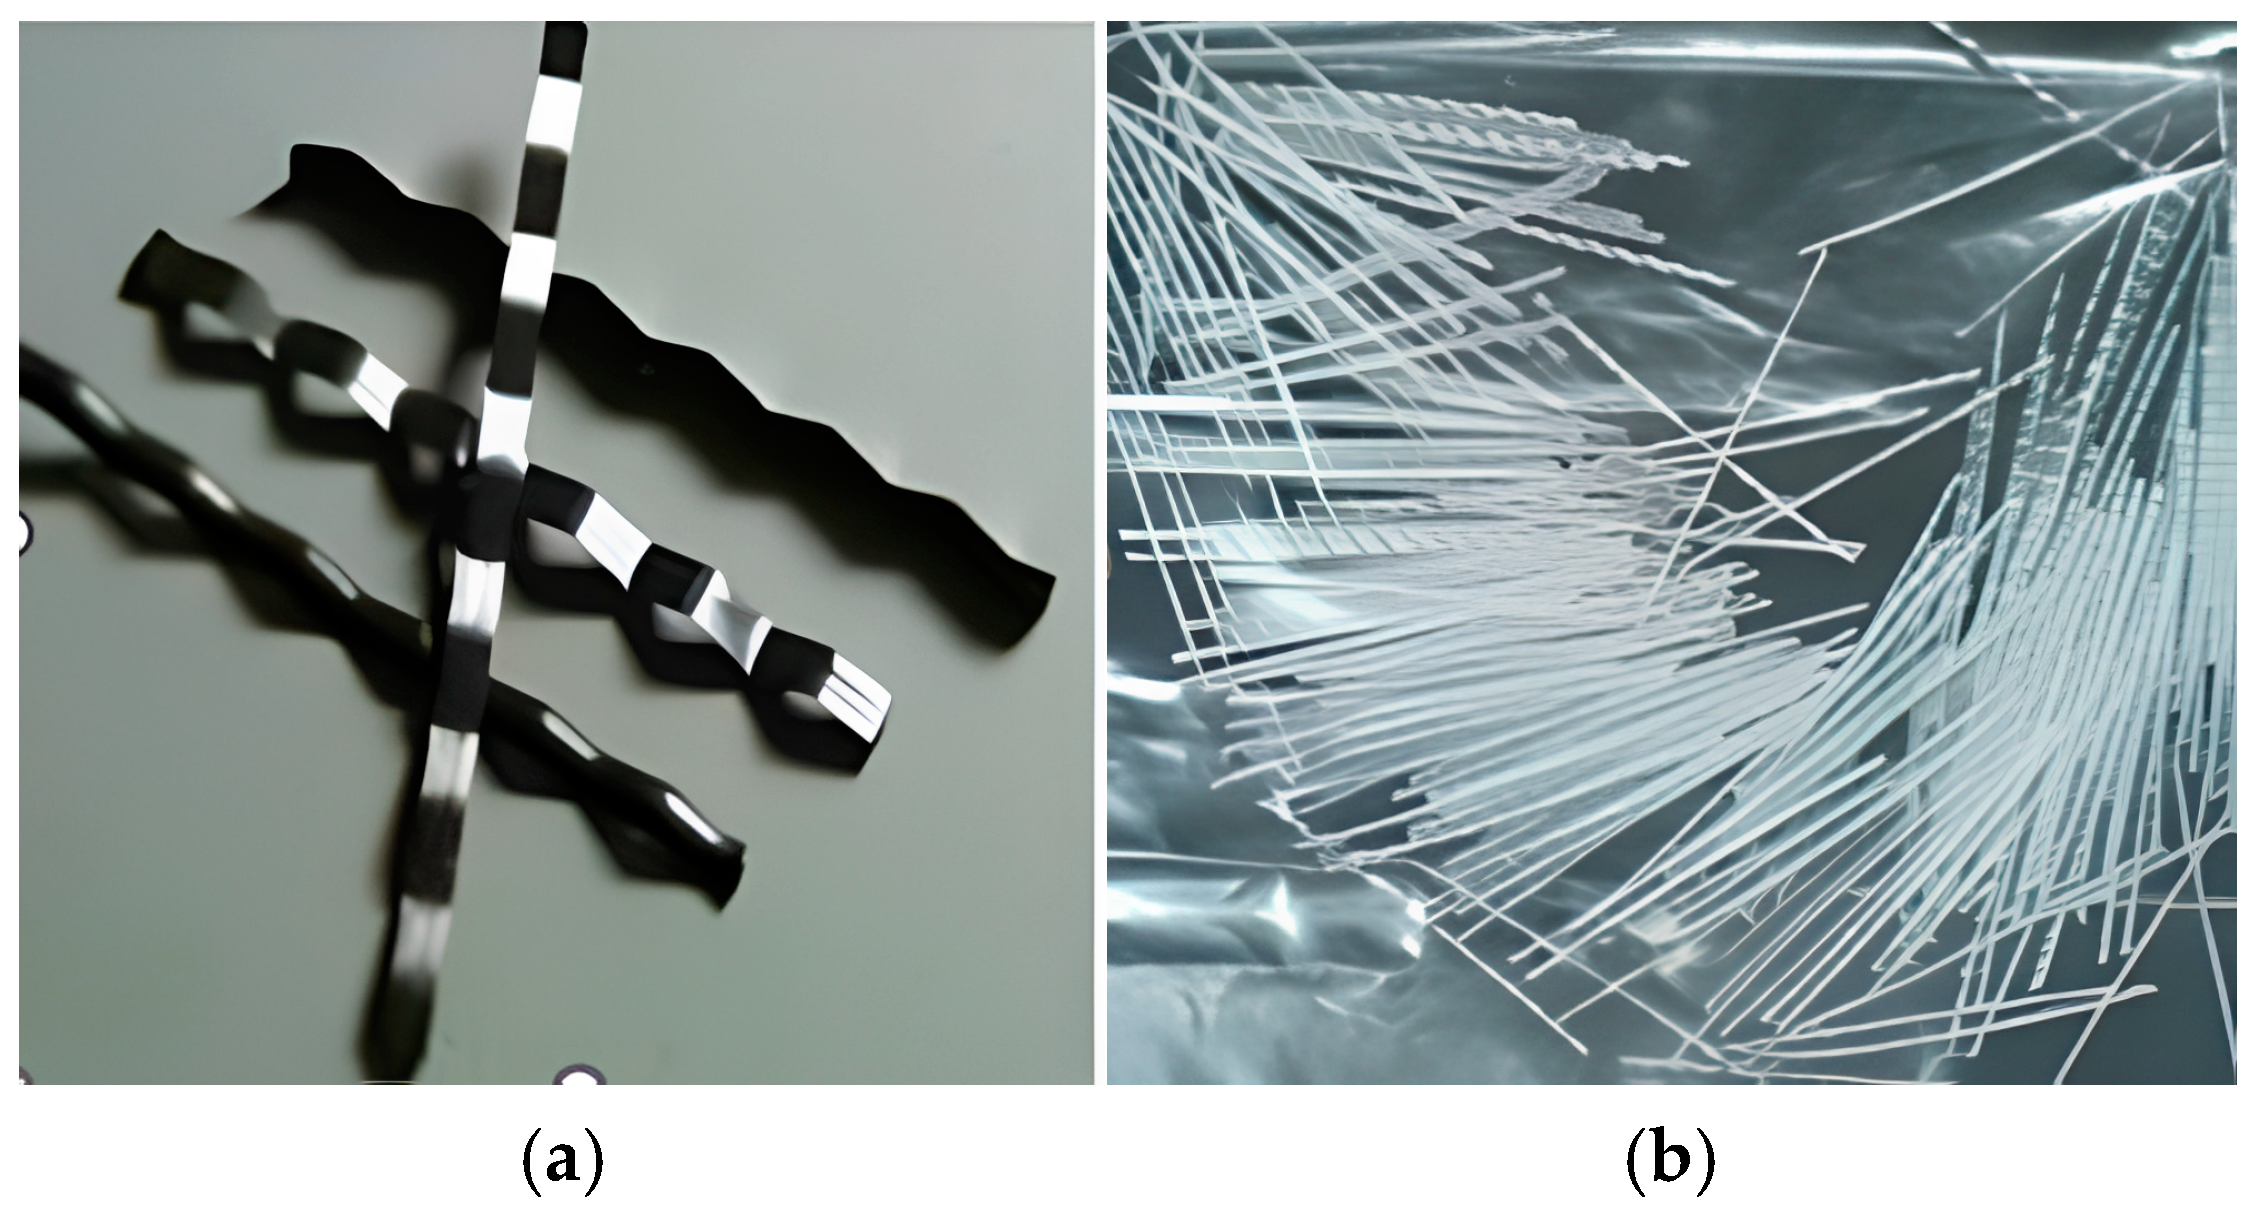
4.1. Raw Material Characterization
4.2. Mix Design Method
4.2.1. PPM-Designed FRC Mixtures
4.2.2. ACI-Designed FRC Mixture
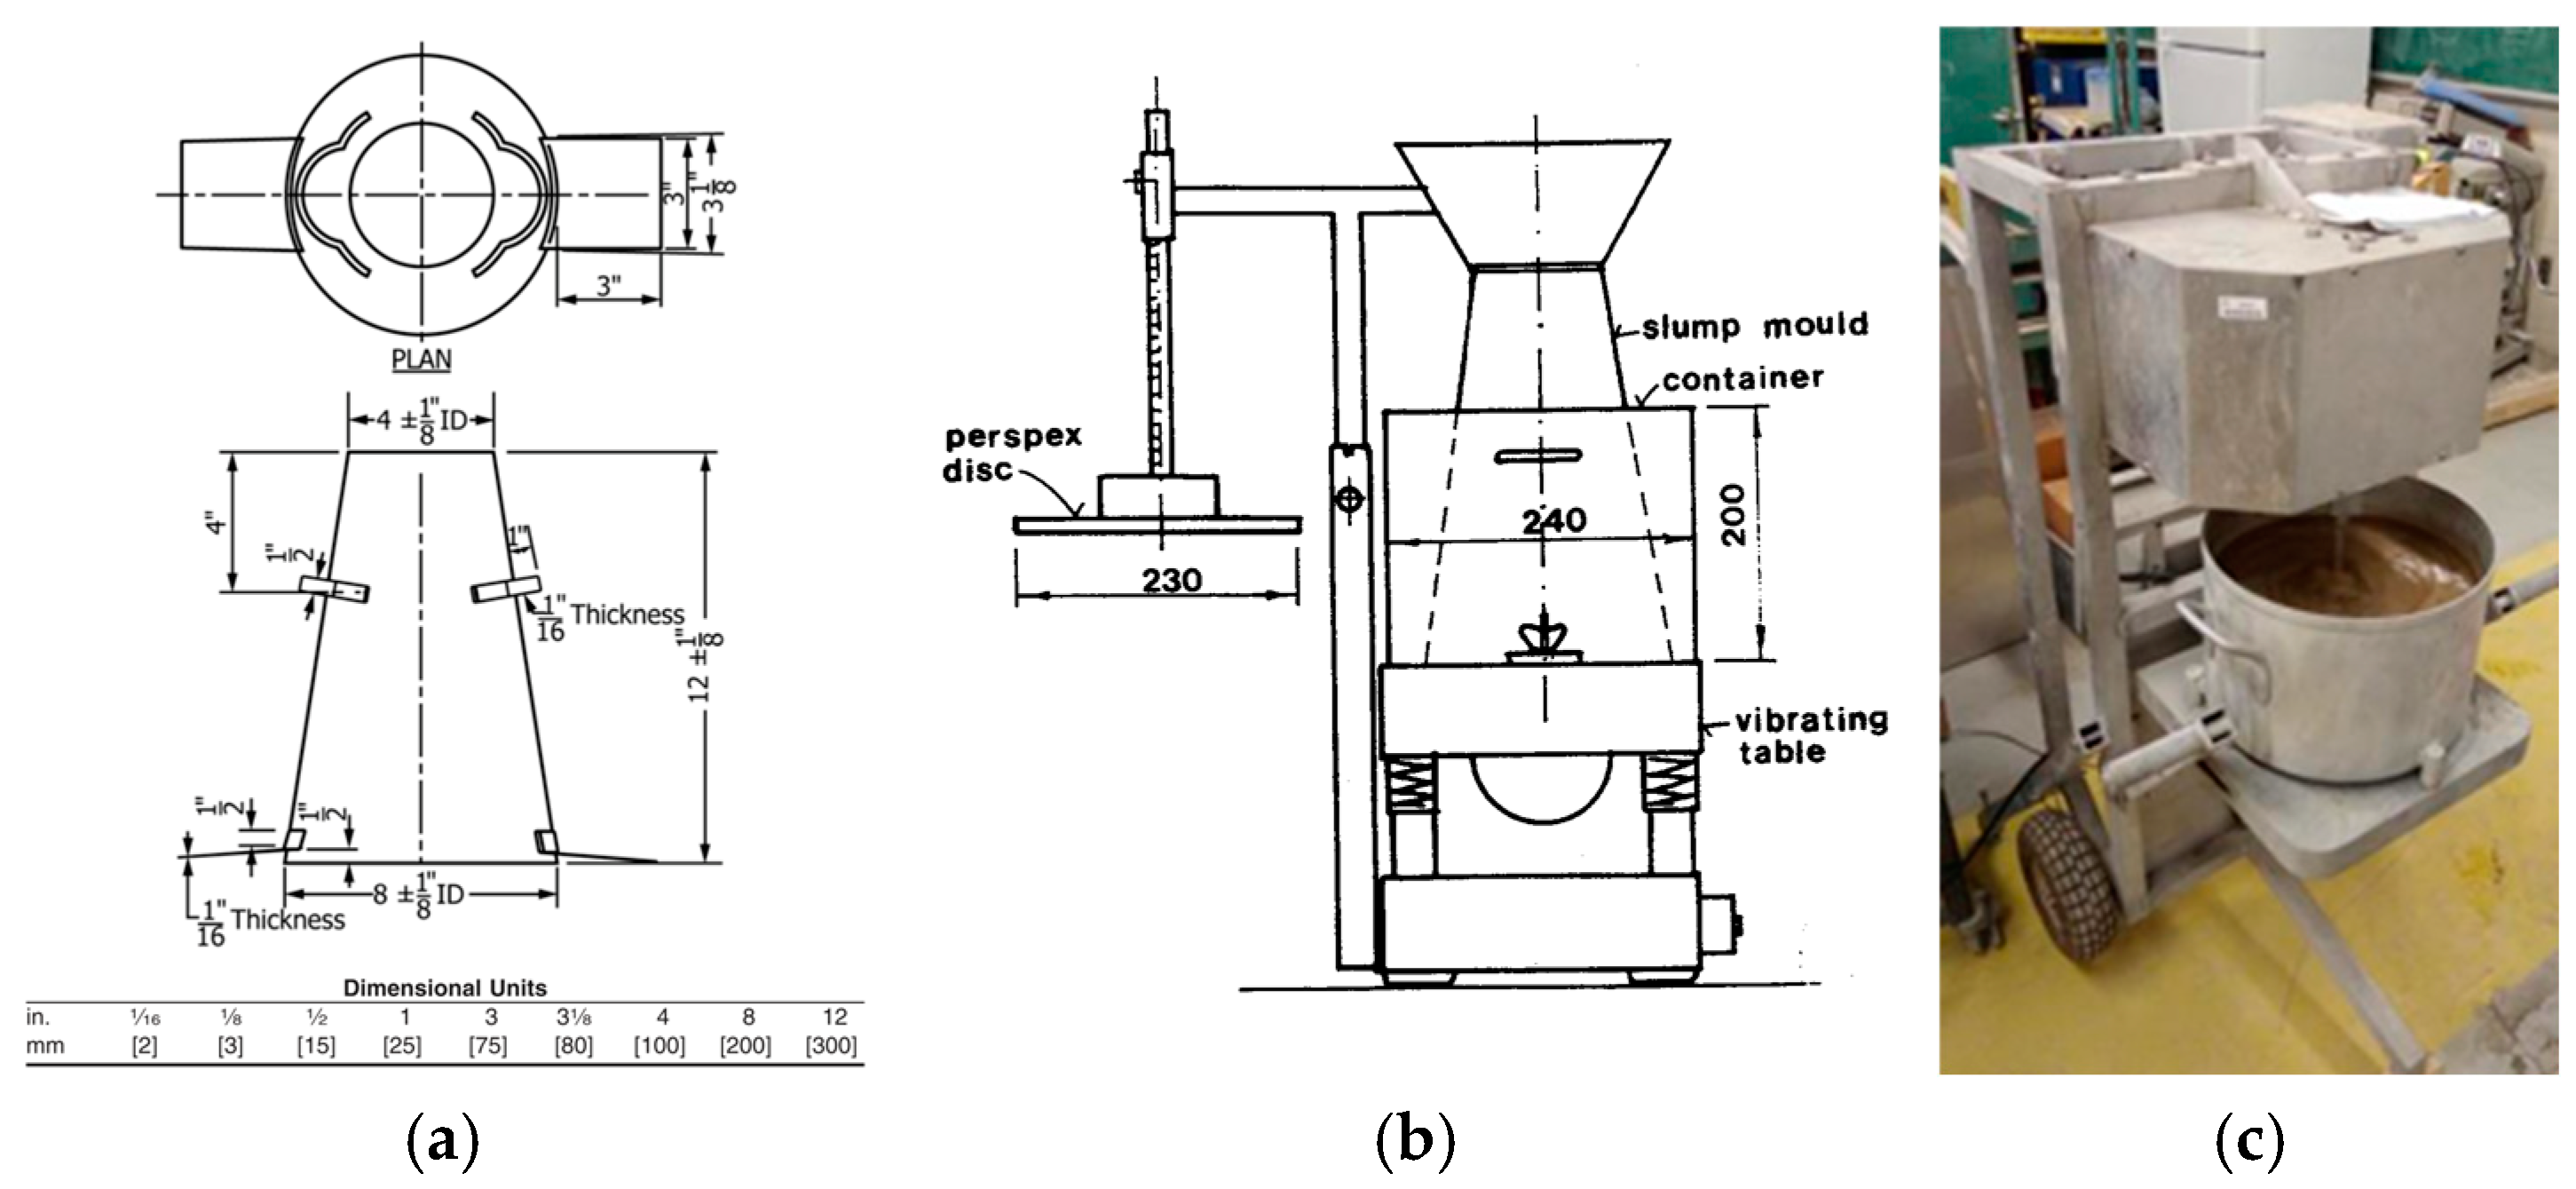
4.3. Fresh and Hardened State Testing Methods
5. Results
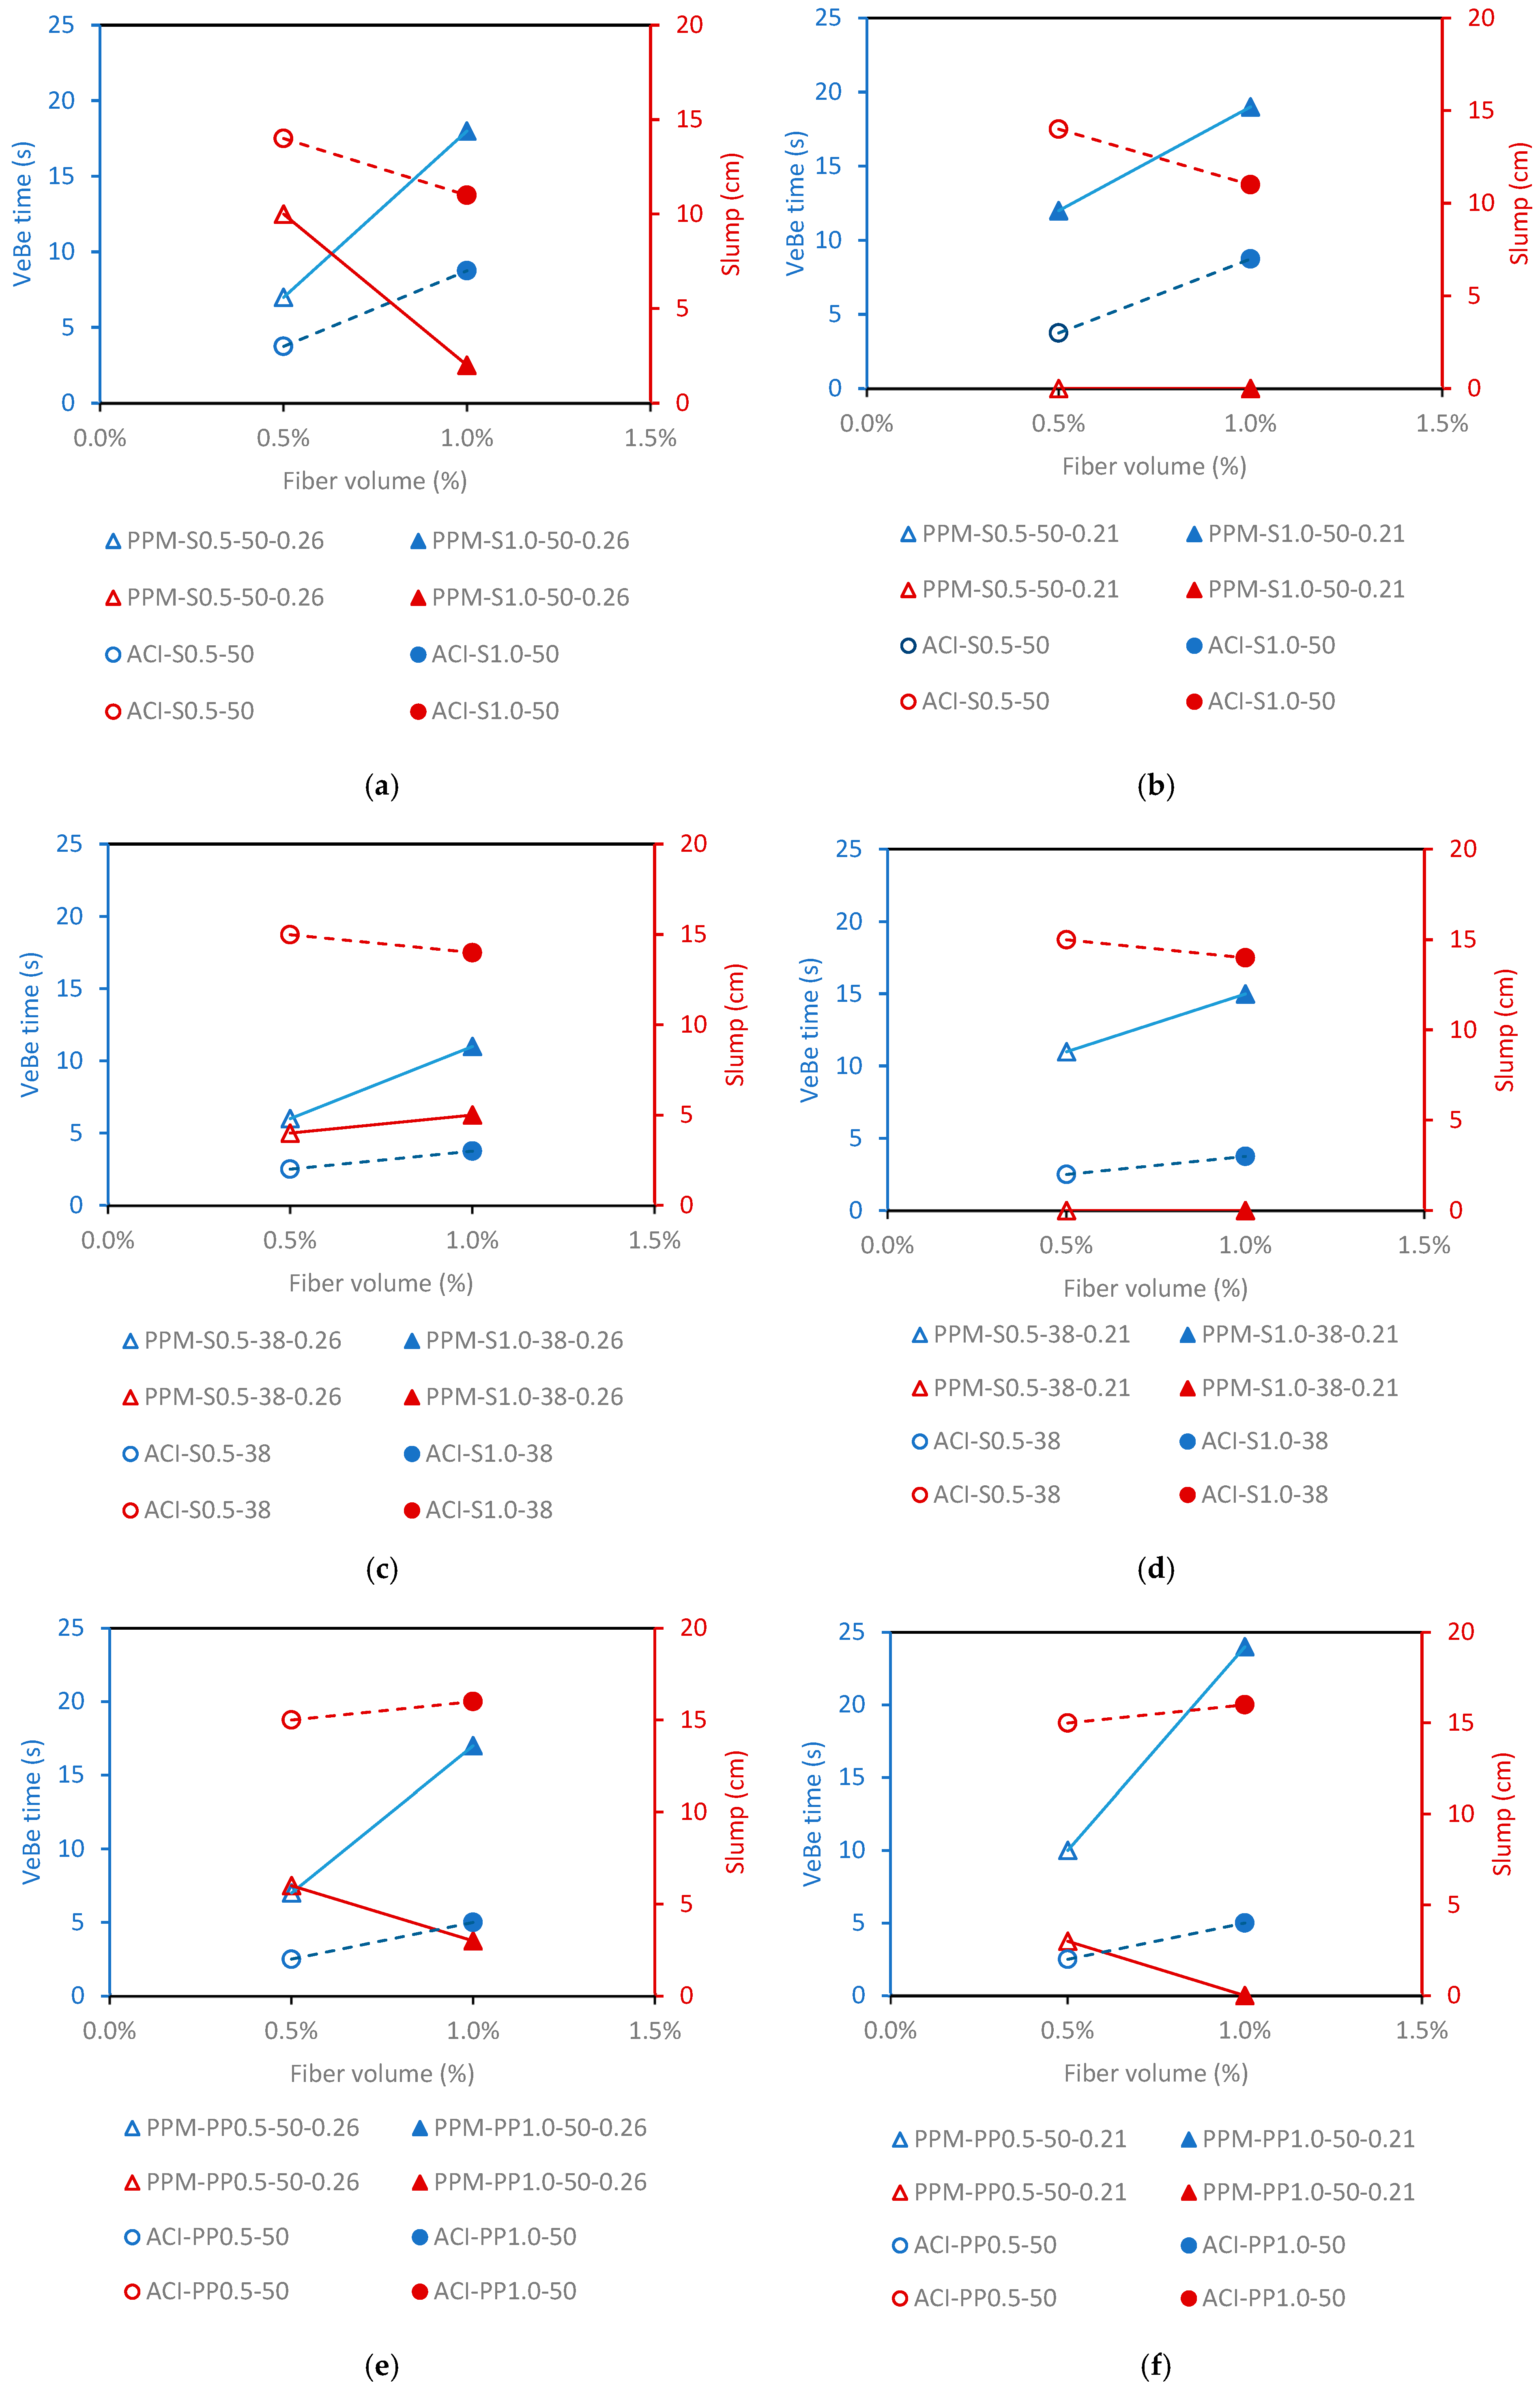
5.1. Fresh State
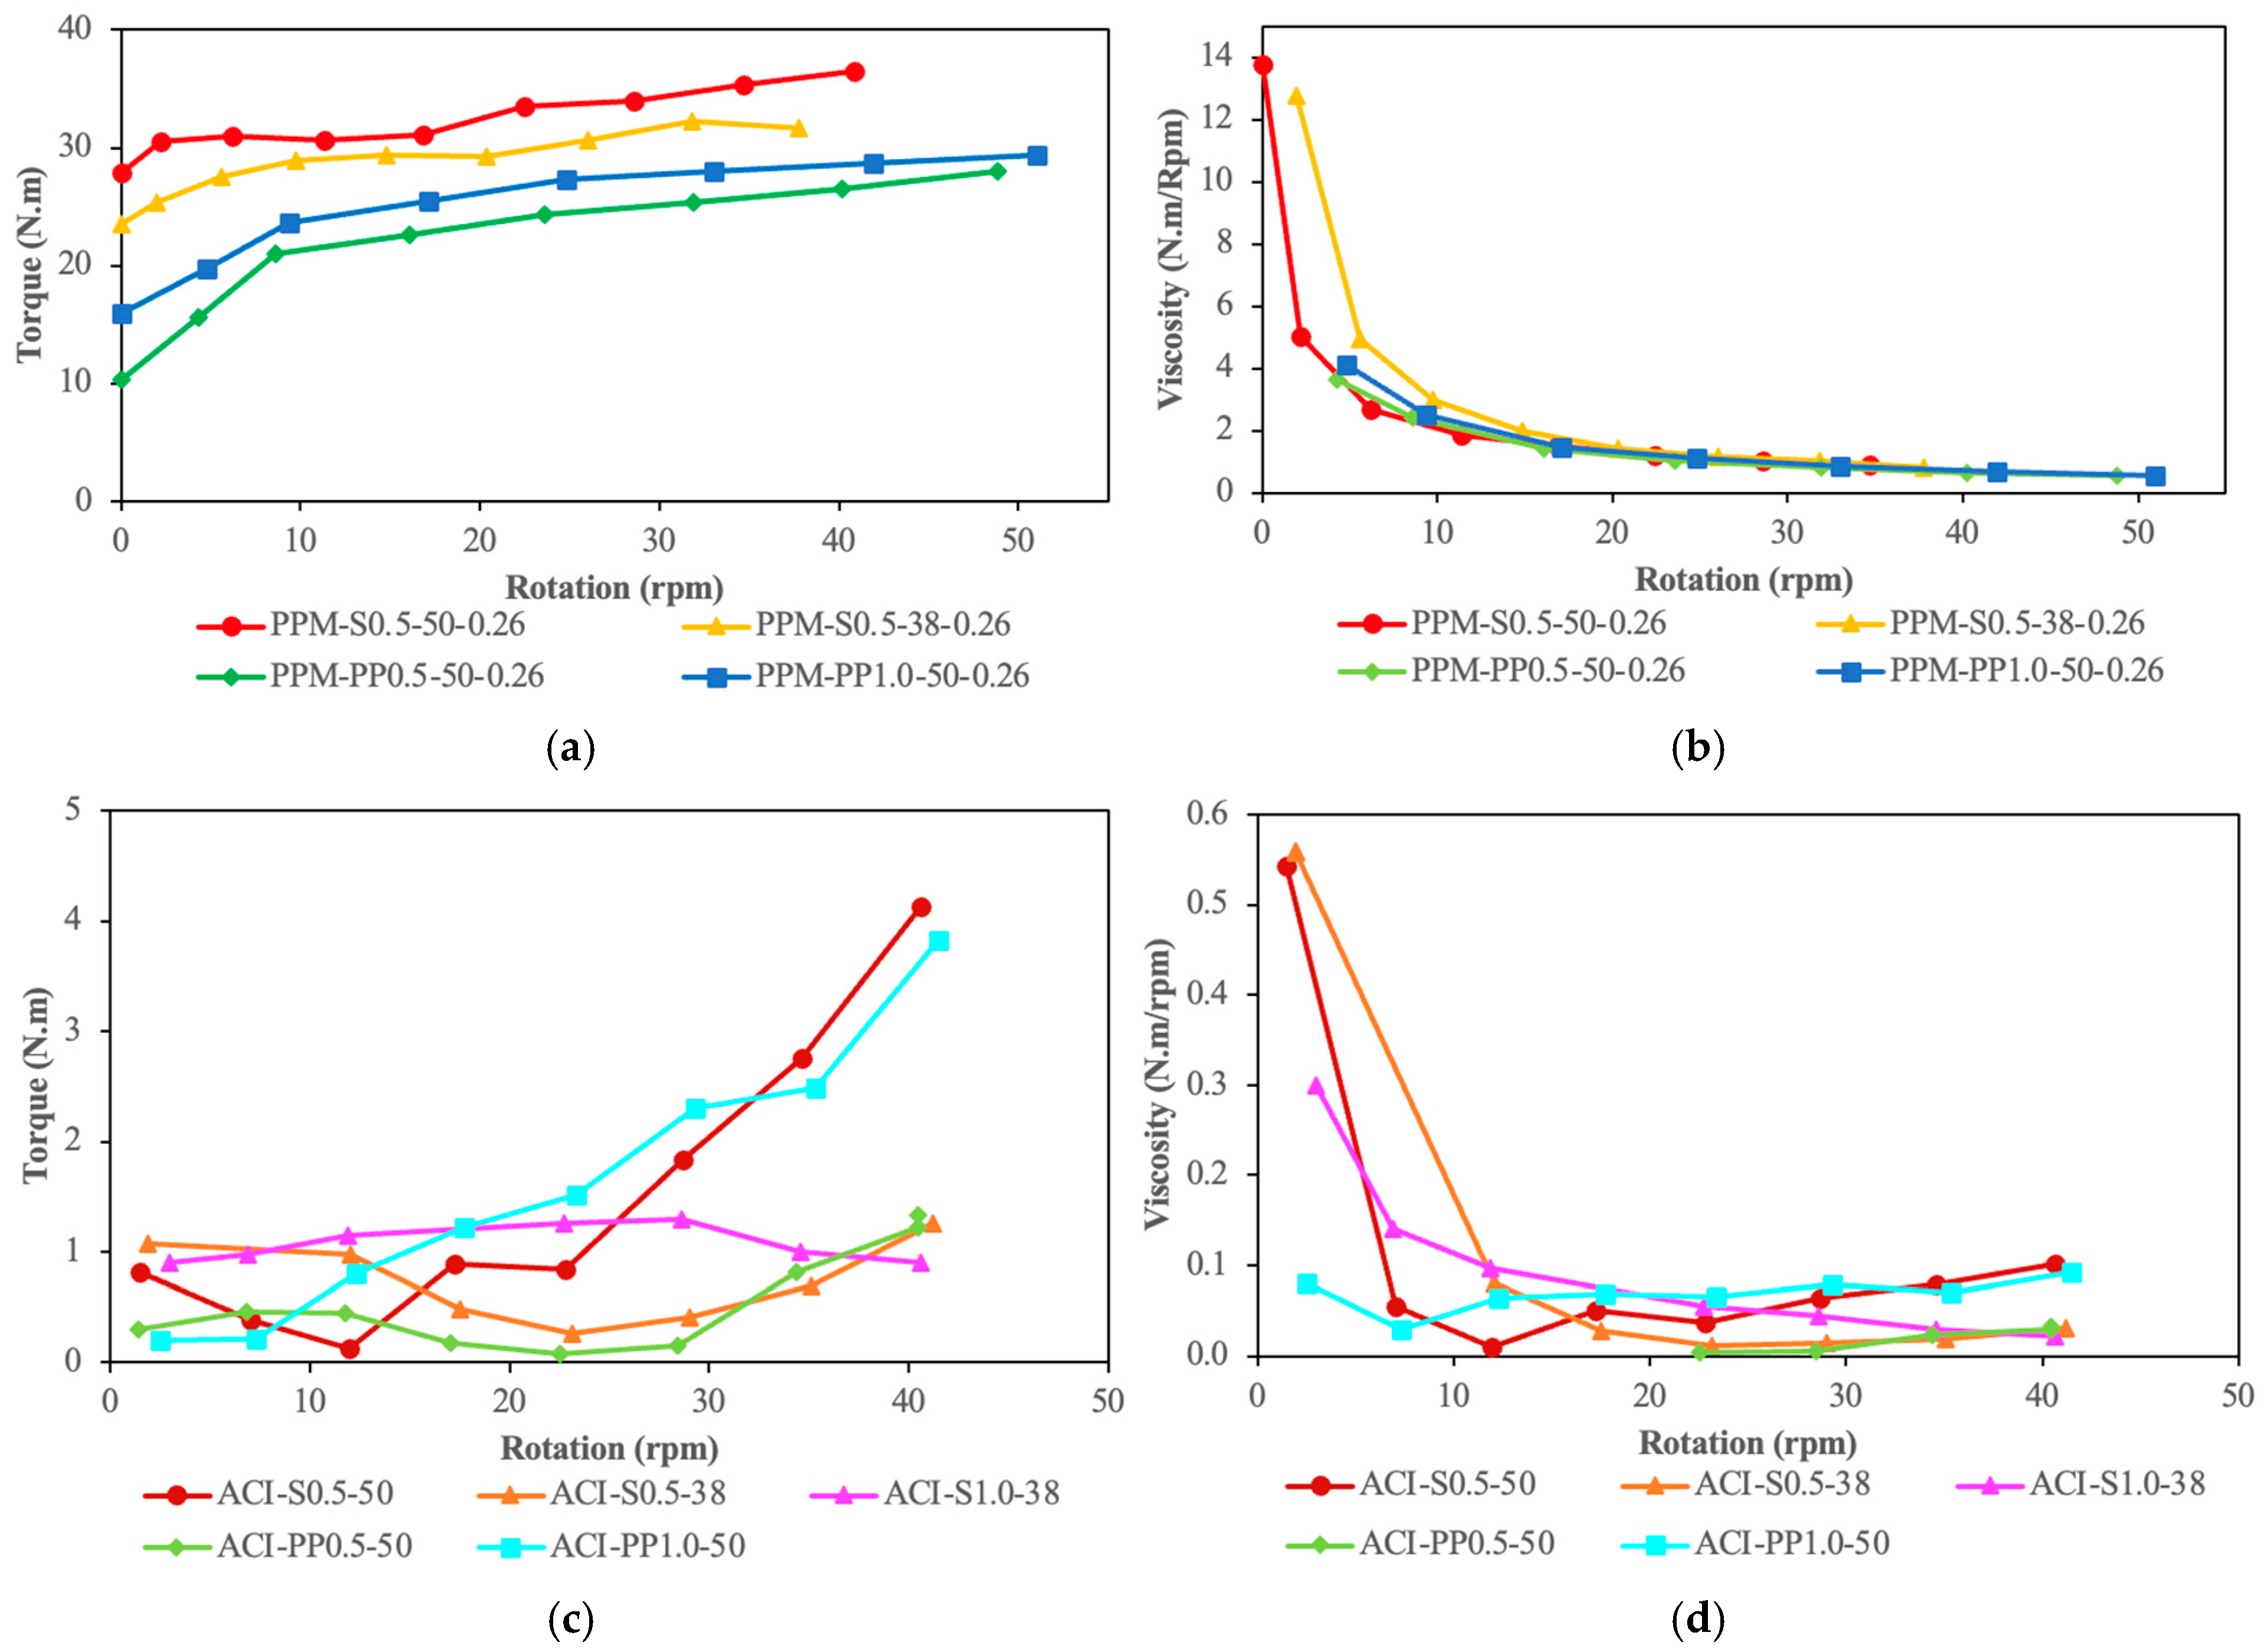
5.2. Rheological Characterization
5.3. Hardened State
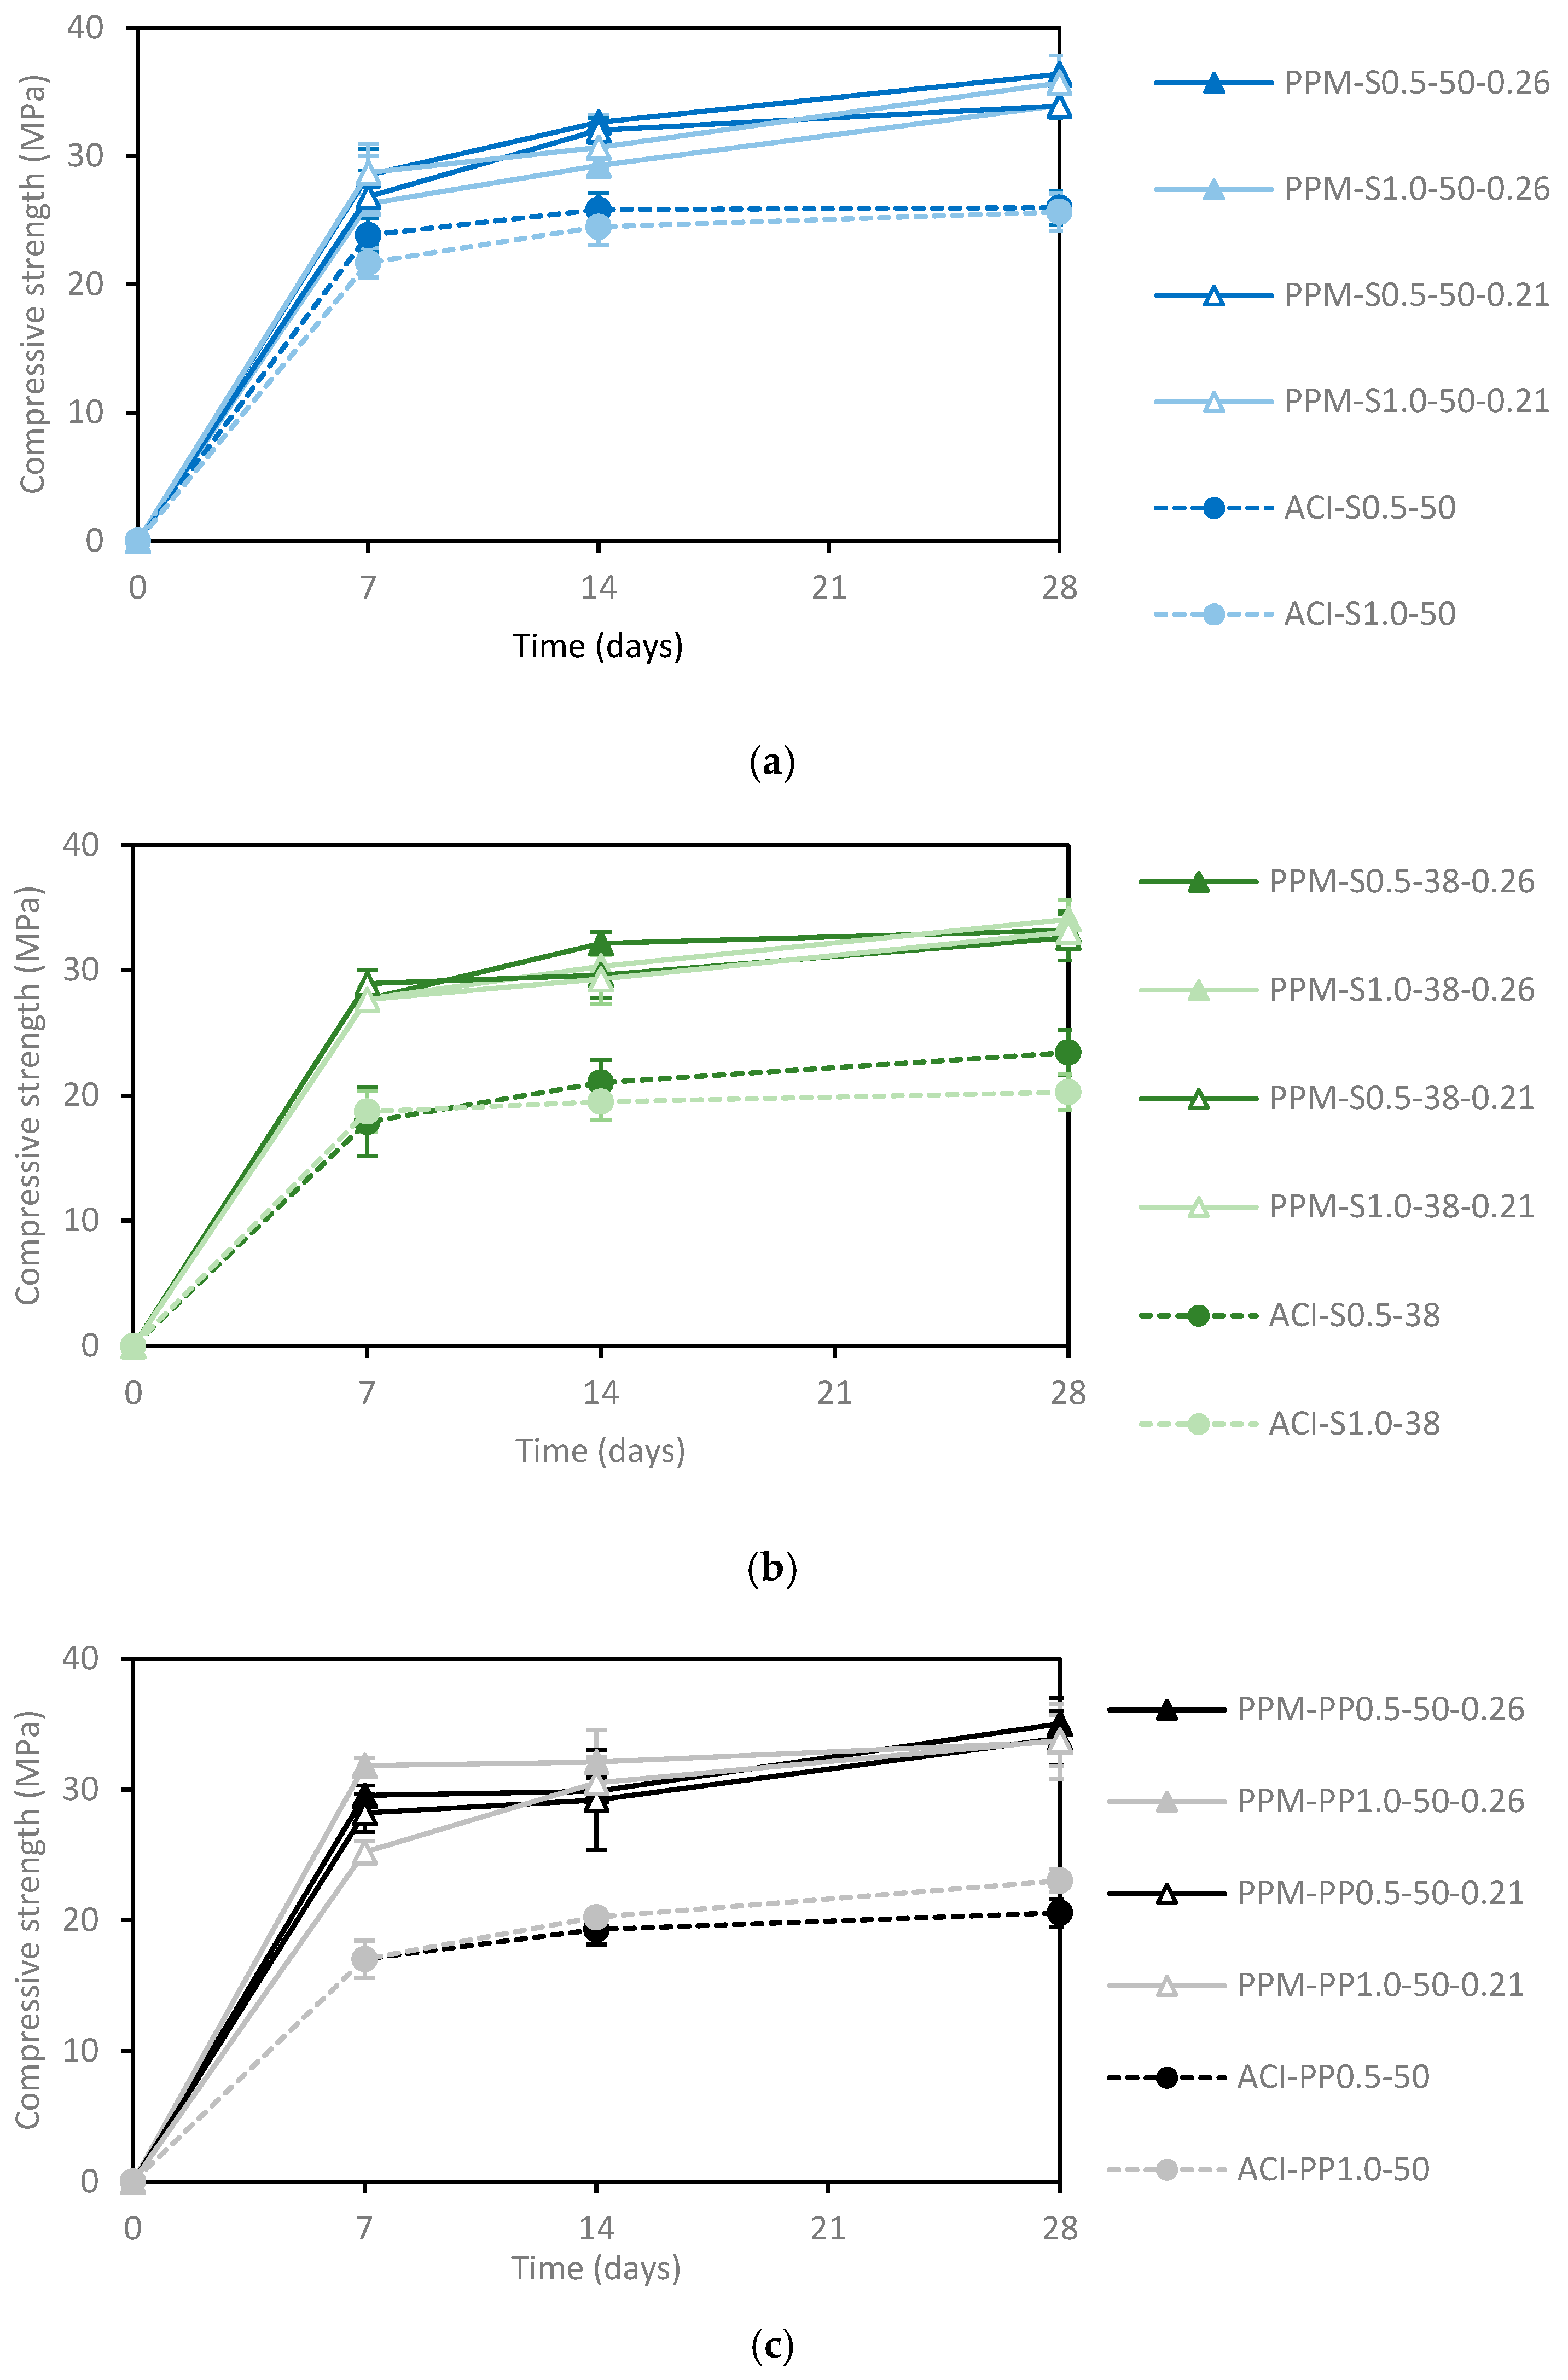
5.3.1. Compressive Strength
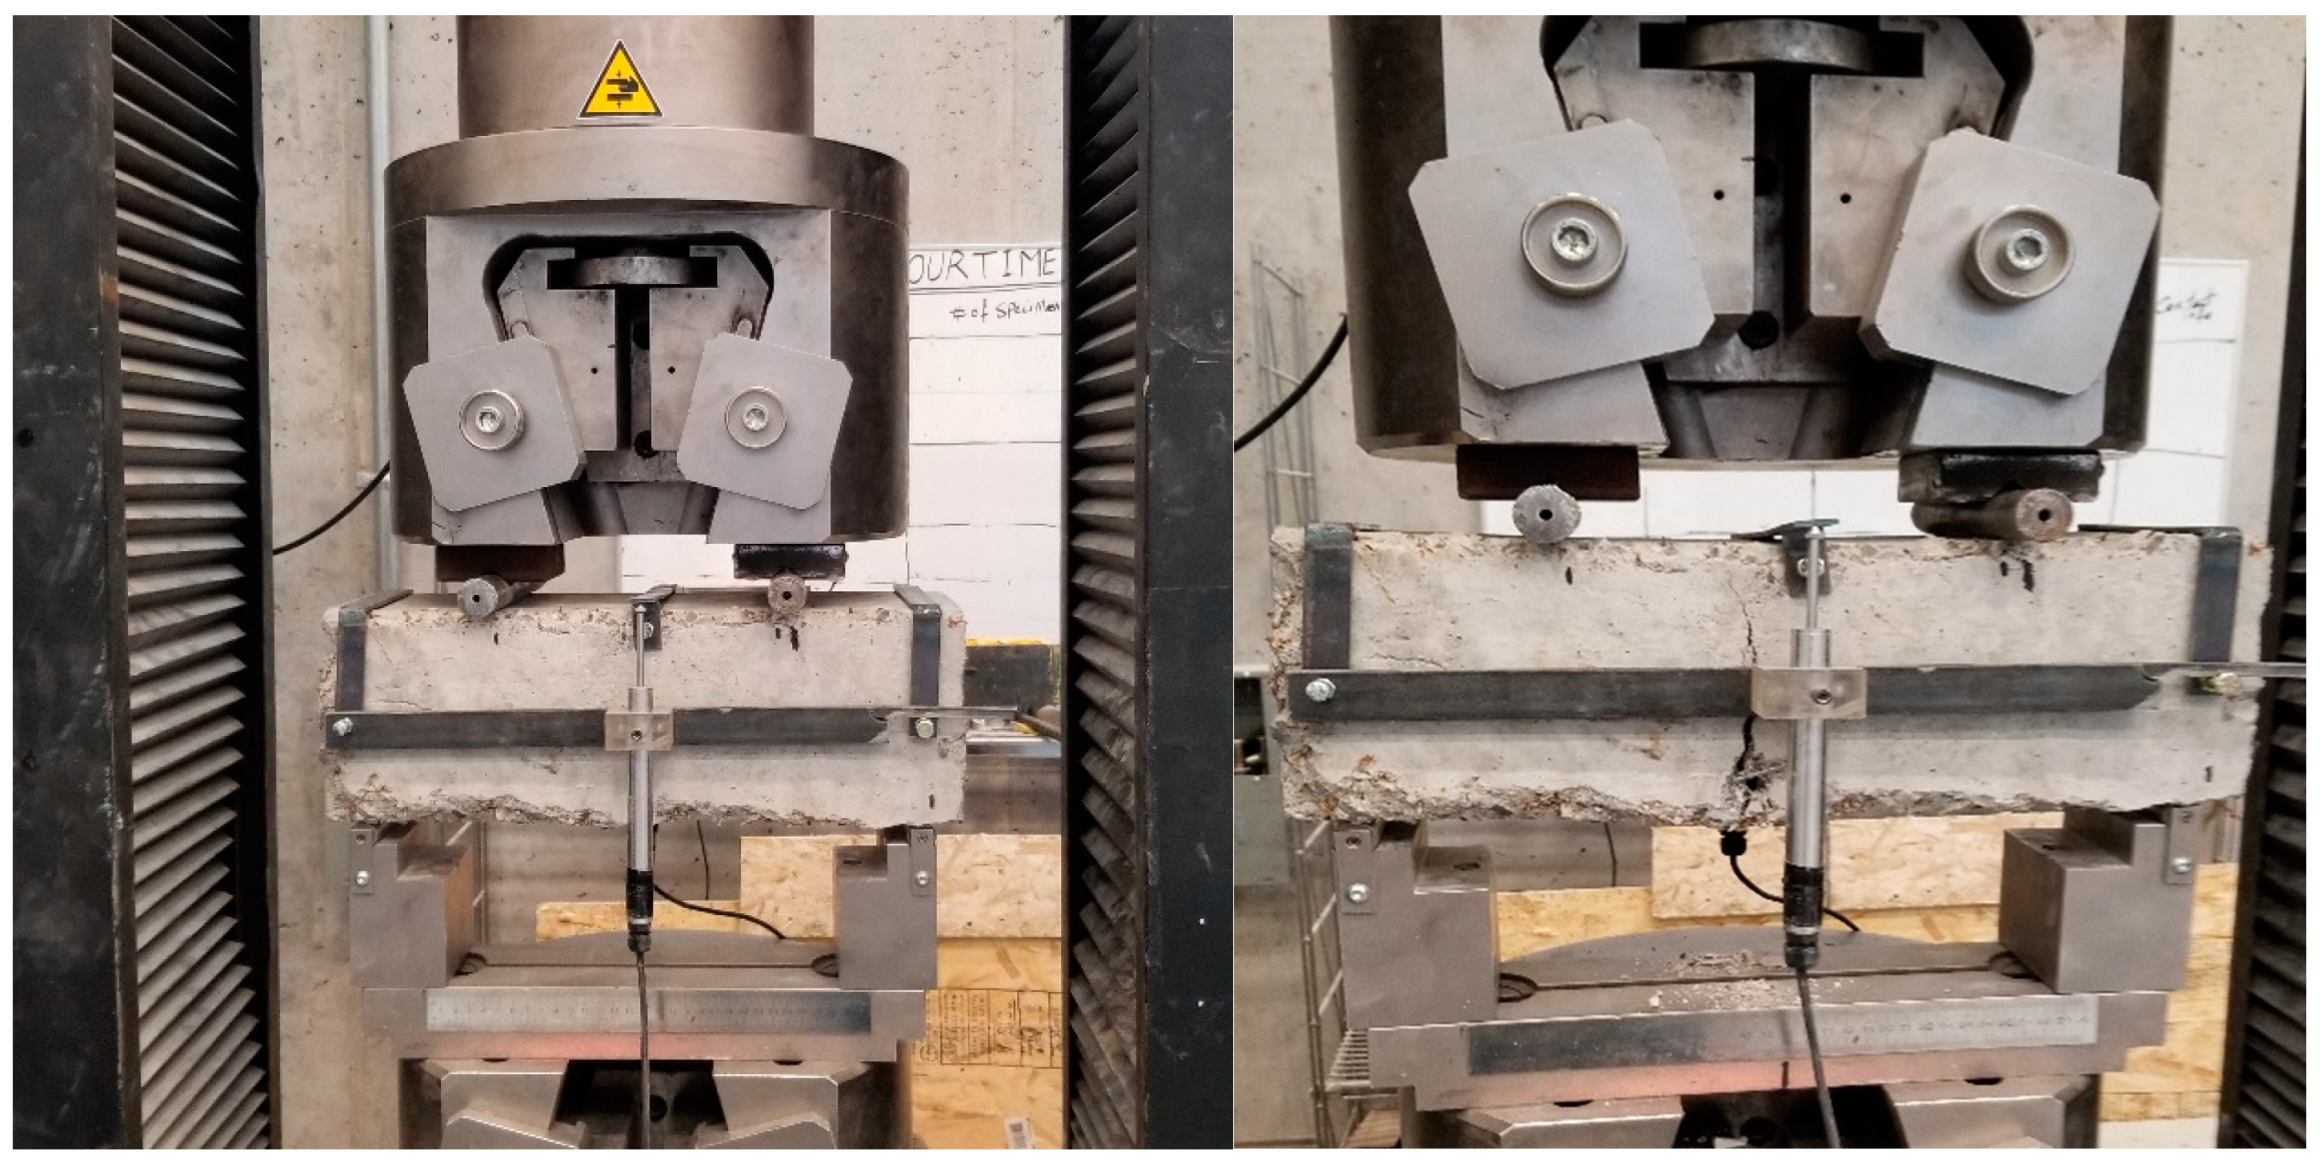
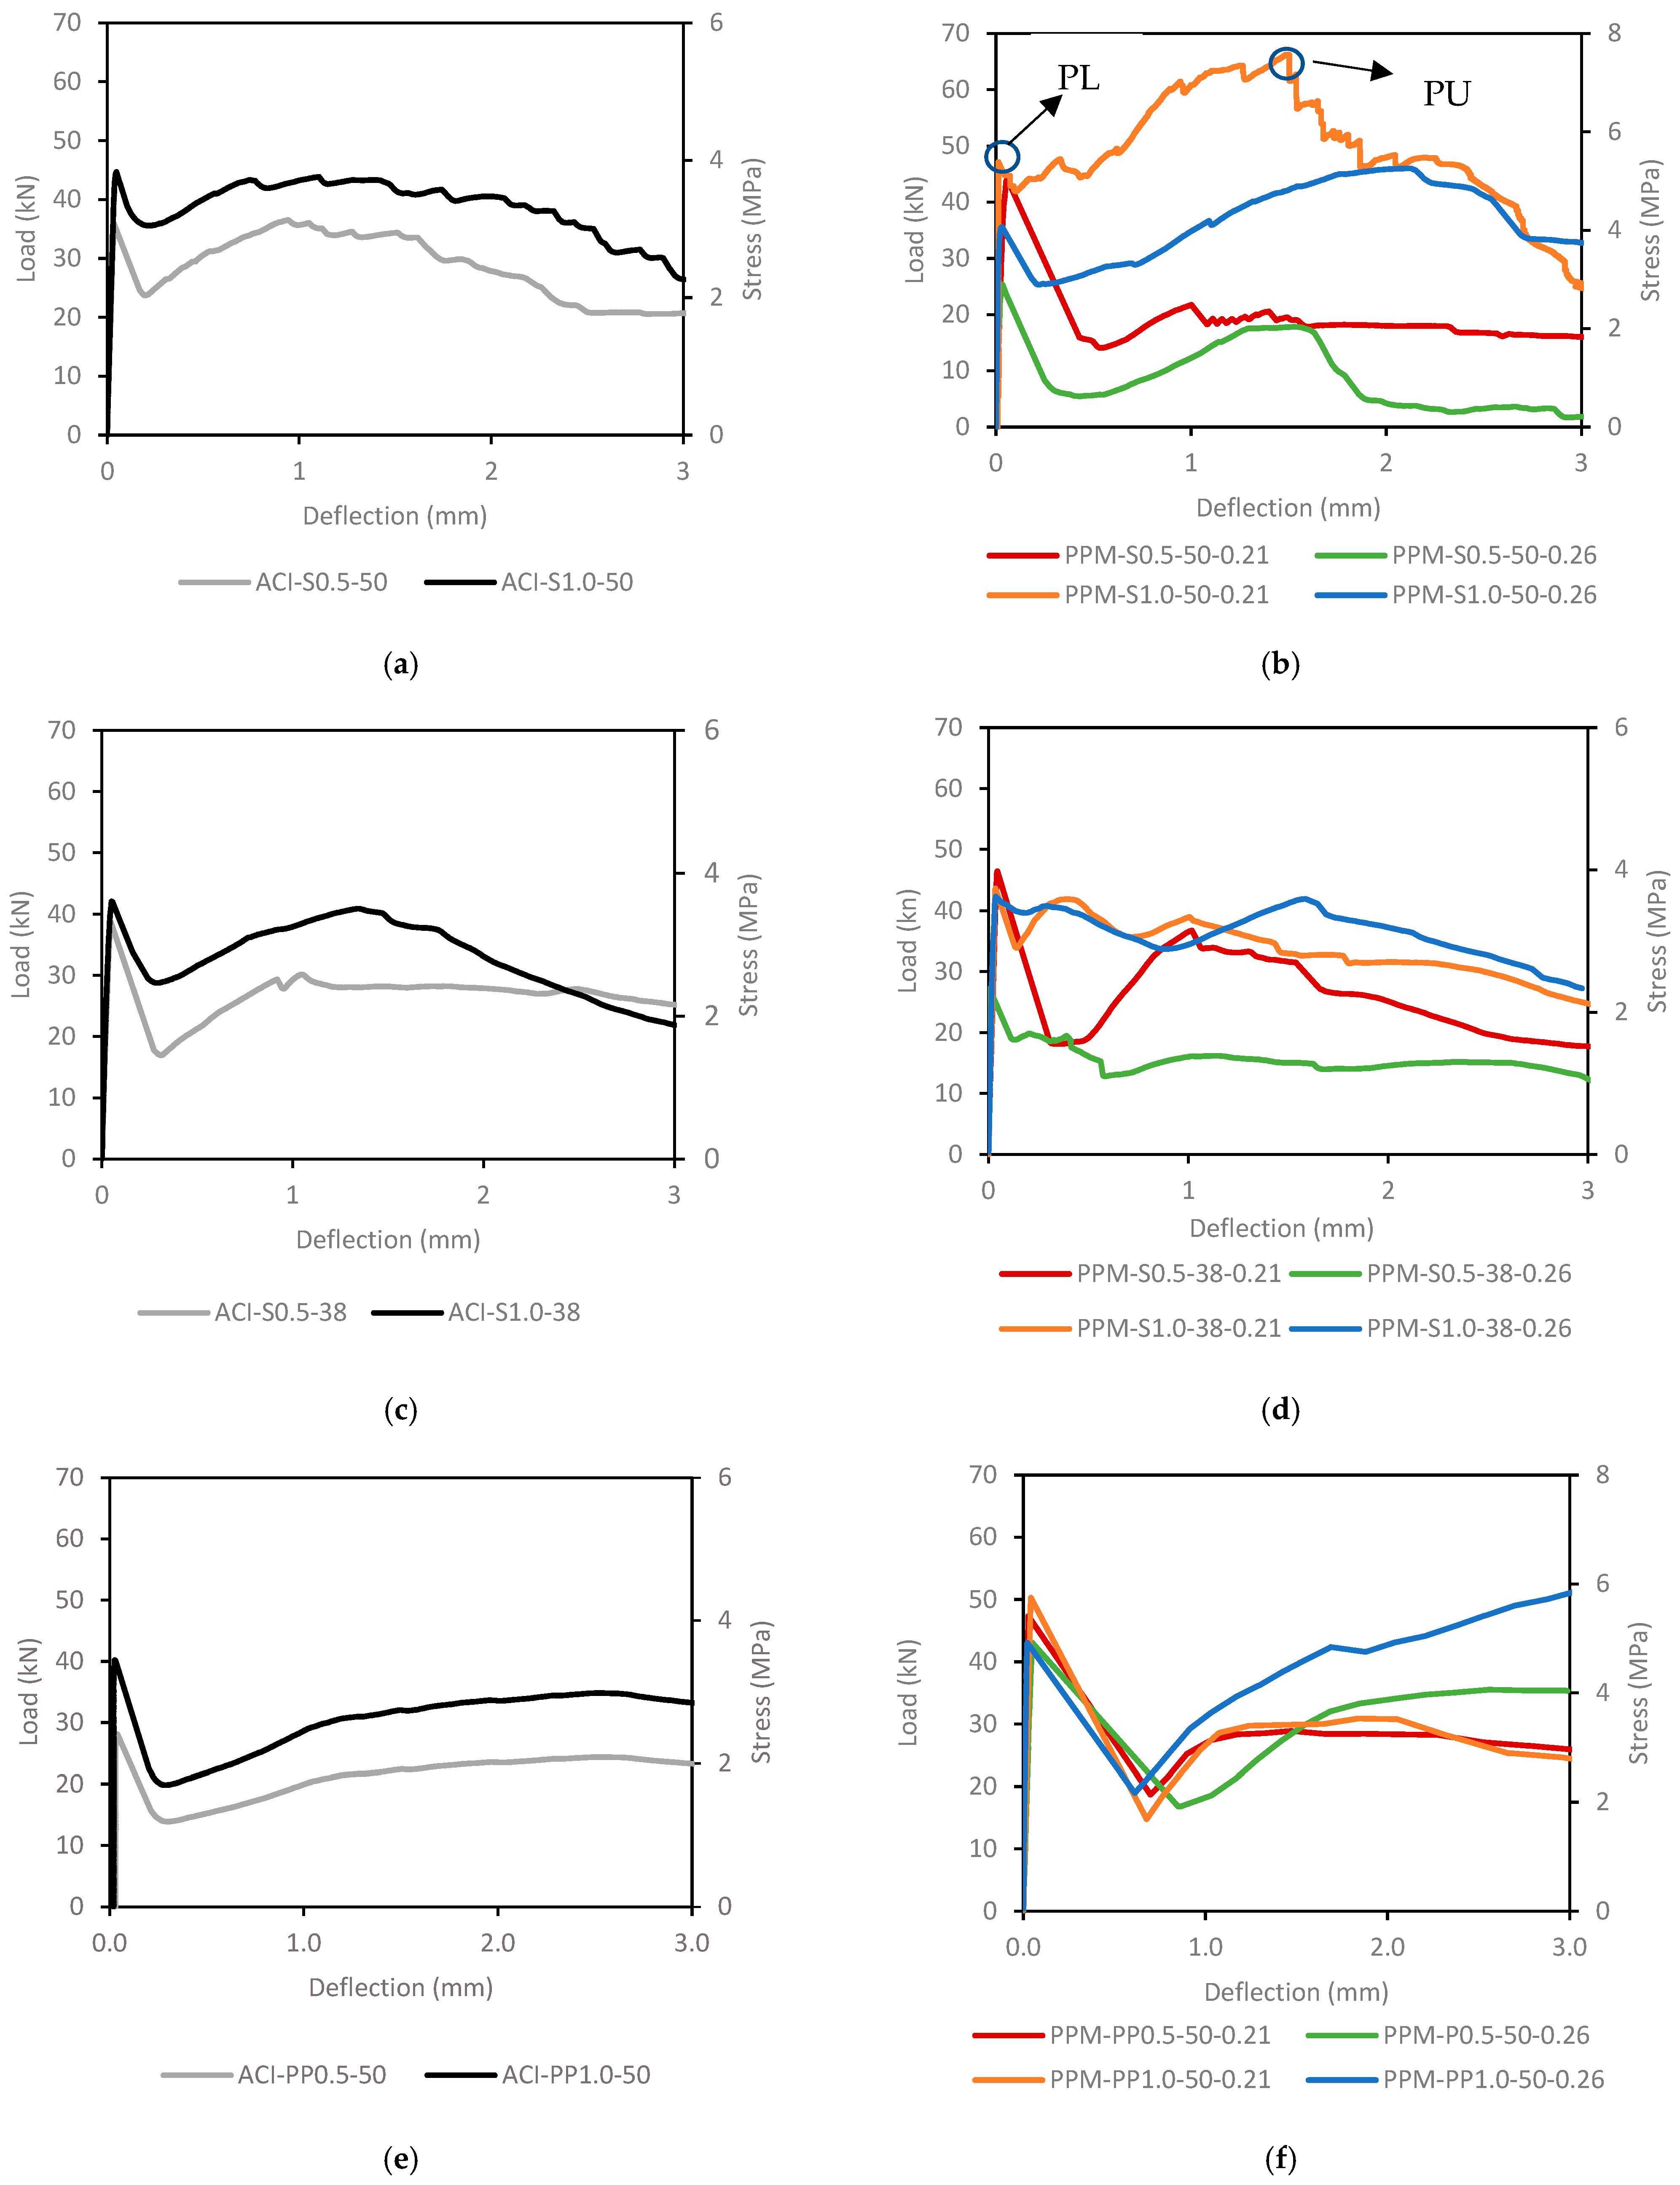
5.3.2. Flexural Analysis
6. Discussion
6.1. Fresh State Performance
6.2. Fresh State Modeling
6.3. Hardened State Performance
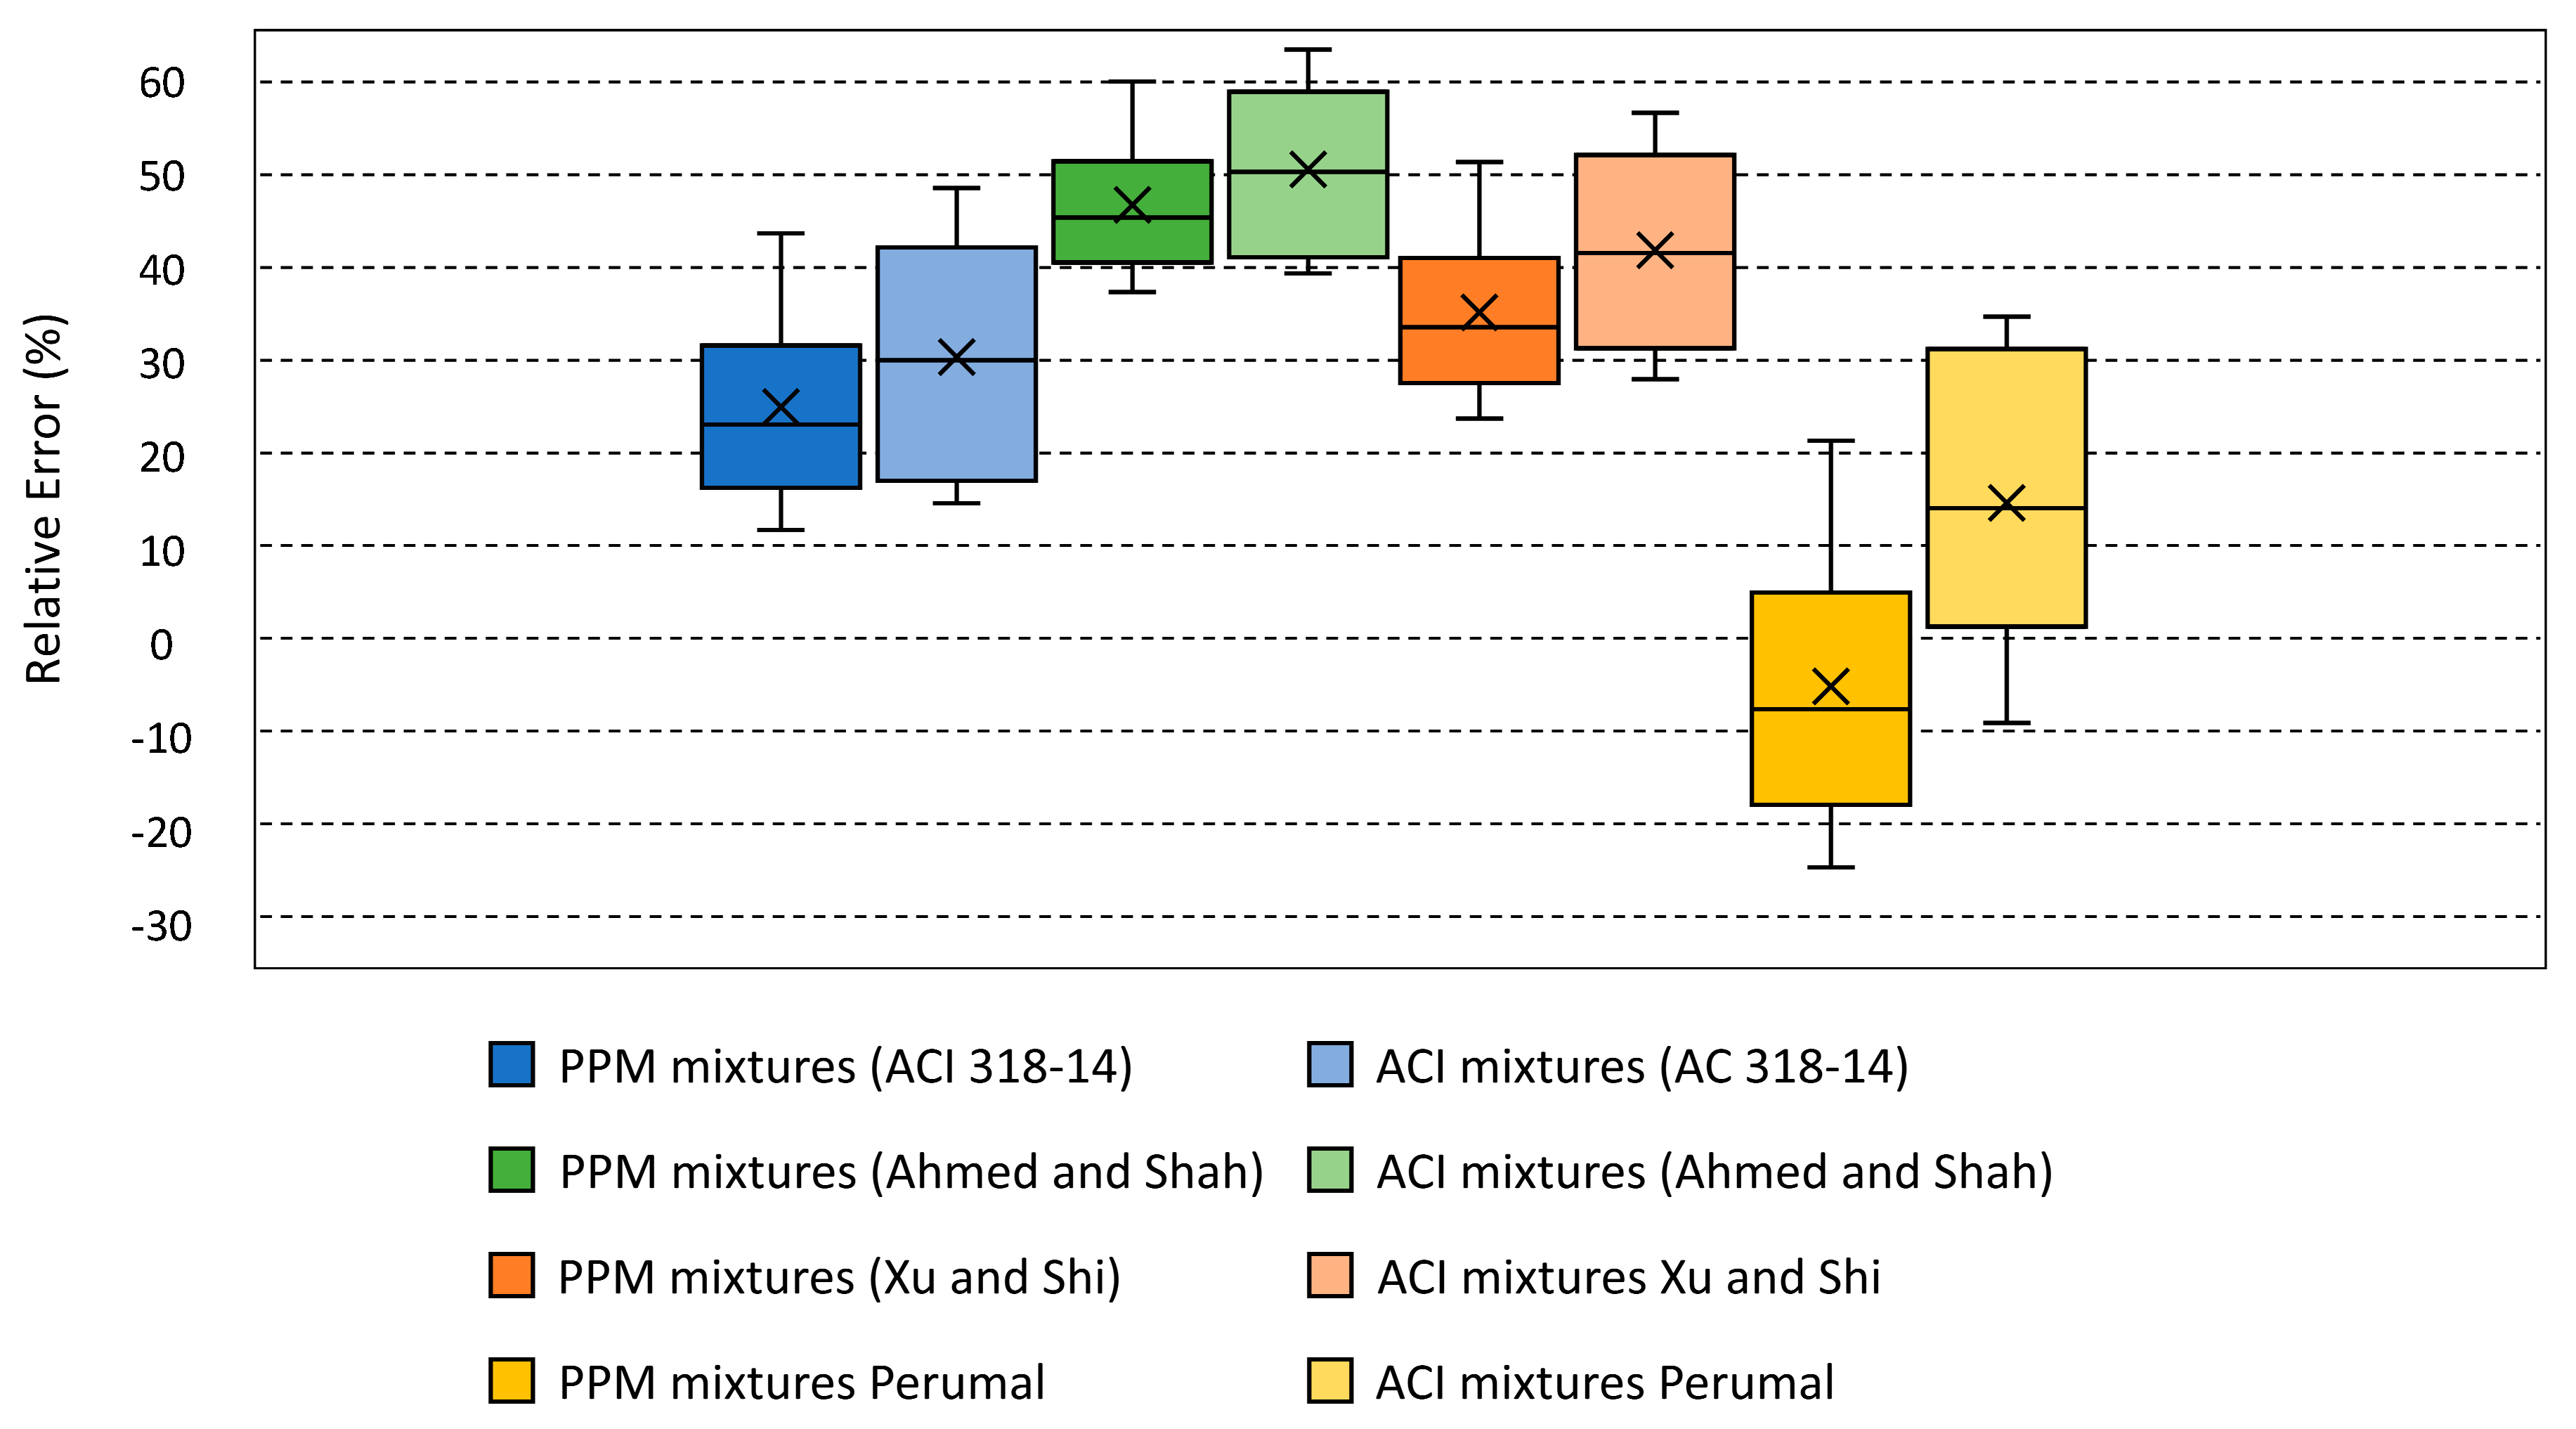
6.4. Quantification of Efficiency Indexes in Concrete
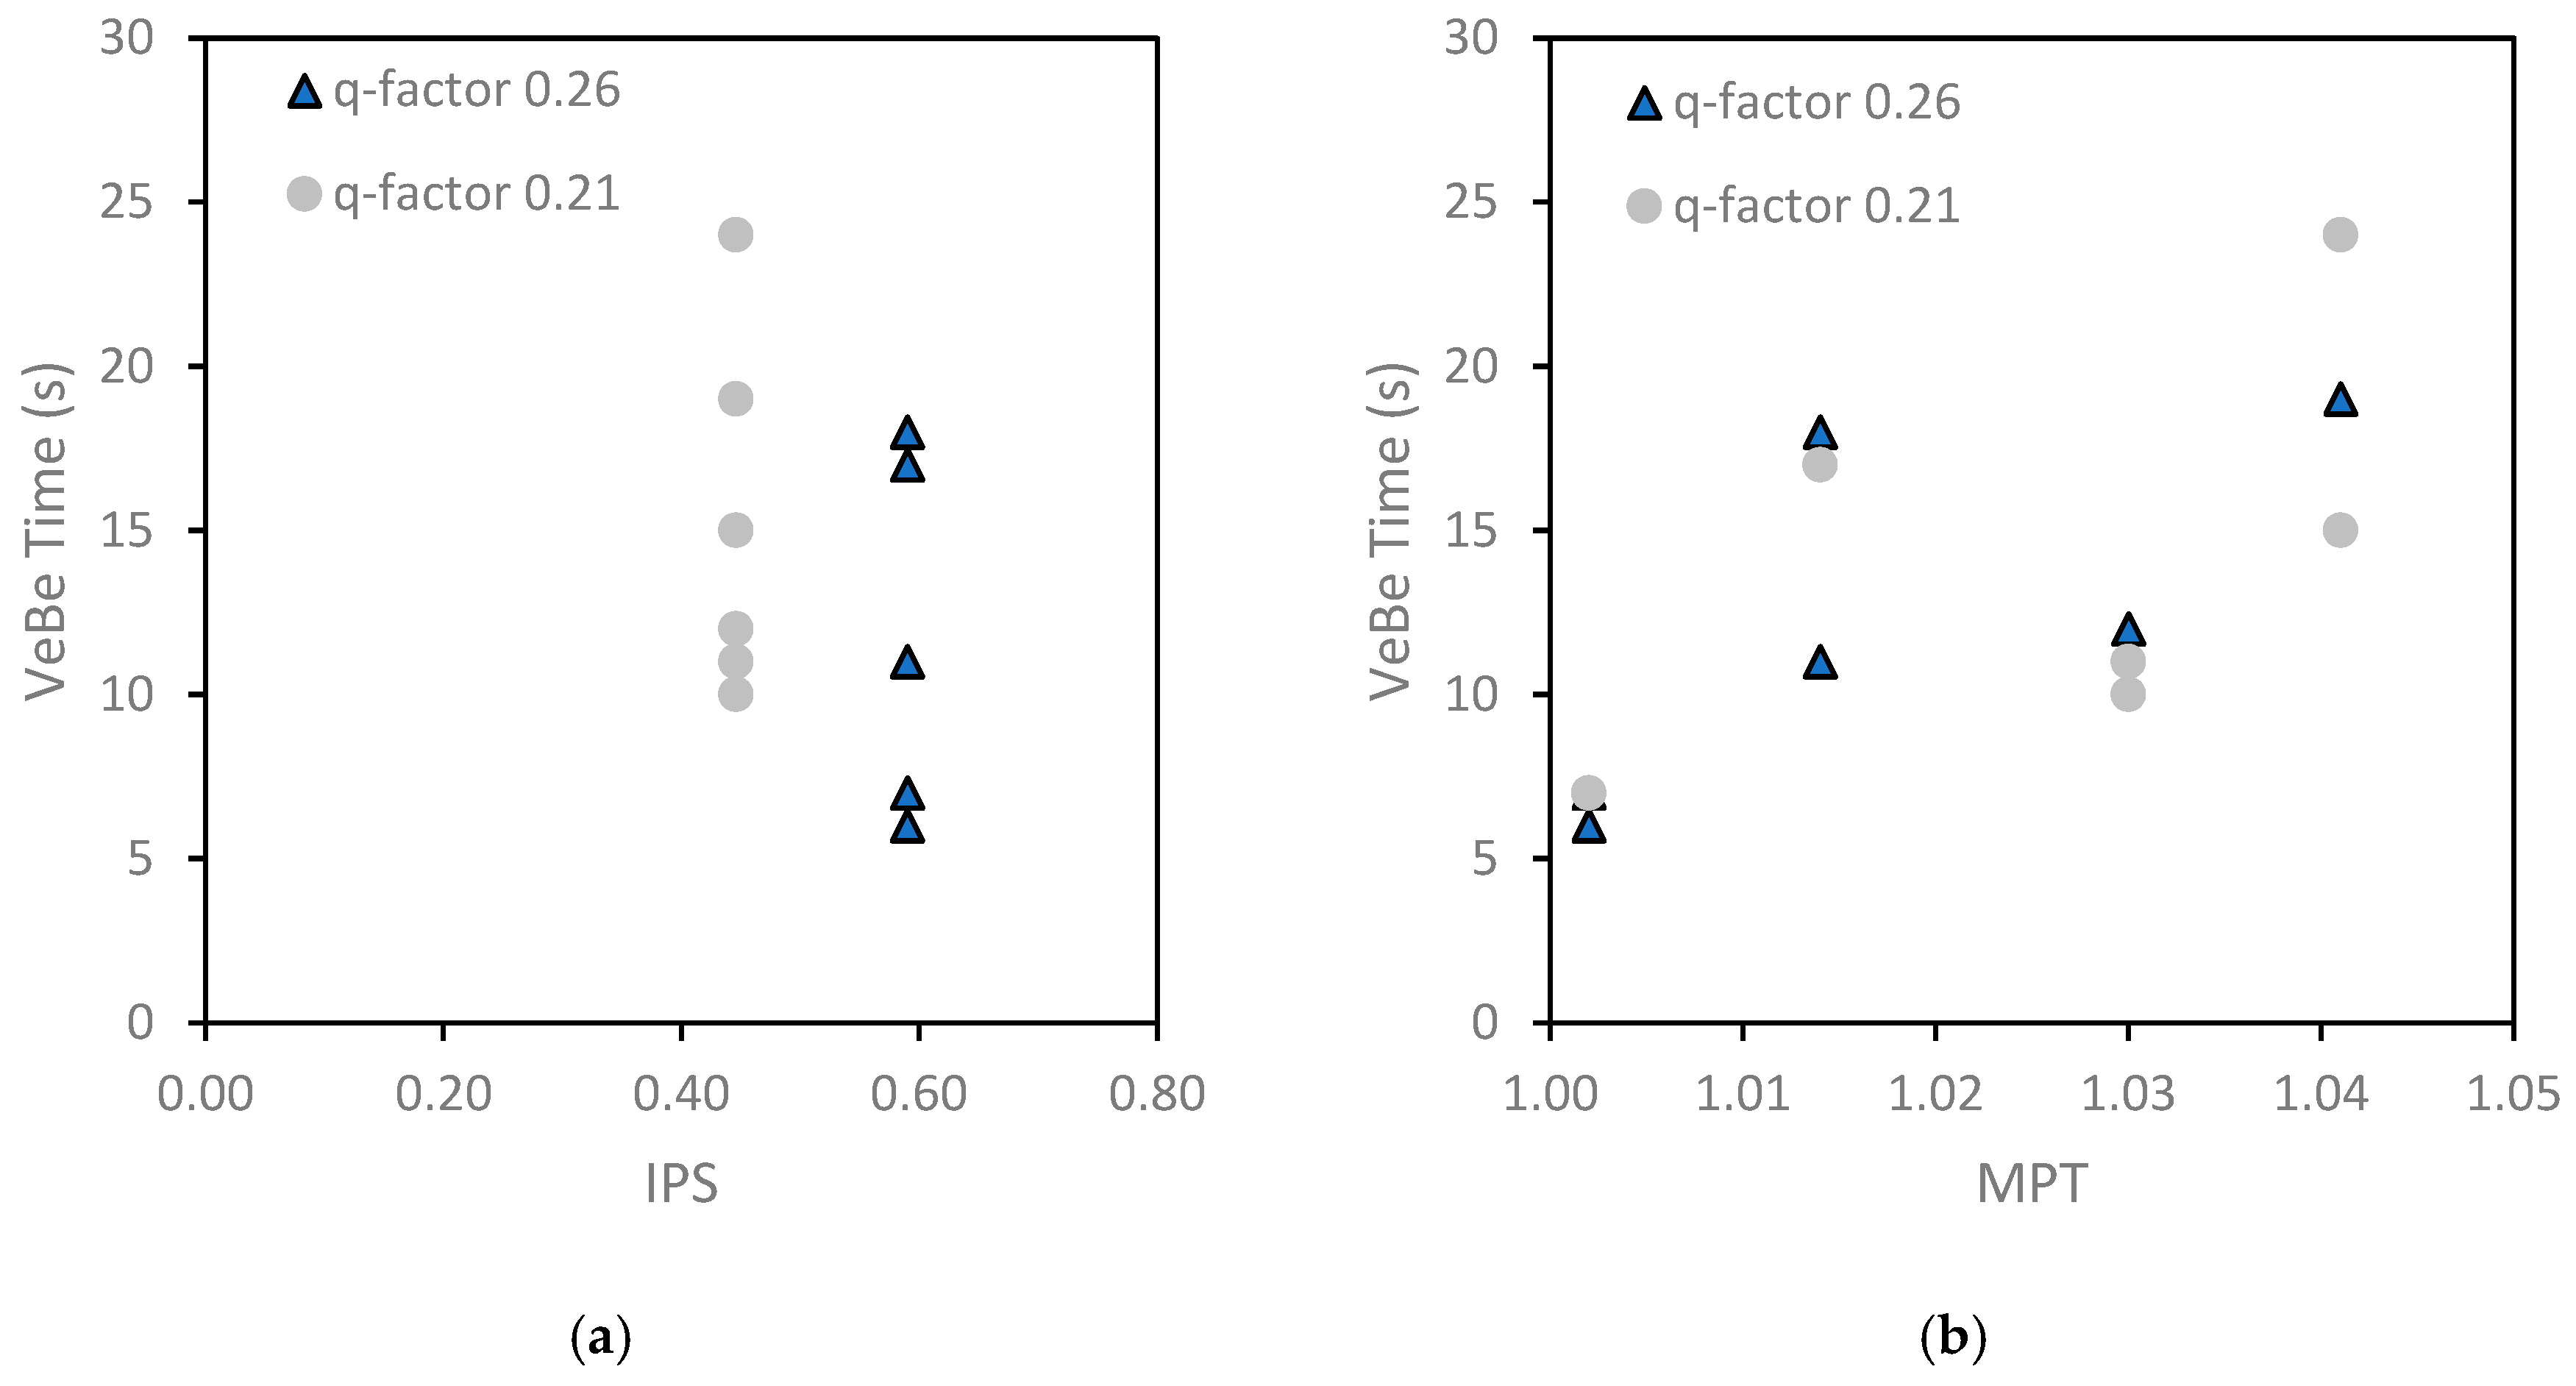
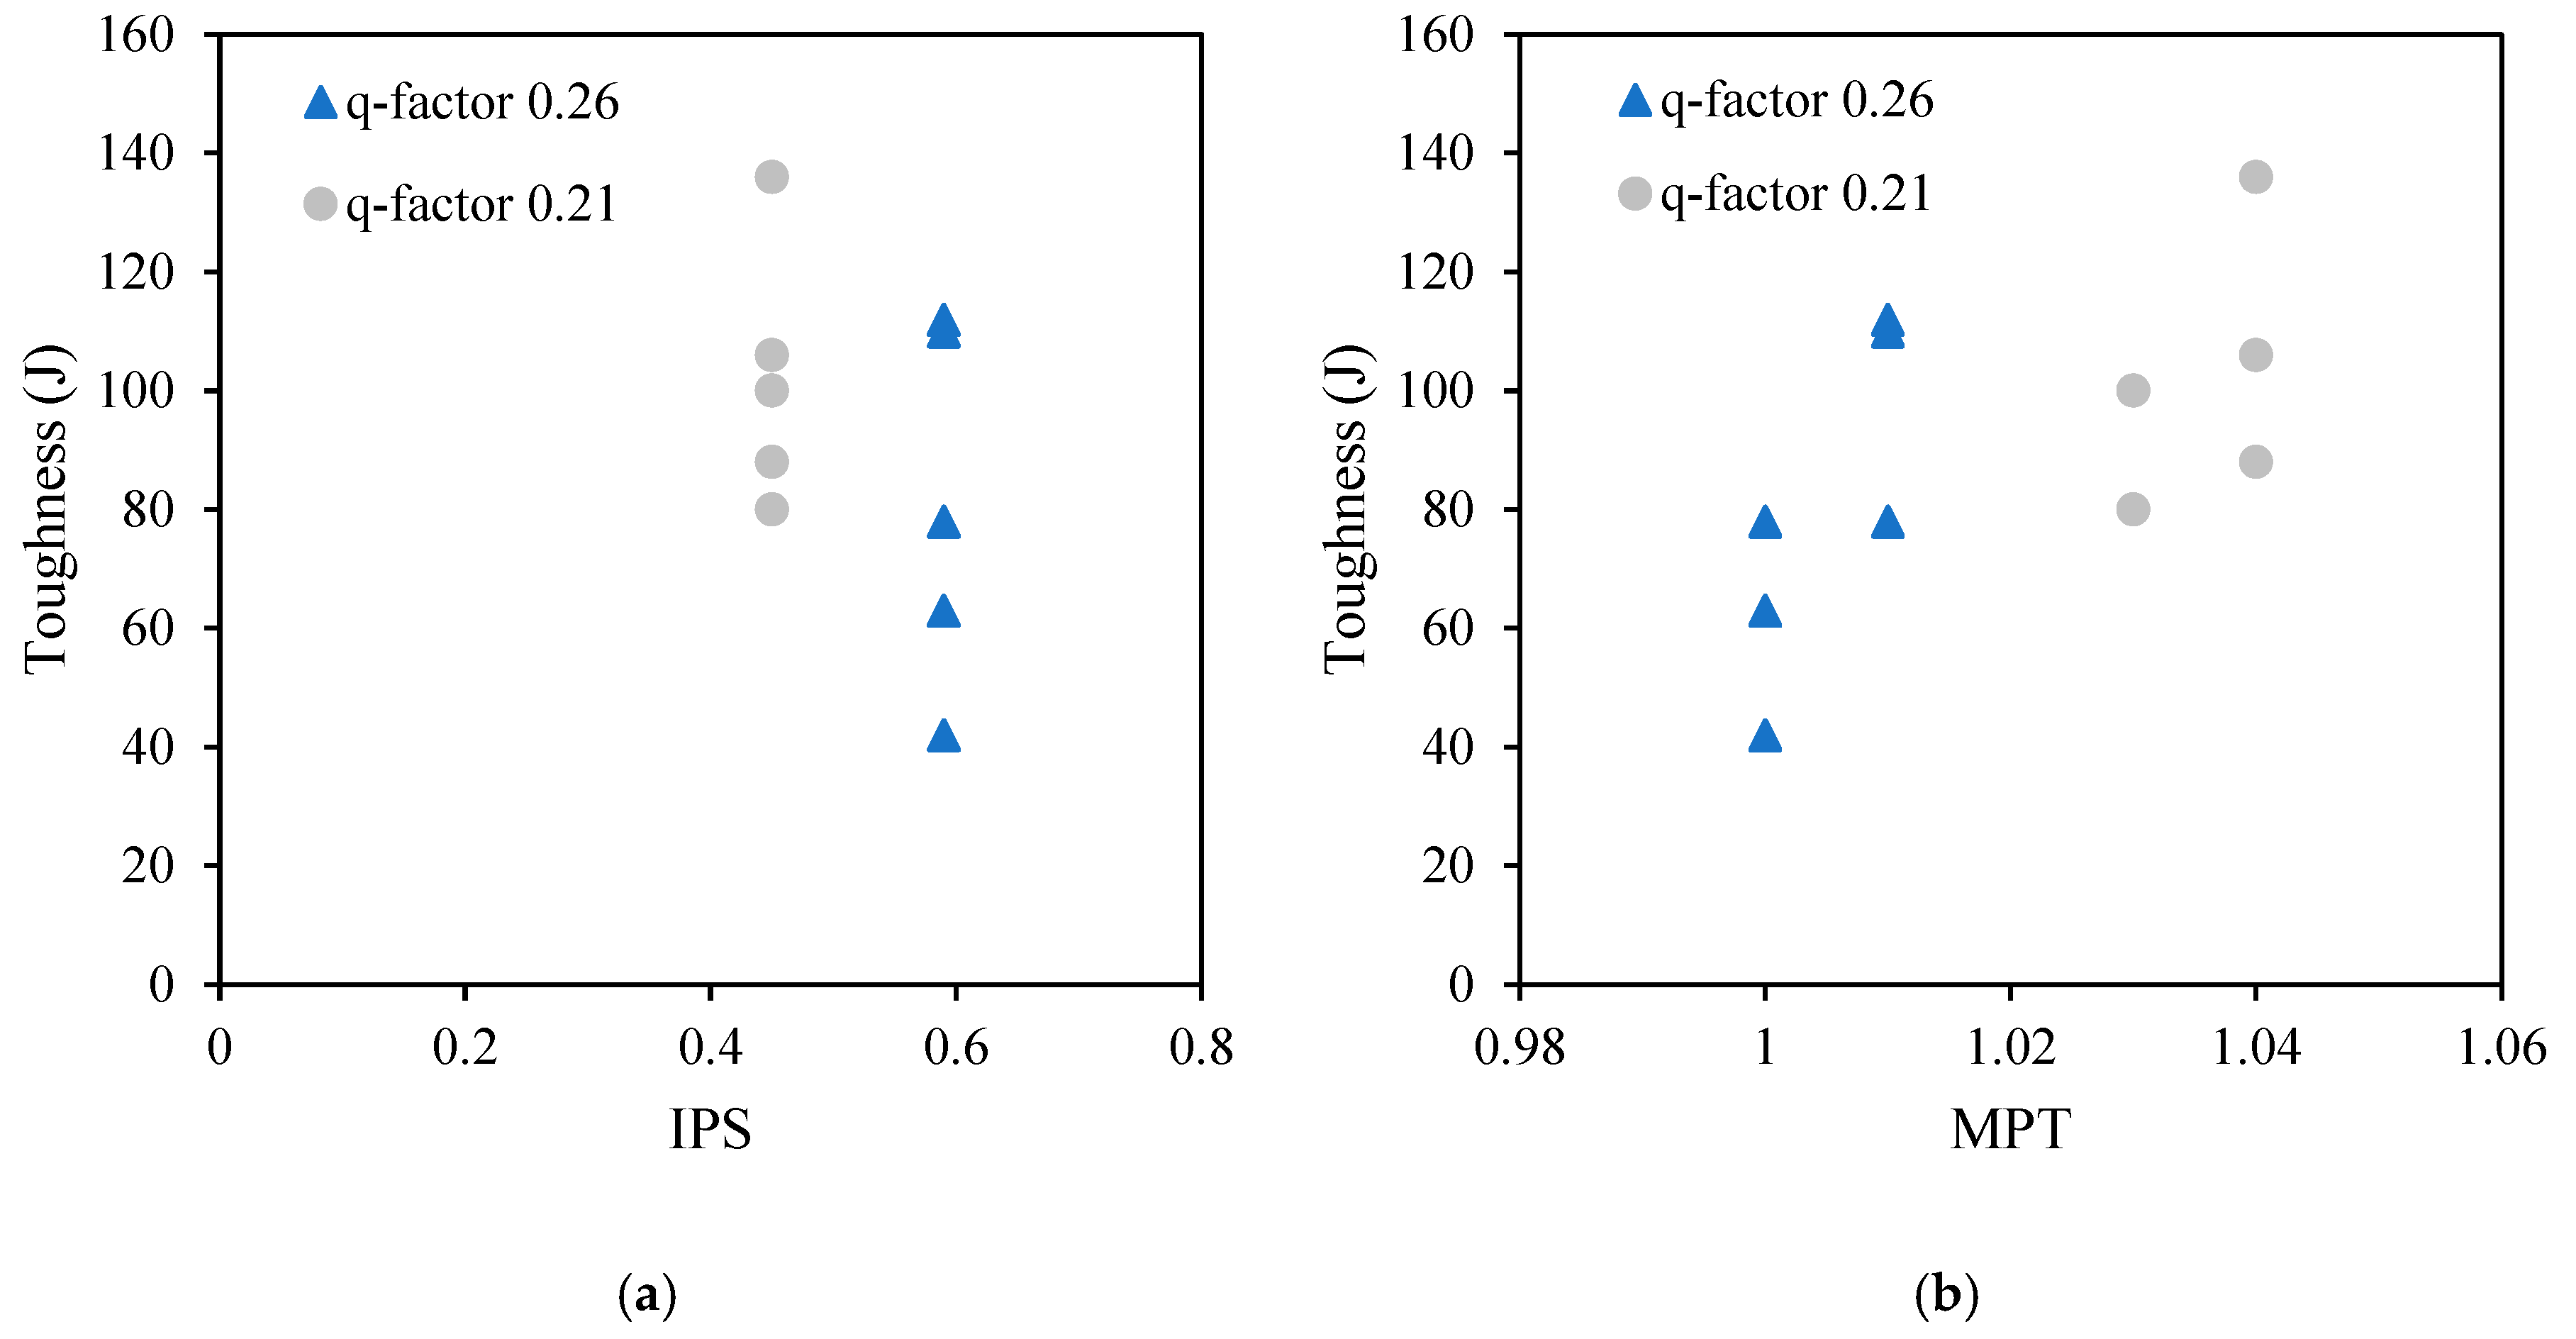
6.4.1. Mobility Parameters
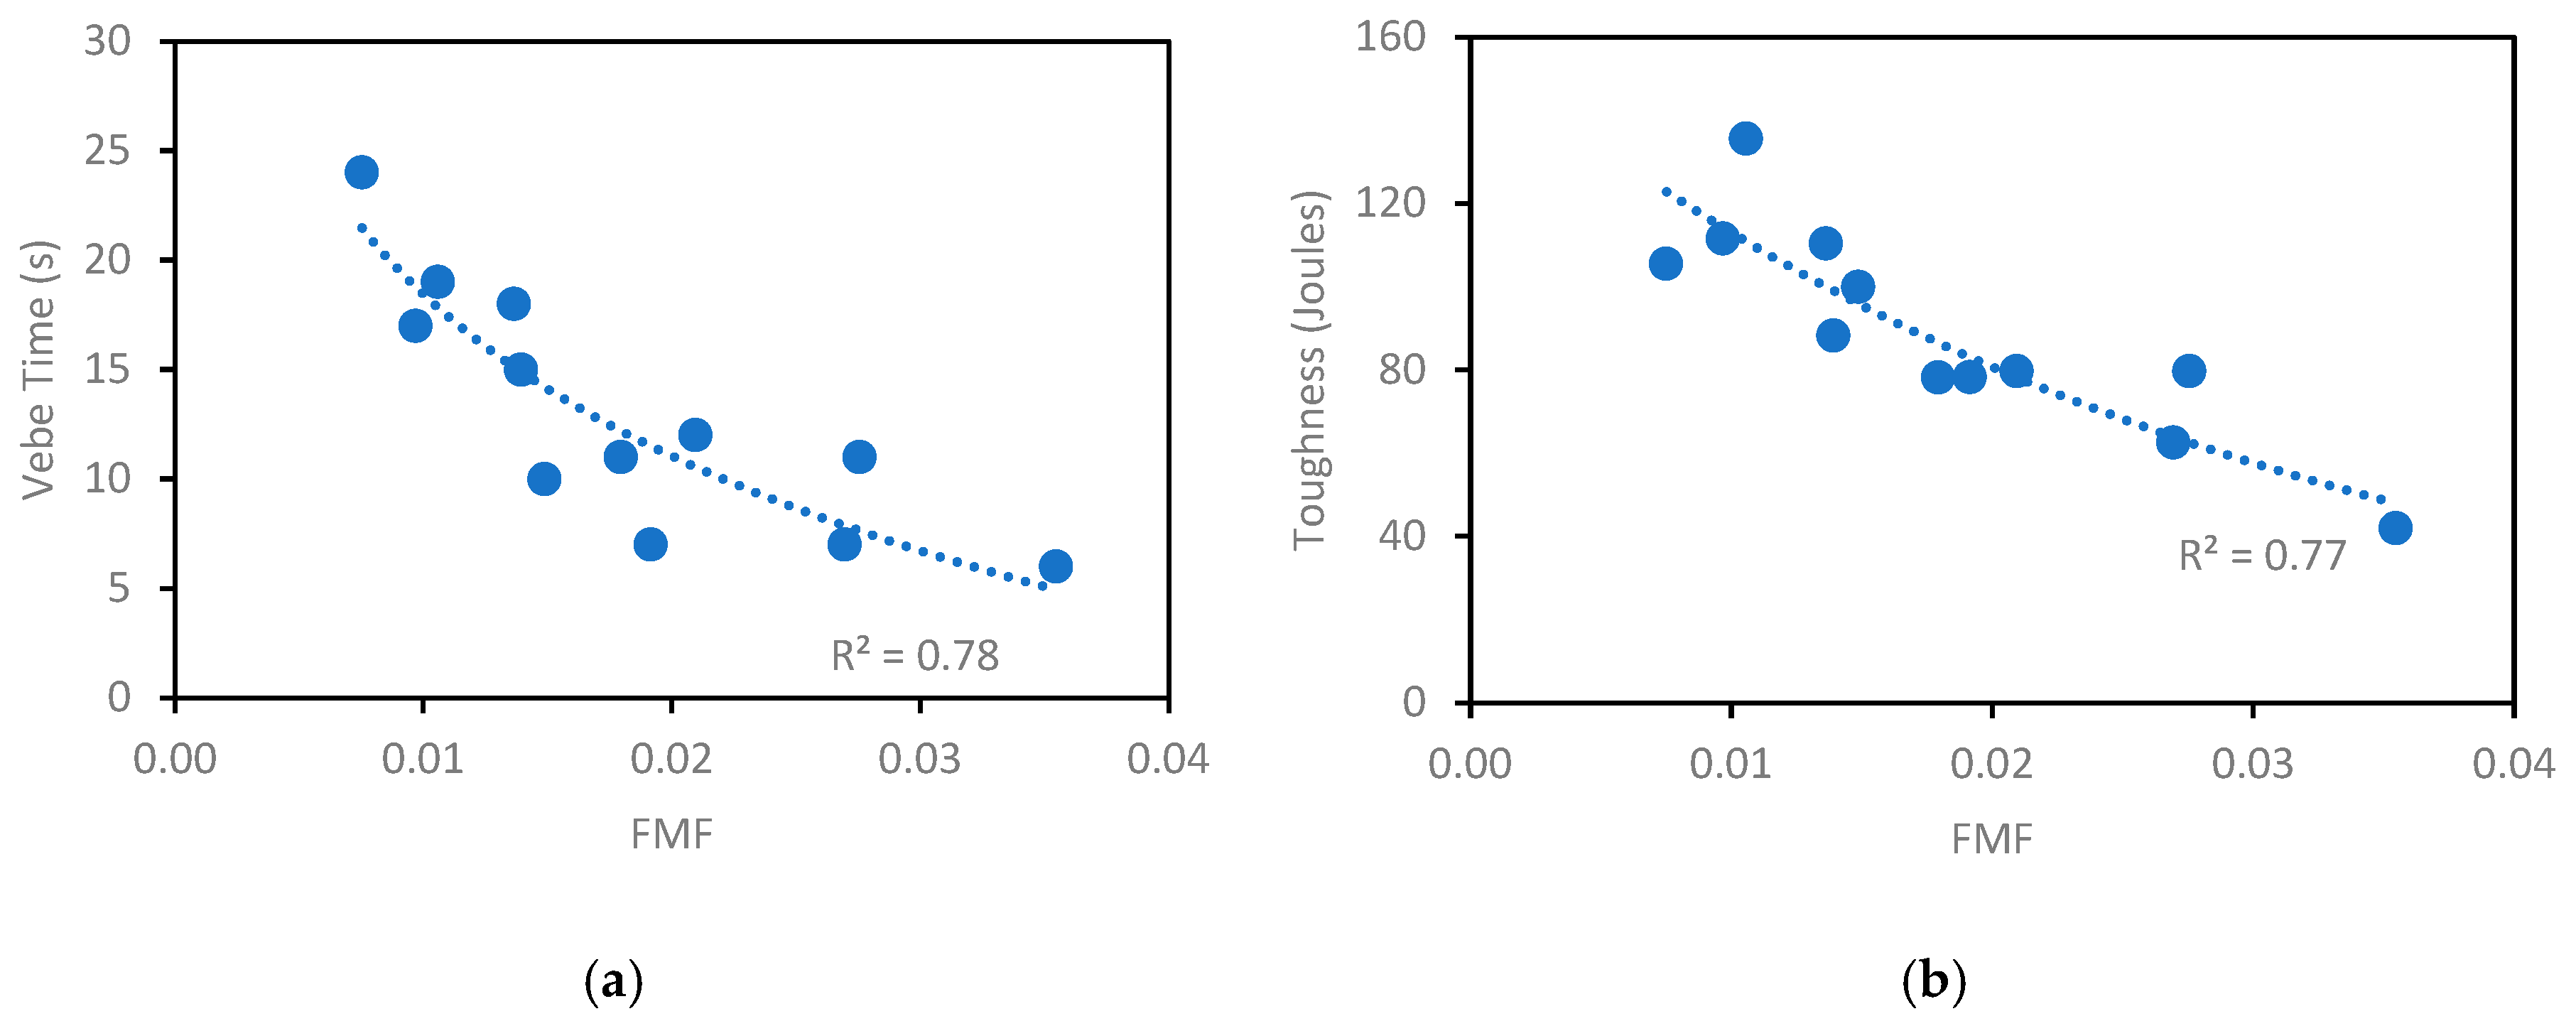
6.4.2. Efficiency Factor of FRC
6.5. Eco-Efficiency of FRC Mixtures
7. Conclusions
- PPM-designed FRC achieved up to 70% higher compressive strength and up to 64% superior flexural properties compared to ACI-designed mixtures, despite maintaining the same water-to-cement ratio.
- PPM mixtures exhibited higher VeBe times and minimum torque values, reflecting increased resistance to flow due to enhanced packing density and interaction between fibers, aggregates, and fines. However, their shear-thinning behavior indicate their suitability for target ranges of yield stress and plastic viscosity (i.e., pumped or vibrated concrete).
- PP fibers improved toughness and residual stress compared to S fibers in PPM mixtures, attributed to their higher aspect ratio and better dispersion. Increased fiber content further enhanced crack resistance, particularly in mixtures with higher inert filler (LF) content (q-factor 0.21).
- An improved fiber matrix factor (FMF) was developed, integrating mobility parameters such as interparticle separation distance (IPS) and maximum paste thickness (MPT), to better predict and control the behavior of PPM-mix-proportioned FRC.
- PPM-designed mixtures achieved lower binder intensity (bi) factors than ACI mixtures, aligning with sustainability goals while maintaining mechanical performance.
Author Contributions
Funding
Institutional Review Board Statement
Informed Consent Statement
Data Availability Statement
Conflicts of Interest
Abbreviations
| ACI | American Concrete Institute |
| AV | Apparent viscosity |
| BC | Binder content |
| bi | Binder intensity factor |
| CA | Coarse aggregate |
| CPFT | Cumulative percentage finer than |
| CSA | Canadian Standards Association |
| df | Fiber diameter |
| Dmax | Maximum particle size |
| FA | Fine aggregate |
| FRC | Fiber-reinforced concrete |
| FF | Fiber factor |
| FMF | Fiber matrix factor |
| GU | General use |
| HB | Herschel–Bulkley |
| IPS | Interparticle separation distance |
| Lf | Fiber length |
| LF | Limestone filler |
| LCC | Low-cement concrete |
| MOR | Modulus of rupture |
| MPT | Maximum paste thickness |
| PC | Portland cement |
| PP | Polypropylene |
| PPM | Particle packing models |
| PSD | Particle size distribution |
| q-factor | Coefficient of distribution |
| RH | Relative humidity |
| SCMs | Supplementary cementitious materials |
| SP | Superplasticizer |
| VeBe | Vibrating table test time |
| Vf | Volumetric fiber fraction |
| VSA | Volumetric surface area |
| w/c | Water-to-cement ratio |
| XRF | X-ray fluorescence |
References
- Yu, R.; Song, Q.; Wang, X.; Zhang, Z.; Shui, Z.; Brouwers, H.J.H. Sustainable development of Ultra-High Performance Fibre Reinforced Concrete (UHPFRC): Towards to an optimized concrete matrix and efficient fibre application. J. Clean. Prod. 2017, 162, 220–233. [Google Scholar] [CrossRef]
- Andrew, R.M. Global CO2 emissions from cement production. Earth Syst. Sci. Data Discuss. 2018, 10, 195–217. [Google Scholar] [CrossRef]
- De Grazia, M.T.; Sanchez, L.F.M.; Romano, R.C.O.; Pileggi, R.G. Investigation of the use of continuous particle packing models (PPMs) on the fresh and hardened properties of low-cement concrete (LCC) systems. Constr. Build. Mater. 2019, 195, 524–536. [Google Scholar] [CrossRef]
- Mohammadi, A.; Ramezanianpour, A.M. Investigating the environmental and economic impacts of using supplementary cementitious materials (SCMs) using the life cycle approach. J. Build. Eng. 2023, 79, 107934. [Google Scholar] [CrossRef]
- De Souza, D.J.; Sanchez, L.F.M. Evaluating the efficiency of SCMs to avoid or mitigate ASR-induced expansion and deterioration through a multi-level assessment. Cem. Concr. Res. 2023, 173, 107262. [Google Scholar] [CrossRef]
- Dadsetan, S.; De Grazia, M.T.; Sanchez, L. The use of low cement structural concrete as a sustainable alternative for civil industry. In Proceedings of the 10th ACI/RILEM International Conference on Cementitious Materials and Alternative Binders for Sustainable Concrete, Montreal, ON, Canada, 2–4 October 2017. [Google Scholar]
- Damineli, B.L.; John, V.M.; Lagerblad, B.; Pileggi, R.G. Viscosity prediction of cement-filler suspensions using interference model: A route for binder efficiency enhancement. Cem. Concr. Res. 2016, 84, 8–19. [Google Scholar] [CrossRef]
- Varhen, C.; Dilonardo, I.; Romano, C.; Pileggi, R.G.; Figueiredo, A. Effect of the substitution of cement by limestone filler on the rheological behaviour and shrinkage of microconcretes. Constr. Build. Mater. 2016, 125, 375–386. [Google Scholar] [CrossRef]
- Bergmann, A.C.; De Grazia, M.T.; Dantas, S.R.A.; Asirvatham, D.; Lozano, G.A.R.; Sanchez, L.F.M.; Perez, Y.A.; Sherwood, E.G. Influence of Interparticle Separation Distance on the Fresh and Hardened Behavior of Ecoefficient Cement Pastes. J. Mater. Civ. Eng. 2023, 35, 04023252. [Google Scholar] [CrossRef]
- Neville, A.M.M.; Brooks, J.J.J. Concrete Technology, 2nd ed.; Harlow: England, UK, 2010. [Google Scholar] [CrossRef]
- Kuder, K.G.; Ozyurt, N.; Mu, E.B.; Shah, S.P. Rheology of fiber-reinforced cementitious materials. Cem. Concr. Res. 2007, 37, 191–199. [Google Scholar] [CrossRef]
- Naaman, A.E. Engineered Steel Fibers with Optimal Properties for Reinforcement of Cement Composites. J. Adv. Concr. Technol. 2003, 1, 241–252. [Google Scholar] [CrossRef]
- Yazici, Ş.; Inan, G.; Tabak, V. Effect of aspect ratio and volume fraction of steel fiber on the mechanical properties of SFRC. Constr. Build. Mater. 2007, 21, 1250–1253. [Google Scholar] [CrossRef]
- Grünewald, S. Fibre Reinforcement and the Rheology of Concrete; Woodhead Publishing Limited: Cambridge, UK, 2011. [Google Scholar]
- Labib, W.A. Fibre Reinforced Cement Composites. In Cement Based Materials; IntechOpen: London, UK, 2018. [Google Scholar] [CrossRef]
- Bentur, A.; Sidney, M. Fibre Reinforced Cementitious Composites, 2nd ed.; Taylor & Francis Group: New York, NY, USA, 2007. [Google Scholar] [CrossRef]
- Yu, R.; Spiesz, P.; Brouwers, H.J.H. Development of an eco-friendly Ultra-High Performance Concrete (UHPC) with efficient cement and mineral admixtures uses. Cem. Concr. Compos. 2015, 55, 383–394. [Google Scholar] [CrossRef]
- Mangulkar, M.; Jamkar, S. Review of Particle Packing Theories Used For Concrete Mix Proportioning. Int. J. Sci. Eng. Res. 2013, 4, 143–148. [Google Scholar]
- Yousuf, S.; Sanchez, L.F.M.; Shammeh, S.A. The use of particle packing models (PPMs) to design structural low cement concrete as an alternative for construction industry. J. Build. Eng. 2019, 25, 100815. [Google Scholar] [CrossRef]
- Fuller, W.B.; Thompson, S.E. The Laws of Proportioning Concrete. Am. Soc. Civ. Eng. 1907, 33, 223–298. [Google Scholar] [CrossRef]
- Vogt, C. Influence of Ultrafine Particles on Concrete Properties and Application to Concrete Mix Design; Kassel University Press: Kassel, Germany, 2010. [Google Scholar]
- Andreasen, A.H.M. Ueber die Beziehung zwischen Kornabstufung und Zwischenraum in Produkten aus losen Körnern (mit einigen Experimenten). Colloid Polim. Sci. 1930, 50, 217–228. [Google Scholar] [CrossRef]
- Ali, Z.S.; Hosseinpoor, M.; Yahia, A. New aggregate grading models for low-binder self-consolidating and semi-self-consolidating concrete (Eco-SCC and Eco-semi-SCC). Constr. Build. Mater. 2020, 265, 120314. [Google Scholar] [CrossRef]
- Funk, J.E.; Dinger, D.R. Predictive Process Control of Crowded Particulate Suspensions; Kluwer Academic Publishers: Boston, MA, USA, 1994. [Google Scholar] [CrossRef]
- Banthia, N. Fiber reinforced concrete for sustainable and intelligent infra structure. In Proceedings of the 1st International Conference on Sustainable Built Environment Infrastructures in Developing Countries ENSET, Oran, Algeria, 12–14 October 2009; pp. 337–350. [Google Scholar]
- Banthia, N.; Bindiganavile, V.; Jones, J.; Novak, J. Fiber-reinforced concrete in precast concrete applications: Research leads to innovative products. PCI J. 2014, 57, 33–46. [Google Scholar] [CrossRef]
- Guerini, V.; Conforti, A.; Plizzari, G.; Kawashima, S. Influence of Steel and Macro-Synthetic Fibers on Concrete Properties. Fibers 2018, 6, 47. [Google Scholar] [CrossRef]
- Biswas, R.K.; Ahmed, F.B.; Haque, M.E.; Provasha, A.A.; Hasan, Z.; Hayat, F.; Sen, D. Effects of Steel Fiber Percentage and Aspect Ratios on Fresh and Harden Properties of Ultra-High Performance Fiber Reinforced Concrete. Appl. Mech. 2021, 2, 501–515. [Google Scholar] [CrossRef]
- Damineli, B.L.; Kemeid, F.M.; Aguiar, P.S.; John, V.M. Measuring the eco-efficiency of cement use. Cem. Concr. Compos. 2010, 32, 555–562. [Google Scholar] [CrossRef]
- Canadian Standard Association. Cementitious Materials for Use in Concrete, 5th ed.; Canadian Standard Association: Toronto, ON, USA, 2018. [Google Scholar]
- ASTM C33/C33M-24a; Standard Specification for Concrete Aggregates. ASTM International: West Conshohocken, PA, USA, 2018. [CrossRef]
- ASTM-C127-15.2; Standard Test Method for Relative Density (Specific Gravity) and Absorption of Coarse Aggregate—ASTM Subcommittee C09.20. ASTM International: West Conshohocken, PA, USA, 2015; p. 5.
- ASTM C128-15; Standard Test Method for Relative Density (Specific Gravity) and Absorption of Fine. ASTM International: West Conshohocken, PA, USA, 2015.
- Yu, A.B.; Standish, N. Characterisation of non-spherical particles from their packing behaviour. Powder Technol. 1993, 74, 205–213. [Google Scholar] [CrossRef]
- Johnston, C.D. Measures of the Workability of Steel Fiber Reinforced Concrete and Their Precision. Cem. Concr. Aggreg. 1984, 6, 74–83. [Google Scholar] [CrossRef]
- Leung, H.Y.; Balendran, R.V. Properties of fresh polypropylene fibre reinforced concrete under the influence of pozzolans. J. Civ. Eng. Manag. 2003, 9, 271–279. [Google Scholar] [CrossRef]
- De Figueiredo, A.D.; Ceccato, M.R. Workability Analysis of Steel Fiber Reinforced Concrete Using Slump and Ve-Be Test. Mater. Res. 2015, 18, 1284–1290. [Google Scholar] [CrossRef]
- ACI 211. 1-91; Standard Practice for Selecting Proportions for Normal Heavyweight, and Mass Concrete (ACI 211. 1-91); Reapproved 2002; ACI Committee 211. American Concrete Institute: Farmington Hills, MA, USA, 2004.
- ACI 544.3R-08; Guide for Specifying, Proportioning, and Production of Fiber-Reinforced Concrete; ACI Committee 544. American Concrete Institute: Farmington Hills, MA, USA, 2008.
- ASTM C172/C172M-17; Standard Practice for Sampling Freshly Mixed Concrete. ASTM International: West Conshohocken, PA, USA, 2017. [CrossRef]
- ASTM C143/C143M; Standard Test Method for Slump of Hydraulic-Cement Concrete. ASTM C2015. ASTM International: West Conshohocken, PA, USA, 2015; Volume 143, pp. 1–4.
- EN 12350-3:2009; Testing Fresh Concrete—Vebe Test. British Standards Institution: London, UK, 2009.
- Tattersall, G.H. The Workability of Concrete, A Viewpoint Publication; Cement and Concrete Association: London, UK, 1976. [Google Scholar]
- Beaupre, D. Rheology of High Performance Shotcrete; University of British Columbia: Vancouver, BC, Canada, 1994. [Google Scholar]
- Ferraris, C.F. Measurement of the rheological properties of high performance concrete: State of the art report. J. Res. Natl. Inst. Stand. Technol. 1999, 104, 461. [Google Scholar] [CrossRef]
- ASTM C39-18; Standard Test Method for Compressive Strength of Cylindrical Concrete Specimens. ASTM International: West Conshohocken, PA, USA, 2018; pp. 1–8.
- ASTM C1609; Standard Test Method for Flexural Perfromance of Fiber-Reinforced Concrete (Using Beam with Third-Point Loading). ASTM International: West Conshohocken, PA, USA, 2012.
- ACI PRC-544.2-17; Report on the Measurement of Fresh State Properties and Fiber Dispersion of Fiber-Reinforced Concrete. ACI Committee 544. American Concrete Institute: Farmington Hills, MA, USA, 2017.
- De Larrard, F.; Ferraris, C.F.; Sedran, T. Fresh concrete: A HerscheI-Bulkley material. Mater. Struct. 1998, 31, 494–498. [Google Scholar] [CrossRef]
- Damineli, B.L.; John, V.M. Developing Low CO2 Concretes: Is Clinker Replacement Sufficient? The Need of Cement Use Efficiency Improvement. In Key Engineering Materials; Trans Tech Publications: Stafa-Zurich, Switzerland, 2012; pp. 342–351. [Google Scholar]
- Abbass, W.; Khan, M.I.; Mourad, S. Evaluation of mechanical properties of steel fiber reinforced concrete with different strengths of concrete. Constr. Build. Mater. 2018, 168, 556–569. [Google Scholar] [CrossRef]
- Xu, B.W.; Shi, H.S. Correlations among mechanical properties of steel fiber reinforced concrete. Constr. Build. Mater. 2009, 23, 3468–3474. [Google Scholar] [CrossRef]
- ACI 318R-14; Building Code Requirements for Structural Concrete. American Concrete Institute: Farmington Hills, MA, USA, 2014.
- Ince, C.; Erdem, B.Z.; Derogar, S.; Yuzer, N. The Effects of SCMs on the Mechanical Properties and Durability of Fibre Cement Plates. Int. J. Civ. Environ. Eng. 2015, 9, 893–899. [Google Scholar]
- Shah, S.P.; Ahmad, S.H. Structural Properties of High Strength Concrete and Its Implications for Precast Prestressed Concrete. J.-Prestress. Concr. Inst. 1985, 30, 92–119. [Google Scholar] [CrossRef]
- Perumal, R. Correlation of compressive strength and other engineering properties of high-performance steel fiber-reinforced concrete. J. Mater. Civ. Eng. 2015, 27, 1–8. [Google Scholar] [CrossRef]
- Cao, M.; Ming, X.; He, K.; Li, L.; Shen, S. Effect of Macro-, Micro- and Nano-Calcium Carbonate on Properties of Cementitious Composites—A Review. Materials 2019, 12, 781. [Google Scholar] [CrossRef] [PubMed]
- Li, Z. Advanced Concrete Technology; Wiley: Hoboken, NJ, USA, 2011. [Google Scholar] [CrossRef]
- de Grazia, M.T. Contribution to the Understanding of Fresh and Hardened State Properties of Low Cement Concrete; Ottawa University: Ottawa, ON, USA, 2018. [Google Scholar]
- Ortega, F.S.; Pileggi, R.G.; Studart, A.R.; Pandofelli, V.C. IPS A Viscosity Predictive Parameter. Am. Ceram. Soc. Bull. 2002, 81, 44–52. [Google Scholar]
- de Oliveira, I.R.; Studart, A.R.; Pileggi, R.G.; Pandolfelli, V.C. Dispersão e Empacotamento de Partículas: Princípios e Aplicações em Processamento Cerâmico; Fazendo Arte: Sao Paulo, Brazil, 2000. [Google Scholar]
- De Larrard, F.; Sedran, T. Optimization of ultra-high-performance concrete by the use of a packing model. Cem. Concr. Res. 1994, 24, 997–1009. [Google Scholar] [CrossRef]


| Material | Compound Content (%) | Blaine (m2/kg) | Loss on Ignition (%) | Specific Gravity (g/cm3) | Absorption (%) | ||||||||
|---|---|---|---|---|---|---|---|---|---|---|---|---|---|
| Na2O | MgO | Al2O3 | SiO2 | SO3 | K2O | CaO | CaCO3 | MgCO3 | |||||
| GU Cement | 0.14 | 2.66 | 4.92 | 19.53 | 3.86 | 0.77 | 61.91 | - | - | 381.46 | 2.24 | 3.15 | - |
| LF—Replacement Filler | - | - | - | - | - | - | - | - | - | - | - | 2.66 | - |
| FA | - | - | - | - | - | - | - | - | - | - | - | 2.73 | 0.79 |
| CA | - | - | - | - | - | - | - | - | - | - | - | 2.73 | 0.54 |
| Type of Fiber | Length (mm) | Diameter (mm) | Aspect Ratio | Volumetric Diameter (mm) | Specific Gravity (g/cm3) | Fiber Shape |
|---|---|---|---|---|---|---|
| Steel (S) | 50 | 1.14 | 44 | 4.6 | 7.85 | Wavy profile |
| Steel (S) | 38 | 1.14 | 33 | 4.2 | 7.85 | |
| Polypropylene (PP) | 50 | 0.81 | 62 | 3.67 | 0.91 |
| Mixtures | Cement (kg/m3) | Filler (kg/m3) | FA (kg/m3) | CA (kg/m3) | Fibers (kg/m3) | Water (kg/m3) | Admixtures (SP + P) |
|---|---|---|---|---|---|---|---|
| PPM-S0.5-50-0.26 | 300 | 178 | 975 | 731 | 39 | 192 | 0.4% + 0.2% |
| PPM-S0.5-38-0.26 | 39 | ||||||
| PPM-PP0.5-50-0.26 | 4.5 | ||||||
| PPM-S0.5-50-0.21 | 277 | 961 | 645 | 39 | |||
| PPM-S0.5-38-0.21 | 39 | ||||||
| PPM-PP0.5-50-0.21 | 4.5 | ||||||
| PPM-S1.0-50-0.26 | 178 | 961 | 731 | 79 | |||
| PPM-S1.0-38-0.26 | 79 | ||||||
| PPM-PP1.0-50-0.26 | 9 | ||||||
| PPM-S1.0-50-0.21 | 277 | 947 | 645 | 79 | |||
| PPM-S1.0-38-0.21 | 79 | ||||||
| PPM-PP1.0-50-0.21 | 9 | ||||||
| ACI-S0.5-50 | 375 | - | 567 | 1115 | 38 | 240 | 0.2% + 0.0% |
| ACI-S0.5-38 | 38 | ||||||
| ACI-PP0.5-50 | 4.5 | ||||||
| ACI-S1.0-50 | 553 | 79 | |||||
| ACI-S1.0-38 | 79 | ||||||
| ACI-PP1.0-50 | 9 |
| Mixture | VeBe Test (s) | Slump Test (cm) | Rheological Characterization |
|---|---|---|---|
| PPM-S0.5-50-0.26 | 7 | 10 | Applicable |
| PPM-S0.5-38-0.26 | 6 | 4 | Applicable |
| PPM-PP0.5-50-0.26 | 7 | 6 | Applicable |
| PPM-S0.5-50-0.21 | 12 | 0 | Non-applicable |
| PPM-S0.5-38-0.21 | 11 | 0 | Non-applicable |
| PPM-PP0.5-50-0.21 | 10 | 3 | Non-applicable |
| PPM-S1.0-50-0.26 | 18 | 2 | Non-applicable |
| PPM-S1.0-38-0.26 | 11 | 5 | Non-applicable |
| PPM-PP1.0-50-0.26 | 17 | 3 | Applicable |
| PPM-S1.0-50-0.21 | 19 | 0 | Non-applicable |
| PPM-S1.0-38-0.21 | 15 | 0 | Non-applicable |
| PPM-PP1.0-50-0.21 | 24 | 0 | Non-applicable |
| ACI-S0.5-50 | 3 | 14 | Applicable |
| ACI-S0.5-38 | 2 | 15 | Applicable |
| ACI-PP0.5-50 | 2 | 15 | Applicable |
| ACI-S1.0-50 | 7 | 11 | Non-applicable |
| ACI-S1.0-38 | 3 | 14 | Applicable |
| ACI-P1.0-50 | 4 | 16 | Applicable |
| Mixture Name | Measured Properties | |
|---|---|---|
| Minimum Torque (N.m) | Apparent Viscosity (N.m/rpm) | |
| PPM-S0.5-50-0.26 | 27.48 | 0.89 |
| PPM-S0.5-38-0.26 | 23.50 | 0.84 |
| PPM-0.5PP-50-0.26 | 7.00 | 0.52 |
| PPM-1.0PP-50-0.26 | 15.61 | 0.51 |
| ACI-S0.5-50 | 0.40 | 0.09 |
| ACI-S0.5-38 | 0.26 | 0.03 |
| ACI-S1.0-38 | 0.90 | 0.02 |
| ACI-PP0.5-50 | 0.20 | 0.03 |
| ACI-PP1.0-50 | 0.20 | 0.08 |
| Mixture | Compressive Strength (MPa) | CV (%) | Modulus of Rupture—MOR (MPa) | Peak Load (kN) | Toughness (J) |
|---|---|---|---|---|---|
| PPM-S0.5-50-0.26 | 36.4 | 4 | 4.3 | 24.1 | 63 |
| PPM-S1.0-50-0.26 | 33.9 | 3 | 4.5 | 35.1 | 110 |
| PPM-S0.5-50-0.21 | 33.9 | 3 | 4.9 | 42.5 | 80 |
| PPM-S1.0-50-0.21 | 35.7 | 1 | 6.5 | 47.4 | 136 |
| PPM-S0.5-38-0.26 | 33.2 | 5 | 4.2 | 24.2 | 42 |
| PPM-S1.0-38-0.26 | 34.1 | 4 | 4.1 | 41.2 | 78 |
| PPM-S0.5-38-0.21 | 32.6 | 6 | 4.3 | 44.1 | 80 |
| PPM-S1.0-38-0.21 | 33.1 | 3 | 5.2 | 43.5 | 88 |
| PPM-PP0.5-50-0.26 | 35.0 | 6 | 4.4 | 41.2 | 78 |
| PPM-PP1.0-50-0.26 | 33.7 | 8 | 5.3 | 41.3 | 112 |
| PPM-PP0.5-50-0.21 | 33.9 | 6 | 5.1 | 48.1 | 100 |
| PPM-PP1.0-50-0.21 | 33.8 | 6 | 6.4 | 51.9 | 106 |
| ACI-S0.5-50 | 26.0 | 5 | 3.7 | 32.2 | 102 |
| ACI-S1.0-50 | 25.6 | 6 | 6.1 | 44.6 | 116 |
| ACI-S0.5-38 | 23.4 | 8 | 4.7 | 39.1 | 85 |
| ACI-S1.0-38 | 20.3 | 7 | 5.0 | 41.1 | 99 |
| ACI-PP0.5-50 | 20.6 | 5 | 3.3 | 28.20 | 64 |
| ACI-PP1.0-50 | 23.0 | 4 | 3.9 | 40.26 | 91 |
| Mixture | P600d kN | F600d MPa | P150d kN | F150d MPa |
|---|---|---|---|---|
| PPM-S0.5-50-0.26 | 30.30 | 2.41 | 16.32 | 1.93 |
| PPM-S1.0-50-0.26 | 29.00 | 3.43 | 34.88 | 4.13 |
| PPM-S0.5-50-0.21 | 23.32 | 2.77 | 18.93 | 2.24 |
| PPM-S1.0-50-0.21 | 48.26 | 5.72 | 33.50 | 3.97 |
| PPM-S0.5-38-0.26 | 18.58 | 2.20 | 14.83 | 1.76 |
| PPM-S1.0-38-0.26 | 24.60 | 2.92 | 22.94 | 2.72 |
| PPM-S0.5-38-0.21 | 17.45 | 2.07 | 11.97 | 1.42 |
| PPM-S1.0-38-0.21 | 32.20 | 3.81 | 23.56 | 2.79 |
| PPM-PP0.5-50-0.26 | 16.58 | 1.97 | 32.26 | 3.82 |
| PPM-PP1.0-50-0.26 | 17.66 | 2.10 | 41.31 | 4.90 |
| PPM-PP0.5-50-0.21 | 19.92 | 2.36 | 37.50 | 4.45 |
| PPM-PP1.0-50-0.21 | 14.45 | 1.71 | 25.28 | 3.00 |
| ACI-S0.5-50 | 32.80 | 3.90 | 20.81 | 2.47 |
| ACI-S1.0-50 | 51.80 | 6.13 | 32.82 | 3.90 |
| ACI-S0.5-38 | 34.30 | 4.00 | 24.70 | 2.92 |
| ACI-S1.0-38 | 31.95 | 3.80 | 22.63 | 2.70 |
| ACI-PP0.5-50 | 17.50 | 2.10 | 0.00 | 0.00 |
| ACI-PP1.0-50 | 24.00 | 2.84 | 34.53 | 4.10 |
| ACI 318-14 | Ahmed and Shah | Xu and Shi | Perumal |
|---|---|---|---|
| PPM Mixtures | Efficient Indexes | Properties of FRC | ||||
|---|---|---|---|---|---|---|
| IPS | MPT | FMF | VeBe Time (s) | Toughness (J) | Compressive Strength (MPa) | |
| PPM-S0.5-50-0.26 | 0.59 | 1.00 | 0.03 | 7 | 63 | 36.4 |
| PPM-S1.0-50-0.26 | 0.59 | 1.01 | 0.01 | 18 | 110 | 33.9 |
| PPM-S0.5-50-0.21 | 0.45 | 1.03 | 0.02 | 12 | 80 | 33.9 |
| PPM-S1.0-50-0.21 | 0.45 | 1.04 | 0.01 | 19 | 136 | 35.7 |
| PPM-S0.5-38-0.26 | 0.59 | 1.00 | 0.04 | 6 | 42 | 33.2 |
| PPM-S1.0-38-0.26 | 0.59 | 1.01 | 0.02 | 11 | 78 | 34.1 |
| PPM-S0.5-38-0.21 | 0.45 | 1.03 | 0.03 | 11 | 80 | 32.6 |
| PPM-S1.0-38-0.21 | 0.45 | 1.04 | 0.01 | 15 | 88 | 33.1 |
| PPM-PP0.5-50-0.26 | 0.59 | 1.00 | 0.02 | 7 | 78 | 35.0 |
| PPM-PP1.0-50-0.26 | 0.59 | 1.01 | 0.01 | 17 | 112 | 33.7 |
| PPM-PP0.5-50-0.21 | 0.45 | 1.03 | 0.01 | 10 | 100 | 33.9 |
| PPM-PP1.0-50-0.21 | 0.45 | 1.04 | 0.01 | 24 | 106 | 33.8 |
Disclaimer/Publisher’s Note: The statements, opinions and data contained in all publications are solely those of the individual author(s) and contributor(s) and not of MDPI and/or the editor(s). MDPI and/or the editor(s) disclaim responsibility for any injury to people or property resulting from any ideas, methods, instructions or products referred to in the content. |
© 2025 by the authors. Licensee MDPI, Basel, Switzerland. This article is an open access article distributed under the terms and conditions of the Creative Commons Attribution (CC BY) license (https://creativecommons.org/licenses/by/4.0/).
Share and Cite
Bergmann, A.; Eid, M.N.; de Grazia, M.T.; Dantas, S.R.A.; Sanchez, L.F.M. Eco-Efficient Fiber-Reinforced Concrete: From Mix Design to Fresh and Hardened State Behavior. Materials 2025, 18, 1245. https://doi.org/10.3390/ma18061245
Bergmann A, Eid MN, de Grazia MT, Dantas SRA, Sanchez LFM. Eco-Efficient Fiber-Reinforced Concrete: From Mix Design to Fresh and Hardened State Behavior. Materials. 2025; 18(6):1245. https://doi.org/10.3390/ma18061245
Chicago/Turabian StyleBergmann, Ana, Mohammed Nabil Eid, Mayra T. de Grazia, Sergio R. A. Dantas, and Leandro F. M. Sanchez. 2025. "Eco-Efficient Fiber-Reinforced Concrete: From Mix Design to Fresh and Hardened State Behavior" Materials 18, no. 6: 1245. https://doi.org/10.3390/ma18061245
APA StyleBergmann, A., Eid, M. N., de Grazia, M. T., Dantas, S. R. A., & Sanchez, L. F. M. (2025). Eco-Efficient Fiber-Reinforced Concrete: From Mix Design to Fresh and Hardened State Behavior. Materials, 18(6), 1245. https://doi.org/10.3390/ma18061245